the international hydrographic review - iho · - how the “download generation” will drive...
TRANSCRIPT
INTERNATIONAL HYDROGRAPHIC REVIEW MAY 2010
THE
INTERNATIONAL
HYDROGRAPHIC
REVIEW
INTERNATIONAL HYDROGRAPHIC BUREAU
MONACO
No. 3
MAY 2010

2
INTERNATIONAL HYDROGRAPHIC REVIEW MAY 2010
Page intentionally left blank

3
INTERNATIONAL HYDROGRAPHIC REVIEW MAY 2010
By Adam J. Kerr, Editor
- An Eighteenth Century Joint Survey of the North-West coast of
America by British and Spanish Surveyors.
By Andrew David (UK) - Seafloor Mapping in the Arctic: Support for a Potential US
Extended Continental Shelf.
By Larry A.Meyer, A.Armstrong, B.Calder and J. Gardner (USA)
□ Editorial
□ Articles
- SHOALS Object Detection.
By Eric Yang and P. E. LaRocque (Canada) - New Standards for Providing Meteorological and Hydrographic
Information via AIS Application-Specific Messages
By Lee Alexander and K, Schwehr (USA)
- A First Generation ENC Service.
By Vaughan Nail (UK)
□ General Information
- Recent Progress in Sub-bottom profiling - the SBP 120 example .
By Gwladys Theuillon (France)
- The next challenge of the International Hydrographic Organisa-
tion and Hydrographic offices: “Green” ECDIS for the Protection
and Monitoring of the Marine Environment .
By Parry Oei (Singapore)
- Why a National Hydrographic Office ?
By Hugo Gorziglia (IHB)
- How the “Download Generation” will drive Electronic Charting
in a New Direction ?
By Mike Casey (Canada)
□ Notes
Book review:
“Estimated Sea Floor dynamics in the Southern North Sea”
By Leendert Louis Dorst. Printed by Optima Grafische Communicatie, Rotterdam, 2009, 220 Pages, ISBN 978-90-365-2878-8
† Obituary:
Vice Admiral Affonso (Brazil)
555
666
141414
242424
373737
454545
515151
555555
616161
676767
767676
777777

4
INTERNATIONAL HYDROGRAPHIC REVIEW MAY 2010
Page intentionally left blank

5
INTERNATIONAL HYDROGRAPHIC REVIEW MAY 2010
Editorial
This issue, once again, owes much to the US Hydrographic Conference 2009 and much of the material was developed from papers given at that conference and for the contacts the Editor was able to make during that event. We start this issue with an historical paper , which for some years, has been a goal of the Review, on the assumption that history interests most people while some of the technical papers may be too esoteric for some. There is then a paper on surveys in the Arctic Ocean as a basis for US claims to the continental shelf in that area. It is timely from two points of view, one that the opening up of Arctic sea routes as a result of global warming and two from the fact that the Law of the Sea Treaty is placing pressure on countries to make their claims under Article 76. With the help of large modern icebreakers and the latest acoustic technology our knowledge of the Arctic Ocean seafloor is being increasingly revealed. There follows a paper on LIDAR and its ability to detect small objects on the sea floor. This has been a much debated subject in previous issues of this Review and this paper adds further information to the debate. Then onwards to a discussion on matters that have a general interest to maritime navigators and is at present a source of debate at the International Maritime Organisation. This is the mandatory requirement for ships to carry Automatic Identification Systems (AIS). In particular this paper discusses the use of Binary Messages associated with this technology.
The final paper concerns the matter of distributing Electronic Navigational Charts (ENCs) and it also reflects the difficulties being faced by the International Hydrographic Organisa-tion (IHO) in providing a global system of ENCs as a basis for the use of ECDIS. The task has proved to be very difficult both in introducing the complex technology and the coordina-tion of the effort between different Hydrographic Offices. This slow and difficult process has possibly resulted in producing ―official charts‖ whose use is becoming mandatory, but whose design will be out of date for the navigators of the future, as discussed in an interesting Note on the ―Download Generation‖, presented originally at the ECDIS Conference in Singapore last year. Another Note in this issue discussing matters of ECDIS is one also presented at Singapore that outlines ideas of a green ECDIS to aid combat environmental concerns.
A review on a book on estimating sea floor dynamics will hopefully bring attention to the subject of the mobility of the sea floor and the importance to hydrographers of understanding it. Most HOs will be faced with the problem of mobile sedimentary sea floors and their effect on under keel clearances for shipping. The book being reviewed is based on a PhD thesis by a Dutch student and includes a considerable amount of mathematics but the overall objective of improving bathymetric survey planning should interest all HOs. Adam J. Kerr, Editor

6
INTERNATIONAL HYDROGRAPHIC REVIEW MAY 2010
AN EIGHTEENTH CENTURY JOINT SURVEY
ON THE NORTH-WEST COAST OF AMERICA BY BRITISH
AND SPANISH SURVEYORS
By Andrew David
Abstract
When the British surveying expedition under George Vancouver met a similar Spanish expedition under Dionisio Alcalà Galiano in June 1792 off Birch Bay, on the coast of present day USA state of Washington, they agreed to carry out a joint survey of the waters to the north of the Strait of Georgia. The resulting survey is a very early example of co-operation in hydrographic surveying between nations. It also highlighted the difficulties they encountered,
Résumé
Lorsque l‘expédition hydrographique britannique conduite par George Vancouver a croisé la route de l‘expédition espagnole similaire, conduite par Dionisio Alcalá Galiano, en juin 1792 au large de Birch Bay, sur la côte qui correspond aujourd‘hui à l‘Etat de Washington (USA), il fut décidé qu‘un levé conjoint serait exécuté dans les eaux situées au Nord du détroit de Georgia. Le levé qui a été réalisé constitue un des tout premiers exemples de coopération hydrographique entre nations et a permis de mettre en évidence les difficultés rencontrées
Resumen
Cuando la expedición hidrográfica británica a las órdenes de George Vancouver se encontró con una expedición similar española bajo Dionisio Alcalá Galiano, en Junio de 1792, en aguas de la Bahía de Birch, en la costa del actual estado de Washington de los Estados Unidos de América, convinieron llevar a cabo un levantamiento conjunto de las aguas hacia el Norte del Estrecho de Georgia. El levantamiento resultante es un ejemplo muy temprano de cooperación entre las naciones en materia de levantamientos hidrográficos. Se destacan también las dificultades encontradas.

7
INTERNATIONAL HYDROGRAPHIC REVIEW MAY 2010
When the British surveyor George Vancouver and the Spanish surveyor Dionisio Alcalá Galiano met on 22 June 1792,1 near Point Grey,2 it was a meeting of two like-minded persons. Vancouver was 35 years old that very day while Galiano, as he was usually referred to, was three years younger, having been born on 8 October 1760. Both had a wealth of hydrographic experience behind them. Vancouver had served as a midshipman in the Resolution under Cook, during the latter‘s second voyage, and in the Discovery, during his third voyage. Vancouver then spent the next ten years in general service ships during which he surveyed Port Royal and Kingston harbours with the help of the gifted master, Joseph Whidbey, who later became Vancouver‘s valuable assistant during the survey of the North-west coast of North America.
Galiano‘s hydrographic credentials were even better than Vancouver‘s, having taken part in various hydro-graphic surveys during most of his naval career. He was first employed charting the coasts of the Iberian Peninsula under the celebrated Spanish surveyor Vicente Tofiño y San Miguel and then in the frigate Nuestra Señora de la Cabenza, commanded by Antonio de Córdoba, when he was in charge of astronomical observations and cartography on a surveying voyage to Magellan Strait. On his return to Spain, Galiano rejoined the survey of the Iberian Peninsula under Tofiño, which brought him to the attention of Alejandro Malaspina, who recruited him as the expedition‘s principal astronomer for his projected voyage to the Pacific. 3
Their Lordships, when drawing up Vancouver‘s instructions, were well aware that he might encounter the Malaspina expedition and so instructed him that:
...if you shall fall in with any Spanish ships employed on any service similar to that which is hereby commit-ted to you, you are to afford to the officer command-ing such ships every possible degree of assistance and information, and to offer to him, that you, and he, should make to each other, reciprocally, a free and unreserved communication of all plans and charts of discoveries made by you and him in your respective voyages.4
Galiano and his fellow captain, Cayetano Valdés, were given similar instructions by Conde de Revillagigedo, viceroy of New Spain: If while at sea, on the north-west coast, or in the Strait [of Juan de Fuca] ships of other European nations are encountered, the comman-dants of the goletas will endeavour to observe the greatest accord with them, avoiding disputes which cause displeasure to their nations and delay the commission, and assisting each other reciprocally.5
It is not clear whether it was Vancouver or Galiano who first proposed that their two surveys should become a joint venture. The reason for this discrep-ancy probably lies in the fact that communication between the two parties would not have been easy since no one in either of the British ships could speak Spanish, while it is not clear how well Galiano spoke English since, according to Vancouver, he only spoke a little English, though according to Peter Puget, one of Vancouver‘s officers, he spoke it with great ease and fluency. However, it seems likely that the proposal may have came from Vancouver, since the Spaniards foresaw difficulties in a joint survey because the British had better ships and equipment, although they thought there could be compensations as they might gain some insight into British methods and techniques. 7
It seems likely that Vancouver and Galiano would have shown one another their instruments and books. Malaspina had supplied Galiano and Valdés with an astronomical quadrant, an astronomical or regulator clock by John Ellicott, a large achromatic telescope and a smaller one, Arnold Box chronometer 61, Arnold pocket chronometer 344, a reflecting circle with stand, a theodolite, an azimuth compass, a mari-ner‘s compass 8 and three artificial horizons.9
Vancouver had two chronometers, namely Kendall No 3, usually referred to as K3, and Arnold 82. He also had a similar collection of instruments as those issued to the Spanish surveyors. The two most important books held by Vancouver were the edition of the Nautical Almanac for the current year and the second edition of Tables Requisite..., which was published in 1781. Based on what Malaspina is known to have held,10 Galiano probably had a copy of the current British Nautical Almanac, its French equivalent 11 and also copies of the current Spanish Almanaque Náutico
y Efemérides Astronómicas, which was first published in 1791, enabling Galiano to compute longitudes di-rectly from Cádiz.
The first meeting between the two expeditions had occurred on June 14 when the Spanish schooners Sutil and Mexicana encountered the Chatham and Discovery at anchor off Birch Bay, about 30 miles south-east of Point Grey. Lieutenant William Broughton, commanding officer of the Chatham, at once called on Galiano on board the Sutil to offer, on behalf of Vancouver, who was absent on a boat trip, any assistance he could give. Galiano then showed Broughton Arnold 344 and told him they also had Ar-nold 61, which was presumably in the Mexicana, com-manded by Cayetano Valdés. Broughton, in his turn, said that the British expedition also had an Arnold chronometer [No 82] and one by Kendall [K3].

8
INTERNATIONAL HYDROGRAPHIC REVIEW MAY 2010
Vancouver first encountered the Spanish expedition when he sighted their two schooners on 22 June off Point Grey, on his way back to join the Discovery after surveying Jervis Inlet, situated about 45 miles north of Point Grey. He at once went on board the Sutil, where he gave Galiano a copy of his recent survey, which included Burrard Inlet, except for Indian Arm, at the head of the inlet, which he had not surveyed. Vancou-ver noted that the officer‘s quarters on board the Sutil only allowed room for sleeping berths on each side, with a table in between at which four persons could sit with difficulty and in consequence the two schooners were, in his opinion, in all other respects, the most ill calculated and unfit vessels that could possibly be imagined for such an expedition‘.12 Vancouver then returned to the Discovery in Birch Bay, whose position he had already determined, thus providing a starting point for the forthcoming joint survey. He had ob-tained the latitude of the bay by eleven meridian alti-tudes of the Sun and had deduced its longitude from observations made in Discovery Bay, on the southern side of Juan de Fuca Strait, where he had observed 220 sets of lunar distances, carried forward by his chro-nometers. Galiano had also established a starting point in the San Juan Islands, on the south-eastern point of Lopez Island, where he had obtained its longitude by observing the emergence of Jupiter‘s first satellite.
The joint British and Spanish survey began when Vancouver sailed from Birch Bay on 24 June, joining the Sutil and Mexicana later that day off Point Grey, where Galiano came on board the Discovery and informed Vancouver that he had now examined Indian Arm and presented him with a copy of his survey. The two surveyors then discussed the possibility that a passage to the open sea might be found if they contin-ued to the north, as shown on a map in Meares‘s Voyage in which a track of the American fur-trading vessel Washington making such a passage was depicted.13 Galiano, however, was able to assure Vancouver that, notwithstanding the fact that the Spanish had lived on terms of great intimacy with Captain Gray and other American traders, they had no knowledge that anyone had performed such a voyage. However, Valdés, who had been with Malaspina at Nootka Sound the preceding year and spoke the local language fluently had been told by the natives that such a passage did in fact exist. (Figure 1)
On 26 June the four vessels got under way and, after passing Burrard Inlet and Howe Sound, about 10 miles north-west of Point Grey, which Vancouver had already surveyed, they proceeded through Malaspina Strait between Texada Island and the mainland, where Galiano began a running survey by measuring bases. 14 They then passed east of Harwood, Savary and Hernando Islands, at which juncture it seemed to Vancouver that they had forsaken the main direction
of the Strait of Georgia as they were now encom-passed on all sides by islands and rocky islets. Around dusk they entered a spacious sound leading to the north-east. Although the night was dark and rainy, they were forced to keep under way under the influ-ence of wind and tide as they were unable to obtain soundings, until they were finally able to anchor about midnight on the north side of Kinghorn Island, just within the sound,15 which Vancouver named Desola-tion Sound. (Figure 2)
Next morning, which was fine and serene, Vancouver, Puget and one of the Discovery‘s midshipmen, accompanied by Galiano and Juan José Vernacci, landed on Kinghorn Island to obtain the position of its south-western point. Vancouver took with him an artificial horizon and presumably a sextant on a stand, while Galiano took the stand of his achromatic telescope on which he mounted a theodolite. Using these instruments the two surveyors were able to ob-serve the meridian altitude of the Sun, which Van-couver found gave a latitude of 50º6‘N, while Galiano‘s latitude differed from this by a mere 20 seconds. Both instruments were also used to obtain local time, which compared with Vancouver‘s chro-nometer, gave the longitude of the point as 235º26‘ East of Greenwich, but, according to Vancouver, Galiano‘s chronometer observations placed the point farther to the west.
While these observations were being taken, four boat parties were being provisioned and, at the same time, Broughton was sent in one of the Chatham‘s boats to seek a better anchorage further up the sound. In the afternoon he returned in time to inform the officers in charge of the various boat parties of a better anchorage he had found on the northern side of Teakerne Arm, on the east side of Lewis Channel. The boat parties then departed. Puget and Whidbey in the Discovery‘s launch and cutter were sent to examine the continen-tal shore, while James Johnstone, the master of the Chatham, was sent in charge of the Chatham‘s cutter and launch to examine a sound leading to the north-west, while Valdés undertook to survey the intermedi-ate coast in the Mexicana‘s launch.
Immediately after the departure of the first three boat parties, the four vessels got under way and moved to the anchorage in Teakerne Arm. Here Galiano made some astronomical observations to rate his chronome-ters. Early the following morning, Saturday 30 June, Vancouver set off himself in the yawl to examine what appeared to be the main channel of the Strait of Georgia, to the west of Hernado and Savary Islands. However, bad weather forced him to return to the Discovery, where he found that Johnstone had also returned, reporting that all the land to the west and north-west appeared to form an immense archipelago.

9
INTERNATIONAL HYDROGRAPHIC REVIEW MAY 2010
Figure 1
Figure 2

10
INTERNATIONAL HYDROGRAPHIC REVIEW MAY 2010
Meanwhile Valdés had also returned, having surveyed an inlet which Galiano named Canal de la Tabla after a plank of wood, covered with paintings, that he had discovered on its eastern shore. When Galiano‘s survey was engraved the name was changed to Brazo de Toba either by an engraver‘s error as suggested by Captain Walbran 16 or in honour of Antonio Tova (or Toba), one of Malaspina‘s officers, as suggested by Henry Wagner.17 Hence its present name of Toba Inlet. As Valdés was returning to the Mexicana he met Puget at the entrance to Toba Inlet and told him that the inlet was closed, but Puget nevertheless proceeded to examine the inlet himself. Because of this Galiano remonstrated with Vancouver telling him that the best way of advancing the survey was to have complete trust with one another and working together as though they were of the same nation. Vancouver replied that he did indeed have full trust in the Spanish surveyors, but he was expressly ordered in his instructions to explore all the inlets on the coast from 40ºN to Cook Inlet. Galiano appears to have accepted Vancouver‘s explanation as they continued to dine amicably together. While Puget and Whidbey were examining Toba Inlet, Johnstone, having also met Valdés, followed the con-tinental shore further north, during which he discov-ered and surveyed Bute Inlet.18 He also discovered Arran Rapids, in the northern entrance to the sound between Stuart Island and the mainland, where the ‗rapidity of the tide‘ caused him to conclude correctly ‗that this narrow passage had communication with some very extensive inlet of the seas‘.19 Shortage of provisions now forced Johnstone to return to the Chat-
ham on 2 July. Three days later Johnstone was again dispatched with a week‘s provisions to continue his survey beyond Arran Rapids. He returned on the 12th with the welcome news he had discovered a passage leading to the open sea. Johnstone had first passed through Yaculta Rapids between Stuart and Sonora Islands. He then followed Cordero Channel to the west as far as the entrance to Loughborough Inlet, which he now followed being mindful of Vancouver‘s instruc-tion to trace the continental shore. However, when he mistakenly thought he had come to the end of the inlet he turned back to its junction with Cordero Channel and then followed its western extension for about two leagues, to where the channel divided around Hard-wicke Island. Johnstone decided to follow the channel to the north of this island, which brought him out into an open strait.He then followed this strait as far as the mouth of the Nimpkish River, some 50 miles west of Hardwicke Island, from where he had a clear view of Queen Charlotte Sound, Vancouver later naming this strait Johnstone Strait. Realising the importance of his find, Johnstone then returned to the Discovery to re-port to Vancouver, but pointing out that this route was
subject to strong tides, accompanied by overfalls, vio-lent eddies and whirlpools.20
On 1 July, Puget and Whidbey were sent to carry out the task that Vancouver had been forced to abandon the previous day. On their return four days later Puget reported that on the first night they had reached the northern end of Savary Island, where they pitched their tents and spent a comfortable night. Next day they continued south to Harwood Island, where they stopped for breakfast, from there they crossed over to the eastern shores of Vancouver Island, where they entered an inlet about a mile wide, leading in a north-north-west direction, whose eastern side was formed by a long narrow peninsula, terminating in Point Mudge, named by Vancouver after his first lieutenant, Zachary Mudge. Puget and Whidbey then followed Discovery Passage, as it was subsequently named by Vancouver, for about twelve miles, without any appar-ent end. The tidal stream was strong, with the flood coming from the north-west at about 5 knots, all of which indicated that the channel was of considerable extent. As he considered that this passage must lead to the open sea, Puget decided to return at once to the Discovery to report his findings to Vancouver as soon as possible.
The Spaniards meanwhile had not been idle. Between 3 and 5 July Galiano examined the continental shore between Point Sarah and Toba Inlet in the Mexicana‘s launch, naming two bays east of Malaspina Peninsula after Malaspina and Bustamante21. On the 7th Vernacci and Salamanca were sent in the launch to continue the survey to the west and on the 9th they entered an inlet which they named Quintano after one of Malaspina‘s officers. It was in fact Bute Inlet. While going about in heavy seas, the launch shipped several seas and nearly capsized, forcing Vernacci to take shelter for the night in a nearby cove. Next morning he continued on to Arran Rapids, waiting until slack water before passing through these rapids, where he encountered whirlpools and eddies caused by the strong tides. Some Indians they encountered informed Vernacci that the channel led to the open sea. (Figure 3)
In consequence of the discoveries made by Johnstone and Puget, Vancouver decided that Discovery Passage must lead to Johnstone Strait and to the open sea. He therefore informed Galiano and Valdés of these discoveries and that he intended to sail for Nootka Sound through this strait at the first favourable oppor-tunity. The two Spanish officers now begged leave to decline accompanying Vancouver any further as the size of their vessels would retard his progress. They were also concerned at the smallness of their boats and the fact that they were not armed with swivel guns as were the larger British boats, both of which made it inadvisable for them to go far from the schooners.

11
INTERNATIONAL HYDROGRAPHIC REVIEW MAY 2010
Fig
ure
3

12
INTERNATIONAL HYDROGRAPHIC REVIEW MAY 2010
After an exchange of surveys Vancouver sailed on the morning of 13 July leaving the Spaniards to continue their survey to the north. Galiano gave Vancouver a letter of introduction to Juan Francisco de la Bodega y Quadra, the Spanish commandant at Nootka Sound, and so with mutual exchange of good wishes and the prospect of meeting again in Nootka Sound the joint survey came to an end. Galiano subsequently took the two schooners through Arran Rapids after he and Valdés had examined it first. After surveying several more inlets, Galiano then also made his way to Nootka Sound, where he was reunited with Vancouver, ena-bling them to make a final exchange of surveys. Although the joint survey was not an unqualified success, it did demonstrate that surveyors of different nations could work together for their own benefit and for the benefit of all nations.
On their return to Europe only Galiano, of the princi-pal participants, carried out further surveys. In 1802-3 He commanded a scientific and hydrographic cruise to the eastern Mediterranean in the frigate Soledad,
during which he fixed the geographical positions of numerous places in the Dardanelles, Turkey and Greece as well as surveying several harbours.22 Sadly Galiano was killed in the Battle of Trafalgar in command of the 74-gun ship Bahama. In 2005 a symposium was held in Cabra, Galiano‘s birthplace in Andalucia, to celebrate the 200 anniversary of his death, for which a medal was struck in his honour. (Figure 4 and 5)
Valdes also took part in the Battle of Trafalgar, in command of the 80-gun ship Neptuno, when he was severely wounded and his ship wrecked.
In 1810, when in command of the Spanish gunboat flotilla during the siege of Cadiz, Valdes made the acquaintance of William Henry Smyth, who was in command of one of the gunboats. Through Valdes Smyth acquired a copy of Tofiño‘s Atlas Maritimo and subsequently, between 1810 and 1824, carried out ex-tensive surveys in the Mediterranean. 23 Valdes died on 6 February1835 and was buried in the Pantéon de Mar-inos Illustres in Cadiz.24 Vancouver returned to Eng-land in poor health and spent his final few years pre-paring the account of his voyage for publication. He died at his home at Petersham, on the outskirts of London, on 12 May 1798 and was buried in St Peter‘s Church, Petersham, (Figure 6) a few months before his Voyage of Discovery to the North Pacific Ocean
and round the World, was published, probably in late August or early September 1798.
Figure 5
Figure 4
Figure 6

13
INTERNATIONAL HYDROGRAPHIC REVIEW MAY 2010
Réferences
1.The date according to Galiano‘s account was 21 June because Vancouver had not altered his date on the 180E meridian, when crossing the Pacific from west to east. All Galiano‘s dates are adjusted to agree with Vancouver‘s.
2.The southern entrance point of Burrard Inlet, leading to the present day port of Vancouver.
3.Andrew David, Felipe Fernández Armesto, Carlos Novi and Glyndwr Williams, eds, The Malaspina Ex-
pedition 1789-1791: The Journal of the Voyage of
Alejandro Malaspina, 3 vols, the Hakluyt Society, London, 2001-4, III, p. 333.
4.W.K. Lamb, ed., George Vancouver: A Voyage of
Discovery to the North Pacific and round the World, 4 vols, the Hakluyt Society, London, 1984, III, p. 285.
5. John Kendrick, The Voyage of the Sutil and Mexi-
cana 1792: The last Spanish exploration of the
Northwest Coast of America, Spokane, Washington, 1991, p. 54.
6. Lamb, Vancouver‟s Voyage, p. 592 and n. 1. 7. Ibid, p. 94. 8. David et alia, The Malaspina Expedition, II, p. 239. 9. Kendrick, The Voyage of Sutil and Mexicana, p. 250,
adding the three artificial horizons.. Unfortunately the statement by Kendrick that the instruments included a ‗Licot pendulum‘ for use in measuring the accelera-tion of gravity is incorrect. This instrument was in fact the astronomical or regulator clock by John Ellicott, which Alejandro Malaspina had found in Mexico City.
10.David et alia, The Malaspina Expedition, III, pp. 368-70.
11. Connaissance des temps, which had been in con-tinuous publication since 1690.
12. Lamb, Vancouver‟s Voyage, p. 593. 13. John Meares, Voyages made in the Years 1788 and
1789 from China to the North West Coast of
America, London, 1790, f.p. 1. 14. By computing the distance between ‗ship stations‘
from the time taken to sail between them and the speed of the schooner as measured by log line. For the survey methods adopted during the Malaspina expedition and presumably used by Galiano in 1782 see David et alia, The Malaspina Expedition, I, pp. 325-7.
15. Galiano named this island Isla de Quema, because sailors from the Discovery set it alight.
16. Captain John T. Walbran, British Columbia Coast
Names, reprint edition, Vancouver, 1971, p. 490.
17. Henry R. Wagner, Spanish Explorations in the Strait
of Juan de Fuca, Santa Ana, California, 1933, p. 269. Vancouver and Galiano do not appear to have discussed the problem of nomenclature. So when Vancouver decided to name the entrance points of the sound after his sisters, the north-west extremity of Malaspina Peninsula Point Sarah, and the south-east extremity of Cortes Island Point Mary, Galiano named them independently Punta de Sarmiento and Punta de Magellanes, presumably in memory of his survey of Magellan Strait under Antonio Cordoba. As a result the present day names in this archipelago are a happy combination of those bestowed by these two surveyors
18. Named by Vancouver after John Stuart, 3rd Earl of Bute, whose son the Hon. Charles Stuart was a mid-shipman on board the Discovery; hence Stuart Island at the entrance to the inlet; Lamb, Vancouver‟s Voy-
age, p. 605, n. 8. 19. Lamb, Vancouver‟s Voyage, p. 606. 20. Modern sailing directions indicate that tidal streams
of up to 10 knots may be encountered in Yuculta Rapids and up to 9 knots in Arran Rapids, with the duration of slack water very brief and sometimes no more than five minutes; British Columbia Pilot, Vol. I, 12th edition, Taunton 2004, p. 289.
21. Malaspina Inlet and Okeover Arm. 22. William Henry Smyth, The Mediterranean: A
Memoir Physical, Historical and Nautical, London, 1854, p. 349.
23. Ibid, pp. 353-4. 24. José Ignacio Gonzáles-Aller Hierro, ‗Officers and
Supernumeraries on the Malaspina Expedition‘, David et alia, The Malaspina Expedition, III, p. 356.
______________________
Biography of the Author Andrew David is a retired Lieutenant Commander, Royal Navy, who specialised in hydrographic survey-ing. He is a senior editor of the much acclaimed The
Charts and Coastal Views of Captain Cook‟s Voyages,
published in three volumes between 1988 and 1997 by the Hakluyt Society and also a co-editor of The Malaspina Expedition, published in three volumes between 2001 and 2004 by the same Society. He is currently editing William Robert Broughton‘s Voyage of Discovery to the North Pacific, 1795-1798, due to be published later this year also by the Hakluyt Society.

14
INTERNATIONAL HYDROGRAPHIC REVIEW MAY 2010
SEA FLOOR MAPPING IN THE ARCTIC:
SUPPORT FOR A POTENTIAL US EXTENDED CONTINENTAL SHELF
By Larry A. Mayer, A. Armstrong, B, Calder and J. Gardner (USA)
Abstract
For the United States, the greatest opportunity for an extended continental shelf under UNCLOS is in the ice-covered regions of the Arctic north of Alaska. Since 2003, CCOM/JHC has been using the icebreaker Healy equipped with a multibeam echosounder, chirp subbottom profiler, and dredges, to map and sample the region of Chukchi Borderland and Alpha-Mendeleev Ridge complex. These data have led to the discovery of several new features, have radically changed our view of the bathymetry and geologic history of the area, and may have important ramifica-tions for the determination of the limits of a U.S. extended continental shelf under Article 76.
Résumé
En ce qui concerne les Etats-Unis, la plus grande possibilité d‘extension du plateau continental dans le cadre de la Convention des Nations Unies sur le droit de la mer réside dans les régions englacées de l‘Arctique, au nord de l‘Alaska. Depuis 2003, le CCOM/JHC a utilisé le brise-glace HEALY, équipé d‘un sondeur multifaisceaux, d‘un sondeur de sédiment chirp et de dragues, pour cartographier et échantillonner la région de l‘ensemble « Chukchi Borderland » et de l‘« Alpha-Mendeleev Ridge ». Ces données ont conduit à la découverte de plusieurs nouveaux éléments, ont changé radicalement nos points de vue sur l‘histoire de la bathymétrie et de la géologie dans la zone et peuvent avoir des ramifications importantes en ce qui concerne la détermination des limites du plateau continental étasunien étendu dans le cadre de l‘Article 76.
Resumen
Para los Estados Unidos, la mayor oportunidad de extensión de la plataforma continental en el marco de la Convención de las Naciones Unidas sobre la Ley del Mar reside en las regiones cubiertas por el hielo del Artico, al Norte de Alaska. Desde el 2003, el CCOM/JHC ha estado utilizando el rompehielos Healy, equipado de un sondador acústico multihaz, un perfilador de sub-fondo por ondas moduladas en frecuencia, y de rastras, para cartografiar y muestrear la región del conjunto de ―Chukchi Borderland‖ y de la ―Alpha-Mendeleev Ridge‖. Estos datos han llevado al descubrimiento de varias nuevas formas del relieve, han cambiado radicalmente nuestra visión de la historia de la batimetría y la geología en la zona, y pueden tener importantes ramificaciones para la determinación de los límites de la plataforma continental estadounidense ampliada en el marco del Artículo 76.

15
INTERNATIONAL HYDROGRAPHIC REVIEW MAY 2010
Article 76 of The United Nations Convention on the Law of the Sea (UNCLOS; U.N. 1997), stipulates that coastal states may, under certain circumstances, gain sovereign rights over the resources of the seafloor and subsurface of ―…submerged extensions of their conti-nental margin…‖ beyond the recognized 200 nautical mile (nmi) limit of their Exclusive Economic Zone (EEZ). The establishment of an extended continental shelf (ECS) under Article 76 involves the demonstra-tion that the area of the ECS is a ―natural prolongation‖
of a coastal state‘s territorial landmass, and then uses a series of formulae and limit lines that are based on determination of the ―foot of the slope,‖ (defined in Article 76 as ―the maximum change in gradient at its base‖), the underlying sediment thickness, and the loca-tions of the 2500 m isobath and the 350 nmi line from the territorial sea base line to establish the limits of the ECS. Although the United States has not yet acceded to the UNCLOS, increasing recognition that implemen-tation of Article 76 could confer sovereign rights over large and potentially resource-rich areas of the seabed beyond its current 200 nautical mile (nmi) limit has renewed interest in the potential for accession to the treaty and spurred U.S. efforts to map areas of potential extended continental shelf.
A detailed analysis of the relevance of current U.S. data holdings to a potential U.S. submission under Article 76 was conducted by Mayer et al., (2003). This analysis includes the identification of regions where the collec-tion of new, modern multibeam bathymetry data would substantially improve the quality of a potential submis-sion for an extended continental shelf under Article 76. These regions include the east coast of the U.S., areas in the Bering Sea, the Gulf of Mexico, the Chukchi Borderland region of the Arctic and potentially the Gulf of Alaska and areas around Hawaii and other Pacific islands (Guam, Johnston Atoll, etc.). Since the publi-cation of this study, the Center for Coastal and Ocean Mapping/Joint Hydrographic Center at the University of New Hampshire has, through direction and funding from NOAA and the U.S. Extended Continental Shelf Task Force (a multi-agency task force chaired by the State Dept. and co-chaired by NOAA and the USGS), collected more than one million square kilometers of new, high-resolution multibeam sonar data in regions where the U.S. has the potential for an ECS; the most recent overview of these data was presented at the 2008 Canadian Hydrographic Conference (Gardner et al., 2008).
The greatest potential for an extended continental shelf beyond the current 200 nmi limit of the U.S. EEZ is found in the area of the Chukchi Borderland of the Arc-tic Ocean, a tightly clustered group of generally high-standing, N-S-trending bathymetric elevations that form a natural prolongation from the Chukchi Shelf north of Alaska. As noted in the Mayer et al., (2003)
study, this area is also an area where the existing data-base of bathymetric data was far too sparse to support a well-defended ECS submission. For these reasons, the Arctic has become the focus for the collection of new high-resolution multibeam sonar data since 2003. New multibeam data in the Arctic also significantly add to the scientific database needed to support the growing recognition of the critical role that the Arctic Ocean plays in the climatic and tectonic history of Earth (IPCC, 2007). New bathymetric and high-resolution subbottom profiler data (as well as associated CTD measurements) can also help define the nature of deep circulation in the Arctic Basin as well as the history and distribution of ice in the region, a key component in understanding the global climate system.
The Chukchi Borderland juts northward between east-ern Siberia and western Alaska into the deep Amerasia Basin north of the Chukchi Sea (Fig. 1). The border-land occupies a rectangular area about 600 by 700 km, or some four percent of the Arctic Ocean. This area encompasses three, approximately north-south-trending segmented topographic highs: the Northwind Ridge, the Chukchi Cap and Rise, and the western plateaus which are located westward of an agreed maritime boundary line with Russia. The plateau-like crests of the Chukchi Borderland rise, in some cases, as much as 3,400 m above the adjacent basin and they are relatively shallow (depths between 246 and 1,000 m). The ridges have steep flanks, which in some places exhibit remarkable linearity over hundreds of kilometers, especially along the east side of the Northwind Ridge (Fig.1).
Fig. 1. Physiographic map of the Arctic Ocean (after
Jakobsson et al., 2003,2008).

16
INTERNATIONAL HYDROGRAPHIC REVIEW MAY 2010
The University of New Hampshire‘s Center for Coastal and Ocean Mapping/Joint Hydrographic Center (CCOM-JHC) has conducted four cruises to the Chukchi region (2003, 2004, 2007 and 2008) to collect data in support of a potential submission for an extended continental shelf under UNCLOS Article 76. From a bathymetric perspective, the key targets for the establishment of an extended continental shelf for the U.S. in the Arctic are the determination of the location of the foot of the slope and the 2500 m isobath. All of the CCOM-JHC cruises were conducted aboard the U.S. Coast Guard Ice Breaker Healy (WAGB-20 -- Fig. 2) using a 12-kHz L-3 Communications Seabeam 2112 multibeam system as the primary bathymetric data source. Additionally, high-resolution sub-bottom profiles were collected using a Knudsen 320/BR chirp profiler; these profiles proved to be extremely useful for determining morphologic features critical to establishing an ECS. This report summarizes the accomplishments to date of the CCOM-JHC Arctic Ocean mapping.
HEALY 2003:
The initial mission in 2003 was a 10 day, 3000 km long, exploratory cruise (September 1-11, 2003) to demonstrate the viability of using the multibeam echo-sounder to follow specific bathymetric targets (in par-ticular the 2500 m isobath) in ice-covered waters (HLY-0302). The 2003 cruise left from Barrow Alaska and steamed to the US-Russian boundary line at 78° 30'N 168° 25'W and followed the 2500 m contour to 78° 35'N 159° 07'W (Fig. 3). Ice conditions ranged from 70 to 90% coverage of mostly first-year ice. The cruise collected ~3000 km of high-resolution multibeam echo-sounder data and made several significant discoveries including:
substantially changed the position and complexity of the 2500-m isobaths; further evidence for pervasive ice and current ero-sion in deep water (flutes and scours) ; evidence for gas-related features (pock-marks), and ; a previously unmapped seamount that rises more than 3000 m above the surrounding seafloor.
This NE-SW trending seamount, some 18 km wide and 40 km long with a slightly concave and northward tilted crest, has been officially named Healy Seamount (Fig. 3).
Most importantly, the 2003 cruise demonstrated that it was possible to collect useful multibeam echosounder data while operating in 90% ice cover and to follow critical bathymetric targets.
HEALY 2004:
The second cruise, originating in Nome, Alaska and returning to Barrow, Alaska, spent 20 days at sea from October 6 to October 26, 2004 (HLY-0405). This cruise covered approximately 6700 km and completed most of the mapping of the 2500-m isobath that was begun the previous year, as well as a detailed survey of the foot of the slope over a segment of the continental margin east of Barrow, AK (Fig. 4). The total area surveyed during HLY-0405 was approximately 20,000 km2 (5830 nmi2). The Healy transited northward from Nome over the Northwind Ridge until it intersected the 2500 m isobath at approximately 77° 10‘N, 154° W, the point where the 350 nmi cutoff limit from the coast of northern Alaska intersects the 2500 m isobath on the eastern flank of the Northwind Ridge.
Fig.2 The USCGC Healy entering the ice pack in Arctic
Ocean ice. Photo by Steve Roberts NCAR/LDEO.
Fig.3 : Cruise track for HLY-0302 and 3-D image (vertical
exaggeration 4x) of Healy Seamount, discovered on this cruise.
Healy Seamount did not appear on any previous chart and
rises more than 3000 m above the surrounding seafloor.

17
INTERNATIONAL HYDROGRAPHIC REVIEW MAY 2010
Ice was first encountered at about 76˚N, and by 77˚N the ice was very heavy 90 to 100% with significant percentages of multi-year ice, many ridges and very few leads. Progress was slow and the Healy often had to back and ram. Nonetheless, the 2500 m isobath was mapped along the Northwind Ridge to approximately 78° 45‘N. During this time, only ~185 km were covered in 4 days. Data were difficult to collect in these conditions and data quality suffered but the 2500 m isobath was still clearly defined. About 5000 km2 (1458 nmi2) of seafloor was mapped during the transect to the north and back (Fig. 4).
At 78° 45‘N, the Healy had great difficulty breaking through the multiyear ice ridges (one ridge took more than eight hours to break through) and the decision was made to move south to the relatively ice-free waters of the continental slope east of Barrow.
This area was chosen so that the foot of the slope could be defined in the central portion of the northern Alas-kan margin. The foot of the slope can be used in this region as a starting point for determination of the ―Gardiner Line‖ – one of the formula lines used for making an ECS submission under UNCLOS Article 76. Complete overlapping multibeam bathymetry was col-lected over a region of 15,435 km2 (4500 nmi2), that ranges in water depth from about 650 m to 3900 m. This margin is dominated by a series of 400 to 600 m high ridges that extend to the NNW for more than 80 km from the upper slope. The ridges appear to be, at least in part, sedimentary in origin, possibly through an interaction of a strong geostrophic slope current and Mackenzie River sediment that has reached the slope
(Fig. 4).
Fig. 4: Cruise track for HLY-0405 and 3-D image (vertical exaggeration 12x) of the full-
coverage mapping of a 15,435 km2 area of the Barrow Margin. This region was mapped when
heavy ice prevented mapping at the top of Chukchi Cap.
18
INTERNATIONAL HYDROGRAPHIC REVIEW MAY 2010
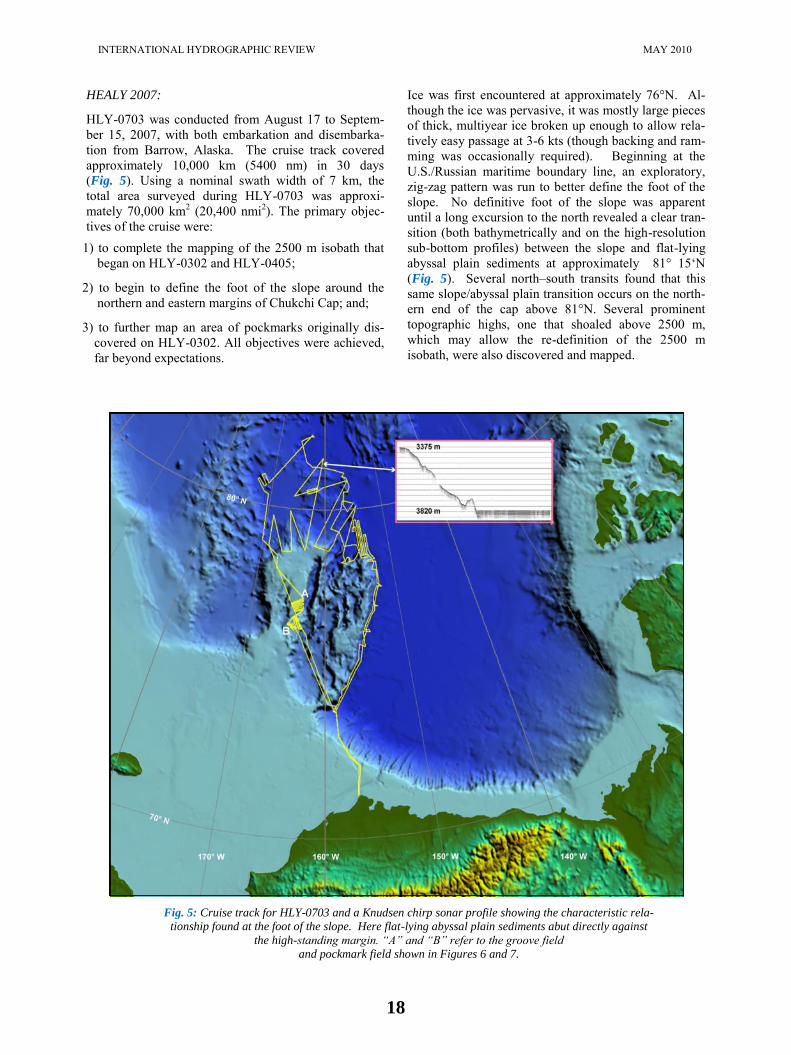
HEALY 2007:
HLY-0703 was conducted from August 17 to Septem-ber 15, 2007, with both embarkation and disembarka-tion from Barrow, Alaska. The cruise track covered approximately 10,000 km (5400 nm) in 30 days (Fig. 5). Using a nominal swath width of 7 km, the total area surveyed during HLY-0703 was approxi-mately 70,000 km2 (20,400 nmi2). The primary objec-tives of the cruise were:
1) to complete the mapping of the 2500 m isobath that began on HLY-0302 and HLY-0405;
2) to begin to define the foot of the slope around the northern and eastern margins of Chukchi Cap; and;
3) to further map an area of pockmarks originally dis-covered on HLY-0302. All objectives were achieved, far beyond expectations.
Ice was first encountered at approximately 76°N. Al-though the ice was pervasive, it was mostly large pieces of thick, multiyear ice broken up enough to allow rela-tively easy passage at 3-6 kts (though backing and ram-ming was occasionally required). Beginning at the U.S./Russian maritime boundary line, an exploratory, zig-zag pattern was run to better define the foot of the slope. No definitive foot of the slope was apparent until a long excursion to the north revealed a clear tran-sition (both bathymetrically and on the high-resolution sub-bottom profiles) between the slope and flat-lying abyssal plain sediments at approximately 81° 15‘N (Fig. 5). Several north–south transits found that this same slope/abyssal plain transition occurs on the north-ern end of the cap above 81°N. Several prominent topographic highs, one that shoaled above 2500 m, which may allow the re-definition of the 2500 m isobath, were also discovered and mapped.
Fig. 5: Cruise track for HLY-0703 and a Knudsen chirp sonar profile showing the characteristic rela-
tionship found at the foot of the slope. Here flat-lying abyssal plain sediments abut directly against
the high-standing margin. “A” and “B” refer to the groove field
and pockmark field shown in Figures 6 and 7.

19
INTERNATIONAL HYDROGRAPHIC REVIEW MAY 2010
A well-developed foot of the slope was traced down and then back up the eastern side of Northwind Ridge, revealing a very sharp and clear slope/abyssal plain transition where the abyssal plain sediments consis-tently occur at a depth of approximately 3820 m. Fol-lowing this transition to the north, allowed the clear definition of a continuous foot of the slope around the northern most extreme of Chukchi Cap to the northern-most point of the survey (82° 17‘N); at this location, the slope/abyssal plain transition appears to continue to the north and east.
Several large and well-defined pockmarks (probably related to gas extrusion) were discovered during HLY-0302 in a shallow region of the Chukchi Cap at ap-proximately 76° 30‘N, 163° 50‘W. The survey of this region was extended in 2007 to generate a better map of the distribution of these pockmarks. An approxi-mately 40 km by 14 km area was mapped revealing numerous pockmarks of various sizes, but typically 300-400 m in diameter and 30 to 50 m deep (Fig. 5)
[labeled B], 6).
Simultaneous collection of subbottom profiles revealed an apparent relationship to subsurface faulting but the nature of this relationship will need further study. A remarkable group of 20 pockmarks were mapped that form a circular ring that is 4 km in diameter (Fig. 6).
Abutting the pockmark area is a series of closely spaced, NW-SE oriented, parallel grooves in water depths of 400 to 500 m. Given the parallel nature of these features, they appear to be related to ice-sheet flow rather than individual icebergs scours. Even more intriguingly, south of these grooves, as the water depths get slightly deeper, there is a series of large, dune-like features that appear erosional in origin in the high-resolution subbottom profiles (Fig. 7). We speculate that these may be related to flow under an ice-shelf that was not grounded but was near the seafloor.
Fig.6: Pockmarks found on HLY-0302 and 0703, including a near-circular ring of pockmarks. For location see ―B‖ on Figure 5. Pockmarks are typically about 300 to 400 m in diameter and 30 to 50 m deep. These examples are found in approximately 500 m of water.
Fig.7: Closely-spaced parallel grooves found on HLY-0703. For location see ―A‖ on Figure 5. Grooves are typically 2 to 5 m deep and have a spacing of 150 to 200 m.

20
INTERNATIONAL HYDROGRAPHIC REVIEW MAY 2010
HEALY 2008:
The fourth bathymetric survey leg, HLY-0805, departed Barrow on 14 Sept. 2008 and steamed north to resume mapping of the region thought to represent the foot of the slope in the vicinity of 82° N, 162° W. Mapping continued east to follow the morphologic expression of the base of the slope until approximately 150° W where the character of the base of the slope changed and the mapping switched to a reconnaissance mode. This mode of survey continued until the eastern-most extent of the survey was reached at approximately 139° W. At this point, several regions that were suspected to shoal above 2500 m were mapped. A total of 5767 km were surveyed (3114 nmi) on HLY-0805 covering an area of approximately 34,600 km2 (assuming an average swath width of 6 km) (Fig. 8).
HEALY-0805 also dredged key areas on the Alpha-
Mendeleev Ridge complex and the Chukchi Cap-Northwind Ridge in order to better understand the geo-logic and tectonic history of this remote region. A total of seven dredges were taken, four on the southern portions of the Alpha-Mendeleev Ridge complex, two on ridges north of the Chukchi Borderland and one in the northwestern Northwind Ridge area (Fig 8).
The first dredge site on the southern Alpha-Mendeleev Ridge complex yielded samples from an outcrop of layered tuffaceous rock (hyaloclastite) that appears to represent a deposit of a shallow phreatomagmatic eruption (Mayer et al., 2008; Brumley et al., 2008).
The second dredge from the same vicinity contained over 90 kg of mud and ice rafted debris (IRD). The third dredge, from another feature on the southern Alpha-Mendeleev Ridge Complex, also brought back only mud and IRD. The fourth dredge, from the same general vicinity as the third, was predominantly mud and IRD; however, the dredge haul also included iron concretions and manganese crusts along with one sample of a possible altered ash deposit. The fifth dredge, from the northern margin of the Chukchi Borderland, recovered more than 450 kg of mud with about 2.25 kg of IRD of various rock types. The sixth dredge from a very steep (~ 60°) slope on the northern Chukchi Borderland was mud free and contained more than 90 kg of basalts, some with fresh glassy rims and pillow-like structures that appear to have erupted within continental material (Andronikov et al., 2008). Finally, the seventh dredge from the western wall of Northwind Ridge had very little mud but more than 300 kg of rocks that probably represent both outcrop and angular talus from the foot of the steep slope from which it was dredged. Samples from this dredge contain a range of rock types including sedimentary (including sandstones and mudstones), metamorphic, and basaltic, all support-ing the notion that Chukchi Cap is of continental origin. Further analyses of all of the dredge samples are currently underway.
Fig. 8: . Cruise track for HLY-0805 showing location of dredge stations.

21
INTERNATIONAL HYDROGRAPHIC REVIEW MAY 2010
A second expedition took place in 2008 (HLY-0806) that was a collaborative effort between Canada and the U.S. During this two-ship effort, Healy broke ice ahead of the Canadian icebreaker Louis S. St. Laurent so that it could collect deep seismic-reflection profiler data (in order to measure sediment thickness) in the open water created by the Healy. A 2009 cruise to the
Arctic is planned, again in company with the Louis S.
St. Laurent and again with the primary purpose of col-lecting seismic data from the Louis S. St. Laurent. All bathymetric data collected during Law of the Sea cruises on the Healy and full cruise reports of each of the expeditions described here can be found at the CCOM/JHC website: http://www.ccom.unh.edu/law.of.the.sea.html/.
CONCLUSIONS:
Four expeditions on the USCG Cutter Healy to the ice-covered regions of the Arctic have demonstrated that it is possible to use an icebreaker equipped with a modern multibeam sonar system to collect high-resolution bathymetric data and to trace bathymetric features even in 90 to 100% coverage of first year ice. In multi-year ice with few leads it was possible, but very difficult, to collect usable data and progress was very slow (averaging less than 1 knot). Since 2003, more than 150,000 km2 of new multibeam sonar data have been collected in the region of the Chukchi Borderland and the Alpha-Mendeleev ridge complex. The primary motivation for these surveys was to collect data in sup-port of a possible U.S. submission for an extended continental shelf under Article 76 of the United Nations Convention on the Law of the Sea. The data collected thus far have dramatically changed our knowledge of the bathymetry of this region of the Arctic; numerous new features have been mapped including a newly named seamount (Healy Seamount) that stands more than 3000 m above the surrounding seafloor. The new data will have significant impact on a potential U.S. submission under Article 76 as they demonstrate that the ―foot of the slope,‖ the key feature from which the limits of an extended continental shelf is determined, is much further seaward than previously recognized. Preliminary analyses of dredge samples taken on one of the Healy cruises in the regions of Chukchi Cap and the Alpha-Mendeleev ridge complex also call into question previous notions of the geologic origins of these fea-tures and may also have implications for an Article 76 submission.
In addition to its value for Law of the Sea, the multi-beam sonar data and dredge samples collected during the Healy expeditions will have important implications on our overall understanding of Arctic geology and processes.
The bathymetry and rock samples collected are already becoming critical components of regional reconstruc-tions of the tectonic and geologic history of the region (e.g. Brumley et al, 2008; Andronikov et al. 2008). Newly mapped fields of pockmarks are indicative of hydrocarbon potential and may host chemosynthetic communities and the discovery of a series of closely spaced, NW-SE oriented, parallel grooves in water depths of 400 to 500 m far out on the Chukchi Cap im-plies that there was a grounded ice-sheet more than 400 nmi from the nearest land. Understanding how an ice-sheet formed so far from land will require a rethink-ing of current ice models for the region.
All bathymetric data collected on U.S. ECS mapping cruises, including those in the Arctic are made available to the public soon after collection. The data as well as 3-D models can be found at http://www.ccom.unh.edu/law.of.the.sea.html or the National Geophysical Data Center. Future expeditions, planned for 2009 and be-yond will likely add even more to our growing knowl-edge to this critically important, yet difficult to study, region. ACKNOWLEDGEMENTS:
The authors would like to thank the commanding offi-cers and crews of Healy cruises 0302, 0405, 0703 and 0805 for their skill and professionalism. We would also like to particularly acknowledge the invaluable assistance of Dale Chayes (LDEO) and Steve Roberts (LDEO/UCAR) in all aspects of data collection and manipulation. The work of the UNH CCOM-JHC has been supported by NOAA Grants NA17OG2285 and NA0NOS4001153.
______________________ Réferences
Andronikov, A., Mukasa, S., Mayer, L.A., and Brum-ley, K. (2008). First recovery of submarine basalts from the Chukchi Borderland and Alpha/Mendeleev Ridge region, Arctic Ocean, EOS, Trans AGU, 80(53), Fall Meet. Suppl., Abstract V41D-2124 Brumley, K., Mayer, L.A., Miller, E. L., and Coakley, B. (2008). Dredged Rock Samples from the Alpha Ridge, Arctic Ocean: Implications for the Tectonic History and Origin of the Amerasian Basin, Eos Trans
AGU, 89(53), Fall Meet. Suppl., Abstract T43B-2013. Gardner, J.V., Mayer, L.A. and Armstrong, A., (2008). From the Arctics to the tropics: The U.S. UNCLOS bathymetric mapping program, Proceedings of the
Canadian Hydrographic Conference and National
Surveyors Symposium, 2008.

22
INTERNATIONAL HYDROGRAPHIC REVIEW MAY 2010
Jakobsson, M., Macnab, R., Mayer, L., Anderson, R., Edwards, M., Hatzky, J., Schenke, H-W. and Johnson, P. (2008). An improved bathymetric portrayal of the Arctic Ocean: Implications for ocean modeling and geological, geophysical and oceanographic analyses, Geophysica l Research Let ters , v . 35, doi:10.1029/2008kkGLO33520 Jakobsson, M., Grantz, A., Kristoffersen, Y., and Macnab, R. (2003), Physiographic provinces of the Arctic Ocean floor, GSA Bulletin, v. 115, no. 11, p. 1143-1455. Mayer, L.A., Brumley, K., Andronikov, A ., Chayes, D. N., Armstrong, A. A., Calder, B., Hall, J. K., Clyde, W.C., Bothner, W.A., and Gardner, J.V. (2008). Recent Mapping and Sampling on the Chukchi Borderland and Alpha/Medeleev Ridge, Eos Trans.
AGU, 89(53), Fall Meet. Suppl., Abstract C11C-0516. United Nations, (1997). The Law of the Sea: United Nations Convention on the Law of the Sea, Division for Ocean Affairs and the Law of the Sea, Office of Legal Affairs, United Nations Publication E. 97.V.10, 224 pp.
_____________________ Biographies of the Authors
Larry Mayer is a Professor and the Director of the Center for Coastal and Ocean Mapping at the Univer-sity of New Hampshire. He graduated magna cum laude with an Honors degree in Geology from the Uni-versity of Rhode Island in 1973 and received a Ph.D. from the Scripps Institution of Oceanography in Marine Geophysics in 1979. At Scripps he worked with the Marine Physical Laboratory's Deep-Tow Geophysical package, applying this sophisticated acoustic sensor to problems of deep-sea mapping and the history of climate. After being selected as an astronaut candidate finalist for NASA's first class of mission specialists, Larry went on to a Post-Doc at the School of Oceanog-raphy at the University of Rhode Island where he worked on the early development of the Chirp Sonar and problems of deep-sea sediment transport and paleoceanography. In 1982, he became an Assistant Professor in the Dept. of Oceanography at Dalhousie University and in 1991 moved to the University of New Brunswick to take up the NSERC Industrial Research Chair in Ocean Mapping.
In 2000 Larry became the founding director of the Cen-ter for Coastal and Ocean Mapping at the University of New Hampshire and the co-director of the NOAA/UNH Joint Hydrographic Center. He is currently co-chair of the NOAA‘s Ocean Exploration Advisory Working Group, a member of the National Science Foundation‘s Ocean Observatories Initiative Program Advisory Committee, and the State Dept‘s Extended Continental Shelf Task Force. Larry's present research deals with sonar imaging and remote characterization of the seafloor as well as advanced applications of 3-D visualization to ocean mapping problems and applica-tions of mapping to Law of the Sea issues, particularly in the Arctic.
Captain Armstrong is the NOAA Co-Director of the Joint Hydrographic Center at the University of New Hampshire. Along with his UNH counterpart, he man-ages the research, mapping, and educational programs of the Center. He has been actively involved in the Joint Hydrographic Center UNCLOS efforts, including serving as Co-Chief Scientist on the Center‘s Arctic seafloor mapping cruises. He is past president of The Hydrographic Society of America and a member and past chair of the FIG/IHO/ICA International Advisory Board on Standards of Competence for Hydrographic Surveyors and Nautical Cartographers. Captain Arm-strong has over 35 years of hydrographic experience with NOAA, including positions as Officer in Charge of hydrographic field parties, Commanding Officer of NOAA Ship Whiting, and Chief of NOAA‘s Hydro-graphic Surveys Division. He has a B.S. in geology from Tulane University and an M.S. in technical management from The Johns Hopkins University
Dr. Brian Calder is a Research Associate Professor at the Center for Coastal and Ocean Mapping & Joint Hydrographic Center at the University of New Hamp-shire. He graduated MEng and PhD in Electrical & Electronic Engineering from Heriot-Watt University in Edinburgh, Scotland in 1994 and 1997 respectively, but was subsequently seduced into sonar signal processing for reasons that are now obscure. His research interests have previously covered speech recognition, texture analysis, object detection in sidescan sonar, high-resolution sub-bottom profiling, simulation of forward-looking passive infrared images, acoustic modeling and pebble counting. Currently, they revolve around the application of statistical models to the problem of hydrographic data processing; ocean mapping, and associated technologies
.

23
INTERNATIONAL HYDROGRAPHIC REVIEW MAY 2010
James V. Gardner is a marine geologist and Research Professor at the University of New Hampshire‘s Center for Coastal and Ocean Mapping. His research is focused on deep-seafloor mapping with multibeam echosounders, marine geomorphology and deep-sea processes. He received a B.S. in geology from San Diego State University in 1967 and a Ph.D. in 1973 in marine geology from Columbia University-Lamont-Doherty Earth Observatory. Jim joined the U.S. Geological Survey‘s Pacific Marine Geology group in Menlo Park, CA at the where he worked for 30 years on a wide variety of seafloor mapping, marine sedimentological and paleoceanographic problems in the Bering Sea, North and South Pacific Ocean, north-east Atlantic Ocean, Gulf of Mexico, Caribbean and Mediterranean Seas, and the Coral Sea. Jim joined the University of New Hampshire in 2003 where he is in charge of the U.S. Law of the Sea bathymetry cruises as well as involved in research methods to extract meaningful geological information from multibeam acoustic backscatter through ground truth and advanced image analysis methods.
______________________

24
INTERNATIONAL HYDROGRAPHIC REVIEW MAY 2010
SHOALS Object Detection
By Eric Yang and Paul E. LaRocque (Canada) Optech Incorporated, 300 Interchange Way, Vaughan
Ontario, Canada
Abstract
For the past decade, SHOALS (Scanning Hydrographic Operational Airborne Lidar Survey) has proven to be an efficient and cost-effective means for large-area coastal mapping projects. However, its capabilities in the rapid reconnaissance of small underwater obstructions have been less appreciated, despite a demonstrated history of successful detection and spatial identification. This paper discusses SHOALS‘ object detection capabilities in light of the recent developments in object detection algorithms, with multiple situation studies to illustrate its overall performance and latest enhancements. Various aspects of object detection using airborne bathymetric lidar are discussed to highlight the challenges and advantages of using SHOALS for rapid reconnaissance of small underwater obstructions.
Résumé
Au cours de la dernière décennie, SHOALS (Scanning Hydrographic Operational Airborne Lidar Survey) s‘est révélé être un instrument efficace et rentable en ce qui concerne les projets de carto-graphie côtière à grande échelle. Toutefois, ses capacités en matière de reconnaissance rapide des petites obstructions sous-marines ont été moins appréciées malgré des antécédents avérés de détection réussie et d‘identification spatiale. Cet article traite des capacités de détection d‘objet du SHOALS à la lumière des récents développements intervenus dans les algorithmes de détection d‘objets, avec de nombreuses études de situations qui illustrent l‘ensemble de ses performances et les dernières améliorations. Divers aspects de la détection d‘objets à l‘aide du lidar bathymétrique aéroporté ont été abordés dans le but de souligner les défis et les avantages de l‘utilisation du SHOALS pour la reconnaissance rapide des petites obstructions sous-marines.
Resumen
Durante la última década, SHOALS (Scanning Hydrographic Operational Airborne Lidar Survey) ha demostrado ser un medio eficaz y económico en lo que se refiere a proyectos de cartografía costera a gran escala. Sin embargo, sus capacidades en materia de reconocimiento rápido de pequeñas obstrucciones submarinas han sido menos apreciadas, a pesar de los antecedentes manifiestos de una lograda detección y de una identificación espacial. Este artículo trata sobre las capacidades de detección de objetos del SHOALS a la luz de los recientes desarrollos acaecidos en los algoritmos de detección de objetos, con múltiples estudios de situaciones para ilustrar su funcionamiento general y sus últimas mejoras. Se han abordado varios aspectos de la detección de objetos que utilizan el lidar batimétrico aerotransportado para destacar los retos y las ventajas del uso del SHOALS para un reconocimiento rápido de pequeñas obstrucciones submarinas.

25
INTERNATIONAL HYDROGRAPHIC REVIEW MAY 2010
1. Introduction
One of the fundamental requirements of hydrographic surveys is to detect underwater objects or obstructions. IHO-1 surveys require that all features larger than 2-m cubes be identified in water depths up to 40 m, whereas the corresponding requirement for IHO Special Order is to detect 1-m cubes (IHO 2008).
Although SHOALS has been widely accepted as an efficient and cost-effective means for large-area coastal mapping projects, whose depth measurement accuracy meets and exceeds IHO-1 requirements (Lockhart et al. 2005; LaRocque et al. 2004), there has been consider-able debate over its capabilities in the rapid reconnais-sance of small underwater obstructions and targets, partly because of misunderstanding and ambiguity in communication. It can be argued that poor perception, rather than technological limitations, has been the limit-ing factor on applications of airborne lidar in hydro-graphic surveys (West, Lillycrop 1999).
Since the ability to detect underwater objects is crucial for SHOALS to perform as a fully functional hydro-graphical survey tool, Optech has made further efforts to improve SHOALS‘ object detection capability. Test results revealed that SHOALS is not only capable of reliably detecting 2-m cubes to meet IHO-1 require-ments, but also capable of consistently detecting 1-m cubes under normal clean water conditions and poten-tially 0.5-m cubes under ideal circumstances.
This paper will examine SHOALS‘ enhanced object detection capability, and provide both analytical and empirical results. The analytical discussions are based on the sensor configuration and associated parameters of the current SHOALS-3000 system. Case studies are presented to illustrate automatic identification of under-water features using the SHOALS ground control soft-ware (GCS).
2. Overview of SHOALS object detection
In bathymetric lidar, many factors contribute to the abil-ity and probability of detecting underwater objects, in-cluding water depth, water clarity, object dimensions, object/bottom reflectivity, system configuration, survey planning, and data processing, as well as sophisticated algorithms to automatically identify underwater anoma-lies.
One of the most obvious factors affecting bathymetric lidar surveys is water clarity, which not only limits the maximum measurable depth, but also considerably af-fects underwater object detectability. For detecting un-derwater objects with limited dimensions, lidar point density also plays a significant role. In general, two key factors define object detectability: 1) the probability that the object will be illuminated (wholly or partly) by the laser footprint, which depends on the effective laser footprint size and lidar point density; 2) the ability to identify the object return signal from its surroundings,
which depends on the significance of the object return signal and the sensitivity of the object detection algo-rithm to discern object signatures.
In practice, the criteria for selecting objects from vari-ous bottom anomalies and features (with variable di-mensions) also play a part in the final result of object identification. This can sometimes cause confusion when comparing detection lists from different methods or from those manually selected by different individu-als. We distinguish between object detection, which depends upon the hardware parameters, environmental conditions and algorithms, and object selection, which is more dependent upon subjective items such as the methodology and selection criteria. The focus of this paper is more on object detection.
In 1996, an analytical study was conducted on the per-formance of bathymetric lidar in underwater obstruction detection, based on parameters and algorithms in use at that time (Guenther et al. 1996). Multiple scenarios with different object dimensions, water conditions, and lidar point densities were discussed in that study, which re-sulted in predictions of target detection probabilities under various scenarios for the SHOALS system. As an example, Figure 1 shows the analytical results of detec-tion probabilities for 4-m2 circular cylinders in various water clarities, with 1-m and 2-m target heights, using 4 m × 4 m lidar point density. Apparently, objects with 2-m height and 4-m2 surface area can be detected with almost unit probability in clear water conditions, even with 4 m × 4 m spot spacing, which meets IHO-1 re-quirements. It is noteworthy that the criteria for positive object identification are based on either distinctive bot-tom peak separation (Type-1 detection) or a correct reading of least depth from the merged bottom peak (Type-2 detection). Type-1 detection occurs when the return signals from both the object and the water bottom can be discerned separately and measured using the traditional depth extraction algorithms. Type-2 detection occurs when the return signal from the target surface area overshadows that of the water bottom.
Figure 1: Detection probabilities for 4-m2 circular
cylinders in various water clarities, with 1-m and 2-m
target heights, using a 20° nadir angle and 4 m × 4 m
lidar point density (Guenther et al 1996).

26
INTERNATIONAL HYDROGRAPHIC REVIEW MAY 2010
The practical experience of several SHOALS users supported and frequently exceeded the performance expectation of the analytical predictions and demon-strated that airborne lidar bathymetry is commonly ca-pable of detecting small features and objects to meet IHO-1 requirements (West, Lillycrop 1999) (Guenther 2007) (Lockhart et al. 2005).
One of the unique design parameters of SHOALS was to have two depth channels. One was optimized for deep water to 50 meters and one was optimized for shallow water from zero to ~ 17 meters. The deep chan-nel has a large receiver Field of View (FOV) and the shallow depth channel has a smaller FOV of ~ 15 mrad. This enhances object detection capability as discussed later.
Since 1996, SHOALS has undergone substantial up-grades in hardware, software and algorithms (LaRocque et al. 2004) (LaRocque et al. 2005) (Yang et al. 2007), which has also enhanced its performance in underwater object detection. With the addition of higher point densities, up to 2 m × 2 m spot spacing, the geometric searching capability has drastically im-proved, with virtually 100% bottom illumination by a single coverage. Most important, Optech‘s latest efforts to improve the object detection algorithm, whose predecessor was merely a by-product of traditional depth extraction algorithms, have revealed that the SHOALS system is much more capable than was ini-tially predicted (Guenther et al. 1996) in terms of ob-ject resolution and detectability when the sophisticated algorithm is used. The significant enhancement in SHOALS‘ object detection capability is therefore pri-marily due to algorithmic advances in identifying ab-normal bottom returns, with experience built upon Op-tech‘s latest success with the shallow water algorithm (SWA) (Yang et al. 2007).
3. Enhanced object detection and categoriza-
tion
3.1. Enhanced object detection
The SHOALS laser beam strikes the air/water interface with a footprint size of about 2 m and a constant inci-dent angle of about 20° (LaRocque et al. 2004).
Although such a configuration originally considered eye-safety, depth penetration, water surface detectabil-ity, and minimization of propagation biases, it is also beneficial for underwater object detection in terms of geometric searching, object differentiation and consis-tency across the scan swath. Because the laser beam further expands in the water column, often significantly, owing to scattering from entrained particulates, it en-sures that 100% bottom illumination is achievable even with a lesser lidar point density, such as 3 m × 3 m. Fur-thermore, with the current configuration of the SHOALS-3000 system, the programmable scanner pat-terns allow lidar point density to vary from 2 m × 2 m to 5 m × 5 m (LaRocque, Yang 2010) (Table 1). This means that SHOALS-3000 is virtually a complete bottom imager from shallow to deep water, capable of illuminating single rocks or objects sitting on top of a relatively flat bottom surface.
If 100% bottom illumination is assured by using suit-able point density patterns, object detectability relies on the capability of identifying an object from its return signal, which is usually compounded by the return sig-nal from the water column and bottom. Traditionally, the approach to identifying an object involves resolving distinguishable return signals from both the object and bottom. This works in cases where the object dimen-sions are greater than what can be resolved by the tradi-tional pulse location algorithms (Guenther et al. 1996). Because the laser footprint is usually greater than 2 m in diameter when reaching the bottom, depending on water depth and water properties, objects the size of 2-m cubes (or smaller) are usually covered entirely by laser footprints, introducing distortions to the return signal normally dominated by the bottom return signal. If such distortion is significant enough to produce a separate and resolvable return signal from the object surface, it will be recognized as an object by the traditional method. In cases where an object is significantly larger than the laser footprint, the return signal from the object may be reflected entirely from the top of the object with no sign of distortion.
Table 1: Scan patterns for SHOALS-3000

27
INTERNATIONAL HYDROGRAPHIC REVIEW MAY 2010
However, such objects will also be identified in the lidar point clouds because of their raised elevations. In general, objects larger than the laser footprint will al-ways be captured, whereas objects comparable to the size of the laser footprint will usually be recognized by the traditional method of object identification. The traditional method of object detection is limited by its ability to identify smaller objects that are insufficient to produce separate object and bottom returns. Figure 2
shows two waveforms from two underwater objects sitting side by side at a depth of about 9 m. These two targets were man-made objects with known dimensions.
In Figure 2 the waveform on the left is from a 1-m cube, whereas the waveform on the right is from a 2-m cube. The 2-m cube produced clear separation between the bottom return (marked with a blue dot) and the target return (marked with a red dot), and would be identified by the traditional method of object identifica-tion.
However, the waveform produced by the 1-m cube showed only a single peaked bottom return with an inflection at the leading edge of the bottom signal. This kind of waveform would not be tagged by any of the traditional algorithms; therefore it would derive a normal bottom elevation (or water depth) without no-tice. As a matter of fact, the location of the blue dot indicates that this waveform will result in an elevation (or water depth) referenced to the true bottom, which means the existence of the target is totally ignored. No matter how carefully the bottom surface and lidar point clouds are examined and analyzed, this 1-m cube would be completely invisible.
The enhanced object detection algorithm takes into consideration the situation shown in Figure 2, as well as many other variants of distorted bottom return
signals from bottom features. The basic approach of the enhanced object detection algorithm is that any illumi-nated objects will distort the waveforms, which will then trigger a sophisticated algorithm for object recog-nition.
3.2. Object categorization and case definitions
Case 1: These objects are features that are larger than the laser footprint. Figure 3 illustrates the categoriza-tion of Case 1 objects, where the sizes are significantly larger than the laser footprint size (~ 2 m). The numer-ous features on the sea floor are easily identifiable in the lidar point clouds; although individual waveforms reflected from these features do not show any differ-ences than those from flat sea bottom, such as the sam-ple waveform inset in the image. The Case 1 features represent the conventional objects that many people refer to (Smith 2006), but they only account for a very small portion of the objects detectable by the SHOALS system. Identification of the Case 1 object is based on spatial analysis, and it is applicable for larger features as well as cases where return signals from the object surface area overshadow those of the water bottom in optically deep water. The Case 1 identification also depends on object definition and selection criteria.
Case 2: Any objects of comparable size to the laser footprint (i.e., similar to a 2-m cube) will mostly be identifiable by the traditional method of object detec-tion. In Figure 4 we show detection of a Case 2 object.
The sample waveform clearly shows a separation between object return and bottom return, which is the criteria for Case 2 object detection. This object detec-tion strategy works very well when the object size is comparable to the laser footprint size on the bottom. This ability to detect an object within the laser footprint is one of the major characteristics of the airborne bathy-metric lidar (such as SHOALS) compared to the multi-beam echo sounder (MBES), although the latter has much greater point density to detect Case 1 objects. Because SHOALS maintains a surface laser footprint of approximately 2 m that expands further in the water column, often significantly, the return signal from an object with size comparable to the laser footprint is usually followed by a signal reflected from the sea bot-tom. Such a physical phenomenon does not stop the feature from being detected by properly-designed pulse-detection software. Indeed, this very beam spreading actually increases the feature detection probability in shallow water for limited spot spacing. As part of the SHOALS object detection strategy, any waveforms with reliable second returns are categorized as object waveforms, which trigger the Case 2 object detection. Figure 4 shows the detection of a 2-m cube under about 11 meters of water
Figure 2: Sample waveforms from two targets of different size
sitting side by side under about 9 m of water.
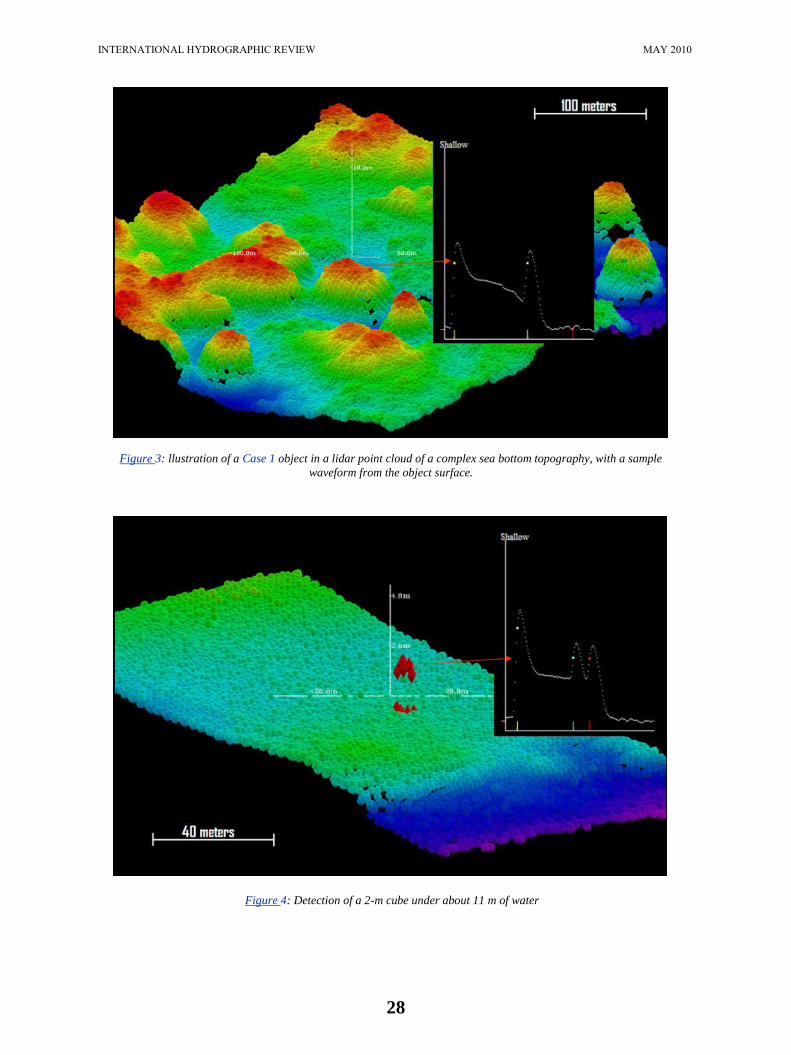
28
INTERNATIONAL HYDROGRAPHIC REVIEW MAY 2010
Figure 3: llustration of a Case 1 object in a lidar point cloud of a complex sea bottom topography, with a sample
waveform from the object surface.
Figure 4: Detection of a 2-m cube under about 11 m of water
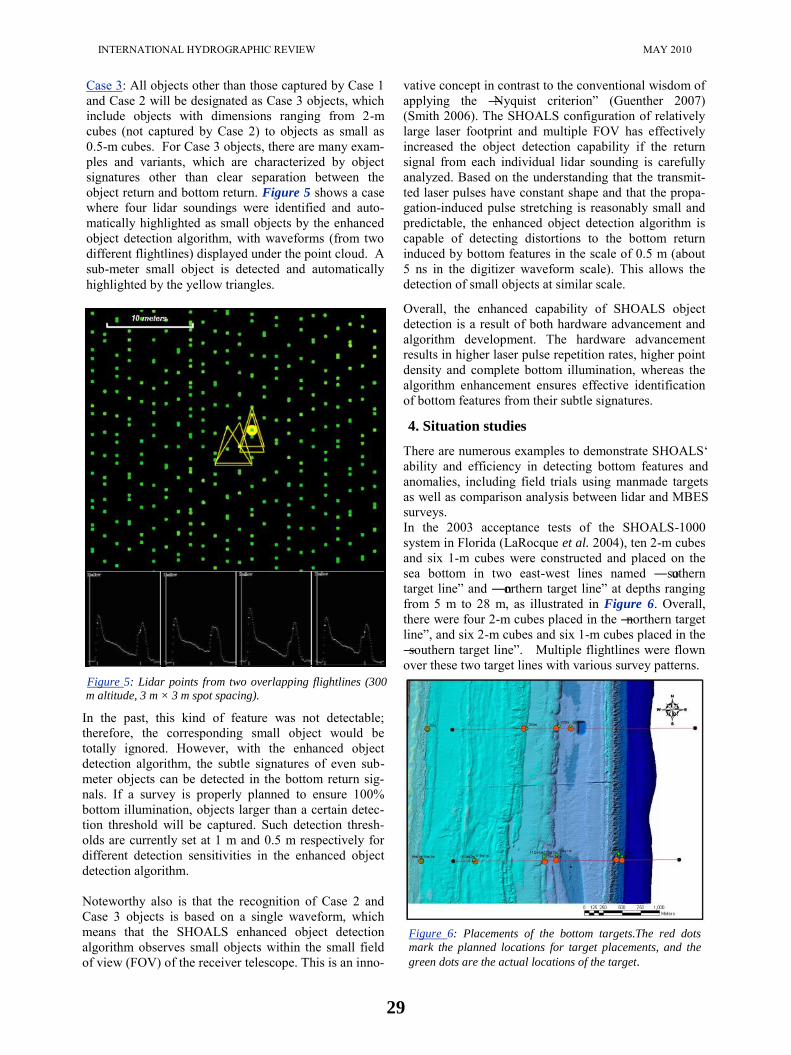
29
INTERNATIONAL HYDROGRAPHIC REVIEW MAY 2010
Case 3: All objects other than those captured by Case 1 and Case 2 will be designated as Case 3 objects, which include objects with dimensions ranging from 2-m cubes (not captured by Case 2) to objects as small as 0.5-m cubes. For Case 3 objects, there are many exam-ples and variants, which are characterized by object signatures other than clear separation between the object return and bottom return. Figure 5 shows a case where four lidar soundings were identified and auto-matically highlighted as small objects by the enhanced object detection algorithm, with waveforms (from two different flightlines) displayed under the point cloud. A sub-meter small object is detected and automatically highlighted by the yellow triangles.
Figure 5: Lidar points from two overlapping flightlines (300
m altitude, 3 m × 3 m spot spacing).
In the past, this kind of feature was not detectable; therefore, the corresponding small object would be totally ignored. However, with the enhanced object detection algorithm, the subtle signatures of even sub-meter objects can be detected in the bottom return sig-nals. If a survey is properly planned to ensure 100% bottom illumination, objects larger than a certain detec-tion threshold will be captured. Such detection thresh-olds are currently set at 1 m and 0.5 m respectively for different detection sensitivities in the enhanced object detection algorithm. Noteworthy also is that the recognition of Case 2 and Case 3 objects is based on a single waveform, which means that the SHOALS enhanced object detection algorithm observes small objects within the small field of view (FOV) of the receiver telescope. This is an inno-
vative concept in contrast to the conventional wisdom of applying the ―Nyquist criterion‖ (Guenther 2007) (Smith 2006). The SHOALS configuration of relatively large laser footprint and multiple FOV has effectively increased the object detection capability if the return signal from each individual lidar sounding is carefully analyzed. Based on the understanding that the transmit-ted laser pulses have constant shape and that the propa-gation-induced pulse stretching is reasonably small and predictable, the enhanced object detection algorithm is capable of detecting distortions to the bottom return induced by bottom features in the scale of 0.5 m (about 5 ns in the digitizer waveform scale). This allows the detection of small objects at similar scale.
Overall, the enhanced capability of SHOALS object detection is a result of both hardware advancement and algorithm development. The hardware advancement results in higher laser pulse repetition rates, higher point density and complete bottom illumination, whereas the algorithm enhancement ensures effective identification of bottom features from their subtle signatures.
4. Situation studies
There are numerous examples to demonstrate SHOALS‘ ability and efficiency in detecting bottom features and anomalies, including field trials using manmade targets as well as comparison analysis between lidar and MBES surveys. In the 2003 acceptance tests of the SHOALS-1000 system in Florida (LaRocque et al. 2004), ten 2-m cubes and six 1-m cubes were constructed and placed on the sea bottom in two east-west lines named ―southern target line‖ and ―northern target line‖ at depths ranging from 5 m to 28 m, as illustrated in Figure 6. Overall, there were four 2-m cubes placed in the ―northern target line‖, and six 2-m cubes and six 1-m cubes placed in the ―southern target line‖. Multiple flightlines were flown over these two target lines with various survey patterns.
Figure 6: Placements of the bottom targets.The red dots
mark the planned locations for target placements, and the
green dots are the actual locations of the target.

30
INTERNATIONAL HYDROGRAPHIC REVIEW MAY 2010
During the one month period of the 2003 acceptance tests, multiple flights in different days were conducted along the two target lines in order to study the SHOALS object detection capability.
Other than the variable water depths of target place-ments (i.e., from 5 m to 28 m) and target sizes (i.e., 1-m cube and 2-m cube), different survey patterns were cho-sen for various flight missions, with point densities of 2 m × 2 m, 3 m × 3 m and 4 m × 4 m. Such arrangements had the intention of examining the system‘s target de-tection capability under variable conditions. The data collected in the 2003 field trial were lately processed for object detection analysis, using our enhanced object detection algorithm, combined with the technique of second depth recognition. Our results indicated that almost all of the underwater targets were successfully identified by our automated algorithm. As an example, Figure 7 shows the 3D lidar point cloud of a dataset collected over the ―northern target line‖, with three targets clearly detected and highlighted (in red color and circled), which are 2-m cubes placed in water depths from about 12 meters to 21 meters. A camera picture is inset to illustrate the size of the 2-m target, and a sample waveform is also displayed to exemplify a typical signature in the target waveform.
Overall, more than 80 flightlines were flown over the targets in various days throughout the field trial period. After processing all flightlines using our latest object detection algorithm, we can summarize the probabili-ties of detecting the 2-m cubes and 1-m cubes, under different lidar point densities and varying water depths. The detection probability of a target was calculated based on the ratio between the number of flightlines detecting the target (using the criterion that at least one or more target waveform was automatically identified and highlighted by our automated object detection algo-rithm) and the number of flightlines flown over the target area when the target is in place. According to the SFTF (South Florida Testing Facility), a few of the shallow targets collapsed or shifted positions during the trial period, especially due to tropical storm Erika which occurred in the middle of the trial period. Our analysis took into consideration that some targets might be absent during the specific surveys (with specific survey patterns). Therefore, the detection probabilities were labeled as ―N/A‖ under the scenario when a mis-sion with multiple flightlines collected over a presumed target location showed no sign at all of any target signa-tures. We are very confident that the cubes were simply not present for the N/A cases.
Figure 7: 3D view of lidar points from the “northern target line”. Three 2-m targets are automatically identi-
fied and highlighted.

31
INTERNATIONAL HYDROGRAPHIC REVIEW MAY 2010
Table 2 summarizes our analysis on the detection prob-abilities for the 2-m cubes, which are those outlined in Figure 6. The six 2-m cubes in the southern target line are labeled from ―1S‖ to ―6S‖, with ―S‖ denoting the ―southern target line‖ and the incremental numbers indicating their sequence from the closest to the farthest off shore. With the same naming convention, the four 2-m cubes in the northern target line are labeled from ―1N‖ to ―4N‖. The second column shows the water depths where individual targets were located, and the third, fourth and fifth columns display the detection probabilities of all targets under different survey patterns. The numbers in brackets are the number of automatic detections divided by the number of flightli-nes over the target (each flightline or pass is allowed a maximum of one detection). The 2-m cubes were analyzed with a 1-m detection sensitivity; the 1-m cube data were analyzed with a 0.5-m sensitivity.
Note that water clarity did play a role in the detection of the cubes. The SHOALS systems have been demon-strated to measure water depths more than three times the Secchi Depth (LaRocque, et al. 2004). For the test cases above, we used the criteria of the cube Bottom Depth being no deeper than approximately 2/3 of the lidar bottom extinction depth for that day. Essentially, we are saying that with a lidar performance of three times the Secchi Depth, the cubes will be found reliably within two Secchi depths. It is evident from Table 2 that SHOALS has almost 100% probability to detect automatically the 2-m cubes under the specified condi-tions, with water depths ranging from 5.5 m to 28.3 m and lidar point density from 2 m × 2 m to 4 m × 4 m. Although there is indication that the detection probabil-ity decreases once spot spacing exceeds 3 m × 3 m, it is almost certain that SHOALS is capable of meeting the IHO-1 requirement for object detection if the water clarity is such that the cube depth is within 2/3 of the extinction depth.
Table 2 Notes: A The 2 × 2 pattern has a narrower swath than the 3 × 3 and 4 × 4 patterns. Some of the 2 × 2 swaths
missed the cube locations, leading to a smaller sample set. B This 1S target collapsed, was repaired and reinstalled on Aug 11. The 2 × 2 flights were flown on the
12th. The 3 × 3 and 4 × 4 flights were flown before Aug 11 when the target was not present or after
Tropical Storm Erika of Aug 14. It is suspected the cube was moved out of the search area by the
storm. C The location of the 2S target was moved NW by 70 meters by TS Erika. The 3 × 3 and 4 × 4 flights
were after the storm and found the cube in this different location from the 2 × 2 flights. D The smaller sample numbers for these cubes in the 20 to 30-m depth range is due to the decreased
water clarity after Aug 14. E This 1N target also collapsed. The 2 × 2 flights occurred when the target was not present. F These targets were not observed again after flights on Aug 5. The later flights were after the storm
and if the target was reinstalled, it must have moved as it was not detected at all.
Table 2: Target detection percentages for 2-m cubes

32
INTERNATIONAL HYDROGRAPHIC REVIEW MAY 2010
Table 3 summarizes our analysis on the detection prob-abilities for those 1-m cubes placed in close proximity to the 2-m cubes along the ―southern target line‖, as outlined in Figure 6. All six 1-m cubes identified in our analysis are associated with 2-m targets from 1S to 6S, therefore these 1-m cubes are labeled accordingly. The second column of the table shows the water depths associated with individual targets, and the third, fourth and fifth columns display the detection probabilities of these targets under different survey patterns. Table 3 reveals that SHOALS is capable of automati-cally detecting 1-m cubes under most cases when the survey pattern has a lidar point density of 2 m × 2 m. Although the detection statistics for the 1-m cubes are not as good as for the 2-m cubes, it is still a remarkable performance by the SHOALS system to find most of the 1-m cubes located on the sea floor with water depth ranging from 5.9 m to 27.6 m, owing to the enhanced object detection algorithm. The statistical analysis indi-cates that SHOALS is capable of meeting the IHO special order with 2 m × 2 m point density in water depth of more than 20 meters (if the water is suffi-ciently clear).
The statistical results of target detection for the 2003 field trial support and surpass what was predicted in the analytical studies (Guenther et al 1996). Particularly, owing to the enhanced object detection algorithm, the capability of detecting 1-m cubes or those objects with lower vertical height is drastically enhanced, which allows SHOALS to meet IHO Special Order in clean water condition.
Another important study to demonstrate SHOALS ob-ject detection capability is from a comparison analysis between MBES and SHOALS in surveying an area full of bottom rocks and pinnacles at Saipan in the Northern Mariana Islands. Figure 8 illustrates the two over-lapped areas surveyed by SHOALS in 2006 and by MBES in 2007 (Elenbaas 2008), both of which covered a dredged navigation channel west of Saipan. One of the major characteristics of these surveyed areas is their complex bottom topographies at the west entrance of the channel, such as shown in Figure 9. The water clarity at the site was favorable for bathymetric lidar surveys, and the SHOALS mission was performed with 3 m × 3 m spot spacing, therefore the results of the SHOALS survey represent a classical performance of the system and should meet IHO-1 standards for both position ac-curacy and object detection.
In 2008, an analysis was presented entitled, ―A Com-parison of Object Detection Using Airborne Lidar and Acoustic Sensors‖ which addressed the Saipan surveys at the 9th Annual JALBTCX Coastal Mapping & Chart-ing Technical Workshop in San Francisco, CA, and summarized findings by using a spatial analysis tool for object selection developed by NAVOCEANO (Elenbaas 2008). In this study, an overlapping area of about 1.64 km2 between SHOALS and MBES was chosen, and then the object list selected from SHOALS surveys was com-pared with the object list determined by NOAA‘s acous-tic survey team. The findings indicated that SHOALS found 535 objects in the area, whereas NOAA‘s team only selected 162 objects.
Table 3 Notes: G The 3S 1-meter cube was automatically selected well with 2 × 2 spacing. For the 3 × 3 spacing it was visu-ally observed at least three times in the waveforms but it was not selected by the algorithm because the cube/bottom was at the limit of the recording of the Shallow Channel. Note also that in the same flightline, the re-turn signal from this 3S 1-m cube was noticeably and consistently less than the return signal of the deeper 4S 1-m cube. This indicates either a lower reflectivity of the 3S 1-m cube or perhaps a partial submersion of the 3S cube. H The 4 × 4 spacing data also showed the cube visually at least twice but it was not automatically detected. The water clarity after the storm of Aug 14 definitely affected the ability to find the 1-m cubes.
Table 3: Target detection percentages for 1-m cubes

33
INTERNATIONAL HYDROGRAPHIC REVIEW MAY 2010
Among the SHOALS selected objects, 133 of them coin-cided with NOAA‘s object list, with 29 unmatched. However, after carefully studying the 29 unselected ob-jects, they saw that SHOALS actually detected 28 of them, but they were not selected due to the criteria used. It is noteworthy that the spatial analysis tool for object selection used by NAVOCEANO made use of the SHOALS‘ post-processing results of the second depth detection to aid the spatial object selection, but our latest enhancements to the object detection algorithm further improved the sensitivity.
Figure 8: Coverage areas of SHOALS survey in 2006 and
MBES survey in 2007 at Saipan.
Figure 9: 3D point cloud of MBES data at the entrance area of
the Saipan navigation channel..
The same SHOALS data was also processed with our latest object detection algorithm, together with our own object selection tool developed under the envelope of the SHOALS GCS package. Figure 10 illustrates a 2D point cloud at the west entrance area of the dredged channel, color-coded by water depth. The red dots mark locations of the GCS-selected objects that were detected multiple times by waveforms with object signatures (highlighted with yellow triangles around the lidar points) and the blue dots locate those GCS-selected objects that were detected by a single object waveform.
In the case of the red dots, a spatial clustering algorithm was used to group the multiple detected lidar points by their close proximity, and to mark the centric position of the group.
The enhanced object detection algorithm further improved the SHOALS capability in detecting smaller objects on the seafloor, which resulted in many more objects being detected in the Saipan data by SHOALS. Analysis indicated that the new object list automatically selected by our enhanced object detection algorithm encompassed all objects spatially detected by NAVO-CEANO and also marked 15 of the 29 missing objects from the NOAA object list. The locations of the remain-ing 14 ―missing objects‖ in the NOAA list were also examined. For some presumed MBES objects, the selec-tion was a bit dubious, and for the rest of the fourteen, it is clear they could have missed manual selection had different criteria been used.
Comparing object lists can be quite subjective, espe-cially in the case of Saipan, because it depends on the definition of objects, including object sizes, dimensions and least depths, etc. For our spatial clustering algo-rithm, the definition of object separation also played a role in the final object list, namely, if two objects are sitting together, they could be counted as one bigger object. Also, our enhanced object detection algorithm has user input about the detection sensitivity for objects of different sizes. Table 4 and Table 5 summarize our findings by using different algorithm settings to process one data set from Saipan. It resulted in a variable amount of objects detected due to the bottom complex-ity with numerous objects in very close proximity.
Figure 10: 2D point cloud of SHOALS data in the Saipan
navigation channel, with red dots identifying objects detected
by multiple hits, and blue dots identifying objects by a single
hit.

34
INTERNATIONAL HYDROGRAPHIC REVIEW MAY 2010
Table 4 shows the object selection statistics with different detecting sensitivities, which were set at 2 m, 1 m and 0.5 m in vertical heights. Obviously, the num-ber of detected objects increases when decreasing the threshold of vertical height for object identification. Also in the table are the statistics about objects with multiple lidar hits and a single hit. The criterion for object separation in this analysis is about 7.5 meters (namely, using a cell size of 5 meters in the spatial analysis).
Table 5 shows the object selection statistics with different cell sizes in spatial analysis. The number of detected objects decreases when increasing the object separation requirement, because some of the smaller objects in close proximity could be grouped into a larger object. Also in the table are the statistics about objects with multiple lidar hits and a single hit. The object detecting sensitivity was set at 1 m.
The study with Saipan data demonstrated SHOALS‘ ability in rapid reconnaissance of small underwater obstructions of variable sizes in natural situations, with great efficiency. Although there is no doubt that the latest high-resolution multi-beam sonars have much greater point density than lidar, thus superior object detection performance, SHOALS is very effective in detecting underwater objects if a sophisticated algo-rithm is applied. It is understandable that both sonar and lidar have their areas of optimum utility based on survey requirements, safety, cost, and speed-of-coverage considerations. Under clean water conditions, SHOALS has supremacy of much greater coverage rate than sonar and can easily meet IHO-1 requirements in position accuracy and object detection. There are other situation studies to further demonstrate SHOALS‘ object detection capability under varying water conditions, including not so clean water. One of those studies was from Shilshole Bay, Seattle, WA, where the extinguishing depth was less than 12 meters
during two of the SHOALS surveys conducted in 2005 and 2007. In these two surveys, there were two sets of pre-installed targets (in 2005) with dimensions of 2 m × 2 m × 2 m, 2 m × 2 m × 1 m and 1 m × 1 m × 1 m un-der water depths of about 7 meters and 12.5 meters respectively (Lockhart et al 2005). By using the en-hanced object detection algorithm, two of the larger targets (i.e., 2 × 2 × 2 and 2 × 2 × 1) under 7 meters of water were automatically detected and highlighted, together with many other natural objects identifiable by examining the multibeam coverage (Lockhart et al 2005). The results from Shilshole Bay, as well as many other local flights over Lake Ontario, clearly indicate that SHOALS is capable of meeting IHO-1 require-ments (within its extinguishing depth) even if the water clarity is not optimal for bathymetric lidar surveys.
5. Discussion
Small object detection is a very important part of hydrographic surveys, but it is also complicated for both sonar and lidar because the detection probability depends on multiple factors. With the addition of the enhanced object detection algorithm, SHOALS has significantly improved its capability of detecting smaller objects. However, its dependency on water clar-ity still remains. Empirically, using the shallow depth channel, SHOALS is capable of detecting objects greater than 1-m cubes within 2-Secchi depths 100% of the time. Such empirical results can be explained by the fact that the shallow green channel of the SHOALS system has a limited FOV of 15 mrad, which enhances object contrast in its measurable depth range of about 0-17 m. The limit of 2-Secchi depths relies on the achiev-able sensitivity of the enhanced object detection algo-rithm that allows reliable differentiation of the object return from the bottom return. As seen in Tables 2 and 3, the 1-m and especially the 2-m cubes are also well detected in the deep green channel which has a much larger FOV. Since this particular data set was acquired, the detectability in the deep channel has been further enhanced by the use of a faster detector (LaRocque, Yang 2010).
The analytical study (Guenther et al. 1996) assumed infinite FOV of the receiver channel, although the pa-per mentioned that limited FOV would increase the object contrast. As a matter of fact, the FOV plays a very significant role in object detection. For example, an altitude of 300 m results in an observing window of only 4.5 m in diameter with a 15 mrad FOV. This im-plies that the effective footprint size visible to the re-ceiver is reduced to a much smaller size than that of the expanded laser footprint (Guenther 1985) (Kopilevich et al. 2005). Such an impact of the FOV further con-solidates SHOALS‘ ability to detect objects greater than 1-m cubes under most environmental conditions, with unit probability to about 2-Secchi depths.
Table 4: Object Selection statistics with different object
detection algorithm sensitivities
Table 5: Object selection statistics with different cell sizes

35
INTERNATIONAL HYDROGRAPHIC REVIEW MAY 2010
Another point of discussion is laser beam expansion in various water conditions, which has sometimes simply been assumed to be approximately half of the water depth. This assumption is believed to be an overesti-mate in clear water. Studies (Guenther 1985) (Kopilevich et al. 2005) indicate that expansion of the laser beam could be as low as 20% of the water depth in optically clear water, which significantly decreases the effective laser footprint on the water bottom. If that is the case, it also explains the enhanced contrast of object return signal versus the return signal from the surrounding bottom.
Based on the above analysis, combined with the re-quirement for 100% bottom illumination, the practical guidelines for rapid reconnaissance of small underwater obstructions would be: 1) a 300-m altitude, 3 m × 3 m spot spacing pattern is efficient and optimized for detecting objects larger than 1-m cubes; 2) a 300-m altitude, 2 m × 2 m spot spacing pattern provides a thorough inspection of all underwater small objects, and has the capability of detecting objects as small as 0.5-m cubes in very clean water; 3) object detectability depends on water clarity, but the rule of thumb is that any objects within 2-Secchi depths will be reliably detected with unit probability.
The enhanced object detection algorithm is based on a signal observed within a small FOV, which assumes a flat water bottom. There are cases where distortions of bottom returns are triggered by sudden bottom slopes, which can lead to mislabeling such bottom anomalies as small objects. Usually, mislabeled bottom anomalies are associated with very rugged water bottoms or neighboring areas surrounding a much larger bottom feature, where user inputs through 3D editing are required to identify isolated objects. Nevertheless, the enhanced object detection algorithm is capable of high-lighting all suspected lidar points.
During development of the enhanced object detection algorithm, major improvements were made to the tradi-tional method of object identification. Initially, any lidar return with a second depth was classified as an object, which resulted in a very high rate of ―false alarms‖ due to noisy waveforms, especially within the water column. Such false alarms, sometimes dominat-ing the highlighted suspects, overshadowed the ability to observe true bottom features, and degraded the over-all performance of the system‘s object detection capa-bility. With the new enhanced object detection algo-rithm, any water column-induced second depth is care-fully analyzed automatically to reject false alarms.
Overall, SHOALS‘ object detection capability is built on successfully identifying three different types of bot-tom features: Case-1 objects, which are obvious in the lidar point cloud; Case-2 objects, which are identified
by distinguishable object and bottom returns using the traditional pulse location algorithms; Case-3 objects, which differentiate bottom anomalies by examining distortion in the bottom returns. Case-3 handles all situations that are not handled by both Case-1 and Case-2, and enables detection of objects as small as 0.5-m cubes.
6. Conclusion
Both empirical and analytical results indicate that SHOALS is highly capable of detecting small objects underwater. Empirical studies indicate that, under clear water conditions, SHOALS exceeds IHO-1 require-ments for underwater object detection and, with proper survey planning, can also meet IHO Special Order requirements.
Considering the efficiency and cost effectiveness of using airborne bathymetric lidars such as SHOALS, it is obvious that this is the technology of choice for the rapid reconnaissance of small underwater obstructions in shallow coastal water.
The enhanced object detection capability also suggests that the SHOALS system has great potential for military applications in the rapid reconnaissance of underwater mines and any other objects of interest as small as 0.5 m in diameter.
7. Acknowledgements
The authors wish to thank the Joint Airborne Lidar Bathymetry Technical Center of Expertise (JALBTCX) for the use of data and imagery from the 2003 CHARTS field trials. In addition, Bill Elenbaas and his colleagues of NAVOCEANO shared their data, im-agery and analysis on the Saipan data. The authors also wish to thank Michael Broadbent and Fugro Pelagos for their survey data and target information over Shilshole Bay, Seattle, WA. Special thanks go to Wenbo Pan of Optech for her tremendous efforts in processing and analyzing all the data from the SHOALS 2003 field trial to produce the recent statisti-cal results in that case study.
_______________________

36
INTERNATIONAL HYDROGRAPHIC REVIEW MAY 2010
References
Elenbaas, B. (2008) A Comparison of Object Detection Using Airborne Lidar and Acoustic Sensors, 9th Annual
JALBTCX Coastal Mapping & Charting Technical
Workshop, San Francisco, CA, 17-18.
Guenther, G.C. (2007). A letter to the editor, Interna-
tional Hydrographic Review.
Guenther, G.C., Eisler, T.J. Riley, J.L. and Perez, S.W. (1996). Obstruction detection and data decimation for
airborne laser hydrography, Proceedings, 1996 Cana-
dian Hydrographic Conference, Halifax, N.S. 51-63.
Guenther, G.C., (1985). Airborne laser hydrography:
system design and performance factors, NOAA profes-
sional paper series, 1. Rockville, Md: U.S. Dept. of
Commerce, National Oceanic and Atmospheric Ad-
ministration, National Ocean Service, Charting and
Geodetic Services, 385.
IHO (International Hydrographic Organization) IHO
Standards for Hydrographic Surveys, Special Publica-
tion No. 44, 5th Edition, Feb 2008.
Kopilevich, Y., Tuell, G., Feygels V. (2005). Aspects of
resolution and target detection, 6th Annual Airborne
Coastal Mapping and Charting Workshop, July 2005,
Philadelphia, PA.
LaRocque, P.E., Yang, E. (2010). Enhancements to the
New SHOALS-3000 System, International Lidar
Mapping Forum, March 2010, Denver, Colorado.
LaRocque P.E., Banic, J.R. and Cunningham, A.G. (2005). CHARTS Upgrade (SHOALS-3000T20E)
Design Description and Field Testing, 6th Annual
JALBTCX Coastal Mapping & Charting Technical
Workshop, Philadelphia, PA, July 12-13, 2005.
LaRocque P.E., Banic, J.R. and Cunningham, A.G. (2004). Design description and field testing of the
SHOALS-1000T airborne bathymeter, Proc. SPIE Vol.
5412, Laser Radar Technology and Applications IX;
Gary W. Kamerman; Ed. p162-184.
Lockhart, C., Arumugam, D., Millar, D. (2005). Meet-
ing Hydrographic Charting Specifications with the
SHOALS-1000T Airborne LiDAR Bathymeter, Proceed-
ings of the 2005 U.S. Hydrographic Conference, San
Diego, CA.
Smith, S.M. (2006). Empirical Object Detection Per-
formance of LIDAR and Multibeam Sonar Systems in
Long Island Sound, International Hydrographic Review
Vol. 7 No. 2, July 2006.
West, G.R. and Lillycrop, W.J. (1999). Feature
Detection and Classification with Airborne Lidar -
Practical Experience, Proc. Shallow Survey 99, October 18-20, Sydney, Australia.
Yang, E., LaRocque P.E., Guenther G.C., Reid D., Pan W., Francis K. (2007). Shallow water depth extraction
– progress and challenges, Proceedings of the 2007
U.S. Hydrographic Conference, Norfolk, VA. ______________________
Biographies of the Authors
Eric Yang is a scientist with great enthusiasm in the study of various lidar applications. Based on his knowledge of the lidar sensors and lidar physics, Eric has been actively involved in advancing the bathymet-ric lidar technology and its applications. In 2009, Eric was awarded the inaugural ―Technical Achievement Award‖ by the Joint Airborne Lidar Bathymetry Tech-nical Center of Expertise (JALBTCX). Eric received his BSc in physics from Peking University and his MSc in geological sciences from McMaster University. He also spent three years of Ph.D. study at McMaster Uni-versity in applied physics.
Dr. Paul LaRocque is currently the Director of Ad-vanced Technology at Optech, the wing of the com-pany that specializes in research and development. In the past he has been the Technical Manager for a vari-ety of Optech systems: atmospheric lidars, terrain map-pers, and most notably for the SHOALS family of air-borne lidar bathymeters. This began in the early 90‘s with the SHOALS 200 system, which has evolved lately into the new SHOALS 3000 system. Paul received his doctorate in Laser Spectroscopy from the University of Toronto in 1985.

37
INTERNATIONAL HYDROGRAPHIC REVIEW MAY 2010
NEW STANDARDS FOR PROVIDING METEOROLOGICAL
AND HYDROGRAPHIC INFORMATION
VIA AIS APPLICATION-SPECIFIC MESSAGES
By Lee Alexander and Kurt Schwehr (USA) Center for Coastal and Ocean Mapping/Joint Hydrographic Center
University of New Hampshire Durham, New Hampshire, USA
Abstract
AIS Application-specific messages transmitted in binary format will be increasingly used to digitally communicate maritime safety/security information between participating vessels and shore stations. This includes time-sensitive meteorological and hydrographic information that is critical for safe vessel transits and efficient ports/waterways management. IMO recently completed a new Safety-of-Navigation Circular (SN/Circ.) that includes a number of meteorologi-cal and hydrographic message applications and data parameters. In conjunction with the development of a new SN/Circ., IMO will establish an International Application (IA) Register for AIS Application-Specific Messages. IALA plans to establish a similar register for regional appli-cations. While there are no specific standards for the presentation/display of AIS application-specific messages on shipborne or shore-based systems, IMO issued guidance that includes specific mention of conforming to the e-Navigation concept of operation. For both IHO S-57 and S-100-related data dealing with dynamic met/hydro information, it is recommended that IHO uses the same data content fields and parameters that are defined in the new IMO SN/Circ. on AIS Application-specific Messages
Résumé
Les messages spécifiques d‘application AIS transmis en format binaire seront utilisés de plus en plus pour communiquer par voie numérique les informations relatives à la sûreté/sécurité maritime entre les bâtiments participants et les stations à terre. Ceci inclut les informations météorologiques et hydrographiques qui requièrent un minutage très précis et qui sont cruciales pour le passage en toute sécurité des navires et la gestion efficace des ports et des voies naviga-bles. L‘OMI a récemment terminé une nouvelle circulaire du sous-comité sur la sécurité de la navigation (SN/Circ.) qui comprend un certain nombre d‘applications pour les messages météorologique et hydrographiques et de paramètres de données. En conjonction avec l‘élabora-tion d‘une nouvelle SN/Circ., l‘OMI établira un registre d‘applications internationales (IA) pour les messages spécifiques d‘application AIS. L‘AISM a prévu d‘établir un registre similaire pour les applications régionales. Bien qu‘il n‘existe pas de normes spécifiques pour la présentation des messages spécifiques d‘application AIS sur les systèmes embarqués ou basés à terre, l‘OMI publie des recommandations qui comportent une mention spécifique de conformité au concept d‘opération pour la navigation électronique. En ce qui concerne la S-57 de l‘OHI et les données relatives à la S-100 qui portent sur les informations dynamiques météorologiques et hydrographi-ques, il est recommandé que l‘OHI utilise les mêmes champs de contenu de données et les paramètres qui sont définis dans la nouvelle circulaire SN/Circ. sur les messages spécifiques d‘application AIS.
38
INTERNATIONAL HYDROGRAPHIC REVIEW MAY 2010
Resumen Se utilizarán cada vez más los mensajes específicos de la aplicación del Sistema de Identificación Automática (AIS) transmitidos en formato binario para comunicar digitalmente la información sobre la seguridad marítima entre los buques participantes y las estaciones en tierra. Esto incluye la información meteorológica e hidrográfica sensible al tiempo, que es crítica para los tránsitos seguros de buques y para una administración eficaz de puertos/ vías navegables. La OMI ha completado recientemente una nueva Circular del Subcomité sobre la Seguridad de la Navega-ción (SN/Circ.), que incluye un cierto número de aplicaciones meteorológicas e hidrográficas y de parámetros de datos. Al mismo tiempo que el desarrollo de una nueva SN/Circ., la OMI esta-blecerá un Registro de Aplicaciones Internacionales (IA) para los mensajes específicos de la Aplicación AIS. La IALA proyecta establecer un registro similar para las aplicaciones regionales. Aunque no hay normas específicas para la presentación/visualización de mensajes específicos de la aplicación AIS en los sistemas embarcados o basados en la costa, la OMI publica unas directivas que incluyen una mención específica de conformidad con el concepto de operación para la navegación electrónica. En lo que se refiere a los datos asociados a la S-57 y a la S-100 de la OHI, que tratan sobre información dinámica meteorológica e hidrográfica, se recomienda que la OHI utilice los mismos campos del contenido de datos y los parámetros que están definidos en la nueva SN/Circ. de la OMI sobre los Mensajes Específicos de Aplicación AIS.

39
INTERNATIONAL HYDROGRAPHIC REVIEW MAY 2010
Introduction
Automatic Identification System (AIS) is an autono-mous and continuous broadcast system that exchanges maritime safety/security information between partici-pating vessels and shore stations. AIS operates in the VHF maritime mobile band using Time Division Multi-ple Access (TDMA) technology. Chapter V of the 1974 SOLAS Convention [1] required mandatory carriage of AIS equipment for all types and sizes of SOLAS Convention vessels by 31 December 2004. As defined in the IMO Performance Standards for AIS [2], AIS enables both ships and maritime safety administrations to effectively track the movement of vessels in coastal waters. In addition, AIS can contribute to safety-of-navigation and protection of the environment by pro-viding additional navigation-related information in the form of AIS binary messages. This includes meteoro-logical and hydrographic data, carriage of dangerous cargos, safety and security zones, status of aids-to-navigation, and other ports/waterway safety informa-tion. This information is broadcast from shore-side AIS Base Stations or specially equipped buoys to ships that are at-sea or in port. AIS Application-Specific Messages ITU-R Recommendation M.1371-1 [3] (―Technical characteristics for a universal shipborne automatic identification system using time-division multiple ac-cess (TDMA) in the VHF maritime mobile band‖) pro-vides the basis for the use of AIS binary messages. These messages contain application-specific binary data which can be created by an application on the transmitting side and interpreted and displayed by an-other application on the receiving end. Proper interpre-tation depends on the use of an agreed data structure. This means that internationally-agreed binary message (now referred to as ―AIS Application-Specific Mes-sages‖) standards are essential. Current Standards In May 2004, IMO issued SN/Circ.236 on ―Guidance on the Application of AIS binary Messages‖ [4]. SN/Circ.236 defines the data content for seven (7) types of AIS Binary Message Applications. These were to be tested and evaluated in conjunction with existing ship-borne navigation systems during a trial period lasting four (4) years. This included the AIS Minimum Key-board Display (MKD), radar, ECDIS, and Integrated Navigation System (INS) equipment, as well as Elec-tronic Charting Systems (ECS) and Portable Piloting Units (PPUs). While it is IMO that defines the content of AIS Messages, it is ITU-R M.1371 that specifies the technical characteristic and the structure of the binary AIS messages [3]. The ITU-R Recommendation M.1371-3 provides the basis for the use of AIS binary
messages. These messages contain application-specific binary data which can be created by an application on the transmitting side and interpreted and displayed by another application on the receiving end.
Revised/New Standards International Applications In July 2008, IMO established a Correspondence Group (CG) to revise the ―Guidance on the Application of AIS Binary Messages‖ contained in SN/Circ.236. The CG included representatives from 14 IMO Member Gov-ernments, a UN specialized agency (WMO), and several intergovernmental organizations − including IHO. In developing international application specific messages, several criteria pertained:
- The messages should provide information that enhances safety of life at sea, efficiency of naviga-tion, and protection of the marine environment. - The use of the message should result in operational benefits. - The information should be effectively displayed by an appropriate user interface. - Messages should not be used for information that is available from other sources with sufficient time in advance, or used for private or profitable purpose.
In April 2009, the CG submitted a report to IMO that included both revised and new messages [5]. In July 2009, IMO NAV 55 agreed to issue a new SN/Circular on ―Guidance on the Use of AIS Application-Specific Messages‖ [6]. Some existing messages in SN/Circ.236 were revised while others were replaced by new messages with enhanced functionality. In addition, some messages with similar functionality were harmo-nized and merged into a new message. Following formal approval by the Maritime Safety Committee (MSC87) in May 2010, this new circular would super-sede SN/Circ.236 beginning 1 January 2013.
Table 1: provides a comparison of existing applica-tions contained in SN/Circ.236 and the revised/new messages in the new SN/Circ. AIS Application-Specific messages that pertain to meterological/hydrographic information are high-lighted in blue.
The following is a brief description of those message applications that are directly related to meteorological and hydrographic parameters.
Meteorological and Hydrographic Data – This mes-sage provides a wide variety of meteorological and hydrographic data including, wind speed/direction, visibility, tide/water levels, surface currents, wave and swell measurements, sea state, and ice. Initially developed by IALA, it is currently in wide use. Other than changing the name from Hydrological to Hy-drographic, the information content in SN/Circ.236 is unchanged.

40
INTERNATIONAL HYDROGRAPHIC REVIEW MAY 2010
Tidal Window This message is used to inform ves-
sels about tidal windows which allow a vessel safe passage in a fairway or channel. In addition to date/time and location, information is also provided on cur-rent direction and speed. Similar to the Met/Hydro, this message is already in use. As such, the informa-tion content in SN/Circ.236 is unchanged.
Weather Report from Ship to Other Ships – Devel-oped by the World Meteorological Organization (WMO), this message is intended to provide weather information observed on a ship in transit to other ves-sels, or to WMO. This includes present weather condi-tions related to visibility, wind, temperature, wave height and swell period/direction.
Environmental – Proposed by the USA/RTCM, this message has a flexible design and is well-suited for some applications, while the Met/Hydro message in SN/Circ.236 is more suited for other situations. Since transmission of Met/Hydro information via binary messages is increasingly used, two different message types are available depending on the particular situa-tion.
The Met/Hydro message is best suited for local trans-mission of information from several sensors at the same position. Alternatively, the Environmental mes-sage separates static data (e.g., station ID, location) from dynamic sensor data. In some situations, it is possible to send same data content using fewer slots than the Met/Hydro message.
This is particularly useful when broadcasting both forecast and ―Nowcast‖ (i.e. continuously updated forecast) information.
Detailed parameters and descriptions for these AIS Application-Specific Messages are contained in the various tables of the ―new‖ IMO SN/Circ.
Table Application 1.1 Meteorological and hydrographic Data 3.1 Tidal window
10.1 Weather observation report – from ship to other ships 12.1 Environmental .2 Environmental message sensor report framework .3 Environmental message sensor report types
.4 Sensor site location .5 Station ID .6 Wind report .7 Water level report .8 Current flow report: two-dimensions (x & y) .9 Current flow report: 3-dimensions (x, y, & z) .10 Horizontal current flow report .11 Sea-state report .12 Salinity report .13 Weather report .14 Air gap
The complete IMO SN/Circ. can be downloaded from the IMO website [http://www.imo.org], under the NAV55 documents.
Table 1 Comparison of existing AIS Application-Specific Messages contained in IMO SN/Circ.236
and the revised/new messages contained in the “new” SN/Circ.
SN/Circ.236 “new” SN/Circ. Appl No. Message Name FI Message Name FI
1 Met/Hydrological 11 Met/Hydrographic 11 2 Dangerous cargo indication 12 Dangerous cargo indication 25 3 Fairway closed 13 --- -- 4 Tidal window 14 Tidal window 14 5 Extended ship static and voy-
age related data 15 Extended ship static and voyage re-
lated data 24
6 No. of persons onboard 16 No. of persons onboard 16 7 Pseudo-AIS targets 17 VTS-generated targets 17
Clearance time to enter port 18 Marine traffic signal 19 Berthing data 20 Weather report from ships 21 Area Notice - broadcast 22 Area Notice - addressed 23 Environmental 26 Route Information – broadcast 27 Route Information – addressed 28 Text Description – broadcast 29 Text Description – addressed 30

41
INTERNATIONAL HYDROGRAPHIC REVIEW MAY 2010
However, this website is accessible only to IMO Member States and Authorized Organizations.1
Regional Applications
In addition to the new IMO standard, the Radio Techni-cal Commission for Maritime Services (RTCM) is developing a standard that defines the scope and content of AIS Application-Specific messages that are intended for both international and regional use. For international use, the RTCM standard provides further guidance/refinement on the use of AIS binary messages that have been published or are planned to be issued by the Inter-national Maritime Organization (IMO). This includes both IMO SN/Circ.236 and the new SN/Circ. to be issued in 2010. Applications intended for regional use include those that were developed for use in North America and other regions. In particular, the RTCM standard contains a ―Waterways Management‖ applica-tion that is not contained in either the IMO SN/Circ.236 or the new SN/Circ.
Currently, the Draft RTCM Standard [121xx.1] for AIS
Binary Application-specific Messages: International
and Regional Use is in the final stages of refinement, and will likely be approved at the 2010 RTCM Annual Assembly meeting in May 2010. It is not the intent of RTCM to duplicate the IMO standard. Instead, there is benefit in publishing the content of these messages in order to begin the implementation process. Further, some of the messages contained in the new SN/Circ. have not been adequately field-tested, and may require further refinement or clarification in order to be prop-erly used. Finally, since it is not likely that the new IMO SN/Circ. would be revised for 4-5 years after it is issued, the RTCM standard serves as a means to ad-dress any errors that need to be corrected, or deficien-cies that should be resolved. This will be performed by issuing an updated version of RTCM standard on a periodic basis (e.g., once a year). Registers
International In conjunction with the development of a new SN/Circ., IMO NAV 55 agreed to establish an Interna-tional Application (IA) Register for AIS Application-Specific Messages. Similar to the IHO Geospatial In-formation Infrastructure Registry [7], the IMO AIS Application Specific Register will be organized and managed based on guidance contained in ISO Standard
19135. ____________________ 1A working copy of the revised SN/Circ. (NAV55/21/Add.1) that was issued by IMO on 22 October 2009 is available at: [http://vislab-ccom.unh.edu/~schwehr/papers/2009-Nav55-CG-AIX-Report-Annex1.pdf].
Establishing the necessary operational management and oversight should benefit all those who create, broad-cast, and use AIS Binary Messages. This includes:
1) Establishing specific procedures regarding proper submission of proposals, reviewing/accepting propos-als, and access to the database. 2) Defining the roles and responsibilities of the Regis-ter Owner, Register Manager, Control Body, Submit-ting Organizations, and Proposers.
Regional At the 1st Meeting of the IALA e-Navigation Commit-tee (eNAV1) in 2007, it was agreed that IALA would maintain a register of regional applications for AIS Application-Specific Messages. The intent is to provide information to all interested parties of what currently exists and/or is in use. In this way, IALA Members and other National Aids-to-Navigation Authorities can make use of existing applications, and avoid developing new messages with only minor/marginal differences. It also provides a site where it can be determined what countries are using the same re-gional message.
At IALA eNAV6, it was agreed that establishing the Register should be a two-phase process: 1st - Compile all existing AIS binaries into a ―collection‖ (i.e., a compilation or catalogue). 2nd - Convert the ―collection‖ into a Register. Once completed, IALA would then develop guidance on best practices for creating and using AIS Applica-tion Specific Messages [8].
If IMO and IALA undertake a similar approach toward registers, Table 2 provides a comparison of the likely organizational structures. Displaying AIS Application-specific Messages
Currently, SOLAS vessels are not required to have spe-cific equipment capable of interpreting, processing or displaying the information content of AIS application specific messages. While the Minimum Keyboard Display (MKD) is capable of displaying text messages, it was never intended for the graphical display/presentation of AIS Application-specific messages. However, some AIS binary messages are already being displayed on other shipborne equipment including radar, ECDIS, INS, and PPUs.
At a minimum, there are four basic display options: alpha-numeric, graphical, symbol, and geo-spatial. Table 3 indicates which options have been used for the existing/revised applications contained in SN/Circ.236.

42
INTERNATIONAL HYDROGRAPHIC REVIEW MAY 2010
Current Standards At present, there is no specific guidance or standards related to the presentation/display of AIS application-specific messages on shipborne equipment or systems. However, there are IMO and IEC standards that pro-vide general ―guidance‖ related to the presentation/display of navigation-related information on shipborne navigational displays. Performance Standards for the Presentation of Navi-
gation-related Information on Shipborne Navigational
Displays, IMO resolution MSC.191(79), 6 Decem-ber 2004. Guidelines for the Presentation of Navigation-related
Symbols, Terms and Abbreviations, IMO SN/Circ.243, 15 December 2004. Presentation of Navigation-related Information on
Shipborne Navigational Displays – General Require-
ments, methods of testing, required test requirements. IEC 62288, Edition 1.0, July 2008. There are specific equipment/system standards that have been adopted by IMO, IHO, and IEC dealing with to the presentation/display of shipborne naviga-tion-related information.
Revised Performance Standards for ECDIS, IMO MSC.232(82), 2006. Specifications for Chart Content and Display Aspects
of ECDIS, IHO S-52, Ed. 4.2, Appendix 2, Colour and
Symbol Specifications for ECDIS, March 2004. Performance Standards for Radar Equipment, IMO MSC.192(79), 2004.
Performance Standards for an Integrated Navigation
System (INS), IMO resolution 86(70), Annex 3. Integrated Navigation Systems (INS) – Operational
and performance requirements, methods of testing
and required test results. IEC 61294, Ed. 1, 2004. Performance Standards for a Universal Shipborne
Automatic Identification System (AIS), IMO resolu-tion MSC.74(69), Annex 3, 19 May 1998. Guidelines for the Onboard Operational Use of Ship-
borne Automatic Identification Systems (AIS), IMO resolution A.917(22), 25 January 2002. Display of AIS Target Information, IMO SN/Circ.217, 11 July 2001. Guidance of the Application of AIS Binary Messages, IMO SN/Circ.236, 28 May 2004. Many of these standards were adopted prior to resolu-tion MSC.191(79), SN/Circ.236, or IEC 62288 being issued. Eventually, these equipment-specific perform-ance standards will need to be ―updated‖ to make sure that they comply with the overall harmonized require-ments contained in resolution MSC.191(79). In the interim, there does not appear to be any existing re-quirement that would preclude the presentation/display of any of the AIS binary message applications contained in SN/Circ.236 or the revised/new mes-sages. However, it will not be possible to reach a gen-eral consensus about the consistent and uniform dis-play of AIS binary messages until the performance standards for individual shipboard equipment and systems are aligned with resolution MSC.191(79). Also, there is need for more operational testing and experience before any specifications or standards are adopted.
Table 2 – Comparison of the proposed organizational structures for the International and re-
gional registers for AIS Application-Specific Messages.
Table 3 – Basic options for displaying the AIS application-specific messages contained in IMO SN/

43
INTERNATIONAL HYDROGRAPHIC REVIEW MAY 2010
In the interim, IMO NAV55 issued ―Guidance for the Presentation and Display of AIS Application Specific Messages Information‖. [9].
Guiding Principles It is premature to propose specific presentation/display standards for AIS application-specific Mes-sages. In particular, more experience is needed in order to determine how AIS binary message informa-tion should be displayed in conjunction with other chart-related and operational information. However, the ―Guidance for the Presentation and Display of AIS Application Specific Messages‖ stated that the presentation/display of AIS application specific mes-sages should conform to the concept of operation envisioned for e-Navigation [9].
As defined by IMO: ―e-Navigation is the harmonized collection, integra-
tion, exchange, presentation and analysis of marine
information on board and ashore by electronic
means to enhance berth to berth navigation and re-
lated services for safety and security at sea and pro-
tection of the marine environment.‖(NAV 54/25, Annex 12) [10].
Further, AIS Application-specific messages should become an effective means to achieve many of the core objectives of e-Navigation: .1 facilitate safe and secure navigation of vessels
having regard to hydrographic, meteorological and
navigational information and risks;
.2 facilitate vessel traffic observation and manage-
ment from shore/coastal facilities, where appropri-
ate;
.3 facilitate communications, including data ex-
change, among ship to ship, ship to shore, shore to
ship, shore to shore and other users;
.4 provide opportunities for improving the efficiency
of transport and logistics;
.5 support the effective operation of contingency
response, and search and rescue services;
.6 demonstrate defined levels of accuracy, integrity
and continuity appropriate to a safety-critical sys-
tem;
.7 integrate and present information on board and
ashore through a human-machine interface which
maximizes navigational safety benefits and minimizes
any risks of confusion or misinterpretation on the
part of the user;
.8 integrate and present information on board and
ashore to manage the workload of the users, while
also motivating and engaging the user and support-
ing decision‑making;
(NAV 54/25, Annex 12) [10]
The ―Guidance‖ issued at IMO NAV 55 also included some guiding principles that should apply to the display of AIS application-specific messages both for shipborne equipment/systems (e.g., ECDIS, radar, & INS) and shore-based systems (e.g., VTS Centre console): 1. Use consistent symbology across all displays.
2. Uniqueness – only one possible meaning.
3. Non-ambiguous – ability to determine differences
(i.e. distinct).
4. Intuitively obvious – an easily recognized symbol,
icon or pattern.
5. Have a basic symbol for different categories. Fur-
ther attributes should be enhancements (not changes)
to the basic symbol. (NAV 55/25, Add.1, Annex 2) [10]
In concept, few would likely disagree with these principles. However, in practice it will be a challenge to achieve a consensus between providers and users as to what is really suitable or effective. Relationship to IHO Standards
Since its adoption 1998, IHO S-57 Edition 3.0/3.1 has been used almost exclusively for encoding Elec-tronic Navigational Charts (ENCs) for use in Elec-tronic Chart Display and Information Systems (ECDIS) [11]. More recently, Marine Information Overlays (MIOs) in S-57 format have been devel-oped for both static and dynamic parameters [12].
The new IHO Geospatial Standard for Digital Hydro-graphic Data (S-100) [7] is intended to be used for the exchange of digital hydrographic data between hydrographic offices, and for the distribution of hydrographic data to manufacturers, mariners and other data users (e.g., environmental management organizations). It was developed so that the transfer of all forms of hydrographic data would take place in a consistent and uniform manner. As announced by IHO, an S-101 ENC Product Specification is under development and will go into force in 2012.
AIS application-specific messages are already in use, and this will likely increase. Ideally, AIS binary Messages and IHO S-100 will be compatible in terms of complementary data content and format such that both can be used in ECDIS, INS, and PPUs. For both IHO S-57 and S-100-related data dealing with dynamic met/hydro information, it is recommended that the hydrographic community use the same data content fields and parameters that are defined in the new IMO SN/Circ. on AIS Application Specific messages.

44
INTERNATIONAL HYDROGRAPHIC REVIEW MAY 2010
Looking Ahead
The challenges associated with the use of AIS-Application Specific Messages are more organizational than technical. Based on what has occurred in the past, it may be a difficult and time-consuming process to establish the necessary infrastructure for one govern-ment agency to convert met/hydro sensor data into a binary format, and then pass it to another agency to be broadcast via AIS base stations as AIS application-specific messages. Often times, different agencies have different ideas on what types of met/hydro data are important, and the level of detail that is required. While most would agree on the need to provide met/hydro data, agreeing on the specific details regarding data parameters, formatting, and distribution can be problematic. To accomplish the process will require a fair amount of cooperation between intra- and inter-government agencies, equipment manufacturers, and maritime user groups. While these organizational challenges may be difficult to overcome, significant benefits result when "harmonized" regional and/or international standards are implemented and used by all concerned.
____________________
References
1 International Convention for the Safety of Life at
Sea; Consolidated text of 1974 SOLAS Convention, the 1978 SOLAS Protocol, and the 1981 and 1983 SOLAS Amendments, International Maritime Or-ganization, 1 July 1986, London,.
Revised SOLAS Chapter V, IMO Resolution MSC.99(73), International Maritime Organization, 5 December 2000, London.
2 Recommendation on Performance Standards for an
Universal Shipborne Automatic Identification Sys-
tem (AIS), IMO Resolution MSC.74(69), Annex 3, International Maritime Organization, 12 May 1998, London.
3 Technical characteristics for an automatic identifi-
cation system using time division multiple access in
the VHF maritime mobile band., Recommendation ITU-R M.1371-3, Annex 5 – Application specific messages. 2007, International Telecommunication Union, Geneva.
4 Guidance on the Application of AIS Binary Mes-
sages, IMO SN/Circ.236, 28 May 2004, Interna-tional Maritime Organization, London.
5 ―Revision of the Guidance on the Application of AIS Binary Messages‖, Report from the AIS Binary Messages Correspondence Group, IMO NAV 55/14, 13 May 2009.
6 IMO Draft SN Circular: ―Guidance on the use of
AIS Application-Specific Messages‖, IMO
NAV55/21/Add.1, Annex 1, 22 October 2009.
7 Ward. R., L. Alexander, and B. Greenslade. 2009. IHO S-100: The New IHO Hydrographic Geospatial Standard for Marine Data and Information, Interna-
tional Hydrographic Review, No. 1, May 2009, p. 44-55.
8 Alexander, L., K. Schwehr, and R. Zetterburg. 2010. Establishing a Regional AIS Application Specific Message Register. Proceedings: 17th IALA Confer-ence, Cape Town, South Africa, 22-27 March 2010.
9 IMO Draft SN Circular: ―Guidance on the Presenta-
tion and Display of AIS Application-Specific Mes-
sages‖, IMO NAV55/21/Add.1, Annex 2, 22 Octo-ber 2009.
10 IMO Sub-Committee on Safety of Navigation, 54th Session: Report to the Maritime Safety Committee (NAV54/25), 14 August 2008. Annex 12.
11 IHO Transfer Standard for Digital Hydrographic
Data, IHO Special Publication No. 57 (IHO S-57), Edition 3.1.1, November 2000, Monaco.
12 Alexander, L. and M. Huet. 2007. Relationship of Marine Information Overlays (MIOs) to Current/Future IHO Standards. International Hydrographic
Review, Vol. 8, No. 2, November 2007, p. 80-82. _____________________
Biographies of the Authors
Dr. Lee Alexander is a Research Associate Professor at the Center for Coastal and Ocean Mapping at the University of New Hampshire, and an Adjunct Profes-sor at the University of New Brunswick. Previously a Research Scientist with the US Coast Guard and a Vis-iting Scientist to the Canadian Hydrographic Service, he serves on a number of international committees and working groups dealing with electronic charting, ship-board navigation system, and e-Navigation standards. He has published over 100 papers and reports on elec-tronic chart-related technologies, and is a co-author of a textbook on Electronic Charting.
Dr. Kurt Schwehr is a Research Assistant Professor at t h e C e n t e r f o r C o a s t a l a n d O c e a n Mapping (CCOM) at the University of New Hamp-shire. In addition to AIS broadcast applications, he works on a range of projects including developing Chart-of-the-Future technologies, visualization tech-niques for underwater and space applications, and un-derstanding marine sedimentary processes. He re-ceived his PhD from Scripps Institution of Oceanogra-phy in marine geology/geophysics, and received a B.S. from Stanford University. Before joining CCOM he worked at the Jet Propulsion Lab, NASA Ames, the Field Robotics Center at Carnegie Mellon, and the US Geological Survey Menlo Park.

45
INTERNATIONAL HYDROGRAPHIC REVIEW MAY 2010
A FIRST GENERATION ENC SERVICES
By Captain Vaughan Nail MA Royal Navy (UK)
Abstract
The effectiveness of the principles underlying the World Electronic Navigational Chart Database (WEND) has been brought into question by the less than optimal service delivery models existing in 2009. It is contended that the delays in the provision of comprehensive Electronic Navigational Chart (ENC) services, partly as a result of real world challenges in generating the required international production capacity, have been the major factor in the growth of a large market in unofficial data services. However, the future course of electronic charting is now clearly pointing towards a model, recognizable as a WEND, but modified according to regional requirements. This paper reviews the challenges in the delivery of an early official integrated vector chart service aspiring to world coverage, launched by the United Kingdom Hydrographic Office. A number of separate strands are examined, including the significant technical challenges in the translation of historic charted data into the new format and the provision of a robust supply chain from data acquisition to the ultimate delivery of data to the end user.
Résumé L‘efficacité des principes qui sous-tendent la base de données mondiale pour les cartes électro-niques de navigation (WEND) a été remise en question par les modèles de délivrance de services peu satisfaisants existants en 2009. On avance que les retards dans la fourniture de services exhaustifs en matière de cartes électroniques de navigation (ENC) ont été le facteur déterminant eu égard au développement d‘un vaste marché de services de données non officielles, en partie du fait des défis pratiques rencontrés pour atteindre la capacité de production internationale requise. Toutefois, le développement futur de la carte électronique s‘oriente maintenant clairement vers un modèle identifiable en tant que WEND, mais modifié selon les prescriptions régionales. Cet article examine les défis rencontrés dans la fourniture du premier service officiel de cartes vectorielles intégré visant à une couverture mondiale, lancé par le Service hydrographique du Royaume Uni. Diverses tendances sont examinées, y compris les défis techniques significatifs dans la conversion de données historiques portées sur les cartes au nouveau format et la fourniture d‘une chaîne d‘approvisionnement robuste depuis l‘acquisition des données jusqu‘à la fourniture ultérieure de données à l‘utilisateur final. Resumen
La eficacia de los principios subyacentes de la Base Mundial de Datos de Cartas Electrónicas de Navegación (WEND) ha sido puesta en duda por los modelos de entrega de servicios poco satisfactorios existentes en el 2009. Se sostiene que los retrasos en el suministro de servicios exhaustivos en materia de Cartas Electrónicas de Navegación (ENC), en parte como resultado de los desafíos del mundo real a los que se ha enfrentado para alcanzar la capacidad de producción internacional requerida, han sido el factor determinante en el crecimiento de un amplio mercado en los servicios de datos no oficiales. Sin embargo, el desarrollo futuro de la cartografía electrónica señala ahora claramente hacia un modelo, reconocible como WEND, pero modificado según los requerimientos regionales. Este artículo revisa los desafíos encontrados en la entrega del primer servicio oficial de cartas vectoriales integrado que aspira a una cobertura mundial, lanzado por el Servicio Hidrográfico del RU. Se examinan diversas tendencias, incluyendo los desafíos técnicos significativos en la conversión de datos históricos representados en las cartas en el nuevo formato y el suministro de una cadena de aprovisionamiento robusta desde la adquisición de datos hasta la entrega ulterior de datos al usuario final.

46
INTERNATIONAL HYDROGRAPHIC REVIEW MAY 2010
The UKHO has played a significant part in the shaping of standards in nautical charting throughout its long history. In the latter part of the 20th Century, it became one of the leading providers of charts and services for vessels engaged in long distance trading. This position was not actively sought, but grew from the high stan-dards of charting demanded by the Royal Navy, sus-tained by the efforts of its own surveyors at sea and many dedicated cartographers ashore. Throughout the 20th Century, hydrographic skills transferred from the old colonial powers, as newly independent countries sought to build their technical capability. The products and services of UKHO are now sustained by the hydrographic data of the Member States of the Interna-tional Hydrographic Organization (IHO), delivered through bilateral arrangements, for the benefit of mari-ners worldwide. While many hydrographic offices pro-duce national and regional charts, the provision of worldwide coverage may only be achieved through a comprehensive series of inter-governmental bilateral arrangements recognizing copyright and intellectual property. As perhaps the most complete physical mani-festation of the IHO‘s hydrographic effort, the resultant paper charts and publications remain at the leading edge of the commercial market for carriage compliant products. 1
The potential for electronic charting to improve naviga-tional safety was recognized by the international com-munity in the 1980s, including some early studies in the North Sea Hydrographic Commission. With the wide-spread availability and reduced costs of increasingly powerful computer processors, as well as an accurate and ever-present space based navigation system, condi-tions were favorable for the commercial development of this technology. The accompanying performance standards for Electronic Chart Display and Information Systems (ECDIS) (introduced in 1995)2 and a common exchange standard for hydrographic data (IHO Special Publication n° 57 (S-57) edition 3.0 introduced in 1996) provided the necessary, but perhaps not sufficient, tech-nical underpinning for the manufacture of both display systems and their navigational data content. Some UK ENCs were published at a relatively early stage, although progress was initially constrained by the sig-nificant cost3 and technical challenge. Unsurprisingly, the development and production of ENCs centered on the national hydrographic offices with a mature capa-bility, a situation that did not materially change until well after 2005. As a result, ENC coverage was re-stricted to isolated areas of excellence, with some stra-tegic straits being covered by cooperative international ventures. This patchy coverage provided a significant influencing factor in explaining the International Mari-time Organisation (IMO) Maritime Safety Committee‘s reluctance to adopt what appeared to provide a positive contribution to navigational safety. In terms of im-
provement of navigational safety at sea, the core raison
d‟être for the IHO and an essential part of IMO‘s wider remit, the authoritative Det Norske Veritas (DNV) Classification Society published a report in April 20074 which asserted that ECDIS was a cost-effective risk control option for many combinations of ship types, size and age. Nevertheless, the lack of continuous high quality coverage along the main shipping routes dis-couraged shipping companies from the significant fi-nancial investment in ENCs. However, with an ECDIS system (or even non-type approved electronic chart system) fitted, many of the significant benefits of ENCs could already be enjoyed by the use of other products such as the Admiralty Raster Chart Service (ARCS) and unofficial vector charts in a variety of pro-prietary formats. The most significant advantages are, firstly, improved real time spatial awareness, leverag-ing GPS positioning and linkage to other navigation aids, such as ARPA, and, secondly, an updating system which requires little operator input. Weighing the rela-tively modest costs of such electronic chart services against their operational benefits, it is un-surprising that display systems for non-ENC data have proliferated. Their utility is such that, even without the imprimatur of carriage compliance, they far outweigh the market penetration of ENCs. As a major provider of papers charts with a large naval customer, UKHO may have been expected to develop a competing ENC service at an early stage, but it is contended that a major factor discouraging such an initiative was the existence of the WEND principles.
The stated purpose of the WEND is to ensure a consis-tent level of high-quality updated ENCs through inte-grated services that support the SOLAS Chapter V chart carriage requirements. The principles of WEND are thoughtfully constructed and strict adherence could have resulted in the desired comprehensive coverage through the efforts of Member States of the IHO. However, subsequent difficulties in building a compre-hensive worldwide database have exposed the failure of the WEND proponents to recognise the limitations in the corporate IHO production capability. Perhaps the most important defining feature of WEND is the responsibility placed on IHO Members States to estab-lish, for waters of national jurisdiction, a mature supply system for ENCs and their subsequent updating. This is facilitated by either nationally produced ENC coverage, or through arrangements with other States to produce the necessary ENC coverage on their behalf. Only one ENC should exist for each area in the relevant naviga-tional usage band; this effectively prevents any single nation providing an ENC ―world view‖ based on a mix-ture of adopted, derived or compiled charts, which could have provided a digital equivalent of, for exam-ple, the Admiralty standard navigational (paper) chart series.

47
INTERNATIONAL HYDROGRAPHIC REVIEW MAY 2010
As the WEND concept effectively removes the possi-bility of a single official producer creating a world series based on ENCs derived from other nations‘ data, such a series will only be completed when the final producer Member State either makes its ENCs avail-able for distribution or allows another to act on its behalf. Under the WEND principles, the IHO intended to address overall coverage on a regional basis through Regional Hydrographic Commissions. The record of success within the various Commissions is mixed, but in general the level of coordination anticipated has not been forthcoming. The ―unofficial‖ market contains no such hindrance; indeed one producer demonstrated that the provision of consistent world vector charting was a straightforward technical proposition.5 Another unin-tended consequence of placing producer responsibilities on individual hydrographic offices was the very incon-sistent quality of the ENC output. Developing an ENC production capability is neither simple nor inexpensive and sometimes the loss of a single key compiler may affect the entire national output. This is a particular risk while ENC trained compilers are in short supply and the majority of hydrographic office resources are other-wise engaged in paper chart production. Similarly, it was difficult to foresee the degree to which ENCs would be used as an instrument of national sovereignty, with individual nations extending coverage into disputed waters (and beyond). The built-in assumption of WEND is that nations would cooperate fully to en-sure worldwide availability.6 Unhappily, the reality of the current state of the chart database suggests that the WEND principles have failed to address the growth in capacity needed to deliver the WEND architects‘ vision, leading to their subordination to national and commercial priorities as the main ENC service provid-ers attempted to address market demand by a variety of direct supply arrangements with producer nations working outside the general understanding of the WEND principles.
Market research during 20047 indicated that the barriers to widespread adoption of ENCs could be grouped into three main issues. Firstly, the coverage was not con-tinuous, particularly along the arterial sea highways between the main trading nations. In Europe, regional trade could be supported by near complete ENC cover-age; there were others areas of excellent coverage across the globe, but these tended to be isolated and based around the more developed nations. Secondly there were concerns about consistency, perhaps arising from different national interpretation of the exchange standard S-57 and portrayal elements. But other issues also contributed to this disjointed picture. The best ENC coverage is probably that compiled from rich un-derpinning hydrographic source data. Unfortunately, virtually all producers were forced through economic necessity or operational expediency to convert many of their existing paper charts into vector data. This process
had a number of short term benefits, primarily that of allowing a relatively rapid growth in the ENC portfolio, but it is unlikely to deliver the full potential that digital charts offer. It is important to note that most unofficial charts are also digital facsimiles of existing paper charts. Finally, given the relatively limited coverage and consistency, the ENCs did not represent good value for money in comparison with the existing paper chart coverage. Somewhat exaggerated calculations were made which showed that ENC costs were significantly more expensive than paper charts for long term use. The challenge presented to the IHO and its Member States was clear: address these issues or allow unoffi-cial data to prevail in the digital environment, perhaps ultimately leading to the exclusion of ENCs from the commercial market. For its own survival as a provider of world charting, UKHO had to take a position of leadership in this arena. There was also the related issue for UKHO that the UK Royal Navy had already entered into a comprehensive fleet-wide ECDIS fitting programme and would need a quality-assured and carriage compliant ENC folio, suitable for distant operational deployments.
At the end of 2006, UKHO sought to address this challenge in the most direct way, by the decision to develop the Admiralty Vector Chart Service (AVCS). The aim was to provide comprehensive ENC coverage from a trusted source to recognized standards. The service sought to combine all available ENCs, validated either through a RENC service or independently by UKHO. New ENCs were to be manufactured by UK, using existing paper charts as source material, to bridge the gaps in existing coverage, until the producer nation had developed its own manufacture and maintenance capability. To overcome concerns in relation to consis-tency, permissions were to be sought to ―harmonize‖ adjoining ENCs, so that the mariner was presented with a continuously smooth flow of data on passage. To focus production efforts, it was decided to concentrate on the main trade routes, identified from a number of sources, and the top 800 ports8 and their approaches, which accounted for 80% of port calls made by mer-chant vessels.
The original launch date of May 2007 proved over-ambitious and perhaps, in a similar vein to the WEND principles, reflected a gross underestimation of the real world problems of this complex undertaking. Despite strenuous efforts to persuade IHO Member States of the advantages of allowing UKHO to harmonize ENCs within national boundaries, and with the adjoining cov-erage of other nations, there was little enthusiasm for this concept. If UKHO were to undertake this work, it would have delivered a modified (or perhaps ―derived‖) ENC, which would have been distributed solely through the medium of AVCS, in order to recover the significant production costs.

48
INTERNATIONAL HYDROGRAPHIC REVIEW MAY 2010
This was, for many nations, clearly at odds with WEND objectives. Interestingly, the concept of harmonization had also been recognised and subse-quently embraced by a number of Regional Hydro-graphic Commissions, most notably the Baltic Sea Hydrographic Commission, in their work package which was initiated in 2007. At a more local level, bi-lateral partners such as France and UK meet regularly to ensure chart coherence at the maritime boundary. All this is possible with the close cooperation of willing partners, which is often sadly absent. Although much of the production of infilling ENCs required data permis-sions from the relevant responsible nation (often the adjacent littoral state, but in other regions a capable third party such as France), some of the early produc-tion by UKHO was commenced with little insight into the aspirations and intentions of the relevant national hydrographic offices. Undoubtedly, some of this early output was wasted in the duplication of work already underway, but many of the remaining gaps were filled with either UK or locally produced ENCs. This cover-age was particularly important along trade routes which passed through the littoral waters of developing nations. Undoubtedly, some of this early output was wasted in the duplication of work already underway, but many of the remaining gaps were filled with either UK or locally produced ENCs. This coverage was particularly important along trade routes which passed through the littoral waters of developing nations.
A further key factor in the achievement of the necessary coverage was the necessity of encouraging new supplier nations to join a Regional Electronic Navigation Centre (RENC). To date, several key ENC supplier nations have chosen not to join either of the two European-based RENCs or the International Centre for ENCs partner in Australia (AUS-RENC); in this case it was necessary to secure a direct supply into the UKHO Value-Added Reseller (VAR) operation. At the time of writing, these include Japan, United States, Canada, Korea, India and China. Therefore, some of the trading nations most dependent on globalization and maritime trade are content to distribute their ENCs without consolidation through a RENC, which is one of the central building blocks of WEND. The two RENCs are not by any means similar bodies. Their controlling bodies (―Steering‖ or ―Advisory‖ groups made up of representatives from the RENC Member States) have quite different views on the control of data distribution, with one (PRIMAR) operating a more sophisticated service for distributors, which extends well beyond basic validation and collation of ENCs. Such differ-ences do not detract from the more important functions common to both. It was therefore necessary to offer an integrated service that combined the output of the two RENCs, which provide effective vehicles for ENC con-sistency and reliability, with the individual national suppliers. A substantial engagement plan was devel-
oped to bring several of these nations into the supply chain; this was to be another challenge for which the early timetable proved over-optimistic.
At the Extraordinary WEND meeting, held in Monaco in October 2007, UK presented their ideas for realizing the WEND concept through the new service. The proposal centred on the three main tenets of seamless coverage, improved consistency and reduced ENC costs. By this time, some of the key challenges in providing a safe and reliable service were becoming apparent and it is worth examining these in some detail.
All ENCs are expected to refer to the WGS84 datum, so that positions derived from GPS navigation are directly plotted. Yet many of the paper charts that provided the source material for ENCs were referred to a local horizontal datum and, in many remote areas, the bathymetric data is sparse, drawn from diverse sources and relatively old. It is interesting to note that the positioning of modern offshore structures on these often ancient charts may have been plotted using unconverted GPS-derived geographical co-ordinates, as this was considered a more safe practice. There are a number of dangers inherent to the paper to ENC conversion, not least in the presentation of old data in a new electronic format which incorporates no clear method to defini-tively indicate the provenance of the data9. The ENC may therefore appear misleadingly accurate. Addition-ally, given the often incomplete geodetic network ashore, applying straightforward datum transformation may not be possible and there is consequently a lengthy and expensive process to ensure consistency with satellite imagery. Provided a coastline has recognizable features, it may be accurately referred to WGS84, but the position of hydrographic features on the same chart cannot be adjusted with the same confidence unless their positional relationship to land features is well established. This latter issue is particularly problematic in archipelagic regions, some of which straddle key sea lanes.
As with paper charts, there is an expectation that ENCs will contain the most up-to-date information available to the charting authority. Indeed, the definition of an ENC is that such updating is incorporated into the chart. There are unfortunate examples which indicate that ENC maintenance is not always of a high standard. For example, in 2008 Country A issued a Notice to Mari-ners warning of the ―non equivalence‖ of a number of ENCs within its country portfolio which, although not stated in the notice, resulted from a failure to update these charts for 4 years. Also in 2008 the entire ENC portfolios of countries B and C were temporarily with-drawn from service until a robust updating regime was in place. This is not a criticism of any individual office. In reality it is very difficult to run the parallel paper and digital output within already constrained budgets.
49
INTERNATIONAL HYDROGRAPHIC REVIEW MAY 2010
One solution already available is for larger partners, with agreement of the producer nation, to take on the routine updating task. Another seductive panacea is the implementation of a national hydrographic database. In principle, this should allow trained personnel to manage a definitive set of data from which charts could be produced in any desired media. There is little doubt that contemporary technology is beginning to deliver the hardware and software to underpin this capability, but the associated training requirement presents a sig-nificant overhead. A common thread running through the various difficulties described is that of availability of resources, particularly trained ―digital‖ cartogra-phers.
A third issue, previously mentioned, is the problem of creating a single ―world view‖ when so many near neighbours cannot agree on what that view should look like. Many overlapping ENCs in the same navigational usage band have been inadvertently introduced during the manufacture phase. This is perhaps unsurprising since most ENCs are based directly on paper chart coverage. Such overlaps exist at both national and trans-boundary level, but they may be readily solved over time. More insidious are the deliberate overlaps produced in association with disputed sovereignty claims. This contravenes the WEND principles, which call for the establishment of bilateral ―technical ar-rangements‖, based on sound cartographic practice, rather than political status. For example, country D unilaterally issued its own national coverage (which also covered waters of their near neighbour) to dupli-cate existing coverage, which had been issued some time previously after joint agreement by several coun-tries (including country D!). At the 11th WEND Committee meeting, held in Tokyo in September 2008, the committee members provided the moral authority for integrated service providers to take action which could address this problem10. In reality, this issue is almost certainly best addressed by the infringing nations concerned and it would be difficult for a service provider to take unilateral action. For some nations it appears that the depth of concern about disputed mari-time boundaries transcends issues relating to naviga-tional safety and the hydrographic office is used to propagate the views of their respective foreign minis-tries. Unofficial data providers may in general avoid such structures.
The development of ENCs from the perspective of the IHO has been very much about the issues above. Less emphasis has been placed on the distribution services that bring the charts to the mariner on the bridge. This is not a practical problem for most hydrographic offices, which rely on capable government and commercial organizations to provide end-user services. Neverthe-less, for the mariner the service delivery element is crucial in ensuring the timely arrival of ENCs, corrected
up to the latest Notice to Mariners. The IC-ENC RENC concept is that this area is best left to capable service providers (known as Value Added Resellers or, more commonly, VARs) who deal directly with the end user, in a competitive environment. This theoretically promotes innovation in both delivery techniques and the service or product provided alongside the ENCs. Typically this might include routing or port information. In reality, with the lengthy delay in the creation of a true WEND, the fertile environment necessary for such inno-vation has not been evident, and few of the ENC-based services match the utility and scope of their better established ―unofficial‖ rivals. However, AVCS provides the first WEND-based service with compre-hensive global coverage and one might expect that, with the mandated ECDIS carriage requirements ahead, this situation will rapidly improve. At the time of writing discussions are once again under-way to better coordinate the activities of the RENCs. Although this is a potentially positive move, it may nevertheless be some time before the WEND emerges in the form envisaged by its creators and the full benefits of ECDIS, including the relatively straightforward distribution options, are therefore unlikely to be appar-ent in the short term11. To put matters into perspective, there appears little doubt that the integrated picture offered by ECDIS is already highly popular, safe and effective in the hands of well-trained bridge teams. AVCS is, for the time being, the most significant ENC service with a coverage approximating to WEND. Although it represents a first generation service, there are plans to rapidly expand its scope in order to meet the needs of the navigator, including chart folio manage-ment and voyage optimization tools. For the foreseeable future, there will be a significant effort in providing the outstanding coverage, particularly in the busy Far East sea lanes, and in improving the quality and consistency of the existing coverage. The IHO 2010 deadline for the provision of adequate ENC coverage is imminent and with the 2012-18 ECDIS carriage timetable looming there can be little relaxation on this effort. In its notable efforts to engineer an efficient solution to the provision of worldwide ENC coverage, the IHO provided a technical framework and guidance for its Member States which may yet prevail. However, the rate of expansion of coverage has been disappointing and it is arguable that without the catalyst of AVCS, the IHO would have possessed insufficient collateral to convince the IMO‘s Maritime Safety Committee that it was time to mandate the use of ECDIS. This paper represents the views of the author and
not the official view of the UK Hydrographic Office.
50
INTERNATIONAL HYDROGRAPHIC REVIEW MAY 2010
References 1 Carriage compliant products are those charts and publications, produced under the authority of official government hydrographic offices, normally required by the Maritime Safety Administrations of the State in which an individual ship is registered. These are required under IMO SOLAS Chapter V. Even in 2008, conventional paper products are outselling the equiva-lent ENCs and digital publications by a factor of at least 10:1. 2 IMO Resolution A.817(19), which also defined the ENC as a database, standardized as to content,
structure and format, issues for use with ECDIS on the
authority of government-authorized hydrographic
offices. It contains all the chart information necessary
for safe navigation and may contain supplementary
information in addition to that contained in the paper
chart….
3 The first ENC manufactured in UK is estimated to have cost £30,000 4 DNV Technical Report no. 2007-0304 (revision 1 published 10 Apr 07) The Effect of ENC coverage on
ECDIS Risk Reduction (Vanem, Gravir and Eide) 5 With significant resources at its disposal, the US National Geospatial Intelligence Agency also produced a world vector chart system (Digital Nautical Chart – DNC) at an early stage for the US Navy, but this was not directly compatible with the S-57 data exchange standard. 6 The efficacies of the WEND principles are dealt with in depth in the paper ―The WEND Concept for a Worldwide ENC Database – Past or Future?‖ (Hecht/Kampfer/Alexander) International Hydrographic Re-view Vol.8 No.2 Nov 2007 7 ―Barriers to the Adoption of ECDIS‖ (Capt Paul Hailwood), commissioned by UKHO and Singapore MPA, published Oct 2004 8 As defined by deadweight tonnage by Lloyd‘s Regis-ter Fairplay, with routes extracted from AMVER data and commercial shipping information sources. 9 The ―CATZOC‖ (Category Zone of Confidence) method is used to present information relating to the positional accuracy of hydrographic data within the chart. Already a rather crude measure, it is not always applied with great care and is presented to the mariner in a less than intuitive manner. 10 The S-57 standard requires that there is no overlap of ENC data within usage bands. ECDIS systems will
operate unpredictably in areas where overlapping ENC data is present; for this reason overlapping ENC data is not acceptable in end-user services. Where overlapping coverage exists the producing States should recognize their responsibility and take the necessary steps to resolve the situation. In situations where overlapping data cannot be resolved through negotiation, the ENC producer(s) can anticipate that an end user service pro-vider may need to take action itself to eliminate the overlap or discontinue services until the issue is satis-factorily addressed. Any such action to eliminate over-lap should be communicated in advance to the affected ENC producer(s) and be based on guidelines that em-phasize navigation safety, such as the following: 1. Scale of the data compiled in the ENC, 2. Currency of data in the ENC - i.e. most recent sur-veys, shoalest soundings, wrecks, rocks, and obstructions, 3. Avoidance of dividing navigationally significant features between producers. For example, Traffic Separation Schemes should be handled by one pro-ducer or the other. GUIDELINES FOR THE IMPLEMENTATION OF THE WEND PRINCIPLES section 1.7 as endorsed by the 11th WEND Committee Meeting , Tokyo, 2-5 Sep-tember 2008.
11 One factor the DNV report did not consider is the significant challenge of training the several hundred thousand deck officers who will be required to operate ―paperless bridges‖. There are already several cases of groundings associated with the incorrect use of ECDIS. This should not, however, detract from the substantial safety improvements inherent in the main-tenance of real-time spatial awareness.
___________________ Biography of the Author
Vaughan Nail has recently left the post of UK Deputy National Hydrographer and returned to duties with the Fleet. As Hydrographer of the Navy, he is responsible for the operational effectiveness of hydrographic, oceanographic and meteorological specialist ships, facilities and personnel. He has been a hydrographic specialist since 1981 and taken part in a variety of operations in home waters and overseas, most recently as the first Commanding Officer of HMS Enterprise. A Fellow of the Institute of Marine Engineers, Scientists and Technologists, he is also a Chartered Marine Scientist and chair of the Hydrographic Services and Standards Committee of the International Hydro-graphic Organisation.

51
INTERNATIONAL HYDROGRAPHIC REVIEW MAY 2010
Recent narrow beam sub bottom profilers achieve improved performances in terms of signal-to-noise ratio and resolution. Thus, the potential of these systems for detection of buried objects and also the inversion of sediment geo-acoustic parameters are high provided the device characteristics are correctly known. This note gives an overview of the results that can be obtained with a high resolution sub bottom profiler and stresses the importance of calibrating these systems when characterizing the geo-acoustic properties of sediments.
Les sondeurs de sédiments récents, à faisceaux étroits, présentent des performances améliorées en termes de rapport signal sur bruit et de résolution. Ainsi, les potentialités de ces systèmes pour la détection d'objets enfouis et également l'inversion des paramètres géoacoustiques des sédiments sont élevées à condition que les caractéristiques des appareils soient correctement connues. Cette note donne une vue d'ensemble des résultats qui peuvent être obtenus avec un sondeur de sédiments à haute résolution et souligne l'importance de l'étalonnage de ces systèmes pour la caractérisation des propriétés géoacoustiques des sédiments.
Los recientes perfiladores de sub-fondo de haz único han obtenido resultados mejores en términos de proporción señal/ruido y de resolución. Así pues, el potencial de estos sistemas para la detección de objetos enterrados y también la inversión de parámetros geo-acústicos de sedimentos son elevados siempre que las características de los mecanismos se conozcan correctamente. Esta nota proporciona una visión general de los resultados que pueden obtenerse con un perfilador de sub-fondo de alta resolución y destaca la importancia de calibrar estos sistemas al caracterizar las propiedades geoacústicas de los sedimentos.
Recent Progress in Sub-Bottom profiling—the SBP 120 example.
By Gwladys Theuillon (France)
Abstract
Résumé
Resumen

52
INTERNATIONAL HYDROGRAPHIC REVIEW MAY 2010
Introduction
Sub bottom profilers are commonly used to explore the first sediment layers below the seafloor. Most sub bot-tom profilers use the same transducers for transmission and reception and a single wide beam (~30°). Because of their high signal level and low frequencies they work well under many conditions. However, it is not possible to tell from which direction echoes are arriving. More-over, it is not possible to characterize quantitatively the geoacoustic properties of the sediments. Thus, the po-tential of recent devices working with new technologies and offering improved performances is very high. This is the case of the SBP 120 sub bottom profiler.
Description
The SBP 120 sub bottom profiler, developed by Kongs-berg (Norway) is installed onboard the French Navy hydro-oceanographic vessel Beautemps-Beaupré. It operates with two large arrays (about 7 m long) used for emission (Tx) and reception (Rx) mounted in a Mills cross configuration. This innovative architecture is built around a technology similar to that imple-mented on bathymetric multibeam echo sounders; it has been designed as an add-on to the bathymetric EM 120 deep water multibeam echo sounder with which it shares the receiver array and the preamplifier. The frequency band of the system is 2.5–7 kHz. Thanks to large Tx and Rx arrays, the resulting two-way beam pattern is 3x3° at 4 kHz. Moreover, it is possible to choose the number of transducers used for emission and reception through the acquisition software, so that the operator can adjust the directivity of the beams to the geometry of the local environment (from 3°x3° when the maximum number of transducers is used to 12°x12° when a quarter of emitting and transmitting arrays is used).
Although various signal types can be emitted, linear chirps are most commonly used because of their good performance in terms of signal to noise ratio improve-ment.
As the SBP 120 can operate with narrow beams, vessel movements are compensated using motion sensor data. Bathymetric data from the EM 120 deep water multi-beam echo sounder and the EA 400 shallow water sin-gle beam echo sounder are integrated in order to adjust automatically the acquisition delay to the depth and to steer beams perpendicularly to the bottom (to avoid the loss of reflected energy on sloping seafloor). The SBP 120 also integrates GPS data to record data location.
Performance
The SBP 120 sub bottom profiler has a much nar-rower beam width than a conventional subbottom profiler. It thus provides higher angular resolution and deeper penetration into the bottom because transmis-sion loss is reduced. Moreover, with a large transmis-sion array with up to 96 transducers, a significantly higher source level can be produced, compared to the other class of narrow beam sub bottom profilers. Thus, the signal to noise ratio is significantly im-proved. Theoretically, for linear frequency modula-tions between 2.5 and 7 kHz, the vertical resolution is about 0.22 ms two-way time (TWT), which corre-sponds to 17 cm for a sound speed of 1,500 m/s. Ex-perimentally, vertical resolutions lower than 0.35 ms have been actually observed on recordings. The source level is above 220 dB re 1 Pa @ 1 m in the frequency band. The theoretical penetration depth can be estimated using the sonar equation for a homoge-neous horizontal layer of sediments lying on a hard basement. The results are consistent with the penetra-tion up to 100 m actually achieved at sea in soft sedi-ments.
(left) The hydro-oceanographic vessel Beautemps-Beaupré, (right) The SBP 120 transmission array.

53
INTERNATIONAL HYDROGRAPHIC REVIEW MAY 2010
While previous sub bottom profilers allowed only qualitative imaging of the geological environment, this system can also be used to characterize quantitatively the sediment geoacoustic parameters, provided a pre-cise knowledge of the acquisition device characteristics is available. Calibration
Before the integration on the hull, the mechanical and electronical characteristics of the system were measured by the manufacturer in a tank. The corresponding source level, receiving sensitivity and receiver gains were pro-vided during the delivery of the SBP 120. To ensure the reliability and the validity of the manufacturer‘s meas-urements, cross correlations have been drawn between the acoustic recordings of the SBP 120 and in situ meas-urements by comparing the impedance contrasts esti-mated from the sub bottom profiler data and those measured in the sampled sediments (density and veloc-ity were measured in the water column, especially at the sea-bottom interface and in the sampled sediments). The conclusions were that significant discrepancy could happen with errors up to 20% on the impedance estimates. Moreover, comparison of reflection coeffi-cients derived from the data with reflectivities measured with other calibrated sensors showed a difference of about 10 dB for some frequencies which confirmed the problem of calibration on the SBP 120. Several hypotheses can explain the difference between the manufacturer‘s data and the real values. The error for the source level might be quite important for several reasons.
These values were extrapolated from 12°x12° beam measurements (the length of the array was reduced in the tank due to the limitation in the measurement
facilities) to a 3°x3° beam. Far field conditions are also difficult to reach with large arrays, especially for high frequencies. Reverberation during the measurement process in the tank might also have distorted the results, particularly at low frequencies. At last, values could have changed after integration of the array on the hull (emission and reception).
A calibration at sea was then required to determine the device electronic characteristics. The procedure was the following. At a depth of 2000 meters (deep waters were chosen in order to respect the far field conditions and to avoid reverberation); a calibrated hydrophone fixed on a cable was immersed at a depth of 1,000 m under the Beautemps-Beaupré in station above a flat seafloor. The hydrophone position was precisely known because it was equipped with an ultra-short baseline. So it was possible to monitor its position in real-time (and to re-cord it) to ensure it was lying in the narrow emission beam. The emitted signal was recorded by the hydro-phone and after compensating from transmission loss (absorption in the water column and geometrical spread-ing); the comparison with the theoretical emitted signal gave the source level of the emitting array. The secular echo returned after reflection on the seafloor was also recorded and the comparison with the signal recorded by the SBP 120 allowed determining the receiving sensi-tivity of the sensor and the receiver gains. Emitted signals were single frequencies varying between 2.5 and 7 kHz (for several beams: 3°x3°, 6°x6° and 12°x12°). Thus, after the processing of the records, it was possible to determine the source level and the receiving sensitiv-ity of the device in its frequency bandwidth. A differ-ence up to 10 dB was observed at low frequencies, which confirmed the initial observations.
Acquisition Configuration
Sub bottom profilers exploit the specular echo returned by the acoustic impedance discontinuities. It is then necessary to make sure that the echo that comes from the coherent reflection is correctly recorded. For this purpose, when imaging the complex structures or the sloping seafloor, the size of the arrays (i.e., the number of active transducers) must be reduced to increase the beam width, because the angle between the axis of the receiving beam and the specular direction must remain within half the beam width for successfully recording the coherent reflection.
Hydrophone used for the calibration
Examples of seismograms recorded with the SBP 120.
The good performances of the system make it possible to
image complex structures.
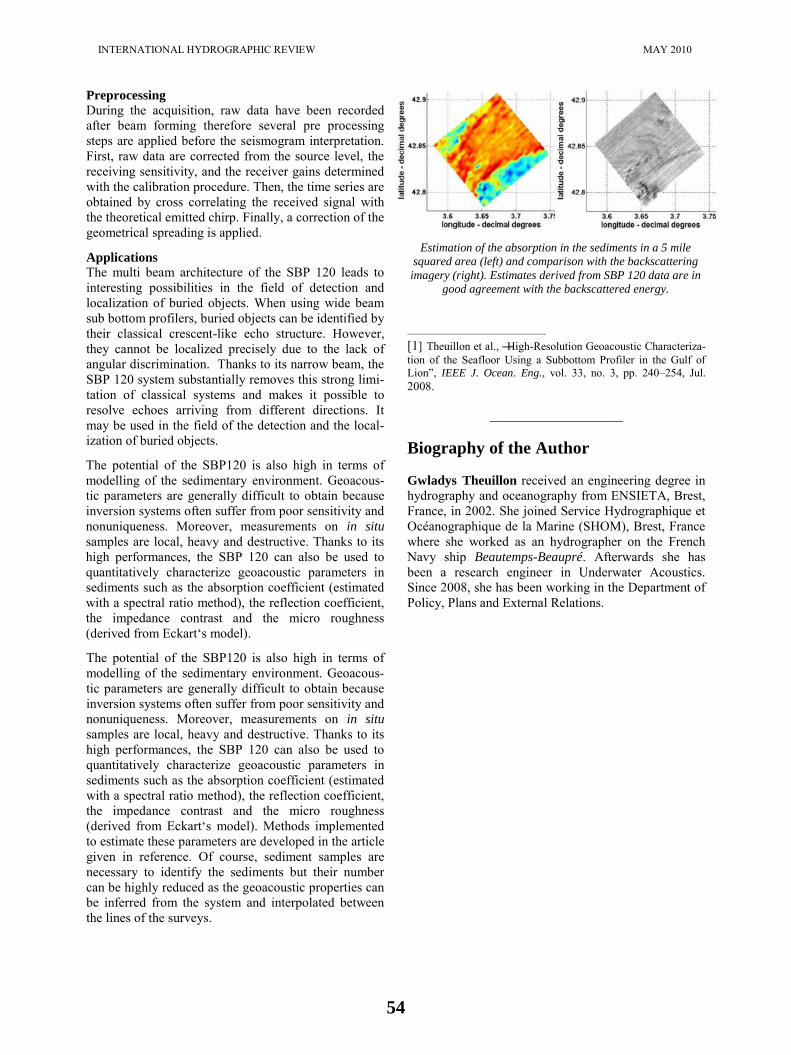
54
INTERNATIONAL HYDROGRAPHIC REVIEW MAY 2010
Preprocessing
During the acquisition, raw data have been recorded after beam forming therefore several pre processing steps are applied before the seismogram interpretation. First, raw data are corrected from the source level, the receiving sensitivity, and the receiver gains determined with the calibration procedure. Then, the time series are obtained by cross correlating the received signal with the theoretical emitted chirp. Finally, a correction of the geometrical spreading is applied.
Applications
The multi beam architecture of the SBP 120 leads to interesting possibilities in the field of detection and localization of buried objects. When using wide beam sub bottom profilers, buried objects can be identified by their classical crescent-like echo structure. However, they cannot be localized precisely due to the lack of angular discrimination. Thanks to its narrow beam, the SBP 120 system substantially removes this strong limi-tation of classical systems and makes it possible to resolve echoes arriving from different directions. It may be used in the field of the detection and the local-ization of buried objects.
The potential of the SBP120 is also high in terms of modelling of the sedimentary environment. Geoacous-tic parameters are generally difficult to obtain because inversion systems often suffer from poor sensitivity and nonuniqueness. Moreover, measurements on in situ
samples are local, heavy and destructive. Thanks to its high performances, the SBP 120 can also be used to quantitatively characterize geoacoustic parameters in sediments such as the absorption coefficient (estimated with a spectral ratio method), the reflection coefficient, the impedance contrast and the micro roughness (derived from Eckart‘s model).
The potential of the SBP120 is also high in terms of modelling of the sedimentary environment. Geoacous-tic parameters are generally difficult to obtain because inversion systems often suffer from poor sensitivity and nonuniqueness. Moreover, measurements on in situ
samples are local, heavy and destructive. Thanks to its high performances, the SBP 120 can also be used to quantitatively characterize geoacoustic parameters in sediments such as the absorption coefficient (estimated with a spectral ratio method), the reflection coefficient, the impedance contrast and the micro roughness (derived from Eckart‘s model). Methods implemented to estimate these parameters are developed in the article given in reference. Of course, sediment samples are necessary to identify the sediments but their number can be highly reduced as the geoacoustic properties can be inferred from the system and interpolated between the lines of the surveys.
—————————————————-
[1] Theuillon et al., ―High-Resolution Geoacoustic Characteriza-tion of the Seafloor Using a Subbottom Profiler in the Gulf of Lion‖, IEEE J. Ocean. Eng., vol. 33, no. 3, pp. 240–254, Jul. 2008.
____________________
Biography of the Author Gwladys Theuillon received an engineering degree in hydrography and oceanography from ENSIETA, Brest, France, in 2002. She joined Service Hydrographique et Océanographique de la Marine (SHOM), Brest, France where she worked as an hydrographer on the French Navy ship Beautemps-Beaupré. Afterwards she has been a research engineer in Underwater Acoustics. Since 2008, she has been working in the Department of Policy, Plans and External Relations.
Estimation of the absorption in the sediments in a 5 mile
squared area (left) and comparison with the backscattering
imagery (right). Estimates derived from SBP 120 data are in
good agreement with the backscattered energy.

55
INTERNATIONAL HYDROGRAPHIC REVIEW MAY 2010
Chief Hydrographer
Maritime and Port Authority of Singapore
The Next Challenge of the International Hydrographic Organisation
And Hydrographic Offices: ¨Green¨ ECDIS
For the Protection and Monitoring of the Marine Environment.
By Parry Oei (Singapore)
Abstract
The introduction of a technologically advanced navigational tool such as ECDIS (the electronic chart display and information system), could easily be expanded from a strictly navigational purpose to provide a more direct benefit to the protection and monitoring of the marine environ-ment. When coupled with marine environmental information ―green‖ navigation through the use of a ―green‖ ECDIS would be a reality. The introduction of a ―green‖ ECDIS would be timely given the impending mandatory carriage requirements for ECDIS. However, a collective effort by hydrographic offices will be a necessary key factor in achieving such a development. This paper considers why and how hydrographic offices should be actively involved in the next challenge of developing a ―green‖ ECDIS, and examines the present level of knowledge and expertise available that could turn this into a reality.
Resumé
L‘introduction d‘un outil de navigation techniquement avancé tel que l‘ECDIS (système de visualisation des cartes électroniques et d‘information) pourrait facilement être développé en partant d‘un strict objectif de navigation jusqu‘à fournir un avantage plus direct en terme de protection et de gestion de l‘environnement marin. Associée à des informations sur le milieu marin, la navigation « verte » grâce à l‘utilisation d‘un ECDIS « vert » deviendrait réalité. L‘introduction d‘un ECDIS « vert » serait opportune compte tenu des prescriptions imminentes en matière d‘emport obligatoire d‘ECDIS. Toutefois, un effort collectif de la part des Services hydrographiques sera un facteur clé nécessaire pour aboutir à un tel développement. Cet article examine comment et pourquoi les Services hydrographiques devront participer activement au prochain défi du développement d‘un ECDIS « vert » et le niveau actuel des connaissances et des compétences disponibles qui pourront permettre de le réaliser.
Resumen
La introducción de un instrumento de navegación técnicamente avanzado como el ECDIS (el Sistema de Visualización de la Carta Electrónica y de Información), podría desarrollarse fácilmente a partir de un objetivo estricto de navegación para proporcionar un beneficio más directo en términos de protección y gestión del medio ambiente marino. Asociada a la informa-ción sobre el medio ambiente marino, la navegación ―verde‖ sería una realidad gracias al uso de un ECDIS ―verde‖. La introducción de un ECDIS ―verde‖ sería oportuna teniendo en cuenta las prescripciones inminentes en materia de transporte obligatorio de ECDIS. Sin embargo, un esfuerzo colectivo por parte de los servicios hidrográficos será un factor clave necesario para lograr un desarrollo similar. Este artículo considera porqué y cómo los servicios hidrográficos deberán participar activamente en el próximo desafío del desarrollo de un ECDIS ―verde‖, y examina el nivel actual de conocimientos y competencias disponibles que podrían permitir que esto se convirtiese en una realidad.

56
INTERNATIONAL HYDROGRAPHIC REVIEW MAY 2010
Introduction
1. Awareness and concerns over the protection of the marine environment is not a recent phenomenon; the International Hydrographic Organization 1 is an inter-governmental consultative and technical organization that was established in 1921 to support the safety in navigation and the protection of the marine environ-ment.
2. Traditionally, hydrographic offices have played a significant role in enhancing navigational safety mainly through the publication of nautical charts showing a 3-dimensional information base. In other words, x (latitude), y (longitude) and z (depth). In simple terms, well-charted waters lead to safer navigation. This is commonly understood to mean the prevention of vessel grounding, and thus indirectly protecting the marine environment.
3. The introduction of a technologically advanced navi-gational tool such as ECDIS (the electronic chart dis-play and information system), could easily be ex-panded from a strictly navigational purpose to pro-vide a more direct benefit to the protection and moni-toring of the marine environment. Unlike the paper chart, an ECDIS could be easily transformed from a static to dynamic system by introducing the 4th dimen-sion of ―Time‖. This can be achieved through the intro-duction of time variable data and information such as tidal levels, current, and wind and wave information. When coupled with marine environmental information such as the location of migratory fish species, seasonal changes affecting seabed topography or areas of clean water for ballast water intake, ―green‖ navigation through the use of a ―green‖ ECDIS would be a reality. The environmental awareness of seafarers and other seaborne users could thereby be significantly and use-fully increased.
4. The introduction of a ―green‖ ECDIS would be timely given the impending mandatory carriage requirements for ECDIS. By 2018, almost all vessels engaged on international voyages will be equipped with ECDIS and it seems reasonable that a ―green‖ ECDIS could easily be extended to other user groups such research institutions, fisheries and oceanographers. However, a collective effort by hydrographic offices will be a necessary key factor in achieving such a development. ___________________
1 In 1919, twenty-four nations met in London for a Hydro-
graphic Conference, during which it was decided that a perma-nent body should be created. The resulting International Hydro-graphic Bureau began its activity in 1921 with nineteen Mem-ber States. At the invitation of H.S.H. Prince Albert I of Monaco, a noted marine scientist, the Bureau was provided with headquarters in the Principality of Monaco.
5. This paper considers why and how hydrographic of-fices should be actively involved in the next chal-lenge of developing a ―green‖ ECDIS for the display and update of marine environmental and hydrographic information. It also examines the present level of knowledge and expertise available that could turn this into a reality.
Potential New Area of responsibilities for the IHO
and Hydrographic offices
6. The rapid growth in interest and concern for the ma-rine environment highlights the need to identify the most appropriate organizations and parties that should lead the development and implementation of a ―green‖
ECDIS. At the same time, it is important to recognize that the protection of the marine environment is a complex issue, covering such things as the management of migratory marine-species; the devastation of coast-lines after maritime incidents; and the impact of rises in sea level. From that perspective, it is important that organizations are aware and equipped to meet the challenges by having all the relevant information to hand. But, as a note of caution, the situation of informa-tion overload must be avoided as it will, almost certainly, be counter-productive.
A Leading Role by the IHO and Hydrographic Offices
7. Despite the growing interest and concern over pro-tecting the marine environment, there is no clear inter-national effort to ensure that the mariner has the tech-nology and relevant information at sea to help protect that environment. There are an increasing number of rules and regulations – but no coordinated way for the mariner to visualize and react to those rules in relation to his situation.
8. Perhaps, if we examine the number of major ground-ings and collisions at sea that result in extensive oil spills; and the consequential massive coastal clean-up, destruction and harm to marine life, then, hydrographic offices might be persuaded to consider the important role that they could play. In the case of a major oil spill, a ―green‖ ECDIS could immediately display the envi-ronmentally vulnerable areas, such as marine parks, recreational beaches and desalination plants. Because the information would be standardized for use in ECDIS, it would be equally accessible to the relevant shore-based authorities and vessel owners, who could then be proactive rather than reactive to a developing situation. Immediate action could be taken by issuing advance warning to vulnerable areas, erecting oil booms based on predicted movement of the oil spill or towing a vessel to another less sensitive location to lessen any possible impact to the environment.

57
INTERNATIONAL HYDROGRAPHIC REVIEW MAY 2010
Hydrographic offices could also be consulted to recom-mend alternative shipping routes, based on underlying hydrographic information. In other words, where acci-dents have occurred a ―green‖ ECDIS could be a significant mitigating factor in minimizing damage to the marine environment.
9. This is best illustrated with an example of an accident that occurred in the Singapore Strait in 1997. On 15 Oct 1997 the oil tanker Evoikos collided with another oil tanker, the Orapin Global. The Evoikos suffered severe damage to three of its cargo tanks, resulting in a spill of 28,500 tonnes of heavy marine fuel oil. The Orapin
Global suffered some damage to its bow. Fortunately and because the Maritime and Port Authority‘s (MPA) marine emergency plan was activated, all the relevant parties immediately responded and swift action was taken to combat the oil spill.
10. A total of 16 ministries and agencies, oil termi-nals, salvage companies and oil spill response compa-nies were involved. Some 80 craft and 650 personnel were deployed. Swift and effective response could not have been achieved without immediate access to vital information on the predicted movement of oil spills. This allowed resources to be strategically deployed effectively. Coupled with the need to keep the port and its approaches opened, there was also a need to con-stantly integrate the tactical picture of resource deploy-ment, sensitive marine areas and general navigation using the port and transiting the Strait. Experience from the incident has shown that an integrated information base is key reasons to the successful outcome in con-taining an oil spill. Such an integrated information base could be provided, particularly at sea, through a ―green‖ ECDIS.
11. A review of current expertise and experience would indicate that national hydrographic offices, coor-dinated by the IHO, are well-placed to promote and support a ―green‖ ECDIS concept and be more actively engaged in the protection and monitoring the marine environment. Their work would not depart far from their existing responsibilities in providing users with the data to provide a graphical presentation of seabed topography, coastlines, currents, aids to navigation and other useful information.
12. Hydrographic offices are already collectors and compilers of information for charting. They compile this information and provide it for ECDIS as Electronic Navigational Charts (ENCs). It is a logical extension of this role for hydrographic offices to provide users with additional environmental information about such things as seabed topography, coastlines, currents, and so on. The IHO standards and specifications that already exist to support ECDIS, such as S-57, and the IHO‘s S-52 display standards adopted by the IMO can accommo-date some, if not all of this additional environmental
information.
13. The IHO and its Member State hydrographic of-fices should therefore be more actively engaged in the protection and monitoring the marine environment than they are at present.
IHO’s S-100 Standards and Specifications for a
“green” ECDIS
14. For the time-sensitive hydrographic information, the former IHO – IEC Harmonisation Group on Marine Information Overlays (HGMIO) has examined and worked extensively on the presentation of time-variable objects to further improve the situational awareness of users. This clearly illustrates that the subject of ―green‖
ECDIS is neither new nor impossible to achieve. Moreover, under the auspices of the HGMIO, the Cana-dian Hydrographic Service and Canadian Industry has embarked on a project to provide sea-ice information for use in ECDIS as part of a St Lawrence Seaway Test Bed project. The aim is to enhance navigational safety in the St Lawrence seaway in winter months, which is a major concern due to the presence of ice sheets.
15. In protecting the most sensitive marine re-sources, it is obviously necessary to identify the most relevant and important assets such as desalination and power plants, recreational beaches, particularly sensi-tive sea areas (PSSAs), fishing areas, and so on. On this aspect, there may be a need to create some new symbols for ECDIS. This can be achieved very easily when the IHO S-100 geospatial information standard is introduced over the next few years.
16. IHO S-100 is the new geospatial standard for hy-drographic data that will eventually replace the S-57 standards. S-100 It is aligned with the ISO 19100 series for geographical information standards and the plan is to introduce it progressively from 2010. S-100 is ideally suited to meet the challenge of providing a ―green‖ ECDIS with capabilities to display time sensitive spatial objects.
Challenges confronting the development of “Green”
ECDIS
Expanding Role of Hydrographic Offices to Marine
Environment Protection
17. One of the principal challenges will be to con-vince hydrographic offices, and hence the IHO, to take a more proactive role in the provision of additional en-vironmental information . At present, a number of hydrographic offices only focus on charting informa-tion for navigation safety. There is no unanimous agreement to take a leading role in providing more in-formation that could directly help protect the marine environment.

58
INTERNATIONAL HYDROGRAPHIC REVIEW MAY 2010
18. But this does not mean that they do not have the capabilities or have not collected relevant information that could be used. Where hydrographic offices are hesitant in supporting a ―green‖ ECDIS, perhaps a wider view is required. Their role would be to collect essential information from stakeholders and distribute it to users. The aim being to contribute to sustainable use of the sea by balancing commercial shipping / maritime development interests with the protection of the marine environment.
19. Some hydrographic offices may argue that such a role may encroach into another authority‘s area of re-sponsibility. However, it could be argued that it is no different from the present role as a middleman, in pro-viding information on nautical charts. For example, some of the information shown on nautical charts comes from sources such as port authorities, meteoro-logical services, land planning authorities and operators of marine facilities. It is clear that the hydrographic offices are suitably equipped and are appropriate tech-nical authorities to embark on a transition that would lead to a ―green‖ ECDIS.
20. There are some HO‘s that already see their roles as wider than just the provision of navigational information – but their numbers are relatively few. Lobbying and explanation will be required to overcome the hesitance of other hydrographic offices. More important than convincing HO‘s will be to convince their controlling governments and authorities, who may need reminding of the changing attitude of mankind towards the protection of the marine environment and the benefits that will easily accrue from the develop-ment of a ―green‖ ECDIS.
Development of Tools and Collation of Data for
“Green” ECDIS
21. Another challenge will be the development of the necessary tools and symbols to present such things as marine sensitive areas, and dynamic time-variable in-formation such as migratory fish patterns, contaminated waters affecting ballast water intake, seasonal effects on current, sand waves, oil spills and ―red tides‖. This would enable, for example, tidal current patterns to be displayed in an area which contains a sensitive marine asset, so that ships‘ officers can constantly monitor the effects of the current and provide larger safety margins when necessary. This, in turn, would reduce the chances of a navigational mishap and consequential damage to the marine environment.
Example Display of “green” ECDIS, highlighting
Current Flow Overlay and
a Marine Conservation Area
22. The IHO is already working towards some aspects of a ―green‖ ECDIS, through its involvement with the International Maritime Organization‘s Marine Electronic Highway (MEH) Demonstration Project for the Singapore and Malacca Straits. The MEH Demon-stration Project seeks, amongst other things, to show that the availability and presentation of relevant environ-mental information via an integrated digital communica-tions environment, is both feasible and beneficial. It has some parallels with the e-Navigation concept. 23. The IHO, represented by its secretariat, has al-ready provided technical advice and suggestions to the MEH Project on how various ECDIS-based solutions, such as dynamic tidal and weather information, and emergency routeing information could be integrated with the baseline chart information already shown in ECDIS as ―Marine Information Overlays (MIOs).
A Grounded vessel - damaging the coral reef below

59
INTERNATIONAL HYDROGRAPHIC REVIEW MAY 2010
24. Underlying the MEH project is the need to re-duce the negative environmental impacts of shipping and coastal activities, and a strengthening of conserva-tion and management of neighboring marine and coastal environments through the use of MIOs. The key process is to provide relevant information in suitable formats for use at sea with shipboard ECDIS and ashore with maritime safety and environmental monitoring technologies using geographical informa-tion system. Some of layers to be included for depiction are:
a. sensitive habitats that are threatened by pollution or physical damage from marine transportation activi-ties;
b. Marine Protected Areas (MPA), user regimes, and related regulatory and/or sensitivity data;
c. endangered species habitat;
d. key habitat sensitivity information as related to oil spill contingency plans of the States bordering the Straits;
e. other marine environmental protection best-practices/stewardship information; and;
f. key technical and regulatory information as related to the International Convention for the Prevention of Pollution from Ships (MARPOL), the OPRC Convention and the OPRC-HNS Protocol, Ballast Water Management Convention 2004, Antifouling System Convention, and related resolutions, codes and guidelines.
25. Another example of how a ―green‖ ECDIS could be used directly to benefit vessels, is in support of the forthcoming IMO Convention on Ballast Water. For example, vessels equipped with a ―green‖ ECDIS tak-ing in ballast water could be provided with the limits of ―clean water‖, which obviously changes according to the season and the tidal flow (as shown below).
This would then eliminate the need for the vessel to carry out an exchange of ballast water en route to the next port. The operation of exchanging ballast water at sea inevitably carries certain risks to the vessel‘s sta-bility which would also be avoided..
Overlapping Jurisdictions and Conflict in Uses
26. A third challenge relates to overlapping data and jurisdictions. Based on the experience gained from the production of ENCs, it is likely that providing and updating environmental information in areas of dis-puted waters could be a problem. Unfortunately the domain of migratory fish-stocks or oil spills more often than not crosses national boundaries.
.27. Introducing information that is both time and spa-tially variable is that it could develop into a conflict of use. For example, publishing the location of migratory fish-stocks could show that fishing grounds straddle navigational channels causing concerns over naviga-tional safety (as shown below), as well as encouraging a concentration of fishers. Similarly, the near real-time display of oil spill tracks could expose trans-boundary sensitivities. Unless such concerns are identified and resolved in advance, this could result in no relevant information being provided at all, or updated across political boundaries.
Sample Display on a “green” ECDIS of Designated Area
for Ballast Water intake shown at 1400 to 1500 hrs. Size
of area changed due to tidal flow

60
INTERNATIONAL HYDROGRAPHIC REVIEW MAY 2010
28. In this regard, the fact that hydrographic offices must established robust mechanisms for the exchange and use of ENC information across borders should set the way for other information, too. This should include real-time exchange of information such as tides, cur-rents and environmentally sensitive shore-based assets.
Conclusion
29. The present level of technology is poised to accel-erate the transition towards a ―green‖ ECDIS. The next generation of ENCs will be based on the IHO S-100 standard which is about to enter force. S-100 will en-able the marine information overlays which will be the critical features in realizing a ―green‖ ECDIS.
30. A necessary precursor for a successful implemen-tation of a ―green‖ ECDIS will be the identification of the relevant information to be stored and displayed when needed. It is analogous to a life raft onboard a vessel: it is always there and ready for use in an emer-gency. The information needed to be populated and displayed have to carefully identify and liaise with po-tential stakeholders such as commercial shipping, pleasure and harbour craft, environmental agencies. The ultimate beneficiaries of a ―green‖ ECDIS will be a wide spectrum of stakeholders including coastal States, user States, environmental groups, shipping and fishing industry.
31. What is needed now to ensure the success of a ―green‖ ECDIS for protection of the marine environ-ment is the identification of the champion(s) to drive this forward. Based on the available standards, exper-tise and experience, it could be concluded that the world‘s most prominent hydrographic offices, through the IHO, and are best placed to take on this responsibil-ity and truly realize the IHO‘s 1921 vision of support-ing the safety in navigation and the protection of the marine environment.
32. More importantly, those hydrographic offices should ensure that the IHO takes a proactive approach by recognizing that they could contribute equally to navigation safety and the protection of the marine environment by pursuing the development of a ―green‖ ECDIS. This enhanced ECDIS would be used in both improving navigation safety and protecting the marine environment. The ――green‖‖ ECDIS is a key develop-ment towards achieving a cleaner marine environment for our future generations.
______________________ Biography of the Author
Dr Parry Oei is the Chief Hydrographer in the Maritime and Port Authority of Singapore. He holds a post-graduate diploma in hydrographic surveying from Plymouth University in the United Kingdom and a Master‘s degree in Maritime Policy from University of Wollongong in Australia. He also received his Hononary Doctorate of Science from Plymouth Univer-sity.
Sample Display of “Green” ECDIS : Migratory
Fish-Stock at 1000 hrs and 1100 hrs

61
INTERNATIONAL HYDROGRAPHIC REVIEW MAY 2010
By Captain H. Gorziglia, IHB Director.* .
This paper is intended to generate discussion concerning the need and justification for a maritime state to have a national hydrographic office tailored to the real needs of the state and its population. Some examples are given illustrating the influence and relationship of hydrography in several areas that are separate from shipping and defence. The existence of a National Hydrographic Committee or similar body is highlighted as the most appropriate coordination mechanism. Finally the role of the International Hydrographic Organisation (IHO) in supporting the development of a sustained hydrographic capability and capacity is described
Why a National Hydrographic Office ?
Cet article tend à susciter des discussions sur la justification et la nécessité pour un Etat maritime d‘être doté d‘un Service hydrographique national adapté aux besoins réels d‘un Etat et de sa population. Des exemples sont donnés pour illustrer l‘influence et les relations de l‘hydrographie dans plusieurs domaines distincts de la navigation et de la défense. L‘existence d‘un Comité hydrographique national ou organe similaire est soulignée comme étant le mécanisme de coordination le plus approprié. En conclusion, le rôle de l‘Organisation hydrographique interna-tionale (OHI) à l‘appui du développement de moyens et de capacités hydrographiques durables est décrit.
La intención de este artículo es suscitar discusiones relativas a la justificación y a la necesidad de que un Estado Marítimo tenga un Servicio Hidrográfico nacional adaptado a las necesidades reales del estado y de su población. Se proporcionan algunos ejemplos que ilustran la influencia y la relación de la hidrografía en varias áreas distintas de la navegación y la defensa. Se destaca la existencia de un Comité Hidrográfico Nacional o de un organismo similar como siendo el mecanismo de coordinación más apropiado. Finalmente, se describe el rol de la Organización Hidrográfica Internacional Organización (OHI) en el apoyo al desarrollo de capacidades hidrográficas sostenidas.
* Presented by Mr. Gordon Johnston, IB Chairman, 7th Regional FIG Conference
"Spatial Data Serving People: Land Governance and the Environment - Building
the Capacity"/ Hanoi Vietnam, 19-22 October 2009
Abstract
Résumé
Resumen

62
INTERNATIONAL HYDROGRAPHIC REVIEW MAY 2010
1.- Background
Assessing the status of worldwide hydrographic surveying and nautical charting we can conclude that despite over 90% of international trade being conducted by sea, reliable maritime cartographic coverage has not yet been reached globally. Indeed in several areas within Central America, the Caribbean Sea, the South West Pacific, Africa and some regions in Asia there is a risk to shipping operations due to the lack of chart cover-age. Despite the understanding of the close relation and influence that exists between the ocean and climate change and being aware of the severe effects of differ-ent natural hazards, the origin of which seems to be strongly related to global change, as a society we do not give sufficient priority to understanding the characteris-tics of oceans and seas. Moreover, despite the evident deterioration of the marine environment due to the increase of our populations living in the coastal regions and the increase of activities that discharge effluents into the sea, we, as a society do not give sufficient priority to the need to have reliable hydrographic infor-mation to adopt the most efficient and effective preven-tive and remedial measures to ensure clean, productive and well managed seas.
Man has long considered the sea as a natural avenue that facilitates connectivity between different human groups, mainly to exchange their goods. Therefore, hydrography and the representation of its results in a nautical chart has for several hundred years been part of that life contributing to mankind‘s development as well. Due to its importance, the sea has also been the scene of disputes over its control. We can say that hydrography traditionally has contributed to both, com-mercial and naval operations.
Nowadays in addition to its original application, hydro-graphy is called on to contribute to many other activi-ties playing key roles in maritime delimitations; exploi-tation of marine living and non-living resources; tour-ism and sports; and others activities, all needing to be properly regulated, managed and controlled. These require hydrography to contribute to the sustainability and protection of the marine environment.
It is evident that some organisation needs to have the responsibility, at a national level, for conducting hydro-graphic surveys and producing nautical charts. Going further there is also a need to manage the building and managing of hydrographic data bases for the prepara-tion of special products required by those responsible for regulating, managing, controlling and operating in and on the oceans and seas.
This fact that is very well understood by many nations and without any doubt countries with a maritime tradi-tion are conscious of the vital role the sea plays in their economies. Regrettably this is not the case for many
other countries that do not give priority even to the development of a basic hydrographic capability.
Probably the relationship between hydrography and safety of navigation is more evident due to interna-tional regulations, than the existing relationship with other activities. In fact, the SOLAS (Safe Of Life At Sea) Convention - under the aegis of the International Maritime Organization (IMO) -, provides clear regula-tions with regard to safety to navigation and all related elements. Particularly Regulation 9 ―Hydrographic Services‖, identifies what contracting Governments shall undertake. In brief, as detailed in this regulation they should arrange for the collection and compilation of hydrographic data and the publication, dissemination and keeping up to date of all nautical information necessary for safe navigation. Thus, the main purpose is to guarantee as much as possible, safe navigation taking into account the recommendations and resolu-tions of the International Hydrographic Organization (IHO). Through the coordination between hydrographic offices, the IHO aims to ensure that hydrographic and nautical information is made available on a worldwide scale as timely, reliably, and unambiguously as possi-ble. Whilst the contribution of hydrography is clear to those involved in providing safe transportation and naviga-tion, as indicated earlier, it is not so evident to the com-mon public. The availability of this critical data and information also has a vital role as support to the devel-opment of other activities of national social and eco-nomic importance related to the coastal zone and near shore areas. 2.- Governmental and Private Sector Hydro-
graphic Information demand.
Hydrographic information is a national asset required by both, governments and private sectors. We cannot con-ceive any activity conducted in the sea or the develop-ment of any coastal or offshore project without hydro-graphic information. It is a government responsibility to administer, regulate, and control the use of the inland waters, interior waters, territorial seas, exclusive economic zones and the continental shelf. How can government officials achieve this without knowing the characteristics of these environments? How can the private sector promote initiatives in these areas in the absence of hydrographic information? Clearly the lack of hydro-cartographic information constitutes a major limitation to achieve progress.
We will not concentrate on the importance of hydrogra-phy with regard to safe navigation but rather we will concentrate on other activities, some of them normally under government‘s responsibility and others more in connection with the private sector.

63
INTERNATIONAL HYDROGRAPHIC REVIEW MAY 2010
2.1.- Governments’ responsibility.
a. Maritime delimitation.
As it is on land, each country needs to establish, agree and set its international boundaries. In the case of the delimitation with other countries, the limit must be drawn on a commonly accepted nautical chart and that chart must be the product of a hydrographic survey complying with international agreed standards. Proba-bly the hydrographic survey will be a joint operation but what if one of the countries involved does not have at all any hydrographic capability?
When establishing the limits of the territorial sea, con-tiguous zone, economic exclusive zone or the extension of the continental shelf (Fig. 1), if it applies, the mari-time state must base such delimitations on standard procedures where depths, distances, characteristics of the sediments, cartographic projections and representa-tions must be considered. Finally lines representing such limits must be represented on nautical charts to make the mariner aware of its location. This information is required by fishermen, the security forces and others who require to have knowledge of which area in which they are located. For each area, different regulatory measures apply but how can such measures and carto-graphic presentations be made in the absence of a na-tional hydrographic capability? To have this capability the relevant ministry, perhaps the ministry of Foreign Affairs, must establish a hydrographic unit as part of its structure.
b. Natural hazard preparedness.
Coastal zone management is a subject on its own due to its complexity and multiple related and dependent factors. One of the aspects that call for special atten-tion is the effect of natural hazards such as tsunamis and storm surges (Fig. 2). These events are of a very different origin however the point is that the coast is impacted by the rise of the water level and waves. They respectively have caused great loss of lives and damage to coastal communities with tremendous economic
effect. Sadly, recently in Chile, the impact of such events has occurred again to remind us of their power. It is probably not completely possible to attempt to stop nature delivering its energy. The risk will always exist, but we can only adopt measures to reduce the effects by an appropriate policy of preparedness.
The direction and amplitude of the energy that approaches from the sea towards the shoreline is driven by the bathymetric characteristics of the place. There-fore if we know the bathymetry, we can run models to determine the expected run-up under certain conditions. The result will be the identification of areas of greater or lesser risk. To decide on what important information is required to decide on where a settlement should or should not be established. In the absence of a national hydrographic capacity, will the National Emergency Agency establish a hydrographic unit in time to provide this vital information for preparedness?
c. Oil spills combat.
If we are part of a conscious society we must care of the environment, and that also includes the sea. There have been many severe maritime accidents resulting in oil spills in past years and such events must certainly be expected to occur again, requiring the action of con-certed action to combat these disasters and reduce as much as possible their impact on the marine environ-ment. Examples of accidents (Fig 3), are unfortunately quite common, however their effects have been assessed with the overall costs impossible to determine due to the long lasting impact of the accident. It is not the cost of pumping or sweeping the beaches, it is the cost of losses that are not recovered that take many years to be assessed.
To help in managing this type of disaster, it is neces-sary to have knowledge of bathymetry, currents, tides, winds, as well as other marine parameters.difficult. One important aspect is that if there is not an up to date nautical chart of the area of the disaster then operations will be surely more difficult.
Fig. 1 Maritime delimitation
Fig. 2 Natural hazard.

64
INTERNATIONAL HYDROGRAPHIC REVIEW MAY 2010
Will the ministry of Environment have a hydrographic unit to provide this hydrographic intelligence?
2.2.- Private Sector interest.
a. Fish Farming.
Fish and seafood farming is an activity that takes place predominately in the sea (Fig. 4). It has to be regulated and the area requires special conditions from an envi-ronmental point of view, including suitable bathymetry. How can the private sector go ahead with fish farming projects? Certainly it needs to comply with any regula-tions set by the authorities, but how do the authorities establish such policies if no environmental information is available? Bathymetry is just one parameter, but that information and its representation on a chart are required. Is it the fish farmer who will establish a hydrographic unit to get the information? Will govern-mental officers consider that information valid? Will the ministry of Fisheries need a hydrographic unit to deal with this matter?
b. Tourism.
Tourism is a very wide title for this paper so we will concentrate on just a little segment: the leisure boating marinas (Fig. 5). Marinas provide sheltered conditions for leisure yachts and boats, and have many activities associated with them. The provision of services and logistic support such as re-fueling, restaurants, maintenance, shops, just to mention a few, offer the opportunity for different employment. Therefore in the selection of the location to build a marina, several factors have to be taken into consideration; one of which is the hydrographic condi-tions. The infrastructure to be developed must have as a main objective to provide the best and safest conditions for small craft.
The engineering studies to be conducted before any decision is adopted must include hydrographic surveys and charts of the area. Later, when in operation, the variation of the hydrographic conditions shall need to be monitored in order to maintain sufficient and safe depths for the vessels using the marinas. Who would like to take the risk of not considering hydrography in the development of a marina? Will the necessary hydrographic studies conducted be used for the preparation of an official nautical chart of the area? Will the private sector produce such a nautical chart and assume the responsibility for its quality? Will the minis-try of Tourism require a hydrographic unit to validate whatever hydrographic information is produced by the private sector?
b. Cable laying
Normally submarine power and communications cables are laid under a contract that is provided by the private sector. This engineering operation requires a very de-tailed representation of the sea floor, therefore specialist hydrographic surveys are conducted in order to decide on the most suitable track for the cable.
Fig. 3 Oil spill.
Fig. 4 Fish farming.
Fig. 5 Tourism.

65
INTERNATIONAL HYDROGRAPHIC REVIEW MAY 2010
However due to the importance of the work, the position of the cable must be shown on the nautical chart to avoid any disruption caused by ships anchoring or fishing vessels conducting deep trawling. In this case the private sector needs hydrographic information before the laying the cable and afterwards to provide assurance to the mariner that he be made aware of the existence of the cable as it is indicated accurately on the nautical chart. If the preliminary survey is conducted by the private sector, will that information be used in the preparation of the official nautical chart and if hydro-graphic information already exists from different reasons, would it not be economically important to make that information available to the private sector, especially if it is of national interest? Who keeps the records of previous hydrographic surveys? Is that information a national asset? 3.- Why a National Hydrographic Service.
As we have outlined in the previous paragraphs hydro-graphic information has an immense value for many activities. In this paper we have just provided examples of some of those activities, but it is easy to imagine that this is valid for many other uses of the sea. We think that it is not effective and not efficient to have a hydro-graphic capability in each national agency that requires hydrographic information. This would create a cost that can neither be afforded nor justified. The development of individual hydrographic capabilities does not appear rational provided that a national hydrographic service exists aimed at offering reliable and timely service to all governmental stakeholders in a coordinated way.
There are no fixed structures to describe the exact organization, structure, components, mission and objec-tives of a national hydrographic service. Such a national agency needs to be tailored to provide the expected services that all the identified stakeholders require so as to support their individual missions and objectives. It must be seen as a national service of strategic importance capable of supporting the develop-ment of the highest maritime national objectives. It does not mean that due to the lack of a national hydrographic capability, hydrographic activity does not take place in a country. That is an error, as the gov-ernment hires some work and the private sector also executes some works. The problem is that without a National Hydrographic Service, there is no uniform quality control and quality assurance on the information generated through these individual efforts. Moreover, the data and formation is not maintained and kept con-veniently archived for future national uses. A maritime nation, with its strong dependency on the sea, cannot be exposed to not being capable of deciding and controlling any project at sea. It is true that con-ducting hydrographic surveys and producing nautical charts are activities that can be contracted, but it must
to have the capability to understand and establish tech-nical specifications and standards that must be followed; regulate the hydrographic activities con-ducted in national waters and control the accomplish-ment of those regulations. All this can only be managed by a centralised agency, the National Hydrographic Service, the characteristics of which shall be decided by the related stakeholders. Its mission and functions shall be considered a national objective and its administration shall be advised by a national hydrographic committee or similar coordina-tion structure, integrated by all the stakeholders. 4.- Economic associated benefits.
It is difficult to assess the economic benefit associated with the existence of a National Hydrographic Service and reliable surveys and charting, but if one was estab-lished according to the real needs of a country, its cost should not be considered as an expenditure, but as an investment. To attempt to use figures does not make any sense as figures may be irrelevant due to the different cost of living and different local and national requirements. Its representation in different parts of the world is not always equitable, but we can get a very good impres-sion if we consider the activities to which we have referred in this paper and make ourselves, citizens of a fictitious country known as ―Wonderland‖: a. Maritime delimitation.
What is the value of establishing national borders of ―Wonderland‖? How much resources are spent in court cases due to the lack of maritime delimitation of ―Wonderland‖? What value has the resources we are not exploiting due to non availability of a clear maritime delimitation of Wonderland?
b. Natural hazard preparedness.
What is the cost to re-establish a flooded village settled erroneously in a risky coastal zone in Won-derland? What is the cost of the lives and welfare of those in risk in Wonderland?
c. Oil spills combat.
What has been the cost of cleaning beaches impacted by oil spills in Wonderland? What has been the over-all operation cost to control oil spills in ―Wonderland‖?
d. Fish Farming.
What is the impact on food and work availability due to not having decided on potential fish farming areas in ―Wonderland‖? What is the effect of fish-farming in ―Wonderland‖ due to restrictions in navi-gable areas?

66
INTERNATIONAL HYDROGRAPHIC REVIEW MAY 2010
e. Tourism.
What is the cost of closing a marina in ―Wonderland‖ for a certain period of time due to grounding or inadequate management of the marine space? What is the operational cost of a marina in ―Wonderland‖? Should not we consider periodic surveys to ensure safety and fit for pur-pose?
f. Cable laying.
What is the cost of adding 100 meters extra cable due to the non availability of proper hydrographic information of a suitable route in ―Wonderland‖? What is the cost of replacement of a damaged section of the cable due to lack of a nautical chart showing precisely where the cable has been laid-out?
Compare your own estimated figures associated with the above activities and the annual budget estimates for some national hydrographic services: 1M euros (Sri Lanka); 1.7M euros (Mozambique); 3.5M euros (Chile); 7M euros (Portugal); 11M euros (Finland); 23M euros (Norway); 43M euros (Australia) (Approximate values in millions of euros based on in-formation reported to the IHB for the IHO Year Book). It is clear that quite large differences exist and so it is necessary to review, plan and manage the development of a national hydrographic service with the real national and perhaps regional requirements.
It must also be recognised that establishing a basic National Hydrographic Service of the appropriate di-mensions for a nation will, without a doubt, contribute to the maritime sectors development and progress, in-cluding our fictitious country ―Wonderland‖. 5.- Conclusions.
1.- Hydrographic data and information is required to produce nautical charts as well as to contribute to the decision making process required for many other differ-ent activities that take place in and on the sea.
2.- Hydrographic activities are taking place due to different needs no matter if there is, or not, a national hydrographic service in existence. Different govern-ments‘ agencies may spend part of their budget hiring ―pieces and bits‖ without any national coordination.
3.- Not having an agency in charge of keeping the data and information collected by different projects, a cost recovery policy cannot be implemented. It also prevents any potential exploitation of the data collected being used for other purposes today and again tomor-row.
4.- A National Hydrographic Committee or similar coordination structure, composed by all stakeholders needing hydrographic information is required to define the size, mission, objectives and policies of the National Hydrographic Service, as well as its annual work program.
5.- A National Hydrographic Service is a ―must‖ for any maritime country with the object of offering its citizens the advantages of having the sea as part of its territory.
6.- One of the objectives of the IHO is to tender guidance and advice to Maritime States engaged in setting-up or expanding their hydrographic services.
______________________ Biography of the Author
Captain Hugo M. Gorziglia (59), graduated as Navy Officer of the Chilean Navy in 1970. In 1975 got his Hydrographic Engineer diploma and served at the Servi-cio Hidrográfico y Oceanográfico de la Armada de Chile (SHOA) as Head of the Department of Hydrographic Surveying and the Department of Cartography. In 1987 was nominated Deputy Director and Technical Advisor. In 1994 was nominated Director of SHOA until Decem-ber 1997. From 1998 till August 2002 he worked as the Advisor for the International Relations at SHOA. In September 2002 was elected Director of the International Hydrographic Bureau (IHB) and in 2007, re-elected for that position. As IHB Director he is, - among others -, strongly involved with all IHO capacity building initia-tives.
67
INTERNATIONAL HYDROGRAPHIC REVIEW MAY 2010
Prepared by Mike Casey (Canada) IIC Technologies Inc.
How the “Download Generation”
will drive Electronic Charting in a New Direction.
Over the next decade we are about to see an amazing transformation as the generation that grew up with the internet, wireless communication and geo-location starts to take over the work force. They have far different expectations than we have or had. They are showing the energy, creativity and ingenuity to remake their world to their own liking. This will certainly change electronic charting as we know it.
Young people understand technology convergence better because they start at a different place. They have an innate sense of how something will work, they learn quickly and are fearless about trying things. This carefree approach gives them a big advantage. Often the mistakes they make are based on a false assumption that the technology is better than it currently is. Older, non-digital na-tives, lack this basic intuition of how things flow together. They may have a better basic understand-ing of how the underlying technology actually works but they lack the social context of how it will be used.
We examine their values and from these make several deductions about how the ―Download Generation‖ might think about re-engineering our charting world. It starts with the collaborative knowledge, activism, customization, realism, and the search for ever increasing detail values as they apply to our mapping world.
Au cours de la prochaine décennie nous allons assister à de fantastiques changements, lorsque la génération qui a grandi avec internet, avec les communications sans fil et avec la géolocalisation commencera à prendre la relève parmi la population active. Les attentes de cette génération sont tout-à-fait différentes de celles qui sont aujourd‘hui les nôtres ou de celles que nous avons pu avoir. Elles sont à la hauteur de l‘énergie, de la créativité et de l‘ingéniosité déployés pour remodeler un monde à leur goût. Ceci changera certainement la face de la cartographie électronique que nous con-naissons aujourd‘hui.
Les jeunes comprennent mieux la convergence technologique parce que leur point de départ n‘est pas le même. Ils ont un sens inné du fonctionnement des choses, ils apprennent rapidement et n‘ont pas peur d‘innover. Cette approche insouciante constitue un réel atout. Les erreurs qu‘ils sont sus-ceptibles de commettre proviennent souvent de la fausse supposition que la technologie est supérieure à ce qu‘elle est réellement. Leurs aînés, non nés à l‘ère du numérique, n‘ont pas d‘emblée cette intuition du flux et de l‘enchaînement naturel des choses. Ils ont peut-être de meilleures con-naissances de base du fonctionnement de la technologie sous-jacente mais il leur manque le con-texte social pour savoir comment les utiliser.
Nous examinons leurs valeurs et à partir de celles-ci nous émettons plusieurs hypothèses sur la manière dont la « génération téléchargement » pourrait concevoir la réingénierie de notre monde cartographique. Cela commence par la combinaison de la connaissance, de la participation active, de la personnalisation et du réalisme, en parallèle à la recherche d‘une quantité d‘informations détaillées toujours plus importante en ce qui concerne notre monde cartographique.
Abstract
Résumé

68
INTERNATIONAL HYDROGRAPHIC REVIEW MAY 2010
Durante la próxima década vamos a asistir a una sorprendente transformación a medida que la generación que ha crecido con internet, la comunicación inalámbrica y la geo-localización, toma el relevo de la población activa. Esta generación tiene expectativas muy diferentes de las que tene-mos hoy o podíamos tener antes. Están mostrando energía, creatividad e ingenuidad para rehacer su mundo a su propio gusto. Esto cambiará ciertamente la cartografía electrónica que conocemos hoy.
Los jóvenes comprenden mejor la convergencia tecnológica porque su punto de partida no es el mismo. Tienen un sentido innato del funcionamiento de las cosas, aprenden rápido y no les da miedo intentar las cosas. Este enfoque despreocupado les da una gran ventaja. A menudo los errores que hacen proceden de la falsa suposición que la tecnología es superior a lo que es actual-mente. Las personas menos jóvenes, que no han nacido en la era digital, carecen de esta intuición natural de cómo fluyen las cosas juntas. Pueden tener un conocimiento básico mejor de cómo fun-ciona realmente la tecnología subyacente pero les falta el contexto social para saber cómo se utilizará.
Examinamos sus valores y a partir de éstos emitimos varias hipótesis sobre cómo podría percibir la ―Generación de Descarga‖ la reingeniería de nuestro mundo cartográfico. Esto empieza por la combinación del conocimiento, de la participación activa, de la personalización y del realismo, paralelamente a la búsqueda de información detallada constantemente creciente relativa a nuestro mundo cartográfico.
Resumen

69
INTERNATIONAL HYDROGRAPHIC REVIEW MAY 2010
Introduction
Over the next decade we are about to see an amazing transformation as the generation that grew up with the internet, wireless communication and geo-location starts to take over the work force. They see things dif-ferently than we do. They don't think about the possi-bilities of the Internet or GPS - it is the air that they breathe. When they think about what their world could be they start at a different place. What we have lodged in our imagination they have as basic intuition. What we take as amazing technology they take for granted. Already, they are starting to drive applications of those technologies in new directions. They have far differ-ent expectations than we have or had. They are show-ing the energy, creativity and ingenuity to remake their world to their own liking. This will certainly change electronic charting as we know it.
Never before has a generation had such a technologi-cal leap over their parents. As technologically savvy as ―Baby Boomers‖ perceive themselves to be, they are no match for their offspring. It is so common that parents defer to their offspring or grandchildren for technological guidance that it‘s no longer a cliché or point of humor; it just ―Is what it is.‖ When it is taken for granted that technology-wise we will learn from our children, then something dramatic has happened.
How did this happen? And, more importantly, What
does it mean for us?, are the questions driving this paper.
First, What Is the “Download Generation”?
Several names have been applied to this new genera-tion; Generation Y, Millennials and Net Generation being three. However, all three cover a slightly wider age group that the one I call the ―Download Genera-tion.‖ More specifically I refer to a subset of Genera-tion Y – those born in 1990 and beyond. Most are entering university now and soon will be flooding the job market. In the next ten to 15 years they will be having an enormous effect on how the mapmaking and charting world operates.
1990 is an important year for a several reasons. For one, by that time the PC market was starting to mature. In fact Apple‘s flagship product was called the Mac ‗Classic‘. So these children grew up in a digital envi-ronment. By the time they went to kindergarten they could see their parents carrying laptop computers. The World Wide Web was the Internet and GPS became fully operational. Throughout their early years they could see that people communicated through cell phones – and soon they would have their own. They and their friends started to download ringtones to cus-tomize their own (or more likely their parent‘s) cell phone and the educational flip-flop began as children began to take it for granted that they had to show Mom and Dad how the cell phone really worked and all the features it had. They also developed patience as they realized that they had to explain these things several times. The same with the home PC - by now net-worked on broadband. In their early teens Wikipedia became the source of quick reference, Google became a verb and Mom and Dad needed help with the GPS in the car. The iPod changed music marketing forever, downloading music took off in earnest and social net-working came upon us. Soon FaceBook and Twitter dominated their time, they mastered smart phones, understood 3G networks and rated and ranked the lat-est iPhone apps. Yet none of them have ever ‗dialed‘ a phone. Yes, this cohort is very different.
In the words of the Berkman Center for Internet & Society at Harvard University they are ―Digital Natives and we, the digital immigrants.2 The unique characteristics of this generation have been docu-mented in several recent books such as ―Born Digi-tal‖3, ―Grown Up Digital‖4, ―The Emerging Millenni-als‖5 as well as several web communities such as www.digitalnative.org, and www.growingupdigital.com.
Figure 1: Expected Changes in Workplace Demographics 1

70
INTERNATIONAL HYDROGRAPHIC REVIEW MAY 2010
What’s So Special About Being Technically Fluent?
When people who lack a degree of technical fluency approach a technical problem we see hesitation, appre-hension and often counter-intuitive behavior as they grope for a solution. Further, this may occur seemingly at random, and all because of a basic lack of intuitive understanding about just how the technology works. They don‘t seem to know what actions are important and which are marginal. Neither can they articulate what the problem issue is as they lack the new language and terminology. Something just doesn‘t work and their frustration level can rise to a fever pitch. Having an intuitive understanding of how technologies can work together (convergence) gives you a big advantage.
Young people understand convergence better because they start at a different place. They have an innate sense of how something will work and so they frequently will ignore any documentation or training and just jump right in. They may make errors but they quickly learn and are fearless about trying things. This carefree ap-proach gives them a big advantage. Often the mistakes they make are based on a false assumption that the technology is better than it currently is. They know something specific should happen but the technology is not there - yet. Older, non-digital natives, lack this ba-sic intuition of how things flow together. They may have a better basic understanding of how the underlying technology actually works but they lack the social con-text of how it will be used and that is the more impor-tant of the two.
Lacking this deep level of fluency makes the terrain difficult to navigate as it is all unknown. Digital natives seem to be able to effortlessly glide - like a gifted athlete – with little hesitation, as if they were born to do this.
That‘s why they will make big changes in the mapmak-ing and charting world. We need to understand this gifted generation in order to provide some level of guid-ance. They may not look to us for technical assistance or training, but they will depend on us for the wisdom ac-quired through years of experience.
Download Generation Characteristics: According to Don Tapscott there are eight (8) ―norms‖ that define this generation: 1. Freedom of choice: free to choose media types, types of mobility, and their jobs almost like they choose their clothing 2. Customization: fully customize TV, Internet brows-ers, avatars... 3. Scrutiny: everything must be authenticated, every-thing scrutinized 4. Integrity: giving their time and resources to help others 5. Collaboration: collaboration in all areas, from jobs to information to lifestyle. 6. Entertainment: Products and services must invoke
enjoyment 7. Innovation: always looking for what is new, differ-ent, or innovative 8. Speed: Instant information, instant gratification.
From these characteristics, we can see where some con-flicts might arise. There is always a reason (good or bad) that things ―Are the way they are‖ As such, issues like freedom of choice, customization and the rate of innovation are issues the existing marine community will instinctively want to curb. Consequently we need to have a better understanding of this new generation since the day will come when we are dependent upon them.
From my own observations, I see the following values being particularly important to this generation:
Timeliness: not as within weeks or days - but as within seconds Connectedness: always connected, always on Free: as in virtually costless Choice: multiple ways to customize what you want Content: if it isn't online it doesn't exist Copyright: new media means new rules Collaborative Knowledge: everybody adds, every-body shares Spatial Awareness: knowing where you are, where your friends are Depth: links to ever increasing detail Realism: as in photorealistic 3D models mirroring the sighted experience Activism: as in bottom up knowledge creation Improvisation: if I see it‘s wrong I will fix it Wikis: fellow travelers contribute the most mean-ingful information Trust: technology works, large institutions don't Rating and Ranking: what do other people think of this product
From these values I believe that several deductions can be made about how the ―Download Generation‖ might
think about re-engineering our charting world. It starts
with the collaborative knowledge, activism, customiza-tion, realism, and the search for ever increasing detail values as they apply to our mapping world. But first it is important to recognize a current phenomenon occur-ring in the mapping world – the effect of Citizen Mapping 6,7and, more generally, Crowdsourcing
Crowdsourcing
Jeff Howe is the author of the best selling book - Crowd-sourcing - Why The Power Of The Crowd Is Driving The Future of Business"8 and he coined the term crowd-sourcing" in a article in Wired Magazine in June, 2006. According to Howe "Crowdsourcing" is defined as: "the act of a company or institution taking a function
once performed by employees and outsourcing to an
undefined (and generally large) network of people in the
form of an open call" ... wired.com

71
INTERNATIONAL HYDROGRAPHIC REVIEW MAY 2010
Howe's book goes into great detail about how Crowdsourcing has changed certain markets and gives many examples showing how the phenomenon has worked spectacularly well and a few where it did not. Crowdsourcing is truly a paradigm-changing move-ment, the effects of which are rippling through society, the workplace, science and mapmaking.9 This is im-portant because the biggest development that the map-ping community has to be concerned about is the creation of maps by the Crowd. A good example is the crowdsourced mapmaking phenomenon called OpenStreetMap.10 Open Street Map
OpenStreetMap deploys teams of volunteer amateur mapmakers into "mapping parties" on weekends to gather road network data and compile it into very useful and credible street maps free for all to use. ‗OSM‘ (as it is known to the Crowd) has literally re-mapped the UK and much of Europe, and is now working its way around the world with extensive mapping going on in India and North America. One has to view the web site (openstreetmap.org) to appre-ciate how extensive the coverage is and the level of detail captured. As one reviewer on OpenGeo-
Data.org has noted:
“OpenStreetMap maps a lot more than roads. All the
things you mention: roads, paths, buildings, heights,
pylons, fences … AND… post boxes, pubs, airfields,
canals, rock climbing routes, shipwrecks, lighthouses,
ski runs, whitewater rapids, universities, toucan
crossings, coffeeshops (the dutch kind), trees, fields,
toilets, speed cameras, toll booths, recycling points
and a whole lot more.” ... www.opengeodata.org
OSM as of January 2009 has more than 50,000 registered users and more than 5000 mapmaking contributors each month and the number is doubling every year. That's an impressive number no matter how you view it.
These actions were primarily motivated because of the feeling among a segment of the population (many of them of the Download Generation) who felt that government mapping data should be free of charge and free of restrictive use. So they did what Tim Berners-Lee (developer of the World Wide Web) had predicted:
"If you don't make [lower-resolution mapping data]
publicly available, there will be people with their cars
and GPS devices driving around with their laptops ..
They will be cataloging every lane, and enjoying it,
driving their 4x4s behind your farm at the dead of
night. There will, if necessary, be a grass-roots re-
mapping"
Which is exactly what has happened and the mapping
data is provided free to anyone who wants to use it. The lesson: if you charge too much for your mapping data and put restrictive practices on how it can be accessed, used or shown, then people will simply go around you and do it themselves. Mapmaking is no longer restricted to the domain of experts.
OpenStreetMap appeals to Download Generation for a number of reasons. First it involves joining a group of activists who are focused on change. Second, acquiring and processing the data is fun and collabo-rative and it uses the same technology that they grew up with and know so well. Third, it allows them to stretch themselves intellectually into a new domain and learn some new skills. Additionally it allows them to acquire as much detail as they feel is necessary for their purpose and enjoyment, to build upon what others have done before them and to be judged and appreciated by their peers for their work.
If the previous ‗values‘ are reduced down to eight (8) essentials, it becomes apparent that the OSM move-ment has a high degree of appeal to the ―Download Generation.‖
Table 1: the Appeal of OSM to the Download Generation
The ―Download Generation‖ is perfectly suited to the Do It Yourself (DIY) movement of collaborative online information generation and OSM makes a logi-cal extension of Wikipedia11, Digg12, Technorati 13
and the many other sites mushrooming up from seem-ingly nowhere.
“Download Generation” and Charting
This DIY mindset will surely have an effect on our charting world. We can see nascent crowdsourced seabed maps through OLEX (www.olex.no) and Pis-catus (www.piscatus.co.nz) who use user-generated bathymetry to improve their seafloor images used in the fishing industry. So crowdsourced charting does exist but is focused on a narrow application at the moment.
Perhaps we can see a more likely model in the online cycling map phenomenon.
OSM
Timeliness x Connectedness Free x Customization x Content x Activism x Collaborative Knowledge x Trust x
72
INTERNATIONAL HYDROGRAPHIC REVIEW MAY 2010
What Can Cyclists Tell Us About The Future of
Charting?
First off cyclists are a well defined community. They enjoy talking to other cyclists and they love to ride to new locations. Now since cyclists must share the road with faster and heavier vehicle traffic there is a safety concern shared by all cyclists. So there is a common need to tell other cyclists how to navigate in their spe-cific neck-of-the-woods. The cycling community is also well connected, technically savvy and environ-mentally active. It is no surprise then that the web is full of sites offering tips to cyclists about the best routes through a community. T h e C a m b r i d g e J o u r n e y P l a n n e r (www.camcycle.org.uk) is a good example. The site offers preferred navigation routes through Cambridge. Fietsrouteplanner.eu is another such site, cyclo-
path.org another, ridethecity.com another, bbbike.sourceforge.ne yet another and on and on. As one enthusiast has noted: "Everyone has their own reasons for enjoying Open-
StreetMap, but for me, cycling is the “killer app” -in
that OSM gives you the best cycling maps in the world
(on the web and on your GPS), and mapping is also a
great excuse to get out there and cy-
cle." ...www.opengeodata.org Cyclopath.org provides a mechanism for riders to up-date the maps after each ride. It is hard to imagine competing with that level of updating. As Jeremy Crampton 14 has noted: "Is data created by an "trained expert" who is not fa-
miliar with an area somehow more "accurate" than
data created by an "amateur" who lives in that area
and has a vested interest in correct information? Espe-
cially given that the local amateur has the means
(through OSM) to make corrections on the fly?" Having a committed group of enthusiasts, eager to share new navigation information with their fellow travelers to ensure they also have a safe, enjoyable and incident-free journey - surely there is a lot to learn from this? Sea kayakers, for example, are a likely group to strongly benefit from some community-driven wiki action. Water depth is largely irrelevant to even the most heavily laden tandem kayak – it still draws less than 25cm at best. Sea kayakers are far more interested in the effects of tidal currents in a region – an aspect that can really affect their safety.
Similar to cyclists, sea kayakers rely on their fellow travelers to provide advice based on first hand experi-ence of sailing in an area; the nature of the currents, kelp beds to avoid, places to launch, beaches to camp on etc. A wiki-based chart would seem to be a good fit. OpenOceanMap.org in California provides a site with NOAA nautical charts marked with points at which sea-kayaks could be launched. EarthNC15 has employed crowdsourcing in its merging of NOAA‘s raster and vector charts and Google Earth. I think there is a lot to learn from ventures like this about how users can add value to digital map and chart products with-out taking away their fundamental core value as navi-gational tools.
Crowdsourcing Navigation Publications
A clear and straightforward step forward to crowd-sourcing useful navigation information would be a wiki-based Coastal Pilot or Sailing Directions. The contribution of other mariners who regularly sail within an area are those best suited to document the relevant information and to keep it up-to-date. It is almost certain that some form of marine wiki-based navigation device will be implemented, particu-larly when a significant percentage of Download Generation mariners start to flood into the market.
3-D Realism
Although not a new development in electronic charting, 3-D chart models have not met with great acceptance among the marine navigation community. That will likely change when the new generation of mariners takes command. I suspect that this is exactly the kind of display detail they want. One specific movement which I‘m sure will have direct relevance to the mapping and charting world in the near future is the amazing free work being done by volunteers in developing 3-D models for display in Google Earth. While the greatest volume of work is being done by commercial organizations and munici-pal governments to develop 3-D models of sections of cities for their own purposes (see for example Digital Urban16), it is the free work being done by gifted vol-unteers that can be breathtaking in its complexity, realism and ultimately its usefulness. Visiting the Google SketchUp Warehouse 17 one can view amazing models of some of the most beautiful building in the world. Additionally, and of great significance to the charting community is the work being done modeling bridges over navigable waterways and waterfront detail. A beautiful example of this exists for Portland OR, 18 but there are many others.

73
INTERNATIONAL HYDROGRAPHIC REVIEW MAY 2010
What about Connectedness?
The missing piece of technology is connectedness for the offshore user. That is both a marketing and a tech-nical problem. The technical issues can be overcome with the use of supplemental antennae which can boost range out to beyond 20Nm19. Satellite phones give global coverage but continuous connectedness is not really financially viable for most shipping applications. Nor is there the same need in mid-oceanic voyages. But conventional 3G network access from 20Nm would seem to fill a growing market need. So Connectedness is doable and inevitable.
The Nautical Chart as a Paradigm
We have traditionally thought of the nautical chart as a physical entity, the end result of an intelligence gather-ing and filtering exercise but nonetheless boiled down to a sheet of paper covered with inked-in symbology. More recently we think of its digital equivalent as a collection of information objects displayed in a near traditional style. The Download Generation is far more likely to see it as a means to an end untied to specific hardware or display standard and fluid enough to pass from different media at different times. The introduc-tion of electronic chart technology has from the begin-ning been referred to as a paradigm-changing20 event. It is, but that paradigm has yet to be fully defined.
The Issue of Free
One of the more vexing issues will undoubtedly be the issue of fee-based licensing. The Download Generation has been raised in the era of Napster and they adopted Pirate Bay with abandon. They are notoriously unsym-pathetic to the entertainment industry‘s complaints of illegal downloading and are outraged by measures like Digital Rights Management (DRM). That didn‘t go so well for the entertainment industry.
A major motivation for OpenStreetMap was to get around what were perceived as excessive fees levied by the Ordnance Survey. That didn‘t go so well for the OS.
The Download Generation will carry that same attitude about ENC licensing when they graduate from naviga-tion colleges and become a force to reckon with on the bridge.
One option might be to support a fee-based service in the image of Spotify21, a streaming customizable mu-sic service which runs constantly. Should such a par-allel chart service eventually come to pass it would be the culmination of one of the dreams of a Electronic Charting pioneer, Neil Anderson, who envisioned in 1984 a chart server ‗in the sky‘ that would stream out nautical chart information in an endless stream22. That kind of technology didn‘t work 25 years ago but the times have changed.
The Entry of the Download Generation Into The
Marine Navigation World The effect on workplace demographics as shown in Figure 2 will somehow be reproduced in the work-place of marine navigation. The effect of the Download Generation may be accelerated in places where there is a disproportionate number of deck and navigation officers approaching retirement in the next decade. If the effect seen in eastern Canada23 is repli-cated elsewhere then we can expect their influence to be felt even sooner than in the population in general.
Figure x: Angus L. MacDonald Bridge Halifax/Dartmouth NS (left) the free model by „mapleleaf‟ in the 3-D
Warehouse; (right) photo of daily vessel transits under the bridge
Figure 2: Expected Entry of Download Generation into
Marine Navigation Community

74
INTERNATIONAL HYDROGRAPHIC REVIEW MAY 2010
Summary of Most Likely Changes Download
Generation Will Expect (And Eventually Get)
Openness of display options for customization Drill down detail 3-D realism Crowdsourced overlays Chart changes within minutes of the action being reported All content online all the time Ratings and feedback from fellow mariners
All of these expectations can be met, some in the near term, others requiring changes by HOs and port state regulators. Some will require changes to existing tech-nical standards and others need international regulatory approval.
Suggested Strategies for Welcoming the Download
Generation into the Navigational Charting Commu-
nity
1) Prepare for the coming pressure for change 2) Use Social Networking technology to encourage
debate about change 3) Support technologies that give mariners an oppor-
tunity to contribute information 4) Encourage standards to keep specific layers open
for direct user input 5) Free up as much supporting data as possible 6) Pipeline new information directly to mariners
tagged with quality level ratings 7) Be guided by users to incorporate photo realism
and 3-D models 8) Encourage and respond to user ratings 9) Begin to employ crowdsourcing, initially on non-
regulated publications, expanding later
Closing Thoughts:
As much as the world is changing one thing will remain constant - there will always be ships. Shipping will remain as the safest, most economic and most environ-mentally sustainable form of transportation. Shipping patterns will shift over the next 30 years - just like they have over the past 30. But like all forms of transporta-tion, there will always be inherent risks There will always be mechanical or electronic glitches, always storms at sea, always heavy traffic, always human mis-understanding, always staff troubled by their own demons, always a chain of events leading to incidents with a loss of life, cargo and damage to the environ-ment. So there will always be a need for vigilance assisted by some form of nautical charting technology.
What will be different is the thinking process used by the navigating officers on board: what they expect, what they know to be true and what they know that they don't know.
The ―Download Generation‖ is perfectly suited to this environment. We need to recognize that they will influence the future.
Notes and References
1 T8-2008. Sex and Selected Age Groups [15]; US Cen-sus Bureau factfinder.census.gov
2 www.digitalnative.org
3 "Born Digital", 2008, John Palfrey and Urs Gasser, Basic Books
4 ―Grown Up Digital‖, 2009, Don Tapscott, McGraw Hill
5 The Emerging Millennials‖, 2009, Reginald W. Bibby, Project Canada
6 ―Citizen Mapping And Charting: How Crowdsourcing is Helping to Revolutionize Mapping & Charting, 2009, M.J. Casey, Hydro 2009 Conference, Norfolk, Va.
7 ―Citizen Mapping and Charting‖, 2009,M.J. Casey, Hydro International, Vol. 13, Number 8
8 "Crowdsourcing - Why The Power Of The Crowd Is Driving The Future of Business", 2008, Jeff Howe, Crown Business
9 ―Volunteering Geographic Information to Authorita-tive Databases: Linking Contributor Motivations to Program Characteristics‖ David J. Coleman et al., in review; Geomatica, Journal of Geospatial Information Science, Technology and Practise,2009
10 OpenStreetmap.org
11 wikipedia.org
12 digg.com
13 technorati.com
14 ―Mapping Without a Net: Neogeography in the 21st C e n t u r y ‖ , 2 0 0 8 , J e r e m y C r a m p t o n , (http://www.wun.ac.uk/ggisa/seminars/archive/autumn08_program/index.html)
15 earthnc.com
16 digitalurban.blogspot.com
17 sketchup.google.com/3dwarehouse
18 digitalurban.blogspot.com/2009/05/portland-3d-city-model.html
19 www.digitalantenna.com/prods/cellantenna_8.html

75
INTERNATIONAL HYDROGRAPHIC REVIEW MAY 2010
20 ―Exploitation of Intellectual Property by Electronic Chartmakers: Liability, Retrenchment and a Proposal for Change‖, 1994, Edward J. Obloy and B. Helen Sharetts-Sullivan, Defense Mapping Agency, Proceed-ings Conference on Law and Information Policy
21 www.spotify.com
22 ―The Electronic Chart‖, Anderson, N.M., 1985. Pro-ceedings of the Canadian Hydrographers Association and the Hydrographic Society, U.S. Branch, joint work-shop, Dartmouth NS
23 Marine Careers Opportunities in the Marine Trans-portation and Offshore Petroleum Industries in Eastern Canada; Government Newfoundland & Labrador; Ma-rine Careers Secretariat: Marine Careers Opportunities
http://www.exec.gov.nl.ca/exec/wpo/publications/
index.html
————————--
Biography of the Author
Mr. Casey is V.P. Geospatial Systems, IIC Technolo-gies Inc. His responsibilities include exploring advances in navigation technologies, topo and bathy-metric lidar developments, general trends in map and geospatial technology and business development. For-merly he worked for the Canadian Hydrographic Ser-vice and participated in several electronic charting ini-tiatives. He was the Project Leader for the Canadian Electronic Chart Pilot Project, a project that grew to include testing electronic charting infrastructure in both Canada and the US and employing over 50 ships. He participated in and led various supporting projects such as ENC updating, at-sea testing, electronic docking charts, ENC pricing and establishing a viable ENC Dis-tribution Chain.

76
INTERNATIONAL HYDROGRAPHIC REVIEW MAY 2010
BOOK REVIEW
Prepared by Leendert Louis Dorst.
Printed by Optima Grafische Communicatie,Rotterdam, 2009, ISBN 978-90-365-2878-8
220 p.
“Estimated Sea Floor dynamics in the Southern North Sea
to improve Bathymetric Survey Planning”
The work described in this book was part of a PhD disserta-tion although its origins came from the Hydrographic Service of the Royal Netherlands Navy. The research carried out at the University of Twente , although academic, has a very practical objective. The Netherlands coast and indeed the coast of most of the Southern North Sea, is of a sedimentary nature, affected by ever varying tidal currents and consequently is mobile and the undersea topography subject to change. To the Hydrographic organisations responsible for surveying and charting the area this presents a great challenge. As these changing depths have a direct effect on the under keel clearances for shipping re-surveys are an essential part of the work. The location and frequency of these surveys is an important decision to be made.
The book describes how the sea floor can be described statistically and this can be used to predict future changes. Kriging is used to produce a time series of grids of depth values and their variances. It then uses deformation analysis based on testing theory. This analy-sis is particularly aimed at the changes in the areas of tidal sand waves, which can be quite extensive in the Southern North Sea. The theoretical developments were then tested in practice on an area Maas West near the Port of Rotterdam and found to provide satis-factory estimates and predictions of sand wave patterns and their mobility. The author states that migration rates of these features are up to 7.5 metres a year with a 95% confi-dence interval that depends upon the regularity of the pattern. Following work on the test area the author analysed several other areas using data from the archives of the Nether-lands HO to develop some general conclusions. From these they were able to formulate four indicators and from these make recommendations for the re-survey policy on the Belgian and Netherlands Continental Shelf.
The book is well written in English, well designed and with ample clear illustrations.
The following are the main subject headings: Introduction; Bathymetric applications of Geostatistics; Estimating sea floor dynamics; analysis of migrating tidal sand waves; spa-tial variations in sea floor dynamics; application to the re-survey policy; conclusions and recommendations.
Adam J.Kerr

77
INTERNATIONAL HYDROGRAPHIC REVIEW MAY 2010
OBITUARY
VICE-ADMIRAL
ORLANDO AUGUSTO AMARAL AFFONSO
Vice-Admiral Orlando Augusto Amaral Affonso was born in the State of Rio de Janeiro, Brazil, on August 24th, 1924. He was promoted to midshipman in 1946 and, after a successful career was promoted to Vice-Admiral in 1978. Graduating from the Naval Academy as a Bachelor of Naval Sciences, he completed the Course of Hydrography and Navigation for Officers in the Brazilian Directorate of Hydrography and Navigation (DHN) with summa cum laude in 1953. Among various courses he achieved summa cum laude for the Command and General Staff Course and the Naval Higher Studies in the Brazilian Naval War College. He served on various Brazilian ships, being Captain of hydrographic and oceanographic sur-veying ships, as well as Chief of Commission of numerous hydrographic surveys, both in Brazilian national waters and abroad in conjunction with operations with foreign navies. His shore service included a high level leadership and advisory activities, being the Brazilian National Hydrographer from 1975 to 1978. His last professional appointment was as IHB Director from 1982 to 1987. Admiral Orlando Affonso was author of numerous articles and papers on hydrography and oceanography, mainly addressed to the Brazilian national maritime policies and sea resources. He participated in numerous scientific societies including the U.S. Naval Institute, Founding Member of the Brazilian Cartography Association, Member of the National Geographic Council of Brazil, Member of the Pan-American Institute for Geography and History, Secretary General to the Oceanographic Commission of the National Research Council, Chairman of the Oceanography Committee of the National Council for Scientific and Technological Development and Interministerial Commission for Sea Resources of the Brazilian Government. He received numerous decorations including the World War II Medal. Admiral Orlando Affonso died on 25th October 2009 of pneumonia and septicemia at the Brazilian Naval Hospital Marcílio Dias.

78
INTERNATIONAL HYDROGRAPHIC REVIEW MAY 2010
Page intentionally left blank

79
INTERNATIONAL HYDROGRAPHIC REVIEW MAY 2010
© Copyright International Hydrographic Organization [2010]
This work is copyright. Apart from any use permitted in accordance with the Berne Conven-tion for the Protection of Literary and Artistic Works (1886), and except in the circumstances described below, no part may be translated, reproduced by any process, adapted, communi-cated or commercially exploited without prior written permission from the International Hydrographic Bureau (IHB). Copyright in some of the material in this publication may be owned by another party and permission for the translation and/or reproduction of that material must be obtained from the owner.
This document or partial material from this document may be translated, reproduced or distributed for general information, on no more than a cost recovery basis. Copies may not be sold or distributed for profit or gain without prior written agreement of the IHB and any other copyright holders.
In the event that this document or partial material from this document is reproduced, translated or distributed under the terms described above, the following statements are to be included:
“Material from IHO publication *reference to extract: Title, Edition+ is reproduced with the permission of the International Hydrographic Bureau (IHB) (Permission No ……./…) acting for the International Hydrographic Organization (IHO), which does not accept responsibility for the correctness of the material as reproduced: in case of doubt, the IHO’s authentic text shall prevail. The incorporation of material sourced from IHO shall not be construed as constitut-ing an endorsement by IHO of this product.”
“This *document/publication+ is a translation of IHO *document/publication+ *name+. The IHO has not checked this translation and therefore takes no responsibility for its accuracy. In case of doubt the source version of *name+ in *language+ should be consulted.”
The IHO Logo or other identifiers shall not be used in any derived product without prior written permission from the IHB.