the internal validation and casework application of
TRANSCRIPT
The Internal Validation and Casework Application
of MiniSTR Systems
A thesis submitted in partial fulfilment of the requirements for the degree of Magister Scientiae
in the Department of Biotechnology, University of the Western Cape
Eugene Lyle Kleyn
March 2008
Supervisors: Dr. Neil Leat (PhD)
Prof. Sean Davison (PhD)

i
Keywords
Validation
MiniSTR
Short Tandem Repeat (STR)
Loci
Y-STR
Skeletal Remains
Political Violence
Degraded DNA
Mitochondrial DNA (mtDNA)
Polymerase Chain Reaction (PCR)
Electrophoresis
Genotyping
South African Missing Persons Task Team (SAMPTT)
Argentine Forensic Anthropology Team (EAAF)
Torture
uMkhonto weSizwe (MK)

ii
Abstract
The Internal Validation and Casework Application of MiniSTR Systems
E L Kleyn
MSc Thesis, Department of Biotechnology, University of the Western Cape
The objective of the study was to conduct an internal validation on miniSTR systems
and apply it to cases received from the South African Missing Persons Task Team
(SAMPTT). This was prompted by the fact that miniSTR systems have been shown to
out perform some of the commercial kits available in the time of the study and
provide an alternative to mtDNA when analysing degraded DNA from skeletal
remains and that the DNA extracted from skeletal remains received from the
SAMPTT would be degraded due to the remains generally being fragmented or
charred and buried for many years. The miniSTR loci chosen for validation comprised
the Combined DNA Index System (CODIS) thirteen core loci and were arranged into
four triplexes and one uniplex. The internal validation studies included the following:
a reaction volume study, sensitivity study, cycle number study, reproducibility and
precision studies, environmental and matrix studies, mixture studies and concordance
studies. Miniplex 1 and 2 exhibited sensitivity down to 100pg of DNA in 10μL
reactions at 38 cycles while Miniplex 3 and 4 exhibited sensitivity down to 100pg at
33 cycles. The average allele size standard deviation ranged from 0.045-0.158 bases
and concordance was observed in 99% of all allele calls made. The casework received
from the SAMPTT involved six bone specimens, four highly fragmented and charred
20 year old bone specimens, a 25 year old bone specimen and a 44 year old bone
specimen. The miniSTR systems produced four full CODIS profiles and two partial
CODIS profiles for the bone specimens. This enabled the identities of four of the six
bone specimens to be resolved. To support the miniSTR results and resolve the other
cases, mtDNA and Y-STR typing were utilised. The DNA analysis data augmented
the non-DNA evidence supporting the hypothesis that the bone specimens were
derived from ANC activists who were abducted, tortured and murdered by the South
African Security Police during the period 1963-1987.
iii
Declaration
I declare that ‘The internal validation and casework application of miniSTR systems’
is my own work, that it has not been submitted for any degree or examination in any
other university and that all the sources I have used or quoted have been indicated and
acknowledged by complete references.
Full Name: Eugene Lyle Kleyn
Signed:
Date: March 2008
iv
Acknowledgements
I would like to acknowledge and thank the National Research Foundation (NRF) for
financial assistance.
I would like to thank my research supervisors for their guidance throughout this
project.
Thanks also go to family and friends who have supported me during this endeavour.

v
List of Abbreviations DNA Deoxyribonucleic Acid STR Short Tandem Repeat CODIS Combined DNA Index System mtDNA Mitochondrial DNA Y-STR Y-chromosome short tandem repeat SNP Single nucleotide polymorphism SWGDAM Scientific Working Group on DNA Analysis Methods EDNAP European DNA Profiling Group ENFSI European Network of Forensic Science Institutes CHI Center for Human identification AFDIL Armed Forces DNA Identification Lab OAFME Office of the Armed Forces Medical Examiner CILHI Central Identification Laboratory, Hawaii ICMP International Commission on Missing Persons FSD Forensic Science Department TRC Truth and Reconciliation Commission SAMPTT South African Missing Persons Task Team EAAF Equipo Argentino de Antropología Forense, Argentine Forensic
Anthropology Team MHL Minimal haplotype loci PCR Polymerase Chain Reaction MgCl2 Magnesium Chloride dNTPs deoxi Nucleotide TriPhosphates BSA Bovine Serum Albumin EDTA Ethylene Diamine Tetra Acetic Di-Sodium Salt
vi
RFU Relative Fluorescent Units TEMED N, N, N’, N’ Tetramethyl-EthyleneDiamine
AMPS Ammonium Persulfate
vii
List of Figures Figure1-1. Deamination of adenine and guanine (Adapted from www.ypatent.com/DNArepair.htm)
Figure1-2. Deamination of cytosine and 5-methylcytosine (www.bio.miami.edu/dana/250/25005_9.html)
Figure 1-3. DNA strand scission resulting from depurination and subsequent β- elimination at the apurinic (AP) site (Adapted from Sheppard et al. 2000)
Figure 1-4. Base-pairing between adenine and the oxygen free-radical-induced lesion 8-oxy-7, 8-dihydroguanine (Adapted from Lindahl, 1996)
Figure 1-5. DNA strand breaks caused by reactive oxygen species (Adapted from von Sonntag, 1987)
Figure 1-6. Problem of using end-point PCR as a quantitative tool (http://www.cstl.nist.gov/biotech/strbase/training.htm)
Figure1-7. CODIS Core Loci (http://www.cstl.nist.gov/biotech/strbase/training.htm)
Figure 1-8. Comparison of the Applied Biosystems 16plex Identifiler and the Promega PowerPlex 16 kits (Butler, 2005)
Figure 1-9. Schematic overview of the product size ranges for the loci included in commercial typing kits (http://www.cstl.nist.gov/biotech/strbase/training.htm)
Figure 1-10. Non-Coding Control Region (Adapted from http://www.cstl.nist.gov/biotech/strbase/NISTpub.htm)
Figure 1-11. Comparison of conventional and miniSTRs (http://www.cstl.nist.gov/biotech/strbase/NISTpub.htm)
Figure 1-12. Comparison of STR allele peak heights obtained from PowerPlex® 16 and Miniplex 1 loci with equivalent amounts of the same aged bloodstain sample (Butler et al. 2003)
Figure 1-13. DNA degraded with DNase I over different time periods (Chung et al.2004)
Figure 1-14. Amplification efficiency of the “BigMini” and commercial PowerPlex 16 typing systems (Chung et al.2004)
viii
Figure 1-15. Proposed Mechanism behind discordant results (http://www.cstl.nist.gov/biotech/strbase/NISTpub.htm)
Figure 1-16. Overview of the screening process to identify miniSTR loci (Coble and Butler, 2005)
Figure 1-17. Sensitivity results for DNA dilutions using the D10S1248 marker (Coble and Butler, 2005)
Figure 2-1. Reaction Volume Study
Figure 2-2. Sensitivity studies Figure 2-3. Cycle number study Figure 2-4. Environmental and Matrix Studies Figure 2-5. Mixture study Figure 3-1. Femur specimen THKY 01-G3 received from the SAMPTT for DNA analysis Figure 3-2. Femur specimens AA06, AA17, AA32 and AA35 received from the SAMPTT for DNA analysis Figure 4-1. Femur specimen Mam07_001_5910_body 2 received from the SAMPTT for DNA analysis

ix
List of Tables Table 1-1. Summary of available commercial STR kits that are commonly used (Butler, 2006) Table 1-2. Y-STR Core loci Table 1-3. Original Miniplex Systems (http://www.cstl.nist.gov/biotech/strbase/NISTpub.htm) Table 1-4. Summary of 15 discordant STR profiling results (Drabek et al. 2004) Table 1-5. Comparison of heterozygosity values from 474 individuals (Coble and Butler, 2005) Table 2-1. Precision Study Table 2-2. Discordant STR profiling results observed between the PowerPlex 16 kit (Promega) and the Miniplex systems Table 3-1. mtDNA amplification and sequencing primers Table 3-2. DNA Concentrations of Family Reference Buccal Swab DNA Samples Table 3-3. DNA Concentrations of DNA Samples extracted from bone Table 3-4. Full CODIS miniSTR profiles of bone specimen THKY 01-G3 and reference swab RF Table 3-5. Full CODIS miniSTR profiles of bone specimen AA32 and reference swab KM Table 3-6. Full CODIS miniSTR profiles of bone specimen AA32 and reference swab LM Table 3-7. Full CODIS miniSTR profiles of bone specimen AA35 and reference swab LS Table 3-8. Full CODIS miniSTR profile of reference swab JM and partial profile of bone specimen AA06 Table 3-9. Full CODIS miniSTR profiles of reference swabs JM and CM Table 3-10. Full CODIS miniSTR profiles of reference swabs JM and JOM Table 3-11. Mitochondrial DNA haplotypes for HVI (16024 to 16365) and HVII (73 to 340) of specimen AA17 and maternal relatives of JAM Table 3-12. Mitochondrial DNA haplotypes for HVI (16024 to 16365) and HVII (73 to 340) of bone specimen AA32 and a maternal relative of AM

x
Table 3-13. Mitochondrial DNA haplotypes for HVI (16024 to 16365) and HVII (73 to 340) of bone specimens AA06, AA35 and maternal relatives of HS and JM Table 4-1. DNA Concentrations of Reference Buccal Swab DNA Samples
Table 4-2. DNA Concentration of Bone DNA Sample Table 4-3. Full CODIS miniSTR profiles of bone specimen Mam07_001_5910_body 2 and Swab DNA_02_03_07 Table 4-4. Full CODIS miniSTR profiles of bone specimen Mam07_001_5910_body 2 and Swab DNA_04_03_07 Table 4-5. Full Y-STR profiles of bone specimen Mam07_001_5910_body 2 and Swab DNA_02_03_07 Table 4-6. Full Y-STR profiles of bone specimen Mam07_001_5910_body 2 and Swab DNA_04_03_07 Table 4-7. Full Y-STR profiles of bone specimen Mam07_001_5910_body 2 and Swab DNA_05_03_07
xi
Table of Contents
Chapter 1: Literature Review
1.1. Introduction 1
1.2. Mass Disasters and Missing Persons 2
1.3. DNA Degradation 2
1.3.1. Factors Leading to Degradation 2
1.3.1.1. Enzymatic DNA Strand Cleavage 3
1.3.1.2. Hydrolytic Damage 3
1.3.1.3. Oxidative Damage 6
1.4. Contamination 8
1.4.1. Sources of Contamination 8
1.4.2. Pre-Laboratory Contamination Controls 9
1.4.3. Laboratory Contamination Controls 10
1.5. DNA Extraction Methods 13
1.5.1. Chelex Extraction 13
1.5.2. Phenol/Chloroform Extraction 14
1.5.3. Silica Extraction 14
1.6. DNA Quantification 15
1.6.1. Classical Methods 15
1.6.2. End-Point PCR Methods 15
1.7. DNA Typing Methods 17
1.7.1. History 17
1.7.2. Autosomal Short Tandem Repeats (STRs) 17
1.7.2.1. CODIS 18
1.7.3. Autosomal Single Nucleotide Polymorphisms (SNPs) 20
1.7.4. Y-STRs 21
1.7.5. MtDNA 23
1.7.6. MiniSTRs 24
1.7.6.1. History of MiniSTR Typing Systems 25
1.7.6.2. Degradation 26
1.7.6.3. Sensitivity 29
1.7.6.4. Concordance 30

xii
1.7.6.5. Analysis of DNA from Human Skeletal Remains 32
1.7.6.6. Beyond the use of CODIS STR Markers 32
1.7.6.7. Commercial MiniSTR Kits 36
1.8. Laboratories Involved in the Identification of Human Remains 38
1.8.1. Center for Human Identification 38
1.8.2. Armed Forces DNA Identification Lab 39
1.8.3. The Bode Technology Group 40
1.8.4. International Commission on Missing Persons 41
1.9. Validation 42
1.9.1. Developmental Validation 42
1.9.2. Internal Validation 42
1.10. Investigation, Recovery and Analysis of Human Skeletal Remains in the 44
Context of the Political Violence in South Africa
1.11. Objectives of this Study 45
Chapter 2: Validation Studies 2.1. Introduction 46
2.2. Materials and Methods 46
2.2.1. DNA Extraction 46
2.2.2. DNA Quantification 46
2.2.3. PCR Amplification 46
2.2.4. Detection and Data Analysis 47
2.3. Results and Discussion 48
2.3.1. Reaction Volume Study 48
2.3.2. Sensitivity Studies 49
2.3.3. PCR Cycle Number Study 50
2.3.4. Reproducibility and Precision 54
2.3.5. Environmental and Matrix Studies 55
2.3.6. Mixture Studies 57
2.3.7. Concordance Studies 59

xiii
Chapter 3: Case Study 1: DNA Analysis of 25 year old and Fragmented and
Charred 20 year old Human Skeletal Remains
3.1. Introduction 61
3.2. Materials and Methods 61
3.2.1. Laboratory Setup 61
3.2.2. Sample Collection and Preparation 62
3.2.3. DNA Extraction 63
3.2.4. DNA Quantification 64
3.2.5. MiniSTR PCR Amplification 64
3.2.6. Mitochondrial DNA PCR Amplification and Sequencing 65
3.2.7. Detection and Data Analysis 67
3.3. Results and Discussion 67
3.3.1. Forensic Specimens 67
3.3.2. DNA Quantification 68
3.3.3. MiniSTR PCR Amplification 69
3.3.4. Mitochondrial DNA PCR Amplification and Sequencing 76
3.4. Conclusion 78
Chapter 4: Case Study 2: DNA Analysis of 44 year old Human Skeletal Remains
4.1. Introduction 80
4.2. Materials and Methods 82
4.2.1. Sample Collection and Preparation 82
4.2.2. DNA Extraction 82
4.2.3. DNA Quantification 82
4.2.4. MiniSTR PCR Amplification 82
4.2.5. Y-STR PCR Amplification 83
4.2.5. Detection and Data Analysis 83
4.3. Results and Discussion 83
4.2.1. DNA Quantification 83
4.2.2. MiniSTR PCR Amplification 84
4.2.3. Y-STR PCR Amplification 86
xiv
4.4. Conclusion 88
References 89
Electronic Supplementary Resources 94
Appendices 95 Appendix I. Protocols 95 Appendix II. Composition of Buffers and Solutions 108
1
Chapter 1: Literature Review
1.1. Introduction
The identification of highly degraded skeletal remains in mass disaster and missing
person’s cases can be extremely challenging. DNA obtained from these remains is
often degraded to a size range of 50-200 base pairs. The use of commercial autosomal
Short Tandem Repeat (STR) typing kits is not ideal as these systems generate
amplicons with a size range of 100-450 base pairs (Krenke et al. 2002; Holt et al.
2002; Coble and Butler, 2005; Alonso et al. 2005). In situations like these
mitochondrial DNA (mtDNA) analysis has traditionally been used because of its high
copy number (Butler and Levin, 1998; Holland and Parsons, 1999; Coble and Butler,
2005). However, mtDNA analysis is both time-consuming and costly and its maternal
inheritance and low power of discrimination make its use rather limited (Coble and
Butler, 2005).
A system able to type degraded DNA with the high discrimination capacity of
commercial autosomal STR typing kits would be ideal. This prompted the
development of miniSTR typing systems, which generate products with reduced sizes
(Butler et al. 2003). This was achieved by repositioning primers as close as possible
to the STR target region (Yoshida et al. 1997; Ricci et al. 1999; Wiegand and Kleiber,
2001; Tsukada et al. 2002 and Butler et al. 2003). This reduction in product size
allowed degraded DNA to be typed, as first observed in the analysis of skeletal
remains from the Waco Branch Davidian fire (Whitaker et al. 1995) and subsequently
in STR typing of human telogen hairs (Hellman et al. 2001); formalin fixed and
mummified tissue (Wiegand and Kleiber, 2001); 17-26 year old bloodstains (Tsukada
et al. 2002); human skeletal remains from the World Trade Center attack (Holland et
al. 2003); enzymatically degraded DNA (Chung et al. 2004) and remains from mass
graves of the Spanish Civil War (Martin et al. 2006). The conversion of the FBI
Combined DNA Index System (CODIS) 13 STR markers to miniSTRs meant that a
system had been developed which could type highly degraded DNA samples with the
high discrimination capacity of commercial autosomal STR typing kits (Butler et al.
2003).

2
This review will consider the issues and methodology involved in the analysis of
skeletal remains. It will focus on mass disasters and missing persons, DNA
degradation and preservation, DNA extraction methods, DNA quantification methods,
DNA typing methods and validation.
1.2. Mass Disasters and Missing Persons
Missing persons definitions vary worldwide but generally refer to an individual whose
whereabouts are unknown to relatives. In the United States of America alone there are
one hundred thousand active missing persons cases with thousands disappearing
under suspicious circumstances (Ritter, 2007). The ability to identify degraded
skeletal remains is often important when addressing missing persons cases. The FBI’s
National Crime Information Center (NCIC) database registry consists of over 6000
unidentified skeletons and this is only 15% of the total being held in medical
examiners evidence rooms across the United States (Ritter, 2007). All of these
remains cannot be identified by conventional forensic methods and many labs are not
capable of DNA analysis.
Mass disasters generally fall into one of the following categories, accidental, natural
or intentional (Budowle et al. 2005; Alonso et al. 2005). Accidental events include
train, bus and aircraft crashes as well as ferry sinkings and fires. Intentional events
include wars, the release of biological or chemical weapons, car, train and aircraft
bombings (Budowle et al. 2005; Alonso et al. 2005). The war in the former
Yugoslavia left behind hundreds of graves many of which were mass graves
containing degraded remains. The World Trade Center attacks generated thousands of
highly compromised skeletal remains (Holland et al. 2003).
1.3. DNA Degradation
1.3.1. Factors Leading to Degradation
DNA obtained from skeletal remains is often highly degraded. A number of factors
lead to this degradation. The process is initiated by cellular nucleases and is followed
by the release of the cells contents exposing it to microbial degradation (Hebsgaard et
al. 2005). The degree to which these enzymatic processes affect DNA degradation
depends on the environmental conditions. It can be slowed or stopped by freezing,
rapid desiccation and high salt concentrations. However other much slower and long
3
term chemical factors such as hydrolysis and oxidation will continue to degrade the
DNA even under ideal environmental conditions. These chemical factors result in the
following types of damage; strand breaks; hydrolytic damage and oxidative damage
(Paabo et al. 2004, Hebsgaard et al. 2005).
1.3.1.1. Enzymatic DNA Strand Cleavage
The process of autolysis occurs in dead or dying cells and results in the digestion and
release of the cell contents due to the release of digestive enzymes from lysosomes
(Paabo et al. 2004, Hebsgaard et al. 2005). This attracts bacteria and other
microorganisms which initiate putrefaction. During this process endonucleases and
exonucleases digest DNA into smaller fragments and sequentially remove nucleotides
from strands. This results in reduction in strand size and overall DNA concentration.
Fragmentation of DNA by nucleases makes the use of commercial autosomal STR
typing kits limited. This is due to the reduced length of available DNA fragments (50-
200bp) while the kits amplify products with a size range of 100-450bp (Krenke et al.
2002; Holt et al. 2002; Paabo et al. 2004; Coble and Butler, 2005; Alonso et al. 2005
and Willerslev and Cooper, 2005).
1.3.1.2. Hydrolytic Damage
The process of hydrolysis leads to deamination and the depurination and
depyrimidination of bases. The products of the deamination are hypoxanthine
(adenine), xanthine (guanine), uracil (cytosine) and thymine (5-methylcytosine)
(Figure1-1 and 1-2). These modifications are referred to as miscoding lesions because
they lead to alteration of sequences during PCR. The change from cytosine to uracil
leads to the incorporation of adenine instead of guanine while the change from 5-
methylcytosine to thymine results in the incorporation of adenine instead of guanine.
The incorporation of these errors has been seen to occur at mtDNA polymorphic sites,
which makes it even more of a concern because the errors could result in sequences
that closely resemble expected evolutionary changes in humans and animals (Paabo et
al. 2004 and Willerslev and Cooper, 2005).

4
Figure1-1. Deamination of adenine and guanine. The deamination of adenine and guanine yields hypoxanthine and xanthine respectively (Adapted from www.ypatent.com/DNArepair.htm).
Figure1-2. Deamination of cytosine and 5-methylcytosine. The deamination of cytosine (a) and 5-methylcytosine (b) yields uracil and thymine respectively (www.bio.miami.edu/dana/250/25005_9.html).
5
Hydrolysis can also cause strand breaks via phosphodiester bond cleavage,
depurination and depyrimidation of bases (Paabo et al. 2004; Hebsgaard et al. 2005
and Willerslev and Cooper, 2005). Direct cleavage of the phosphodiester bonds in the
phosphate-sugar backbone by hydrolysis generates single stranded nicks.
Depurination is the loss of purine bases (guanine and adenine) and depyrimidation is
the loss of pyrimidine bases (cytosine and thymine). The hydrolytic cleavage of the
glycosidic bond between the phosphate-sugar backbone and the bases result in
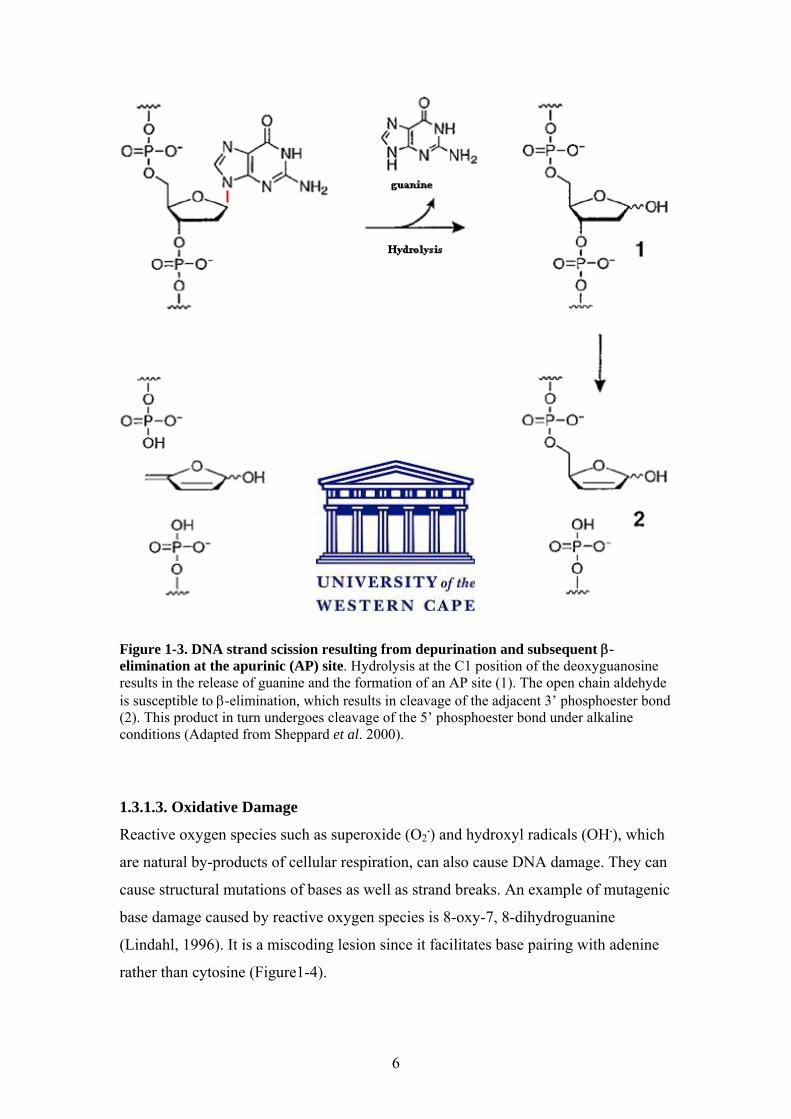
depurination and depyrimidation (Sheppard et al. 2000). The loss of these bases result
in apurinic or apyrimidinic (AP) sites. Figure 1-3 illustrates the steps involved in the
process, hydrolytic cleavage of the glycosidic bond leads to the formation of an open
chain aldehyde (compound 1), which is susceptible to β-elimination. Due to its
susceptibility the 3` phosphoester bond is cleaved (compound 2). Cleavage of the 5`
phosphoester bond occurs under alkaline conditions. The end result is DNA strand
breaks, which causes fragmentation and reduction in overall DNA concentration.
6
Figure 1-3. DNA strand scission resulting from depurination and subsequent β-elimination at the apurinic (AP) site. Hydrolysis at the C1 position of the deoxyguanosine results in the release of guanine and the formation of an AP site (1). The open chain aldehyde is susceptible to β-elimination, which results in cleavage of the adjacent 3’ phosphoester bond (2). This product in turn undergoes cleavage of the 5’ phosphoester bond under alkaline conditions (Adapted from Sheppard et al. 2000).
1.3.1.3. Oxidative Damage
Reactive oxygen species such as superoxide (O2.) and hydroxyl radicals (OH.), which
are natural by-products of cellular respiration, can also cause DNA damage. They can
cause structural mutations of bases as well as strand breaks. An example of mutagenic
base damage caused by reactive oxygen species is 8-oxy-7, 8-dihydroguanine
(Lindahl, 1996). It is a miscoding lesion since it facilitates base pairing with adenine
rather than cytosine (Figure1-4).
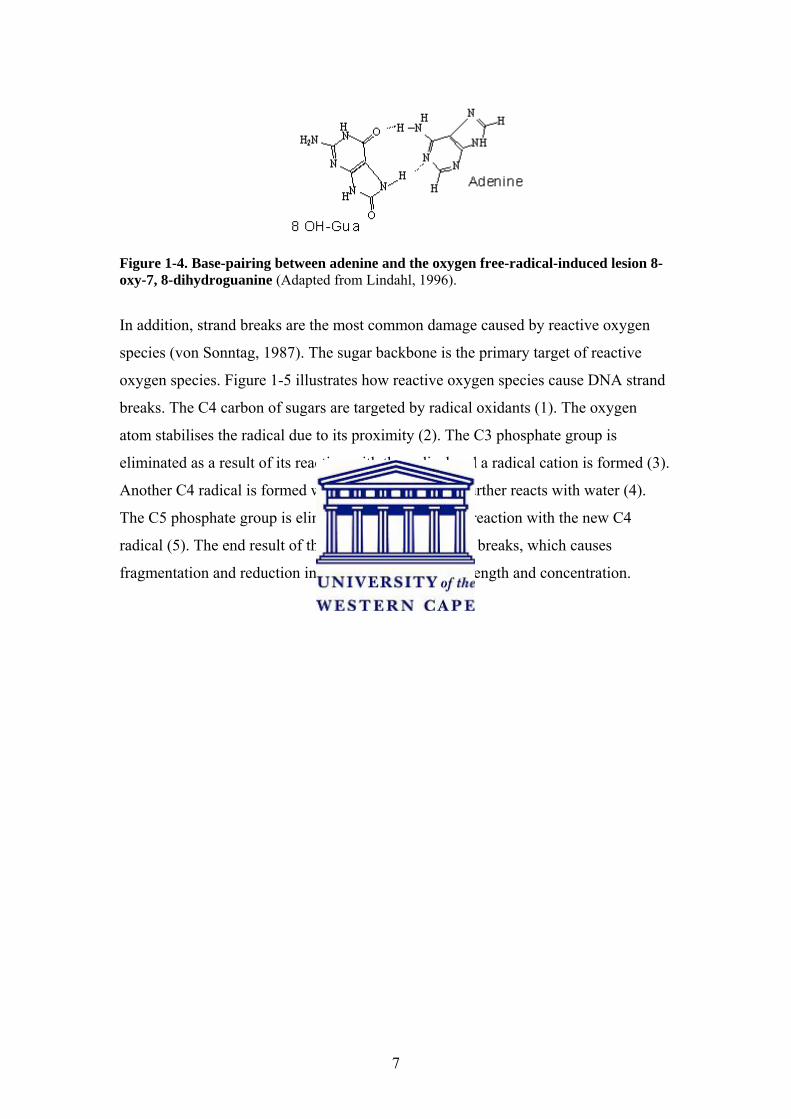
7
Figure 1-4. Base-pairing between adenine and the oxygen free-radical-induced lesion 8-oxy-7, 8-dihydroguanine (Adapted from Lindahl, 1996).
In addition, strand breaks are the most common damage caused by reactive oxygen
species (von Sonntag, 1987). The sugar backbone is the primary target of reactive
oxygen species. Figure 1-5 illustrates how reactive oxygen species cause DNA strand
breaks. The C4 carbon of sugars are targeted by radical oxidants (1). The oxygen
atom stabilises the radical due to its proximity (2). The C3 phosphate group is
eliminated as a result of its reaction with the radical and a radical cation is formed (3).
Another C4 radical is formed when the radical cation further reacts with water (4).
The C5 phosphate group is eliminated as a result of its reaction with the new C4
radical (5). The end result of the process is DNA strand breaks, which causes
fragmentation and reduction in overall DNA fragment length and concentration.
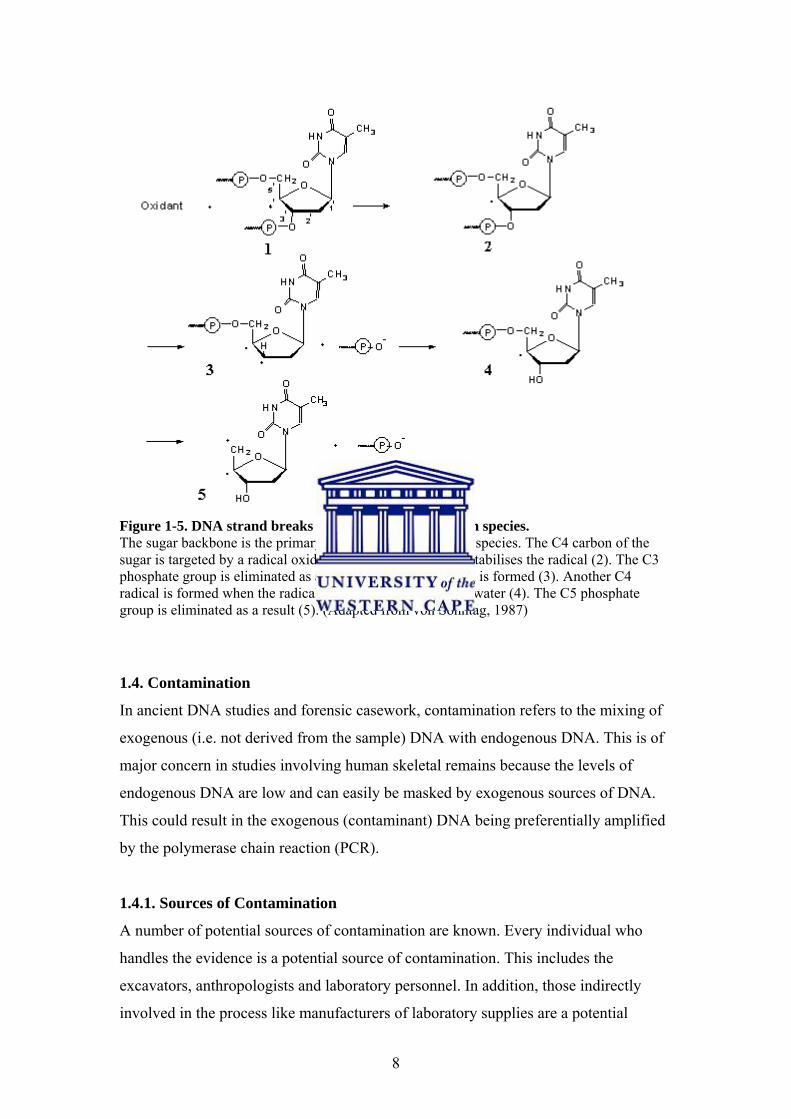
8
Figure 1-5. DNA strand breaks caused by reactive oxygen species. The sugar backbone is the primary target of reactive oxygen species. The C4 carbon of the sugar is targeted by a radical oxidant (1). The oxygen atom stabilises the radical (2). The C3 phosphate group is eliminated as a result and a radical cation is formed (3). Another C4 radical is formed when the radical cation further reacts with water (4). The C5 phosphate group is eliminated as a result (5). (Adapted from von Sonntag, 1987)
1.4. Contamination
In ancient DNA studies and forensic casework, contamination refers to the mixing of
exogenous (i.e. not derived from the sample) DNA with endogenous DNA. This is of
major concern in studies involving human skeletal remains because the levels of
endogenous DNA are low and can easily be masked by exogenous sources of DNA.
This could result in the exogenous (contaminant) DNA being preferentially amplified
by the polymerase chain reaction (PCR).
1.4.1. Sources of Contamination
A number of potential sources of contamination are known. Every individual who
handles the evidence is a potential source of contamination. This includes the
excavators, anthropologists and laboratory personnel. In addition, those indirectly
involved in the process like manufacturers of laboratory supplies are a potential
9
source of exogenous DNA (Hebsgaard et al. 2005 and Yang and Watt, 2005). Two of
the major concerns are the washing stages of exhumed remains and contamination by
PCR products in the DNA laboratory (Cooper, 1997; Willerslev and Cooper, 2005;
Hebsgaard et al. 2005). Therefore both pre-laboratory and laboratory contamination
controls and guidelines are critical to the success of a study.
1.4.2. Pre-Laboratory Contamination Controls
There have been cases where contamination could be traced back to individuals
involved in the exhumation and anthropological analysis of samples (Sampietro et al.
2006). This illustrates the importance of general excavation controls and guidelines.
Yang and Watt, (2005) suggest that the following contamination control guidelines be
used by field archaeologists.
1. Samples for DNA analysis should not be cleaned as the dirt may protect
against contaminants entering the sample.
2. Washing should be avoided as this could draw contaminant DNA into the
sample and hydrolytic damage may occur.
3. The use of preservatives should be avoided as they may inhibit PCR reactions.
4. Further degradation can be limited by storing samples in a cool and dry
environment.
5. Cross sample contamination can be prevented by storing modern reference and
ancient samples separately.
6. All tools should be cleaned with at least a 10% (w/v) commercial bleach
solution between each sample and whenever possible disposable tools should
be used.
7. Disposable gloves and hair nets and depending on conditions protective suites
should be worn at all times.
8. If a sample is not completely dry it could be stored in a paper bag but never in
a plastic bag or tube as this would create ideal conditions for bacterial growth.
Strict contamination controls of course only need to be in place for the collection of
the bones or teeth that will be used for DNA analysis but excavators might not know
which specimens will be sent for DNA analysis. A DNA analyst could help with this
by giving advice on, which bones from the site would be best for analysis and if any
10
extra precautions should be taken. Notes should also be kept by field archaeologists
recording the details of individuals involved in the exhumation. In addition, reference
samples should be collected from all of workers.
1.4.3. Laboratory Contamination Controls
Criteria of authenticity have been developed to prevent and detect laboratory
contamination. The criteria were developed for ancient DNA (aDNA) studies but can
be useful when conducting forensic studies on human skeletal remains. The criteria
include: (1) the use of a physically isolated pre-PCR work area or laboratory, (2)
Negative controls: PCR and extraction blanks, (3) independent reproducibility, (4)
cloning and sequencing, (5) decontamination of reagents and specimens, (6) DNA
analysis of associated faunal remains, (7) appropriate molecular behaviour, (8) uracil-
N-glycosylase (UNG) treatment and (9) quantification of starting templates. These
criteria are briefly considered below.
1. Physically isolated pre-PCR work area or laboratory
The physical separation of pre and post-PCR laboratories will limit contamination by
PCR products. The preparation of PCR reactions should be conducted in a dedicated
pre-PCR laboratory and personnel should not be allowed to move from a post to pre-
PCR environment on any one day (Yang and Watt, 2005 and Willerslev and Cooper,
2005). The further division of the pre-PCR laboratory into areas exclusively setup for
bone preparation, DNA purification and PCR setup would also help to prevent
contamination (Yang and Watt, 2005). Ideally each work area should be wiped down
with at least 10% bleach and exposed to UV irradiation daily.
2. Negative controls: PCR and extraction blanks
A PCR blank control contains all PCR reagents but no DNA template, which allows
contamination that occurs during the PCR setup to be detected. An extraction blank
control contains all the extraction reagents but no skeletal sample material and is
treated identically to the rest of the sample extractions. This allows any contamination
that occurs during the DNA extraction process to be detected. It has been suggested
that multiple PCR and extraction blank controls should be used per experiment
(Poinar, 2003; Paabo et al. 2004 and Gilbert et al. 2005). This multiple blank control
approach allows for the detection of sporadic and low-level contamination. However,
11
PCR extraction blank controls only provide an indication of authenticity and do not
take carrier-effects into account (Poinar, 2003; Paabo et al. 2004 and Willerslev and
Cooper, 2005). Substances like sugars and microbial DNA that are found in certain
extracts can act as “carriers” during PCR reactions thus allowing contaminant DNA of
low concentration to be amplified. The low level contamination might be present in
the PCR blank control as well but because it does not contain any “carriers” it will not
be detected.
3. Independent reproducibility
Independent replication of results by an external laboratory is seen as the best way of
demonstrating that internal laboratory contamination has been avoided (Willerslev
and Cooper, 2005). This is because it’s unlikely that the same erroneous result would
be generated independently in another laboratory. It has therefore been suggested that
10% of all key results of a study should be independently replicated.
4. Cloning and sequencing of PCR products
Cloning and sequencing can be used to assess contamination and DNA damage
(Poinar, 2003 and Willerslev and Cooper, 2005). The detection of the same type of
mtDNA sequence from several unrelated individuals or the presence of more than one
mtDNA sequence type from one individual is a clear indication of contamination. The
percentage and number of different mtDNA types present in a sample can be
determined by cloning. Ancient endogenous sequences are prone to sequence errors
due to the accumulation of DNA damage like miscoding lesions. Such errors can be
detected by sequencing of several independently cloned fragments.
The most frequently occurring and the most damaged or modified sequence is
considered to be the endogenous one (Poinar, 2003 and Sampietro et al. 2006). This is
because damage and modification has been thought to occur over time and therefore
the older (authentic) sequence should be more damaged or modified than the
contaminant sequence.
5. Decontamination of reagents and specimens
All tools and reagents, even if labelled as sterile, are also potential sources of
contamination and therefore must be decontaminated. Appropriate treatments can

12
include exposure to high concentrations of bleach for 48hours, 2.5M Hydrochloric
acid for 48 hours, UV irradiation or baking at 180oC for more than 12 hours
(Willerslev and Cooper, 2005).
Specimens must also be decontaminated due to the problem of pre-laboratory
contamination. Recent studies by Gilbert et al. 2006 and Sampietro et al. 2006 have
indicated that skeletal remains are most susceptible to contamination during pre-
laboratory handling. Therefore all specimens need to be decontaminated before DNA
extraction and analysis. The commonly used procedures to decontaminate human
skeletal remains include washing and physical removal of the outer surfaces,
extraction of internal material, acid washing of surfaces, UV irradiation, ethanol
immersion, bleach immersion and various combinations (Kemp and Smith, 2005).
6. DNA analysis of associated faunal remains
The preservation of DNA from associated remains can provide evidence for DNA
survival and against contamination (Poinar, 2003 and Willerslev and Cooper, 2005).
The amplification of DNA from associated faunal remains indicates whether the long-
term environmental conditions of the particular exhumation site favoured DNA
survival and if contamination occurred.
7. Appropriate molecular behaviour
Due to degradation, the DNA from skeletal remains is generally fragmented to a size
range of 50-200bp. Therefore PCR success should be inversely related to product size.
If this is not the case then it’s likely that the particular sample has been contaminated
with modern DNA (Paabo et al. 2004).
8. Uracil-N-glycosylase (UNG) treatment
Previously amplified PCR products may contaminate subsequent PCR reactions.
Carry over of PCR products can be prevented by substituting dTTP with dUTP in
reactions. Treatment of subsequent reactions with Uracil-N-glycosylase facilitates the
elimination of contaminating post PCR products.

13
9. Quantification of starting templates
An assessment of the copy number of the target DNA should be made. This is
important because it may be impossible to avoid sporadic contamination when
template levels are extremely low.
1.5. DNA Extraction Methods
The success of DNA analysis depends on the purity, quality and quantity of the DNA
extracted. Therefore extraction methods that reduce the loss of DNA and reduce or
remove inhibitors are desirable. There are four basic extraction categories with many
variations: denaturation and dilution, organic extraction, differential precipitation, and
differential affinity (Glenn, 1996). The methods of choice for ancient DNA extraction
over the years have been variations of the phenol/chloroform method, which is an
organic extraction method and the silica method, which is a differential affinity
method, as well as combinations of the two methods (Mac Hugh et al. 2000). While
the denaturation and dilution and differential precipitation methods generally result in
loss of DNA and inefficient removal of inhibitors. Each of the methods will be briefly
considered.
1.5.1. Chelex Extraction
The chelex method was first described as being a useful and simple extraction
procedure by Singer-Sam et al. 1989 and Walsh et al. 1991. Briefly, the method
involves the use of a Chelex chelating resin. Typically the sample is heated in the
presence of Proteinase K and the resin. Cells are lysed by the heat, Proteinase K
digests the proteins while the resin binds magnesium and other cellular components
that might interfere with downstream processes. The binding of magnesium is
important as it inhibits nuclease activity. A negative aspect of this is that if the resin
beads are carried over to a PCR reaction Taq polymerase activity will also be
inhibited. The Chelex method has been shown to be an effective protocol for the
extraction of DNA from saliva (Sweet et al. 1996). This has made it ideal for the
extraction of reference samples collected with buccal swabs. However it has been
observed by Hoff-Olsen et al. 1999 that when used on degraded tissue and ancient
animal bones it fails to remove PCR inhibitors.
14
1.5.2. Phenol/Chloroform Extraction
The phenol/chloroform extraction is a classical organic DNA extraction method. The
method has been used to extract DNA from ancient animal and human skeletal
remains and decomposed human soft tissue (Hagelberg et al. 1989; Hagelberg &
Clegg 1991 and 1993; Hagelberg et al. 1991, Hagelberg et al. 1994a, 1994b; Hoff-
Olsen et al. 1999). Most variations of the method are based on the protocol presented
in a widely used laboratory manual (Sambrook et al. 1989).
The material from which DNA is extracted is typically homogenised and exposed to
an aqueous lysis buffer containing a detergent. After cell lysis DNA is separated from
the lysate by a phenol extraction followed by a series of phenol chloroform
extractions. Phenol causes phase separation when combined with the aqueous lysis
buffer while the chloroform enhances the efficiency of the phase separation and
removes any residual phenol. Therefore when combined with the lysate it causes the
separation of proteins and other cell debris that are more soluble in phenol (organic
phase) from the aqueous phase in which DNA is more soluble. DNA is either
precipitated from the aqueous phase using ethanol or isopropanol or desalted and
concentrated by dialysis centrifugation. The dialysis centrifugation method is
preferred as less DNA is lost during the process.
1.5.3. Silica Extraction
This method was first described by Boom et al. 1990. It exploits the tendency of DNA
to bind to silica in the presence of chaotropic agents such as guanidinium thiocyanate
(GuSCN). Boom et al. 1990 evaluated the use of the GuSCN, which has the ability to
lyse cells, inactivate nucleases and facilitate the binding of DNA to silica. They
observed that DNA from human serum and urine will bind to silica in the presence of
sufficiently high GuSCN concentrations. This method was modified for use on
ancient animal bones by Hoss and Paabo, 1993 and was found to overcome some of
the challenges encountered using other methods. The principle of silica based
purification systems has evolved into the modern commercial “spin-column” systems
that are currently widely in use such as Qiagen’s Qiaquick PCR purification and
QIAamp DNA Blood Mini Kits.
15
1.6. DNA Quantitation
The accurate quantitation of DNA samples is required for human forensic casework.
The human specific quantitation of samples is a federal requirement for crime labs in
the United States of America. It’s important for the labs to show that the concentration
of a crime scene reference sample is known and that non-human DNA from animals,
plants, bacteria and fungi has not played a role in the quantitation. The accurate
quantitation of samples is especially important when commercial STR kits are used
since these kits are optimised for a narrow DNA input range usually 0.5-2ng.
1.6.1. Classical Methods
Sensitivity, dynamic range and human specificity are issues that have to be considered
when assessing quantitation methods. Classical methods such as spectrometry (UV
260/280), yield gels, fluorescence and slot blots have been used but have limitations
(http://www.cstl.nist.gov/biotech/strbase/training.htm). The UV 260/280 and yield gel
methods are not human specific or sensitive enough but the yield gel does give an idea
of the quality of the sample. While some methods based on fluorescent dyes (Pico
Green assay) and the slot blot method are both fairly sensitive (150pg-10ng) they have
a poor dynamic range.
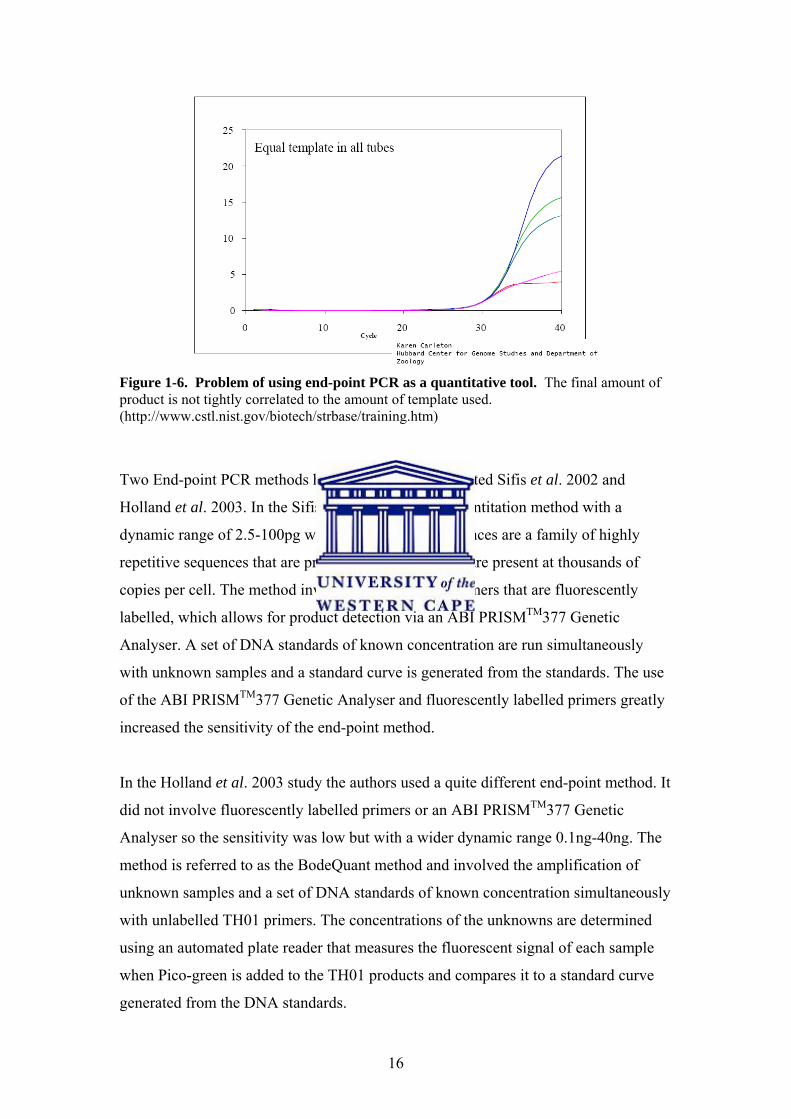
1.6.2. End-Point PCR Methods
There are three stages to a PCR, the baseline stage where there is no significant
increase in product, the exponential stage where there is an exponential increase in
product and the final plateau stage where resources are limited and product synthesis
ceases. End-point PCR quantitation is based on the use of the plateau stage, where the
amount of product is not necessarily correlated with the amount of template in the
initial reaction (Figure 1-6.)
16
Figure 1-6. Problem of using end-point PCR as a quantitative tool. The final amount of product is not tightly correlated to the amount of template used. (http://www.cstl.nist.gov/biotech/strbase/training.htm)
Two End-point PCR methods however have been reported Sifis et al. 2002 and
Holland et al. 2003. In the Sifis study an Alu-based quantitation method with a
dynamic range of 2.5-100pg was developed. Alu sequences are a family of highly
repetitive sequences that are primate specific and they are present at thousands of
copies per cell. The method involves the use of Alu primers that are fluorescently
labelled, which allows for product detection via an ABI PRISMTM377 Genetic
Analyser. A set of DNA standards of known concentration are run simultaneously
with unknown samples and a standard curve is generated from the standards. The use
of the ABI PRISMTM377 Genetic Analyser and fluorescently labelled primers greatly
increased the sensitivity of the end-point method.
In the Holland et al. 2003 study the authors used a quite different end-point method. It
did not involve fluorescently labelled primers or an ABI PRISMTM377 Genetic
Analyser so the sensitivity was low but with a wider dynamic range 0.1ng-40ng. The
method is referred to as the BodeQuant method and involved the amplification of
unknown samples and a set of DNA standards of known concentration simultaneously
with unlabelled TH01 primers. The concentrations of the unknowns are determined
using an automated plate reader that measures the fluorescent signal of each sample
when Pico-green is added to the TH01 products and compares it to a standard curve
generated from the DNA standards.

17
These methods overcome the problems of sensitivity and dynamic range but not the
major problem associated with end-point methods namely that the product
accumulated at the plateau stage is not always correlated with the initial amount of
template.
1.7. DNA Typing Methods
DNA typing has become a vital component of human identification. It has been
widely used to solve cases involving rape and murder, paternity issues and to identify
the remains of victims of mass disasters. The array of markers and commercial typing
technologies has increased the speed and ease with which DNA typing methods can
be implemented.
1.7.1. History
DNA typing was first described in 1985 when it was discovered that DNA sequences
at certain regions were tandemely repeated and varied between individuals (Butler et
al. 2005). These regions later became known as variable number of tandem repeats
(VNTRs) and were typed using restriction fragment length polymorphism analysis.
The use of DNA typing in human identification has been widespread ever since PCR
technology and information on human markers increased speed and discrimination
capacity. At present hundreds of thousands of DNA tests are conducted by forensic
and paternity labs around the world. These labs make use of a variety of DNA typing
systems but the most commonly use autosomal short tandem repeats, Y-chromosome
short tandem repeats and mtDNA.
1.7.2. Autosomal Short Tandem Repeats (STRs)
Studies by Edwards et al. 1991, 1992 were the first to describe autosomal short
tandem repeats markers as being useful for human identification. Autosomal STRs are
tandemely repeated units of 2-6bp that are found on the autosomal chromosomes.
Short tandem repeats are useful for human identification because they are highly
polymorphic and sets of loci can be selected which have independent chromosomal
assortment and recombination. They can also be amplified and analysed using
multiplex PCR .These properties have prompted the development of a number of
commercial STR typing kits (Table 1-1).
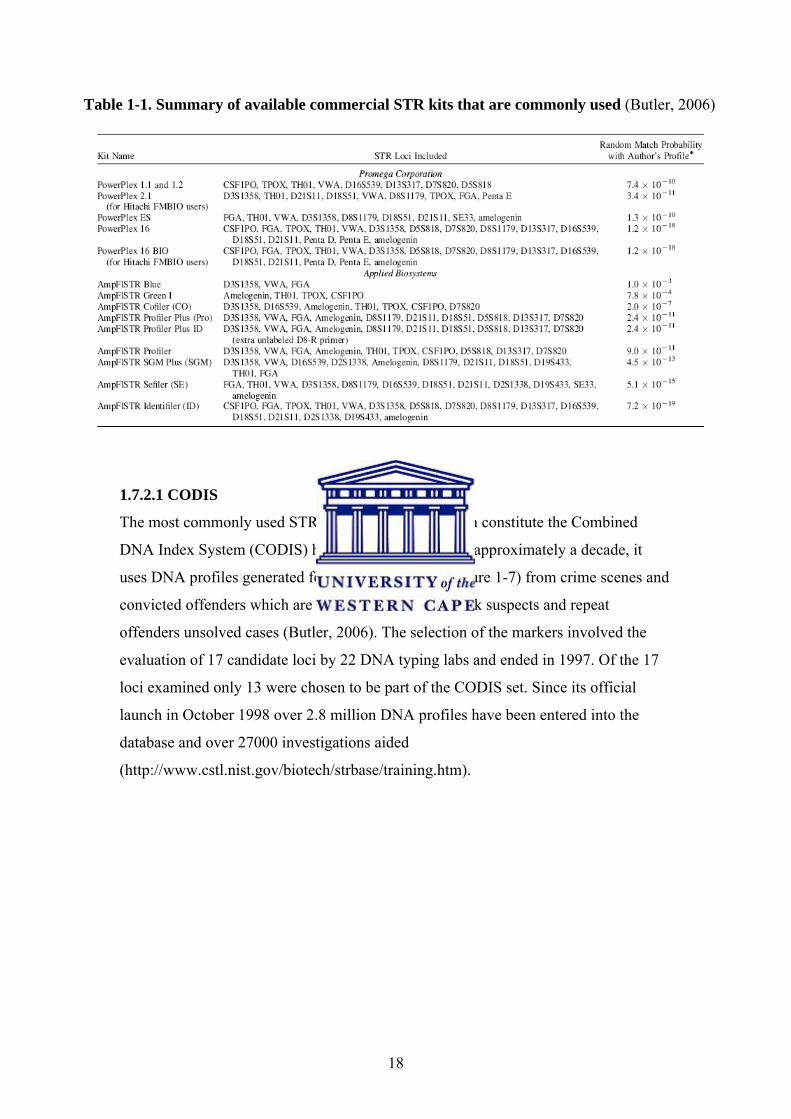
18
Table 1-1. Summary of available commercial STR kits that are commonly used (Butler, 2006)
1.7.2.1 CODIS
The most commonly used STR markers are those which constitute the Combined
DNA Index System (CODIS) has been in existence for approximately a decade, it
uses DNA profiles generated for 13 core STR loci (Figure 1-7) from crime scenes and
convicted offenders which are stored in databases to link suspects and repeat
offenders unsolved cases (Butler, 2006). The selection of the markers involved the
evaluation of 17 candidate loci by 22 DNA typing labs and ended in 1997. Of the 17
loci examined only 13 were chosen to be part of the CODIS set. Since its official
launch in October 1998 over 2.8 million DNA profiles have been entered into the
database and over 27000 investigations aided
(http://www.cstl.nist.gov/biotech/strbase/training.htm).

19
Figure1-7. CODIS Core Loci (http://www.cstl.nist.gov/biotech/strbase/training.htm)
The establishment of the CODIS loci motivated the development of commercial STR
kits that could type the 13 core loci simultaneously. Initially two Applied Biosystems
kits, Profiler Plus and COfiler were available which together covered the 13 CODIS
loci while Promega developed the PowerPlex 1.1 and 2.1 kits (Table1-1) (Butler,
2006). In 2000 Promega released their PowerPlex 16 kit that amplifies the 13 CODIS
loci, Penta D and Penta E as well as the sex determining marker amelogenin. This was
followed in 2001 by Applied Biosystems release of their 16plex Identifiler kit
amplifying the 13 CODIS loci and amelogenin but also includes D2S1338 and
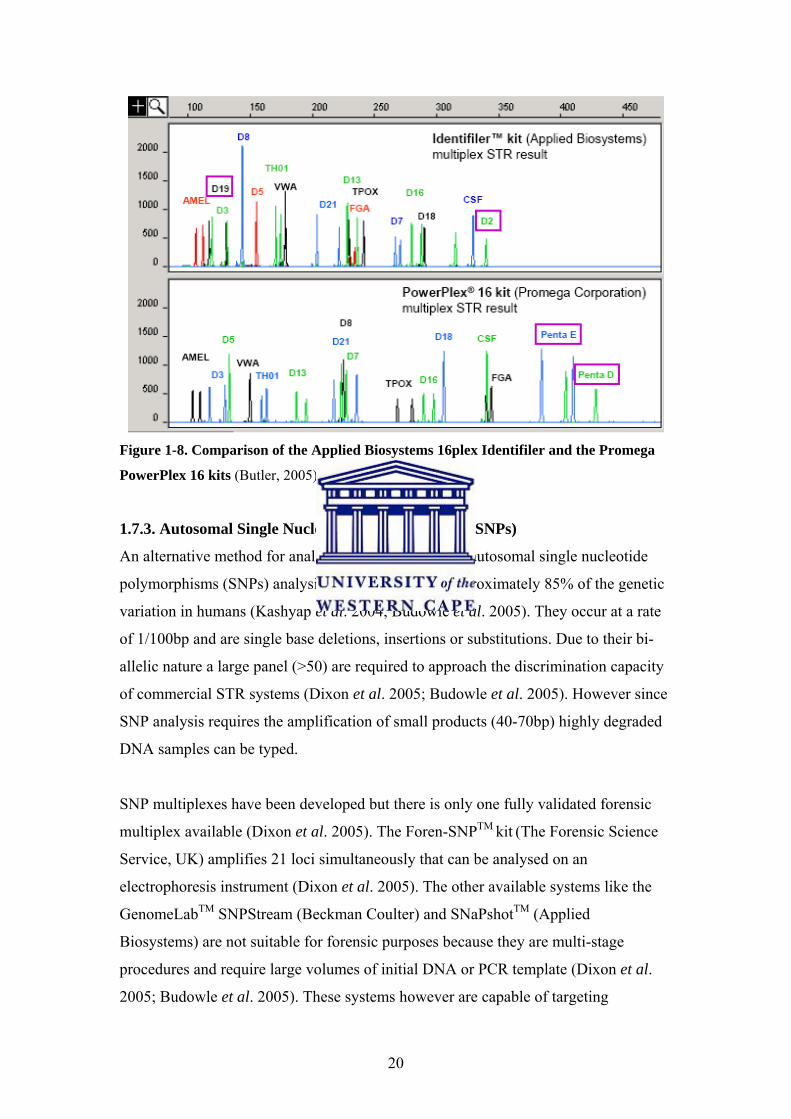
D19S433 (Figure 1-8). These kits are currently used by the majority of forensic and
paternity labs around the world.
20
Figure 1-8. Comparison of the Applied Biosystems 16plex Identifiler and the Promega
PowerPlex 16 kits (Butler, 2005).
1.7.3. Autosomal Single Nucleotide Polymorphisms (SNPs)
An alternative method for analysing degraded DNA is autosomal single nucleotide
polymorphisms (SNPs) analysis. SNPs account for approximately 85% of the genetic
variation in humans (Kashyap et al. 2004; Budowle et al. 2005). They occur at a rate
of 1/100bp and are single base deletions, insertions or substitutions. Due to their bi-
allelic nature a large panel (>50) are required to approach the discrimination capacity
of commercial STR systems (Dixon et al. 2005; Budowle et al. 2005). However since
SNP analysis requires the amplification of small products (40-70bp) highly degraded
DNA samples can be typed.
SNP multiplexes have been developed but there is only one fully validated forensic
multiplex available (Dixon et al. 2005). The Foren-SNPTM kit (The Forensic Science
Service, UK) amplifies 21 loci simultaneously that can be analysed on an
electrophoresis instrument (Dixon et al. 2005). The other available systems like the
GenomeLabTM SNPStream (Beckman Coulter) and SNaPshotTM (Applied
Biosystems) are not suitable for forensic purposes because they are multi-stage
procedures and require large volumes of initial DNA or PCR template (Dixon et al.
2005; Budowle et al. 2005). These systems however are capable of targeting
21
thousands of SNPs and with optimisation and a few modifications in the future could
play an important role in the identification of human skeletal remains (Dixon et al.
2005).
1.7.4. Y-STRs
Y-chromosome short tandem repeats (Y-STRs) are useful for human identification
testing (Butler, 2006). Y-STRs are paternally inherited and do not undergo
recombination. Therefore all paternal relatives, barring a mutation will share the same
haplotype. There are certain disadvantages and advantages associated with this. The
primary disadvantage is that paternal relatives cannot be distinguished from one
another. The advantages of Y-STRs can be seen in their application in sexual assault
cases, paternity testing, missing person’s investigations, human migrations and
evolutionary studies as well as historical and genealogical research (Butler, 2005). In
sexual assault cases the time consuming process of differential extraction, which
separates sperm from epithelial cells is required in order to use autosomal STRs. This
can be avoided by using Y-STRs which target only the male fraction. In paternity
testing it can be useful when the mother is unavailable as the male child will share an
identical Y-STR profile with his father. This inheritance pattern is also useful in
missing persons investigations as it allows any paternal male relative to be used as a
reference sample. Due to the lack of Y-chromosome recombination, in human Y-
STRs can be used to compare males separated by long time periods and in historical
and genealogical research can make links where historical records are limited.
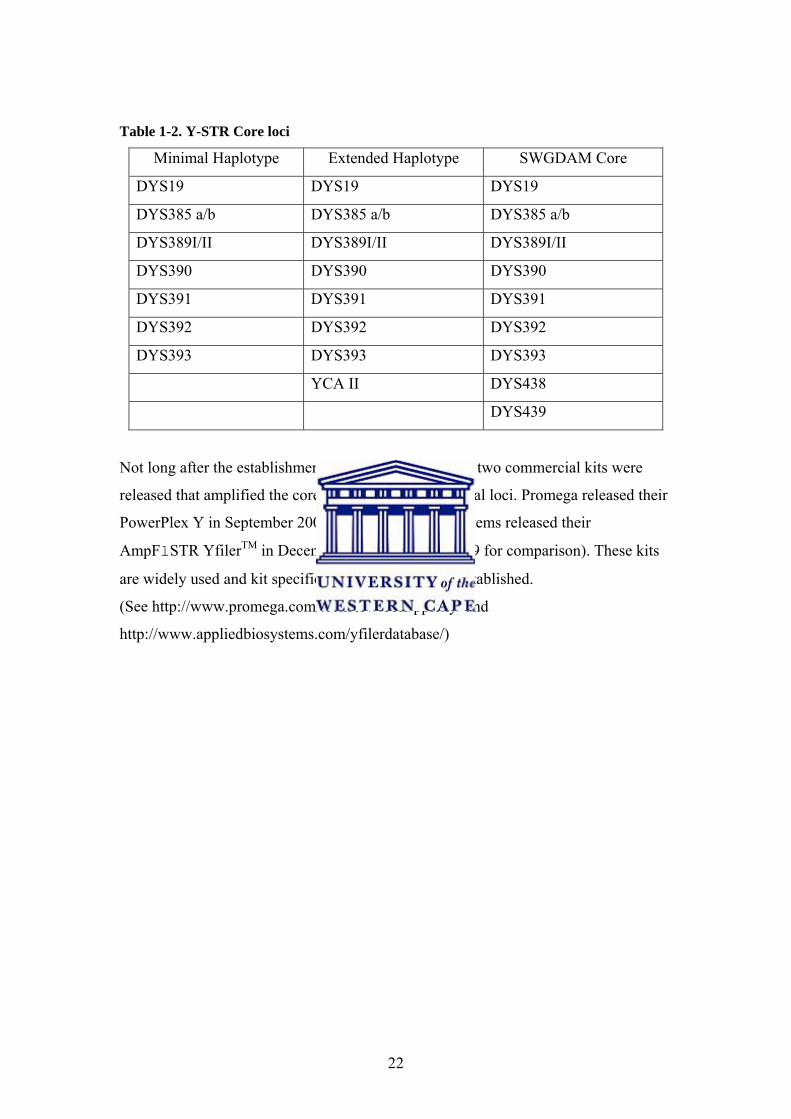
The core set of Y-STRs has changed over the years but this has not stopped the
establishment of a large database. The original core set referred to as the minimal
haplotype loci (MHL) were chosen in the 1990s when only a few Y-STRs were
characterised and consisted of seven loci (Table 1-2) (Butler, 2006). The MHL were
then extended by the addition of the duplicated dinucleotide repeat locus YCA II and
referred to as the extended haplotype. In 2003 the Scientific Working Group on DNA
Analysis Methods (SWGDAM) recommended that DYS438 and DYS439 form part
of a new extended haplotype and that YCA II be removed. These changes have not
hindered the Y-Chromosome Haplotype Reference Database (YHRD)
(http://www.yhrd.org), which as of 28 December 2006 contained 46831 haplotypes of
which 17935 have been typed with the SWGDAM core.
22
Table 1-2. Y-STR Core loci
Minimal Haplotype Extended Haplotype SWGDAM Core
DYS19 DYS19 DYS19
DYS385 a/b DYS385 a/b DYS385 a/b
DYS389I/II DYS389I/II DYS389I/II
DYS390 DYS390 DYS390
DYS391 DYS391 DYS391
DYS392 DYS392 DYS392
DYS393 DYS393 DYS393
YCA II DYS438
DYS439
Not long after the establishment of the SWGDAM core two commercial kits were
released that amplified the core loci plus a few additional loci. Promega released their
PowerPlex Y in September 2003 while Applied Biosystems released their
AmpFlSTR YfilerTM in December 2004 (see Figure 1-9 for comparison). These kits
are widely used and kit specific databases have been established.
(See http://www.promega.com/techserv/tools/pplexy/ and
http://www.appliedbiosystems.com/yfilerdatabase/)
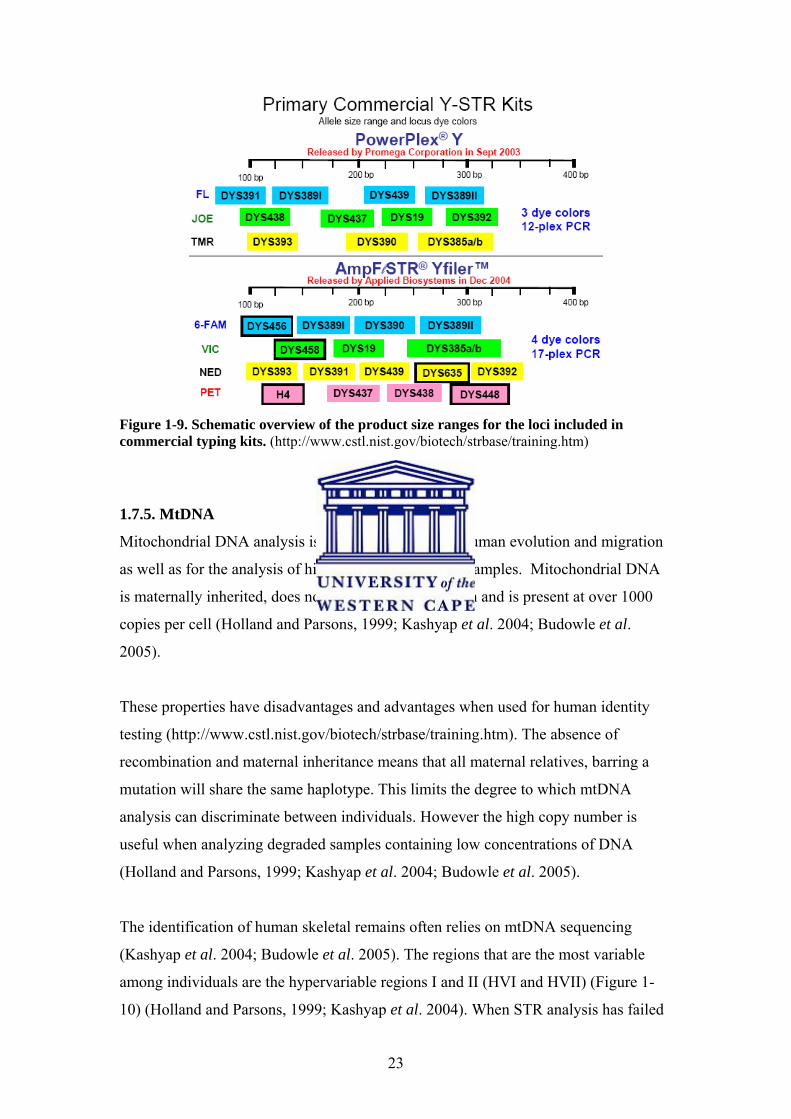
23
Figure 1-9. Schematic overview of the product size ranges for the loci included in commercial typing kits. (http://www.cstl.nist.gov/biotech/strbase/training.htm)
1.7.5. MtDNA
Mitochondrial DNA analysis is useful in the study of human evolution and migration
as well as for the analysis of highly degraded forensic samples. Mitochondrial DNA
is maternally inherited, does not undergo recombination and is present at over 1000
copies per cell (Holland and Parsons, 1999; Kashyap et al. 2004; Budowle et al.
2005).
These properties have disadvantages and advantages when used for human identity
testing (http://www.cstl.nist.gov/biotech/strbase/training.htm). The absence of
recombination and maternal inheritance means that all maternal relatives, barring a
mutation will share the same haplotype. This limits the degree to which mtDNA
analysis can discriminate between individuals. However the high copy number is
useful when analyzing degraded samples containing low concentrations of DNA
(Holland and Parsons, 1999; Kashyap et al. 2004; Budowle et al. 2005).
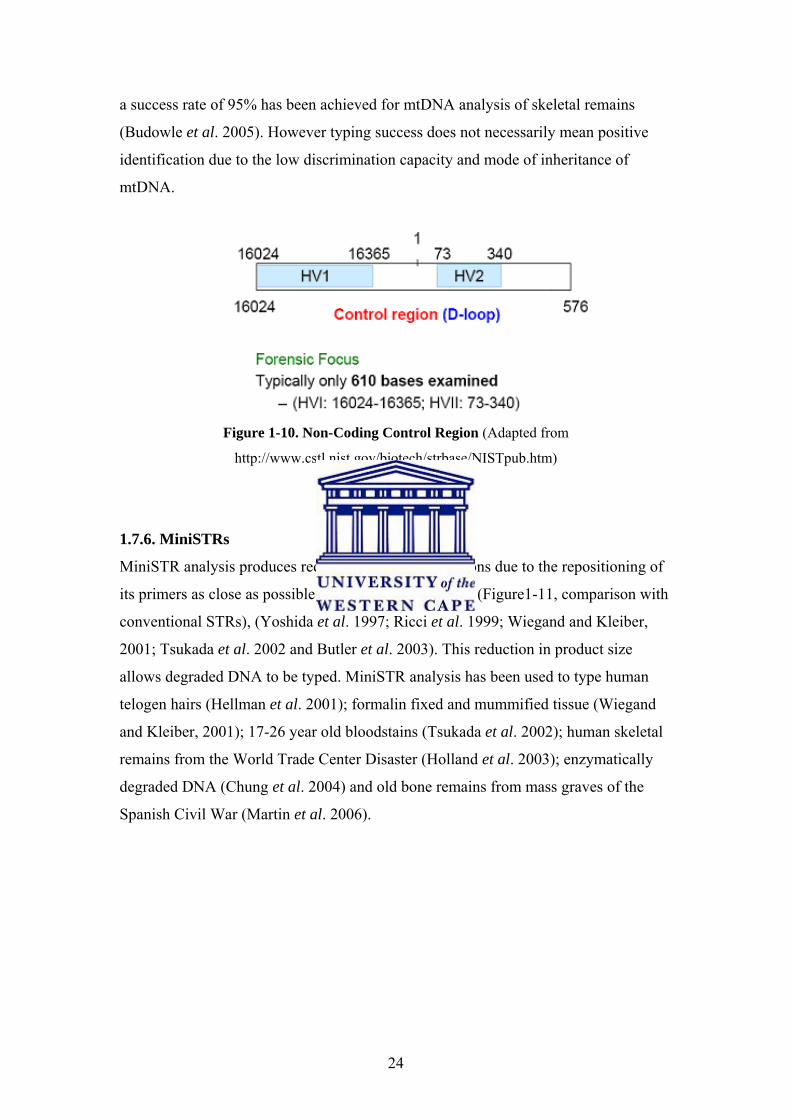
The identification of human skeletal remains often relies on mtDNA sequencing
(Kashyap et al. 2004; Budowle et al. 2005). The regions that are the most variable
among individuals are the hypervariable regions I and II (HVI and HVII) (Figure 1-
10) (Holland and Parsons, 1999; Kashyap et al. 2004). When STR analysis has failed
24
a success rate of 95% has been achieved for mtDNA analysis of skeletal remains
(Budowle et al. 2005). However typing success does not necessarily mean positive
identification due to the low discrimination capacity and mode of inheritance of
mtDNA.
Figure 1-10. Non-Coding Control Region (Adapted from
http://www.cstl.nist.gov/biotech/strbase/NISTpub.htm)
1.7.6. MiniSTRs
MiniSTR analysis produces reduced sized STR amplicons due to the repositioning of
its primers as close as possible to the STR target region (Figure1-11, comparison with
conventional STRs), (Yoshida et al. 1997; Ricci et al. 1999; Wiegand and Kleiber,
2001; Tsukada et al. 2002 and Butler et al. 2003). This reduction in product size
allows degraded DNA to be typed. MiniSTR analysis has been used to type human
telogen hairs (Hellman et al. 2001); formalin fixed and mummified tissue (Wiegand
and Kleiber, 2001); 17-26 year old bloodstains (Tsukada et al. 2002); human skeletal
remains from the World Trade Center Disaster (Holland et al. 2003); enzymatically
degraded DNA (Chung et al. 2004) and old bone remains from mass graves of the
Spanish Civil War (Martin et al. 2006).
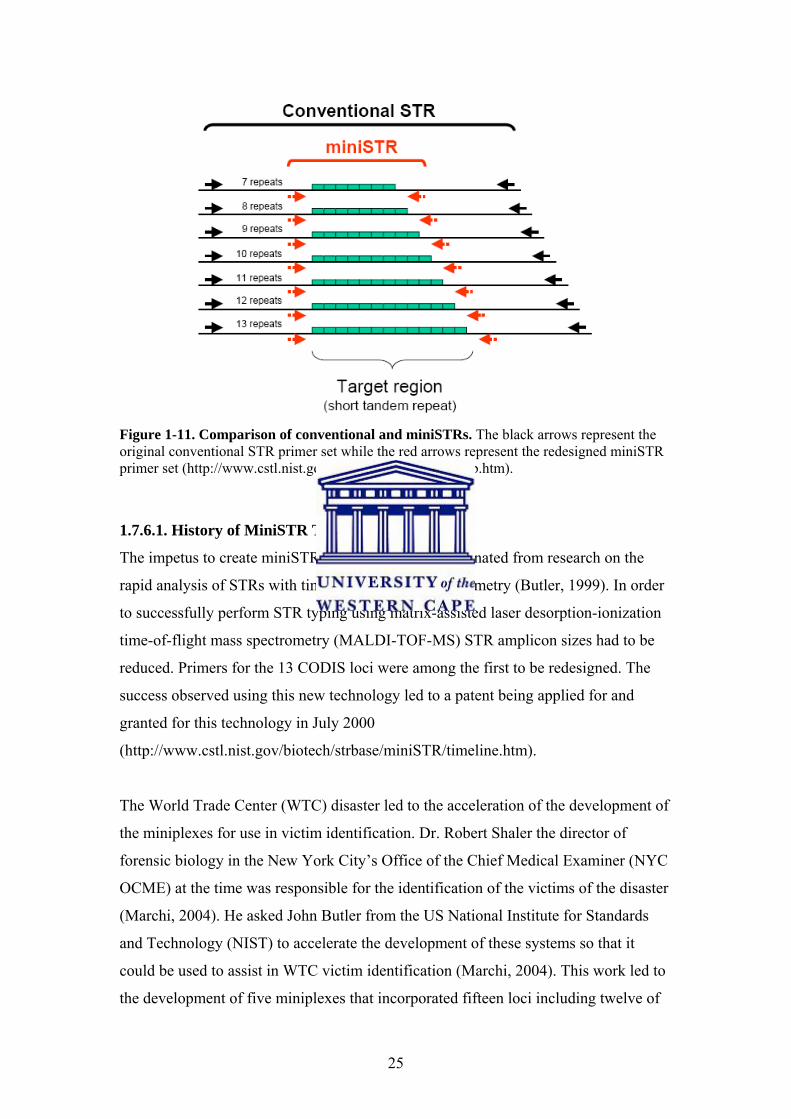
25
Figure 1-11. Comparison of conventional and miniSTRs. The black arrows represent the original conventional STR primer set while the red arrows represent the redesigned miniSTR primer set (http://www.cstl.nist.gov/biotech/strbase/NISTpub.htm).
1.7.6.1. History of MiniSTR Typing Systems
The impetus to create miniSTR multiplex systems originated from research on the
rapid analysis of STRs with time-of-flight mass spectrometry (Butler, 1999). In order
to successfully perform STR typing using matrix-assisted laser desorption-ionization
time-of-flight mass spectrometry (MALDI-TOF-MS) STR amplicon sizes had to be
reduced. Primers for the 13 CODIS loci were among the first to be redesigned. The
success observed using this new technology led to a patent being applied for and
granted for this technology in July 2000
(http://www.cstl.nist.gov/biotech/strbase/miniSTR/timeline.htm).
The World Trade Center (WTC) disaster led to the acceleration of the development of
the miniplexes for use in victim identification. Dr. Robert Shaler the director of
forensic biology in the New York City’s Office of the Chief Medical Examiner (NYC
OCME) at the time was responsible for the identification of the victims of the disaster
(Marchi, 2004). He asked John Butler from the US National Institute for Standards
and Technology (NIST) to accelerate the development of these systems so that it
could be used to assist in WTC victim identification (Marchi, 2004). This work led to
the development of five miniplexes that incorporated fifteen loci including twelve of
26
the CODIS 13 (Table 1-3)
(http://www.cstl.nist.gov/biotech/strbase/miniSTR/timeline.htm). Following these
developments Robert Shaler asked the Bode Technology Group who were already
involved in the WTC victim identification to build on these efforts (Marchi, 2004).
The Bode Technology Group developed two miniplexes, BodePlex 1 and BodePlex 2
(Holland et al. 2003). The use of these systems more than tripled the success rate of
results when compared to commercial systems (Holland et al. 2003).
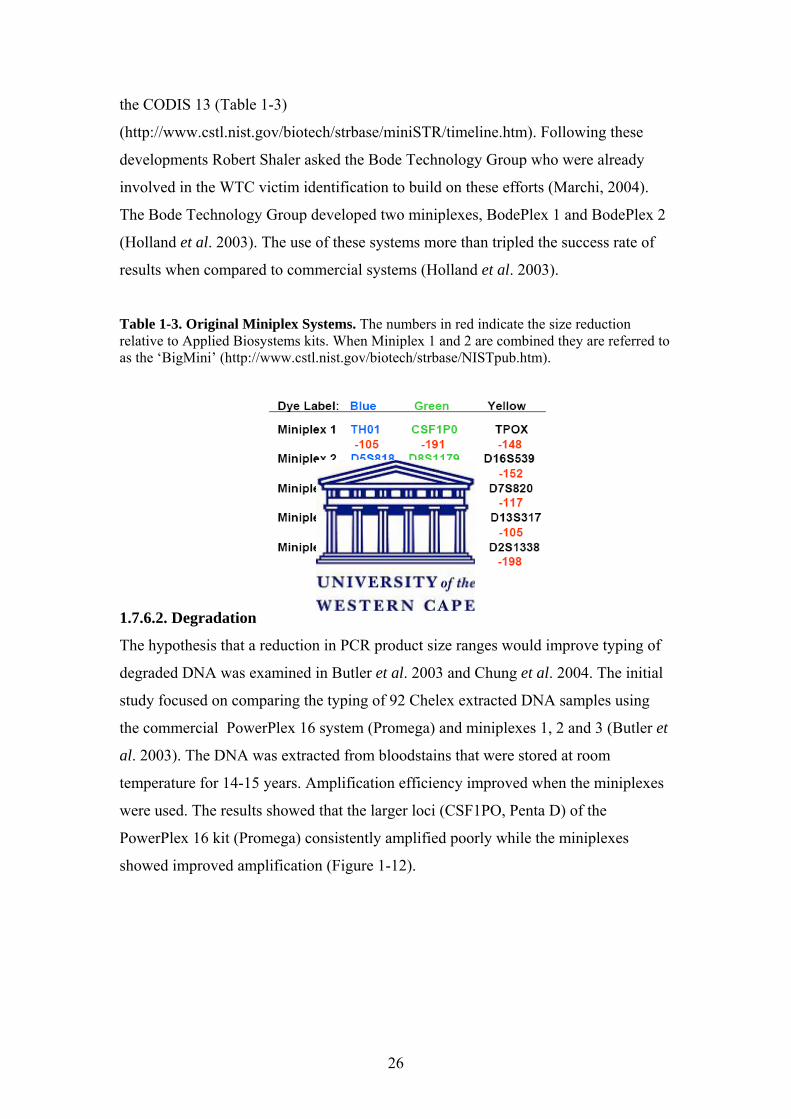
Table 1-3. Original Miniplex Systems. The numbers in red indicate the size reduction relative to Applied Biosystems kits. When Miniplex 1 and 2 are combined they are referred to as the ‘BigMini’ (http://www.cstl.nist.gov/biotech/strbase/NISTpub.htm).
1.7.6.2. Degradation
The hypothesis that a reduction in PCR product size ranges would improve typing of
degraded DNA was examined in Butler et al. 2003 and Chung et al. 2004. The initial
study focused on comparing the typing of 92 Chelex extracted DNA samples using
the commercial PowerPlex 16 system (Promega) and miniplexes 1, 2 and 3 (Butler et
al. 2003). The DNA was extracted from bloodstains that were stored at room
temperature for 14-15 years. Amplification efficiency improved when the miniplexes
were used. The results showed that the larger loci (CSF1PO, Penta D) of the
PowerPlex 16 kit (Promega) consistently amplified poorly while the miniplexes
showed improved amplification (Figure 1-12).
27
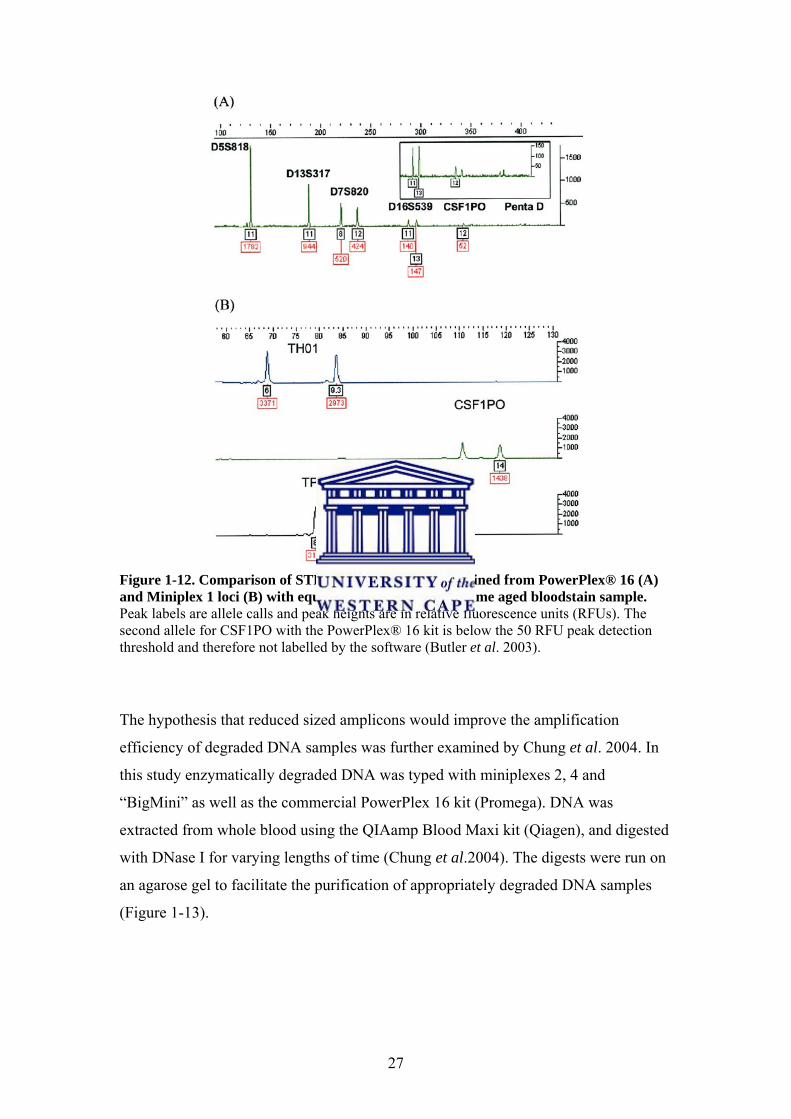
Figure 1-12. Comparison of STR allele peak heights obtained from PowerPlex® 16 (A) and Miniplex 1 loci (B) with equivalent amounts of the same aged bloodstain sample. Peak labels are allele calls and peak heights are in relative fluorescence units (RFUs). The second allele for CSF1PO with the PowerPlex® 16 kit is below the 50 RFU peak detection threshold and therefore not labelled by the software (Butler et al. 2003). The hypothesis that reduced sized amplicons would improve the amplification
efficiency of degraded DNA samples was further examined by Chung et al. 2004. In
this study enzymatically degraded DNA was typed with miniplexes 2, 4 and
“BigMini” as well as the commercial PowerPlex 16 kit (Promega). DNA was
extracted from whole blood using the QIAamp Blood Maxi kit (Qiagen), and digested
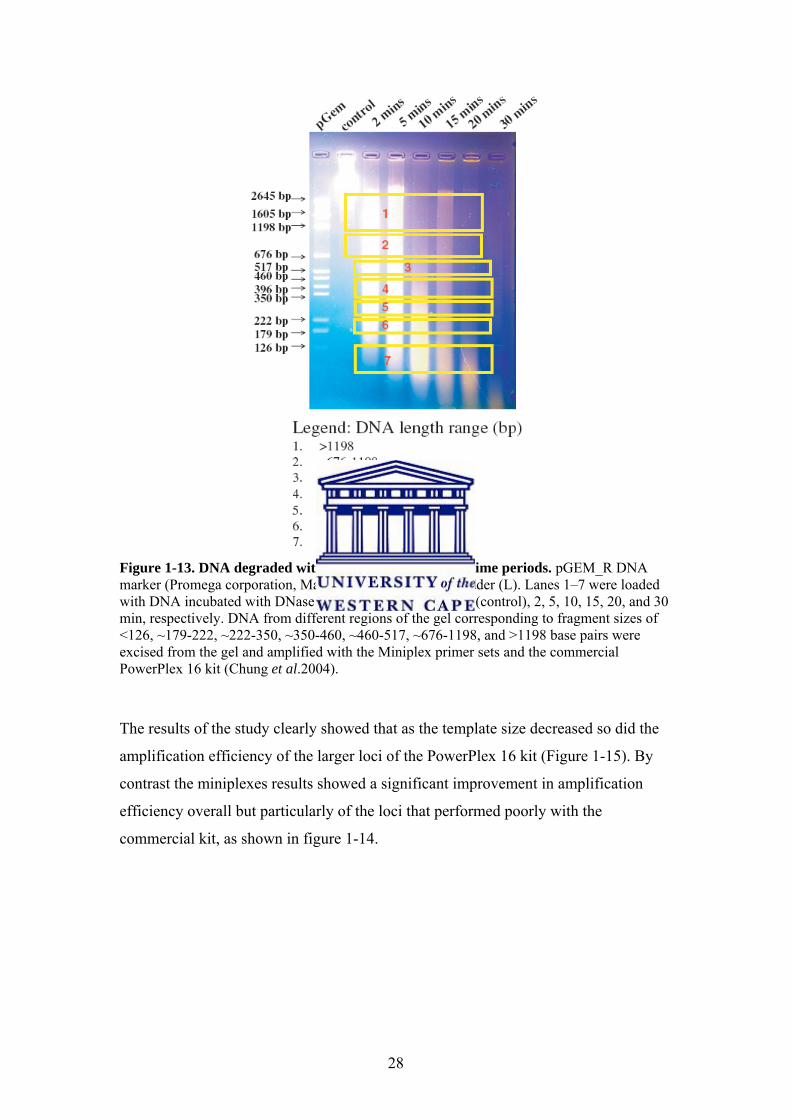
with DNase I for varying lengths of time (Chung et al.2004). The digests were run on
an agarose gel to facilitate the purification of appropriately degraded DNA samples
(Figure 1-13).
28
Figure 1-13. DNA degraded with DNase I over different time periods. pGEM_R DNA marker (Promega corporation, Madison, WI) was used as ladder (L). Lanes 1–7 were loaded with DNA incubated with DNase for several time periods: 0 (control), 2, 5, 10, 15, 20, and 30 min, respectively. DNA from different regions of the gel corresponding to fragment sizes of <126, ~179-222, ~222-350, ~350-460, ~460-517, ~676-1198, and >1198 base pairs were excised from the gel and amplified with the Miniplex primer sets and the commercial PowerPlex 16 kit (Chung et al.2004).
The results of the study clearly showed that as the template size decreased so did the
amplification efficiency of the larger loci of the PowerPlex 16 kit (Figure 1-15). By
contrast the miniplexes results showed a significant improvement in amplification
efficiency overall but particularly of the loci that performed poorly with the
commercial kit, as shown in figure 1-14.

29
Figure 1-14. Amplification efficiency of the “BigMini” and commercial PowerPlex 16 typing systems. TH01 and FGA loci were amplified using degraded DNA as a template. The “BigMini” clearly improved the amplification efficiency of the degraded DNA (Chung et al.2004).
1.7.6.3. Sensitivity
The study conducted by Chung et al. 2004 also investigated how DNA template
concentrations influenced miniplex amplification efficiency. This is important
because highly degraded samples usually yield low DNA concentrations. In this
study, sensitivity of Miniplex 2, 4 and the Big Mini were examined by amplifying
DNA concentrations ranging from 31-500pg in 25μL reactions (Chung et al. 2004).
The sensitivity observed was generally superior to that reported for commercial kits.
Miniplex 2 and 4 generated correct genotypes for most of the samples at
concentrations of 31pg and 63pg/25μL (Chung et al. 2004). The allele dropout rate for
Miniplex 2 for both concentrations was 8.33% while Miniplex 4 had a dropout rate of
30% for 31pg/25μL and 20% for 63pg/25μL. As for the Big Mini significant dropout
was observed at both 31pg and 63pg/25μL. Template concentrations above 100pg in
25μL reactions were found to be ideal for Miniplex 2 and 4 while concentrations
above 250pg/25μL were required for the Big Mini. The high degree of multiplexing
was given as the reason for the lower performance of the Big Mini. The overall results
show that the sensitivity of these Miniplex systems is better than commercial kits
(Chung et al. 2004).
30
1.7.6.4. Concordance
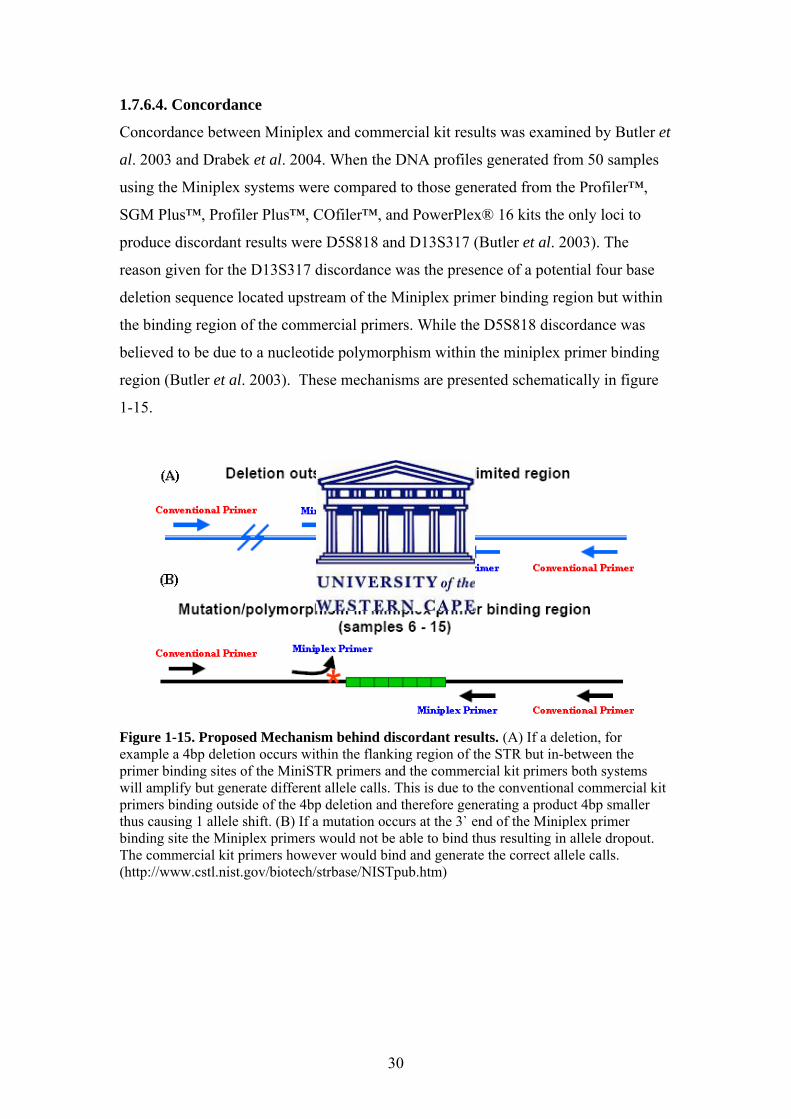
Concordance between Miniplex and commercial kit results was examined by Butler et
al. 2003 and Drabek et al. 2004. When the DNA profiles generated from 50 samples
using the Miniplex systems were compared to those generated from the Profiler™,
SGM Plus™, Profiler Plus™, COfiler™, and PowerPlex® 16 kits the only loci to
produce discordant results were D5S818 and D13S317 (Butler et al. 2003). The
reason given for the D13S317 discordance was the presence of a potential four base
deletion sequence located upstream of the Miniplex primer binding region but within
the binding region of the commercial primers. While the D5S818 discordance was
believed to be due to a nucleotide polymorphism within the miniplex primer binding
region (Butler et al. 2003). These mechanisms are presented schematically in figure
1-15.
Figure 1-15. Proposed Mechanism behind discordant results. (A) If a deletion, for example a 4bp deletion occurs within the flanking region of the STR but in-between the primer binding sites of the MiniSTR primers and the commercial kit primers both systems will amplify but generate different allele calls. This is due to the conventional commercial kit primers binding outside of the 4bp deletion and therefore generating a product 4bp smaller thus causing 1 allele shift. (B) If a mutation occurs at the 3` end of the Miniplex primer binding site the Miniplex primers would not be able to bind thus resulting in allele dropout. The commercial kit primers however would bind and generate the correct allele calls. (http://www.cstl.nist.gov/biotech/strbase/NISTpub.htm)
31
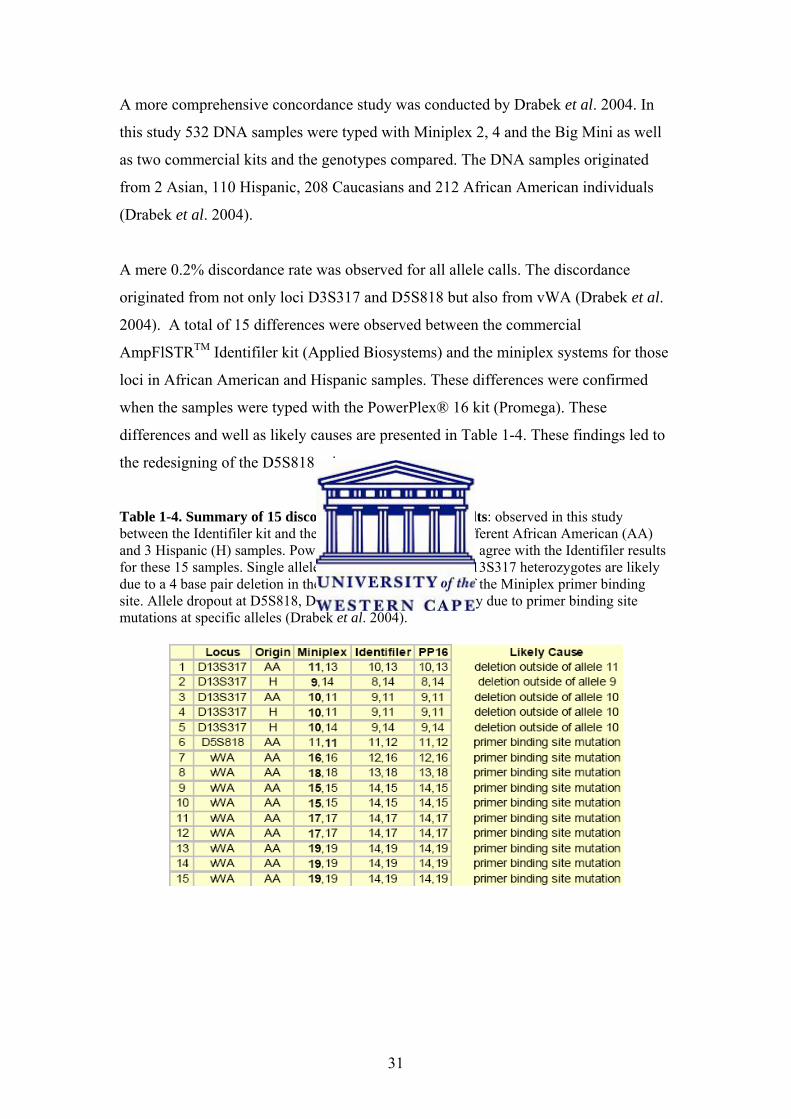
A more comprehensive concordance study was conducted by Drabek et al. 2004. In
this study 532 DNA samples were typed with Miniplex 2, 4 and the Big Mini as well
as two commercial kits and the genotypes compared. The DNA samples originated
from 2 Asian, 110 Hispanic, 208 Caucasians and 212 African American individuals
(Drabek et al. 2004).
A mere 0.2% discordance rate was observed for all allele calls. The discordance
originated from not only loci D3S317 and D5S818 but also from vWA (Drabek et al.
2004). A total of 15 differences were observed between the commercial
AmpFlSTRTM Identifiler kit (Applied Biosystems) and the miniplex systems for those
loci in African American and Hispanic samples. These differences were confirmed
when the samples were typed with the PowerPlex® 16 kit (Promega). These
differences and well as likely causes are presented in Table 1-4. These findings led to
the redesigning of the D5S818 primers.
Table 1-4. Summary of 15 discordant STR profiling results: observed in this study between the Identifiler kit and the Miniplex assays for 12 different African American (AA) and 3 Hispanic (H) samples. PowerPlex 16 (PP16) results all agree with the Identifiler results for these 15 samples. Single allele shifts of 1 repeat in the D13S317 heterozygotes are likely due to a 4 base pair deletion in the flanking region outside of the Miniplex primer binding site. Allele dropout at D5S818, D13S317, and vWA are likely due to primer binding site mutations at specific alleles (Drabek et al. 2004).
32
1.7.6.5. Analysis of DNA from Human Skeletal Remains
Studies conducted by Chung et al. 2003 and Coble and Butler, 2005 demonstrated that
Miniplex systems could be used to analyse degraded DNA from human skeletal
remains, however the first comprehensive study was conducted by Opel et al. 2006. In
this study, Miniplex 2, 4 and the “BigMini Multiplex” as well as the commercial
PowerPlex 16 kit (Promega) were used to type DNA extracted from 31 human bones
that had been exposed to diverse environmental conditions. The set of bones consisted
of 30 femurs and 1 tibia. Specimens were prepared and the DNA extracted and
quantified as described in Chung et al. 2003.
The amplification efficacy observed for the Miniplex systems was much greater than
that of the commercial kits. The PowerPlex kit (Promega) generated full DNA profiles
for only 16% of the samples while the Miniplex systems generated full DNA profiles
for 64% of the samples (Opel et al. 2006). As expected it was the larger loci of the
commercial kit that amplified poorly. While the Miniplex systems often generated full
profiles the larger loci of the Big Mini were the most likely to fail. Overall these
results confirmed the findings of Chung et al. 2003 and Coble and Butler, 2005 but
also highlighted the problem with the larger loci of the Big Mini.
1.7.6.6. Beyond the use of CODIS STR Markers
A process of characterising new miniSTRs was initiated by Coble and Butler, 2005.
The original miniSTR design plan was based on placing the primers adjacent to the
repeat region thus making the amplicon as small as possible. However the large allele
ranges and polymorphic nature of the flanking regions of some of the CODIS loci
made this challenging (Coble and Butler, 2005). This is particularly evident with
Miniplex 3, which contains loci which generate relatively large amplicons (FGA,
D21S11 and D7S820).
The study conducted by Coble and Butler, 2005 screened a large number of novel
miniSTR loci. The screening process considered characteristics of ideal miniSTR
markers. These characteristics include a small allele range, flanking regions free of
repeated elements, heterozygosity value above 0.70 and a tetranucleotide repeat unit
which limits stuttering (Coble and Butler, 2005). Out of a total of 920 loci screened 18
produced amplicons generally below 110bp. The focus of the study was on six of
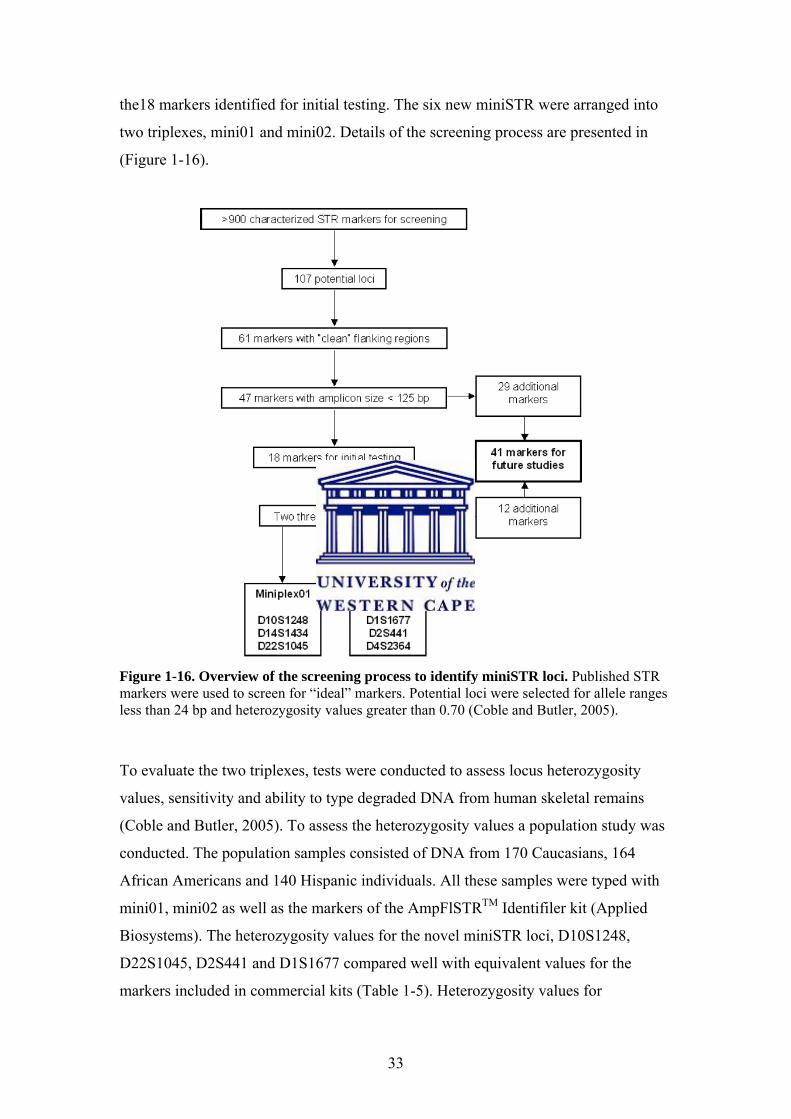
33
the18 markers identified for initial testing. The six new miniSTR were arranged into
two triplexes, mini01 and mini02. Details of the screening process are presented in
(Figure 1-16).
Figure 1-16. Overview of the screening process to identify miniSTR loci. Published STR markers were used to screen for “ideal” markers. Potential loci were selected for allele ranges less than 24 bp and heterozygosity values greater than 0.70 (Coble and Butler, 2005).
To evaluate the two triplexes, tests were conducted to assess locus heterozygosity
values, sensitivity and ability to type degraded DNA from human skeletal remains
(Coble and Butler, 2005). To assess the heterozygosity values a population study was
conducted. The population samples consisted of DNA from 170 Caucasians, 164
African Americans and 140 Hispanic individuals. All these samples were typed with
mini01, mini02 as well as the markers of the AmpFlSTRTM Identifiler kit (Applied
Biosystems). The heterozygosity values for the novel miniSTR loci, D10S1248,
D22S1045, D2S441 and D1S1677 compared well with equivalent values for the
markers included in commercial kits (Table 1-5). Heterozygosity values for
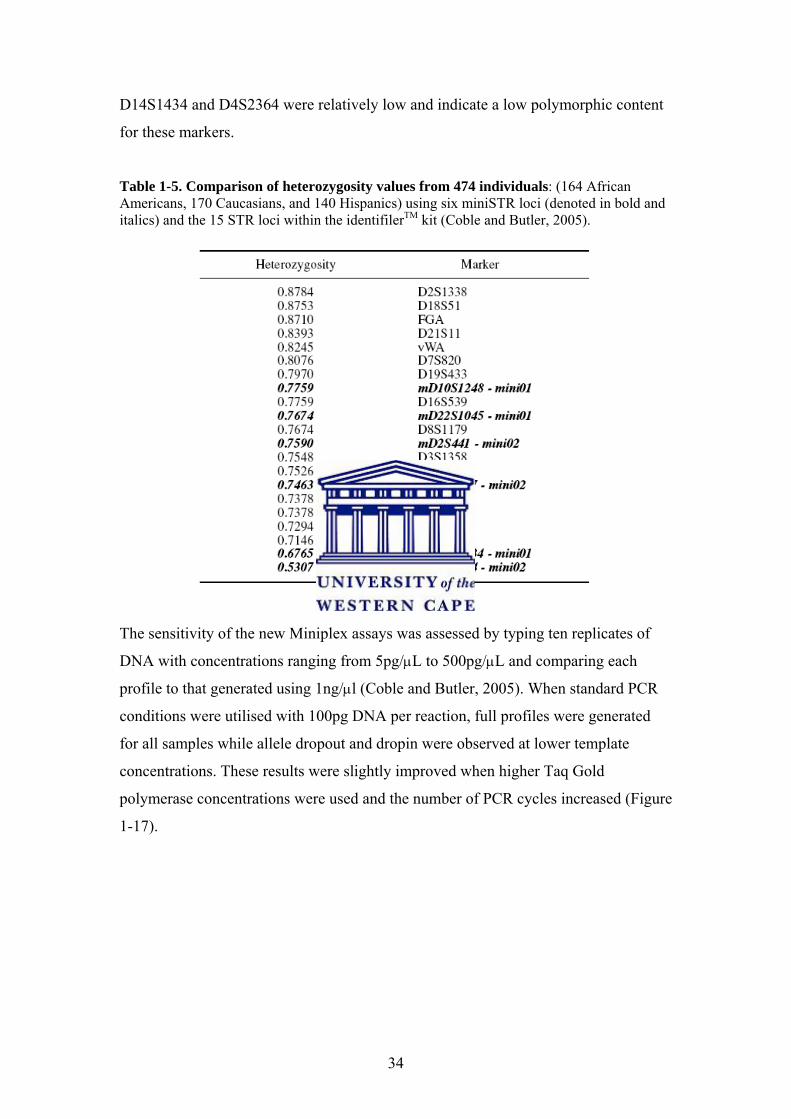
34
D14S1434 and D4S2364 were relatively low and indicate a low polymorphic content
for these markers.
Table 1-5. Comparison of heterozygosity values from 474 individuals: (164 African Americans, 170 Caucasians, and 140 Hispanics) using six miniSTR loci (denoted in bold and italics) and the 15 STR loci within the identifilerTM kit (Coble and Butler, 2005).
The sensitivity of the new Miniplex assays was assessed by typing ten replicates of
DNA with concentrations ranging from 5pg/μL to 500pg/μL and comparing each
profile to that generated using 1ng/μl (Coble and Butler, 2005). When standard PCR
conditions were utilised with 100pg DNA per reaction, full profiles were generated
for all samples while allele dropout and dropin were observed at lower template
concentrations. These results were slightly improved when higher Taq Gold
polymerase concentrations were used and the number of PCR cycles increased (Figure
1-17).

35
Figure 1-17. Sensitivity results for DNA dilutions using the D10S1248 marker. Results are from 10 replicate PCR amplifications and were analyzed on the ABI 3100. An interpretational threshold of 50 relative fluorescent units (RFUs) was used for genotyping each dilution. Each replicate was typed as being either correct (matching the genotype at 1 ng amplification), partial (one allele in a heterozygote drops below 50 RFUs), incorrect (allele drop-in that creates a wrong genotype), or failure (no peaks were observed above 50 RFUs). (A) Results with 28 cycles of PCR amplification and 1U of Taq Gold polymerase. (B) Results with 32 cycles of PCR amplification and 2U of Taq Gold polymerase. These results show an increase in the successful typing at low template levels. However, the number of partial profiles and profiles having the incorrect typing can be increased with extra samples and extra polymerase. (C) Mean Peak Height values from samples amplified at 32 cycles with 2U AmpliTaq Gold polymerase for the D10S1248 marker (Coble and Butler, 2005).
36
To assess the performance of the novel triplexes on degraded DNA, tests were
conducted on skeletal remains (Coble and Butler, 2005). DNA was extracted from 16
bone specimens in varying stages of decomposition. The extracts were typed with the
novel triplexes and the PowerPlex 16 kit (Promega). One sample failed completely
with all systems while the triplexes generated full profiles for the rest. The PowerPlex
16 kit (Promega) only produced one full profile. These results as well as the previous
studies indicated that the novel miniSTR systems especially mini01 could be a useful
addition to the current miniSTR sets.
The European DNA Profiling Group (EDNAP) and the European Network of
Forensic Science Institutes (ENFSI) recently agreed on the inclusion of the mini01
loci in a group of core loci used by European laboratories. This was partly due to a
collaborative study conducted by Dixon et al. 2005. In the study, the ability of typing
systems to profile artificially degraded DNA samples was assessed by nine European
and US labs. Each lab was supplied with a set of degraded DNA stains and DNA
profiling systems. These included a Foren-SNP kit (The Forensic Science Service),
the Miniplex systems and the preferred commercial kit of each laboratory.
The mini-STR systems out performed the SNP kit as well as the common commercial
kits. The NC01 mini-STR system gave the highest overall profile percentage and was
the most consistent across all labs (Dixon et al. 2005). The consistency showed how
robust miniSTR systems can be. While the SNP kit gave the lowest profile percentage
and varied the most between labs. The reason given for this was the complexity of the
SNP kit; it contained 65 separate primers which amplified 21 loci. These results led to
the EDNAP and the ENFSI to adopt the NC01 loci as new core European loci and
recommend that current core-loci be transformed into miniSTRs (Dixon et al. 2005;
Gill et al. 2006).
1.7.6.7. Commercial MiniSTR Kits
Applied Biosystems has developed the first commercial miniSTR kit, the
AmpFlSTR® MiniFiler™. The kit amplifies D13S317, D7S820, D2S1338, D21S11,
D16S539, D18S51, CSF1PO, and FGA as well as the sex determining marker
Amelogenin. The kit was launched in March 2007. An initial evaluation to examine
37
the AmpFlSTR® MiniFiler™ kits performance on human skeletal remains as well as
other compromised samples has been conducted by Eisenberg et al. 2006. The study
was part of a multi lab study and included a reproducibility, sensitivity and mixture
study. In the reproducibility study four DNA samples were run in triplicate with a
positive and negative control. While for the sensitivity study, positive control DNA
dilutions with a concentration range of 31.25pg to1ng in a 25μL reaction were run in
triplicate. For the mixture study two DNA samples were mixed as follows; 0:1, 15:1,
10:1, 7:1, 3:1, 1:1, 1:0 and run in triplicate.
The kit proved to be highly reproducible down to a concentration of 125pg/25μL
(Eisenberg et al. 2006). Concentrations of 62pg/25μL and 32pg/25μL showed
significant allele dropout and peak imbalance and limited data respectively. However
full profiles were generated when 125pg/25μL was used, which was twice as sensitive
as other commercial kits (Profiler Plus® ID and COfiler®) previously used in the lab.
All mixtures could be typed, with major and minor contributors presented at all loci.
The AmpFlSTR® MiniFiler™ kit produced full profiles for degraded DNA samples
from skeletal remains when commercial kits only produced partial profiles (Eisenberg
et al. 2006). The Profiler Plus® ID and COfiler® kits consistently failed to amplify
the following loci, FGA, D21S11, D18S51, D13S317, D7S820, D16S539, and
CSF1PO when used on degraded DNA from skeletal remains. These are the larger
loci of the kits and highlight the problem with using standard kits to analyse highly
degraded DNA. The AmpFlSTR® MiniFiler™ kit produced full profiles when used
on the same degraded samples. As can be seen the AmpFlSTR® MiniFiler™ kit has
incorporated all the loci that have proven to be problematic with the commercial kits.
Although the evaluation of the AmpFlSTR® MiniFiler™ kit is ongoing the overall
results of the study indicate that it will be a useful addition to the miniSTR systems
already in use to analyse degraded DNA from skeletal remains.
38
1.8. Laboratories Involved in the Identification of Human Remains
There are academic, governmental, private and non-governmental laboratories
worldwide that utilises DNA analysis to assist in the identification of human remains.
Major laboratories included the following: the Center for Human Identification (CHI);
the Armed Forces DNA Identification Laboratory (AFDIL); The Bode Technology
Group and the International Commission on Missing Persons (ICMP). The Center for
Human Identification is an academic laboratory located at the University of North
Texas Health Science Center in the USA (Eisenberg et al. 2006; Ritter, 2007). It
conducts DNA analysis on unidentified human skeletal remains, the relatives of
missing persons and investigates new technologies that could aid in skeletal remains
identification. The Armed Forces DNA Identification Laboratory is a governmental
laboratory situated in Washington, USA (http://www.afip.org). It uses DNA analysis
to identify US military personnel and civilians that have died in both recent and past
conflicts around the world. The Bode Technology Group is a commercial service
provider located in New York, USA (http://www.bodetech.com). To date it has
analysed more than 40 000 forensic casework samples using both STR and mtDNA
analysis and has assisted US labs in eliminating a backlog of 300 000 convicted
offender samples. The International Commission on Missing Persons is a non-
governmental organisation located in the former Yugoslavia (http://www.ic-mp.org).
It’s has a Forensic Science Department (FSD) that’s responsible for tracing
approximately 40 000 people that went missing as a result of conflicts in the former
Yugoslavia. The forensic DNA laboratory is located in Banja Luka, Republika
Srpska, Bosnia and Herzegovina. These activities of these laboratories are briefly
considered below.
1.8.1. Center for Human Identification
The Center for Human identification (CHI) provides free DNA testing of skeletal
remains and missing persons direct or family reference samples as well as
anthropological examinations of the skeletal remains to all law enforcement agencies
in the USA (Eisenberg et al. 2006; Ritter, 2007). The CHI is located at the University
of North Texas Health Science Center. It’s able to provide free mtDNA, STR as well
as forensic anthropological analysis to all law enforcement agencies due to significant
funding by the National Institute of Justice (NIJ). This collaboration with the NIJ has
also made it one of a few labs that has access to the FBI CODIS(mp) database, which
39
contains data on unidentified human remains and missing persons cases including
nuclear and mitochondrial data (Ritter, 2007). This means that all law enforcement
agencies in the US now have access to the database via the CHI.
The development and dissemination of DNA collection kits has led to an increase in
samples being received by the lab (Ritter, 2007). A problem identified by the director
of the CHI, Arthur Eisenberg was the lack of family reference data in the database.
Reference sample data is essential to the identification process of human skeletal
remains. Therefore the lab developed a family DNA reference sample collection kit as
well as a human remains collection and transportation kit. These kits have been made
freely available to the medico legal community as well as all law enforcement
agencies in the US and have led to the lab receiving 1200 family reference samples
and 680 unidentified human remains as of July 2006.
A major part of the funding received by the NIJ was to investigate new technologies,
which include both CODIS and non-CODIS based miniSTR systems to aid in human
skeletal remains identification (Eisenberg et al. 2006). The miniSTR systems NC01
and NC02 have both been evaluated by the lab and recently it has aided in the
development and evaluation of the first commercial miniSTR kit, the AmpFlSTR®
MiniFiler™ kit (Applied Biosystems).
The CHI will soon be implementing a high throughput system to assist with their
caseload, which is certain to increase dramatically in the coming years (Ritter, 2007).
This involves implementing a robotic system. With each robot able to analyse over
17000 samples a year.
1.8.2. Armed Forces DNA Identification Lab
Since its inception in 1991 the Armed Forces DNA Identification Lab (AFDIL) has
been regarded as a leader in the identification of human remains
(http://www.afip.org). Its mission in partnership with the Office of the Armed Forces
Medical Examiner (OAFME) and the Central Identification Laboratory, Hawaii
(CILHI) is to identify US military personnel and civilians that have died in recent and
past conflicts (Edson et al.2004). AFDIL has experience with samples which have
been exposed to various conditions including humid jungles, mountaintops and even

40
drenched in jet fuel and saltwater. This has enabled AFDIL to develop highly
effective protocols for the identification of human skeletal remains.
ADFIL consists of two sections, a Nuclear DNA (nucDNA) Section and a
Mitochondrial DNA (mtDNA) Section. The nuclear DNA section handles current US
military personnel and civilian death cases. The mtDNA sections priority is to identify
skeletal remains from the Vietnam War, Korean War, and World War II. Since large
scale mtDNA sequencing was implemented by AFDIL, it has had an 85% success rate
(http://www.afip.org).
1.8.3. The Bode Technology Group
The Bode Technology Group is probably the most respected forensic DNA analysis
laboratory worldwide. This respect has been gained by the role it has played in
identifying victims of war including the Bosnian and Vietnam wars, natural disasters
like the tsunami in Thailand and aircraft disasters but most of all for its work in the
World Trade Center (WTC) attack (http://www.bodetech.com). To date it has
analysed more than 40 000 forensic casework samples using both STR and mtDNA
analysis and has assisted US laboratories in eliminating a backlog of 300 000
convicted offender samples. It offers these services not only to agencies and
organisations in the US but worldwide.
Bode developed a high quality, high throughput system to analyse DNA from skeletal
remains from the WTC disaster (Holland et al. 2003). They recognised that
conventional methods although robust were time consuming and labour intensive and
therefore new approaches were needed to process the volume of samples from the
WTC attack. The most time consuming and labour intensive step involved the initial
sampling and cleaning of bone. A modified sampling protocol was implemented
reducing the sampling time from 20 minutes to 3-4 minutes (Holland et al. 2003). In
addition a new high throughput extraction method was also developed. A 96 well
DNA extraction procedure was implemented by modifying the standard protocol for
the QIAamp 96 DNA Blood Kit (Qiagen) (Holland et al. 2003). Overall this increased
the DNA extraction success rate and allowed for the extraction of over 1000 samples
per week.
41
The initial STR analysis of DNA samples focussed on the use of commercial kits but
later included the use of miniSTR systems, which dramatically increased the success
rate. Bode initially relied solely on the use of the Profiler Plus (Applied Biosystems),
Cofiler (Applied Biosystems) and PowerPlex 16 kits (Promega) for STR analysis
(Holland et al. 2003). For those samples that did amplify with the commercial kits it
was observed that the larger loci of the kits amplified poorly and frequently dropped
out. Therefore they developed proprietary miniSTR systems (BodePlex 1 and 2)
incorporating those loci that were observed to be problematic. The use of the
miniSTR systems tripled the amplification success rate of the problematic loci.
Overall the development of the Bode high throughput system helped the WTC victim
identification effort tremendously and together with work done by other labs 54% of
the victims were identified as of March 2004 (Marchi, 2004).
1.8.4. International Commission on Missing Persons
The International Commission on Missing Persons (ICMP) was formed in 1996 and
soon established a Forensic Science Department (FSD) to address the issue of
approximately 40 000 people missing as a result of conflicts in the former Yugoslavia
(http://www.ic-mp.org). Many of the missing were believed to be buried in mass
graves. The ICMP had to setup a human remains identification program. It consists of
three divisions: [1] the Excavations and Examination Program, which locates,
recovers and undertakes anthropological examinations on remains; [2] the
Identification Coordination Division, which collects family reference samples, does
the initial sampling and cleaning of bones in preparation for DNA extraction and
manages software as well as the storage of samples and DNA reports and [3] the DNA
Laboratories program, which extracts DNA from samples, conducts DNA analysis
and generates and reviews reports. To date it has identified 8000 of approximately
13000 bodies that have been recovered. Besides its work in the former Yugoslavia it
also helped in the South-East Asia Tsunami and helps the Iraqi government as well as
other countries that have a history of large numbers of missing persons.
42
1.9. Validation
Validation is the process used by the Forensic Science community to demonstrate that
a procedure is reproducible, reliable and robust (Butler, 2001). A validation study
should be performed by a DNA laboratory or the scientific community before
methods are put to routine use. It indicates whether the method is suitable for the
intended purpose and identifies the limitations of the method and the aspects that are
critical to its reliability. There are two kinds of validation, developmental and internal
validation.
1.9.1. Developmental Validation
Developmental validation demonstrates that a novel method is suitable for its intended
purpose by determining its conditions of reliability and its limitations. It’s conducted
by various groups including manufacturers, government laboratories, technical
organizations and academic institutions (Butler, 2001).
The Scientific Working Group on DNA Analysis Methods (SWGDAM) has
recommended a set of developmental validation guidelines which are presented in
appendix I.
1.9.2. Internal Validation
An internal validation is the in-house demonstration of the limitations and the
conditions of reliability of an established procedure (one that has undergone
developmental validation) (Butler, 2001). It should be conducted by forensic DNA
laboratories before the procedure is applied to casework.
SWGDAM suggests the following studies be conducted as part of an internal
validation and comprise a minimum of 50 sample runs.
1. Known and non-probative evidence samples: The method must be evaluated and
tested using known samples and, when possible, authentic case samples; otherwise,
simulated case samples should be used. DNA profiles obtained from questioned items
should be compared to those from reference samples. When previous typing results
are available, consistency as to the inclusion or exclusion of suspects or victims
within the limits of the respective assays should be assessed.
43
2. Reproducibility and precision: The laboratory must document the reproducibility
and precision of the procedure using an appropriate control(s).
3. Match criteria: For procedures that entail separation of DNA molecules based on
size, precision of sizing must be determined by repetitive analyses of appropriate
samples to establish criteria for matching or allele designation.
4. Sensitivity and stochastic studies: The laboratory must conduct studies that ensure
the reliability and integrity of results. For PCR-based assays, studies must address
stochastic effects and sensitivity levels.
5. Mixture studies: When appropriate, forensic casework laboratories must define and
mimic the range of detectable mixture ratios, including detection of major and minor
components. Studies should be conducted using samples that mimic those typically
encountered in casework.
6. Contamination: The laboratory must demonstrate that its procedures minimize
contamination that would compromise the integrity of the results. A laboratory should
employ appropriate controls and implement quality practices to assess contamination
and demonstrate that its procedure minimizes contamination.
7. Qualifying test: The method must be tested using a qualifying test. This may be
accomplished through the use of proficiency test samples or types of samples that
mimic those that the laboratory routinely analyzes. This qualifying test may be
administered internally, externally, or collaboratively.
44
1.10. Investigation, Recovery and Analysis of Human Skeletal Remains in the
Context of the Political Violence in South Africa
The Truth and Reconciliation Commission (TRC) was created in 1995 to uncover
details about human rights violations committed during the period March 1960-May
1995 in South Africa
(http://www.brandonhamber.com/publications/pap_khulumani.doc).
The TRC provided a forum where the testimony of survivors and perpetrators could
be heard. Perpetrators who provided a full account of their actions were granted
amnesty while the victims and families received reparations. By the end of the
commission over 20 000 victims had made submissions and over 7000 perpetrators
applied for amnesty.
The issue of missing persons was consistently encountered by the commission. It was
realized that to fully investigate disappearances related to human rights abuses an
investigation unit that comprised of experts in human rights investigations and an
array of forensic fields was required. Therefore it turned to the National Prosecuting
Authority (NPA). A team was formed within the NPA which had access to state
archives including police and military as well as other required resources. The team
was referred to as the South African Missing Persons Task Team (SAMPTT).
The SAMPTT formed a strong partnership with the Argentine Forensic Anthropology
Team (Equipo Argentino de Antropología Forense, EAAF). The EAAF were among
the first to apply forensic anthropology and archaeology to human rights violations
investigations (http://eaaf.typepad.com/). The EAAF has always been committed to
training and building capacity in the countries in which it operates.
In 2005, the newly established Forensic DNA Laboratory of the University of the
Western Cape was invited to attend one of the EAAF run training programs. The
objective of the training program was to introduce South African professionals and
students to the EAAF forensic investigation methods. The training consisted of
lectures on the preliminary investigation, crime scene investigation and laboratory
methods and analysis required for human rights violations investigations.
45
It was during this training program that the Forensic DNA Laboratory of the
University of the Western Cape formed a relationship with both the SAMPTT as well
as the EAAF.
1.11. Objectives of this Study
The objective of the study was to conduct an internal validation on miniSTR systems
and apply it to cases received from the SAMPTT. This was prompted by the fact that
miniSTR systems have been shown to out perform commercial kits and provide an
alternative to mtDNA when analysing degraded DNA from skeletal remains and that
the DNA extracted from skeletal remains received from the SAMPTT would be
degraded due to the remains generally being fragmented or charred and buried for at
least 20 years.
46
Chapter 2: Validation Studies 2.1. Introduction
The recent demonstration of miniSTR systems as an effective tool for the analysis of
degraded DNA prompted the Forensic DNA Laboratory at the University of the
Western Cape (UWC) to conduct internal validation studies on miniSTR systems. At
the time the Laboratory was conducting mtDNA analysis on skeletal remains received
from the Missing Persons Unit of South Africa. The skeletal remains were of
individuals thought to have been victims of South Africa’s past political violence. The
use of miniSTR systems in addition to mtDNA analysis would allow for more
information to be gathered in each case. Internal validation studies were conducted to
evaluate the performance of the miniSTR systems. As discussed in chapter 1, the
original miniSTR systems consist of five multiplex reactions each amplifying three
STR loci. The loci included in each multiplex are as follows. Miniplex 1: TH01,
CSF1PO, TPOX, Miniplex 2: D5S818, D8S1179, D16S539, Miniplex 3: FGA,
D21S11, D7S820, Miniplex 4: vWA, D18S51, D13S317 and Miniplex 5: Penta D,
Penta E, D2S1338. Of these fifteen loci, twelve form part of the Combined DNA
Index System (CODIS) loci set. Uniplex amplification of D3S1358 was required to
obtain a full 13 locus CODIS genotype.
2.2. Materials and Methods
2.2.1. DNA Extraction
One whole blood control sample was extracted following the QIAamp Blood Mini Kit
protocol (Qiagen) according to the manufactures instructions (Appendix I).
Blood stained materials were extracted following the Chelex protocol described in the
Applied Biosystems Profiler Plus User Manual (Appendix I).
2.2.2. DNA Quantification
DNA samples were quantified using a Nanodrop ND 1000 UV-Vis
Spectrophotometer.
2.2.3. PCR Amplification
Amplifications were performed in a final reaction volume of 10μL. Unless otherwise
specified the reactions contained 250pg genomic DNA, 1X Supertherm PCR buffer
47
with 15mM MgCl2, 200µM dNTPs, 0.8 U of Supertherm GoldTaq, and Miniplex
primers (Miniplex 1: 0.075µM TH01, 0.3µM CSF1PO, 0.2µM TPOX, Miniplex 2:
0.3µM D5S818, 0.5µM D8S1179, 0.1µM D16S539, Miniplex 3: 0.3µM FGA, 0.5µM
D21S11, 0.5µM D7S820 and Miniplex 4: 0.2µM vWA, 0.4µM D18S51, 0.5µM
D13S317). Primers were synthesized by Applied Biosystems using previously
reported sequences (Butler et al. 2003). The standard operating procedure for
preparing the primer mixtures can be found in Appendix I.
PCR amplification was performed using a GeneAmp PCR System 2700 thermal
cycler (Applied Biosystems). Thermal cycling conditions were:
1 cycle at 95oC for 10 minutes, 33 cycles at 94oC for 1 minute, 55oC for 1 minute, and
72oC for 1 minute, followed by a final cycle at 60 oC for 45 minutes. Allelic ladders
were prepared by re-amplifying diluted commercial kit ladders with Miniplex primers
as described previously (Butler et al. 2003).
Modifications to the general protocol are indicated where relevant in the results and
discussion section.
2.2.4. Detection and Data Analysis
Amplicons were analysed using an ABI PRISM 377 DNA Sequencer. Samples were
prepared for electrophoresis by adding 1µL loading mix (5µL HiDi formamide,
1.5µLGenescan ROX 500 size standard, 1.5µL Dextran blue loading dye Applied
Biosystems) to1µL PCR product. Following denaturation of the samples at 95 oC for 5
to 9 minutes in a GeneAmp PCR System 9600 thermal cycler (Applied Biosystems),
the samples were snap-cooled on ice for 2 minutes before loading 1µL of each sample
on a 5% Long Ranger gel (BioWhittaker Molecular Applications) (Detailed protocols
are included in Appendix I).
Electrophoresis was conducted and the data analysed according to manufacturer’s
instructions. The gel was run with filter set D for 2 ½ hours at 2400 scans per hour
and the data collected with ABI 377 collection software and analyzed with GeneScan
3.0.0 software (Applied Biosystems). Allele sizes and allele designations were
subsequently assigned using Genotyper 3.7 software (Applied Biosystems).
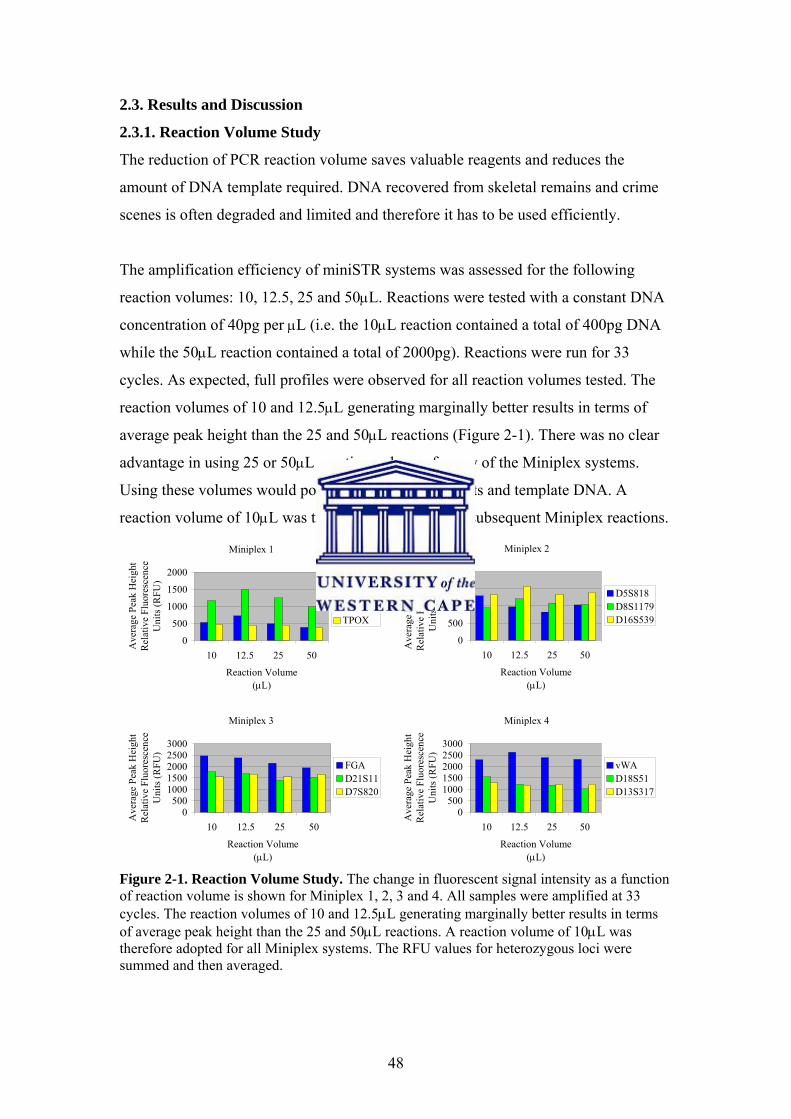
48
2.3. Results and Discussion
2.3.1. Reaction Volume Study
The reduction of PCR reaction volume saves valuable reagents and reduces the
amount of DNA template required. DNA recovered from skeletal remains and crime
scenes is often degraded and limited and therefore it has to be used efficiently.
The amplification efficiency of miniSTR systems was assessed for the following
reaction volumes: 10, 12.5, 25 and 50μL. Reactions were tested with a constant DNA
concentration of 40pg per μL (i.e. the 10μL reaction contained a total of 400pg DNA
while the 50μL reaction contained a total of 2000pg). Reactions were run for 33
cycles. As expected, full profiles were observed for all reaction volumes tested. The
reaction volumes of 10 and 12.5μL generating marginally better results in terms of
average peak height than the 25 and 50μL reactions (Figure 2-1). There was no clear
advantage in using 25 or 50μL reaction volumes for any of the Miniplex systems.
Using these volumes would potentially waste of reagents and template DNA. A
reaction volume of 10μL was therefore adopted for all subsequent Miniplex reactions.
Miniplex 1
0
500
1000
1500
2000
10 12.5 25 50
Reaction Volume(μL)
Ave
rage
Pea
k H
eigh
t R
elat
ive
Fluo
resc
ence
U
nits
(RFU
)
TH01CFS1POTPOX
Miniplex 2
0
500
1000
1500
2000
10 12.5 25 50
Reaction Volume(μL)
Ave
rage
Pea
k H
eigh
t R
elat
ive
Fluo
resc
ence
U
nits
(RFU
)
D5S818D8S1179D16S539
Miniplex 3
0500
10001500200025003000
10 12.5 25 50
Reaction Volume(μL)
Ave
rage
Pea
k H
eigh
t R
elat
ive
Fluo
resc
ence
U
nits
(RFU
)
FGAD21S11D7S820
Miniplex 4
0500
10001500200025003000
10 12.5 25 50
Reaction Volume(μL)
Ave
rage
Pea
k H
eigh
t R
elat
ive
Fluo
resc
ence
U
nits
(RFU
)
vWAD18S51D13S317
Figure 2-1. Reaction Volume Study. The change in fluorescent signal intensity as a function of reaction volume is shown for Miniplex 1, 2, 3 and 4. All samples were amplified at 33 cycles. The reaction volumes of 10 and 12.5μL generating marginally better results in terms of average peak height than the 25 and 50μL reactions. A reaction volume of 10μL was therefore adopted for all Miniplex systems. The RFU values for heterozygous loci were summed and then averaged.
49
2.3.2. Sensitivity Studies
Since the DNA recovered from degraded samples is often at a low concentration a
typing system designed to amplify degraded DNA needs to have a high sensitivity.
To assess the sensitivity of the miniSTR systems, varying amounts of control DNA
were added to 10μL Miniplex reactions for 33 cycles. The amounts of template DNA
added were 10pg, 50pg, 100pg, 250pg, 500pg and 1000pg. At concentrations of
250pg and above full profiles were generated for all miniSTR systems (Figure 2-2).
While at 100pg, allele dropout was evident for the TH01 and TPOX loci of Miniplex
1 and D8S1179 for Miniplex 2, however Miniplex 3 and 4 generated full profiles. At
50pg only Miniplex 3 generated a full profile while allele dropout was observed for
Miniplex 1, 2 and 4. At 10pg complete allele dropout was observed for all miniSTR
systems except one allele of vWA from Miniplex 3.
Overall these results indicate that of the concentrations tested at least 250pg/10μL is
required in order to avoid allele dropout and to generate good quality profiles for all
miniSTR systems at 33 cycles. However in situations where highly degraded DNA
has to be analysed this might not be ideal. The DNA concentrations of highly
degraded samples are often low and therefore it might be impossible to add a total of
250pg to each miniSTR system amplification reaction.
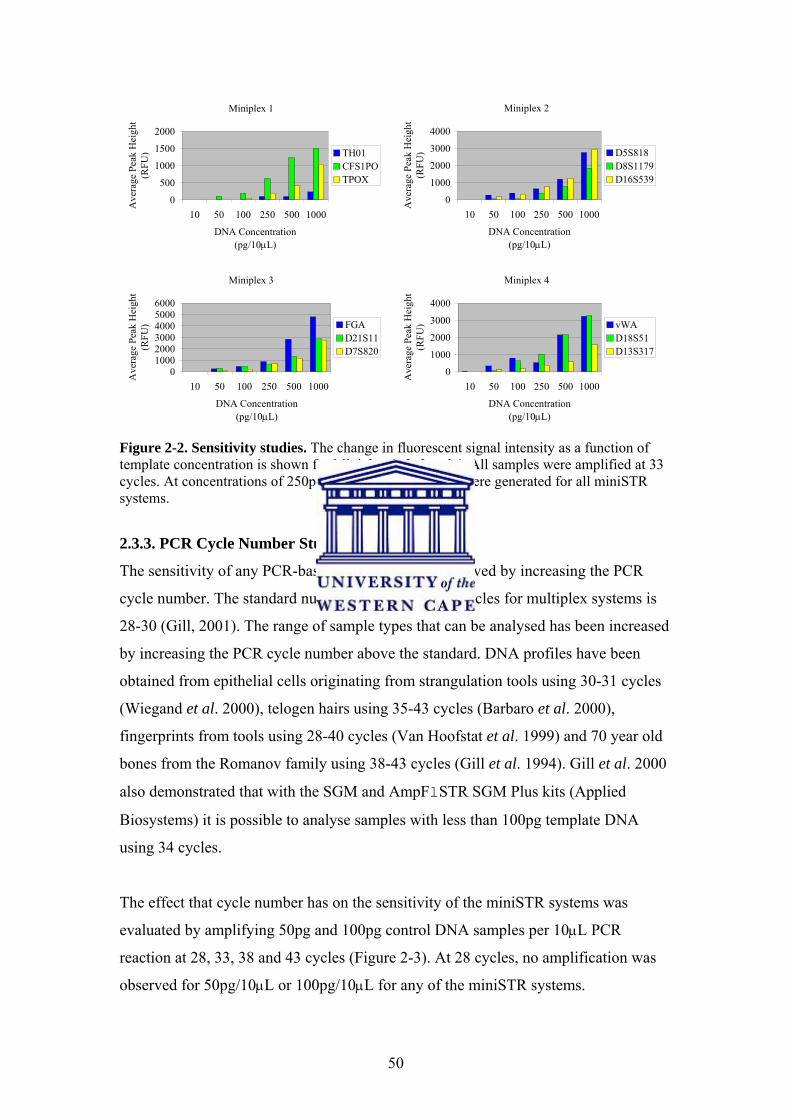
50
Miniplex 2
0
1000
2000
3000
4000
10 50 100 250 500 1000
DNA Concentration(pg/10μL)
Ave
rage
Pea
k H
eigh
t (R
FU) D5S818
D8S1179D16S539
Miniplex 3
0100020003000400050006000
10 50 100 250 500 1000
DNA Concentration(pg/10μL)
Ave
rage
Pea
k H
eigh
t (R
FU) FGA
D21S11D7S820
Miniplex 4
0
1000
2000
3000
4000
10 50 100 250 500 1000
DNA Concentration(pg/10μL)
Ave
rage
Pea
k H
eigh
t (R
FU) vWA
D18S51D13S317
Figure 2-2. Sensitivity studies. The change in fluorescent signal intensity as a function of template concentration is shown for Miniplex 1, 2, 3 and 4. All samples were amplified at 33 cycles. At concentrations of 250pg and above full profiles were generated for all miniSTR systems.
2.3.3. PCR Cycle Number Study
The sensitivity of any PCR-based method can be improved by increasing the PCR
cycle number. The standard number of amplification cycles for multiplex systems is
28-30 (Gill, 2001). The range of sample types that can be analysed has been increased
by increasing the PCR cycle number above the standard. DNA profiles have been
obtained from epithelial cells originating from strangulation tools using 30-31 cycles
(Wiegand et al. 2000), telogen hairs using 35-43 cycles (Barbaro et al. 2000),
fingerprints from tools using 28-40 cycles (Van Hoofstat et al. 1999) and 70 year old
bones from the Romanov family using 38-43 cycles (Gill et al. 1994). Gill et al. 2000
also demonstrated that with the SGM and AmpFlSTR SGM Plus kits (Applied
Biosystems) it is possible to analyse samples with less than 100pg template DNA
using 34 cycles.
The effect that cycle number has on the sensitivity of the miniSTR systems was
evaluated by amplifying 50pg and 100pg control DNA samples per 10μL PCR
reaction at 28, 33, 38 and 43 cycles (Figure 2-3). At 28 cycles, no amplification was
observed for 50pg/10μL or 100pg/10μL for any of the miniSTR systems.
Miniplex 1
0
500
1000
1500
2000
10 50 100 250 500 1000
DNA Concentration(pg/10μL)
Ave
rage
Pea
k H
eigh
t (R
FU) TH01
CFS1POTPOX
51
Miniplex 1 performed as follows. At 33 cycles, for 50pg/10μL, complete dropout was
observed for the TH01 and TPOX loci (Figure 2-3). At 38 cycles, complete dropout
was observed for TH01 but alleles were observed for TPOX, which failed at 33
cycles. At 43cycles, over-amplification was observed for all loci. At 33 cycles, for
100pg/10μL, the complete dropout of CFS1PO and one allele of TH01 were observed.
At 38 cycles, a full profile was generated while over-amplification was observed at 43
cycles.
Miniplex 2 performed as follows. At 33 cycles, for 50pg/10μL, complete dropout was
observed for D5S818 and D8S1179 (Figure 2-3). At 38 cycles, alleles were observed
for D5S818 and D8S1179, which failed at 33 cycles. At 43 cycles, a full profile was
generated. At 33 cycles, for 100pg/10μL, the drop out of one allele of D16S539 was
observed. At 38 cycles, a full profile was generated. At 43 cycles, over-amplification
was observed for all loci.
Miniplex 3 performed as follows. At 33 cycles, for 50pg/10μL, one allele of D7S820
and complete dropout was observed for D21S11. At 38 cycles, alleles were observed
for D21S11 but the drop out of one allele of D7S820 was still observed. At 43 cycles,
no significant improvement was observed. At 33 cycles, for 100pg/10μL, a full profile
was generated. However at 38 cycles, the drop out of one allele of D7S820 was
observed. The fact that this allele was observed at 33 cycles suggests that preferential
amplification due to stochastic effects was the reason behind the allele drop out at 38
cycles. When low levels of DNA (100pg or less) are used in PCR reactions an
unequal sampling of the two alleles present from a heterozygous individual can occur,
this is what is referred to as a stochastic sampling effect. This results in the
preferential amplification of one allele, which can cause drop out of the other allele or
severe allele imbalance. At 43 cycles, over-amplification was observed for all loci.
Miniplex 4 performed as follows. At 33 and 38 cycles, for 50pg/10μL drop out was
observed for D18S51 and D13S317 (Figure 2-3). At 43 cycles, no significant
improvement was observed. At 33 and 38 cycles, for 100pg/10μL, full profiles were
generated. At 43 cycles, over-amplification was observed.
52
Overall an increase in cycle number increased the sensitivity of the Miniplex systems.
For 50pg/10μL at 33 cycles, 43% (10 out of 23) of the expected control DNA profile
alleles were observed. While at 38 cycles, this increased to 65% (15 out of 23). For
100pg/10μL at 33 cycles, 82.60% (19 out of 23) of the expected control DNA profile
alleles were observed. While at 38 cycles, this increased to 95.65% (22 out of 23).
Miniplex 1 and 2 exhibited sensitivity down to 100pg at 38 cycles while Miniplex 3
and 4 exhibited sensitivity down to 100pg at 33 cycles. However the high
amplification of certain alleles (RFU>5000-6000) for Miniplex 1 and 2 at 38 cycles
suggests that lower cycle numbers could be used successfully. Therefore when a DNA
concentration of less than 250pg is used then a cycle number in the range of 34-37
cycles is recommended.

53
Miniplex 1 100pg/10μL
0100020003000400050006000
33 cycles 38 cycles
Cycle Number
Ave
rage
Pea
k H
eigh
t (R
FU) TH01
CFS1POTPOX
Miniplex 2 100pg/10μL
0
2000
4000
6000
8000
33 cycles 38 cycles
Cycle Number A
vera
ge P
eak
Hei
ght
(RFU
) D5S818D8S1179D16S539
Miniplex 3
100pg/10μL
010002000300040005000
33 cycles 38 cycles
Cycle Number
Ave
rage
Pea
k H
eigh
t (R
FU) FGA
D21S11D7S820
Miniplex 4
100pg/10μL
0
1000
2000
3000
4000
33 cycles 38 cycles
Cycle Number
Ave
rage
Pea
k H
eigh
t (R
FU) vWA
D18S51D13S317
Figure 2-3. Cycle number study. The change in fluorescent signal intensity as a function of cycle number and template concentration is shown for Miniplex 1, 2, 3 and 4. Miniplex 1 and 2 exhibited sensitivity down to 100pg at 38 cycles while Miniplex 3 and 4 exhibited sensitivity down to 100pg at 33 cycles.
Miniplex 150pg/10μL
010002000300040005000
33 cycles 38 cycles
Cycle Number
Ave
rage
Pea
k H
eigh
t (R
FU) TH01
CFS1P0TPOX
Miniplex 2 50pg/10μL
0500
1000150020002500
33 cycles 38 cycles
Cycle Number
Ave
rage
Pea
k H
eigh
t (R
FU) D5S818
D8S1179D16S539
Miniplex 3 50pg/10μL
0100020003000400050006000
33 cycles 38 cycles
Cycle Number
Ave
rage
Pea
k H
eigh
t (R
FU) FGA
D21S11D7S820
Miniplex 4 50pg/10μL
0
1000
2000
3000
4000
33 cycles 38 cycles
Cycle Number
Ave
rage
Pea
k H
eigh
t (R
FU) vWA
D18S51D13S317
54
2.3.4. Reproducibility and Precision
To ensure that the miniSTR systems generated consistent genotypes from DNA
samples of the same donors, a reproducibility and precision study was conducted.
DNA samples that were extracted from the blood of two individuals were utilised in
this study. To test the reproducibility, the samples were amplified and analysed on
two separate occasions using the standard conditions except that the miniSTR
D3S1358 was included so that all 13 CODIS loci would be amplified. To test the
precision of allele sizing, one of the samples was analysed an additional three times.
The average allele size and standard deviation was determined.
For the reproducibility study, consistent genotypes were obtained for both samples
and high precision was observed. No differences were observed between the
genotypes determined for the first and second amplifications.
For the precision study, the standard deviation did not exceed 0.158 bases (Table 2-1),
a reasonable value given that a standard deviation of 0.2 bases is considered
acceptable (http://www.cstl.nist.gov/biotech/strbase/training.htm). However forensic
laboratories that utilise capillary-based genetic analysers and DNA sequencers
generally report standard deviation values under 0.15bp. In this study the gel-based
ABI PRISM 377 DNA Sequencer (Applied Biosystems), which is generally believed
to be less precise than the capillary-based genetic analysers and DNA sequencers was
utilised. The study demonstrated that the miniSTR systems could generate
reproducible results with high precision.
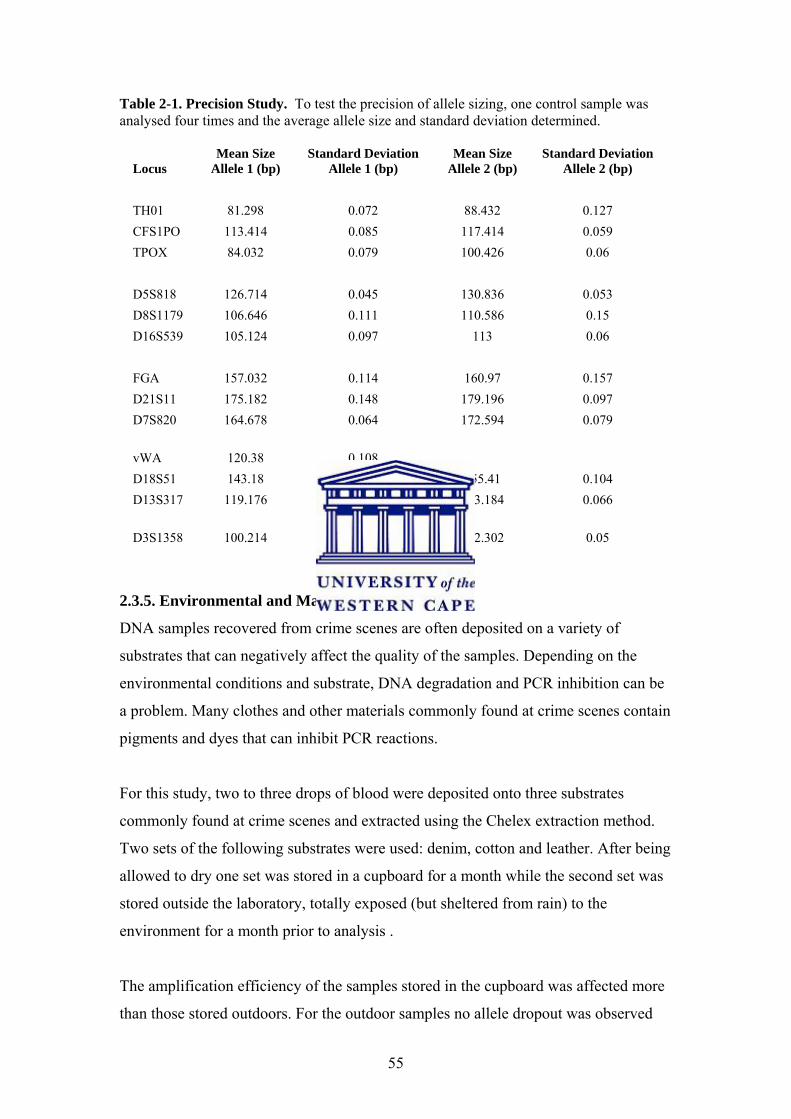
55
Table 2-1. Precision Study. To test the precision of allele sizing, one control sample was analysed four times and the average allele size and standard deviation determined.
Locus Mean Size
Allele 1 (bp) Standard Deviation
Allele 1 (bp) Mean Size
Allele 2 (bp) Standard Deviation
Allele 2 (bp) TH01 81.298 0.072 88.432 0.127 CFS1PO 113.414 0.085 117.414 0.059 TPOX 84.032 0.079 100.426 0.06 D5S818 126.714 0.045 130.836 0.053 D8S1179 106.646 0.111 110.586 0.15 D16S539 105.124 0.097 113 0.06 FGA 157.032 0.114 160.97 0.157 D21S11 175.182 0.148 179.196 0.097 D7S820 164.678 0.064 172.594 0.079 vWA 120.38 0.108 D18S51 143.18 0.158 155.41 0.104 D13S317 119.176 0.101 123.184 0.066 D3S1358 100.214 0.143 112.302 0.05
2.3.5. Environmental and Matrix Studies
DNA samples recovered from crime scenes are often deposited on a variety of
substrates that can negatively affect the quality of the samples. Depending on the
environmental conditions and substrate, DNA degradation and PCR inhibition can be
a problem. Many clothes and other materials commonly found at crime scenes contain
pigments and dyes that can inhibit PCR reactions.
For this study, two to three drops of blood were deposited onto three substrates
commonly found at crime scenes and extracted using the Chelex extraction method.
Two sets of the following substrates were used: denim, cotton and leather. After being
allowed to dry one set was stored in a cupboard for a month while the second set was
stored outside the laboratory, totally exposed (but sheltered from rain) to the
environment for a month prior to analysis .
The amplification efficiency of the samples stored in the cupboard was affected more
than those stored outdoors. For the outdoor samples no allele dropout was observed
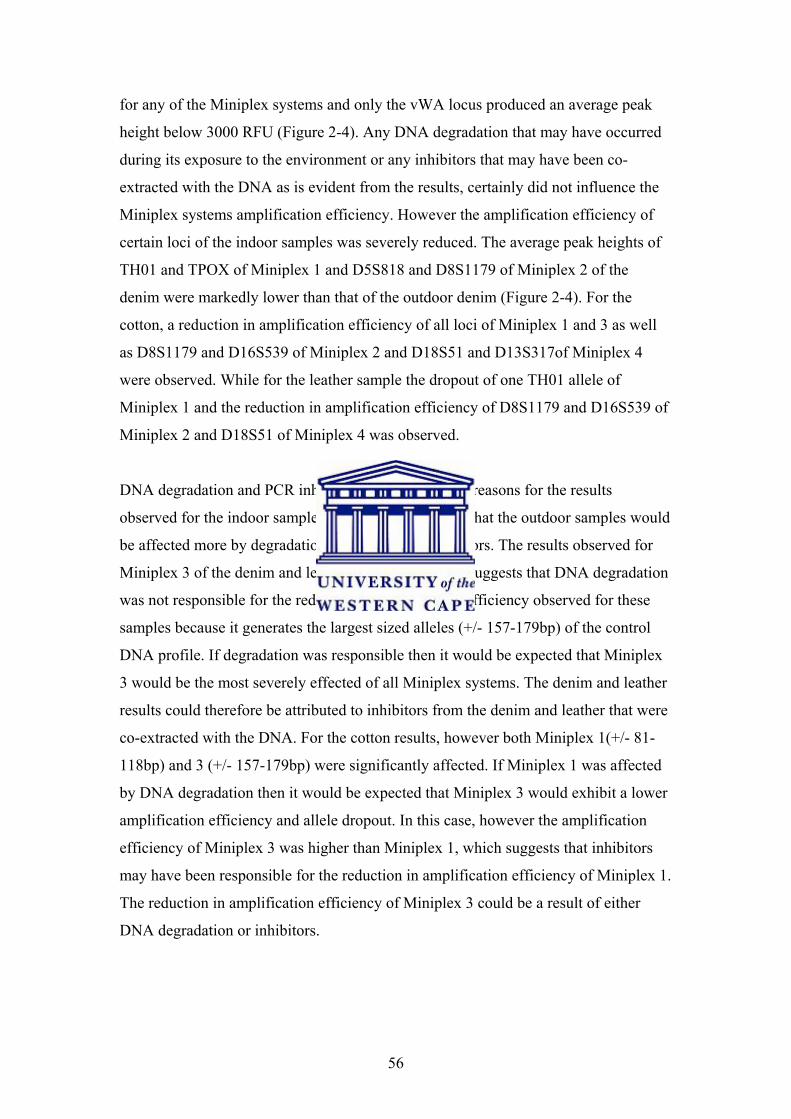
56
for any of the Miniplex systems and only the vWA locus produced an average peak
height below 3000 RFU (Figure 2-4). Any DNA degradation that may have occurred
during its exposure to the environment or any inhibitors that may have been co-
extracted with the DNA as is evident from the results, certainly did not influence the
Miniplex systems amplification efficiency. However the amplification efficiency of
certain loci of the indoor samples was severely reduced. The average peak heights of
TH01 and TPOX of Miniplex 1 and D5S818 and D8S1179 of Miniplex 2 of the
denim were markedly lower than that of the outdoor denim (Figure 2-4). For the
cotton, a reduction in amplification efficiency of all loci of Miniplex 1 and 3 as well
as D8S1179 and D16S539 of Miniplex 2 and D18S51 and D13S317of Miniplex 4
were observed. While for the leather sample the dropout of one TH01 allele of
Miniplex 1 and the reduction in amplification efficiency of D8S1179 and D16S539 of
Miniplex 2 and D18S51 of Miniplex 4 was observed.
DNA degradation and PCR inhibition are two possible reasons for the results
observed for the indoor samples. It would be expected that the outdoor samples would
be affected more by degradation than those stored indoors. The results observed for
Miniplex 3 of the denim and leather samples certainly suggests that DNA degradation
was not responsible for the reduction in amplification efficiency observed for these
samples because it generates the largest sized alleles (+/- 157-179bp) of the control
DNA profile. If degradation was responsible then it would be expected that Miniplex
3 would be the most severely effected of all Miniplex systems. The denim and leather
results could therefore be attributed to inhibitors from the denim and leather that were
co-extracted with the DNA. For the cotton results, however both Miniplex 1(+/- 81-
118bp) and 3 (+/- 157-179bp) were significantly affected. If Miniplex 1 was affected
by DNA degradation then it would be expected that Miniplex 3 would exhibit a lower
amplification efficiency and allele dropout. In this case, however the amplification
efficiency of Miniplex 3 was higher than Miniplex 1, which suggests that inhibitors
may have been responsible for the reduction in amplification efficiency of Miniplex 1.
The reduction in amplification efficiency of Miniplex 3 could be a result of either
DNA degradation or inhibitors.
57
Miniplex1
01000200030004000500060007000
DenimIndoor
CottonIndoor
LeatherIndoor
DenimOutdoor
CottonOutdoor
LeatherOutdoor
Matrix
Ave
rage
Pea
k H
eigh
t R
elat
ive
Fluo
resc
ence
Uni
ts (R
FU)
THO1CFS1POTPOX
Miniplex 2
01000200030004000500060007000
DenimIndoor
CottonIndoor
LeatherIndoor
DenimOutdoor
CottonOutdoor
LeatherOutdoor
Matrix
Ave
rage
Pea
k H
eigh
tR
elat
ive
Fluo
resc
ence
Uni
ts (R
FU)
D5S818D8S1179D16S539
Miniplex 3
0
1000
2000
3000
4000
5000
6000
DenimIndoor
CottonIndoor
LeatherIndoor
DenimOutdoor
CottonOutdoor
LeatherOutdoor
Matrix
Ave
arag
e Pe
ak H
eigh
tR
elat
ive
Fluo
resc
ence
Uni
ts (R
FU)
FGAD21S11D7S820
Miniplex 4
01000200030004000500060007000
DenimIndoor
CottonIndoor
LeatherIndoor
DenimOutdoor
CottonOutdoor
LeatherOutdoor
Matrix
Ave
rage
Pea
k H
eigh
tR
elat
ive
Fluo
resc
ence
Uni
ts (R
FU)
vWAD18S51D13S317
Figure 2-4. Environmental and Matrix Studies. The change in fluorescent signal intensity as a function of environmental and substrate exposure is shown for Miniplex 1, 2, 3 and 4. Two to three drops of blood were deposited onto three substrates commonly found at crime scenes. Two sets of the following substrates were used: denim, cotton and leather. After being allowed to dry one set was stored in a cupboard for a month while the second set was stored outside the laboratory, totally exposed (but sheltered from rain) to the environment for a month prior to amplification. All samples were amplified using 200pg template DNA in 10μL reactions for 35 cycles. The amplification efficiency of the samples stored in the cupboard was affected more than those stored outdoors.
2.3.6. Mixture Studies
In many casework studies, DNA mixtures have to be analysed. Samples obtained
from crime scenes often contain DNA from multiple donors and therefore the ability
of STR multiplex systems to differentiate between the minor and major components
of samples is important.
Peak ratio analysis can be of great help in these situations as it can help determine the
quantity of DNA from the minor or major donors. The ratio of the minor to major
component for a locus can be determined by dividing the average peak height of the
minor alleles by the average peak height of the major alleles.
In this study, two control samples were mixed in the following ratios: 1/100, 1/10, 1/5
and 1/1 while keeping the template concentration of the major component constant at
250pg/10μL. The average peak height ratios of minor to major peaks were determined
58
for the following loci: CFS1PO (Miniplex 1), D16S539 (Miniplex 2), FGA (Miniplex
3) and D18S51 (Miniplex 4) (Figure 2-5). These loci were chosen because both DNA
samples were heterozygous at each locus. The samples only shared one common
allele and that was at the locus CFS1PO. At a ratio of 1/100, the minor component is
present at 1% of the total amount of DNA template and therefore the average peak
height ratio of minor to major peak is expected to be 0.01. At a ratio of 1/10, the
minor component is present at 10% of the total amount of DNA template and
therefore the average peak height ratio of minor to major peak is expected to be 0.1.
At a ratio of 1/5, the minor component is present at 20% of the total amount of DNA
template and therefore the average peak height ratio of minor to major peak is
expected to be 0.2.
For the CFS1PO locus, the ratio of the minor to major component alleles reflected the
ratio of input DNA (Figure 2-5). The average peak height of the minor component
was above the laboratories Relative Fluorescence Units (RFU) threshold (50RFU) at
all mixture ratios except 1/100. For the D16S539 locus, the ratio of the minor
components above a 1/100 ratio was below what was expected (Figure 2-5). However
the average peak height of the minor component was above the laboratories RFU
threshold at all mixture ratios. For the FGA locus, the ratio of the minor component
reflected the ratio of input DNA only at 1/1, while at 1/5 and 1/10 it was below and at
1/100 it was above the expected ratio (Figure 2-5). The average peak height of the
minor component was above the laboratories RFU threshold at all mixture ratios
except 1/100. For the D18S51 locus, the ratio of the minor component at no point
reflected the ratio of input DNA and the average peak height of the minor component
was below the laboratories RFU threshold at mixture ratios below 1/5 (Figure 2-5).
Overall the results of this study show that at a mixture ratio of 1/10 the minor
components of the CFS1PO, D16S539 and FGA loci are detectable (RFU>50). As for
D18S51, it is only detectable when the minor component is present at 20% (1/5 ratio)
of the total DNA template.
This is a limited study and therefore a more detailed study is suggested in order to
obain a better understanding of the overall ability of the miniSTR systems to
differentiate between the minor and major components of samples. The study could
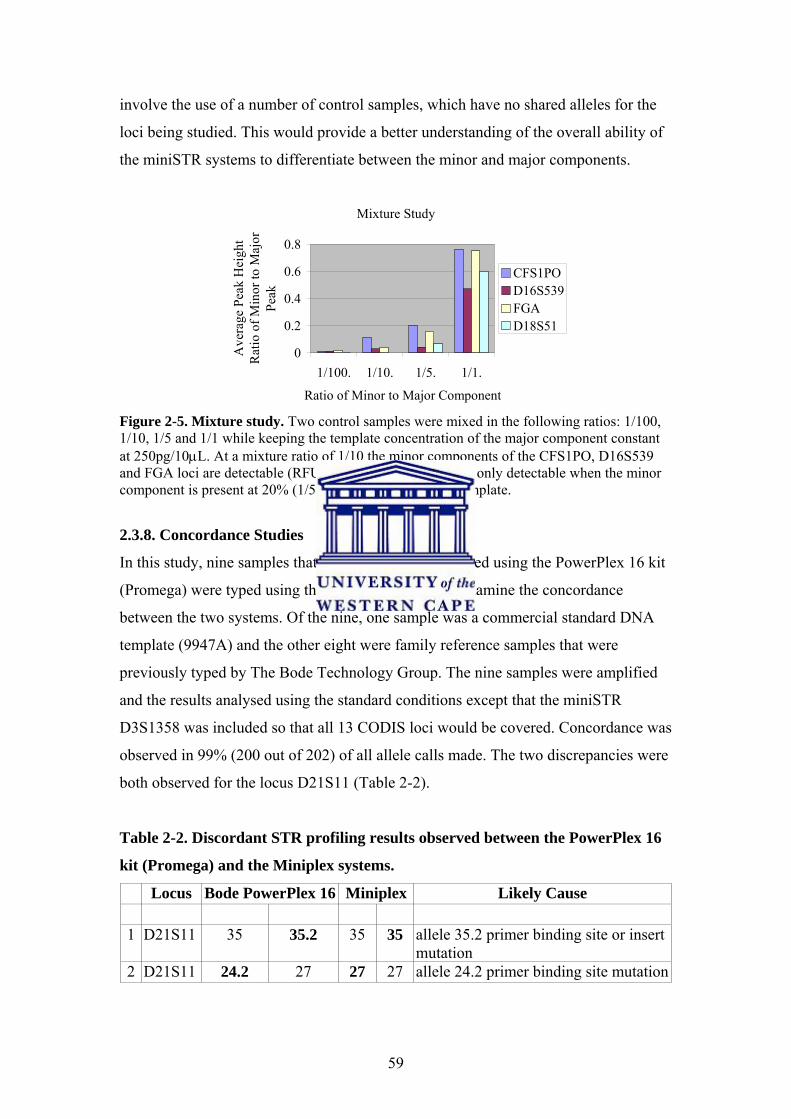
59
involve the use of a number of control samples, which have no shared alleles for the
loci being studied. This would provide a better understanding of the overall ability of
the miniSTR systems to differentiate between the minor and major components.
Mixture Study
0
0.2
0.4
0.6
0.8
1/100. 1/10. 1/5. 1/1.
Ratio of Minor to Major Component
Ave
rage
Pea
k H
eigh
t R
atio
of M
inor
to M
ajor
Pe
akCFS1POD16S539FGAD18S51
Figure 2-5. Mixture study. Two control samples were mixed in the following ratios: 1/100, 1/10, 1/5 and 1/1 while keeping the template concentration of the major component constant at 250pg/10μL. At a mixture ratio of 1/10 the minor components of the CFS1PO, D16S539 and FGA loci are detectable (RFU>50). As for D18S51, it is only detectable when the minor component is present at 20% (1/5 ratio) of the total DNA template.
2.3.8. Concordance Studies
In this study, nine samples that had previously been typed using the PowerPlex 16 kit
(Promega) were typed using the Miniplex systems to examine the concordance
between the two systems. Of the nine, one sample was a commercial standard DNA
template (9947A) and the other eight were family reference samples that were
previously typed by The Bode Technology Group. The nine samples were amplified
and the results analysed using the standard conditions except that the miniSTR
D3S1358 was included so that all 13 CODIS loci would be covered. Concordance was
observed in 99% (200 out of 202) of all allele calls made. The two discrepancies were
both observed for the locus D21S11 (Table 2-2).
Table 2-2. Discordant STR profiling results observed between the PowerPlex 16
kit (Promega) and the Miniplex systems. Locus Bode PowerPlex 16 Miniplex Likely Cause
1 D21S11 35 35.2 35 35 allele 35.2 primer binding site or insert mutation
2 D21S11 24.2 27 27 27 allele 24.2 primer binding site mutation

60
There are three possible reasons for the observed discrepancies, firstly an insertion
mutation could be present between the Miniplex primer binding site and the
commercial kits binding site. An insert mutation present between the Miniplex primer
binding site and the commercial kits binding site would not hinder amplification of
either system but result in the systems generating different allele calls. The insertion
would cause the commercial kit to generate a larger product for a given allele.
Secondly, a mutation in the middle of a primer binding site would hinder primer
binding and cause preferential amplification of an allele and result in allele peak
height imbalance. An allele might be present but not called due to its peak height
being below a laboratory RFU threshold. Thirdly, a mutation at the 3` end of a primer
binding site would prevent the primer from binding and result in allele dropout.
It’s difficult to determine exactly what mechanism could be responsible for the results
as discordance associated with D21S11 has not been previously reported in
concordance studies between the Miniplex systems and the PowerPlex16 (Promega)
or AmpFlSTR Identifiler kits (Drabek et al. 2004). The only way to determine what
was responsible for the discrepancies observed would be to sequence the relevant
alleles.

61
Chapter 3: Case Study 1: DNA Analysis of 25 year old and Fragmented and
Charred 20 year old Human Skeletal Remains
3.1. Introduction
This study involved two cases that were related to political violence and human rights
abuses. The first case involved an uMkhonto weSizwe (MK) operative who was killed
during a police ambush outside the town of Piet Retief in 1982. Remains thought to be
those of the operative were exhumed in December 2005 and provided for DNA
analysis.
The second case involved a commingled grave containing the fragmented remains of
four adults. The remains were thought to be those of four activists abducted and
murdered by the Northern Transvaal Security Police in June and July 1987. The
individuals were tortured and their bodies dismembered with explosives. Fragmented
skeletal remains were exhumed from an alleged grave site.
These remains were highly fragmented. This made it difficult for the Argentine
Forensic Anthropology Team (EAAF) to identify the victims using conventional
forensic anthropology. Therefore samples were sent to the Forensic DNA Laboratory
at the University of the Western Cape (UWC) for analysis. This particular study was
conducted to confirm earlier DNA analysis.
3.2. Materials and Methods
3.2.1. Laboratory Setup
Skeletal remains preparation, DNA extraction and PCR amplification setup was
conducted in a dedicated ancient DNA laboratory. This laboratory was physically and
logistically separated from the Modern-DNA pre-PCR lab where reference samples
were extracted and PCR amplifications were setup. Both pre-PCR areas were exposed
to UV irradiation overnight and all surfaces were treated with bleach regularly.
Disposable hair nets, lab coats and gloves as well as boots were always worn in the
ancient DNA lab while standard protective equipment was worn in the Modern-DNA
lab. This minimised the risk of contamination.
62
3.2.2. Sample Collection and Preparation
Family reference samples and skeletal remains were received from the South African
Missing Persons Task Team (SAMPTT). For the first case, 1 family reference swab
sample and 1 femur was received while for the second case, 13 family reference swab
samples and 4 femur fragments were received. The femur fragments were obtained
from remains that had been analyzed by the EAAF as part of their work for the
SAMPTT. All femurs were stored in paper bags at room temperature prior to
sampling, cleaning and milling.
The sampling procedure was the most time consuming. A dremmel tool was used to
cut an appropriately sized sample from the femur. Surface material was then removed
by sanding using the dremmel tool. Once the surface was removed the sample was
photographed and then cut into smaller pieces to assist the milling processes. Each
bone was sampled separately and the area dedicated to sampling was treated with
bleach during and between each sampling session. This minimised the chances of
cross contamination.
Before the samples were milled they were cleaned to ensure the removal of
contaminant DNA. The bone samples stored in the 50mL falcon tubes were immersed
in bleach and rinsed with deionised water and ethanol before drying in a UV
irradiated laminar flow hood.
Once the samples were cleaned they were ready to be milled using a 6750 freezer mill
(Spex Certiprep). The milling began with 15 min of pre-cooling followed by 3 cycles
of 2-min grinding and 2-min resting, with an impact frequency of 15. The standard
operating procedures for bone sampling and cleaning as well as milling can be found
in Appendix I.
63
3.2.3. DNA Extraction
DNA was extracted from reference buccal swabs using the Chelex protocol described
in the Applied Biosystems Profiler Plus User Manual. The step by step protocol for
this method can be found in Appendix I.
DNA was extracted from the milled bone samples using the organic extraction
method described previously (Hagelberg et al. 1989). One to two grams of milled
bone powder was incubated overnight at 370 C in 10 ml of Lysis buffer (0.5 M EDTA
pH 8-8.5, 0.5 ml 10% N-lauroyl sarcosine and 200µL of the 20 mg/mL Proteinase K)
in a shaking incubator. Water-saturated phenol (10 ml) was added and the solution
vortexed and centrifuged for 10 minutes at 3000 r.p.m. The aqueous phase was then
extracted twice with an equal mixture of water-saturated phenol and chloroform and
the solution vortexed and centrifuged as before. Residual phenol was removed by one
chloroform (10ml) extraction. The aqueous phase was recovered and concentrated
using dialysis centrifugation. This was achieved using Centriplus 30 tubes centrifuged
at max speed until the solution was concentrated down to 100-200ul. The extract was
then washed twice with 10ml SABAX water to remove salt. The extracts were stored
at -200 C. The step by step protocol for this method can be found in Appendix I.
3.2.4. DNA Quantification
The family reference samples and bone DNA samples were quantified using an in-
house developed TH01 quantification system. The system relies on the amplification
of the TH01 locus from unknown and standard DNA samples and was adopted from a
previously published protocol (Sifis et al. 2001). Instead of amplifying the samples
with Alu primers and using quantitation standards with a range of 1pg to 100pg,
samples were amplified with miniSTR TH01 primers and quantified against standards
ranging from 3.33pg/μL to 100pg/μL.
Amplifications were performed in a final reaction volume of 10μL containing 3µL
DNA, 10 x Supertherm PCR buffer with 15mM MgCl2, 200µM dNTPs, 0.8 U of
Supertherm Gold, and Miniplex primers (0.075µM TH01). Primers were synthesized
by Applied Biosystems using previously reported sequences (Butler et al. 2003).
64
PCR amplification was performed using a GeneAmp 2700 or 2720 thermal cycler
(Applied Biosystems). Thermal cycling conditions were:
1 cycle at 95oC for 10 minutes, 33 cycles at 94oC for 1 minute, 55oC for 1 minute, and
72oC for 1 minute, followed by a final cycle at 60 oC for 45 minutes.
Amplicons were analysed using an ABI PRISM 377 DNA Sequencer. Samples were
prepared for electrophoresis by mixing1µL PCR product with 1µL loading mix,
which consisted of the following components at the indicated ratio: 5µL HiDi
formamide, 1.5µL ROX 500: 1.5µL Dextran Blue loading dye (all Applied
Biosystems). Following denaturation of the samples at 95 oC for 5 to 9 minutes in a
GeneAmp PCR System 2700 or 2720 thermal cycler (Applied Biosystems), the
samples were snap-cooled on ice for 2 minutes before loading 1µL of each sample on
a 5% Long Ranger gel (BioWhittaker Molecular Applications) (The step by step
protocol for the gel preparation and pouring can be found in Appendix I).
Electrophoresis was conducted and the data analysed according to manufacturer’s
instructions. The gel was run with filter set D for 2 ½ hours at 2400 scans per hour
and the data collected with the ABI 377 collection software (Applied Biosystems),
analyzed using GeneScan 3.0.0 software (Applied Biosystems) to determine peak
heights. The construction of the standard curve and the quantitation of the extracts
were achieved as described (Sifis et al. 2001).
3.2.5. MiniSTR PCR Amplification
The family reference samples were amplified as previously described (Chapter 2,
section 2.2.3). Specific modifications made to the reactions are considered in the
results and discussion section.
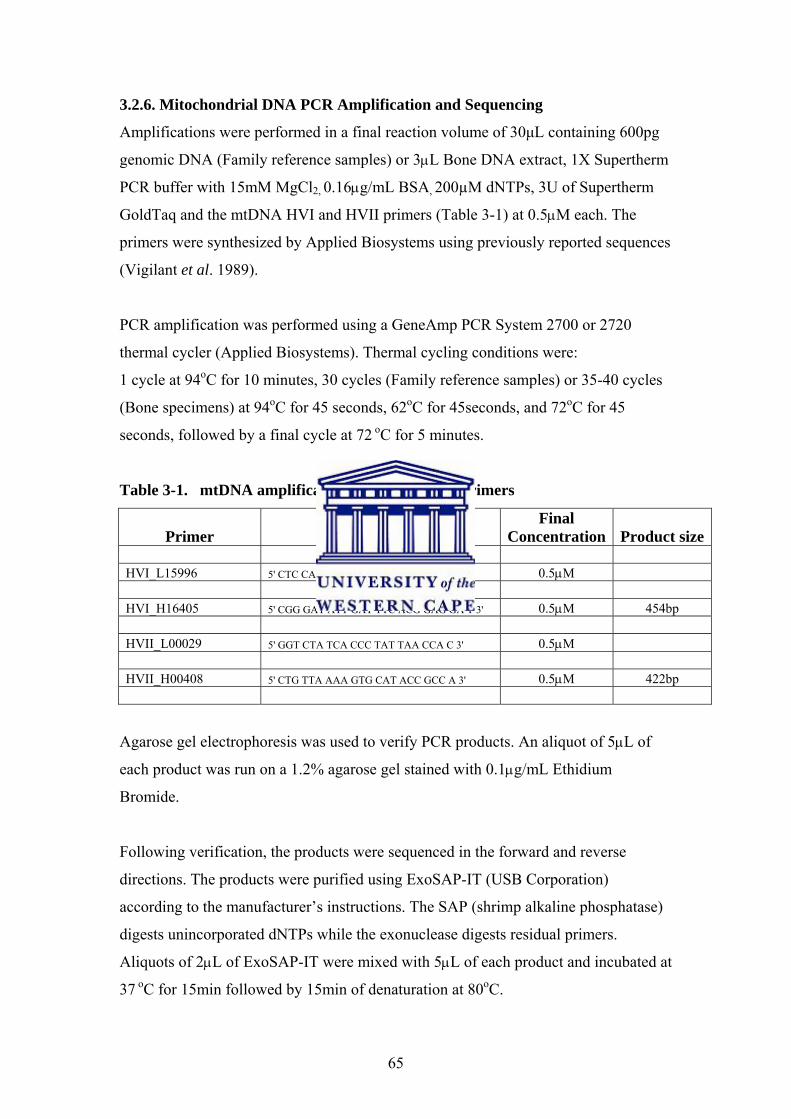
65
3.2.6. Mitochondrial DNA PCR Amplification and Sequencing
Amplifications were performed in a final reaction volume of 30μL containing 600pg
genomic DNA (Family reference samples) or 3μL Bone DNA extract, 1X Supertherm
PCR buffer with 15mM MgCl2, 0.16μg/mL BSA, 200µM dNTPs, 3U of Supertherm
GoldTaq and the mtDNA HVI and HVII primers (Table 3-1) at 0.5μM each. The
primers were synthesized by Applied Biosystems using previously reported sequences
(Vigilant et al. 1989).
PCR amplification was performed using a GeneAmp PCR System 2700 or 2720
thermal cycler (Applied Biosystems). Thermal cycling conditions were:
1 cycle at 94oC for 10 minutes, 30 cycles (Family reference samples) or 35-40 cycles
(Bone specimens) at 94oC for 45 seconds, 62oC for 45seconds, and 72oC for 45
seconds, followed by a final cycle at 72 oC for 5 minutes.
Table 3-1. mtDNA amplification and sequencing primers
Primer Primer Sequence Final
Concentration Product size HVI_L15996 5' CTC CAC CAT TAG CAC CCA AAG C 3' 0.5μM HVI_H16405 5' CGG GAT ATT GAT TTC ACG GAG GA T 3' 0.5μM 454bp HVII_L00029 5' GGT CTA TCA CCC TAT TAA CCA C 3' 0.5μM HVII_H00408 5' CTG TTA AAA GTG CAT ACC GCC A 3' 0.5μM 422bp
Agarose gel electrophoresis was used to verify PCR products. An aliquot of 5μL of
each product was run on a 1.2% agarose gel stained with 0.1μg/mL Ethidium
Bromide.
Following verification, the products were sequenced in the forward and reverse
directions. The products were purified using ExoSAP-IT (USB Corporation)
according to the manufacturer’s instructions. The SAP (shrimp alkaline phosphatase)
digests unincorporated dNTPs while the exonuclease digests residual primers.
Aliquots of 2μL of ExoSAP-IT were mixed with 5μL of each product and incubated at
37 oC for 15min followed by 15min of denaturation at 80oC.
66
Sequencing was performed using the BigDye Terminator v3.1 cycle sequencing kit
(Applied Biosystems) according to manufacturer’s instructions. Sequencing was
performed in a final reaction volume of 10μL containing 4.0μL ready reaction mix,
1μL mtDNA primer at 0.5μM each, and 1.5μL Sabax water and 3.5μL template DNA
(ExoSAP-IT treated). The primers used for sequencing were identical to those used
for amplification.
Cycle sequencing was performed using a GeneAmp PCR System 2700 or 2720
thermal cycler (Applied Biosystems). Thermal cycling conditions were:
1 cycle at 96oC for 1 minute, 25 cycles at 96oC for 10 seconds, 50oC for 5 seconds,
and 60oC for 4 minutes, followed by a hold at 4 oC.
The sequencing products were purified and precipitated using Ethanol/EDTA/Sodium
Acetate Precipitation as described by the manufacturers. Briefly, 125mM EDTA, 3M
Sodium Acetate and 100% Ethanol were added to each reaction prior to an incubation
for 15 minutes at room temperature. The samples were then centrifuged for 30
minutes and the supernatant removed prior to the addition of 70% Ethanol and
centrifugation for 15minutes. The supernatant was again removed and the samples
incubated at room temperature for 40 minutes.
Amplicons were analysed using an ABI PRISM 377 DNA Sequencer. In preparation
for running, the samples were resuspended in 1.5μL loading mix (5μL formamide to
1μL Dextran Blue Loading Dye). Following denaturation of the samples at 95 oC for 5
to 9 minutes in a GeneAmp PCR System 2700 or 2720 thermal cycler (Applied
Biosystems), the samples were snap-cooled on ice for 2 minutes before loading 0.8-
1.2µL of each sample on a 5% Long Ranger gel (BioWhittaker Molecular
Applications)
Electrophoresis was conducted according to manufacturer’s instructions. The gel was
run using filter set E for 10½ hours at 1200 scans per hour.
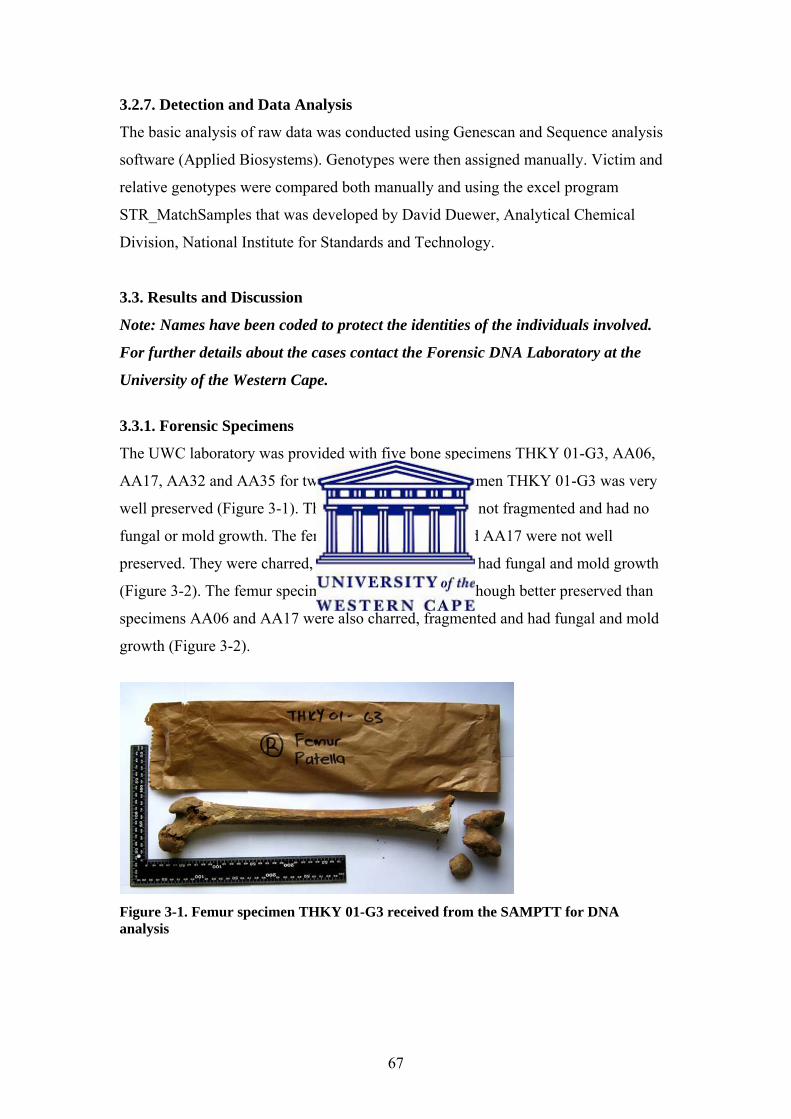
67
3.2.7. Detection and Data Analysis
The basic analysis of raw data was conducted using Genescan and Sequence analysis
software (Applied Biosystems). Genotypes were then assigned manually. Victim and
relative genotypes were compared both manually and using the excel program
STR_MatchSamples that was developed by David Duewer, Analytical Chemical
Division, National Institute for Standards and Technology.
3.3. Results and Discussion
Note: Names have been coded to protect the identities of the individuals involved.
For further details about the cases contact the Forensic DNA Laboratory at the
University of the Western Cape.
3.3.1. Forensic Specimens
The UWC laboratory was provided with five bone specimens THKY 01-G3, AA06,
AA17, AA32 and AA35 for two cases. The femur specimen THKY 01-G3 was very
well preserved (Figure 3-1). The shaft of the femur was not fragmented and had no
fungal or mold growth. The femur specimens AA06 and AA17 were not well
preserved. They were charred, severely fragmented and had fungal and mold growth
(Figure 3-2). The femur specimens AA32 and AA35 although better preserved than
specimens AA06 and AA17 were also charred, fragmented and had fungal and mold
growth (Figure 3-2).
Figure 3-1. Femur specimen THKY 01-G3 received from the SAMPTT for DNA analysis
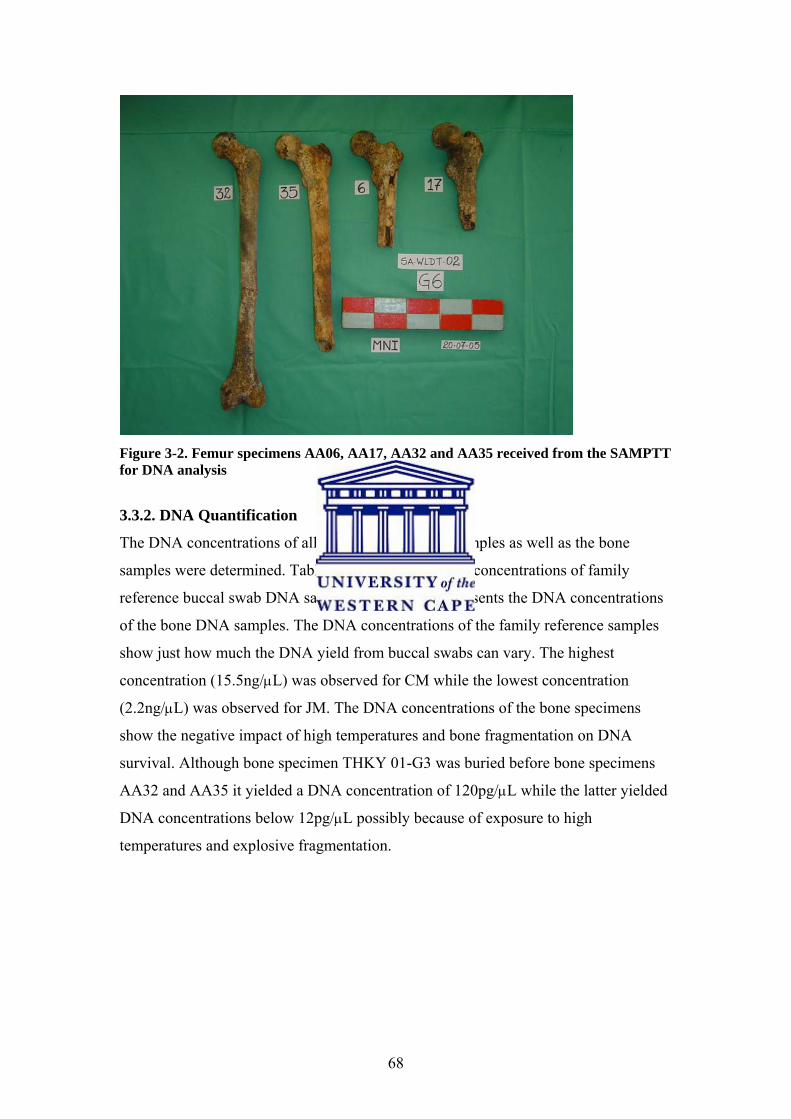
68
Figure 3-2. Femur specimens AA06, AA17, AA32 and AA35 received from the SAMPTT for DNA analysis
3.3.2. DNA Quantification
The DNA concentrations of all the family reference samples as well as the bone
samples were determined. Table 3-2 presents the DNA concentrations of family
reference buccal swab DNA samples and Table 3-3 presents the DNA concentrations
of the bone DNA samples. The DNA concentrations of the family reference samples
show just how much the DNA yield from buccal swabs can vary. The highest
concentration (15.5ng/μL) was observed for CM while the lowest concentration
(2.2ng/μL) was observed for JM. The DNA concentrations of the bone specimens
show the negative impact of high temperatures and bone fragmentation on DNA
survival. Although bone specimen THKY 01-G3 was buried before bone specimens
AA32 and AA35 it yielded a DNA concentration of 120pg/μL while the latter yielded
DNA concentrations below 12pg/μL possibly because of exposure to high
temperatures and explosive fragmentation.
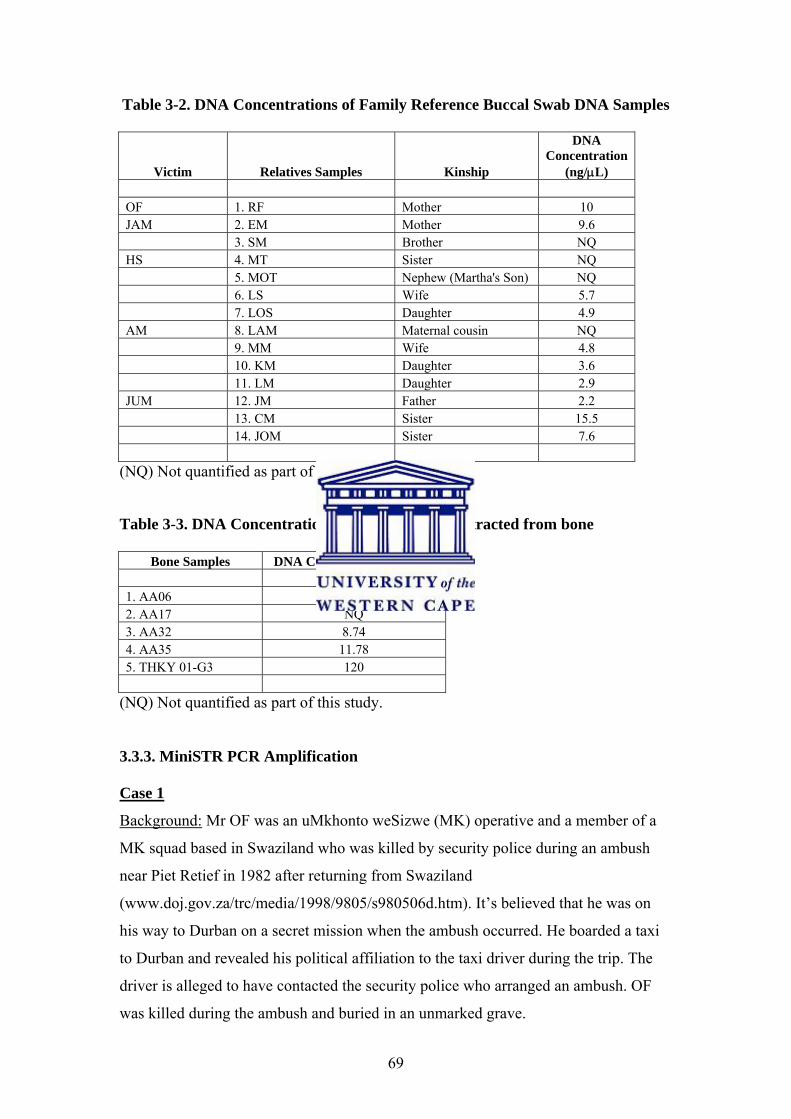
69
Table 3-2. DNA Concentrations of Family Reference Buccal Swab DNA Samples
Victim Relatives Samples Kinship
DNA Concentration
(ng/μL) OF 1. RF Mother 10 JAM 2. EM Mother 9.6 3. SM Brother NQ HS 4. MT Sister NQ 5. MOT Nephew (Martha's Son) NQ 6. LS Wife 5.7 7. LOS Daughter 4.9 AM 8. LAM Maternal cousin NQ 9. MM Wife 4.8 10. KM Daughter 3.6 11. LM Daughter 2.9 JUM 12. JM Father 2.2 13. CM Sister 15.5 14. JOM Sister 7.6
(NQ) Not quantified as part of this study.
Table 3-3. DNA Concentrations of DNA Samples extracted from bone
Bone Samples DNA Concentration (pg/μL) 1. AA06 NQ 2. AA17 NQ 3. AA32 8.74 4. AA35 11.78 5. THKY 01-G3 120
(NQ) Not quantified as part of this study.
3.3.3. MiniSTR PCR Amplification Case 1
Background: Mr OF was an uMkhonto weSizwe (MK) operative and a member of a
MK squad based in Swaziland who was killed by security police during an ambush
near Piet Retief in 1982 after returning from Swaziland
(www.doj.gov.za/trc/media/1998/9805/s980506d.htm). It’s believed that he was on
his way to Durban on a secret mission when the ambush occurred. He boarded a taxi
to Durban and revealed his political affiliation to the taxi driver during the trip. The
driver is alleged to have contacted the security police who arranged an ambush. OF
was killed during the ambush and buried in an unmarked grave.
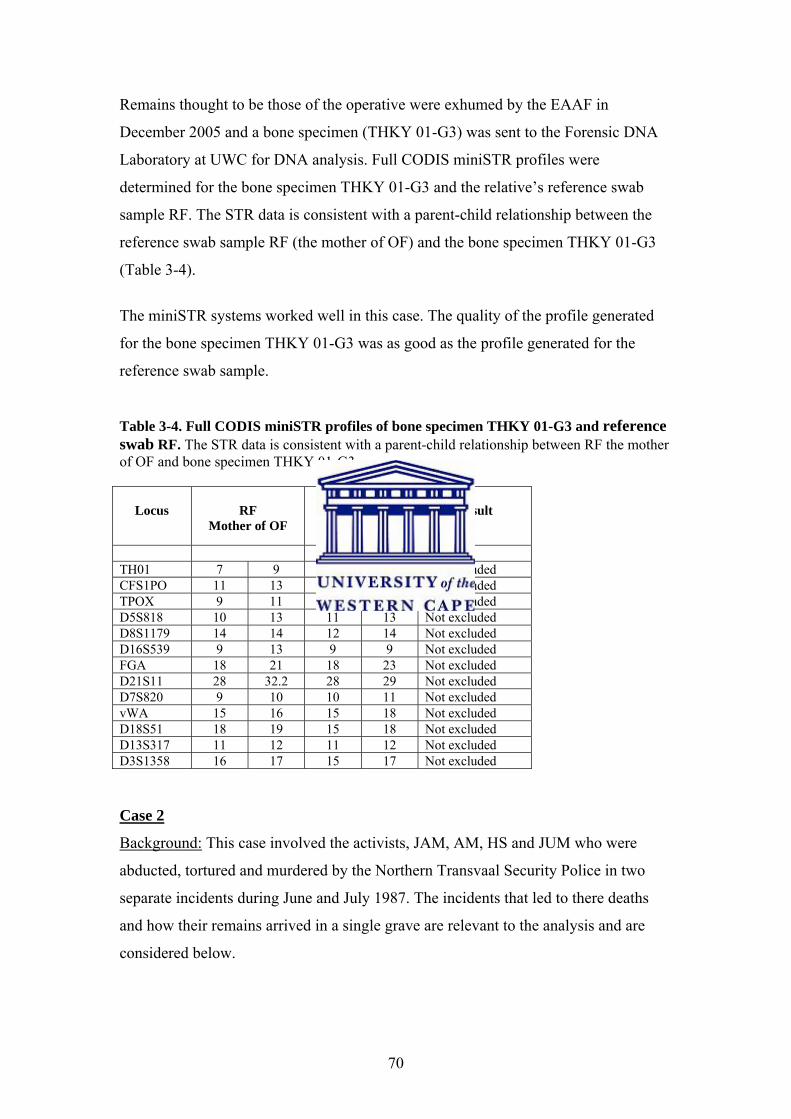
70
Remains thought to be those of the operative were exhumed by the EAAF in
December 2005 and a bone specimen (THKY 01-G3) was sent to the Forensic DNA
Laboratory at UWC for DNA analysis. Full CODIS miniSTR profiles were
determined for the bone specimen THKY 01-G3 and the relative’s reference swab
sample RF. The STR data is consistent with a parent-child relationship between the
reference swab sample RF (the mother of OF) and the bone specimen THKY 01-G3
(Table 3-4).
The miniSTR systems worked well in this case. The quality of the profile generated
for the bone specimen THKY 01-G3 was as good as the profile generated for the
reference swab sample.
Table 3-4. Full CODIS miniSTR profiles of bone specimen THKY 01-G3 and reference swab RF. The STR data is consistent with a parent-child relationship between RF the mother of OF and bone specimen THKY 01-G3.
Locus
RF
Mother of OF
Bone Specimen THKY 01-G3
Result
TH01 7 9 7 7 Not excluded CFS1PO 11 13 10 11 Not excluded TPOX 9 11 9 11 Not excluded D5S818 10 13 11 13 Not excluded D8S1179 14 14 12 14 Not excluded D16S539 9 13 9 9 Not excluded FGA 18 21 18 23 Not excluded D21S11 28 32.2 28 29 Not excluded D7S820 9 10 10 11 Not excluded vWA 15 16 15 18 Not excluded D18S51 18 19 15 18 Not excluded D13S317 11 12 11 12 Not excluded D3S1358 16 17 15 17 Not excluded Case 2
Background: This case involved the activists, JAM, AM, HS and JUM who were
abducted, tortured and murdered by the Northern Transvaal Security Police in two
separate incidents during June and July 1987. The incidents that led to there deaths
and how their remains arrived in a single grave are relevant to the analysis and are
considered below.
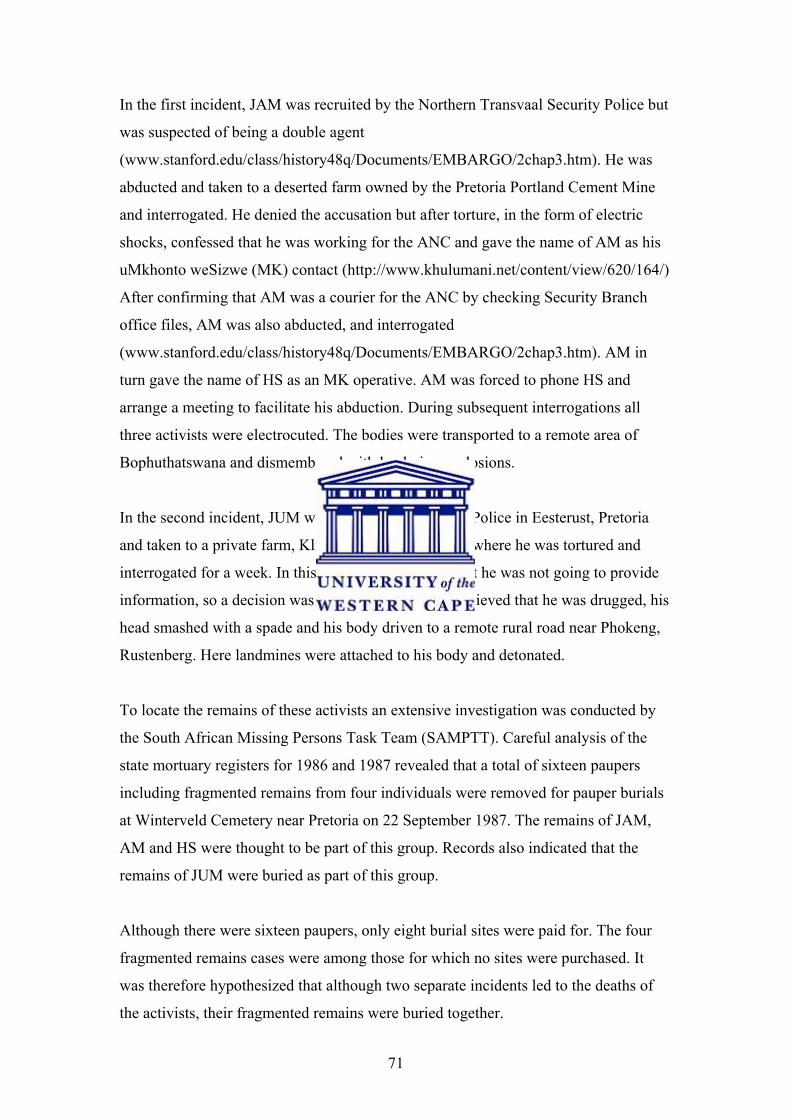
71
In the first incident, JAM was recruited by the Northern Transvaal Security Police but
was suspected of being a double agent
(www.stanford.edu/class/history48q/Documents/EMBARGO/2chap3.htm). He was
abducted and taken to a deserted farm owned by the Pretoria Portland Cement Mine
and interrogated. He denied the accusation but after torture, in the form of electric
shocks, confessed that he was working for the ANC and gave the name of AM as his
uMkhonto weSizwe (MK) contact (http://www.khulumani.net/content/view/620/164/)
After confirming that AM was a courier for the ANC by checking Security Branch
office files, AM was also abducted, and interrogated
(www.stanford.edu/class/history48q/Documents/EMBARGO/2chap3.htm). AM in
turn gave the name of HS as an MK operative. AM was forced to phone HS and
arrange a meeting to facilitate his abduction. During subsequent interrogations all
three activists were electrocuted. The bodies were transported to a remote area of
Bophuthatswana and dismembered with landmine explosions.
In the second incident, JUM was abducted by Security Police in Eesterust, Pretoria
and taken to a private farm, Klipdrift, north of Pretoria where he was tortured and
interrogated for a week. In this time it became clear that he was not going to provide
information, so a decision was made to kill him. It’s believed that he was drugged, his
head smashed with a spade and his body driven to a remote rural road near Phokeng,
Rustenberg. Here landmines were attached to his body and detonated.
To locate the remains of these activists an extensive investigation was conducted by
the South African Missing Persons Task Team (SAMPTT). Careful analysis of the
state mortuary registers for 1986 and 1987 revealed that a total of sixteen paupers
including fragmented remains from four individuals were removed for pauper burials
at Winterveld Cemetery near Pretoria on 22 September 1987. The remains of JAM,
AM and HS were thought to be part of this group. Records also indicated that the
remains of JUM were buried as part of this group.
Although there were sixteen paupers, only eight burial sites were paid for. The four
fragmented remains cases were among those for which no sites were purchased. It
was therefore hypothesized that although two separate incidents led to the deaths of
the activists, their fragmented remains were buried together.

72
During the exhumations a single commingled grave was identified containing remains
thought to be those of the four activists (JAM, AM, HS and JUM).This case was
particularly challenging because it involved a commingled grave, which contained the
charred fragmented remains of at least four adults. Due to this poor preservation, only
low concentrations of DNA (<12pg/μL) could be extracted from the specimens. Due
to the low concentrations, 6μL of bone DNA and 35 cycles were used for
amplification.
The following bone DNA and family reference DNA samples were analysed: AA06,
AA17, AA32, AA35, JM, CM, JOM, EM, MM, KM, LM and LS, LOS.
Full CODIS miniSTR profiles were determined for all relatives and two of the four
bone specimens (AA32 and AA35). The STR data is consistent with parent-child
relationships between bone specimen AA32 and the daughters of AM (reference
swabs KM and LM) (Table 3-5, 3-6). The STR evidence is also consistent with a
parent-child relationship between bone specimen AA35 and the daughter of HS
(reference swab LOS) (Table 3-7). Only 11 out of 13 loci of bone specimen AA06 are
consistent with a parent-child relationship between the father of JUM (reference swab
JM) and bone specimen AA06 (Table 3-8). It is important to note that the profile
generated for bone specimen AA06 was rather poor. It is entirely possible that the
failure of the two loci to match between bone specimen AA06 and reference swab JM
reflects an allele dropout event for bone specimen AA06. No reliable data was
recovered from bone specimen AA17.
In an effort to resolve the situation with bone specimen AA06, the sisters of JUM
(reference swabs CM and JOM) were also typed and compared with their alleged
father JM. The STR data generated is inconsistent with a parent-child relationship
between JM and CM (Table 3-9) but consistent with a parent-child relationship
between JM and JOM (Table 3-10). At best CM is the half-sister of JOM and JUM.
One way to resolve this would be to use the mothers STR data but unfortunately her
DNA was not available. Overall the miniSTR systems were only completely useful
for two out of the four specimens and therefore mtDNA typing was employed in the
hope of resolving the case.
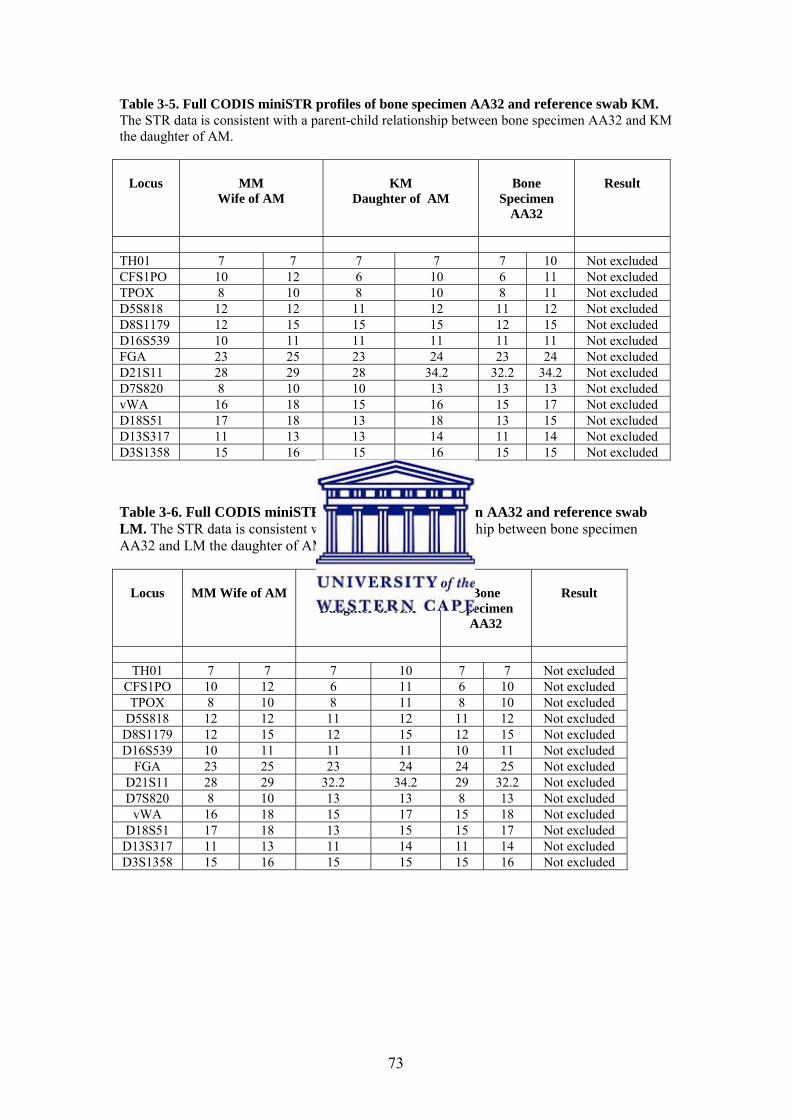
73
Table 3-5. Full CODIS miniSTR profiles of bone specimen AA32 and reference swab KM. The STR data is consistent with a parent-child relationship between bone specimen AA32 and KM the daughter of AM.
Locus
MM
Wife of AM
KM
Daughter of AM
Bone
Specimen AA32
Result
TH01 7 7 7 7 7 10 Not excluded CFS1PO 10 12 6 10 6 11 Not excluded TPOX 8 10 8 10 8 11 Not excluded D5S818 12 12 11 12 11 12 Not excluded D8S1179 12 15 15 15 12 15 Not excluded D16S539 10 11 11 11 11 11 Not excluded FGA 23 25 23 24 23 24 Not excluded D21S11 28 29 28 34.2 32.2 34.2 Not excluded D7S820 8 10 10 13 13 13 Not excluded vWA 16 18 15 16 15 17 Not excluded D18S51 17 18 13 18 13 15 Not excluded D13S317 11 13 13 14 11 14 Not excluded D3S1358 15 16 15 16 15 15 Not excluded
Table 3-6. Full CODIS miniSTR profiles of bone specimen AA32 and reference swab LM. The STR data is consistent with a parent-child relationship between bone specimen AA32 and LM the daughter of AM.
Locus
MM Wife of AM
LM
Daughter of AM
Bone
Specimen AA32
Result
TH01 7 7 7 10 7 7 Not excluded
CFS1PO 10 12 6 11 6 10 Not excluded TPOX 8 10 8 11 8 10 Not excluded
D5S818 12 12 11 12 11 12 Not excluded D8S1179 12 15 12 15 12 15 Not excluded D16S539 10 11 11 11 10 11 Not excluded
FGA 23 25 23 24 24 25 Not excluded D21S11 28 29 32.2 34.2 29 32.2 Not excluded D7S820 8 10 13 13 8 13 Not excluded
vWA 16 18 15 17 15 18 Not excluded D18S51 17 18 13 15 15 17 Not excluded
D13S317 11 13 11 14 11 14 Not excluded D3S1358 15 16 15 15 15 16 Not excluded
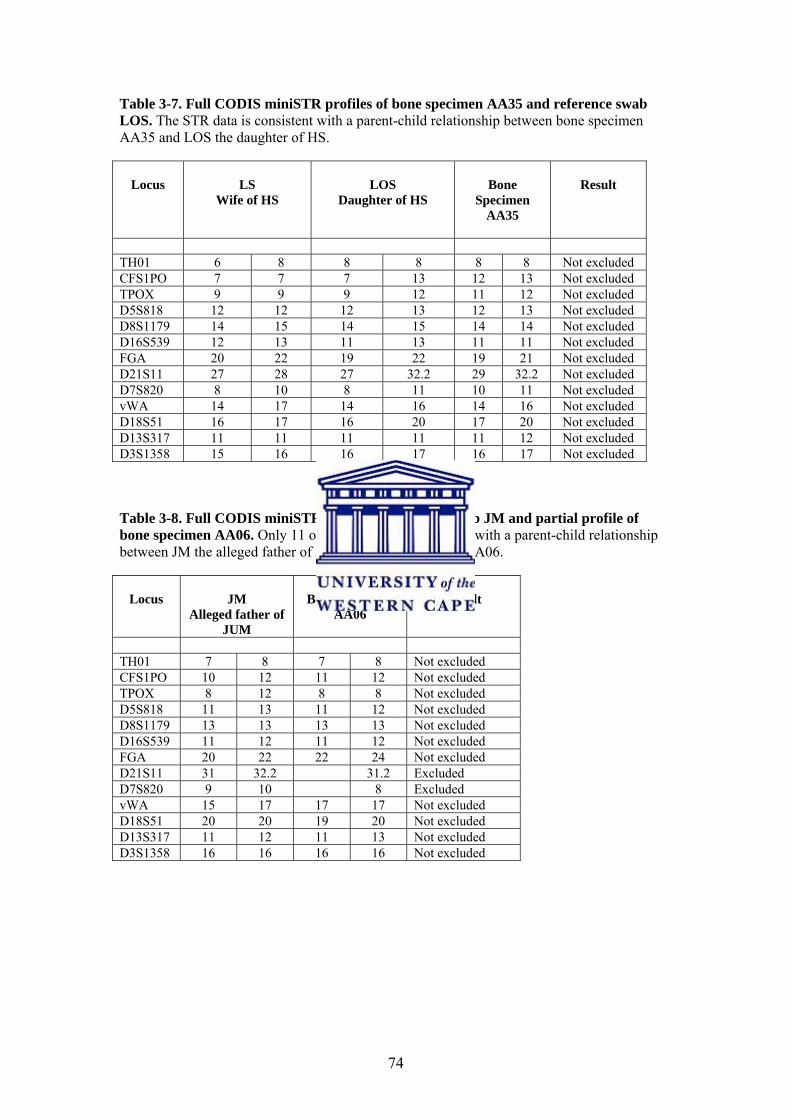
74
Table 3-7. Full CODIS miniSTR profiles of bone specimen AA35 and reference swab LOS. The STR data is consistent with a parent-child relationship between bone specimen AA35 and LOS the daughter of HS.
Locus
LS
Wife of HS
LOS
Daughter of HS
Bone
Specimen AA35
Result
TH01 6 8 8 8 8 8 Not excluded CFS1PO 7 7 7 13 12 13 Not excluded TPOX 9 9 9 12 11 12 Not excluded D5S818 12 12 12 13 12 13 Not excluded D8S1179 14 15 14 15 14 14 Not excluded D16S539 12 13 11 13 11 11 Not excluded FGA 20 22 19 22 19 21 Not excluded D21S11 27 28 27 32.2 29 32.2 Not excluded D7S820 8 10 8 11 10 11 Not excluded vWA 14 17 14 16 14 16 Not excluded D18S51 16 17 16 20 17 20 Not excluded D13S317 11 11 11 11 11 12 Not excluded D3S1358 15 16 16 17 16 17 Not excluded Table 3-8. Full CODIS miniSTR profile of reference swab JM and partial profile of bone specimen AA06. Only 11 out of 13 loci are consistent with a parent-child relationship between JM the alleged father of JUM and bone specimen AA06.
Locus
JM
Alleged father of JUM
Bone Specimen
AA06
Result
TH01 7 8 7 8 Not excluded CFS1PO 10 12 11 12 Not excluded TPOX 8 12 8 8 Not excluded D5S818 11 13 11 12 Not excluded D8S1179 13 13 13 13 Not excluded D16S539 11 12 11 12 Not excluded FGA 20 22 22 24 Not excluded D21S11 31 32.2 31.2 Excluded D7S820 9 10 8 Excluded vWA 15 17 17 17 Not excluded D18S51 20 20 19 20 Not excluded D13S317 11 12 11 13 Not excluded D3S1358 16 16 16 16 Not excluded
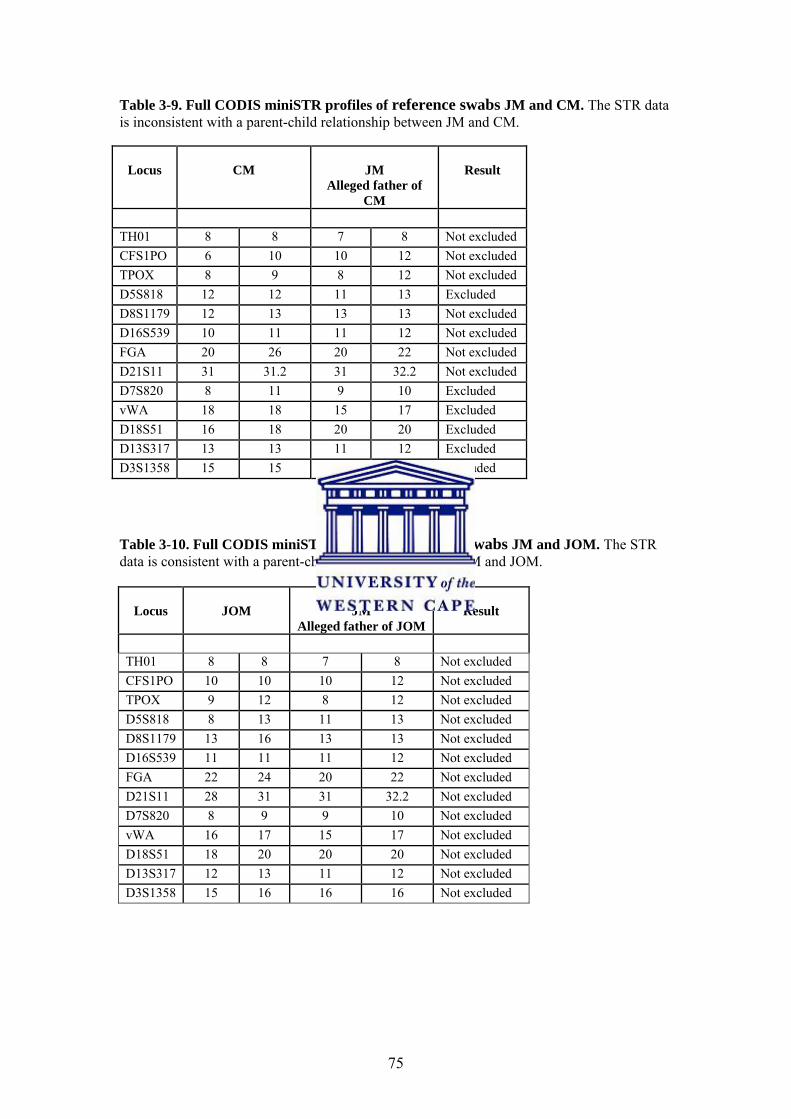
75
Table 3-9. Full CODIS miniSTR profiles of reference swabs JM and CM. The STR data is inconsistent with a parent-child relationship between JM and CM.
Locus
CM
JM
Alleged father of CM
Result
TH01 8 8 7 8 Not excluded CFS1PO 6 10 10 12 Not excluded TPOX 8 9 8 12 Not excluded D5S818 12 12 11 13 Excluded D8S1179 12 13 13 13 Not excluded D16S539 10 11 11 12 Not excluded FGA 20 26 20 22 Not excluded D21S11 31 31.2 31 32.2 Not excluded D7S820 8 11 9 10 Excluded vWA 18 18 15 17 Excluded D18S51 16 18 20 20 Excluded D13S317 13 13 11 12 Excluded D3S1358 15 15 16 16 Excluded
Table 3-10. Full CODIS miniSTR profiles of reference swabs JM and JOM. The STR data is consistent with a parent-child relationship between JM and JOM.
Locus
JOM
JM
Alleged father of JOM
Result
TH01 8 8 7 8 Not excluded CFS1PO 10 10 10 12 Not excluded TPOX 9 12 8 12 Not excluded D5S818 8 13 11 13 Not excluded D8S1179 13 16 13 13 Not excluded D16S539 11 11 11 12 Not excluded FGA 22 24 20 22 Not excluded D21S11 28 31 31 32.2 Not excluded D7S820 8 9 9 10 Not excluded vWA 16 17 15 17 Not excluded D18S51 18 20 20 20 Not excluded D13S317 12 13 11 12 Not excluded D3S1358 15 16 16 16 Not excluded
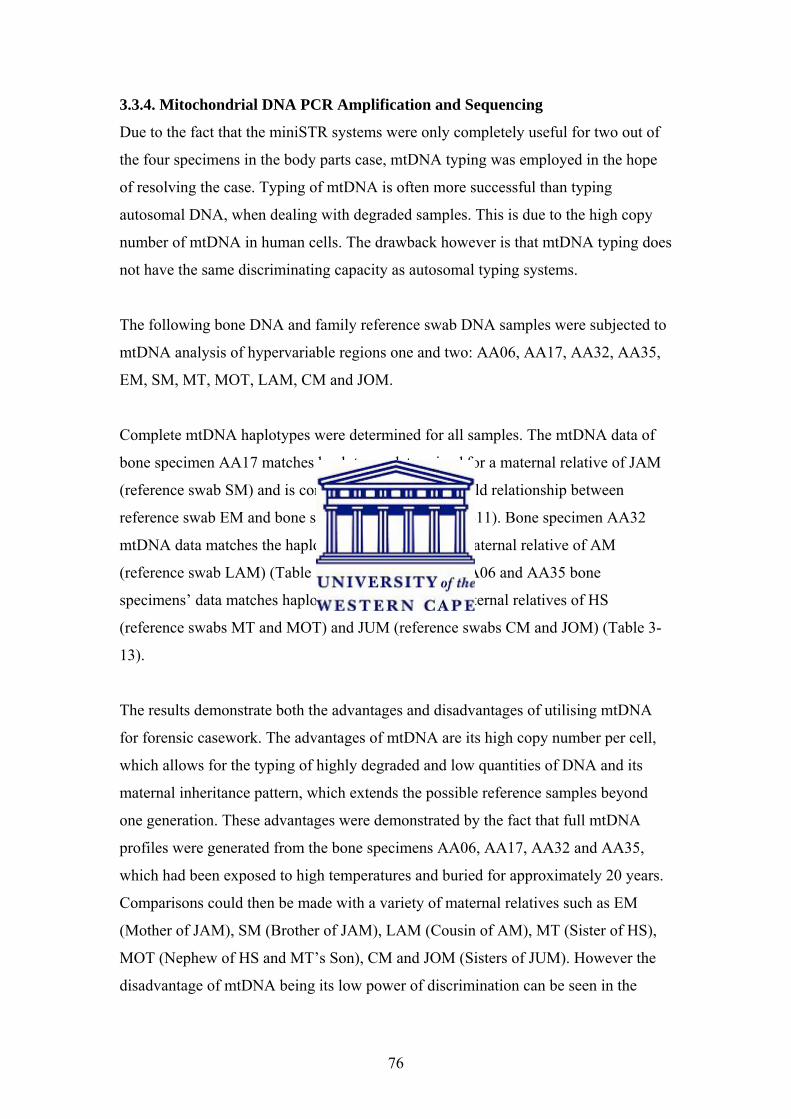
76
3.3.4. Mitochondrial DNA PCR Amplification and Sequencing
Due to the fact that the miniSTR systems were only completely useful for two out of
the four specimens in the body parts case, mtDNA typing was employed in the hope
of resolving the case. Typing of mtDNA is often more successful than typing
autosomal DNA, when dealing with degraded samples. This is due to the high copy
number of mtDNA in human cells. The drawback however is that mtDNA typing does
not have the same discriminating capacity as autosomal typing systems.
The following bone DNA and family reference swab DNA samples were subjected to
mtDNA analysis of hypervariable regions one and two: AA06, AA17, AA32, AA35,
EM, SM, MT, MOT, LAM, CM and JOM.
Complete mtDNA haplotypes were determined for all samples. The mtDNA data of
bone specimen AA17 matches haplotypes determined for a maternal relative of JAM
(reference swab SM) and is consistent with a parent-child relationship between
reference swab EM and bone specimen AA17 (Table 3-11). Bone specimen AA32
mtDNA data matches the haplotype determined for a maternal relative of AM
(reference swab LAM) (Table 3-12). While both the AA06 and AA35 bone
specimens’ data matches haplotypes determined for maternal relatives of HS
(reference swabs MT and MOT) and JUM (reference swabs CM and JOM) (Table 3-
13).
The results demonstrate both the advantages and disadvantages of utilising mtDNA
for forensic casework. The advantages of mtDNA are its high copy number per cell,
which allows for the typing of highly degraded and low quantities of DNA and its
maternal inheritance pattern, which extends the possible reference samples beyond
one generation. These advantages were demonstrated by the fact that full mtDNA
profiles were generated from the bone specimens AA06, AA17, AA32 and AA35,
which had been exposed to high temperatures and buried for approximately 20 years.
Comparisons could then be made with a variety of maternal relatives such as EM
(Mother of JAM), SM (Brother of JAM), LAM (Cousin of AM), MT (Sister of HS),
MOT (Nephew of HS and MT’s Son), CM and JOM (Sisters of JUM). However the
disadvantage of mtDNA being its low power of discrimination can be seen in the
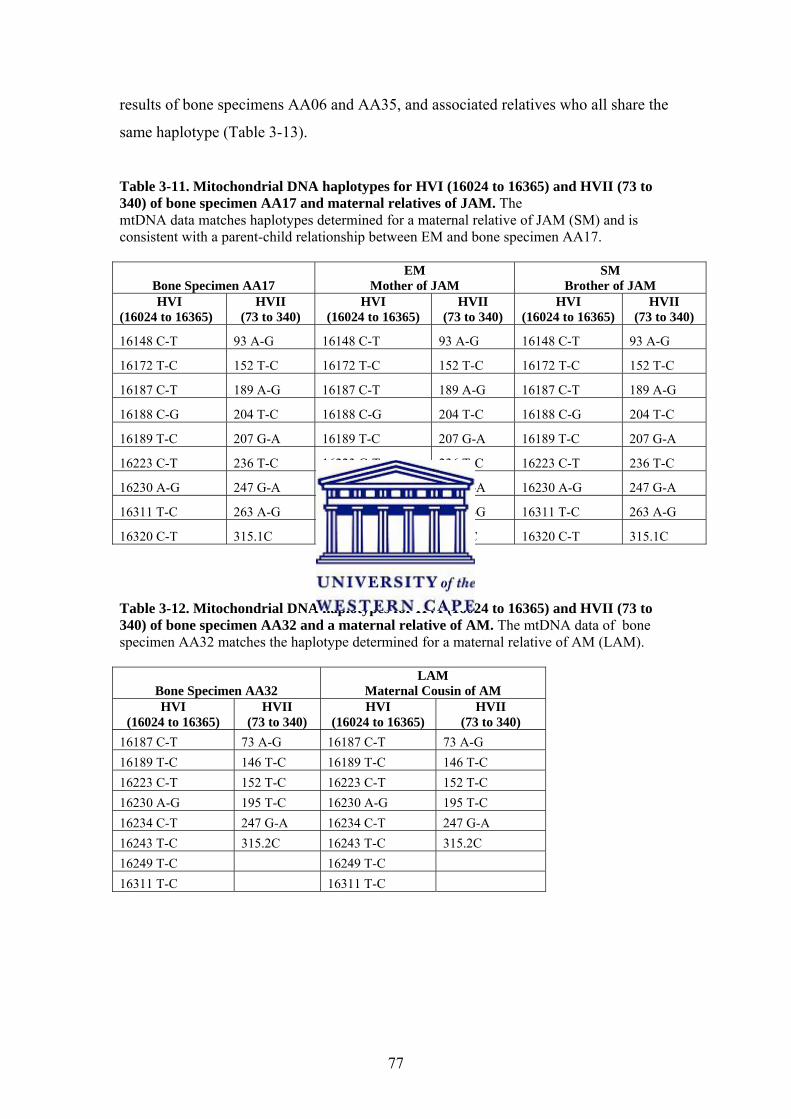
77
results of bone specimens AA06 and AA35, and associated relatives who all share the
same haplotype (Table 3-13).
Table 3-11. Mitochondrial DNA haplotypes for HVI (16024 to 16365) and HVII (73 to 340) of bone specimen AA17 and maternal relatives of JAM. The mtDNA data matches haplotypes determined for a maternal relative of JAM (SM) and is consistent with a parent-child relationship between EM and bone specimen AA17.
Bone Specimen AA17 EM
Mother of JAM SM
Brother of JAM HVI
(16024 to 16365) HVII
(73 to 340) HVI
(16024 to 16365) HVII
(73 to 340) HVI
(16024 to 16365) HVII
(73 to 340)
16148 C-T 93 A-G 16148 C-T 93 A-G 16148 C-T 93 A-G
16172 T-C 152 T-C 16172 T-C 152 T-C 16172 T-C 152 T-C
16187 C-T 189 A-G 16187 C-T 189 A-G 16187 C-T 189 A-G
16188 C-G 204 T-C 16188 C-G 204 T-C 16188 C-G 204 T-C
16189 T-C 207 G-A 16189 T-C 207 G-A 16189 T-C 207 G-A
16223 C-T 236 T-C 16223 C-T 236 T-C 16223 C-T 236 T-C
16230 A-G 247 G-A 16230 A-G 247 G-A 16230 A-G 247 G-A
16311 T-C 263 A-G 16311 T-C 263 A-G 16311 T-C 263 A-G
16320 C-T 315.1C 16320 C-T 315.1C 16320 C-T 315.1C
Table 3-12. Mitochondrial DNA haplotypes for HVI (16024 to 16365) and HVII (73 to 340) of bone specimen AA32 and a maternal relative of AM. The mtDNA data of bone specimen AA32 matches the haplotype determined for a maternal relative of AM (LAM).
Bone Specimen AA32 LAM
Maternal Cousin of AM HVI
(16024 to 16365) HVII
(73 to 340) HVI
(16024 to 16365) HVII
(73 to 340) 16187 C-T 73 A-G 16187 C-T 73 A-G 16189 T-C 146 T-C 16189 T-C 146 T-C 16223 C-T 152 T-C 16223 C-T 152 T-C 16230 A-G 195 T-C 16230 A-G 195 T-C 16234 C-T 247 G-A 16234 C-T 247 G-A 16243 T-C 315.2C 16243 T-C 315.2C 16249 T-C 16249 T-C 16311 T-C 16311 T-C
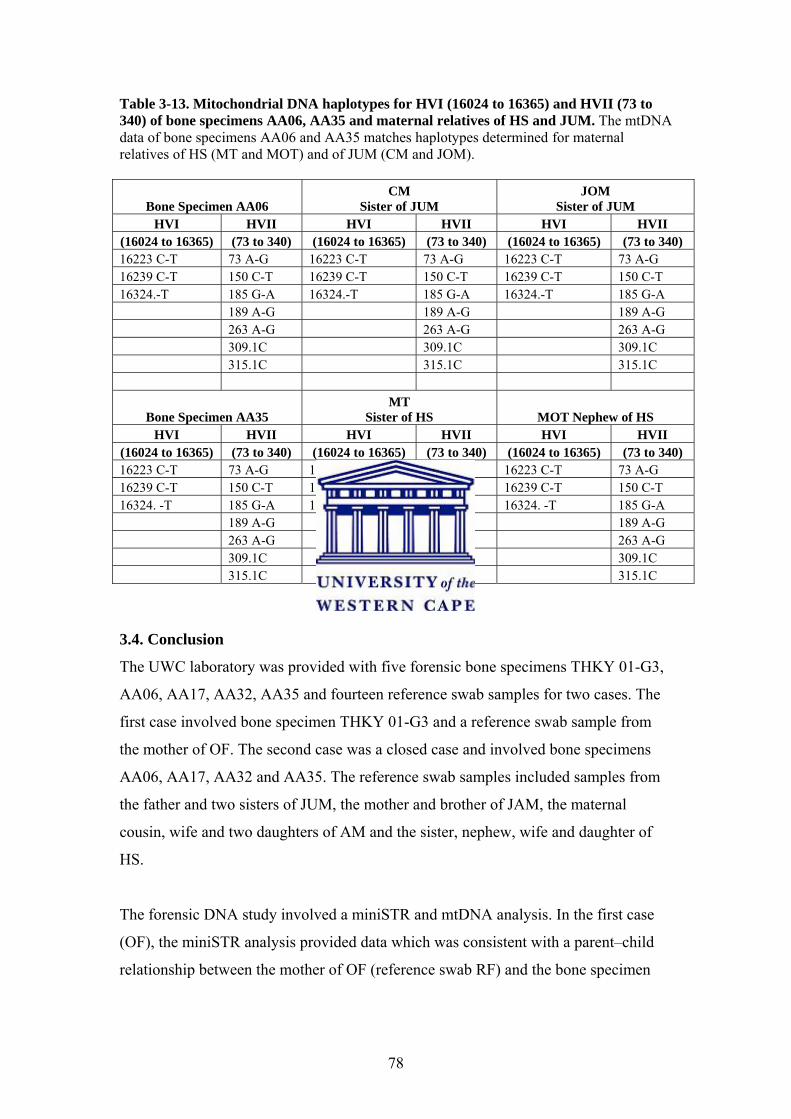
78
Table 3-13. Mitochondrial DNA haplotypes for HVI (16024 to 16365) and HVII (73 to 340) of bone specimens AA06, AA35 and maternal relatives of HS and JUM. The mtDNA data of bone specimens AA06 and AA35 matches haplotypes determined for maternal relatives of HS (MT and MOT) and of JUM (CM and JOM).
Bone Specimen AA06 CM
Sister of JUM JOM
Sister of JUM HVI HVII HVI HVII HVI HVII
(16024 to 16365) (73 to 340) (16024 to 16365) (73 to 340) (16024 to 16365) (73 to 340) 16223 C-T 73 A-G 16223 C-T 73 A-G 16223 C-T 73 A-G 16239 C-T 150 C-T 16239 C-T 150 C-T 16239 C-T 150 C-T 16324.-T 185 G-A 16324.-T 185 G-A 16324.-T 185 G-A 189 A-G 189 A-G 189 A-G 263 A-G 263 A-G 263 A-G 309.1C 309.1C 309.1C 315.1C 315.1C 315.1C
Bone Specimen AA35 MT
Sister of HS MOT Nephew of HS HVI HVII HVI HVII HVI HVII
(16024 to 16365) (73 to 340) (16024 to 16365) (73 to 340) (16024 to 16365) (73 to 340) 16223 C-T 73 A-G 16223 C-T 73 A-G 16223 C-T 73 A-G 16239 C-T 150 C-T 16239 C-T 150 C-T 16239 C-T 150 C-T 16324. -T 185 G-A 16324. -T 185 G-A 16324. -T 185 G-A 189 A-G 189 A-G 189 A-G 263 A-G 263 A-G 263 A-G 309.1C 309.1C 309.1C 315.1C 315.1C 315.1C
3.4. Conclusion
The UWC laboratory was provided with five forensic bone specimens THKY 01-G3,
AA06, AA17, AA32, AA35 and fourteen reference swab samples for two cases. The
first case involved bone specimen THKY 01-G3 and a reference swab sample from
the mother of OF. The second case was a closed case and involved bone specimens
AA06, AA17, AA32 and AA35. The reference swab samples included samples from
the father and two sisters of JUM, the mother and brother of JAM, the maternal
cousin, wife and two daughters of AM and the sister, nephew, wife and daughter of
HS.
The forensic DNA study involved a miniSTR and mtDNA analysis. In the first case
(OF), the miniSTR analysis provided data which was consistent with a parent–child
relationship between the mother of OF (reference swab RF) and the bone specimen

79
THKY 01-G3. This data augmented the non-DNA evidence supporting the hypothesis
that bone specimen THKY 01-G3 was derived from OF.
In the second case (Body Parts), the miniSTR analysis could only resolve the
identities of two (AA32 and AA35) of the four bone specimens. The miniSTR data
was consistent with a parent–child relationship between bone specimen AA32 and the
daughters of AM (reference swabs KM and LM). The data was also consistent with a
parent-child relationship between bone specimen AA35 and the daughter of HS
(reference swab LOS). The data generated for bone specimen AA06 was ambiguous
and no reliable data was recovered from bone specimen AA17.
To further resolve the case mtDNA analysis was conducted. For bone specimens
AA17 and AA32 the mtDNA data indicates relationships which were consistent with
the results for the miniSTR analysis. For AA06 and AA35 a shared haplotype was
observed. This haplotype was also shared with the relatives of JUM and HS. MiniSTR
data had already indicated that AA35 was derived from HS. By a process of
elimination this suggested that AA06 was derived from JUM. These data augmented
the non-DNA evidence supporting the hypothesis that the bone specimens AA06,
AA17, AA32 and AA35 were derived from JUM, JAM, AM and HS.
80
Chapter 4: Case Study 2: DNA Analysis of 44 year old Human Skeletal Remains
Note: Names have been coded to protect the identities of the individuals involved.
For further details about the cases contact the Forensic DNA Laboratory at the
University of the Western Cape.
4.1. Introduction
LN was born on May 22, 1922, in Langa Cape Town and grew up in KwaZali village
in the Eastern Cape and became the first detainee to die under the 90-Day Detention
Act in 1963 (http://www.cosatu.org.za/press/2006/sept/press6.htm,
http://www.star.co.za). LN was a significant activist yet his role is not widely
appreciated. Therefore it seems appropriate to place the case in context by considering
his political life, the events that led to his death and the 44 year search for his remains.
LN joined the ANC in the 1950s and in 1961 when the ANC established a military
wing, uMkhonto weSizwe (MK), he became an MK commander. He joined the ANC
after he witnessed forced removals and the use of bulldozers to demolish black-owned
houses to create space for white suburbs. There was a marked change in his
perspective. Politics consumed his life and when the ANC established a military wing
(uMkhonto weSizwe) it was a natural step for him to join the armed struggle.
LN became the MK commander of the Western Cape and soon started recruiting
operatives and training them. He and a friend DG, a technical officer, started a
training camp at Mamre. The camp taught recruits how to make electric circuits for
bombs, how to read a compass and first aid. The unit successfully carried out various
acts of sabotage.
The police had been monitoring LN’s movements for years because of information
presented in his speeches. This information made its way to Justice Minister John
Vorster and a focus was placed on LN. He was constantly harassed by security police
and was jailed on several occasions. However these incidents required both a charge
and court appearance within two days of arrest.

81
On May 1, 1963, Justice Minister John Vorster introduced the 90-day Detention Act.
The detention act provided the security police and military intelligence with greater
opportunity to interrogate and torture suspects. Abuse was common because the act
allowed for the solitary confinement of detainees without charge or trial for renewable
periods, without access to family or lawyers (http://www.star.co.za).
LN went into hiding when the high command of MK was captured just two months
after the introduction of the detention act. However information from an informer led
to him being arrested on August 19, 1963. He was taken to Caledon Square police
station in Cape Town and then transferred to Pretoria Central Prison a few days later.
LN was tortured and died shortly after arriving in Pretoria.
An inquest was held into the death of LN by his families’ lawyers. At the inquest a
District Surgeon as well as the security police claimed that LN committed suicide.
The lawyers argued that if he had committed suicide then it would surely have been as
a result of extensive and severe torture
(http://www.info.gov.za/speeches/2007/07030215151001.htm). This claim was denied
by the surgeon and the police. The Detention Act had served its purpose by removing
the influence of the courts. The situation for the family was further exacerbated by
continued police harassment.
The family continued the search for LN’s remains. By the time the Truth and
Reconciliation Commission (TRC) was setup they had been searching for over thirty
years. At the TRC, GM was the only key figure to testify. The two had been held in
Pretoria Central Prison at the same time. In a chance meeting LN had confided details
of his abuse in a note to GM. No one else came forward with information or applied
for amnesty for the incident. LN’s widow Beauty then requested that the TRC set up
an investigation and search for her husbands remains. This investigation led nowhere
and the family were no closer to finding his remains.
In 2007 the Missing Persons Task Team reinvestigated the whereabouts of LN’s
remains. After an extensive search a grave register was discovered with LN’s name, a
grave number and a cemetery map. The map indicated that his grave was located in
the middle of the Mamelodi West Cemetery near Pretoria. A Land Surveyor was used
82
by the team to identify the grave according to the cemetery map. The remains were
exhumed and a preliminary anthropological assessment of the skeleton suggested that
its age was consistent with that of LN at the time of his death. To augment the
existing evidence, the remains were sent to the Forensic DNA Laboratory at UWC
where genotyping was carried out. The genotyping presented in this chapter was
duplicated by another investigator and a consensus has been presented below.
4.2. Materials and Methods
4.2.1. Sample Collection and Preparation
Family reference samples and skeletal remains were sent to UWC by the South
African Missing Persons Task Team (SAMPTT). A total of 6 reference buccal swabs
and one femur were received. The reference samples included LN’s two sons and his
brother and three unrelated controls. The femur was stored in a paper bag at room
temperature prior to sampling, cleaning and DNA analysis. The femur was prepared
for DNA extraction as previously described (Chapter 3, section 3.2.2).
4.2.2. DNA Extraction
The family reference buccal swab samples were either extracted using the Chelex
extraction method or the Epicenter buccal swab extraction kit used according to the
manufactures instructions. Reference buccal swabs samples were extracted following
the Chelex protocol described in the Applied Biosystems Profiler Plus User Manual.
The step by step protocol for this method can be found in Appendix I. DNA was
extracted from the milled bone samples using the organic extraction method
previously described (Hagelberg et al. 1989).
4.2.3. DNA Quantification
All samples were quantified using a previously published assay (Nicklas et al. 2003).
The assay relies on the amplification of a 124bp ALU fragment. The assay was
conducted on a Roche LightCycler 1 instrument using the LightCycler Fast Start
SYBR GREEN kit.
4.2.4. MiniSTR PCR Amplification
Samples were amplified as previously described (Chapter 3, section 3.2.5).
83
4.2.5. Y-STR PCR Amplification
A Y-STR multiplex assay designed by Dr. Maria Eugenia D’Amato from the Forensic
DNA Laboratory at the University of the Western Cape (UWC) was used. The assay
includes the markers DYS385, DYS518, DYS449, DYS504, DYS626, DYS447,
DYS644, DYS612, DYS481, DYS710 and DYS710I. The development and
validation of this assay will form the basis of a separate publication by the UWC
forensic laboratory.
4.2.6. Detection and Data Analysis
Amplicons were analysed using an ABI PRISM 377 DNA Sequencer. The data was
collected with the ABI 377 collection software (Applied Biosystems), analyzed using
GeneScan 3.0.0 software (Applied Biosystems). Allele designations were
automatically assigned using Genotyper 3.7 software (Applied Biosystems). The
profiles were evaluated both manually and using the excel program
STR_MatchSamples that was developed by David Duewer, Analytical Chemical
Division, NIST. The methods were previously described in Chapter 2, section 2.2.4.
4.3. Results and Discussion
4.3.1. DNA Quantification
The DNA concentrations of all the family reference swab samples as well as the bone
samples were determined. Table 4-1 presents the DNA concentrations of reference
buccal swab DNA samples and Table 4-2 presents the DNA concentration of the bone
DNA sample.
Table 4-1. DNA Concentrations of Reference Buccal Swab DNA Samples
Victim Reference
Swab Samples
DNA Concentration (ng/ul)
LN 1. DNA_01_03_07 14.08 2. DNA_02_03_07 1.72 3. DNA_03_03_07 14.32 4. DNA_04_03_07 11.40 5. DNA_05_03_07 27.28 6. DNA_06_03_07 8.36
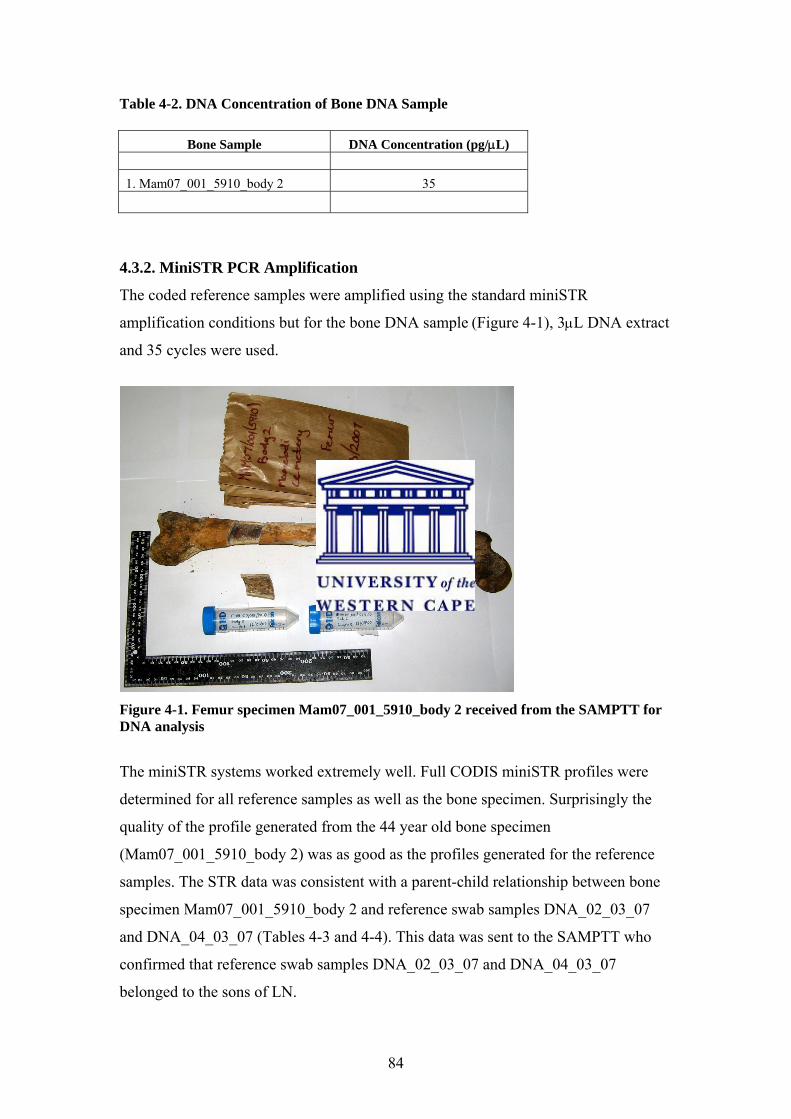
84
Table 4-2. DNA Concentration of Bone DNA Sample
Bone Sample DNA Concentration (pg/μL)
1. Mam07_001_5910_body 2 35
4.3.2. MiniSTR PCR Amplification
The coded reference samples were amplified using the standard miniSTR
amplification conditions but for the bone DNA sample (Figure 4-1), 3μL DNA extract
and 35 cycles were used.
Figure 4-1. Femur specimen Mam07_001_5910_body 2 received from the SAMPTT for DNA analysis
The miniSTR systems worked extremely well. Full CODIS miniSTR profiles were
determined for all reference samples as well as the bone specimen. Surprisingly the
quality of the profile generated from the 44 year old bone specimen
(Mam07_001_5910_body 2) was as good as the profiles generated for the reference
samples. The STR data was consistent with a parent-child relationship between bone
specimen Mam07_001_5910_body 2 and reference swab samples DNA_02_03_07
and DNA_04_03_07 (Tables 4-3 and 4-4). This data was sent to the SAMPTT who
confirmed that reference swab samples DNA_02_03_07 and DNA_04_03_07
belonged to the sons of LN.
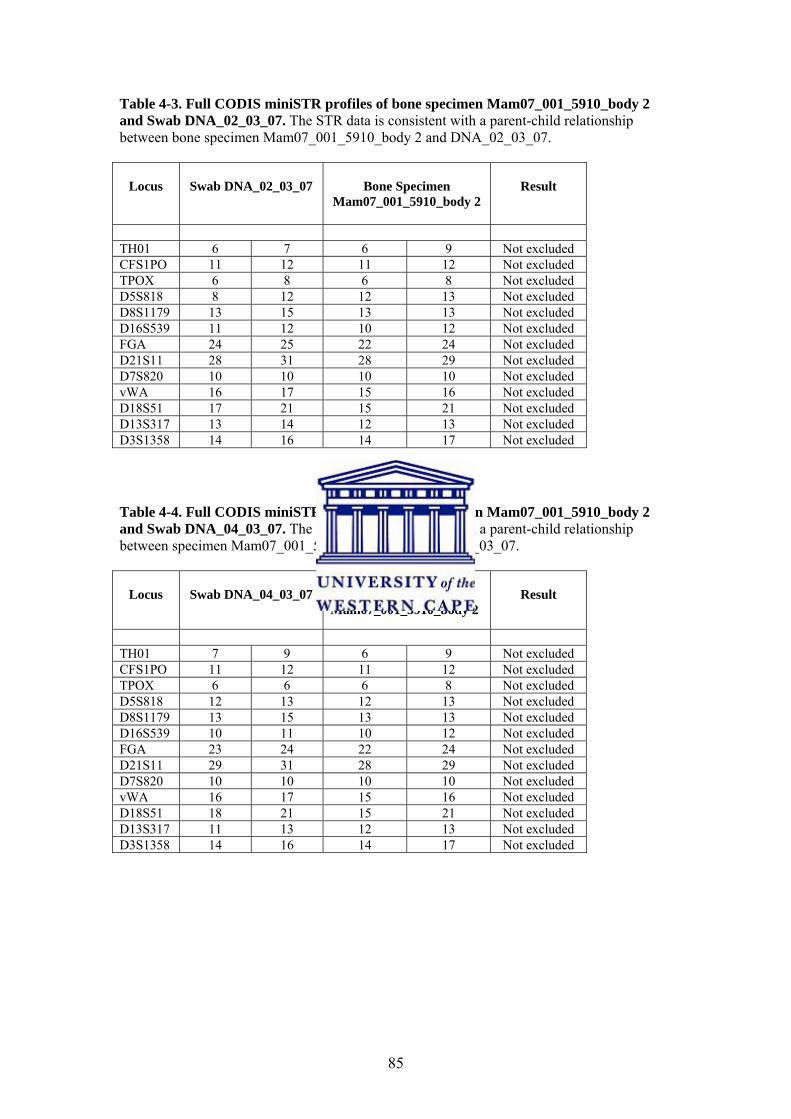
85
Table 4-3. Full CODIS miniSTR profiles of bone specimen Mam07_001_5910_body 2 and Swab DNA_02_03_07. The STR data is consistent with a parent-child relationship between bone specimen Mam07_001_5910_body 2 and DNA_02_03_07.
Locus
Swab DNA_02_03_07
Bone Specimen
Mam07_001_5910_body 2
Result
TH01 6 7 6 9 Not excluded CFS1PO 11 12 11 12 Not excluded TPOX 6 8 6 8 Not excluded D5S818 8 12 12 13 Not excluded D8S1179 13 15 13 13 Not excluded D16S539 11 12 10 12 Not excluded FGA 24 25 22 24 Not excluded D21S11 28 31 28 29 Not excluded D7S820 10 10 10 10 Not excluded vWA 16 17 15 16 Not excluded D18S51 17 21 15 21 Not excluded D13S317 13 14 12 13 Not excluded D3S1358 14 16 14 17 Not excluded
Table 4-4. Full CODIS miniSTR profiles of bone specimen Mam07_001_5910_body 2 and Swab DNA_04_03_07. The STR data is consistent with a parent-child relationship between specimen Mam07_001_5910_body 2 and DNA_04_03_07.
Locus
Swab DNA_04_03_07
Bone Specimen
Mam07_001_5910_body 2
Result
TH01 7 9 6 9 Not excluded CFS1PO 11 12 11 12 Not excluded TPOX 6 6 6 8 Not excluded D5S818 12 13 12 13 Not excluded D8S1179 13 15 13 13 Not excluded D16S539 10 11 10 12 Not excluded FGA 23 24 22 24 Not excluded D21S11 29 31 28 29 Not excluded D7S820 10 10 10 10 Not excluded vWA 16 17 15 16 Not excluded D18S51 18 21 15 21 Not excluded D13S317 11 13 12 13 Not excluded D3S1358 14 16 14 17 Not excluded

86
4.3.3. Y-STR PCR Amplification As previously indicated, the six coded reference samples included three unrelated
controls, two swabs from his sons and one from his brother. This meant that three of
the reference samples shared a paternal lineage with LN. The autosomal miniSTR
analysis was useful in confirming the parent-child relationships between specimen
Mam07_001_5910 and the two reference swab samples from LN’s sons
(DNA_02_03_07 and DNA_04_03_07). However, the relationship between
Mam07_001_5910 and the sample from LN’s brother had yet to be established. To
address this Y-chromosome STR (Y-STR) analysis was used. The Y-STR analysis
would identify all references samples sharing a paternal lineage.
The Y-STR testing system being used is the subject of a parallel project in the
Forensic DNA laboratory at the UWC. The system has been developed to include a
highly discriminatory set of Y-Chromosome markers: DYS385, DYS518, DYS449,
DYS504, DYS626, DYS447, DYS644, DYS612, DYS481, DYS710 and DYS710I.
Full Y-STR profiles were determined for all reference samples as well as the bone
specimen. The data indicated that bone specimen Mam07_001_5910_body 2 shared a
paternal lineage with reference swab samples DNA_02_03_07, DNA_04_03_07 and
DNA_05_03_07 (Tables 4-5 to 4-7). This suggested that the reference swab sample
DNA_05_03_07 was from the brother of specimen Mam07_001_5910_body 2. This
was confirmed by the South African Missing Persons Task Team (SAMPTT).
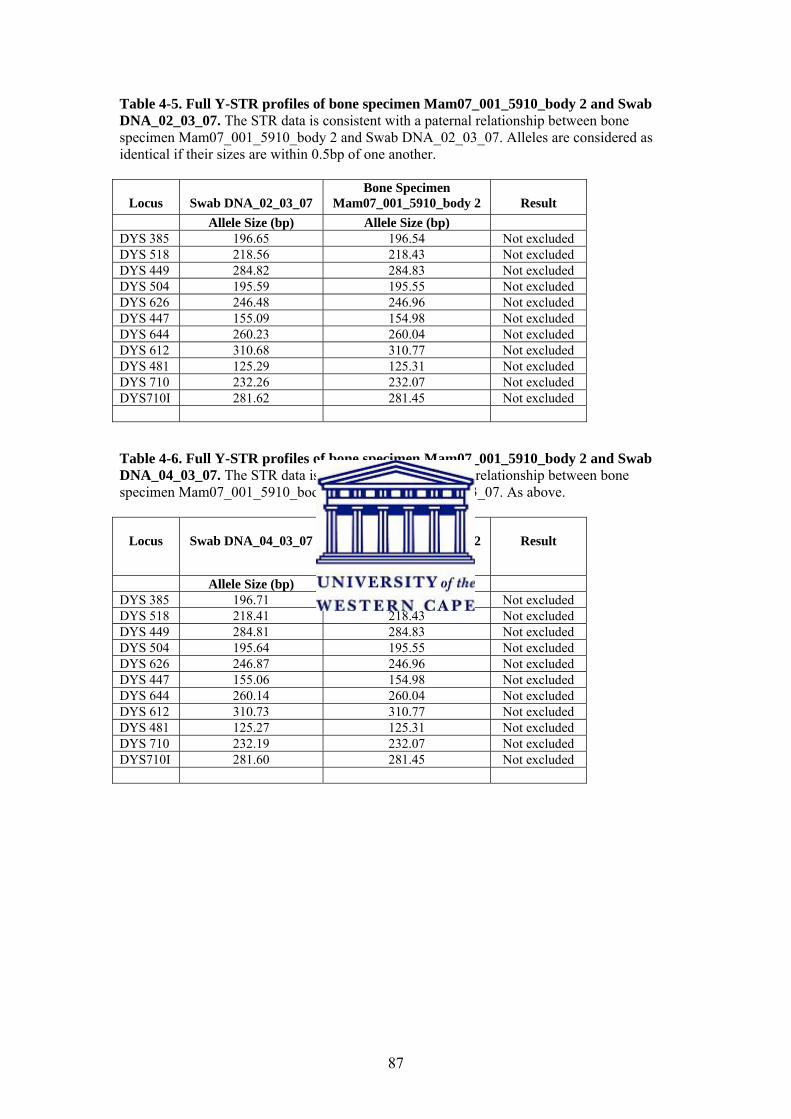
87
Table 4-5. Full Y-STR profiles of bone specimen Mam07_001_5910_body 2 and Swab DNA_02_03_07. The STR data is consistent with a paternal relationship between bone specimen Mam07_001_5910_body 2 and Swab DNA_02_03_07. Alleles are considered as identical if their sizes are within 0.5bp of one another.
Locus
Swab DNA_02_03_07
Bone Specimen Mam07_001_5910_body 2
Result
Allele Size (bp) Allele Size (bp) DYS 385 196.65 196.54 Not excluded DYS 518 218.56 218.43 Not excluded DYS 449 284.82 284.83 Not excluded DYS 504 195.59 195.55 Not excluded DYS 626 246.48 246.96 Not excluded DYS 447 155.09 154.98 Not excluded DYS 644 260.23 260.04 Not excluded DYS 612 310.68 310.77 Not excluded DYS 481 125.29 125.31 Not excluded DYS 710 232.26 232.07 Not excluded DYS710I 281.62 281.45 Not excluded
Table 4-6. Full Y-STR profiles of bone specimen Mam07_001_5910_body 2 and Swab DNA_04_03_07. The STR data is consistent with a paternal relationship between bone specimen Mam07_001_5910_body 2 and Swab DNA_04_03_07. As above.
Locus
Swab DNA_04_03_07
Bone Specimen Mam07_001_5910_body 2
Result
Allele Size (bp) Allele Size (bp) DYS 385 196.71 196.54 Not excluded DYS 518 218.41 218.43 Not excluded DYS 449 284.81 284.83 Not excluded DYS 504 195.64 195.55 Not excluded DYS 626 246.87 246.96 Not excluded DYS 447 155.06 154.98 Not excluded DYS 644 260.14 260.04 Not excluded DYS 612 310.73 310.77 Not excluded DYS 481 125.27 125.31 Not excluded DYS 710 232.19 232.07 Not excluded DYS710I 281.60 281.45 Not excluded
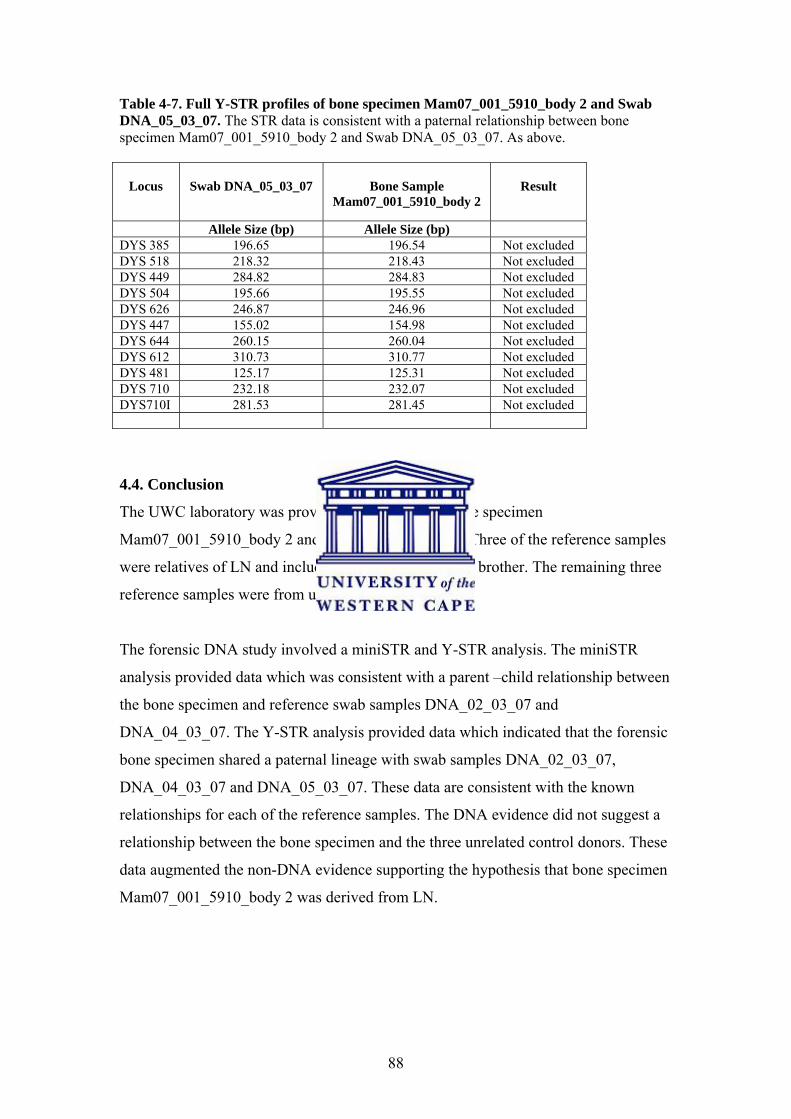
88
Table 4-7. Full Y-STR profiles of bone specimen Mam07_001_5910_body 2 and Swab DNA_05_03_07. The STR data is consistent with a paternal relationship between bone specimen Mam07_001_5910_body 2 and Swab DNA_05_03_07. As above.
Locus
Swab DNA_05_03_07
Bone Sample
Mam07_001_5910_body 2
Result
Allele Size (bp) Allele Size (bp) DYS 385 196.65 196.54 Not excluded DYS 518 218.32 218.43 Not excluded DYS 449 284.82 284.83 Not excluded DYS 504 195.66 195.55 Not excluded DYS 626 246.87 246.96 Not excluded DYS 447 155.02 154.98 Not excluded DYS 644 260.15 260.04 Not excluded DYS 612 310.73 310.77 Not excluded DYS 481 125.17 125.31 Not excluded DYS 710 232.18 232.07 Not excluded DYS710I 281.53 281.45 Not excluded
4.4. Conclusion
The UWC laboratory was provided with a forensic bone specimen
Mam07_001_5910_body 2 and six reference samples. Three of the reference samples
were relatives of LN and included his two sons and one brother. The remaining three
reference samples were from unrelated control donors.
The forensic DNA study involved a miniSTR and Y-STR analysis. The miniSTR
analysis provided data which was consistent with a parent –child relationship between
the bone specimen and reference swab samples DNA_02_03_07 and
DNA_04_03_07. The Y-STR analysis provided data which indicated that the forensic
bone specimen shared a paternal lineage with swab samples DNA_02_03_07,
DNA_04_03_07 and DNA_05_03_07. These data are consistent with the known
relationships for each of the reference samples. The DNA evidence did not suggest a
relationship between the bone specimen and the three unrelated control donors. These
data augmented the non-DNA evidence supporting the hypothesis that bone specimen
Mam07_001_5910_body 2 was derived from LN.
89
References Alonso, A.; Martin, P.; Albarran, C.; Garcia, P.; de Simon, L.F.; Jesus, I. M.; Fernandez-Rodriguez, A.; Atienza, I.; Capilla, J.; Garcia-Hirschfeld, J.; Martinez, P.; Vallejo, G.; Garcia, O.; Garcia, E.; Real, P.; Alvarez, D.; Leon, A.; Sancho, M. Challenges of DNA profiling in mass disaster investigations. Croat. Med. J. 2005, 46, 540-548. Barbaro, A.; Falcone, G.; Barbaro, A. DNA typing from hair shaft. Progress in Forensic Genetics 2000, 8, 523-525. Boom, R.; Sol, C.J.A.; Salimans, M.M.M.; Jansen, C.L.; Wertheim-van Dillen, P.M.E.; van der Noordaa, J. Rapid and Simple Method for Purification of Nucleic Acids. J. Clin. Microbiol. 1990, 28(3), 495-503. Budowle, B.; Bieber, F.R.; Eisenberg, A.J. Forensic aspects of mass disasters: strategic considerations for DNA-based human identification. Leg. Med. (Tokyo) 2005, 7, 230-243. Butler, J. M. Debunking Some Urban Legends Surrounding Validation Within the Forensic DNA Community. Profiles in DNA 2006, 3-6. Butler, J.M. Forensic DNA Typing: Biology and Technology Behind STR Markers, San Diego: Elsevier Academic Press, 2001; pp. 205-222. Butler, J.M. Forensic DNA Typing: biology, technology, and genetics of STR markers. 2nd Ed.; New York: Elsevier; 2005. Butler, J.M. Genetics and genomics of core short tandem repeat loci used in human identity testing. J. Forensic Sci. 2006, 51, 253-265. Butler, J.M. STR Analysis by Time-of-Flight Mass Spectrometry. Profiles in DNA 1999, 3-6. Butler, J.M.; Levin, B.C. Forensic applications of mitochondrial DNA. Trends Biotech. 1998, 16, 158–162. Butler, J.M.; Shen, Y.; McCord, B.R. The development of reduced size STR amplicons as tools for analysis of degraded DNA. J. Forensic Sci. 2003, 48(5), 1054-1064. Chung, D.T.; Drabek, J.; Opel, K.L.; Butler, J.M.; Mc Cord, B.R. A study on the effects of degradation and template concentration on the amplification efficiency of the STR Miniplex primer sets. J. Forensic Sci. 2004, 49, 733-740. Coble, M.D.; Butler, J.M. Characterization of new MiniSTR loci to Aid Analysis of Degraged DNA. J. Forensic Sci. 2005, 50, 43-53. Dixon, L.A.; Dobbins, A.E.; Pulker, H.K.; Butler, J.M.; Vallone, P.M.; Coble, M.D.; Parson, W.; Berger, B.; Grubwieser, P.; Mogensen, H.S.; Morling, N.; Nielsen, K.;

90
Sanchez, J.J.; Petkovski, E.; Carracedo, A.; Sanchez-Diz, P.; Ramos-Luis, E.; Brion, M.; Irwin, J.A.; Just, R.S.; Loreille, O.; Parsons, T.J.; Syndercombe-Court, D.; Schmitter, H.; Stradmann-Bellinghausen, B.; Bender, K.; Gill, P. Analysis of artificially degraded DNA using STRs and SNPs--results of a collaborative European (EDNAP) exercise. Forensic Sci. Int. 2006, 164, 33-44. Edson, S.M.; Ross, J.P.; Coble, M.D.; Parsons, T.J.; Barritt, S.M. Naming the Dead — Confronting the Realities of Rapid Identification of Degraded Skeletal Remains. Forensic Sci. Rev. 2004, 16, 64-89. Edwards, A.; Civitello, A.; Hammond, H.A.; Caskey, C.T. DNA typing and genetic mapping with trimeric and tetrameric tandem repeats. Am. J. Hum. Genet. 1991, 49, 746-756. Edwards, A.; Hammond, H.A.; Jin, L.; Caskey, C.T.; Chakraborty, R. Genetic variation at five trimeric and tetrameric tandem repeat loci in four human population groups. Genomics 1992, 12, 241-253. Eisenberg, A.J.; Aranda, X.G.; Planz, J.V. Evaluation of the AmpFlSTR® MiniFiler™ PCR Amplification Kit for Use with Compromised DNA Samples. Applied Biosystems, Forensic News, Customer Corner 2006. Gill, P.; Whitaker, J.; Flaxman, C.; Brown, N.; Buckleton, J. An investigation of the rigor of interpretation rules for STRs derived from less than 100 pg of DNA. Forensic Sci. Int. 2000, 112(1), 17-40. Gilbert, M.T.; Bandelt, H.J.; Hofreiter, M.; Barnes, I. Assessing ancient DNA studies. Trends Ecol. Evol. 2005, 20, 541-544. Gill, P.; Fereday, L.; Morling, N.; Schneider, P. M. New multiplexes for Europe-amendments and clarification of strategic development. Forensic Sci. Int. 2006, 163, 155-157. Gill, P.; Fereday, L.; Morling, N.; Schneider, P. M. The evolution of DNA databases-recommendations for new European STR loci. Forensic Sci. Int. 2006, 156, 242-244. Gill, P. Application of Low Copy Number DNA Profiling. Croat. Med. J. 2001, 42(3), 229-232. Gill, P.; Ivanov, P.L.; Kimpton, C.; Piercy, R.; Benson, N.; Tully, G. et al. Identification of the remains of the Romanov family by DNA analysis. Nat. Genet. 1994, 6, 130-135. Gilbert, M.T.P.; Hansen, A.J.; Willerslev, E.; Turner-Walker, G. Insights into the processes behind the contamination of degraded human teeth and bone samples with exogenous sources of DNA. International Journal of Osteoarchaeology 2006, 16, 156-164. Glen, T. Getting DNA from Old Dead Stuff. Unkown
91
Hagelberg, E. DNA in bone. In: Ancient DNA; Herrmann, B.; Hummel, S. Eds.; Springer-Verlag: New York, 1994; pp 195-204. Hagelberg, E.; Bell, L.; Allen T. et al. Analysis of ancient bone DNA: techniques and applications. Phil. Trans. R. Soc. Lond. 1991, 333, 399-407. Hagelberg, E.; Clegg, J.B. Isolation and characterisation of DNA from archaeological bone. Proc. R. Soc. Lond. 1991, B 244, 45-50.
Hagelberg, E.; Gray, I.G; Jeffreys, A.J. Identification of the skeletal remains of a murder victim by DNA analysis. Nature 1991, 352, 427-429. Hagelberg, E.; Sykes, B.; Hedges, R. Ancient bone DNA amplified. Nature 1989, 342, 485. Hagelberg, E.; Thomas, M.G.; Cook, C.E.; Sher, A.V.; Baryshnikov, G.F.; Lister, A.M. DNA from mammoth bones. Nature 1994, 370, 333-334.
Hebsgaard, M.B.; Phillips, M.J.; Willerslev, E. Geologically ancient DNA: fact or artefact?. Trends in Microbiology 2005, 13(5), 212-220. Hellmann, A.; Rohleder, U.; Schmitter, H.; Wittig, M. STR typing of human telogen hairs–a new approach. Int. J. Legal Med. 2001, 114(4–5), 269-273. Hoff-Olsen, P.; Mevag, B.; Staalstrom, E.; Hovde, B.; Egeland, T; Olaisen, B. Extraction of DNA from decomposed human tissue – An evaluation of five extraction methods for short tandem repeat typing. J. Forensic Sci. 1999, 105, 171-183. Holland, M.M.; Cave, C.A.; Holland, C.A.; Bille, T.W. Development of a quality, high throughput DNA analysis procedure for skeletal samples to assist with the identification of victims from the world trade center attacks. Croat. Med. J. 2003, 44, 264-272. Holland, M.M.; Parsons, T.J. Mitochondrial DNA sequence analysis - validation and use for forensic casework. Forensic Sci. Rev. 1999, 11, 21-50. Holt, C.L.; Buoncristiani, M.; Wallin, J.M.; Nguyen, T.; Lazaruk, K.D.; Walsh, P.S. TWGDAM validation of AmpFlSTR PCR amplification kits for forensic DNA casework. J. Forensic Sci. 2002, 47(1), 66-96. Hoss, H.; Paabo, S. DNA extraction from Pleistocene bones by a silica-based purification method. Nucleic Acids Res. 1993, 21(16), 3913-3914. Kashyap, V.K.; Sitalaximi, T.; Chattopadhyay, P.; Trivedi, R. DNA Profiling Technologies in Forensic Analysis. Int. J. Hum. Genet. 2004, 4(1), 11-30. Kemp, B.M.; Smith, D.G. Use of bleach to eliminate contaminating DNA from the surface of bones and teeth. Forensic Sci. Int. 2005, 154, 53-61.
92
Krenke, B.E.; Tereba, A.; Anderson, S.J.; Buel, E.; Culhane, S.; Finis, C.J.; et al. Validation of a 16-locus fluorescent multiplex system. J. Forensic Sci. 2002, 47(4), 773-785. Lindahl, T. Instability and decay of the primary structure of DNA. Nature 1993, 362, 709-715. Marchi, E. Methods Developed to identify Victims of the World Trade Center Disaster. American Laboratory 2004, 30-36. Martin, P.; Garcia, O.; Albarran, C.; Garcia, P.; Alonso, A. International Congress Series 2006, 1288, 522-525. MacHugh, D.E.; Edwards, C.J.; Bailey, J.F.; Bancroft, D.R.; Bradley, D.G. The Extraction and Analysis of Ancient DNA From Bone and Teeth: a Survey of Current Methodologies. Ancient Biomolecules 2000, 3, 81-102. Opel, K.L.; Chung, D.T.; Drabek, J.; Tatarek, N.E.; Jantz, L.M.; McCord, B.R. The application of miniplex primer sets in the analysis of degraded DNA from human skeletal remains. J. Forensic Sci. 2006, 51, 351-356. Paabo, S.; Poinar, H.; Serre, D.; Jaenicke-Despres, V.; Hebler, J.; Rohland, N.; Kuch, M.; Krause, J.; Vigilant, L.; Hofreiter, M. Genetic analyses from ancient DNA. Annu. Rev. Genet. 2004, 38, 645-679. Poinar, H.N. The top 10 list: criteria of authenticity for DNA from ancient and forensic samples. International Congress Series 2003, 1239, 575-579. Ricci, U.; Giovannucci Uzielli, M.L.; Klintschar, M. Modified primers for D12S391 and a modified silver staining technique. Int. J. Legal Med. 1999, 112(5), 342-344. Ritter, N. Missing Persons and Unidentified Remains: The Nations Silent Mass Disaster. NIJ Journal 2007, 256, 1-7. Sambrook, J.; Fritsch, E.F.; Maniatis, T. 1989. Molecular Cloning: A Laboratory Manual, second ed., Cold Spring Harbor Laboratory Press, Cold Spring Harbor, NY. Sampietro, M. L., M. T. Gilbert, O. Lao, D. Caramelli, M. Lari, J. Bertranpetit, and C. Lalueza-Fox. Tracking down human contamination in ancient human teeth. Mol. Biol. Evol. 2006, 23, 1801-1807. Schmerer, W.M.; Hummel, S.; Herrmann, B. Optimized DNA extraction to improve reproducibility of short tandem repeat genotyping with highly degraded DNA as target. Electrophoresis 1999, 20, 1712-1716. Sheppard, T.L.; Ordoukhanian, P.; Joyce, G.F. A DNA enzyme with N-glycosylase activity. Biochemistry 2000, 97, 7802-7807. Sifis, M.E.; Both, K.; Burgoyne, L.A. A more sensitive method for the quantitation of genomic DNA by Alu amplification. J. Forensic Sci. 2002, 47(3), 589-592.
93
Singer-Sam, J.; Tanguay, R.L.; Riggs, A.D. Use of Chelex to improve the PCR signal from a small number of cells. Amplifications 1989, 11(3), 11. Sonntag, C.V. Polynucleotides and DNA. The Chemical Basis of Radiation Biology, Taylor & Francis, Inc. Philadelphia, PA 1987; Chapter 9. Sweet, D.; Lorente, M.; Valenzuela, A.; Lorente, J.; Alvarez, J.C. Increasing DNA extraction yield from saliva stains with a modified Chelex method. Forensic Sci. Int. 1996, 83, 167-177. Tsukada, K.; Takayanagi. K.; Asamura, H.; Ota, M.; Fukushima, H. Multiplex short tandem repeat typing in degraded samples using newly designed primers for the TH01, TPOX, CSF1PO, and vWA loci. Legal Med. 2002, 4, 239-245. Van Hoofstat, D.; Deforce, D.; Brochez, V.; De Pauw, I.; Janssens, K.; Mestdagh, M. et al. DNA typing of fingerprints and skin debris: sensitivity of capillary electrophoresis in forensic applications using multiplex PCR. In: Promega Corporation. Proceedings of the 2nd European Symposium of Human Identification, 1998, Innsbruck, Austria, p. 131-137. Walsh, P.S.; Metzger, D.A.; Higuchio, R. Chelex 100 as a medium for simple extraction of DNA for PCR-based typing from forensic material. Biotechniques 1991, 10, 506-513. Whitaker, J.P.; Clayton, T.M.; Urquhart, A.J.; Millican, E.S.; Downes, T.J.; Kimpton, C.P.; Gill, P. Short tandem repeat typing of bodies from a mass disaster: high success rate and characteristic amplification patterns in highly degraded samples. BioTechniques 1995, 18(4), 670-677. Wiegand, P.; Kleiber, M. DNA typing of epithelial cells after strangulation. Int. J. Legal Med. 1997, 110, 181-183. Wiegand, P.; Kleiber, M. Less is more - length reduction of STR amplicons using redesigned primers. Int. J. Legal. Med. 2001, 114(4-5), 285–287. Wiegand, P.; Trubner, K.; Kleiber, M. STR typing of biological stains on strangulation tools. Progress in Forensic Genetics 2000, 8, 508-513. Willerslev, E.; Cooper, A. Ancient DNA. Proc. R. Soc. B. 2005, 272, 3-16. Yang, D.Y.; Watt, K. Contamination controls when preparing archaeological remains for ancient DNA analysis. Journal of Archaeological Science 2004, 32, 331-336. Yoshida, K.; Sekiguchi, K.; Kasai, K.; Sato, H.; Seta, S.; Sensabaugh, G.F. Evaluation of new primers for CSF1PO. Int. J. Legal Med. 1997, 110(1), 36-38.
94
Electronic Supplementary Resources http://www.ypatent.com/DNArepair.htm http://www.bio.miami.edu/dana/250/25005_9.html http://www.cstl.nist.gov/biotech/strbase/training.htm http://www.promega.com/techserv/tools/pplexy/ http://www.appliedbiosystems.com/yfilerdatabase/ http://www.yhrd.org http://www.cstl.nist.gov/biotech/strbase/miniSTR/timeline.htm http://www.afip.org http://www.bodetech.com http://www.ic-mp.org http://www.brandonhamber.com/publications/pap_khulumani.doc http://www.info.gov.za/otherdocs/2003/trc/4_1.pdf http://eaaf.typepad.com/ http://eaaf.typepad.com/founding_of_eaaf/ http://www.khulumani.net/content/view/620/164/ http://www.khulumani.net/content/view/1570/164/ http://www.stanford.edu/class/history48q/Documents/EMBARGO/2chap3.htm http://www.info.gov.za/speeches/2001/010703245p1007.htm http://www.star.co.za http://www.cosatu.org.za/press/2006/sept/press6.htm http://www.info.gov.za/speeches/2007/07030215151001.htm http://www.doj.gov.za/trc/media/1996/9604/s960425l.htm
95
Appendices
Appendix I: Protocols
Developmental Validation
1. Characterization of genetic markers: The basic characteristics (described below) of a genetic marker must be determined and documented.
1.1. Inheritance: The mode of inheritance of DNA markers demonstrated through family studies.
1.2. Mapping: The chromosomal location of the genetic marker (submitted to or recorded with the Nomenclature Committee of the Human Genome Organization).
1.3. Detection: Technological basis for identifying the genetic marker.
1.4. Polymorphism: Type of variation analyzed.
2. Species specificity: For techniques designed to type human DNA, the potential to detect DNA from forensically relevant nonhuman species should be evaluated. For techniques in which a species other than human is targeted for DNA analysis, the ability to detect DNA profiles from non-targeted species should be determined. The presence of an amplification product in the non-targeted species does not necessarily invalidate the use of the assay.
3. Sensitivity studies: When appropriate, the range of DNA quantities able to produce reliable typing results should be determined.
4. Stability studies: The ability to obtain results from DNA recovered from biological samples deposited on various substrates and subjected to various environmental and chemical insults has been extensively documented. In most instances, assessment of the effects of these factors on new forensic DNA procedures is not required. However, if substrates and/or environmental and/or chemical insults could potentially affect the analytical process, then the process should be evaluated using known samples to determine the effects of such factors.
5. Reproducibility: The technique should be evaluated in the laboratory and among different laboratories to ensure the consistency of results. Specimens obtained from donors of known types should be evaluated.
6. Case-type samples: The ability to obtain reliable results should be evaluated using samples that are representative of those typically encountered by the testing laboratory. When possible, consistency of typing results should be demonstrated by comparing results from the previous procedures to those obtained using the new procedure.
96
7. Population studies: The distribution of genetic markers in populations should be determined in relevant population groups. When appropriate, databases should be tested for independence expectations.
8. Mixture studies: The ability to obtain reliable results from mixed source samples should be determined.
9. Precision and accuracy: The extent to which a given set of measurements of the same sample agree with their mean and the extent to which these measurements match the actual values being measured should be determined.
10. PCR-based procedures: Publication of the sequence of individual primers is not required in order to appropriately demonstrate the accuracy, precision, reproducibility, and limitations of PCR-based technologies.
10.1. The reaction conditions needed to provide the required degree of specificity and robustness must be determined. These include thermocycling parameters, the concentration of primers, magnesium chloride, DNA polymerase, and other critical reagents.
10.2. The potential for differential amplification among loci, preferential amplification of alleles in a locus, and stochastic amplification must be assessed.
10.3. When more than one locus is co-amplified, the effects of co-amplification must be assessed (e.g., presence of artifacts).
10.4. Positive and negative controls must be validated for use.
10.5. Detection of PCR product
10.5.1. Characterization without hybridization
10.5.1.1. When PCR product is characterized directly, appropriate measurement standards (qualitative and/or quantitative) for characterizing the alleles or resulting DNA product must be established.
10.5.1.2. When PCR product is characterized by DNA sequencing, appropriate standards for characterizing the sequence data must be established.
10.5.2. Characterization with hybridization
10.5.2.1. Hybridization and wash conditions necessary to provide the required degree of specificity must be determined.
10.5.2.2. For assays in which the probe is bound to the matrix, a mechanism must be employed to demonstrate whether adequate amplified DNA is present in the sample (e.g., a probe that reacts with an amplified allele(s) or a product yield gel).
97
Bone cleaning Step 1: Remove a section of bone from the main sample by sawing using a dremel
tool. A typical sample weighs approx 2grams.
Step 2: Clean surface using a dremel tool.
Step 3: Immerse bone in 3.2% (w/v) bleach for 1hour.
Step 4: Wash 4X with sabax water and 2X with ethanol.
Step 5: Place under UV radiation for 15-30 minutes and let the sample dry.
Step 6: Place the bone sample into the Freezer mill sample vial as soon as possible.
The bone sample is now ready to be milled.
Tooth Cleaning Step 1: Remove teeth from a jaw by using a pliers or by sawing using a dremel tool. A
typical sample weighs approx 2grams.
Step 2: Remove any attached material from the tooth with a toothbrush and clean with
sabax water. If all material cannot be removed with a toothbrush a razor blade may be
used.
Step 3: Immerse tooth in 3.2% (w/v) bleach for 1 hour.
Step 4: Wash 4X with sabax water and 2X with ethanol.
Step 5: Place under UV radiation for 15-30 minutes and let the sample dry.
Step 6: Place the sample into the Freezer mill sample vial as soon as possible.
The tooth sample is now ready to be milled.
Milling of Bones
Settings:
Pre-cooling: 15 minutes .
Grinding: 2 minutes X 3 cycles
Resting: 2 minutes .
Impact Frequency: 15
Cleaning of 6750 Freezer Mill sample vials and end pieces
Step 1: Decon for 30min-1 hour in a ziplock bag or suitable container
Step 2: Bleach for 1 hour
Step 3: Wash 4X with sabax water
Step 4: Wash 2X with ethanol
Sample vials and end pieces now ready for milling of next sample
98
DNA Extraction from oral swabs using Chelex Extraction Method
1. Suspend the swab sample in 1mL of deionized water in a 1.5mL microcentrifuge tube. 2. Incubate at room temperature for 30 minutes to rehydrate the sample. 3. Use an autoclaved toothpick to tease the fibers apart on the inside of the tube. Twirl the swab and toothpick for 2 minutes to release the cells from the swab. 4. Remove the substrate and toothpick. Spin in a microcentrifuge for 2 minutes at 10, 000-15,000 x g at room temperature. 5. Without disturbing the pellet, remove and discard all but 25μL of the pellet. 6. Resuspend the pellet in the remaining 25μL by stirring with an autoclaved pipette tip. 7. Add 5% Chelex to final volume of 200μL. 8. Add 2μL of 10mg/mL Proteinase K. Mix gently. 9. Incubate the sample at 56oC for 15-30 minutes. 10. Vortex the sample at high speed for 5-10 minutes. 11. Spin the sample in a microcentrifuge for 10-20 seconds at 10, 000-15, 000 x g at room temperature. 12. Incubate the sample in a boiling water bath for 8 minutes. 13. Vortex the sample at high speed for 5-10 seconds. 14. Spin the sample in a microcentrifuge for 2-3 minutes at 10, 000-15, 000 x g at room temperature. The sample is now ready for DNA quantitation and the PCR amplification process. 15. Store the remainder of the sample at either 2-6 oC or -15 oC to -25 oC. 16. To reuse, thaw the sample at room temperature and repeat steps 7-8.
DNA Extraction using Phenol Chloroform Method
1. Wash the bone powder with 10 ml 0.25 M EDTA pH 8-8.5 to remove loose impurities. 2. Centrifuge immediately to pellet the bone powder and discard the supernatant The washing step can be repeated once or twice.
99
3. Add 10 ml of Bone Lysis buffer (0.5 M EDTA pH 8-8.5, 0.5 ml 10% N-lauroyl sarcosine and 200 µl of the 20 mgml-1 Proteinase K) to each tube containing the bone powder. Make sure that the tubes are closed firmly and wrapped with Parafilm to avoid leaks. 4. Incubate overnight at 370 C or 500 C for three hours. The important thing at this point is to ensure that the content of the tubes is thoroughly agitated so the bone powder does not settle out. 5. After the lysis step, use a glass pipette to add 10 ml of water-saturated phenol to each tube. 6. Mix solution thoroughly and centrifuged for 10 minutes at 3000 r.p.m as soon as possible to separate the two phases. Attention: the aqueous phase remains in the bottom in this step. 7. After centrifugation, remove the top (phenol) layer with a sterile glass Pasteur pipette and discarded into a suitable waste container. 8. Extract the aqueous phase once or twice with an equal mixture of water-saturated phenol and chloroform. 9. Mix solution thoroughly and centrifuge as before to separate the phases. After centrifugation, the aqueous phase remains at the top of the organic phase. 10. Remove aqueous phase with a sterile glass or plastic Pasteur pipette and placed in a clean Falcon tube. 11. Remove residual phenol by one chloroform (10ml) extraction. 12. Recover aqueous phase and place into Falcon tube, it typically consists of 7-8 ml. 13. Add the 7-8ml aqueous solution to Centriplus 30 tubes and centrifuge at max speed until solution reduced/concentrated down to 100-200ul. 14. Wash extract at least twice with 7-8ml sterile water to remove the salt. Extracts can be stored at –200 C, although long-term storage is preferable at –700 C.
The DNA is ready to amplify, although further purification might be necessary or
desirable.
100
DNA Purification using QIAamp® Blood Mini Kit 1. Add an equal volume of Buffer AL to the sample. Mix by pulse-vortexing for 15 s. e.g., a 400 µl sample will require 400 µl Buffer AL 2. After mixing, briefly centrifuge the 1.5 ml microcentrifuge tube to remove drops from lid 3. Carefully apply the mixture to the QIAamp Spin Column without wetting the rim, close the cap. 4. Centrifuge at 6000 x g (8000 rpm) for 1 min. Place the QIAamp Spin Column in a clean 2 ml collection tube (provided), and discard the tube containing the filtrate. 5. Add 500 µl Buffer AW1 to the column. 6. Centrifuge at 6000 x g (8000 rpm) for 1 min. Place the QIAamp Spin Column in a clean 2 ml collection tube (provided), and discard the collection tube containing the filtrate. 7. Add 500 µl Buffer AW2 to the column. Close the cap and centrifuge at full speed (20,000 x g; 14,000 rpm) for 3 min. 8. Place the QIAamp Spin Column in a clean 1.5 ml microcentrifuge tube (not provided), and discard the collection tube containing the filtrate. Carefully open the QIAamp Spin Column and add 60µl Buffer AE or distilled water. 9. Incubate at room temperature (15–25°C) for 5 min, and then centrifuge at 6000 x g (8000 rpm) for 1 min. Samples are now ready for PCR amplification
101
Precipitation and cleanup of sequencing reactions 1. 125mM EDTA mixed in equal parts with 3M Sodium Acetate.
2. 2ul added to each 10ul sequencing reaction.
3. 25ul of 100% EtOH added to each sequencing reaction.
4. Incubated at room temp for 15min
5. Spun at max for 30min (room temp)
6. Supernatant removed
7. 70ul 70% EtOH added.
8. Spun at max for 15 min (room temp)
9. Supernatant removed and air dried for +-40min in fume hood.
10. Resuspended in 1.5ul loading mix (5ul formamide to 1ul Blue Dye).
11. Denatured for 4 min.
12. Snap cooled on ice.
13. Load around 0.8 to 1.2ul.
14. Run on standard 36cm gel at using filter set E at 1200 scans per hour.
Mitochondrial DNA Sequence Analysis 1. Process raw data using ABI sequence Manager.
2. Reverse compliment heavy chain sequences.
3. Conduct pairwise comparison of heavy and light chains for each sequence.
4. Identify discrepancies between heavy and light chain sequences.
5. Examine corresponding electropherograms and attempt to identify source of
discrepancy.
6. Correct sequence if one strand has very clear electropherogram (otherwise repeat
sequencing)
7. Copy corrected sequences in fasta format to a text file. (Include Cambridge
Reference Sequence (CRS))
8. Use clustal to conduct a multiple sequence alignment and render alignment using
Genedoc.
9. Identify positions at which each sequence differs from CRS.
10. Confirm bases at these positions on the relevant electropherograms.
102
Epicenter extraction protocol for buccal swabs.
1. Place swab fragment in 250ul of Epicenter extraction buffer
2. Vortex for 15 seconds
3. Heat at 65C for five minutes
4. Vortex for 15 seconds
5. Heat at 98C for 2 minutes
6. Vortex for 15 seconds.
Genotyping with the ABI377 Pouring the gel 1. Place a clean set of assembled plates in the gel pouring area. Ensure that the glass
plates have been moved as far down the cassette as possible. All the cassette clamps
should be in place except the one that holds the beam trap. Ensure that the 48 tooth
well forming comb is clean and accessible.
2. Ensure all glassware and syringes have been rinsed with deionised water. 3. Transfer 25ml of gel mix to a clean 50ml beaker. This allows for easy access to the
gel mix with a 50ml syringe.
4. Suck up gel mix with the 50ml syringe and filter through a 0.22 micron filter
directly into the side-arm flask.
5. Degas gel mix with intermittent gentle agitation. Degas for +/- 5 min or until no
bubbles appear after agitation. The pump must be running first. Always ensure that
the rubber stopper is in place. Set or break the vacuum only at the rubber hose/side
arm junction.
6. Transfer from side arm flask to a clean 50ml beaker. 7. Add 125μL (AMPS) and 17.5μL N, N, N’, N’ Tetramethyl-EthyleneDiamine
(TEMED) to opposite sides of the gel mix in the beaker. You should mix soon after
adding the AMPS and TEMED but make sure you don’t introduce bubbles into the
mix. Once mixed the gel takes a long time to set so there is no rush.
8. Pour gel.
103
9. Insert comb and clamp. 10. Seal bottom of the plates with cling-wrap. 11. Clamp the beam trap down. 12. Let the gel polymerise for 2hrs. Running the ABI377 1. Start by turning the ABI377 on and let the instrument go through its start up
routine.
2. Check that the laser fan is blowing. 3. Once the ABI377 has gone through its start up routine turn on the PC. 4. Start cleaning the gel so that it can be loaded onto the ABI. Remove the clamps but
leave the comb in place. Remove the cling-wrap from the bottom of the gel.
5. Remove the gel from the cassette for cleaning. Pour deionised water over the
bottom and top of the gel to remove any residual gel. After the initial rinse remove the
comb drawing it backwards in the plane of the gel. Doing this helps draw any
polyacrylamide away from the wells. Use paper towel to dab the residual
polyacrylamide from the gel.
6. Once the gel has been thoroughly rinsed, dry it with paper towel. Place it back in
the cassette.
7. Lift the beam trap and clean the laser scan area. 8. Place the cleaned gel into the instrument. Clip it into place and ensure that it is
correctly aligned.
9. Ensure the collection software is open. Open Genescan Run dialogue box. Set the
Prerun options tab to PlateCheck X.
10. Click the PlateCheck Run option. With any of the run options if the instrument
does not comply simple cancel the run and restart it.

104
11. Examine the scan and gel windows and cancel the run. If you’re happy with the
result continue with the rest of the setup. If not, clean the scan area again and repeat
the plate check.
12. If you’re satisfied with the plate check, place the upper buffer chamber onto the
instrument. Pour 1X TBE into the chamber and check for leaks.
13. If no leaks occur then add the heat plate to the gel assembly. 14. Pour 1X TBE buffer into the lower buffer chamber. 15. Flush the well area and insert the 48 tooth comb so that approximately 1.5mm of
the arches are exposed.
16. Put the lid of the upper chamber on and close the instrument door. 17. Select GS PRF 2400 X from the Prerun options tab. Click on the prerun tab. 18. Open the status window and check that the 35 second initialisation has been
initiated. If not cancel the run and click on the prerun tab again.
19. The moment you hear the water pump activate, pause the run, open the instrument
door and check that there are no leaks.
20. If there is no leaking simply close the instrument door and allow it to heat up to
50oC.
21. While the instrument is heating up the samples can be prepared for loading. Preparation of samples for loading on the ABI377 1. Prepare a sample sheet with the names of each sample. 2. Place the amplification-tubes in one continuous row. 3. In front of each amplification-tube place a clean 0.2ml PCR tube (loading tubes).
Number the tubes with the relevant well number.
4. Prepare sufficient loading mixture (loading mixture in the following ratio: 5μL
Formamide, 1.5μL ROX internal size ladder, 1.5μL Blue dye).
105
5. Place 1μL loading dye in each loading tube. 6. Transfer 1μL of each amplified sample to the appropriate loading tubes. 7. Place the loading tubes into the GeneAmp 2700 Thermocycler for 5 min to
denature. Place odd numbered tubes consecutively into an appropriate number of
rows. Then place the even numbered tubes consecutively into an appropriate number
of rows. This simplifies the loading process when odd wells are loaded first, run in
then even wells are loaded.
8. During this time the paused prerun will brought the gel to 50oC. Cancel the prerun
and set up the Run parameters (48 tooth comb, GS RUN 2400 X module, Operator,
Filter set, Sample Sheet). Click the run tab. Pause the instrument as soon as you hear
the water pump.
9. With the instrument paused open the instrument door and flush the wells with a
5μL syringe. Load 0.8μL of each sample into the relevant well. Load all odd
numbered samples first, run the instrument for 2 minutes, pause it and load the even
samples. Restart the run. It should take 2hrs 15 minutes for all the relevant bands to be
detected.
10. As soon you’ve seen the 400bp band you can terminate the run and process the
results.
Processing the results from the ABI377 1. Open the Gel processor software. Auto track the lanes. Each lane should be visually
inspected and any tracking errors corrected.
2. Once tracked the lanes can be extracted. 3. Open Genescan, start a new project and import the relevant run files. Before
analyzing each sample you’ll need to install a matrix file and an appropriate size
standard. Good initial peak height threshold settings for the colour channels are B:
100, G: 100, Y: 100, R: 50.
4. Click the analyse tab to analyse the samples.
106
5. Once the initial processing is done you’ll need to check each sample individually to
see that all the peaks have been detected. Where necessary raise the peak height cut
off threshold values to avoid stutter or lower the threshold to make sure that all allele
peaks are detected.
6. Once satisfied, the project file can be saved and is now ready to be typed. Genotyping of Samples The samples can either be typed manually using a ladder or by using the Genotyper
Software as follows:
1. Open Genotyper Macro 2. Click File, Import from Gensecan files. Search for appropriate project file and add
it to the Genotyper document and save.
3. Click inside the Dye/Lanes window, click Edit and Select all. 4. Double click on the Label Peak Sizes macro. 5. Select each colour and ensure that the peaks have been properly labelled with sizes
as follows: Click on one of the coloured squares next to the Dye/Lanes window and
draw a virtual box around the peaks. Press Ctrl R to zoom in on peaks and Ctrl Y to
show individual plots. If peaks have been missed or labelled incorrectly, change this
by clicking on the appropriate peaks. Press Ctrl H to zoom back out. Do this for all
other colours as well and save.
6. Click inside the Dye/Lanes window, click Edit and Select all. 7. Double click on the Label Peaks Categories macro. 8. Select each colour and ensure that the peaks have been properly labelled with the
allele numbers as follows: Click on one of the coloured squares next to the Dye/Lanes
window and draw a virtual box around the peaks. Press Ctrl R to zoom in on peaks
and Ctrl Y to show individual plots and check. Press Ctrl H to zoom back out. Do this
for all other colours as well and save.
9. Double click on the Make Table macro and save. All samples are now typed.
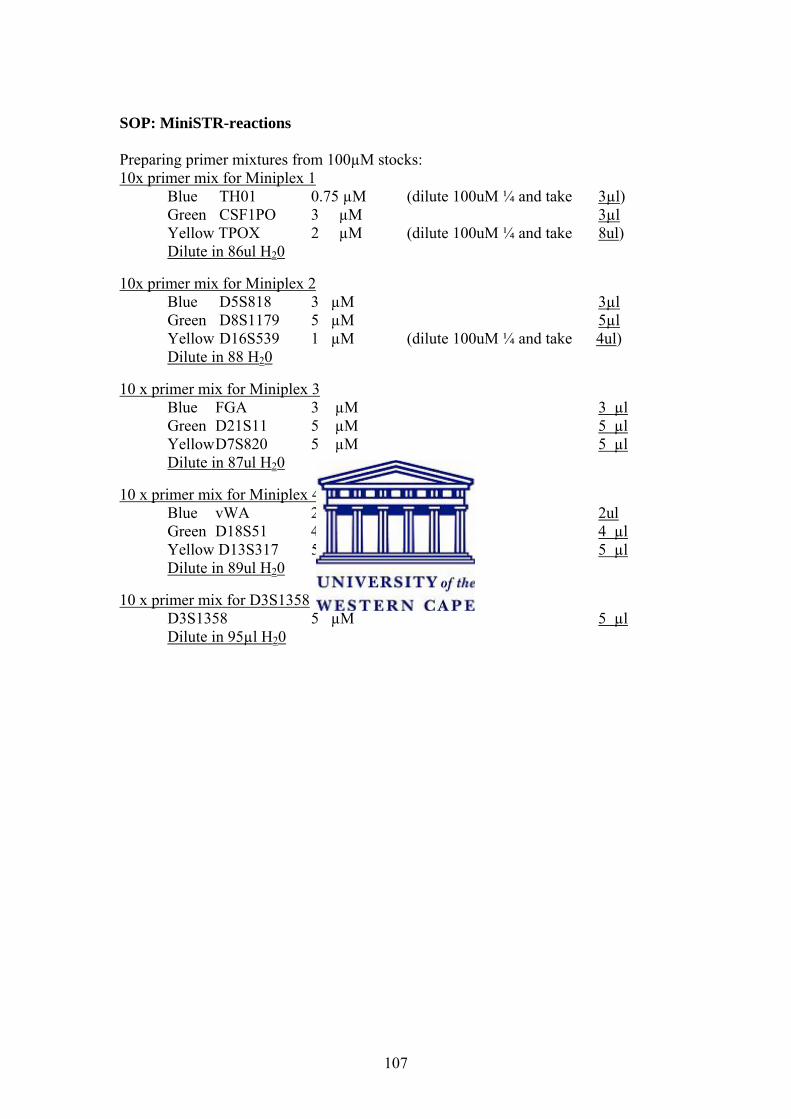
107
SOP: MiniSTR-reactions Preparing primer mixtures from 100µM stocks: 10x primer mix for Miniplex 1
Blue TH01 0.75 µM (dilute 100uM ¼ and take 3µl) Green CSF1PO 3 µM 3µl Yellow TPOX 2 µM (dilute 100uM ¼ and take 8ul) Dilute in 86ul H20
10x primer mix for Miniplex 2 Blue D5S818 3 µM 3µl
Green D8S1179 5 µM 5µl Yellow D16S539 1 µM (dilute 100uM ¼ and take 4ul) Dilute in 88 H20
10 x primer mix for Miniplex 3
Blue FGA 3 µM 3 µl Green D21S11 5 µM 5 µl Yellow D7S820 5 µM 5 µl Dilute in 87ul H20
10 x primer mix for Miniplex 4 Blue vWA 2 µM 2ul
Green D18S51 4 µM 4 µl Yellow D13S317 5 µM 5 µl Dilute in 89ul H20
10 x primer mix for D3S1358 D3S1358 5 µM 5 µl
Dilute in 95µl H20
108
Appendix II. Composition of Buffers and Solutions 0.5 M EDTA pH 8-8.5 Commercial Stock 10% (w/v) N-lauroyl sarcosine (50mL) 5g N-lauroyl sarcosine Add N-lauroyl sarcosine to 50mL DI H2O. 20 mgmL-1 Proteinase K (5mL) 100g Proteinase K Add Proteinase K to 5mL DI H2O. Bone Lysis Buffer 0.465 M EDTA pH 8-8.5, 0.5% N-lauroyl sarcosine, 0.4mgmL-1 Proteinase K (50mL) 2.5mL 10% (w/v) N-lauroyl sarcosine 1mL 20 mgmL-1 Proteinase K Add N-lauroyl sarcosine and Proteinase K to 46.5mL of 0.5 M EDTA pH 8-8.5. 5% (w/v) Chelex (50mL) 2.5g Chelex Add Chelex to 50mL DI H2O. 10X TBE Buffer (1L) 108g Tris Base EDTA ~55g Boric Acid Add Tris Base, EDTA and Boric Acid to 800mL DI H2O and mix to dissolve. Adjust to 1L with additional DI H2O once dissolved.
109
1X TBE Buffer (1L) 100mL 10X TBE Buffer Add TBE to 900mL DI H2O. Polyacrylamide Gel Mix (50mL) 18g Urea 5mL Long-Ranger Gel Solution 5mL 10X TBE Add required DI H2O to Urea, Long-Ranger Gel Solution and 10X TBE get 50mL.