the internal capital markets of pyramidal business groups
TRANSCRIPT

1
The Internal Capital Markets of Pyramidal
Business Groups: Evidence from Chile
David Buchuk, Borja Larrain, Francisco Muñoz, and Francisco Urzúa I.
PRELIMINARY AND INCOMPLETE
PLEASE DO NOT CITE WITHOUT PERMISSION
Abstract
We study intra-group loans within pyramidal business groups using Chilean data
from 1990-2009. On average, loans are received by firms with high capital intensity,
which is consistent with the financing advantage of pyramids in Almeida and
Wolfenson (2006). Loan providers are firms where the controlling shareholder has
lower cash-flow rights than in receiving firms, although both providers are receivers
tend to be in the lower part of pyramids. This suggests that tunneling plays a role
only in the margin. We do not find evidence that market valuations or short-run
cash-flow fluctuations play an important role in these internal capital markets.
Acknowledgements: We would like to thank Francisco Gallego, Aníbal Larrain, Tomás Rau, José Tessada, and seminar participants at Pontificia Universidad Católica de Chile for comments and suggestions. We also thank Fernando Lefort and Eduardo Walker for providing some of the data used in this paper. Larrain acknowledges partial financial support provided by the Programa Bicentenario de Ciencia y Tecnología through the Concurso de Anillos de Investigación en Ciencias Sociales (code SOC-04) and by Grupo Security through Finance UC.
§ Buchuk: Pontificia Universidad Católica de Chile, Escuela de Administración; Larrain (*): Pontificia Universidad Católica de Chile, Escuela de Administración and Finance UC; Muñoz: Pontificia Universidad Católica de Chile, Escuela de Administración; Urzúa: Tilburg University, Department of Finance. (*) Corresponding author. Address: Avenida Vicuña Mackenna 4860, Macul, Santiago, Chile. Tel: (56 2) 354-4025, e-mail: [email protected]

2
The Internal Capital Markets of Pyramidal
Business Groups: Evidence from Chile
Abstract
We study intra-group loans within pyramidal business groups using Chilean data
from 1990-2009. On average, loans are received by firms with high capital intensity,
which is consistent with the financing advantage of pyramids in Almeida and
Wolfenson (2006). Loan providers are firms where the controlling shareholder has
lower cash-flow rights than in receiving firms, although both providers are receivers
tend to be in the lower part of pyramids. This suggests that tunneling plays a role
only in the margin. We do not find evidence that market valuations or short-run
cash-flow fluctuations play an important role in these internal capital markets.
3
The importance of understanding the inner workings of business groups can be
hardly overstated. From Korea to Mexico, and India to Brazil, business groups are
the dominant form of corporate structure. Groups are typically controlled by families
through pyramidal structures, which connect public and private firms, both in
related and non-related lines of business, through a complex web of ownership links.
Business groups, or more precisely the elites behind them, control a significant
fraction of the economies where they operate. For instance, Faccio and Lang (2002)
show that the Agnelli family in Italy controls approximately 10% of the stock market
capitalization of that country. Similarly, Claessens, Djankov, and Lang (2000) find
that the wealthiest family in Philippines controls 17% of the country’s market
capitalization. In the period we study in this paper groups as a whole control more
than 60% of Chile’s total market capitalization, and more than 50% of Chile’s GDP.
The fact that a few business groups control such a large fraction of a country’s
wealth can have both positive and negative effects. On the one hand, through a
concerted development effort a la Big Push business groups can overcome the kind of
coordination problems that many emerging economies face (Morck (2011)). On the
other hand, the fact that a few groups decide how to allocate the lion’s share of
capital in a country can lead to what Morck, Wolfenson, and Yeung (2005) call
“economic entrenchment”. In such scenario, economic development can be severely
hampered since business groups can “bias capital allocation, retard capital market
development, obstruct entry by outside entrepreneurs, and retard growth” (Morck,
Wolfenson, and Yeung (2005)).
However, and despite the importance of business groups around the world, we
still don’t know much about how capital is allocated within them. As Almeida and
Wolfenson (2006b) show, business groups can severely affect capital allocation in a

4
country despite the fact that their internal allocations are efficient. However, it is
still an open debate whether capital markets within groups are efficient or not, and
more fundamentally, what determines the allocations of capital within business
groups. The lack of empirical evidence in this regard is probably due to data
availability and the opacity of business groups. In this paper we provide direct
evidence of intra-group borrowing and lending that can shed light on the inner
workings of internal capital markets.
Previous literature shows that internal capital markets serve three non-
mutually exclusive purposes. First, the internal capital markets of groups can
alleviate financial constraints both by providing support in the face of short-run
shocks, and by financinging long-term projects. For example, Gopalan, Nanda, and
Seru (2007) show that Indian business groups’ affiliated firms benefit from the
support of other related firms when they suffer cash-flow shocks, which avoids
bankruptcy and negative spillovers in the rest of the group. Both Almeida and
Wolfenzon (2006) and Almeida et al. (2011) show that groups use their internal
revenues to set up (or acquire) capital intensive firms, which are the firms most in
need of long-term financing. A second motive behind intra-group loans is tunneling,
or the expropriation of minority shareholders (Johnson et al. (2000)). For example,
Bertrand. Mehta, and Mullainathan (2002) show that Indian groups channel
resources from firms at the bottom of pyramids to firms near the top of the
pyramid.1 Similarly, Jiang, Lee, and Yue (2010) show that the controlling
shareholders of Chinese firms use inter-company loans to tunnel large amounts of
money away from firms, and consequently damaging minority investors. Finally, a
third broad motive for the existence of business groups is that their internal capital
1 Although their methodology has been recently questioned by Siegel and Choudhury (2012).

5
markets substitute for under-developed external markets, or for under-developed
legal and judicial institutions (see Khanna and Yafeh (2007)). If internal capital
markets substitute for under-developed capital markets they can, for example, make
up for the lack of funds given to firms with better investment opportunities (e.g.,
firms with higher Tobin’s Q).
We benefit from the relative transparency of business groups in Chile, most of
which was imposed by market regulators after the debt crisis of the early 1980s, and
which gives us a long sample (20 years) on the activity of internal capital markets
inside groups.2 The key for our purposes is that the net lending (or borrowing)
position in terms of intra-group loans must be disclosed as a separate line in the
balance sheet of each firm. Disclosure requirements even force firms to separate
between long and short term intra-groups loans. Furthermore, for the years 2001-
2009 the notes to financial statements are also available on electronic form, and we
can extract from there even more detail on intra-group lending. Through the notes
we can identify the firm that lends and the firm that receives the loan within the
group. Since we know both the lender and the borrower we can test more directly
several theories on how capital is allocated within groups. From the notes we are also
able to understand the web of ownership links in control pyramids. We can identify
precisely the ultimate controlling shareholder, which is typically a family, together
with their voting and cash flow rights for each firm in the pyramid. This process is
particularly cumbersome since it requires an intimate knowledge of the corporate
structure of many public and privately-held companies. Given all these unique
2 Chilean business groups have been studied previously in terms of the benefits of group
diversification (Khanna and Palepu (2000)), the synchronization of stock returns and firm interlocks (Khanna and Thomas (2009)), and tunneling (Urzua (2009)), among others, but not in terms of their internal capital markets.
6
characteristics of Chilean data we are able to provide a more complete picture on the
workings of internal capital markets in business groups.
In the data we first note that the internal capital markets of business groups
are quite active. On average net intra-group loans are 1.6% of book assets
(individual, non-consolidated assets). Despite the tremendous development of Chile
in the last two decades (e.g., per capita GDP tripled in this period), there is no
discernible tendency for intra-group loans to disappear: on average net intra-group
loans are still 2.4% of assets by the end of 2009. We define providers (receivers) as
those firms which provide (receive) more than 5% of their assets as loans to other
firms in the pyramid. Approximately 20% of firm-year observations are providers,
whereas 12% are receivers. We find that capital intensity (PPE over assets) is the
strongest predictor of the provider-receiver status. Firms with high capital intensity
tend to receive intra-group loans and the opposite happens with firms with low
capital intensity. This finding is in line with the prediction in Almeida and
Wolfenzon (2006) that pyramids are partly set up to finance capital-intensive
projects. The financing advantage of pyramidal ownership structures is the
possibility to use the retained earnings of other firms in the pyramid to finance firms
that need substantial fixed assets and long-term financing. Receivers also tend to be
firms with high cash-flow rights in the hands of the controlling shareholder relative
to providers. However, this does not have to be understood as firms at the bottom of
pyramids (with low cash flow rights) lending heavily to firms at the top of pyramids
(with high cash flow rights), because both providers and receivers are more frequent
in the lower ranks of pyramids. In other words, the tunneling effect along the lines of
Bertrand. Mehta, and Mullainathan (2002) is only relevant at the margin in our
sample. This is perhaps not too surprising given that cash flow rights are on average

7
quite high (around 48%) when compared to pyramids in other countries where the
separation of ownership and control is more extreme (see Adams and Ferreira (2008)
for a survey). Finally, we find that current cash flows (EBIT) and Tobin’s Q are not
strong predictors of the provider-receiver status. These last two finds suggest that
short-run support and market valuations (which can lead to “winner-picking” or
“socialism” as in Stein (2003)) are not important determinants of intra-group
lending.
With the data from the notes to the financial statements we can dig deeper
into the determinants of intra-group loans. Notes provide loan balances for pairs of
firms, instead of simply a generic balance of intra-group loans for each firm. On
average, each firm reports loan balances with two other group-affiliated public firms,
and loan balances last on average for two years in our sample. Consistent with the
previous evidence, we see that high capital intensive firms receive loans from low
capital intensive firms, and this is true both within and across industries. Capital
intensity appears as the most robust predictor of loans across the battery of tests
that we perform. For example, we take special care of firm-pairs with zero balances
within a group and the potential biases that arise from ignoring these observations.
Finally, and in order to paint a complete picture of internal capital markets,
we study the impact of intra-group loans on real investment and dividend payments.
We observe a significant effect on fixed investment. Receivers have a 2.2% higher
fixed investment rate when compared to other firms in business groups, whereas
providers have a 1.3% lower fixed investment rate. We do not find evidence that
investment in other assets (e.g., inventories) is affected, which suggests that loans are
used for long-term investments rather than to fund short-term needs of working
capital. There is no strong evidence that firms that receive intra-group loans increase
8
their dividend payments, or that the firms that provide loans decrease dividend
payments. This also reinforces the idea that tunneling is only a marginal concern in
our sample.
Our paper contributes primarily to the literature on business groups and
pyramidal ownership structures, and more specifically, to the few papers that try to
understand their internal capital markets. Other papers in this area have studied,
for example, the investment-cash flow sensitivity of Korean chaebols (Shin and Park
(1999), and Lee, Park, and Shin (2009)) or the efficiency of chaebols’ investment
after the Asian financial crisis (Almeida and Kim (2012)). Khanna and Yafeh
(2007)’s view is that business groups can sometimes be paragons, and sometimes be
parasites. In a sense our evidence is consistent with this view. Although intra-group
loans are used to fund capital-intensive projects, tunneling also seems to play a role
since loans are preferably given to firms with relatively higher cash flow rights of the
controlling shareholder. We do not find strong evidence for the support motive
documented by Gopalan, Nanda, and Seru (2007) among Indian business groups.
One of the potential reasons for this difference is that bankruptcies are extremely
rare during this period in Chile.
Our evidence also contributes to the large literature on internal capital
markets, which is mostly focused on conglomerates in developed markets (see Stein
(2002) for a survey). This literature tests several theories regarding the efficiency of
investment within conglomerates. The fact that allocations are made within a
conglomerate can increase efficiency, because, for example, relative performance
evaluation is easier than absolute evaluation (i.e., a “winner-picking” effect), or it
can decrease efficiency, because, for example, rent-seeking within the conglomerate
leads to cross-subsidies (i.e., “socialism”). The sensitivity of investment to Tobin’s Q
9
is usually considered in empirical applications as a metric of investment efficiency. In
our setup Tobin’s Q is largely irrelevant for intra-group lending which suggest that
efficiency is not the main driver of internal capital markets. The main driver seems
to be the desire to set up large-scale, capital-intensive projects.
The rest of the paper is organized as follows. In Section 1 we describe our
data in detail. Section 2 presents the main regressions using net balances of all intra-
group loans for a given firm, and with firm-pair balances. In Section 3 we look at the
uses of intra-group loans. Section 4 presents our conclusions.
1. Data
a. Data on Internal Capital Markets
Chilean accounting standards are particularly strict with respect to internal
capital markets due to the country’s unique recent history. In 1981, and after several
years of economic growth and liberalization policies implemented by the regime of
General Pinochet, an economic crisis struck the country. External credit halted;
there was a rise in interest rates, and terms of trade fell, all of which severely hit
business groups. The effect was devastating for business groups since they were
heavily indebted, in particular with their group-related banks. As a consequence
many groups were intervened and nationalized. A limit was set for banks on their
related lending activities, and crucially for our purposes, information on group-
related transactions was required to be disclosed in the annual statements of
companies. Therefore, in the balance sheet of every listed firm there is a line called
“notes and account receivables/payables from related companies” (both for the short

10
and long term). Due to our interest in internal capital markets we focus on non-
consolidated financial statements since whenever a firm consolidates its statements
with a subsidiary any transaction between both parties disappears (as the
transaction is both on the asset side and the liability side for the consolidating firm).
We define net intra-group loans for a given firm as the difference between accounts
receivable and accounts payable with related companies. We are able to collect this
information for Chilean companies between 1990 and 2009.
In Figure 1 we provide a stylized example to get a grasp of our data. Firm A
lends to firm B, and it receives a loan from firm C, both of which are in the same
business group. Firms B and C can either be public or private firms, but as long as
they are related to firm A through ownership links the balance sheet of firm A will
provide information on these loans.4 The loan to firm B (LAB) is considered an
account receivable from a related firm, and the loan received from firm C (LCA) is
considered an account payable to a related firm. Net intra-groups loans for firm A
correspond to the difference between these two outstanding loans (= LAB — LCA).
However, with the balance sheet data we get only half way in terms of identifying
relevant data about internal capital markets. The main disadvantage of the balance
sheet is that it pools together many different loans, to and from public and private
firms, into a single line. We can dig deeper into intra-group loans by looking at the
notes to the financial statements, which Chile’s stock market’s regulatory agency, the
Superintendencia de Valores y Seguros (hereafter, SVS), compiles electronically since
2001. The notes provide detail on specific loans, identifying the related firm that
extended and that received the loan. For instance, in our example above, we are able
4 In fact, the regulation requires that firms related not only through ownership links (e.g., firms that
share a common director, although they are in different business groups) to report transactions between them as transactions between related parties. These tend to be small compared to intra-group transactions.

11
to identify firms B and C through the notes. If firm B or C is a public company we
can match both ends of the loan to firm-level characteristics reported in public
financial statements. Most of these loans, however, involve privately-held firms that
typically do not report financial statements and that are outside the scope of the
SVS. Since there is no data set covering private firms in Chile, such as Amadeus for
example in Europe, we restrict our attention to loans between listed firms in this
part.
Figure 2 provides a real example taken from our data. It shows both the structure
and the activity of internal capital markets of the Chilean group controlled by the
Claro family. The Claro group represents more than 2% of Chile’s total market
capitalization. By 2008 it controlled seven listed firms, ranging from a sea-shipping
company (Vapores), to a glass and bottles producer (Cristales), and a vineyard (Viña
Santa Rita), plus a multitude of private firms. Figure 2 shows all ownership links in
the pyramid, for instance, that Cristales (listed) controls 54% of Viña Santa Rita
(listed) and 99% of Constructora Apoger (private). It also shows that Cristales’ net
loans to Santa Rita are equivalent to 0.58% of its non-consolidated assets. The
largest net loan position between listed firms in Figure 2 is the one between
Elecmetal and Cristales, which accounts for 3.58% of Elecmetal’s assets. Figure 2
shows that internal capital markets play a non-trivial role in Claro’s group. Almost
every firm receives a significant loan from its parent or from other group related
company.
Table 1 shows examples of particular loans between public firms in our sample,
and the specific amounts and conditions involved in each case. For instance,
Navarino of the Claro group received CLP 762 million (approximately USD 1.1
million) from its parent company, Quemchi, in the year 2001. The rate of the loan

12
was 5.01%. Unlike the evidence presented in Gopalan, Nanda, and Seru (2007) for
India, intra-group loans are almost never at an interest rate of zero in our sample.
This happens because Chilean regulation requires related loans to be made at the
prevailing “market interest rate”.
b. Financial and Ownership Data
Financial and accounting data for all firms is taken from Economatica, a data
set covering publicly-traded companies in Latin America. However, our tests require
an intimate knowledge of the ownership links between group-affiliated firms, which
are not reported in standard data sets. We hand collected voting and cash flow
rights for all Chilean listed firms between 1990 and 2009. The SVS requires all listed
firms to provide the name of their twelve largest shareholders in their annual reports.
Yet this information is in itself of little help in identifying the controlling
shareholder, as these twelve largest shareholders are almost always other companies -
some of them listed, some private. We check the annual reports of firms by hand in
order to understand the web of companies connected through the pyramidal
structure of each group. Annual reports typically explain whether control is exercised
by the controlling shareholder through one holding company that owns all of the
controller’s shares, or alternatively through several firms related to the controlling
shareholder. With all this information in hand we compute both voting and cash-flow
rights of controlling shareholders for all business groups between 1990 and 2009. To
the best of our knowledge, such a long panel on ownership structures would be
difficult to assemble in other countries, even the US. For instance, Helwege, Pirinsky,
and Stulz (2007) use only a 16-year sample (1986-2001) in their study on ownership
structures in the US.

13
We illustrate our methodology with Viña Santa Rita from Figure 2. This firm is
controlled through a cascade of ownership links where the last two listed companies
before Santa Rita correspond to Elecmetal and Cristales. Several intertwined
privately-held companies, such as Bayona S.A., also affect the ultimate ownership of
the Claro family in Santa Rita. The Claro family controls, both through private and
public firms, 50% of Elecmetal, which directly holds 34% of Cristalerías which, in
turn, holds 54% of Santa Rita. The Claro family, therefore, controls Santa Rita with
54% of the shares (votes). This assumes, as is standard in the literature on control
(Adams and Ferreira (2008)), that control is achieved with a stake larger than 20%.
Once considering all stakes the Claro family has, both through private and public
firms, its voting rights increase from 54% to 78% in Santa Rita.
As in many other countries (for instance East Asia (Claessens, Djankov, and
Lang (2000)), Europe (Faccio and Lang (2002)), and the US (Villalonga and Amit
(2009)), separation of control and cash-flow rights is also common in our sample. We
compute cash-flow rights, i.e. the fraction of dividends the controlling shareholder
receives, by multiplying all ownership stakes in the pyramidal chain. Considering
only links through listed companies, the claim of the Claro family on Santa Rita’s
dividends would be 9.2% (=50% x 34% x 54%). Adding the stakes held through
private companies, their cash-flow rights increase to 20%, which implies a 58%
separation between voting and cash-flow rights.
Overall, our sample covers 20 pyramidal groups in Chile. The average pyramid
has 5 listed firms, and multiple private firms associated to them. The pyramid with
most public firms has 11 of them, while the pyramid with fewest public firms has
only two of them. These 20 pyramids cover a substantial amount of Chile’ stock
market capitalization (approximately 60%), and certainly represent a significant
14
fraction of the economic activity of the country. Morck (2011) highlights that the
importance of business groups resides in that a few families control a significant
share of a country’s wealth. In this sense we benefit again from Chile’s unique recent
history since Chile’s largest firms are listed in the stock market and are therefore
present in our data set, in contrast to, for example, what happens in Continental
Europe (see Franks, Mayer, Volpin, and Wagner (2012) on the importance of private
firms in Europe). After both President Salvador Allende’s nationalization scheme in
the early 1970s and the debt crisis of the 1980s, most large companies were
nationalized. By the late 1980s the government of General Pinochet privatized most
of these firms through the stock market. Most of those companies are now in our
database. In addition, a few state-owned companies were privatized in the mid-1990s.
2. Providers and Receivers of Intra-Group Loans
a. Evidence From Firm Balances with all Intra-
Group Loans
Table 2 reports summary statistics for the main variables in our analysis. On
average net loans are 1.6% of book assets (individual, not consolidated assets). Short-
term loans are the lion’s share of loans (1.3% of assets), while the long-term portion
is smaller. The evolution in time of net loans can be seen in Table 3. We see no
tendency for these loans to disappear despite the rapid development of financial
markets in Chile throughout the sample period. Notice that the average is positive in
almost all years, implying that firms in our sample are on average lending to related

15
firms —including private firms whose balances we do not directly observe–rather
than receiving funds.
Table 4 shows the frequency of providers (receivers) of intra-group loans
defined as those firm-year observations with net intra-group loans larger (smaller)
than 5% (-5%) of book assets. Approximately 20% of firm-year observations are
labeled as providers and 12% as receivers. We also do the same categorization
considering only the short or the long-term portion of net loans. In the data we are
equally likely to observe short and long-term providers, and similarly among
receivers. Since average long-term net loans are smaller than short-term ones
according to Table 2, this implies that relatively small short-term loans (less than 5%
of assets) are frequent in the data. Short-term receivers are also long-term borrowers,
although by smaller amounts. Similarly, short-term providers also tend to be long-
term lenders.
We further split firms according to their position in the control pyramid. We
count the number of public companies between the controlling shareholder and the
firm under study in order to determine its position in the pyramid. For example,
firms in the second row of the pyramid are controlled though another public
company instead of being controlled directly by the ultimate owner. In the case of
the Claro Group in Figure 2, Navarino is a firm in the second row of the pyramid.
We find that providers are more frequent among firms down in the pyramid
than among firms up in the pyramid. For example, 22% of firms at the top of
pyramids are providers, while 29.5% of firms in position four or higher are providers.
The difference is more pronounced among short-term loans, where only 7.4% of firms
at the top are short-term providers, while 28.2% of firms in position four or higher
are short-term providers. It is important to note that large firms (most likely at the
16
top of pyramids) can mechanically be outside the provider/receiver status since we
are dividing net loans by total assets. However this is not always true. For example,
firms in the first line of pyramids are the ones with the highest frequency of long-
term providers in Table 4 (15.5% against an average of 10.1% among all firms).
Among receivers we see differences in the same direction as providers when
comparing firms in different positions in the pyramid. Simply put, receivers are also
more prevalent at the bottom of pyramids just like providers. For instance, 6.8% of
firms at the top of pyramids are receivers, while 34.6% of firms in position four or
higher are receivers. Perhaps a naïve tunneling prediction would be that firms up in
the pyramid should receive loans from firms down in the pyramid. Our preliminary
evidence suggests that loans in the pyramid are not on average from the bottom of
the pyramid towards upstream firms, but are more horizontal in nature: firms at the
bottom of the pyramid are active providers and receivers alike.
In Table 5 we show differences in firm characteristics between providers and
receivers. Providers are in general larger, less profitable, less capital-intensive (lower
PPE/assets), low Q firms, and where the cash-flow rights of the controlling
shareholder are lower when compared to receivers. The differences in means are in
general statistically significant, although less so when comparing short-term
providers and receivers. In terms of cash-flow rights, although statistically
significant, the differences are not large economically speaking. Controlling
shareholders have on average 41% of the cash-flow rights of providers and 51% of
receivers, but 41% is already quite high when compared to cash-flow rights in
pyramids in other countries, in particular in East Asia where cash-flow rights can be
less than 10% (see, for example, Claessens et al. (2002)). These results are,

17
nevertheless, consistent with tunneling in the sense that low cash-flow rights are
more likely among receivers rather than providers.
In Table 6 we report results from the following OLS regression of net intra-
group loans over total book assets provided by firm i in year t:
(NetLoans/Assets) ,= aCashFlowRights , + b(PPE/Assets) , + cln(Assets) ,+ d(EBIT/Assets) , + eQ , + μ + δ + ϵ , ,(1)
where μ represents firm fixed effects and δ represents year fixed effects. Standard
errors are clustered by firm. We report the regression for all loans, short-term loans,
and long-term loans.
We find that cash-flow rights have a negative effect on net loans, although the
effect is significant at the 10% level, and only when we include firm fixed effects
which absorb the average level of cash-flow rights. This suggests that a few dramatic
changes in cash-flow rights are associated with changes in net loans, but the levels of
cash-flow rights are not generally correlated with loans following from the regression
without the firm fixed effects (consistent with the previous evidence on providers are
receivers). PPE over total assets has a strong and significant negative effect on net
loans, implying that capital-intensive firms tend to receive intra-group loans rather
than to provide them. Firm size has a positive effect on loans, but also only when
firm fixed effects are included. Perhaps surprisingly, cash flow (EBIT over assets)
does not have an effect on loans, contrary to what the findings of Gopalan, Nanda,
and Seru (2007) for Indian business groups would suggest. Tobin’s Q has a negative
effect, which implies that high Q firms receive rather than provide funds. This is in

18
principle consistent with an efficient allocation of capital or “winner-picking” within
the firms that belong to the business group. However, the effect is again only seen
once we include firm fixed effects and is therefore associated with changes in time
more than with average valuations.
Next we conduct a multivariate probit analysis where p is the probability that
firm i is a provider (receiver) in year t. This probability is modeled as a function of
the same explanatory variables of the previous regressions:
p = Φ aCashFlowRights , + b PPEAssets , + cln(Assets) , + d EBITAssets ,+ eQ , + δ ,(2)
where Φ is the cumulative standard normal distribution. We also run an ordered
probit model where the dependent variable takes a number 1 if the firm is a receiver,
2 if the firm is neither a receiver nor a provider, and 3 if the firm is a provider.
The results of the different probit estimations are provided in Table 7. High
cash-flow rights reduce the chance of being a provider. According to these estimates,
a one-standard-deviation increase in cash-flow rights reduces the frequency of
providers from approximately 20% (see Table 4) to 13%. Higher cash-flow rights
increase the chance of being a receiver, but only in the long term. In the short term,
high cash flow rights reduce rather than increase the chances of being a receiver.
This is consistent with the evidence in Table 4 regarding the abundance of short-
term receivers at the bottom of pyramids.
High capital intensity reduces the chance of being a provider and increases the
chance of being a receiver. The results are consistent for the short- and long-term

19
portions. A one-standard-deviation increase in capital intensity reduces the frequency
of providers from 20% to 12%. Large firms are more likely to be providers and less
likely to be receivers. Tobin’s Q is a significant predictor of the receiver status, in
particular for long-term receivers. However, the effect of Q disappears in the probit
analysis of providers and in the ordered probit.
b. Evidence From Firm-Pair Balances
Following the Chilean law the total amount of intra-group loans is reported in
the balance sheet of each firm. Through the notes to the financial statements we
have more detailed information regarding loan balances with each individual related
firm starting in the year 2001. In terms of the stylized example in Figure 1, we do
not only know the overall balance of related loans in firm A (= LAB — LCA), but also
the balances of firm A and B (LAB) and firms A and C (LCA). We need at least one of
the firms in the pair to be publicly traded in order to get to this level of detail. For
example, if both firms B and C are private firms we cannot know how much
borrowing and lending there is between them, although we know how much
borrowing and lending they have with firm A if this is publicly traded.
We focus in this section in balances between public firms since in this case we can
compute firm characteristics in both ends of the loan. Since financial information is
not in general available for private firms, we do not know, for example, their size or
EBIT, and by definition we cannot compute market-related variables such as Tobin’s
Q. Table 8 shows the average number of connections to other public firms for each
public firm in our database. Firm pairs are only counted once, e.g., we count the pair
AB if both firms are listed and if they have an outstanding loan between them, but
we do not count the pair BA as a different connection. The overall average is about

20
two connections, with a minimum of one connection and a maximum of ten
connections per firm. In our sample we have slightly more than 500 observations of
loan balances between related firms.
In Table 8 we also report some statistics about the “creation” and
“destruction” of loan connections in time. There is time series variation provided by
changes in the size of the loans, but this can exist even if we always have the same
pair of firms. In this table we want to get a sense of how much variation there is in
the pairs of firms lending and borrowing to each other each year. We measure
creation and destruction by comparing the loan connections of a given firm in two
consecutive years. If firm A was connected to firm B in year t, but is connected to
firms B and C in year t+1, we count this as one connection created. If subsequently
in year t+2, firm A is connected only to firm C we count this as one connection
destroyed in that year. In each year we add up the creation and destruction for each
firm and then we average across firms. In Table 8 we see that the average of creation
and destruction is 0.49, which means approximately that one connection is created or
destroyed every two years. This is a substantial amount of turnover in loan
connections, so it is not the case that the same lenders lend to the same borrowers
throughout the entire sample period.
Table 9 reports some summary statistics for these balances. We report
averages always from the perspective of the lender (i.e., all numbers are positive).
The average balance of 2.4% of assets is above the average of 1.6% reported in Table
2.5 However, unlike Table 2, the long-term portion constitutes the lion’s share of this
average rather than the short-term portion. Differences between Tables 2 and 9
5 We divide loans by total book assets of the first firm reporting the loan in our sample (we exclude
the second mention of the same loan by the other firm in the pair). We have explored dividing always by book assets of the lending firm or the borrowing firm and it does not make a significant difference for the results.

21
depend on three factors: first, balances in Table 2 can be positive or negative;
second, balances in Table 2 include loans to and from private firms; and finally, the
balances in Table 2 net out loans in opposite directions from two listed firms (e.g.,
the balance of firm A nets out the loan extended to public firm B and the loan
received from public firm C). Therefore, the results in Table 9 are expected if loans
from listed firms are significant.
Since now we are able to identify firms in both ends of the loan we can
compute average balances between firms in the same and in different industries.6
This is interesting since firms in the same industry naturally trade more between
them and are more inclined to give credit to one another, in particular short-term
financing (see, for example, Helpman and Krugman (1989) on the extent of intra-
industry trade). Also, some of the theories on internal capital markets are naturally
applied to firms in conglomerates that operate in the same industry. For example,
the relative comparison of projects and “winner picking” are more easily applicable
to firms in closely related lines of business (Stein (2003)). We find that balances are
on average larger among same-industry firms (3.5% vs. 1.3%), and particularly in the
long-term portion. On the other hand, this evidence shows that intra-industry trade-
credit is not the sole story behind loans in business groups because there is
significant lending and borrowing across industries.
In the lower panel of Table 9 we show means of the difference in
characteristics between firm pairs. We report means of the difference between the
lender and the borrower in each pair. We see that differences between lender and
borrower characteristics go in the same direction for loans within and across
industries. For instance, lenders tend to be less capital intensive than borrowers in
6 Industries are defined at the four-digit level.
22
both cases. On average, lenders have 12% lower PPE over assets than borrowers.
Only for the case of EBIT over assets we find a significant difference between firms
in the same and in different industries, but in both cases we find that lenders are less
profitable than borrowers. These findings suggest that similar stories drive lending
within and across industries.
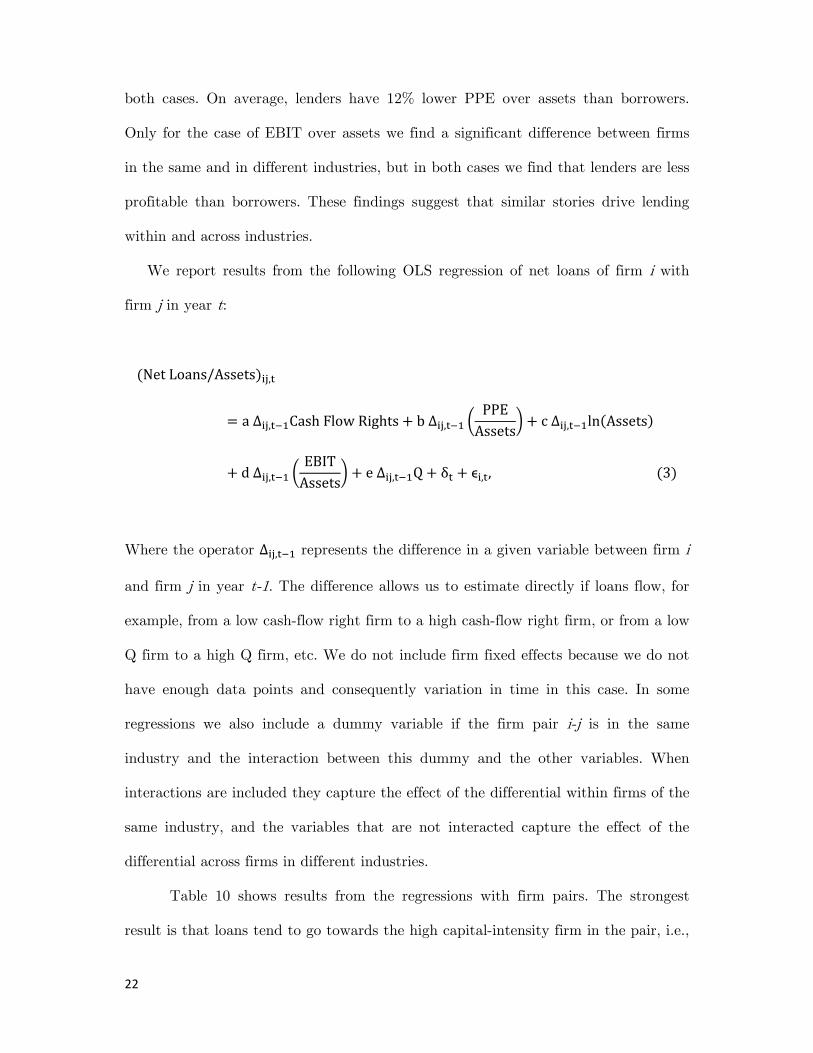
We report results from the following OLS regression of net loans of firm i with
firm j in year t:
(NetLoans/Assets) ,= a∆ , CashFlowRights + b∆ , PPEAssets + c∆ , ln(Assets)+ d∆ , EBITAssets + e∆ , Q + δ + ϵ , ,(3)
Where the operator ∆ , represents the difference in a given variable between firm i
and firm j in year t-1. The difference allows us to estimate directly if loans flow, for
example, from a low cash-flow right firm to a high cash-flow right firm, or from a low
Q firm to a high Q firm, etc. We do not include firm fixed effects because we do not
have enough data points and consequently variation in time in this case. In some
regressions we also include a dummy variable if the firm pair i-j is in the same
industry and the interaction between this dummy and the other variables. When
interactions are included they capture the effect of the differential within firms of the
same industry, and the variables that are not interacted capture the effect of the
differential across firms in different industries.
Table 10 shows results from the regressions with firm pairs. The strongest
result is that loans tend to go towards the high capital-intensity firm in the pair, i.e.,

23
the b coefficient in the regression above is negative and strongly significant. This is
true within the same industry and across industries, in particular for long-term loans.
The effect of cash-flow rights is less clear. The firm where the controlling shareholder
has more cash flow rights tends to receive loans. However, this is true for long-term
loans, yet the effect is reversed for short-term loans. Both effects are seen within the
same industry and across industries.
One potential bias that we have ignored so far is that we are considering only
firm pairs where there is a loan. However, many firms within the same pyramid are
not lending and borrowing from each other. In other words, there are lots of firm
pairs with a zero balance. The results so far in Table 10 can be interpreted as the
effect of different firm characteristics in the direction and magnitude of a loan
conditional on observing a loan. The potential problem is that the firm pairs with
zero balance can have similar characteristics as those pairs with a non-zero balance,
and therefore interpreting the results as unconditional effects becomes problematic.
For example, we found before that lenders tend to be less capital intensive than
borrowers. But what if there are important differences in capital intensity in firm
pairs where we do not see a loan? In other words, we cannot be sure that capital
intensity is an unconditional predictor of intra-group loans if we do not take into
account the pairs of firms with no loans between them.7
We approach this problem in two ways. First, we run simple OLS regressions
as in (3) but including the pairs of group-firms with zero balance. Second, we run a
Heckit model to take into account the selection bias in considering only pairs with
non-zero loans. It is important to note that we include the pairs of firms with zero
7 The situation is similar to the one in the literature on international trade related to the determinants of exports and imports. There are many country-pairs with no trade between them and this becomes important for evaluating trade theories (see Helpman, Melitz, and Rubinstein (2008) among others).

24
loans within groups and not all potential pairs of firms with zero loans. In other
words, we take the structure of groups as exogenous in determining the set of
potential connections of each firm. In a long run sense this is perhaps not correct
since firms can be sold and bought by another group, or they can simply disappear.
However, and consistent with evidence from groups around the world in Khanna and
Yafeh (2005), this is not a restrictive assumption in the short or medium run given
the slow-moving nature of group structures.
In the second panel of Table 10 we run the OLS regressions with the zero-
pairs included. The key effect of capital intensity remains after including these
observations. High capital intensity firms tend to receive funds from low capital
intensity firms. There is also a marginally significant effect of cash-flow rights, but it
goes in opposite directions for firms in the same and in different industry, which
blurs the interpretation a bit. The effect of Tobin’s Q goes in the right direction (i.e.,
low-Q firms lend to high-Q firms) across industries, but there is no effect of Q within
the same industry as “winner picking” theories might suggest.
In Table 11 we present the Heckit estimations. The first stage of Heckit is a
probit model where the dependent variable is 1 if there is a loan and 0 otherwise.
The second stage is a standard regression that includes the inverse of Mill’s ratio to
account for the self-selection bias (Wooldridge (2002)). We report two versions of the
Heckit model. First, a model where the first stage is run with observations from all
the pyramids and including pyramid fixed effects. In the second model we run the
first stage only with the observations of a single pyramid, and therefore the
estimation is specific to each pyramid. The first model is probably more efficient
since it uses more observations, and the second model is more flexible by not
imposing the same parameter estimates across all pyramids. We have fewer overall

25
observations in the second model since we need a minimum of observations to run
the probit for each pyramid in the first stage.
The results in Table 11 show that the effect of capital intensity is fairly robust
to applying the Heckit estimation. Overall, the message does not change much once
we correct for the selection bias in this way. Perhaps the only difference is that now
the effect of EBIT over assets appears strongly, implying that lenders tend to be
high EBIT-firms and borrowers tend to be low-EBIT firms. This is in line with the
support motive of internal capital markets as emphasized by Gopalan, Nanda, and
Seru (2007).
3. The Use of Intra-Group Loans
Finally, we study the impact of intra-group loans on real investment and
dividend payments in order to paint a complete picture of the potential uses of intra-
group loans. We also examine briefly the connection with equity financing, which is
an alternative source of funds for public firms.
In terms of real investment we run an OLS regression of the following type:
(Investment/Assets) ,= aNetProvider , + bCashFlowRights , + c(PPE/Assets) ,+ dln(Assets) , + e(EBIT/Assets) , + fQ , + μ + δ+ ϵ , ,(4)
26
In Table 12 we study fixed investment (changes in PPE) and non-fixed
investment (changes in non-PPE assets). Net Provider is a dummy for the providers
of intra-group loans as identified previously. The regressions using Net Receiver is
analogous. We see significant effects in fixed investment, although not in non-fixed
investment. The rate of fixed investment is 2.2% higher if the firm is a receiver, and
1.3% lower if the firm is a provider (estimates from the regression with firm fixed
effects). The effect on fixed investment fits with the previous evidence that capital
intensive firms are the ones most likely to receive intra-group loans.
Chilean law requires firms to distribute at least 30% of annual earnings as
dividends; therefore earnings and dividends are tightly linked in the Chilean market.
This type of regulation, which is a way to protect minority shareholders, is common
in emerging markets as documented by La Porta, Lopez-de-Silanes, Shleifer, and
Vishny (1998). Firms can also decide to pay dividends above the 30% rate. We run
two different models for dividend payments. First, we run a probit model where the
dependent variable is a 1 if the firm distributed dividends above the 30% threshold
and 0 otherwise. Then we run a tobit model for extraordinary dividends, which are
defined as the actual amount of dividends paid during the year minus 30% of
earnings. In this last case the dependent variable is censored in zero and
consequently the tobit methodology is appropriate.
We show the results for dividends in Table 13. The provider-receiver status
has no predictive power over dividends above and beyond the other firm
characteristics. Only in the tobit estimation we see marginally significant effect of
being a receiver in the amount of extraordinary dividends that are paid. Some of the
other coefficients are interesting. For example, high cash-flow rights have a positive
and highly significant impact on dividends, which is probably not too surprising.
27
Compared to the frequency of intra-group loans, equity issues are relatively
rare in this market. They still represent an important source of funds for growing
firms so it is interesting to see if there is a connection between these different sources
of funds. In particular, we study whether there is a tendency to use some of the
proceeds of the issuance to provide funds to other firms in the pyramid through
intra-group loans. We show some suggestive evidence in this regard in Table 14. Net
providers are more frequent among firms that issue equity than among non-issuers,
in particular in the short-term. Among issuers, 17% are short-term providers, while
among non-issuers only 12% are short-term providers. We do not find a difference in
long-term providers. This is only suggestive evidence because it is hard to prove that
the proceeds of the issuance are literally used for intra-group loans. It can be the case
that providers and issuers share similar characteristics and that there is no
redirecting of proceeds to other firms in the pyramid.
4. Conclusions
Business groups are present in almost every single country in the world. These
sets of firms, managed by families and often structured through pyramids, typically
comprise a significant fraction of the wealth of a country. They can have both
positive and negative effects. On the one hand, they can effectively replace the
government in Big Push development efforts (Morck 2011). On the other hand, they
can lead to “economic entrenchment”, thus biasing capital allocation and hampering
growth Morck, Wolfenson, and Yeung (2005).
In order to shed some light into the impact of business groups we focus on their
internal capital markets. Using Chilean data we construct a 20 year (1990-2009)
28
panel database with the internal capital markets’ activity of business groups.
Furthermore, for the years 2001-2009 our data coverage improves and we can track
every transaction within the group. Key for our purposes, we are able to understand
the web of pyramids which is typical of business groups, obtaining, for each firm,
both the voting and cash flow rights of the controlling shareholder.
Perhaps surprisingly, internal capital markets are extremely active, even by the
end of our sample in 2009. We see that capital intensive firms tend to receive intra-
group loans, therefore supporting the financing advantage of pyramids postulated by
Almeida and Wolfenzon (2006). However, our results also support the existence of
tunneling (Bertrand, Mehta, and Mullainathan (2002), and Jiang, Lee, and Yue
(2010)), since firms with high cash flows rights on the side of the controlling
shareholder are more likely to be receivers than providers. However, both providers
and receivers are more frequent in the lower ranks of pyramids; therefore the
tunneling motivation appears to be important only in the margin. We also study the
impact of intra-group loans on investment and dividend payments. We observe
significant effects in fixed investment, as receivers have higher fixed investment than
other firms. We do not find strong evidence of intra-group loans affecting dividend
payments in firms providing or receiving loans.
One potential area of future research is the interplay between internal capital
markets and external capital markets. Understanding which firms get external
financing within the group, and how the group subsequently allocates these funds
can certainly improve our understanding of internal capital markets. In a similar
way, understanding how providers of funds prevent business groups from doing this,
i.e., by setting up covenants and guarantees, can shed some light on the functioning
of capital markets in a host of similar countries.

29
References
Adams, Renée, and Daniel Ferreira, 2008, One share-one vote: The empirical
evidence, Review of Finance 12, 51–91.
Almeida, Heitor and Chang-Soo Kim, 2012, Internal Capital Markets in
Business Groups: Evidence from the Asian Financial Crisis, Working Paper.
Almeida, Heitor, Sang Yong Park, Marti Subrahmanyam, and Daniel
Wolfenzon, 2011, The structure and formation of business groups: Evidence from
Korean chaebols, Journal of Financial Economics 99, 447–475.
Almeida, Heitor and Daniel Wolfenzon, 2006, A theory of pyramidal
ownership and family business groups, Journal of Finance 61, 2637-2680.
Almeida, Heitor and Daniel Wolfenzon, 2006b, Should business groups be
dismantled? The equilibrium costs of eficient internal capital markets, Journal of
Financial Economics 79, 99-144.
Bertrand, Marianne, Paras Mehta, and Sendhil Mullainathan, 2002, Ferreting
out tunneling: An application to Indian business groups, Quarterly Journal of
Economics 117, 121-148.
Claessens, Stjin, Simeon Djankov, Joseph Fan, and Larry Lang, 2002,
Disentangling the incentive and entrenchment effects of large shareholdings, Journal
of Finance 57, 2741-2771.
Claessens, Stijn, Simeon Djankov, and Larry Lang, 2000, The separation of
ownership and control in East Asian corporations, Journal of Financial Economics
58, 81–112.
Faccio, Mara, and Larry Lang, 2002, The ultimate ownership of western
European corporations, Journal of Financial Economics 65, 365–395.

30
Franks, Julian, Colin Mayer, Paolo Volpin, and Hannes F. Wagner, 2012, The
Life Cycle of Family Ownership: International Evidence, Review of Financial Studies,
forthcoming.
Gopalan, Radhakrishnan, Vikram Nanda, and Amit Seru, 2007, Affiliated
firms and financial support: Evidence from Indian business groups, Journal of
Financial Economics 86, 759–795.
Helpman, Elhanan and Paul R. Krugman, 1989, Trade Policy and Market
Structure, Cambridge, MA: The MIT Press.
Helpman, Elhanan, Melitz Marc and Rubinstein Yona, 2008, Estimating trade
flows: tranding partners and trading volumes, The Quarterly Journal of Economics,
123(2), 441-487.
Helwege, Jean, Christo Pirinsky, and René M. Stulz, 2007, Why do firms
become widely held? An analysis of the dynamics of corporate ownership, Journal of
Finance 62, 995–1028.
Jiang, Guohua, Charles M.C. Lee, and Heng Yue, 2010, Tunneling through
intercorporate loans: The China experience, Journal of Financial Economics 98, 1–
20.
Johnson, Simon, Rafael La Porta, Florencio López-de-Silanes, and Andrei
Shleifer, 2000, Tunneling, American Economic Review 90, 22–27.
Khanna, Tarun and Yishay Yafeh, 2005, Business groups and risk sharing
around the world, Journal of Business 78, 301-340.
Khanna, Tarun and Yishay Yafeh, 2007, Business groups in emerging
markets: Paragons or parasites?, Journal of Economic Literature 45(2), 331-372.
31
Khanna, Tarun, and Krishna Palepu, 2000, Is group affiliation profitable in
emerging markets? An analysis of diversified Indian business groups, Journal of
Finance 55, 867–891.
Khanna, Tarun, and Catherine Thomas, 2009, Synchronicity and Firm
Interlocks in an Emerging Market, Journal of Financial Economics 92(2), 182—204.
La Porta, Rafael, Florencio López-de-Silanes, Andrei Shleifer, and Robert
Vishny, 1998, Law and finance, Journal of Political Economy 106, 1113–1155.
Morck, Randall. 2011, Finance and Governance in Developing Economics,
Annual Review of Financial Economics 3(Dec.) 375-406
Morck, Randall, Daniel Wolfenson, and Bernard Yeung, 2005, Corporate
Governance, economic entrenchment, and growth, Journal of Economic Literature
43, 655-720.
Shin, Hyun-Han and Cyn-Young Park, 1999, Financing Constraints and
Internal Capital Markets: Evidence from Korean Chaebols, Journal of Corporate
Finance, 5(2), 169-191.
Siegel, Jordan and Prithwiraj Choudhury, 2012, A Reexamination of
Tunneling and Business Groups: New Data and New Methods, Review of Financial
Studies 25(5).
Stein, Jeremy C., 2003, Agency, information, and corporate investment, in
Handbook of the Economics of Finance, edited by George Constantinides, Milton
Harris, and Rene Stulz, Amsterdam: North Holland.
Urzúa, Francisco, 2009, Too few dividends? Groups tunneling through chair
and board compensation, Journal of Corporate Finance 15, 245-256.
Villalonga, Belen, and Raphael Amit, 2009, How are U.S. family firms
controlled? Review of Financial Studies 22, 3047–3091.

32
Wooldrige, Jeffrey, 2002, Econometric Analysis of Cross Section and Panel
Data, 2nd Edition, The MIT Press Cambridge, Massachusetts London, England.
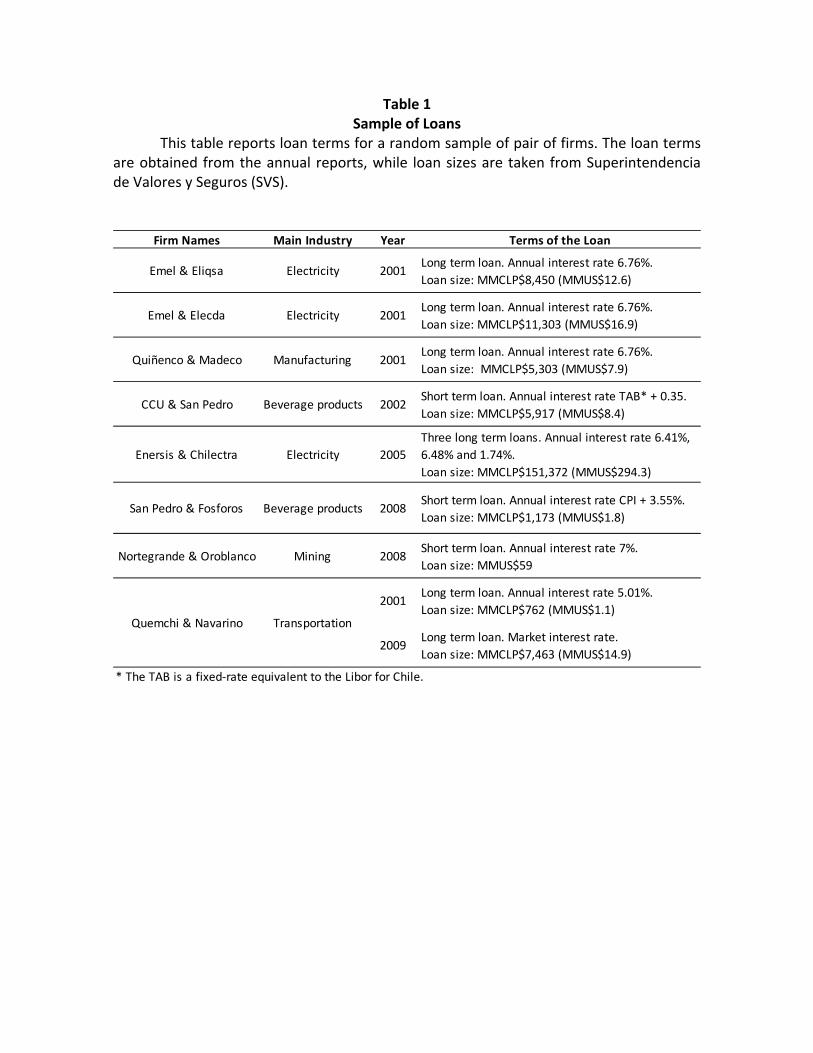
Table 1 Sample of Loans
This table reports loan terms for a random sample of pair of firms. The loan terms are obtained from the annual reports, while loan sizes are taken from Superintendencia de Valores y Seguros (SVS).
Firm Names Main Industry Year Terms of the Loan
Emel & Eliqsa Electricity 2001 Long term loan. Annual interest rate 6.76%.Loan size: MMCLP$8,450 (MMUS$12.6)
Emel & Elecda Electricity 2001 Long term loan. Annual interest rate 6.76%.Loan size: MMCLP$11,303 (MMUS$16.9)
Quiñenco & Madeco Manufacturing 2001 Long term loan. Annual interest rate 6.76%.Loan size: MMCLP$5,303 (MMUS$7.9)
CCU & San Pedro Beverage products 2002 Short term loan. Annual interest rate TAB* + 0.35.Loan size: MMCLP$5,917 (MMUS$8.4)
Enersis & Chilectra Electricity 2005Three long term loans. Annual interest rate 6.41%, 6.48% and 1.74%.Loan size: MMCLP$151,372 (MMUS$294.3)
San Pedro & Fosforos Beverage products 2008 Short term loan. Annual interest rate CPI + 3.55%.Loan size: MMCLP$1,173 (MMUS$1.8)
Nortegrande & Oroblanco Mining 2008 Short term loan. Annual interest rate 7%.Loan size: MMUS$59
2001 Long term loan. Annual interest rate 5.01%.Loan size: MMCLP$762 (MMUS$1.1)
2009 Long term loan. Market interest rate.Loan size: MMCLP$7,463 (MMUS$14.9)
* The TAB is a fixed‐rate equivalent to the Libor for Chile.
Quemchi & Navarino Transportation

Table 2 Summary Statistics for Main Variables
This table reports aggregate summary statistics for total net loans, short term net loans, long term net loans (all over total assets), cash flow rights, PPE over total assets, the natural logarithm of total assets, EBIT over total assets and Tobin’s Q. Short‐term is defined as loans due in one year or less, while long‐term is defined as loans due in more than one year. All variables except for cash flow rights are winsorized at the 1% level. The sample covers non‐financial Chilean firms in pyramidal business groups from 1990 to 2009. Data are taken from Economatica, Fecus Plus, and Superintendencia de Valores y Seguros (SVS).
Number ofObservations
Mean StandardDeviation
25thPercentile
Median 75thPercentile
Net Loans / Total Assets 1187 1.6% 13.3% ‐0.8% 0.4% 3.9%Net Loans S‐T / Total Assets 1187 1.3% 7.1% ‐0.4% 0.2% 2.0%Net Loans L‐T / Total Assets 1187 0.2% 9.7% 0.0% 0.0% 0.2%Cash Flow Rights 1243 48% 23% 32% 47% 64%PPE / Total Assets 1187 27% 30% 0% 16% 50%Ln (Total Assets) 1187 18.83 1.57 17.78 18.75 19.95EBIT / Total Assets 1154 4.6% 7.5% ‐0.2% 2.0% 8.3%Tobin's Q 1134 1.27 0.78 0.79 1.08 1.54
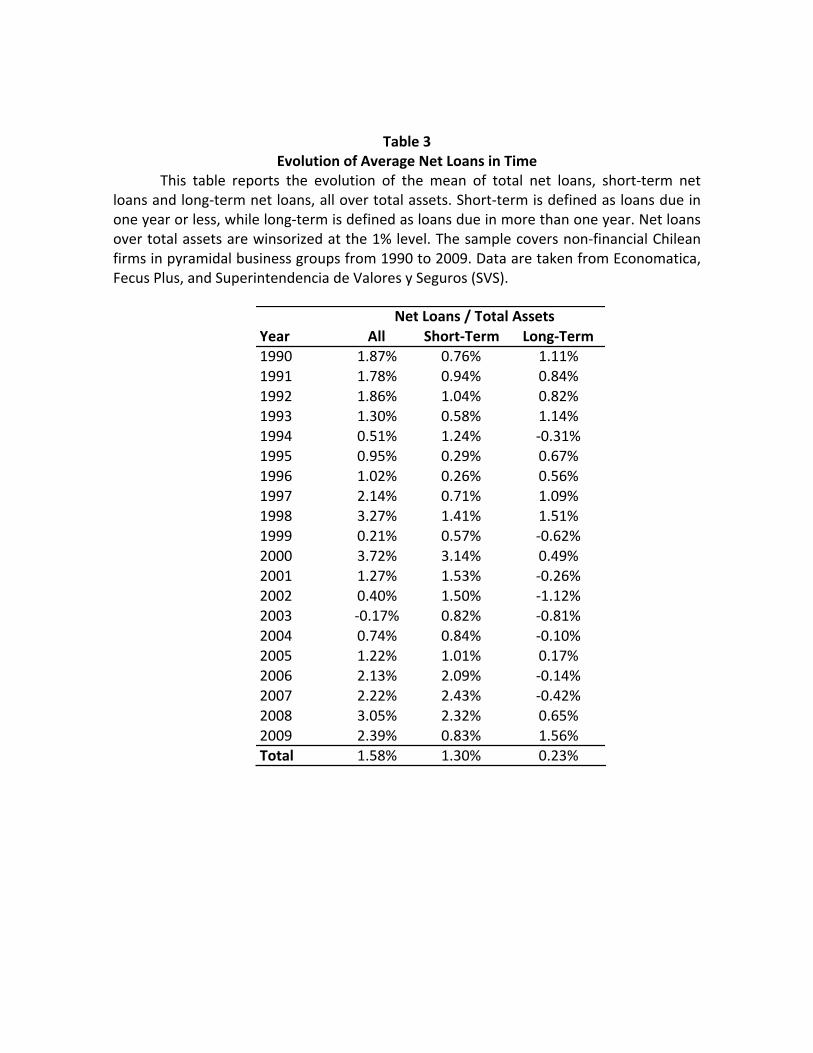
Table 3
Evolution of Average Net Loans in Time This table reports the evolution of the mean of total net loans, short‐term net
loans and long‐term net loans, all over total assets. Short‐term is defined as loans due in one year or less, while long‐term is defined as loans due in more than one year. Net loans over total assets are winsorized at the 1% level. The sample covers non‐financial Chilean firms in pyramidal business groups from 1990 to 2009. Data are taken from Economatica, Fecus Plus, and Superintendencia de Valores y Seguros (SVS).
Year All Short-Term Long-Term1990 1.87% 0.76% 1.11%1991 1.78% 0.94% 0.84%1992 1.86% 1.04% 0.82%1993 1.30% 0.58% 1.14%1994 0.51% 1.24% ‐0.31%1995 0.95% 0.29% 0.67%1996 1.02% 0.26% 0.56%1997 2.14% 0.71% 1.09%1998 3.27% 1.41% 1.51%1999 0.21% 0.57% ‐0.62%2000 3.72% 3.14% 0.49%2001 1.27% 1.53% ‐0.26%2002 0.40% 1.50% ‐1.12%2003 ‐0.17% 0.82% ‐0.81%2004 0.74% 0.84% ‐0.10%2005 1.22% 1.01% 0.17%2006 2.13% 2.09% ‐0.14%2007 2.22% 2.43% ‐0.42%2008 3.05% 2.32% 0.65%2009 2.39% 0.83% 1.56%Total 1.58% 1.30% 0.23%
Net Loans / Total Assets

Table 4
Summary Statistics for Providers and Receivers This table reports summary statistics for provider and receivers at different terms.
We define net provider as a dummy variable that identifies with 1 those firm‐year observations with more than 5% of net loans over total assets, while net receiver is defined as a dummy variables that identifies with 1 those firm‐year observations with less than ‐5% of net loans over total assets. We divide net providers and net receivers by the term of loans: all refers to all loans, short‐term is defined as loans due in one year or less, while long‐term is defined as loans due in more than one year. Panel A presents frequency for providers and receivers dummies in the whole pyramid and at different layers of the pyramid. Panel B reports average total net loans, short‐term net loans, and long‐term net loans, all over total assets. All variables except for cash flow rights are winsorized at the 1% level. The sample covers non‐financial Chilean firms in pyramidal business groups from 1990 to 2009. Data are taken from Economatica, Fecus Plus, and Superintendencia de Valores y Seguros (SVS).
Net Provider Net Receiver Net Provider Net Receiver Net Provider Net ReceiverPanel A: FrequencyAll Firms 20.7% 12.2% 12.5% 7.5% 10.1% 8.4%In Position 1 of Pyramids 22.0% 6.8% 7.4% 3.7% 15.5% 3.1%In Position 2 of Pyramids 16.2% 14.4% 10.8% 8.1% 7.3% 12.7%In Position 3 of Pyramids 34.8% 12.9% 22.9% 7.0% 13.4% 10.0%In position 4 or more of Pyramids 29.5% 34.6% 28.2% 30.8% 14.1% 10.3%Panel B: Average Net LoansNet Loans / Total Assets 17.6% ‐19.5% 16.8% ‐16.7% 19.4% ‐20.8%Net Loans S‐T / Total Assets 8.5% ‐6.0% 14.4% ‐10.9% 2.0% ‐0.9%Net Loans L‐T / Total Assets 8.5% ‐12.8% 1.6% ‐5.2% 17.2% ‐19.5%
All Short-Term Long-Term

Table 5
Differences in Means of Characteristics for Providers and Receivers This table reports mean and t‐test statistics for the difference in means between
provider and receivers at different terms. We define net provider as a dummy variable that identifies with 1 those firm‐year observations with more than 5% of net loans over total assets, while net receiver is defined as a dummy variable that identifies with 1 those firms‐year observations with less than ‐5% of net loans over total assets. We divide net providers and net receivers by the term of loans: all refers to all loans, short‐term is defined as loans due in one year or less, while long‐term is defined as loans due in more than one year. Statistics are presented for cash flow rights, PPE over total assets, the natural logarithm of total asset, EBIT over total assets and Tobin’s Q. All variables except for cash flow rights are winsorized at the 1% level. The sample covers non‐financial Chilean firms in pyramidal business groups from 1990 to 2009. Data are taken from Economatica, Fecus Plus, and Superintendencia de Valores y Seguros (SVS).
Net Provider Net Receiver t-test Net Provider Net Receiver t-test Net Provider Net Receiver t-testCash Flow Rights 0.41 0.51 *** 0.39 0.44 * 0.42 0.60 ***PPE / Total Assets 0.20 0.40 *** 0.22 0.33 *** 0.16 0.47 ***Ln (Total Assets) 19.28 18.55 *** 19.16 18.33 *** 19.57 18.72 ***EBIT / Total Assets 0.03 0.07 *** 0.04 0.06 *** 0.02 0.08 ***Tobin's Q 1.24 1.45 *** 1.34 1.45 1.19 1.51 ***
*** p<0.01, ** p<0.05, * p<0.1
All Short-Term Long-Term
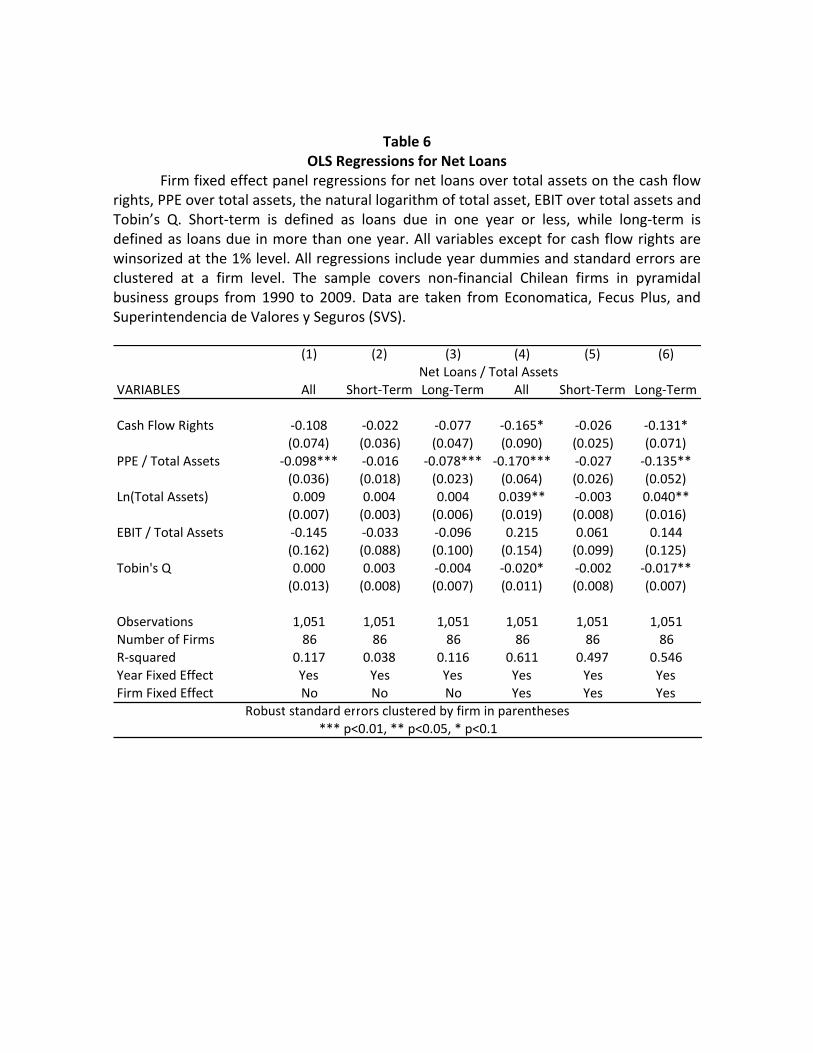
Table 6
OLS Regressions for Net Loans Firm fixed effect panel regressions for net loans over total assets on the cash flow
rights, PPE over total assets, the natural logarithm of total asset, EBIT over total assets and Tobin’s Q. Short‐term is defined as loans due in one year or less, while long‐term is defined as loans due in more than one year. All variables except for cash flow rights are winsorized at the 1% level. All regressions include year dummies and standard errors are clustered at a firm level. The sample covers non‐financial Chilean firms in pyramidal business groups from 1990 to 2009. Data are taken from Economatica, Fecus Plus, and Superintendencia de Valores y Seguros (SVS).
(1) (2) (3) (4) (5) (6)
VARIABLES All Short‐Term Long‐Term All Short‐Term Long‐Term
Cash Flow Rights ‐0.108 ‐0.022 ‐0.077 ‐0.165* ‐0.026 ‐0.131*(0.074) (0.036) (0.047) (0.090) (0.025) (0.071)
PPE / Total Assets ‐0.098*** ‐0.016 ‐0.078*** ‐0.170*** ‐0.027 ‐0.135**(0.036) (0.018) (0.023) (0.064) (0.026) (0.052)
Ln(Total Assets) 0.009 0.004 0.004 0.039** ‐0.003 0.040**(0.007) (0.003) (0.006) (0.019) (0.008) (0.016)
EBIT / Total Assets ‐0.145 ‐0.033 ‐0.096 0.215 0.061 0.144(0.162) (0.088) (0.100) (0.154) (0.099) (0.125)
Tobin's Q 0.000 0.003 ‐0.004 ‐0.020* ‐0.002 ‐0.017**(0.013) (0.008) (0.007) (0.011) (0.008) (0.007)
Observations 1,051 1,051 1,051 1,051 1,051 1,051Number of Firms 86 86 86 86 86 86R‐squared 0.117 0.038 0.116 0.611 0.497 0.546Year Fixed Effect Yes Yes Yes Yes Yes YesFirm Fixed Effect No No No Yes Yes Yes
Net Loans / Total Assets
Robust standard errors clustered by firm in parentheses*** p<0.01, ** p<0.05, * p<0.1

Table 7 Probit and Ordered Probit Regressions for Providers and Receivers
This table presents probit and order probit regressions. In the case of the probit our dependent variables are net provider, whish is a dummy variable that identifies with 1 those firm‐year observations with more than 5% of net loans over total assets and net receiver, defined as a dummy variable that identifies with 1 those firm‐year observations with less than ‐5% of net loans over total assets. In the case of the order probit our dependent variable takes the number of 1 if is a net receiver, a number of 2 if it is neither a net receiver nor a net provider, and 3 if it is a net provider. We divide net providers and net receivers by the term of loans: all refers to all loans, short‐term is defined as loans due in one year or less, while long‐term is defined as loans due in more than one year. Our set of controls are cash flow rights, PPE over total assets, the natural logarithm of total asset, EBIT over total assets and Tobin’s Q. All regressions include year dummies and standard errors are robust. All variables except for cash flow rights are winsorized at the 1% level. The sample covers non‐financial Chilean firms in pyramidal business groups from 1990 to 2009. Data are taken from Economatica, Fecus Plus, and Superintendencia de Valores y Seguros (SVS).

Table 8
Loan Connections This table reports the evolution of the average number of loan connections and the
creation and destruction of loan connections. A connection is defined as a net loan balance greater than zero for a pair of public firms inside a pyramid. The sample covers non‐financial Chilean firms in pyramidal business groups from 2001 to 2009. Data are taken from Superintendencia de Valores y Seguros (SVS).
Year Mean Min Max Mean Min Max2001 2.19 1 7 . . .2002 2.30 1 10 0.51 0 62003 2.23 1 7 0.47 0 42004 2.06 1 5 0.41 0 22005 1.94 1 6 0.49 0 32006 1.86 1 6 0.57 0 42007 1.80 1 6 0.42 0 32008 1.97 1 8 0.57 0 62009 1.73 1 5 0.43 0 2All 2.02 1 10 0.49 0 6
Number ofLoan Connections
Creation/Destructionof Loan Connections

Table 9 Means for Net Loans and Differences in Firm Characteristics for Firm-Pair Balances
This table reports mean and t‐test statistics for the difference in means between firm pairs in the same industry and firm pairs in different industries. Statistics are presented for total net loans, short term net loans and long term net loans over total assets, difference of cash flow rights, difference of PPE over total assets, difference of the natural logarithm of total asset, difference of EBIT over total assets and difference of Tobin’s Q. Short‐term is defined as loans due in one year or less, while long‐term is defined for loans due in more than one year. All variables except from net loans and cash flow rights are winsorized at the 1% level. Same Industry indicates that both firms have the same four digit industry code. The sample covers non‐financial Chilean firms in pyramidal business groups from 2001 to 2009. Data are taken from Economatica, Fecus Plus, and Superintendencia de Valores y Seguros (SVS).
All Same Industry Different Industry t-testPanel A: Average Net LoansNet Loans (All) / Total Assets 2.4% 3.5% 1.3% **Net Loans (S‐T)/ Total Assets 0.9% 1.0% 0.8% Net Loans (L‐T) / Total Assets 1.6% 2.7% 0.6% ***Panel B: Differences in Firm CharacteristicsΔ Cash Flow Rights 3.0% 3.7% 2.3% Δ PPE / Total Assets ‐12.3% ‐11.7% ‐12.9% Δ Ln (Total Assets) 0.273 0.153 0.391 Δ EBIT / Total Assets ‐1.9% ‐1.2% ‐2.6% **Δ Tobin's Q ‐0.055 ‐0.028 ‐0.081

Table 10 OLS Regressions for Net Loans in Firm-Pair Balances
OLS regressions for net loans in firms‐pair balances over total assets on the difference of total assets, the difference of cash flow rights, the difference of PPE over total assets, the difference of the natural logarithm of total asset, the difference of EBIT over total assets and the difference of Tobin’s Q. We divide net loans by their term: all refers to all loans, short‐term is defined as loans due in one year or less, while long‐term is defined as loans due in more than one year. All variables except from net loans and cash flow rights are winsorized at the 1% level. Same Industry is a dummy variable that identifies with 1 those firm‐pair observations in which both firms belong to the same four digit industry code. All regressions include year dummies and standard errors are robust. The sample covers non‐financial Chilean firms in pyramidal business groups from 2001 to 2009. Data are taken from Economatica, Fecus Plus, and Superintendencia de Valores y Seguros (SVS).
(1) (2) (3) (4) (5) (6)
VARIABLESNet Loans (All) /
Total AssetsNet Loans (S-T) /
Total Assets Net Loans (L-T) /
Total AssetsNet Loans (All) /
Total AssetsNet Loans (S-T)/
Total Assets Net Loans (L-T) /
Total Assets
Δ Cash Flow Rights ‐0.014 0.009** ‐0.300* 0.002 0.001 0.076**(0.020) (0.004) (0.152) (0.005) (0.002) (0.035)
Δ PPE / Total Assets ‐0.082*** ‐0.021** ‐0.160*** ‐0.021*** ‐0.001 ‐0.057***(0.022) (0.008) (0.051) (0.006) (0.003) (0.016)
Δ Ln (Total Assets) ‐0.004 ‐0.002** ‐0.012 0.001 0.000 0.004(0.002) (0.001) (0.009) (0.001) (0.000) (0.006)
Δ EBIT / Total Assets 0.192 0.063* 0.428 0.008 0.016 0.079(0.134) (0.034) (0.381) (0.024) (0.016) (0.161)
Δ Tobin's Q 0.008 0.001 0.031 ‐0.003 ‐0.001 ‐0.055**(0.015) (0.001) (0.035) (0.003) (0.001) (0.027)
Same Industry 0.020** ‐0.008*** 0.129***(0.010) (0.003) (0.019)
Same Industry × Δ Cash Flow Rights ‐0.121* 0.030*** ‐0.934***(0.064) (0.012) (0.146)
Same Industry × Δ PPE / Total Assets ‐0.154*** ‐0.041** ‐0.309**(0.053) (0.017) (0.124)
Same Industry × Δ Ln (Total Assets) ‐0.008* ‐0.004*** ‐0.019**(0.005) (0.001) (0.009)
Same Industry × Δ EBIT / Total Assets 0.440* 0.079 0.507*(0.233) (0.066) (0.295)
Same Industry × Δ Tobin's Q 0.017 0.003 0.106***(0.020) (0.003) (0.029)
Observations 481 464 102 481 464 102R‐squared 0.125 0.097 0.302 0.249 0.182 0.583Year FE Yes Yes Yes Yes Yes Yes
Panel A: Excluding Pairs of Firms with Net Loans equal to zero.
Robust standard errors in parentheses*** p<0.01, ** p<0.05, * p<0.1
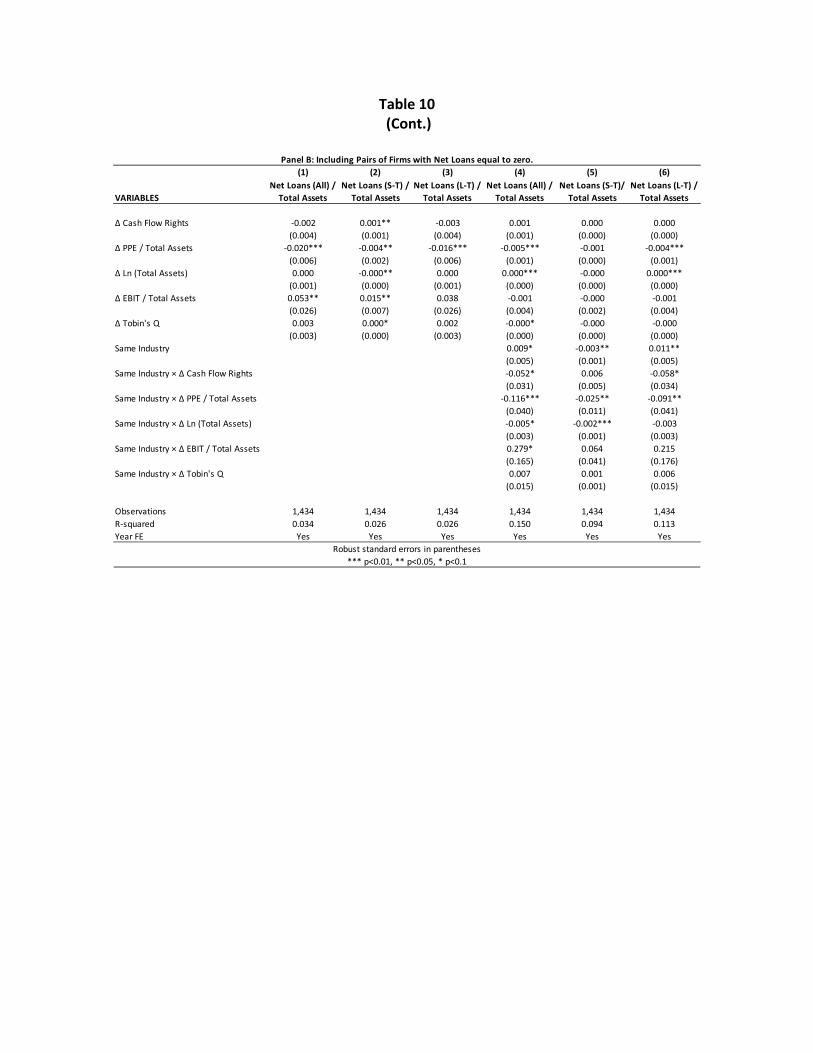
Table 10 (Cont.)
(1) (2) (3) (4) (5) (6)
VARIABLESNet Loans (All) /
Total AssetsNet Loans (S-T) /
Total Assets Net Loans (L-T) /
Total AssetsNet Loans (All) /
Total AssetsNet Loans (S-T)/
Total Assets Net Loans (L-T) /
Total Assets
Δ Cash Flow Rights ‐0.002 0.001** ‐0.003 0.001 0.000 0.000(0.004) (0.001) (0.004) (0.001) (0.000) (0.000)
Δ PPE / Total Assets ‐0.020*** ‐0.004** ‐0.016*** ‐0.005*** ‐0.001 ‐0.004***(0.006) (0.002) (0.006) (0.001) (0.000) (0.001)
Δ Ln (Total Assets) 0.000 ‐0.000** 0.000 0.000*** ‐0.000 0.000***(0.001) (0.000) (0.001) (0.000) (0.000) (0.000)
Δ EBIT / Total Assets 0.053** 0.015** 0.038 ‐0.001 ‐0.000 ‐0.001(0.026) (0.007) (0.026) (0.004) (0.002) (0.004)
Δ Tobin's Q 0.003 0.000* 0.002 ‐0.000* ‐0.000 ‐0.000(0.003) (0.000) (0.003) (0.000) (0.000) (0.000)
Same Industry 0.009* ‐0.003** 0.011**(0.005) (0.001) (0.005)
Same Industry × Δ Cash Flow Rights ‐0.052* 0.006 ‐0.058*(0.031) (0.005) (0.034)
Same Industry × Δ PPE / Total Assets ‐0.116*** ‐0.025** ‐0.091**(0.040) (0.011) (0.041)
Same Industry × Δ Ln (Total Assets) ‐0.005* ‐0.002*** ‐0.003(0.003) (0.001) (0.003)
Same Industry × Δ EBIT / Total Assets 0.279* 0.064 0.215(0.165) (0.041) (0.176)
Same Industry × Δ Tobin's Q 0.007 0.001 0.006(0.015) (0.001) (0.015)
Observations 1,434 1,434 1,434 1,434 1,434 1,434R‐squared 0.034 0.026 0.026 0.150 0.094 0.113Year FE Yes Yes Yes Yes Yes Yes
Robust standard errors in parentheses*** p<0.01, ** p<0.05, * p<0.1
Panel B: Including Pairs of Firms with Net Loans equal to zero.

Table 11 Heckit Regressions for Firm-Pair Balances
Heckit two step regressions for net loans in firms‐pair balances over total assets on the difference of total assets, the difference of cash flow rights, the difference of PPE over total assets, the difference of the natural logarithm of total asset, the difference of EBIT over total assets, and the difference of Tobin’s Q. Short‐term is defined as loans due in one year or less, while long‐term is defined as loans due in more than one year. In column (1) and (2) we run a common first step for all firms, while in columns (3) and (4) we run the first step for each pyramid. All variables from net loans and cash flow rights are winsorized at the 1% level. Same Industry is a dummy variable that identifies with 1 those firm‐pair observations in which both firms belong to the same four digit industry code. All regressions include year dummies. The sample covers non‐financial Chilean firms in pyramidal business groups from 2001 to 2009. Data are taken from Economatica, Fecus Plus, and Superintendencia de Valores y Seguros (SVS).
(1) (2) (3) (4)
Δ Cash Flow Rights ‐0.007 0.004 ‐0.014 0.002(0.015) (0.019) (0.013) (0.003)
Δ PPE / Total Assets ‐0.073*** ‐0.019 ‐0.020*** ‐0.011**(0.011) (0.014) (0.006) (0.005)
Δ Ln (Total Assets) ‐0.003 0.001 ‐0.003 0.000(0.002) (0.003) (0.002) (0.000)
Δ EBIT / Total Assets 0.161*** 0.013 0.067*** 0.039*(0.054) (0.072) (0.024) (0.023)
Δ Tobin's Q 0.008* ‐0.004 ‐0.006 ‐0.001(0.005) (0.008) (0.006) (0.002)
Same Industry 0.010 0.007(0.007) (0.004)
Same Industry × Δ Cash Flow Rights ‐0.077** ‐0.046(0.033) (0.040)
Same Industry × Δ PPE / Total Assets ‐0.136*** ‐0.025(0.023) (0.016)
Same Industry × Δ Ln (Total Assets) ‐0.004 ‐0.007*(0.004) (0.004)
Same Industry × Δ EBIT / Total Assets 0.343*** 0.041(0.102) (0.057)
Same Industry × Δ Tobin's Q 0.018* ‐0.010(0.010) (0.012)
Constant 0.004 ‐0.011 0.009*** 0.005(0.014) (0.015) (0.003) (0.004)
Observations 1,434 1,434 411 411Year FE Yes Yes Yes Yes
Net Loans / Total Assets
*** p<0.01, ** p<0.05, * p<0.1Standard errors in parentheses

Table 12
OLS Regressions for Firm Investment Firm fixed effect panel regressions for firm investment on net provider and net
receiver dummies at different terms, cash flow rights, PPE over total assets, the natural logarithm of total asset, EBIT over total assets and Tobin’s Q. Investment in fixed assets (non‐fixed assets) is defined as change in fixed assets (non‐fixed assets) over the lag of total assets. Short‐term is defined as loans due in one year or less, while long‐term is defined as loans due in more than one year. All variables except for cash flow rights are winsorized at the 1% level. All regressions include year dummies and standard errors are clustered at a firm level. The sample covers non‐financial Chilean firms in pyramidal business groups from 1990 to 2009. Data are taken from Economatica, Fecus Plus, and Superintendencia de Valores y Seguros (SVS).
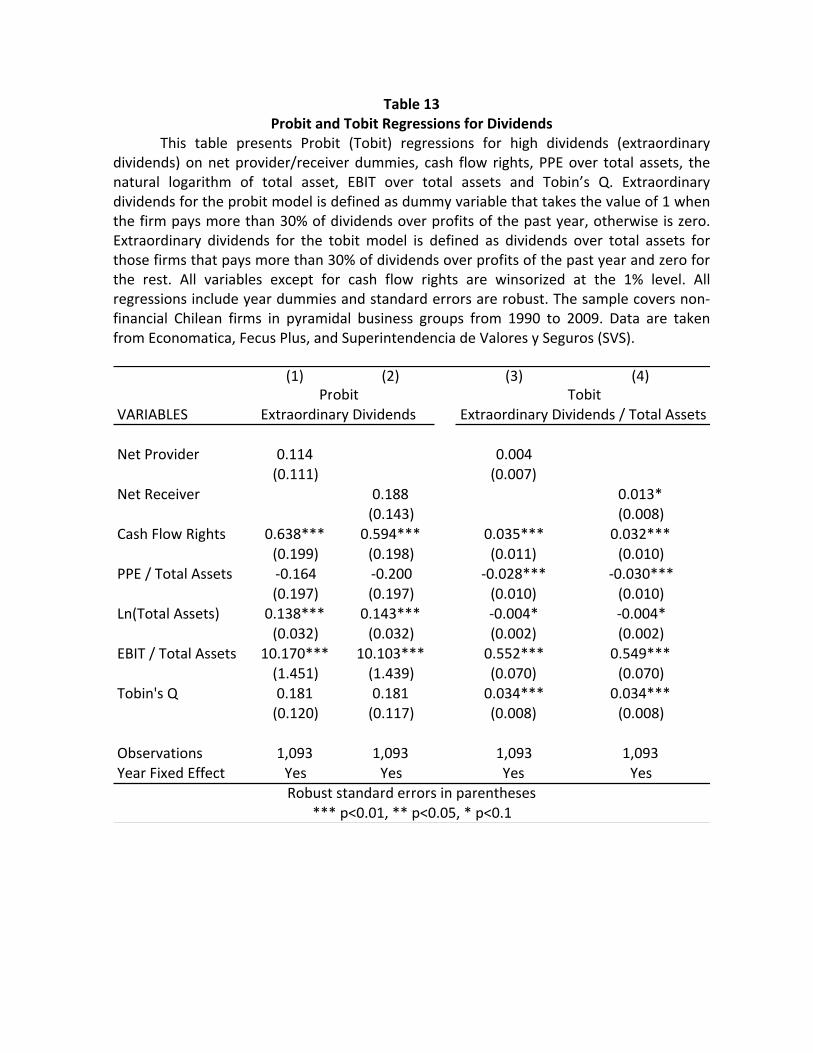
Table 13 Probit and Tobit Regressions for Dividends
This table presents Probit (Tobit) regressions for high dividends (extraordinary dividends) on net provider/receiver dummies, cash flow rights, PPE over total assets, the natural logarithm of total asset, EBIT over total assets and Tobin’s Q. Extraordinary dividends for the probit model is defined as dummy variable that takes the value of 1 when the firm pays more than 30% of dividends over profits of the past year, otherwise is zero. Extraordinary dividends for the tobit model is defined as dividends over total assets for those firms that pays more than 30% of dividends over profits of the past year and zero for the rest. All variables except for cash flow rights are winsorized at the 1% level. All regressions include year dummies and standard errors are robust. The sample covers non‐financial Chilean firms in pyramidal business groups from 1990 to 2009. Data are taken from Economatica, Fecus Plus, and Superintendencia de Valores y Seguros (SVS).
(1) (2) (3) (4)
VARIABLES
Net Provider 0.114 0.004(0.111) (0.007)
Net Receiver 0.188 0.013*(0.143) (0.008)
Cash Flow Rights 0.638*** 0.594*** 0.035*** 0.032***(0.199) (0.198) (0.011) (0.010)
PPE / Total Assets ‐0.164 ‐0.200 ‐0.028*** ‐0.030***(0.197) (0.197) (0.010) (0.010)
Ln(Total Assets) 0.138*** 0.143*** ‐0.004* ‐0.004*(0.032) (0.032) (0.002) (0.002)
EBIT / Total Assets 10.170*** 10.103*** 0.552*** 0.549***(1.451) (1.439) (0.070) (0.070)
Tobin's Q 0.181 0.181 0.034*** 0.034***(0.120) (0.117) (0.008) (0.008)
Observations 1,093 1,093 1,093 1,093Year Fixed Effect Yes Yes Yes Yes
Robust standard errors in parentheses*** p<0.01, ** p<0.05, * p<0.1
Tobit Extraordinary Dividends / Total Assets
ProbitExtraordinary Dividends

Table 14 Equity
This table shows frequency of net provider at different terms when there is an equity issuance in the previous year and when there are no equity issuance. We define net provider as a dummy variable that identifies with 1 those firm‐year observations with more than 5% of net loans over total assets, while net receiver is defined as a dummy variable that identifies with 1 those firm‐year observations with less than ‐5% of net loans over total assets. We divide net providers and net receivers by the term of loans: all refers to all loans, short‐term is defined as loans due in one year or less, while long‐term is defined as loans due in more than one year. The sample covers non‐financial Chilean firms in pyramidal business groups from 1990 to 2009. Data are taken from Economatica, Fecus Plus, and Superintendencia de Valores y Seguros (SVS).
EquityIssuance
(Obs: 172)
Non‐EquityIssuance
(Obs: 1040) DifferentialMean Mean
Net Provider 25% 20% 5%*Net Provider S‐T 17% 12% 6%**Net Provider L‐T 10% 10% 0%
*** p<0.01, ** p<0.05, * p<0.1
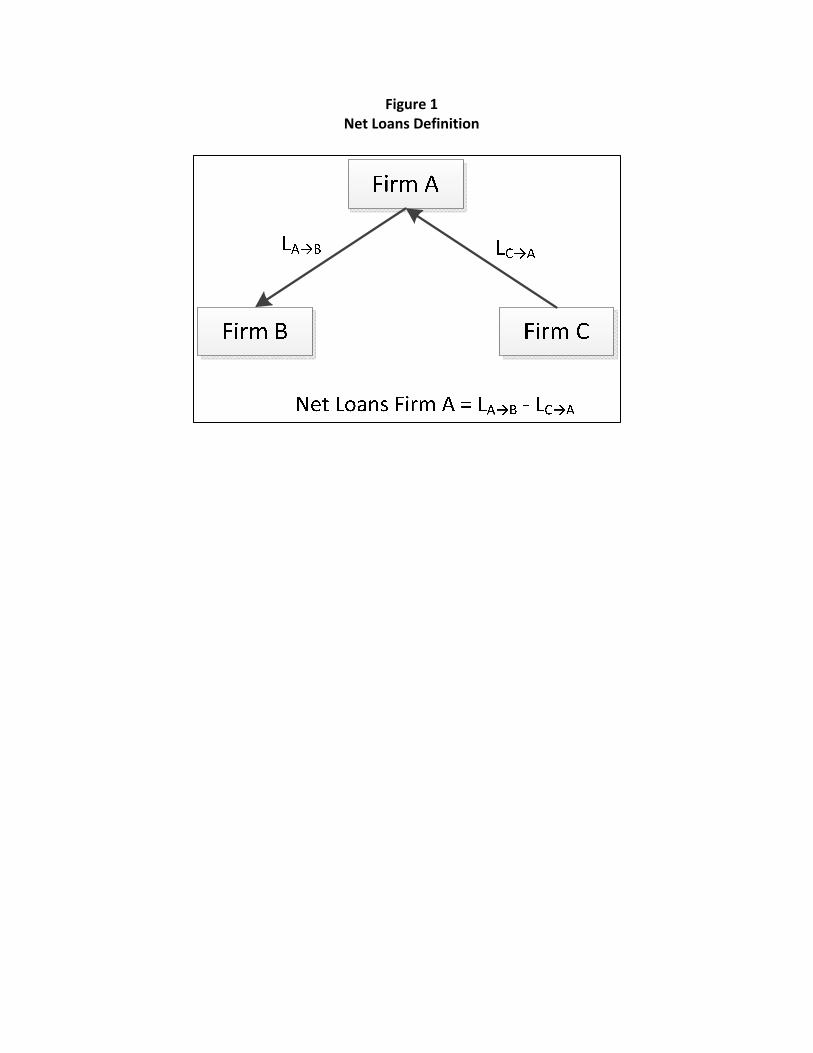
Figure 1 Net Loans Definition
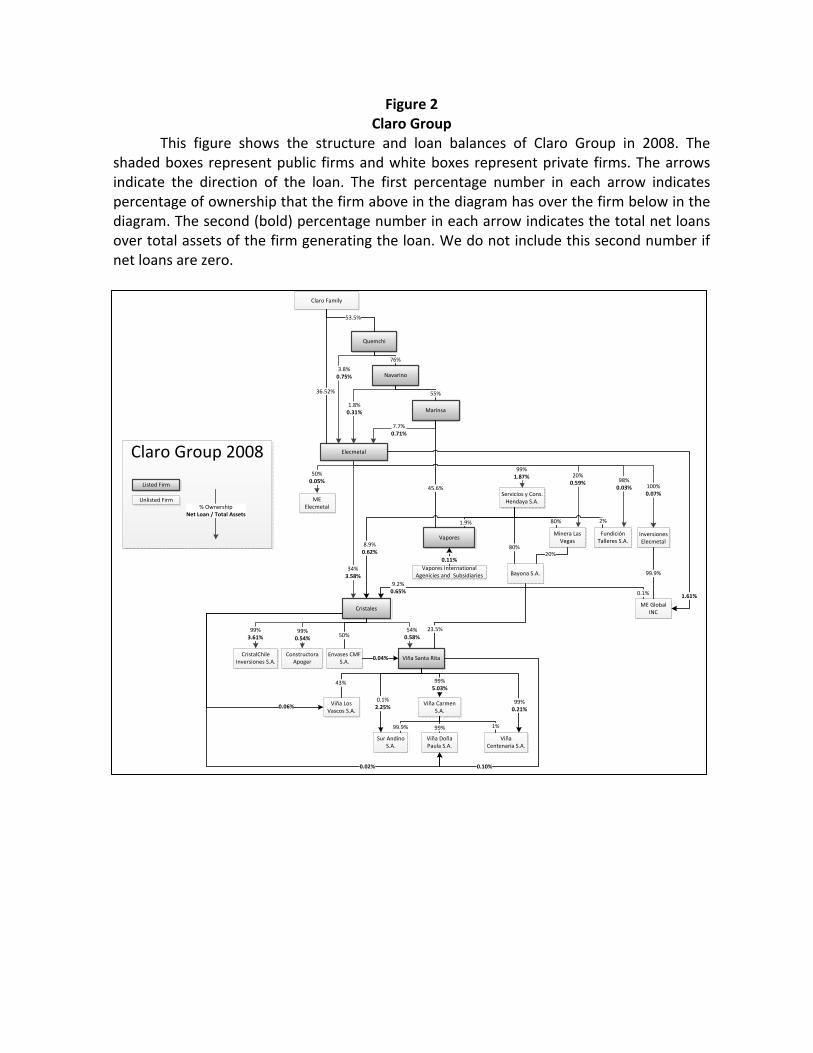
Figure 2 Claro Group
This figure shows the structure and loan balances of Claro Group in 2008. The shaded boxes represent public firms and white boxes represent private firms. The arrows indicate the direction of the loan. The first percentage number in each arrow indicates percentage of ownership that the firm above in the diagram has over the firm below in the diagram. The second (bold) percentage number in each arrow indicates the total net loans over total assets of the firm generating the loan. We do not include this second number if net loans are zero.
Cristales
Minera Las Vegas
Fundición Talleres S.A.
Constructora Apoger
Servicios y Cons. Hendaya S.A.
Navarino
Marinsa
Inversiones Elecmetal
Elecmetal
34%3.58%
ME Elecmetal
ME Global INC
Viña Santa Rita
1.61%
20%0.59% 98%
0.03%
99%1.87%50%
0.05%100%0.07%
Quemchi
3.8%0.75%
7.7%0.71%
1.8%0.31%
Viña Doña Paula S.A.
0.02%
CristalChile Inversiones S.A.
8.9%0.62%
99%3.61%
Bayona S.A.
9.2%0.65%
Viña Los Vascos S.A.
0.06%
54%0.58%
Envases CMF S.A.
Viña Centenaria S.A.
Claro Group 2008
99%0.54%
0.04%
0.10%
99%0.21%
Sur Andino S.A.
0.1%2.25% Viña Carmen
S.A.
99%5.03%
Vapores
Vapores International Agenicies and Subsidiaries
0.11%
43%
50%
99.9%
80%
1.9%
99.9%
23.5%
80%
20%
2%
0.1%
1%99%
55%
45.6%
76%
Claro Family
36.52%
53.5%
Unlisted Firm
Listed Firm
% OwnershipNet Loan / Total Assets