the interim trading skills of institutional investors
TRANSCRIPT

THE JOURNAL OF FINANCE • VOL. LXVI, NO. 2 • APRIL 2011
The Interim Trading Skills of InstitutionalInvestors
ANDY PUCKETT and XUEMIN (STERLING) YAN∗
ABSTRACT
Using a large proprietary database of institutional trades, this paper examines the in-terim (intraquarter) trading skills of institutional investors. We find strong evidencethat institutional investors earn significant abnormal returns on their trades withinthe trading quarter and that interim trading performance is persistent. After trans-actions costs, our estimates suggest that interim trading skills contribute between20 and 26 basis points per year to the average fund’s abnormal performance. Ourfindings also indicate that any trading skills documented by previous studies that usequarterly data are biased downwards because of their inability to account for interimtrades.
FINANCIAL ECONOMISTS OFTEN refer to institutional investors as “informed”traders, and individuals attempting to trade in the same markets as insti-tutions are likened to “tourists playing poker with professionals in the smokybackroom of a Las Vegas casino.”1 In spite of this conventional wisdom, empiri-cal evidence on institutional investors’ ability to generate positive abnormal re-turns is mixed. On the one hand, Jensen (1968), Gruber (1996), Carhart (1997),Wermers (2000), and Fama and French (2010) find that actively managed mu-tual funds underperform passive benchmarks after fees. On the other hand,a number of studies provide evidence that a subset of mutual funds seems topossess superior skill.2 Furthermore, while the presence of skilled institutionssuggests that past winners should continue to outperform, the literature is am-biguous about whether superior performance persists over adjacent periods.3
∗Andy Puckett is at the University of Tennessee. Xuemin (Sterling) Yan is at the Trulaske Col-lege of Business, University of Missouri. We would like to thank Judy Maiorca, Allison Keane,and ANcerno Ltd. (formerly the Abel Noser Corporation) for providing institutional trading data.We would also like to thank Cam Harvey (the Editor), an anonymous associate editor, an anony-mous referee, Paul Brockman, Dan French, Bill Moser, Chunchi Wu, Lu Zheng (AFA discussant),Jonathan Berk, Russ Wermers, Harold Black, Larry Fauver, Phillip Daves, Mike Ehrhardt, andseminar participants at the 2009 American Finance Association Conference, the University of Ten-nessee, the University of Missouri, and the National Chiao Tung University of Taiwan for helpfulcomments. We acknowledge financial support from the University of Missouri Research Board.
1 Excerpt taken from “Individual Investors See Red, Prof. Terry Odean Finds,” June 5, 2007,Hass Newsroom.
2 Studies that show at least some fund managers are skilled include Cohen, Coval, and Pastor(2005), Kacperczyk, Sialm, and Zheng (2005), Mamaysky, Spiegel, and Zhang (2008), Kacperczykand Seru (2007), and Cremers and Petajisto (2009).
3 Studies that find persistence in relative performance include Grinblatt and Titman (1992),Hendricks, Patel, and Zeckhauser (1993), Goetzmann and Ibbotson (1994), Brown and Goetzmann
601
602 The Journal of Finance R©
Prior findings that institutional investors possess little, if any, investment skillare economically troubling, since portfolio managers are highly compensatedby the market.
A number of recent studies investigate institutional investors’ stock-pickingskills more directly by examining the performance of their trades.4 Chen, Je-gadeesh, and Wermers (CJW, 2000), Kacperczyk, Sialm, and Zheng (KSZ, 2005),and Alexander, Cici, and Gibson (2007) find that the stocks that mutual fundspurchase earn significantly higher returns than the stocks they sell, althoughsubsequent studies (e.g., Duan, Hu, and McLean (2009)) find that this tradingperformance has declined or even reversed during more recent time periods.Alternatively, Bennett, Sias, and Starks (2003), Cai and Zheng (2004), andYan and Zhang (2009) find conflicting results on whether institutional tradingpredicts future stock returns. Because institutional trading data are not pub-licly available, previous studies that examine trading performance have usedchanges in quarterly institutional holdings to proxy for trading activity,5 andthere are at least two important limitations of this proxy. First, changes inquarterly holdings data do not capture intraquarter transactions where fundspurchase and sell or sell and repurchase the same stock (hereafter, round-triptrades). Second, quarterly holdings do not identify the exact timing or execu-tion price of trades. Studies that use quarterly data commonly assume thatall trades occur at the end of the quarter, but in fact they could occur at anytime within the quarter. Imprecision in the identification and estimated tim-ing (and therefore execution price) of trades might limit researchers’ ability toidentify superior trading skills if trades are motivated by short-lived private in-formation and profitable trading opportunities dissipate quickly (Kothari andWarner (2001)).6
Our study contributes to the current trading skill debate by using actualinstitutional trades to examine the trading performance of institutions. Weovercome the limitations of quarterly institutional holdings data by using aproprietary database of institutional trades provided by ANcerno Ltd. (for-merly the Abel Noser Corporation). The ANcerno data are uniquely suited foranswering questions related to trading skill, since they identify the exact date
(1995), Elton, Gruber and Blake (1996), Bollen and Busse (2005), Busse and Irvine (2006), andKosowski et al. (2006). However, Carhart (1997), Busse, Goyal, and Wahal (2010), and a previousversion of Fama and French (2010) find that performance persistence is weak to nonexistent aftercontrolling for momentum and is sensitive to the methodology employed.
4 Kothari and Warner (2001) use simulation procedures to show that analyzing mutual funds’stock trades substantially improves power to detect abnormal performance.
5 Several studies use high-frequency data to examine whether institutional trading predictsfuture stock returns. Griffin, Harris, and Topaloglu (2003) identify institutional trades by usingthe brokerage firm involved, whereas Campbell, Ramadorai, and Schwartz (2009) use a complexalgorithm to infer institutional trades in TAQ. However, both of these studies measure institutionaltrades with noise and neither is able to distinguish the trades of different institutions either in thecross section or over time.
6 To quantify the magnitude of the potential measurement error in the execution price of trades,we investigate the difference between the intraquarter high and low price for all CRSP stocksduring the 1999 to 2005 sample period. On average, the intraquarter price range is 41.42%.
The Interim Trading Skills of Institutional Investors 603
and execution price of each transaction and allow us to distinguish the trades ofeach institution (and funds within these institutions) both in the cross-sectionand over time.
The primary objective of our paper is to examine the performance of funds’trades during the quarter in which they occur. Our analysis of interim trades isimportant since, by definition, the within-quarter performance of these tradescannot be captured using quarterly data. Our investigation is inspired by KSZ(2008), who show that unobserved mutual fund actions within the quarter (in-cluding interim trades) are important, persistently create value for some funds,and predict future abnormal fund performance. Although it is not possible forKSZ (2008) to fully disentangle the benefits and costs of all unobserved actions,they argue that interim trades “create sufficient value to offset trading costsand other hidden costs of fund management” (p. 2380). Our study builds on thefindings of KSZ (2008) by directly analyzing the performance of interim trades.Our analysis is also motivated by Elton et al. (2010) and Elton, Gruber, andBlake (2010), who show that when higher-frequency (i.e., monthly) holdingsare used to investigate window dressing, tax-loss selling, tournament behav-ior, and timing ability, conclusions are very different from those obtained usingquarterly data. In a similar spirit, we provide evidence on the existence, per-sistence, and sources of interim trading skill, and we show that these resultschange rather dramatically when quarterly data are used.
If institutional trades are motivated by short-lived private information, wemight expect funds to reverse their trades in order to lock in gains (Hirshleifer,Subrahmanyam, and Titman (1994)). As such, we begin our empirical analysisby investigating trades that are reversed within the trading quarter (i.e., in-traquarter round-trip trades). We find that round-trip trades account for nearlya quarter of all trades in our sample, and, more importantly, we find strongevidence of round-trip trading skill. For the average fund in our sample, the ab-normal holding-period return for round-trip trades is 1.80% (t-statistic = 3.27).We also investigate the persistence of round-trip trading performance and findthat the quintile of funds with the best past trading performance significantlyoutperforms the quintile of funds with the worst past trading performance inthe four quarters following portfolio formation.
While round-trip trades are an important component of trading performance,our round-trip analysis does not consider all trades that occur within the quar-ter. Moreover, if institutional investors are influenced by the disposition effect(Odean (1998)) or if their portfolios are subject to rebalancing requirements,the abnormal performance of round-trip trades might be biased upwards. Toprovide a more comprehensive measure of interim trading skill, we track theabnormal performance of all stocks that a fund buys and sells from the exe-cution date (using the execution price) until the end of the quarter, and werefer to the performance difference between buys and sells as interim tradingperformance. For the average fund in our sample, the stocks that a fund buysoutperform the stocks that it sells by 0.74% (0.57%) using equal- (principal-)weighted averages, suggesting that institutional investors in our sample havesuperior interim trading skills. To examine whether this performance is
604 The Journal of Finance R©
persistent, each quarter we sort funds into quintiles based on their interimtrading performance. Subsequent quarter interim trading performance is1.56% (t-statistic = 5.69) for high-performance funds, compared to −0.33%(t-statistic = −1.49) for low-performance funds. Our results that trading skillpersistence is significant and almost entirely driven by high-performance fundscontrast with CJW (2000) and Carhart (1997), who show that persistence,when it exists, is driven by past underperforming funds that charge highfees.
High-frequency trading data are necessary to investigate interim tradingperformance; however, it is not clear whether our results and inferences differfrom those that would obtain if we were to use coarser proxies for institutionaltrading (i.e., changes in quarterly holdings). This question is particularly rele-vant for future research that relies on low-frequency quarterly ownership datato investigate institutional trading activities. To highlight the importance ofusing high-frequency data in our investigation, we reconstruct our analysisusing “implied” quarterly trades. Specifically, for each fund and stock we ag-gregate all trades within the quarter and calculate net trading positions asof the quarter-end. We then track the abnormal performance of these impliedquarterly trades over the subsequent quarter in a manner similar to CJW(2000). We find that the equal- (principal-) weighted implied quarterly tradingperformance is −0.33% (−0.24%), and implied quarterly trading performance isnot persistent. These results contrast starkly with our interim trading perfor-mance results and suggest that had we conducted our analysis at the quarterlyfrequency (i.e., ignoring round-trip trades and the timing of each trade), wewould conclude that the funds in our sample have no (or even negative) tradingskills.
To better understand the sources of superior interim trading skills, we ex-plore whether interim trading performance varies systematically across firmcharacteristics such as size, book-to-market, turnover, idiosyncratic volatility,and liquidity. To the extent that superior interim trading performance resultsfrom private information, we conjecture that profitable trading opportunitiesare more likely to arise in stocks where the public information environmentis more limited, greater information asymmetries exist, or limits to arbitrageare higher. On the other hand, we also recognize that funds will be able totrade profitably only if the value of their private information is large enoughto overcome the higher liquidity costs that are associated with these types ofstocks. We find that interim trading performance is significantly more positivein stocks with high idiosyncratic volatility and in illiquid stocks. We furthershow that superior interim trading performance does not result from compen-sation for liquidity provision. In fact, consistent with Campbell, Ramadorai,and Schwartz (2009), we find that high-skill funds experience higher implicittrading costs than low-skill funds, suggesting that high-skill funds are morelikely to demand (rather than provide) liquidity in their trades. Taken together,our results are most consistent with institutions being able to exploit tempo-rary mispricing in situations in which information asymmetry and limits toarbitrage are high.
The Interim Trading Skills of Institutional Investors 605
Overall, our study contributes to the investment skill debate by showing thatinstitutional investors have significant interim trading skills, these tradingskills are persistent, and this persistence is driven by high-skill funds. Ourinterim trading performance results are significantly different from quarterlystudies that examine trading skill (e.g., CJW (2000)). Because interim tradingperformance is orthogonal to quarterly trading performance measures, ourresults suggest that prior studies understate the trading skills of institutionalinvestors.
One limitation of the ANcerno database is that it does not contain informa-tion on management fees or fund returns. Thus, we cannot ascertain whetherinterim trading performance accrues to underlying investors or is capturedas rents by portfolio managers. To provide some insight concerning the im-plications of our results for overall fund performance, we make a back-of-the-envelope calculation. We document (in Table III) that the stocks institutionsbuy outperform the stocks institutions sell by 27 to 34 basis points after com-missions. Assuming this outperformance accrues to the fund and assumingan average turnover rate of 75% per year, we show that interim trading per-formance contributes between 20 and 26 basis points to the annual abnormalreturns of the portfolio. This amount is roughly a quarter of the average man-agement fee for equity mutual funds, which we assume to be about 1%. As such,our results are consistent with Grossman and Stiglitz (1980), who show thatinformed traders earn abnormal returns from their trading when informationacquisition is costly.
The remainder of the paper proceeds as follows. Section I discusses our data,Section II presents the methodology, Section III reports our empirical results,and Section IV concludes.
I. Data
A. Data, Sample, and Summary Statistics
We obtain institutional trading data for the period from January 1, 1999 toDecember 31, 2005 from ANcerno Ltd. ANcerno is a widely recognized consult-ing firm that works with institutional investors to monitor their equity tradingcosts. ANcerno clients include pension plan sponsors such as CalPERS, theCommonwealth of Virginia, and the YMCA retirement fund, as well as moneymanagers such as Massachusetts Financial Services (MFS), Putman Invest-ments, and Lazard Asset Management.7
The ANcerno data offer significant advantages over other high-frequencytrading data that make them uniquely suited for investigating institutional in-vestor trading skill and trading skill persistence. Conversations with ANcernoconfirm that the database captures the complete transaction history for insti-tutions in the sample; data available for each transaction include an identity
7 Previous academic studies that use ANcerno data include Goldstein et al. (2009), Chemmanur,He, and Hu (2009), Goldstein, Irvine, and Puckett (2010), Jame (2010), Puckett and Yan (2010),and Busse, Green, and Jegadeesh (2010).
606 The Journal of Finance R©
code for the institution, an identity code for the fund within each institution,the date of execution, the stock traded, the number of shares executed, theexecution price, commissions paid, and whether the execution is a buy or sell.Identity codes for both the institution and fund provide unique identification inthe cross section and time series, which is not available in other high-frequencydata such as TAQ or Plexus.8 We provide a more detailed description of the AN-cerno database, how the data are delivered from institutions to ANcerno, andthe variables contained in the database in the Appendix at the end of thepaper.
Institutional coverage in the ANcerno database is quite broad. The databasecontains a total of 840 different institutions during our sample period and al-lows us to reliably track 3,816 different funds within those institutions. Insti-tutions in the ANcerno database are responsible for approximately 87 milliontrades involving more than $22.9 trillion (755 billion shares) in trading vol-ume. On average, this trading activity accounts for approximately 8% of thedollar value of CRSP trading volume during the 1999 to 2005 sample period.9
Assuming that institutional investors, in aggregate, are responsible for 80% ofCRSP trading volume, we estimate that ANcerno institutions account for 10%of all institutional trading volume. Thus, while the ANcerno data capture theactivities of a subset of pension and money managers, the subset represents asignificant fraction of total institutional trading volume.
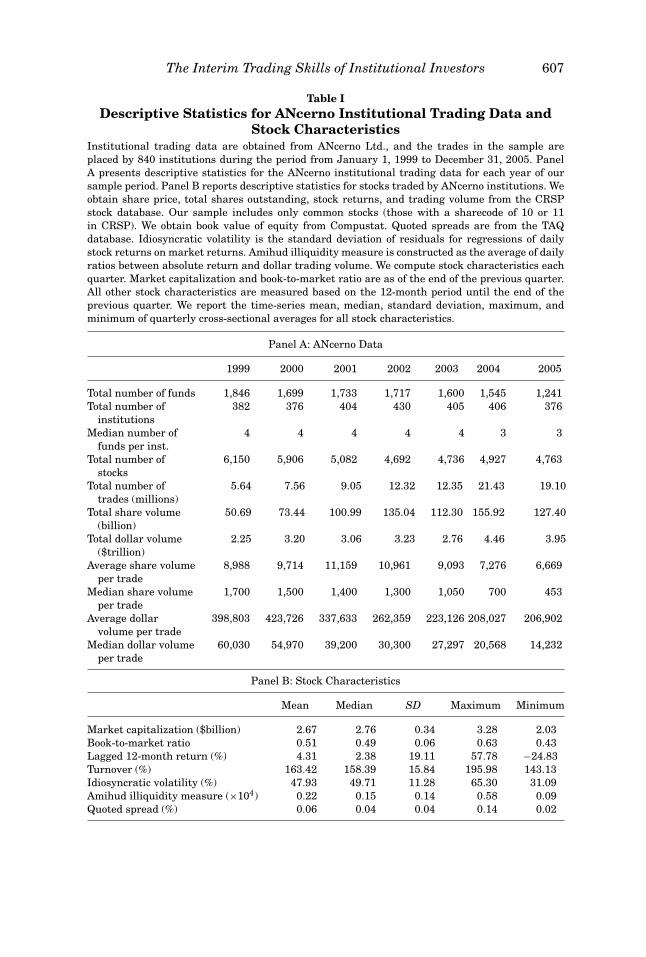
Summary statistics for the ANcerno trading data are presented in Panel Aof Table I. Of the 3,816 funds that we can reliably track in the database, 227are money manager funds and 3,589 are pension funds. While the number ofmoney manager funds is small relative to pension funds, money manager fundsare responsible for more than half of the trading volume in the database. Thetotal number of different stocks traded by ANcerno funds ranges from 4,692 in2002 to 6,150 in 1999, while the average dollar volume per trade varies from$423,726 in 2000 to $206,902 in 2005. The median dollar volume per trade isalmost an order of magnitude smaller than the mean, ranging from $60,030in 1999 to $14,232 in 2005, and, consistent with Campbell, Ramadorai, andSchwartz (2009), suggests that institutional trade sizes are likely to be eithervery large or very small.
We collect stock and market data from CRSP, Compustat, and TAQ to com-plement our analysis of ANcerno trade data. We obtain stock returns, shareprice, trading volume, and shares outstanding from CRSP and book value ofequity from Compustat, and we estimate quoted spreads from TAQ. Summary
8 TAQ data, for example, do not provide any type of investor identification, while the Plexusdatabase (a competitor of ANcerno) changes anonymous institutional identifiers each month, mak-ing it impossible to track the performance of particular institutions over time. Studies using thePlexus database include Chan and Lakonishok (1995) and Jones and Lipson (2001).
9 We calculate the ratio of ANcerno trading volume to CRSP trading volume during each dayof the sample period. We include only stocks with sharecode equal to 10 or 11 in our calculation.In addition, we divide all ANcerno trading volume by two, since each individual ANcerno clientconstitutes only one side of a trade. We believe this estimate represents an approximate lowerbound for the size of the ANcerno database.
The Interim Trading Skills of Institutional Investors 607
Table IDescriptive Statistics for ANcerno Institutional Trading Data and
Stock CharacteristicsInstitutional trading data are obtained from ANcerno Ltd., and the trades in the sample areplaced by 840 institutions during the period from January 1, 1999 to December 31, 2005. PanelA presents descriptive statistics for the ANcerno institutional trading data for each year of oursample period. Panel B reports descriptive statistics for stocks traded by ANcerno institutions. Weobtain share price, total shares outstanding, stock returns, and trading volume from the CRSPstock database. Our sample includes only common stocks (those with a sharecode of 10 or 11in CRSP). We obtain book value of equity from Compustat. Quoted spreads are from the TAQdatabase. Idiosyncratic volatility is the standard deviation of residuals for regressions of dailystock returns on market returns. Amihud illiquidity measure is constructed as the average of dailyratios between absolute return and dollar trading volume. We compute stock characteristics eachquarter. Market capitalization and book-to-market ratio are as of the end of the previous quarter.All other stock characteristics are measured based on the 12-month period until the end of theprevious quarter. We report the time-series mean, median, standard deviation, maximum, andminimum of quarterly cross-sectional averages for all stock characteristics.
Panel A: ANcerno Data
1999 2000 2001 2002 2003 2004 2005
Total number of funds 1,846 1,699 1,733 1,717 1,600 1,545 1,241Total number of
institutions382 376 404 430 405 406 376
Median number offunds per inst.
4 4 4 4 4 3 3
Total number ofstocks
6,150 5,906 5,082 4,692 4,736 4,927 4,763
Total number oftrades (millions)
5.64 7.56 9.05 12.32 12.35 21.43 19.10
Total share volume(billion)
50.69 73.44 100.99 135.04 112.30 155.92 127.40
Total dollar volume($trillion)
2.25 3.20 3.06 3.23 2.76 4.46 3.95
Average share volumeper trade
8,988 9,714 11,159 10,961 9,093 7,276 6,669
Median share volumeper trade
1,700 1,500 1,400 1,300 1,050 700 453
Average dollarvolume per trade
398,803 423,726 337,633 262,359 223,126 208,027 206,902
Median dollar volumeper trade
60,030 54,970 39,200 30,300 27,297 20,568 14,232
Panel B: Stock Characteristics
Mean Median SD Maximum Minimum
Market capitalization ($billion) 2.67 2.76 0.34 3.28 2.03Book-to-market ratio 0.51 0.49 0.06 0.63 0.43Lagged 12-month return (%) 4.31 2.38 19.11 57.78 −24.83Turnover (%) 163.42 158.39 15.84 195.98 143.13Idiosyncratic volatility (%) 47.93 49.71 11.28 65.30 31.09Amihud illiquidity measure (×104) 0.22 0.15 0.14 0.58 0.09Quoted spread (%) 0.06 0.04 0.04 0.14 0.02
608 The Journal of Finance R©
statistics for the sample of stocks traded by ANcerno institutions are reportedin Panel B of Table I. The mean market capitalization of securities traded byANcerno institutions is $2.67 billion, while the average book-to-market ratiois 0.51. In addition, we find that our sample stocks have a mean turnover of163% per year and an average quoted spread of 0.06%.
B. Database Integrity
Issues of survivorship and selection bias are of primary concern with anyproprietary database, and we investigate both of these potential biases as theyrelate to the ANcerno trading data. We believe that survivorship bias is nota concern in the ANcerno database for at least three reasons. First, ANcernorepresentatives have told us directly that the database is free of survivorshipbias. Second, if the ANcerno data contain only surviving institutions, we wouldexpect all sample institutions to be present at the end of our sample period.However, we observe many institutions that are present during a portion of thesample period but no longer present in the data set in December 2005. Finally,the method by which the data were delivered to us prevents survivorship biasfor most of the sample period. Specifically, in May 2003 we were providedwith data for the 1999 to 2002 sample period. ANcerno provided subsequentannual updates every year thereafter, and since we already had the earlierdata, ANcerno did not have the ability to retroactively delete nonsurvivinginstitutions.
The first form of potential selection bias that we investigate relates towhether institutions that choose to become ANcerno clients might differ sys-tematically from the typical institution. Because the ANcerno database con-tains neither the actual names (i.e., institutions are identified by unique client-codes) nor the portfolio holdings of client institutions, a full sample comparisonof institutions in the ANcerno database to institutions in the 13F universe isnot possible. We circumvent this problem in two ways. First, we use a list of 64client institution names that ANcerno separately provided to us to facilitate acomparison between the holdings of ANcerno and 13F institutions. Second, wecompare changes in quarterly holdings for all ANcerno institutions to changesin quarterly holdings for all 13F institutions. The results for both of theseanalyses are presented in the Internet Appendix.10 We find that the character-istics of stocks held and traded by ANcerno institutions are not significantlydifferent from the characteristics of stocks held and traded by the average 13Finstitution. We also compare the return characteristics of holdings and tradesand find that they are almost identical between the two groups of institutions.It appears that ANcerno institutions differ from the average 13F institutionprimarily in one dimension: institution size. ANcerno institutions are largerthan the average 13F institution with respect to the number of different stock
10 The Internet Appendix is located on the Journal of Finance website at http://www.afajof.org/supplements.asp.
The Interim Trading Skills of Institutional Investors 609
holdings (603 vs. 264), total net assets ($22.04 billion vs. $4.34 billion), anddollar value of trades ($1,285 million vs. $842 million).11
Given that ANcerno institutions are larger than the typical institution in the13F universe, our primary concern is whether a relationship exists betweenfund size and trading skill. Although Berk and Green (2004) show that fundsize is positively associated with skill, many empirical studies actually findevidence of a negative relation between fund size and performance (Chen etal. (2004), Yan (2008), KSZ (2008), Lewellen (2009), and Edelen, Evans, andKadlec (2009)). Since the ANcerno sample is biased toward larger funds, webelieve that evidence from these studies suggests that this type of selection biasactually works against finding significant interim trading skill in our sample.12
Another form of potential selection bias that we explore relates to whetherANcerno clients submit a nonrandom selection of either ex post profitable ordifficult-to-execute trades to ANcerno. Our detailed analysis of evaluation re-ports that ANcerno provides its clients suggests that these behaviors wouldbe suboptimal. First, ANcerno consults exclusively on execution costs and pro-vides no analysis on the investment performance of client trades; thus, it isunclear why institutions would have any incentive to submit only their mostprofitable trades. Second, institutions that are concerned about evaluating theexecution cost of trades that are particularly difficult (i.e., expensive) have theability to do so ex post, and limiting the trades sent to ANcerno only reducesthe value of the execution cost analysis service that clients are paying for. Inaddition, we compare cumulative quarterly ANcerno trades to changes in quar-terly 13F holdings for a subsample of matched institutions. Matching scoresreported in the Internet Appendix show that more than 80% of quarterly tradesbetween these two databases match with respect to the stock traded and thetrading direction.13 Although we cannot completely rule out the possibility thatinstitutions send only a subset of their trades to ANcerno, the magnitude ofour matching scores suggests it is unlikely that institutions are submitting anonrandom selection of trades to ANcerno.
II. MethodologyA. Round-Trip Trades
Our first interim trading skill measure focuses on intraquarter round-triptrades. We proceed as follows. For each fund, we select all trades within a
11 In the Internet Appendix, we also compare a subsample of ANcerno funds to the CRSP equitymutual fund database. Fund characteristics for expense ratios, turnover, and average monthlyreturn are not significantly different between the two samples. Consistent with our other compar-isons based on 13F data, we find that ANcerno funds are larger than the average CRSP equitymutual fund.
12 We test for differences in interim trading skill between large and small ANcerno funds andpresent results in the Internet Appendix. Our results provide no evidence that larger funds havebetter interim trading skill than smaller funds.
13 In the Internet Appendix, we present four reasons we would not expect matching statis-tics between these two databases to be perfect. The reasons include differences in “institution”definitions, short sales, confidential 13F filings, and small trades.
610 The Journal of Finance R©
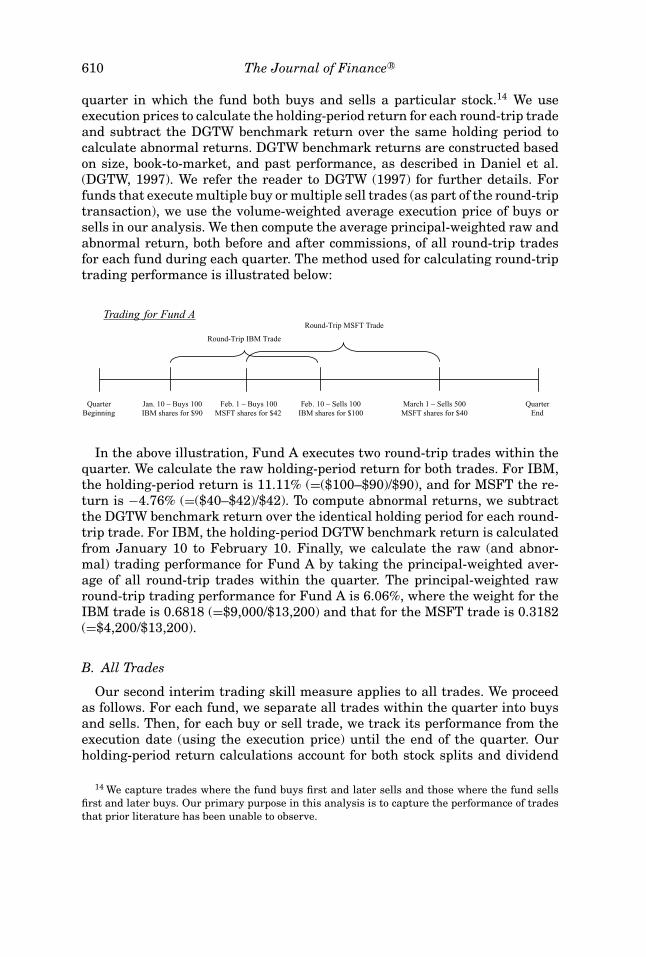
quarter in which the fund both buys and sells a particular stock.14 We useexecution prices to calculate the holding-period return for each round-trip tradeand subtract the DGTW benchmark return over the same holding period tocalculate abnormal returns. DGTW benchmark returns are constructed basedon size, book-to-market, and past performance, as described in Daniel et al.(DGTW, 1997). We refer the reader to DGTW (1997) for further details. Forfunds that execute multiple buy or multiple sell trades (as part of the round-triptransaction), we use the volume-weighted average execution price of buys orsells in our analysis. We then compute the average principal-weighted raw andabnormal return, both before and after commissions, of all round-trip tradesfor each fund during each quarter. The method used for calculating round-triptrading performance is illustrated below:
Trading for Fund A
QuarterBeginning
QuarterEnd
Jan. 10 – Buys 100 IBM shares for $90
Feb. 1 – Buys 100 MSFT shares for $42
Feb. 10 – Sells 100 IBM shares for $100
March 1 – Sells 500 MSFT shares for $40
Round-Trip IBM Trade
Round-Trip MSFT Trade
In the above illustration, Fund A executes two round-trip trades within thequarter. We calculate the raw holding-period return for both trades. For IBM,the holding-period return is 11.11% (=($100–$90)/$90), and for MSFT the re-turn is −4.76% (=($40–$42)/$42). To compute abnormal returns, we subtractthe DGTW benchmark return over the identical holding period for each round-trip trade. For IBM, the holding-period DGTW benchmark return is calculatedfrom January 10 to February 10. Finally, we calculate the raw (and abnor-mal) trading performance for Fund A by taking the principal-weighted aver-age of all round-trip trades within the quarter. The principal-weighted rawround-trip trading performance for Fund A is 6.06%, where the weight for theIBM trade is 0.6818 (=$9,000/$13,200) and that for the MSFT trade is 0.3182(=$4,200/$13,200).
B. All Trades
Our second interim trading skill measure applies to all trades. We proceedas follows. For each fund, we separate all trades within the quarter into buysand sells. Then, for each buy or sell trade, we track its performance from theexecution date (using the execution price) until the end of the quarter. Ourholding-period return calculations account for both stock splits and dividend
14 We capture trades where the fund buys first and later sells and those where the fund sellsfirst and later buys. Our primary purpose in this analysis is to capture the performance of tradesthat prior literature has been unable to observe.
The Interim Trading Skills of Institutional Investors 611
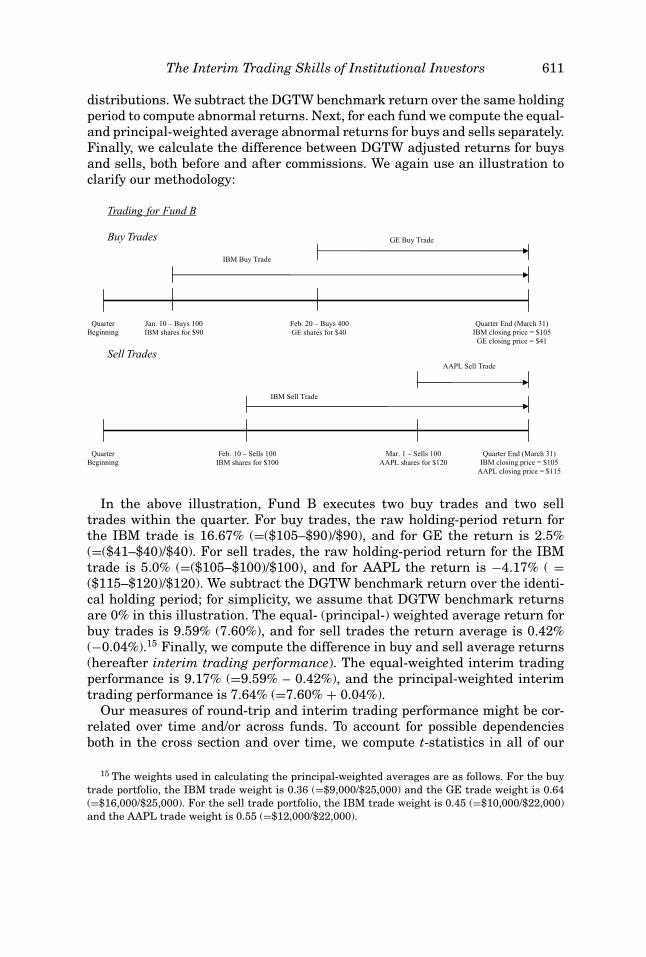
distributions. We subtract the DGTW benchmark return over the same holdingperiod to compute abnormal returns. Next, for each fund we compute the equal-and principal-weighted average abnormal returns for buys and sells separately.Finally, we calculate the difference between DGTW adjusted returns for buysand sells, both before and after commissions. We again use an illustration toclarify our methodology:
Trading for Fund B
Buy Trades
Sell Trades
QuarterBeginning
Quarter End (March 31) IBM closing price = $105
GE closing price = $41
Jan. 10 – Buys 100 IBM shares for $90
Feb. 20 – Buys 400 GE shares for $40
GE Buy Trade
QuarterBeginning
Quarter End (March 31) IBM closing price = $105
AAPL closing price = $115
Mar. 1 – Sells 100 AAPL shares for $120
Feb. 10 – Sells 100 IBM shares for $100
IBM Sell Trade
IBM Buy Trade
AAPL Sell Trade
In the above illustration, Fund B executes two buy trades and two selltrades within the quarter. For buy trades, the raw holding-period return forthe IBM trade is 16.67% (=($105–$90)/$90), and for GE the return is 2.5%(=($41–$40)/$40). For sell trades, the raw holding-period return for the IBMtrade is 5.0% (=($105–$100)/$100), and for AAPL the return is −4.17% ( =($115–$120)/$120). We subtract the DGTW benchmark return over the identi-cal holding period; for simplicity, we assume that DGTW benchmark returnsare 0% in this illustration. The equal- (principal-) weighted average return forbuy trades is 9.59% (7.60%), and for sell trades the return average is 0.42%(−0.04%).15 Finally, we compute the difference in buy and sell average returns(hereafter interim trading performance). The equal-weighted interim tradingperformance is 9.17% (=9.59% – 0.42%), and the principal-weighted interimtrading performance is 7.64% (=7.60% + 0.04%).
Our measures of round-trip and interim trading performance might be cor-related over time and/or across funds. To account for possible dependenciesboth in the cross section and over time, we compute t-statistics in all of our
15 The weights used in calculating the principal-weighted averages are as follows. For the buytrade portfolio, the IBM trade weight is 0.36 (=$9,000/$25,000) and the GE trade weight is 0.64(=$16,000/$25,000). For the sell trade portfolio, the IBM trade weight is 0.45 (=$10,000/$22,000)and the AAPL trade weight is 0.55 (=$12,000/$22,000).
612 The Journal of Finance R©
analyses based on two-way clustered standard errors (see Moulton (1986) andThompson (2011)).
III. Empirical Results
A. Round-Trip Trades
If institutional trades are motivated by value-relevant private informationand profitable trading opportunities dissipate quickly, we might expect fundsto reverse their trading to lock in gains. Furthermore, if funds reverse theirtrades within the quarter, these trades are not observed by studies that usequarterly holdings data (e.g., CJW (2000)). As such, we begin our empiricalanalysis by investigating trades that are reversed within the trading quarter(i.e., intraquarter round-trip trades). This type of trading pattern is consistentwith Hirshleifer, Subrahmanyam, and Titman (1994), who model the tradingbehavior of investors who receive private information. In the period before in-formation is publicly revealed, informed investors trade in order to exploit theirinformation advantage. When information is publicly revealed, early informedinvestors partially reverse their trading in order to lock in gains. We hypoth-esize that if funds possess trading skill, their abnormal round-trip tradingperformance will be positive.
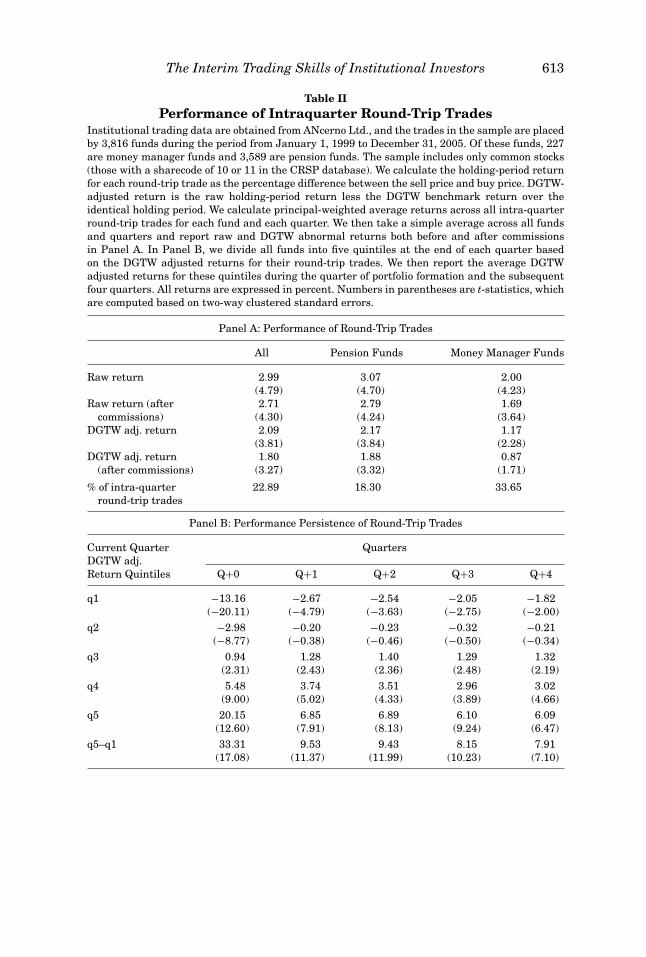
We present raw and abnormal holding-period returns for round-trip tradesacross all funds in Panel A of Table II. Consistent with estimates by Elton et al.(2010) that intraquarter round-trip trades account for approximately 20% of atypical mutual fund’s trades, we find that 22.89% of all trades in our sampleare intraquarter round-trip trades. Performance results show that the averageraw and abnormal returns for round-trip trades are significantly positive. Forthe average fund in our sample, raw returns are 2.99% (t-statistic = 4.79), andDGTW abnormal returns are 2.09% (t-statistic = 3.81). Even after commissions,abnormal returns are 1.80% (t-statistic = 3.27). We further note that since weuse actual execution prices to compute returns, our measures of performanceaccount for implicit trading costs (e.g., price impact). We find that abnormalreturns from round-trip trading activity are larger for pension funds (2.17%)than for money manager funds (1.17%).16
Although abnormal round-trip trading performance, on average, is positive,a more demanding test of investment skill is whether certain funds persistentlyoutperform. We sort funds into quintiles based on abnormal round-trip tradingperformance during each quarter. Funds with the lowest abnormal round-triptrading performance are assigned to quintile 1, while those with the highest
16 This result is somewhat puzzling because money manager funds trade more actively, andhence if they are skilled, we would expect the money manager funds to exhibit better round-triptrading performance. However, later in this section we argue that our interim trading performancemeasure is a more appropriate measure to use when comparing the trading performance of pensionand money manager funds, since round-trip trading performance might be influenced by severalpotential biases. Consistent with this conjecture, we find (in Section III.B) some evidence of moneymanager fund outperformance using the interim trading performance measure.
The Interim Trading Skills of Institutional Investors 613
Table IIPerformance of Intraquarter Round-Trip Trades
Institutional trading data are obtained from ANcerno Ltd., and the trades in the sample are placedby 3,816 funds during the period from January 1, 1999 to December 31, 2005. Of these funds, 227are money manager funds and 3,589 are pension funds. The sample includes only common stocks(those with a sharecode of 10 or 11 in the CRSP database). We calculate the holding-period returnfor each round-trip trade as the percentage difference between the sell price and buy price. DGTW-adjusted return is the raw holding-period return less the DGTW benchmark return over theidentical holding period. We calculate principal-weighted average returns across all intra-quarterround-trip trades for each fund and each quarter. We then take a simple average across all fundsand quarters and report raw and DGTW abnormal returns both before and after commissionsin Panel A. In Panel B, we divide all funds into five quintiles at the end of each quarter basedon the DGTW adjusted returns for their round-trip trades. We then report the average DGTWadjusted returns for these quintiles during the quarter of portfolio formation and the subsequentfour quarters. All returns are expressed in percent. Numbers in parentheses are t-statistics, whichare computed based on two-way clustered standard errors.
Panel A: Performance of Round-Trip Trades
All Pension Funds Money Manager Funds
Raw return 2.99 3.07 2.00(4.79) (4.70) (4.23)
Raw return (after 2.71 2.79 1.69commissions) (4.30) (4.24) (3.64)
DGTW adj. return 2.09 2.17 1.17(3.81) (3.84) (2.28)
DGTW adj. return 1.80 1.88 0.87(after commissions) (3.27) (3.32) (1.71)
% of intra-quarter 22.89 18.30 33.65round-trip trades
Panel B: Performance Persistence of Round-Trip Trades
Current Quarter QuartersDGTW adj.Return Quintiles Q+0 Q+1 Q+2 Q+3 Q+4
q1 −13.16 −2.67 −2.54 −2.05 −1.82(−20.11) (−4.79) (−3.63) (−2.75) (−2.00)
q2 −2.98 −0.20 −0.23 −0.32 −0.21(−8.77) (−0.38) (−0.46) (−0.50) (−0.34)
q3 0.94 1.28 1.40 1.29 1.32(2.31) (2.43) (2.36) (2.48) (2.19)
q4 5.48 3.74 3.51 2.96 3.02(9.00) (5.02) (4.33) (3.89) (4.66)
q5 20.15 6.85 6.89 6.10 6.09(12.60) (7.91) (8.13) (9.24) (6.47)
q5–q1 33.31 9.53 9.43 8.15 7.91(17.08) (11.37) (11.99) (10.23) (7.10)

614 The Journal of Finance R©
are assigned to quintile 5. We then track the abnormal round-trip trading per-formance for each quintile during the subsequent four quarters. We note that,by definition, abnormal round-trip trading performance in a particular quar-ter depends only on round-trip trades executed within that quarter. There-fore, the momentum of prior holdings is not a concern in our sample (Carhart(1997)).
Round-trip trading persistence results are presented in Panel B of Table II.By construction, the best performing funds significantly outperform the worstperforming funds (20.15% compared to −13.16%) in the quarter of portfolioformation. The central test of trading skill is whether relative performancepersists in subsequent quarters. We find that it does. In particular, funds withthe best past trading performance continue to have positive abnormal round-trip trading performance during the subsequent four quarters, while abnormalperformance for the worst past performers continues to be negative. The differ-ence in abnormal round-trip trading performance between extreme quintilesis 9.53%, 9.43%, 8.15%, and 7.91% in quarters Q+1, Q+2, Q+3, and Q+4,respectively.
Our analysis of round-trip trades quantifies the performance of trading activ-ities that were previously unobserved. However, this analysis is limited sinceround-trip trading decisions might result from mechanical factors or behav-ioral biases that are unrelated to investment skill. Mechanical factors includeexplicit or implicit rebalancing requirements. For instance, if a fund buys astock and the stock price increases significantly over a short period of time, thefund might sell some of the position in order to rebalance its portfolio. Thus,our round-trip trading measure might suffer from a selection bias such that adisproportionate number of successful trades are reversed prior to the end ofthe quarter. Behavioral biases may also play a role. If institutional investorsare subject to the same disposition effect that Odean (1998) documents forindividual investors—selling winners too quickly and holding on to losers toolong—then our selection of round-trip trades might pick up a disproportionateamount of successful trades ex post. Specifically, the disposition effect wouldsuggest that for a given stock purchase, the fund is more likely to realize gains(with a subsequent sale) if prices go up and is more likely to keep holding thestock (no sale) if prices go down. In the next section, we examine a more com-prehensive measure of interim trading skill that is not influenced by the aboveselection biases.
B. All Trades
To provide a comprehensive measure of interim trading skill, we analyze theperformance of all trades within the quarter in which they are executed. Con-sistent with our previous discussion, we hypothesize that if funds have tradingskills, then the stocks a fund buys will outperform the stocks it sells. We notethat some trades by funds might be motivated by fund flows and/or rebalancingrequirements. As such, these trades will likely contain little information andshould bias our study against finding evidence of trading skill (Alexander, Cici,and Gibson (2007)).
The Interim Trading Skills of Institutional Investors 615
Table IIIInterim Trading Performance of Institutional Investors
Institutional trading data are obtained from ANcerno Ltd. and the trades in the sample are placedby 3,816 funds during the period from January 1, 1999 to December 31, 2005. Of these funds, 227are money manager funds and 3,589 are pension funds. Money manager funds are responsiblefor more than half of the dollar value of trading volume in the sample. The sample includes onlycommon stocks (those with a sharecode of 10 or 11 in the CRSP database). For each trade, wecalculate the raw cumulative stock return from the execution price until the end of the quarter.We adjust the raw cumulative return by the DGTW benchmark return over the same period.For each fund in each quarter, we then compute the equal-weighted or principal-weighted DGTWadjusted returns separately for buys and sells. We take the difference in DGTW adjusted returnsbetween buys and sells. We report a simple average across all funds and quarters. Panel A presentsequal-weighted DGTW adjusted returns, and Panel B presents principal-weighted DGTW adjustedreturns. All returns are expressed in percent. Numbers in parentheses are t-statistics, which arecomputed based on two-way clustered standard errors.
All Pension Funds Money Manager Funds
Panel A: Equal-Weighted DGTW Adjusted Return
Buy 0.67 0.68 0.50(4.04) (3.96) (4.38)
Sell −0.06 −0.06 −0.13(−0.43) (−0.40) (−1.06)
Buy−Sell 0.74 0.74 0.63(7.73) (7.51) (6.28)
Buy−Sell (after commissions) 0.34 0.34 0.27(3.26) (3.16) (2.87)
Panel B: Principal-Weighted DGTW Adjusted Return
Buy 0.54 0.55 0.45(3.57) (3.48) (4.22)
Sell −0.03 −0.01 −0.26(−0.18) (−0.08) (−1.73)
Buy−Sell 0.57 0.56 0.72(5.73) (5.52) (4.75)
Buy−Sell (after commissions) 0.27 0.26 0.40(2.67) (2.52) (2.74)
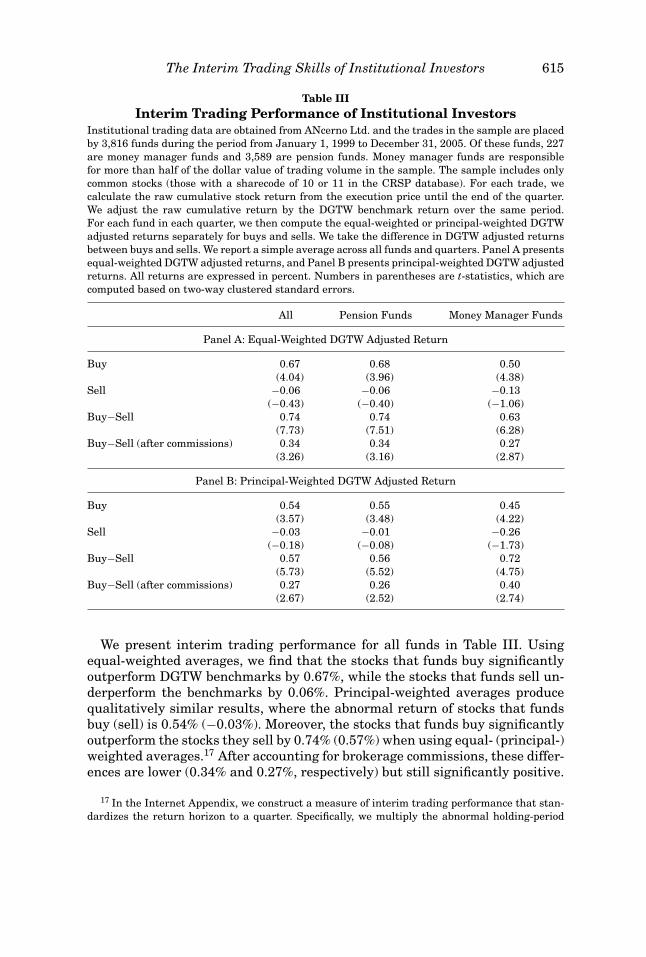
We present interim trading performance for all funds in Table III. Usingequal-weighted averages, we find that the stocks that funds buy significantlyoutperform DGTW benchmarks by 0.67%, while the stocks that funds sell un-derperform the benchmarks by 0.06%. Principal-weighted averages producequalitatively similar results, where the abnormal return of stocks that fundsbuy (sell) is 0.54% (−0.03%). Moreover, the stocks that funds buy significantlyoutperform the stocks they sell by 0.74% (0.57%) when using equal- (principal-)weighted averages.17 After accounting for brokerage commissions, these differ-ences are lower (0.34% and 0.27%, respectively) but still significantly positive.
17 In the Internet Appendix, we construct a measure of interim trading performance that stan-dardizes the return horizon to a quarter. Specifically, we multiply the abnormal holding-period
616 The Journal of Finance R©
Our results suggest that funds possess superior skills in timing their tradeswithin the quarter.
The asymmetry between the relative abnormal performance of buy and selltrades is consistent with many studies in the literature. In particular, Chanand Lakonishok (1993, 1995) argue that when institutional investors purchasesecurities, their choice of which security to buy is likely to be unconstrained. Assuch, the decision to buy a particular security, out of the numerous possibilitiesthat exist, is likely to convey positive firm-specific information. Alternatively,an institutional investor holds a finite number of securities in its portfolio and,when short sales are constrained, faces a limited number of alternatives whendeciding to sell. As a result, there are many reasons why institutional salesmight not necessarily convey negative firm-specific information.
Table III also presents interim trading performance results separately formoney manager funds and pension funds. Because money manager funds trademore actively, we expect them to display higher interim trading performance(Yan and Zhang (2009)). For both institution types, buy trades significantlyoutperform DGTW benchmarks. Although sell trades uniformly underperformtheir DGTW benchmarks, only principal-weighted money manager sells sig-nificantly underperform (−0.26%, t-statistic = −1.73). The equal- (principal-)weighted interim trading performance is 0.74% (0.56%) for pension funds and0.63% (0.72%) for money manager funds. Focusing on principal-weighted in-terim trading performance, which more accurately reflects trading returns thataccrue to the fund, the performance of money manager funds is about 16 basispoints higher than pension funds (0.72% vs. 0.56%). The fact that we do notobserve an even larger performance difference between these two groups issomewhat puzzling.
If some funds in our database are truly skilled, we should expect relativeinterim trading performance to persist. To test for persistence, we sort fundsinto quintiles based on their principal-weighted interim trading performance.We then track the principal-weighted interim trading performance for fundsin each quintile over the subsequent four quarters. By construction, tradeexecutions and trade performance evaluation do not overlap across the timeseries of quarterly observations.
Our results are presented in Table IV. We find strong evidence that pastinterim trading performance is related to future interim trading performance.Quintile 1 funds have the worst interim trading performance in the quarterof portfolio formation (−8.67%) and continue to have negative interim tradingperformance of −0.33%, −0.24%, −0.23%, and −0.16% during the subsequentfour quarters. Quintile 5 funds have the best interim trading performanceduring the portfolio formation quarter (9.60%) and continue to display positiveinterim trading performance of 1.56%, 1.16%, 1.33%, and 1.10% during thefollowing four quarters. The difference between extreme quintiles is 1.89%
return for each trade by the number of trading days in the quarter divided by the number oftrading days between the transaction date and the last day of the quarter. Quarterized equal-(principal-) weighted interim trading performance is 2.98% (2.08%).

The Interim Trading Skills of Institutional Investors 617
Table IVPersistence of Interim Trading Performance
Institutional trading data are obtained from ANcerno Ltd. and the trades in the sample are placedby 3,816 funds during the period from January 1, 1999 to December 31, 2005. The sample includesonly common stocks (those with a sharecode of 10 or 11 in the CRSP database). For each trade, wecalculate the raw cumulative stock return from the execution price until the end of the quarter.We adjust this cumulative return by the DGTW benchmark return over the same period. For eachfund in each quarter, we then compute the principal-weighted DGTW adjusted returns separatelyfor buys and sells. We take the difference in DGTW adjusted returns between buys and sells. Atthe end of the each quarter, we divide all funds into five quintiles based on the principal-weightedDGTW adjusted returns for buys minus sells. We then report the average DGTW adjusted returnsfor these quintiles during the quarter of portfolio formation and for the subsequent four quarters.All returns are expressed in percent. Numbers in parentheses are t-statistics, which are computedbased on two-way clustered standard errors.
Current Quarter QuartersPerformanceQuintiles Q+0 Q+1 Q+2 Q+3 Q+4
q1 Buy −3.88 0.15 0.13 0.21 0.11(−14.12) (0.95) (0.63) (1.23) (0.57)
Sell 4.79 0.48 0.38 0.44 0.27(10.70) (2.38) (1.81) (2.48) (1.26)
Buy–Sell −8.67 −0.33 −0.24 −0.23 −0.16(−15.11) (−1.49) (−1.38) (−1.14) (−0.66)
q2 Buy −0.78 0.36 0.29 0.21 0.30(−8.16) (3.73) (2.73) (1.36) (2.35)
Sell 1.05 0.05 −0.08 −0.01 0.11(6.98) (0.33) (−0.61) (−0.07) (0.64)
Buy−Sell −1.84 0.31 0.37 0.22 0.18(−11.59) (2.50) (3.01) (1.75) (1.12)
q3 Buy 0.37 0.36 0.50 0.46 0.36(3.60) (2.63) (4.04) (2.54) (3.93)
Sell −0.25 −0.14 −0.15 0.02 −0.16(−2.45) (−1.11) (−1.08) (0.10) (−1.06)
Buy−Sell 0.62 0.50 0.65 0.44 0.52(10.06) (5.04) (4.97) (3.76) (3.69)
q4 Buy 1.72 0.59 0.54 0.64 0.59(12.58) (3.44) (3.38) (3.82) (3.73)
Sell −1.41 −0.15 −0.17 −0.30 −0.36(−14.18) (−0.70) (−0.86) (−1.40) (−2.64)
Buy−Sell 3.13 0.74 0.70 0.93 0.96(20.29) (5.18) (4.82) (6.42) (7.41)
q5 Buy 5.29 1.13 0.96 1.13 0.63(10.35) (3.55) (3.45) (3.44) (2.56)
Sell −4.31 −0.44 −0.20 −0.20 −0.46(−15.80) (−2.18) (−0.95) (−0.88) (−2.61)
Buy−Sell 9.60 1.56 1.16 1.33 1.10(16.19) (5.69) (5.73) (6.40) (6.12)
q5–q1 Buy 9.17 0.97 0.82 0.91 0.52(15.21) (3.74) (4.18) (2.87) (2.49)
Sell −9.11 −0.92 −0.58 −0.64 −0.74(−16.02) (−4.86) (−3.19) (−3.53) (−3.39)
Buy−Sell 18.27 1.89 1.41 1.56 1.26(16.26) (5.16) (5.55) (5.47) (5.19)
618 The Journal of Finance R©
(t-statistic = 5.16) during quarter Q+1 and declines to 1.26% (t-statistic =5.19) in quarter Q+4, although differences in all quarters are significant atthe 1% level. Further, our results show that persistence is primarily drivenby skilled funds, which contrasts with results found by Carhart (1997), whoshows that performance persistence is driven by past underperforming fundsthat tend to charge higher fees.
C. Abnormal Trading Performance of Implied Quarterly Trades
The results in the previous section support the hypothesis that institutionspossess significant interim trading skills. In this section, we ask whether wewould still find significant trading skills for our sample of funds if we were toignore round-trip trades and the timing of interim trades within the quarter.Our investigation not only helps facilitate comparisons to previous quarterlystudies but, more importantly, could help highlight the importance of usinghigh-frequency trading data when investigating institutional trading skill.
We proceed as follows. For each fund and each stock, we aggregate all tradeswithin a quarter and calculate the cumulative net trading position as of thequarter-end. Our net trading positions correspond to net changes in holdingsfrom the previous quarter (identical to CJW (2000) and KSZ (2005)). We thencalculate the DGTW equal- and principal-weighted abnormal return perfor-mance for buys (positive net trading positions) and sells (negative net tradingpositions) separately over the subsequent quarter and compute the differencebetween buys and sells. We refer to this difference as implied quarterly tradingperformance (to differentiate it from our previous interim trading performancemeasures). Our methodology is consistent with CJW (2000) and implicitly as-sumes that all trades occur at the closing price on the last day of the quarter.
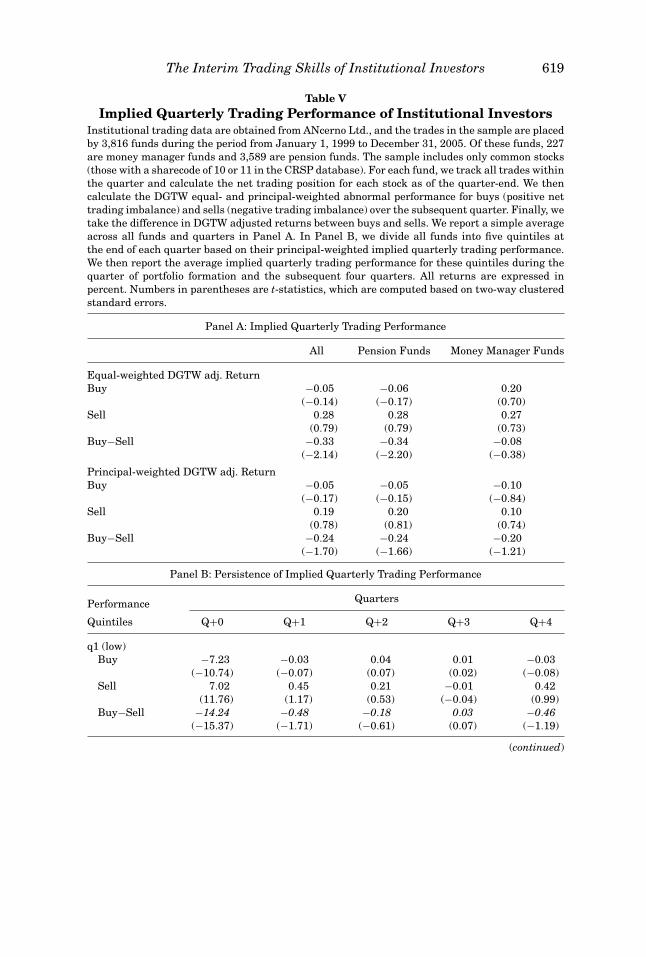
We present implied quarterly trading performance results in Panel A of Ta-ble V. The equal- (principal-) weighted average is −0.33% (−0.24%) and bothare marginally significant. Implied quarterly trading results suggest that thestocks funds buy underperform the stocks funds sell during the subsequentquarter. These conclusions are opposite to our interim trading results andunderscore the importance of using high-frequency trading data in the inves-tigation of trading skill.
Our implied trading measurement period is identical to the measurementperiod that is used by previous quarterly studies, yet our findings appear to beinconsistent with CJW (2000) and KSZ (2005). In particular, CJW (2000) findthat mutual fund buys outperform sells by 0.59% over the subsequent quarter,and KSZ (2005) find outperformance of 1.06% during the subsequent quarter.However, our results are consistent with a more recent study by Duan, Hu, andMcLean (2009), who follow the methodology of CJW (2000) and KSZ (2005) andfind that subsequent quarter trading performance has declined dramaticallyover time. Specifically, Duan, Hu, and McLean (2009) find outperformance of0.76% in the 1980 to 1994 sample period but find that the stocks that mutualfunds buy underperform the stocks they sell by −0.16% during the more recent1995 to 2003 sample period. We again note that our sample period is 1999
The Interim Trading Skills of Institutional Investors 619
Table VImplied Quarterly Trading Performance of Institutional Investors
Institutional trading data are obtained from ANcerno Ltd., and the trades in the sample are placedby 3,816 funds during the period from January 1, 1999 to December 31, 2005. Of these funds, 227are money manager funds and 3,589 are pension funds. The sample includes only common stocks(those with a sharecode of 10 or 11 in the CRSP database). For each fund, we track all trades withinthe quarter and calculate the net trading position for each stock as of the quarter-end. We thencalculate the DGTW equal- and principal-weighted abnormal performance for buys (positive nettrading imbalance) and sells (negative trading imbalance) over the subsequent quarter. Finally, wetake the difference in DGTW adjusted returns between buys and sells. We report a simple averageacross all funds and quarters in Panel A. In Panel B, we divide all funds into five quintiles atthe end of each quarter based on their principal-weighted implied quarterly trading performance.We then report the average implied quarterly trading performance for these quintiles during thequarter of portfolio formation and the subsequent four quarters. All returns are expressed inpercent. Numbers in parentheses are t-statistics, which are computed based on two-way clusteredstandard errors.
Panel A: Implied Quarterly Trading Performance
All Pension Funds Money Manager Funds
Equal-weighted DGTW adj. ReturnBuy −0.05 −0.06 0.20
(−0.14) (−0.17) (0.70)Sell 0.28 0.28 0.27
(0.79) (0.79) (0.73)Buy−Sell −0.33 −0.34 −0.08
(−2.14) (−2.20) (−0.38)
Principal-weighted DGTW adj. ReturnBuy −0.05 −0.05 −0.10
(−0.17) (−0.15) (−0.84)Sell 0.19 0.20 0.10
(0.78) (0.81) (0.74)Buy−Sell −0.24 −0.24 −0.20
(−1.70) (−1.66) (−1.21)
Panel B: Persistence of Implied Quarterly Trading Performance
Performance Quarters
Quintiles Q+0 Q+1 Q+2 Q+3 Q+4
q1 (low)Buy −7.23 −0.03 0.04 0.01 −0.03
(−10.74) (−0.07) (0.07) (0.02) (−0.08)Sell 7.02 0.45 0.21 −0.01 0.42
(11.76) (1.17) (0.53) (−0.04) (0.99)Buy−Sell −14.24 −0.48 −0.18 0.03 −0.46
(−15.37) (−1.71) (−0.61) (0.07) (−1.19)
(continued)
620 The Journal of Finance R©
Table V—Continued
Panel B: Persistence of Implied Quarterly Trading Performance
PerformanceQuarters
Quintiles Q+0 Q+1 Q+2 Q+3 Q+4
q2Buy −2.25 −0.17 −0.40 0.04 0.16
(−7.75) (−0.50) (−1.00) (0.10) (0.42)Sell 1.94 −0.04 0.02 0.35 0.15
(7.56) (−0.11) (0.09) (1.02) (0.48)Buy−Sell −4.19 −0.13 −0.43 −0.03 0.01
(−15.72) (−0.66) (−1.63) (−1.33) (0.03)
q3Buy −0.08 −0.07 0.11 0.11 −0.09
(−0.32) (−0.23) (0.47) (0.35) (−0.28)Sell 0.12 0.19 0.31 0.19 0.25
(0.52) (0.84) (1.22) (0.82) (0.79)Buy−Sell −0.20 −0.25 −0.20 −0.08 −0.34
(−1.90) (−1.48) (−0.99) (−0.35) (−1.72)
q4Buy 1.97 −0.03 0.05 0.07 0.11
(6.45) (−0.13) (0.20) (0.22) (0.33)Sell −1.90 0.11 0.33 0.23 0.29
(−7.05) (0.54) (1.60) (0.81) (1.18)Buy−Sell 3.87 −0.14 −0.28 −0.16 −0.17
(12.94) (−0.81) (−1.18) (−0.69) (−0.74)
q5 (high)Buy 7.33 0.04 0.37 0.04 0.16
(10.79) (0.11) (0.88) (0.13) (0.35)Sell −6.21 0.03 0.19 0.43 −0.13
(−13.06) (0.08) (0.47) (1.38) (−0.37)Buy−Sell 13.54 0.01 0.18 −0.38 0.29
(15.77) (0.04) (0.47) (−1.49) (0.95)
q5–q1Buy 14.56 0.07 0.33 0.03 0.20
(14.24) (0.17) (0.57) (0.08) (0.51)Sell −13.23 −0.42 −0.02 0.44 −0.55
(−15.96) (−1.27) (−0.08) (1.13) (−1.37)Buy−Sell 27.78 0.49 0.36 −0.41 0.75
(16.07) (1.05) (0.68) (−1.00) (1.72)
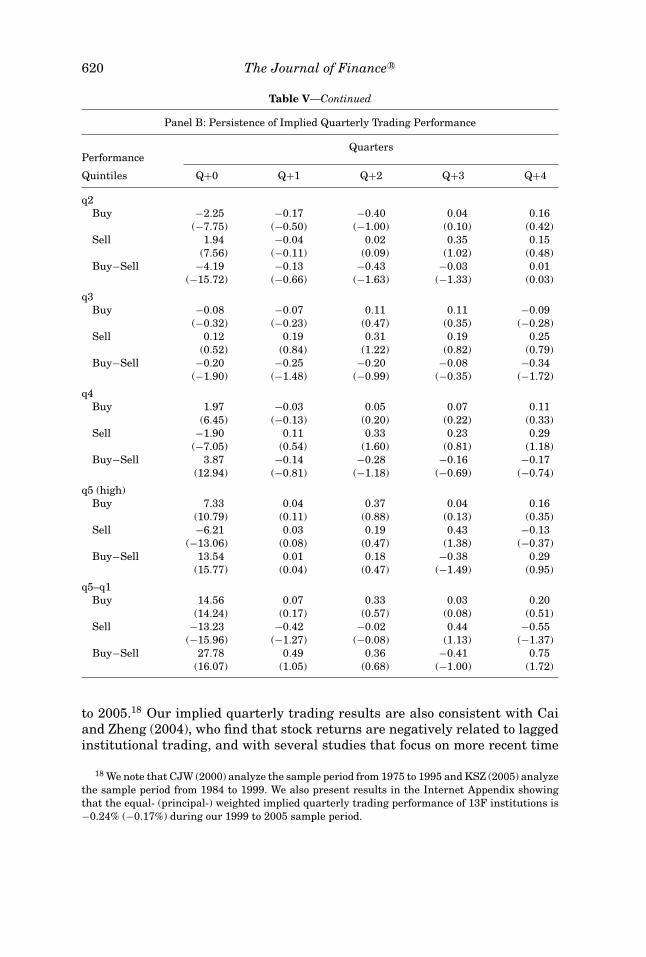
to 2005.18 Our implied quarterly trading results are also consistent with Caiand Zheng (2004), who find that stock returns are negatively related to laggedinstitutional trading, and with several studies that focus on more recent time
18 We note that CJW (2000) analyze the sample period from 1975 to 1995 and KSZ (2005) analyzethe sample period from 1984 to 1999. We also present results in the Internet Appendix showingthat the equal- (principal-) weighted implied quarterly trading performance of 13F institutions is−0.24% (−0.17%) during our 1999 to 2005 sample period.
The Interim Trading Skills of Institutional Investors 621
periods. In particular, Brown, Wei, and Wermers (2009) and Dasgupta, Prat,and Verardo (2011) document evidence of return reversals following institu-tional trading or herding.
We also investigate the persistence of implied quarterly trading performanceto see whether the results differ from those obtained using high-frequency trad-ing data. We sort funds into quintiles based on their principal-weighted impliedquarterly trading performance and track the implied trading performance ofeach quintile over the subsequent four quarters. Results presented in PanelB of Table V show almost no evidence of performance persistence, and anypersistence is only evident for quintile 1 (poor performing) funds. Quintile 1funds have implied quarterly trading performance of −0.48% in the subsequentquarter, whereas the subsequent performance of quintile 5 funds is 0.01%. Thedifference between quintiles 5 and 1 is insignificant in all four subsequentquarters. This result differs from earlier interim trading persistence resultsbut is consistent with CJW (2000), who also find no evidence of performancepersistence.
D. Sources of Interim Trading Skill
Given that we find evidence of superior interim trading skill in Tables IIthrough IV, one important follow-up question is: What is the source of thistrading skill? We argue that profitable trading opportunities are more likelyto occur in stocks where the public information environment is more limited,greater information asymmetries exist, or arbitrage costs are large. Mispric-ing is more likely to arise and persist in these stocks and therefore provideinstitutional investors with greater incentive to gather and process privateinformation. On the other hand, we also recognize that funds will be able tocapture abnormal trading profits only if the value of their private informationis large enough to overcome the higher liquidity costs associated with thesestocks.
The stock characteristics that we use to proxy for a more limited publicinformation environment or greater information asymmetries are firm size andbook-to-market ratio. We expect that smaller firms are more likely to operatein an environment of more limited publicly available information (Fang andPeress (2009)). In addition, greater information asymmetries are likely to existin growth firms because their values are derived more from growth options thanassets in place. We proxy for limits to arbitrage using idiosyncratic volatility.Pontiff (1996, 2006) and Shleifer and Vishny (1997) contend that arbitrageursare less willing to take large positions in high idiosyncratic volatility stocks,which results in larger potential mispricing.
Both information asymmetry and limits to arbitrage are likely to be positivelycorrelated with stock illiquidity, which we measure using turnover, Amihud’s(2002) illiquidity measure, and quoted spreads. As such, we might expect in-terim trading performance to be higher among illiquid stocks. However, therelationship between stock liquidity and interim trading performance is notclear-cut; while higher illiquidity enables mispricing and potentially creates
622 The Journal of Finance R©
profitable trading opportunities for informed investors, it also makes tradesless profitable after implementation costs. Finally, we investigate the relationbetween trading performance and lagged returns, since some institutions mightprofit by following momentum trading strategies.
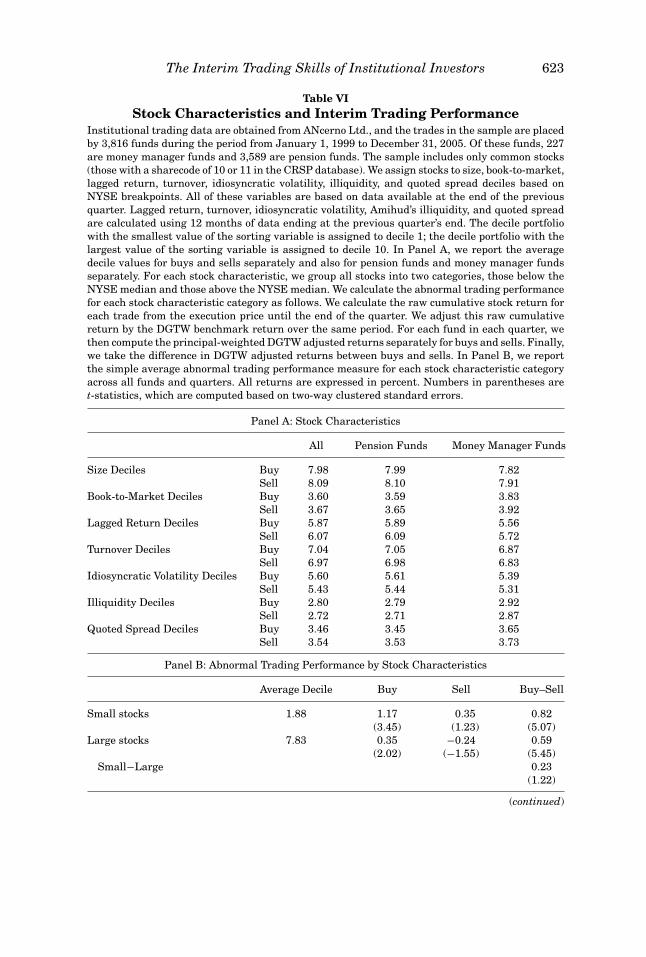
We begin our analysis by assigning a decile-rank value to each stock basedon NYSE breakpoints for each of the above-listed stock characteristics. Thehighest decile for each stock characteristic category has a decile-rank valueof 10 and the lowest a decile-rank value of 1. We report average decile ranksfor buy and sell trades separately in Panel A of Table VI. The average marketcapitalization decile rank for buys (sells) is 7.98 (8.09), and the average book-to-market decile rank is 3.60 (3.67). Our lagged return variable is measuredover the prior 12 months, where we find average decile values between 5.87 and6.07, slightly higher than the median. Turnover, illiquidity, and quoted spreadstatistics all suggest that institutions prefer to trade liquid stocks. Our resultthat institutional investors typically trade large, growth, and liquid stocksis consistent with findings by CJW (2000) and Gompers and Metrick (2001).Our results do not indicate meaningful differences between the characteristicsof stocks bought or sold or systematic differences between the type of stockstraded by pension funds and money manager funds.
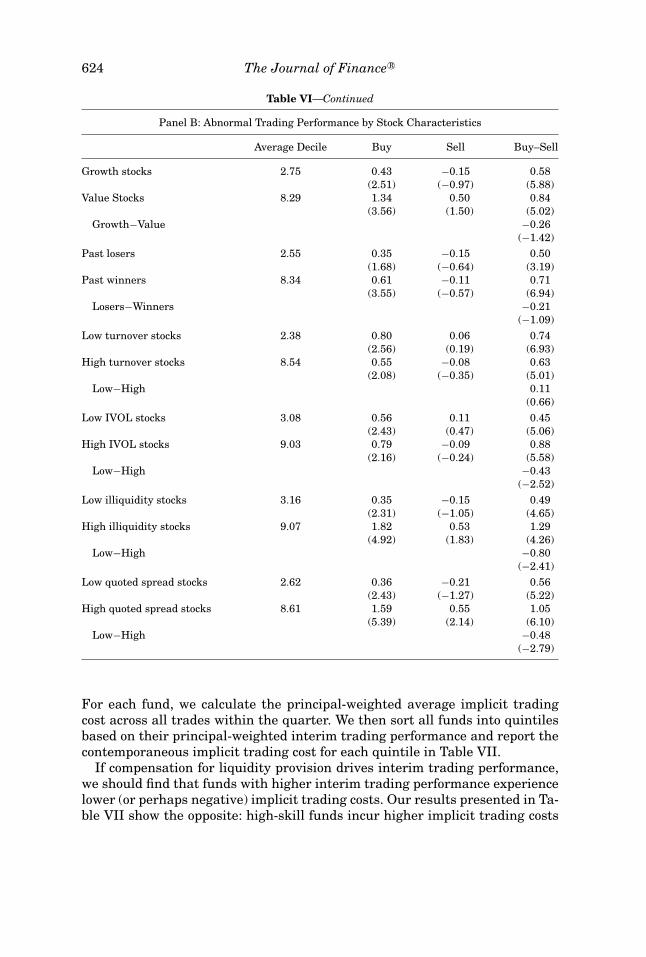
For each stock characteristic listed in Panel A of Table VI, we divide all buyand sell trades into two portfolios based on the median NYSE stock character-istic breakpoint. Following our previous methodology, we calculate principal-weighted interim trading performance for each stock characteristic categoryand present our results in Panel B of Table VI. Interim trading performance ishigher in small stocks (0.82%) when compared to large stocks (0.59%), althoughthe difference is not statistically significant (t-statistic = 1.22). We find higherinterim trading performance for value stocks and past winners (0.84% and0.71%, respectively) than for growth stocks and past losers (0.58% and 0.50%,respectively), but neither difference is statistically significant. Our results doshow significantly higher interim trading performance for high idiosyncraticvolatility and illiquid stocks. The difference in interim trading performance be-tween high and low idiosyncratic volatility stocks is 0.43% (t-statistic = 2.52),and the performance differential is also higher for stocks with higher illiquid-ity (0.80%, t-statistic = 2.41) and higher quoted spreads (0.48%, t-statistic =2.79). Overall, our results provide some support for the hypothesis that in-terim trading gains are driven by trades in stocks where potential informationasymmetries and limits to arbitrage are greater.
Our result that interim trading performance is significantly higher in low-liquidity stocks raises the possibility that some funds exhibit superior tradingperformance because they systematically provide liquidity (and are compen-sated for doing so). To explore the possibility that interim trading performanceis driven by liquidity provision rather than investment skill, we investigatethe relationship between funds’ implicit trading costs and their interim trad-ing performance. We calculate implicit trading costs for each buy trade as theexecution price minus the volume-weighted average price (VWAP) of the sametrading day, and for sell trades we take the VWAP minus the execution price.
The Interim Trading Skills of Institutional Investors 623
Table VIStock Characteristics and Interim Trading Performance
Institutional trading data are obtained from ANcerno Ltd., and the trades in the sample are placedby 3,816 funds during the period from January 1, 1999 to December 31, 2005. Of these funds, 227are money manager funds and 3,589 are pension funds. The sample includes only common stocks(those with a sharecode of 10 or 11 in the CRSP database). We assign stocks to size, book-to-market,lagged return, turnover, idiosyncratic volatility, illiquidity, and quoted spread deciles based onNYSE breakpoints. All of these variables are based on data available at the end of the previousquarter. Lagged return, turnover, idiosyncratic volatility, Amihud’s illiquidity, and quoted spreadare calculated using 12 months of data ending at the previous quarter’s end. The decile portfoliowith the smallest value of the sorting variable is assigned to decile 1; the decile portfolio with thelargest value of the sorting variable is assigned to decile 10. In Panel A, we report the averagedecile values for buys and sells separately and also for pension funds and money manager fundsseparately. For each stock characteristic, we group all stocks into two categories, those below theNYSE median and those above the NYSE median. We calculate the abnormal trading performancefor each stock characteristic category as follows. We calculate the raw cumulative stock return foreach trade from the execution price until the end of the quarter. We adjust this raw cumulativereturn by the DGTW benchmark return over the same period. For each fund in each quarter, wethen compute the principal-weighted DGTW adjusted returns separately for buys and sells. Finally,we take the difference in DGTW adjusted returns between buys and sells. In Panel B, we reportthe simple average abnormal trading performance measure for each stock characteristic categoryacross all funds and quarters. All returns are expressed in percent. Numbers in parentheses aret-statistics, which are computed based on two-way clustered standard errors.
Panel A: Stock Characteristics
All Pension Funds Money Manager Funds
Size Deciles Buy 7.98 7.99 7.82Sell 8.09 8.10 7.91
Book-to-Market Deciles Buy 3.60 3.59 3.83Sell 3.67 3.65 3.92
Lagged Return Deciles Buy 5.87 5.89 5.56Sell 6.07 6.09 5.72
Turnover Deciles Buy 7.04 7.05 6.87Sell 6.97 6.98 6.83
Idiosyncratic Volatility Deciles Buy 5.60 5.61 5.39Sell 5.43 5.44 5.31
Illiquidity Deciles Buy 2.80 2.79 2.92Sell 2.72 2.71 2.87
Quoted Spread Deciles Buy 3.46 3.45 3.65Sell 3.54 3.53 3.73
Panel B: Abnormal Trading Performance by Stock Characteristics
Average Decile Buy Sell Buy–Sell
Small stocks 1.88 1.17 0.35 0.82(3.45) (1.23) (5.07)
Large stocks 7.83 0.35 −0.24 0.59(2.02) (−1.55) (5.45)
Small−Large 0.23(1.22)
(continued)
624 The Journal of Finance R©
Table VI—Continued
Panel B: Abnormal Trading Performance by Stock Characteristics
Average Decile Buy Sell Buy–Sell
Growth stocks 2.75 0.43 −0.15 0.58(2.51) (−0.97) (5.88)
Value Stocks 8.29 1.34 0.50 0.84(3.56) (1.50) (5.02)
Growth−Value −0.26(−1.42)
Past losers 2.55 0.35 −0.15 0.50(1.68) (−0.64) (3.19)
Past winners 8.34 0.61 −0.11 0.71(3.55) (−0.57) (6.94)
Losers−Winners −0.21(−1.09)
Low turnover stocks 2.38 0.80 0.06 0.74(2.56) (0.19) (6.93)
High turnover stocks 8.54 0.55 −0.08 0.63(2.08) (−0.35) (5.01)
Low−High 0.11(0.66)
Low IVOL stocks 3.08 0.56 0.11 0.45(2.43) (0.47) (5.06)
High IVOL stocks 9.03 0.79 −0.09 0.88(2.16) (−0.24) (5.58)
Low−High −0.43(−2.52)
Low illiquidity stocks 3.16 0.35 −0.15 0.49(2.31) (−1.05) (4.65)
High illiquidity stocks 9.07 1.82 0.53 1.29(4.92) (1.83) (4.26)
Low−High −0.80(−2.41)
Low quoted spread stocks 2.62 0.36 −0.21 0.56(2.43) (−1.27) (5.22)
High quoted spread stocks 8.61 1.59 0.55 1.05(5.39) (2.14) (6.10)
Low−High −0.48(−2.79)
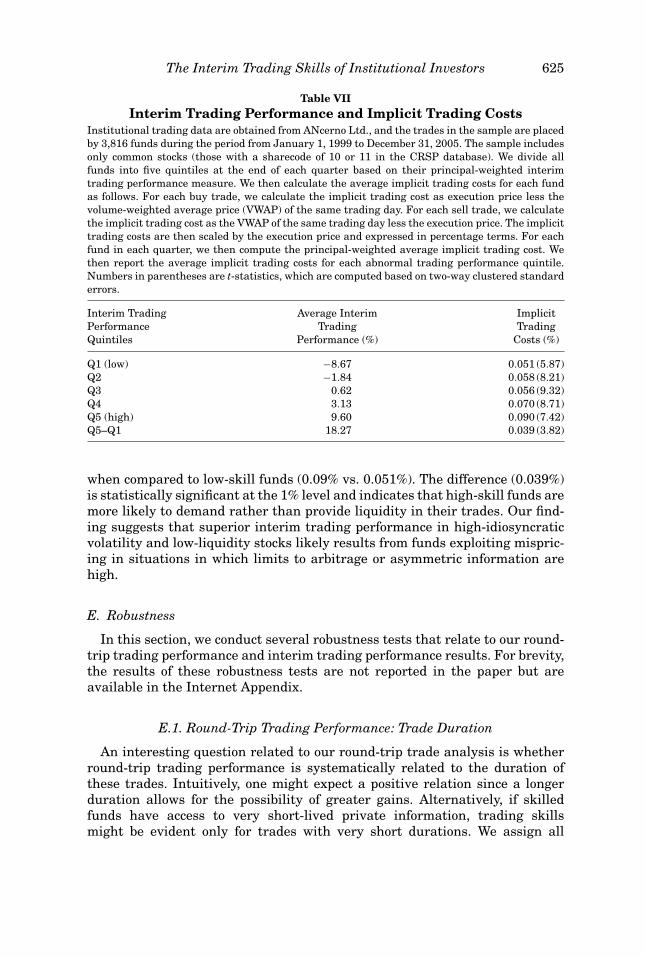
For each fund, we calculate the principal-weighted average implicit tradingcost across all trades within the quarter. We then sort all funds into quintilesbased on their principal-weighted interim trading performance and report thecontemporaneous implicit trading cost for each quintile in Table VII.
If compensation for liquidity provision drives interim trading performance,we should find that funds with higher interim trading performance experiencelower (or perhaps negative) implicit trading costs. Our results presented in Ta-ble VII show the opposite: high-skill funds incur higher implicit trading costs
The Interim Trading Skills of Institutional Investors 625
Table VIIInterim Trading Performance and Implicit Trading Costs
Institutional trading data are obtained from ANcerno Ltd., and the trades in the sample are placedby 3,816 funds during the period from January 1, 1999 to December 31, 2005. The sample includesonly common stocks (those with a sharecode of 10 or 11 in the CRSP database). We divide allfunds into five quintiles at the end of each quarter based on their principal-weighted interimtrading performance measure. We then calculate the average implicit trading costs for each fundas follows. For each buy trade, we calculate the implicit trading cost as execution price less thevolume-weighted average price (VWAP) of the same trading day. For each sell trade, we calculatethe implicit trading cost as the VWAP of the same trading day less the execution price. The implicittrading costs are then scaled by the execution price and expressed in percentage terms. For eachfund in each quarter, we then compute the principal-weighted average implicit trading cost. Wethen report the average implicit trading costs for each abnormal trading performance quintile.Numbers in parentheses are t-statistics, which are computed based on two-way clustered standarderrors.
Interim Trading Average Interim ImplicitPerformance Trading TradingQuintiles Performance (%) Costs (%)
Q1 (low) −8.67 0.051 (5.87)Q2 −1.84 0.058 (8.21)Q3 0.62 0.056 (9.32)Q4 3.13 0.070 (8.71)Q5 (high) 9.60 0.090 (7.42)Q5–Q1 18.27 0.039 (3.82)
when compared to low-skill funds (0.09% vs. 0.051%). The difference (0.039%)is statistically significant at the 1% level and indicates that high-skill funds aremore likely to demand rather than provide liquidity in their trades. Our find-ing suggests that superior interim trading performance in high-idiosyncraticvolatility and low-liquidity stocks likely results from funds exploiting mispric-ing in situations in which limits to arbitrage or asymmetric information arehigh.
E. Robustness
In this section, we conduct several robustness tests that relate to our round-trip trading performance and interim trading performance results. For brevity,the results of these robustness tests are not reported in the paper but areavailable in the Internet Appendix.
E.1. Round-Trip Trading Performance: Trade Duration
An interesting question related to our round-trip trade analysis is whetherround-trip trading performance is systematically related to the duration ofthese trades. Intuitively, one might expect a positive relation since a longerduration allows for the possibility of greater gains. Alternatively, if skilledfunds have access to very short-lived private information, trading skillsmight be evident only for trades with very short durations. We assign all

626 The Journal of Finance R©
round-trip trades in our sample to one of four mutually exclusive categories:holding period less than or equal to 1 week, holding period between 1 week and1 month, holding period between 1 month and 2 months, and holding periodgreater than 2 months. Abnormal holding-period returns are roughly equiv-alent for the first three holding period categories (1.86%, 2.11%, and 2.06%,respectively), and slightly lower for round-trip trades held more than 2 months(1.43%). Our results do not support the hypothesis that trading performanceand trading horizon are correlated but are consistent with the idea that theholding period is endogenous.
E.2. Round-Trip Trading Performance: FIFO and LIFO
Our analysis of round-trip trades relies on specific choices in how we de-fine and calculate round-trip trading performance. In particular, for funds thatexecute multiple buy or multiple sell trades (as part of a round-trip transac-tion) we use the volume-weighted average execution price of buys or sells inour analysis. To check the robustness of our results to alternative methods,we reconstruct our round-trip trading results using the intraquarter first-infirst-out (FIFO) and last-in first-out (LIFO) methods. After-commission abnor-mal round-trip trading performance is 1.76% (t-statistic = 3.38) using FIFOand 1.92% (t-statistic = 3.12) using LIFO. Both methods produce very similarresults to those reported in Table II.
E.3. Interim Trading Performance: Subperiod Analysis
Our sample of institutional trades spans an interesting time period of botheconomic expansion and contraction. We investigate whether interim trad-ing performance differs across different market environments by splitting thesample into bubble (1999 to 2000) and post-bubble (2001 to 2005) periods. Sev-eral recent studies document that mutual funds perform significantly betterduring economic contractions than during economic expansions (Kacperczyk,Van Nieuwerburg, and Veldkamp (2009), Kosowski (2006), Lynch and Wachter(2007), Moskowitz (2000), and Glode (2010)), which suggests that we shouldexpect higher trading performance during the post-bubble period. On the otherhand, we might expect funds to deliver greater abnormal trading profits dur-ing the bubble period, which is characterized by elevated volatility and tradingvolumes, large stock mispricing (ex post), and greater market participationby individual investors. The magnitude and significance of interim tradingperformance during both bubble and post-bubble sample periods (0.55% and0.58%) are similar to full sample results. However, the excess interim tradingperformance for high-idiosyncratic volatility and low-liquidity stocks declinessignificantly from the bubble to the post-bubble period.
E.4. Interim Trading Performance: Money Manager Funds versus PensionFunds
Because money manager funds trade more actively than pension funds,we might expect to observe differences in the sources of interim trading
The Interim Trading Skills of Institutional Investors 627
performance between these two groups. We examine interim trading perfor-mance across various stock characteristics (listed in Table VI) and find thatboth pension funds and money manager funds have higher interim tradingperformance in small, high idiosyncratic volatility, and illiquid stocks. Thereappear to be some differences between the two types of institutions; in partic-ular, money manager funds appear to be more skilled in their sells.
E.5. Interim Trading Performance: Institution-Level Evidence
It is possible that private information used to generate abnormal interimtrading performance is common to all funds within a particular institution(e.g., Fidelity). Indeed, Pomorski (2009) finds that common trades from fundswithin the same investment management company exhibit significant outper-formance. To investigate this possibility, we replicate our analysis of perfor-mance persistence at the institution level and find that the interim tradingperformance difference between quintile 5 and quintile 1 is 1.10% (t-statistic =3.81) in the quarter following portfolio formation. Our results suggest that atleast a portion of the interim trading performance we document is attributableto institution-level factors.
E.6. Does Interim Trading Performance Predict Fund Returns?
If superior interim trading performance benefits fund investors, then a re-lationship should exist between interim trading skill and fund returns. Sincefund returns are unavailable in our data, we construct a proxy of fund returnsbased on trades and also match a subset of ANcerno funds to the CRSP mutualfund database. In both of our analyses, funds with the highest interim tradingperformance have higher monthly fund alphas during the quarter followingportfolio formation than funds with the lowest interim trading performance.Although there is significant noise in each of these tests, our results are consis-tent with the hypothesis that interim trading performance is correlated withsubsequent quarter fund alphas.
F. Discussion
Our analysis reveals that institutional investors possess significant interimtrading skills. In particular, we find that the average after-commission interimtrading performance is 0.27% to 0.34% for funds in our sample. If we assume a75% turnover rate, these figures would suggest that interim trades contribute20 to 26 basis points to abnormal annual fund performance. An obvious follow-up question is: Where or to whom does this outperformance go?
One limitation of the ANcerno database is that it does not contain informationon management fees or fund returns; therefore, we cannot determine whetherinterim trading performance goes to investors or is captured by portfolio man-agers. However, we can compare our abnormal fund performance estimate tothe average management fee charged by institutions. French (2008) estimates
628 The Journal of Finance R©
the average management fee for mutual funds to be approximately 1% peryear.19 We conclude that the fund outperformance due to interim trading skillsdoes not exceed the management fee on average. Our results are consistent withGrossman and Stiglitz (1980), who show that informed traders earn abnormalreturns from their trading when information acquisition is costly.
We note that interim trading performance is persistent and for the top quin-tile of funds is 1.56%. Using a similar calibration, we estimate that interimtrading contributes 1.17% annually to abnormal portfolio returns for high-skillfunds. This estimate is large enough to overcome an average management fee;however, we stress that we do not have information on the cross section of fundmanagement fees. These excess returns might accrue to underlying investors,or as in Berk and Green (2004), these high-skill funds might capture their skillby charging higher management fees.
We also acknowledge that our study captures only one dimension of institu-tional investors’ skills, namely, interim trading skills. Our analysis does notaddress whether institutional investors possess other investment skills suchas long-term (i.e., holdings-based) skills or market-timing skills. We choose tofocus on interim trading skills in part because of data availability but moreimportantly because these skills have not been previously examined, whereaslong-term skills and market-timing skills have already received substantialattention.
IV. Conclusions
The question of whether institutional investors have superior investmentskills is essential to our understanding of efficient capital markets. Our studycontributes uniquely to the current investment skill debate by directly examin-ing the performance of fund trades within the quarter in which they occur. Wefind that interim trading performance is significantly positive and persistentand that persistence is driven by high-skill funds. Our results contrast withmuch of the prior literature and suggest that prior studies using quarterly datahave understated the trading skill of institutional investors because of theirinability to capture interim trades.
To highlight the importance of using high-frequency data in our investiga-tion, we reconstruct our analysis to mimic the sampling frequency of studiesthat employ quarterly holdings data to investigate trading skill (e.g., CJW(2000)). We find that this “implied” quarterly trading performance is actuallynegative and therefore suggests that if we had conducted our analysis at the
19 We provide two alternative estimates for the average annual management fee that is chargedby our sample of funds. Since our data contain both money manager funds and pension funds,the first alternative that we provide aggregates French’s (2008) management fee estimates for fivegroups of institutional investors: mutual funds, defined benefit plans, defined contribution plans,public funds, and nonprofits. The asset-weighted average management fee across all institutiongroups is 0.6%. The second alternative is the average expense ratio for a subsample of ANcerno mu-tual funds that we discuss in the Internet Appendix. The average expense ratio for this subsampleof funds is 1.41%.

The Interim Trading Skills of Institutional Investors 629
quarterly frequency (i.e., ignoring round-trip trades and the timing of interimtrades), we would conclude that funds in our sample have negative tradingskills. Our findings highlight the necessity of using high-frequency trading datawhen investigating short-term institutional trading activities. Specifically, fu-ture research investigating institutional trading activities around events, suchas earnings announcements, analyst recommendations, and merger announce-ments using high-frequency data is likely to yield fresh insights.
We also believe that our research is relevant for policy debates involving thefrequency of disclosure for institutional investors. In the past, the Securitiesand Exchange Commission (SEC) has considered petitions that would requiremore frequent disclosure for mutual funds and other institutional investors(see Wermers (2001)). Our findings suggest that institutional investors exploitshort-term information advantages through their trading activity, and there-fore any requirement that increases the frequency of portfolio disclosures mighterode some of this short-term information advantage.
Appendix: ANcerno Database of Institutional Trades
In this appendix, we present a detailed description of the ANcerno Ltd.institutional trading database. ANcerno is a widely recognized consulting firmthat works with institutional investors to monitor their equity trading costs.Our understanding of the database results from dozens of conversations withANcerno over a period of more than 5 years. In the following description, wedetail some of the key insights to understanding the data. Where appropriate,we include samples taken directly from the ANcerno database. For each clientexecution, the ANcerno database contains 107 different variables. For brevity,we do not list all 107 variables in this appendix, but, rather, concentrate ourdiscussion on what we believe are some of the most important variables.
Trades are sent to ANcerno in “batches” by institutional clients. Tradingdata for money manager clients are received directly from these clients’ OrderDelivery System, while the method of data delivery for pension plan sponsorsis more heterogeneous. Batches can be identified by the variable lognumber,and institutional clients are given a unique numerical code (clientcode). Eachobservation in the ANcerno database represents an execution. Several of thekey variables of interest are clientcode, clientmgrcode, clientbkrcode, ticker,cusip, side, price, and volume. The clientmgrcode refers to the fund within eachinstitution that is responsible for the trade (e.g., Fidelity Magellan vs. FidelityContrafund). The clientbkrcode allows the researcher to identify the brokerexecuting the trade. Ticker and cusip identify the stock traded. Side, price, andvolume identify whether the trade is a buy or sell, the execution price, and thenumber of shares executed.
Executions are often part of larger ticket orders submitted by an insti-tution. The variables xv and xp correspond to the executed volume andvolume-weighted execution price of the ticket order. Each observation (exe-cution) corresponds to a ticket order. The following illustration represents aticket order from an institution to buy (identified by side) 600 shares of a
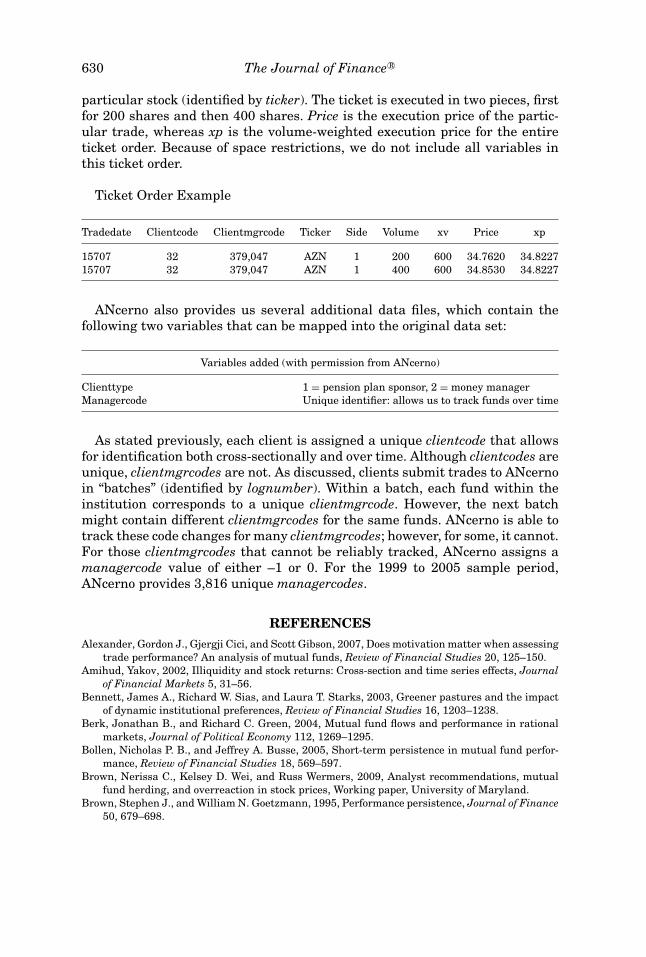
630 The Journal of Finance R©
particular stock (identified by ticker). The ticket is executed in two pieces, firstfor 200 shares and then 400 shares. Price is the execution price of the partic-ular trade, whereas xp is the volume-weighted execution price for the entireticket order. Because of space restrictions, we do not include all variables inthis ticket order.
Ticket Order Example
Tradedate Clientcode Clientmgrcode Ticker Side Volume xv Price xp
15707 32 379,047 AZN 1 200 600 34.7620 34.822715707 32 379,047 AZN 1 400 600 34.8530 34.8227
ANcerno also provides us several additional data files, which contain thefollowing two variables that can be mapped into the original data set:
Variables added (with permission from ANcerno)
Clienttype 1 = pension plan sponsor, 2 = money managerManagercode Unique identifier: allows us to track funds over time
As stated previously, each client is assigned a unique clientcode that allowsfor identification both cross-sectionally and over time. Although clientcodes areunique, clientmgrcodes are not. As discussed, clients submit trades to ANcernoin “batches” (identified by lognumber). Within a batch, each fund within theinstitution corresponds to a unique clientmgrcode. However, the next batchmight contain different clientmgrcodes for the same funds. ANcerno is able totrack these code changes for many clientmgrcodes; however, for some, it cannot.For those clientmgrcodes that cannot be reliably tracked, ANcerno assigns amanagercode value of either –1 or 0. For the 1999 to 2005 sample period,ANcerno provides 3,816 unique managercodes.
REFERENCESAlexander, Gordon J., Gjergji Cici, and Scott Gibson, 2007, Does motivation matter when assessing
trade performance? An analysis of mutual funds, Review of Financial Studies 20, 125–150.Amihud, Yakov, 2002, Illiquidity and stock returns: Cross-section and time series effects, Journal
of Financial Markets 5, 31–56.Bennett, James A., Richard W. Sias, and Laura T. Starks, 2003, Greener pastures and the impact
of dynamic institutional preferences, Review of Financial Studies 16, 1203–1238.Berk, Jonathan B., and Richard C. Green, 2004, Mutual fund flows and performance in rational
markets, Journal of Political Economy 112, 1269–1295.Bollen, Nicholas P. B., and Jeffrey A. Busse, 2005, Short-term persistence in mutual fund perfor-
mance, Review of Financial Studies 18, 569–597.Brown, Nerissa C., Kelsey D. Wei, and Russ Wermers, 2009, Analyst recommendations, mutual
fund herding, and overreaction in stock prices, Working paper, University of Maryland.Brown, Stephen J., and William N. Goetzmann, 1995, Performance persistence, Journal of Finance
50, 679–698.
The Interim Trading Skills of Institutional Investors 631
Busse, Jeffrey A., Amit Goyal, and Sunil Wahal, 2010, Performance and persistence in institutionalinvestment management, Journal of Finance 65, 765–790.
Busse, Jeffrey A., T. Clifton Green, and Narasimhan Jegadeesh, 2010, Buy-side trades and sell-side recommendations: Interactions and information content, Journal of Financial Markets(forthcoming).
Busse, Jeffrey A., and Paul Irvine, 2006, Bayesian alphas and mutual fund persistence, Journalof Finance 61, 2251–2288.
Cai, Fang, and Lu Zheng, 2004, Institutional trading and stock returns, Finance Research Letters1, 178–189.
Campbell, John Y., Tarun Ramadorai, and Allie Schwartz, 2009, Caught on tape: Institutionaltrading, stock returns, and earnings announcements, Journal of Financial Economics 92,66–91.
Carhart, Mark M., 1997, On persistence in mutual fund performance, Journal of Finance 52,57–82.
Chan, Louis K. C., and Josef Lakonishok, 1993, Institutional trades and intraday stock pricebehavior, Journal of Financial Economics 33, 173–199.
Chan, Louis K. C., and Josef Lakonishok, 1995, The behavior of stock prices around institutionaltrades, Journal of Finance 50, 1147–1174.
Chemmanur, Thomas J., Shan He, and Gang Hu, 2009, The role of institutional investors inseasoned equity offerings, Journal of Financial Economics 94, 384–411.
Chen, Hsiu-Lang, Narasimhan Jegadeesh, and Russ Wermers, 2000, The value of active mutualfund management: An examination of the stockholdings and trades of fund managers, Journalof Financial and Quantitative Analysis 35, 343–368.
Chen, Joseph, Harrison Hong, Ming Huang, and Jeffrey D. Kubik, 2004, Does fund size erodemutual fund performance? The role of liquidity and organization, American Economic Review94, 1276–1302.
Cohen, Randolph B., Joshua D. Coval, and Lubos Pastor, 2005, Judging fund managers by thecompany they keep, Journal of Finance 60, 1057–1096.
Cremers, K. J. Martijn, and Antti Petajisto, 2009, How active is your fund manager? A new measurethat predicts performance, Review of Financial Studies 22, 3329–3365.
Daniel, Kent, Mark Grinblatt, Sheridan Titman, and Russ Wermers, 1997, Measuring mu-tual fund performance with characteristic-based benchmarks, Journal of Finance 52, 1035–1058.
Dasgupta, Amil, Andrea Prat, and Michela Verardo, 2011, Institutional trade persistence andlong-term equity returns, Journal of Finance 66, 635–654.
Duan, Ying, Gang Hu, and R. David McLean, 2009, When is stock picking likely to be successful?Evidence from mutual funds, Financial Analysts Journal 65, 55–65.
Edelen, Roger M., Richard B. Evans, and Gregory B. Kadlec, 2009, Scale effects in mutual fundperformance: The role of trading costs, Working paper, University of Virginia.
Elton, Edwin J., Martin J. Gruber, and Christopher R. Blake, 1996, The persistence of risk-adjustedmutual fund performance, The Journal of Business 69, 133–157.
Elton, Edwin J., Martin J. Gruber, and Christopher R. Blake, 2010, Holdings data, security returns,and the selection of superior mutual funds, Journal of Financial and Quantitative Analysis(forthcoming).
Elton, Edwin J., Martin J. Gruber, Christopher R. Blake, Yoel Krasny, and Sadi O. Ozelge, 2010,The effect of holdings data frequency on conclusions about mutual fund behavior, Journal ofBanking and Finance 34, 912–922.
Fama, Eugene F., and Kenneth R. French, 2010, Luck versus skill in the cross section of mutualfund returns, Journal of Finance 65, 1915–1947.
Fang, Lily, and Joel Peress, 2009, Media coverage and the cross-section of stock returns, Journalof Finance 64, 2023–2052.
French, Kenneth R., 2008, Presidential address: The cost of active investing, Journal of Finance63, 1537–1573.
Glode, Vincent, 2010, Why mutual funds “underperform,” Journal of Financial Economics (forth-coming).
632 The Journal of Finance R©
Goetzmann, William N., and Roger G. Ibbotson, 1994, Do winners repeat: Patterns in mutual fundreturn behavior, Journal of Portfolio Management 20, 9–18.
Goldstein, Michael A., Paul Irvine, Eugene Kandel, and Zvi Wiener, 2009, Brokerage commissionsand institutional trading patterns, Review of Financial Studies 22, 5175–5212.
Goldstein, Michael A., Paul Irvine, and Andy Puckett, 2010, Purchasing IPOs with commissions,Journal of Financial and Quantitative Analysis (forthcoming).
Gompers, Paul A. and Andrew Metrick, 2001, Institutional investors and equity prices, QuarterlyJournal of Economics 116, 229–259.
Griffin, John M., Jeffrey H. Harris, and Selim Topaloglu, 2003, The dynamics of institutional andindividual trading, Journal of Finance 58, 2285–2320.
Grinblatt, Mark, and Sheridan Titman, 1992, The persistence of mutual fund performance, Journalof Finance 47, 1977–1984.
Grossman, Sanford J., and Joseph E. Stiglitz, 1980, On the impossibility of informationally efficientmarkets, American Economic Review 70, 393–408.
Gruber, Martin J., 1996, Another puzzle: The growth in actively managed mutual funds, Journalof Finance 51, 783–810.
Hendricks, Darryll, Jayendu Patel, and Richard Zeckhauser, 1993, Hot hands in mutual funds:Short-run persistence of relative performance 1974–1988, Journal of Finance 48, 93–130.
Hirshleifer, David, Avanidhar Subrahmanyam, and Sheridan Titman, 1994, Security analysis andtrading patterns when some investors receive information before others, Journal of Finance49, 1665–1698.
Jame, Russell E., 2010, Organizational structure and fund performance: Pension funds versusmutual funds, Working paper, Emory University.
Jensen, Michael C., 1968, The performance of mutual funds in the period 1945–1964, Journal ofFinance 23, 389–416.
Jones, Charles M., and Marc L. Lipson, 2001, Sixteenths: Direct evidence on institutional executioncosts, Journal of Financial Economics 59, 253–278.
Kacperczyk, Marcin, and Amit Seru, 2007, Fund manager use of public information: New evidenceon managerial skills, Journal of Finance 62, 485–528.
Kacperczyk, Marcin, Clemens Sialm, and Lu Zheng, 2005, On the industry concentration of activelymanaged equity mutual funds, Journal of Finance 60, 1983–2011.
Kacperczyk, Marcin, Clemens Sialm, and Lu Zheng, 2008, Unobserved actions of mutual funds,Review of Financial Studies 21, 2379–2416.
Kacperczyk, Marcin, Stijn Van Nieuwerburgh, and Laura Veldkamp, 2009, Attention allocationover the business cycle, Working paper, New York University.
Kosowski, Robert, 2006, Do mutual funds perform when it matters most to investors? U.S. mutualfund performance and risk in recessions and expansions, Working paper, Imperial College.
Kosowski, Robert, Allan Timmermann, Russ Wermers, and Hal White, 2006, Can mutual fund“stars” really pick stocks? New evidence from a bootstrap analysis, Journal of Finance 61,2551–2595.
Kothari, S. P., and Jerold B. Warner, 2001, Evaluating mutual fund performance, Journal ofFinance 56, 1985–2010.
Lewellen, Jonathan, 2009, Institutional investors and the limits of arbitrage, Journal of FinancialEconomics (forthcoming).
Lynch, Anthony W., and Jessica A. Wachter, 2007, Does mutual fund performance vary over thebusiness cycle? Working paper, New York University.
Mamaysky, Harry, Matthew Spiegel, and Hong Zhang, 2008, Estimating the dynamics of mutualfund alphas and betas, Review of Financial Studies 21, 233–264.
Moskowitz, Tobias J., 2000, Mutual fund performance: An empirical decomposition into stock-picking talent, style, transactions costs, and expenses: Discussion, Journal of Finance 55,1695–1703.
Moulton, Brent R., 1986, Random group effects and the precision of regression estimates, Journalof Econometrics 32, 385–397.
Odean, Terrance, 1998, Are investors reluctant to realize their losses? Journal of Finance 53,1775–1798.
The Interim Trading Skills of Institutional Investors 633
Pomorski, Lukasz, 2009, Acting on the most valuable information: “Best idea” trades of mutualfund managers, Working paper, University of Toronto.
Pontiff, Jeffrey, 1996, Costly arbitrage: Evidence from closed-end funds, Quarterly Journal ofEconomics 111, 1135–1151.
Pontiff, Jeffrey, 2006, Costly arbitrage and the myth of idiosyncratic risk, Journal of Accountingand Economics 42, 35–52.
Puckett, Andy, and Xuemin Yan, 2010, Short-term institutional herding and its impact on stockprices, Working paper, University of Tennessee.
Shleifer, Andrei, and Robert W. Vishny, 1997, The limits of arbitrage, Journal of Finance 52, 35–55.Thompson, Samuel, 2011, Simple formulas for standard errors that cluster by both firm and time,
Journal of Financial Economics 81, 101–141.Wermers, Russ, 2000, Mutual fund performance: An empirical decomposition into stock-picking
talent, style, transactions costs, and expenses, Journal of Finance 55, 1655–1695.Wermers, Russ, 2001, The potential effects of more frequent portfolio disclosure on mutual fund
performance, Perspective (The Investment Company Institute) 7, 1–12.Yan, Xuemin, 2008, Liquidity, investment style, and the relation between fund size and fund
performance, Journal of Financial and Quantitative Analysis 43, 741–768.Yan, Xuemin and Zhe Zhang, 2009, Institutional investors and equity returns: Are short-term
institutions better informed? Review of Financial Studies 22, 893–924.