the insurance sector: vacancies in london€¦ · the rise in the number of vacancies in the...
TRANSCRIPT

The Insurance Sector:Vacancies in LondonMarch 2017

0202
Overview 03
Analysis by Role 04
Breakdown by Company 05
Analysis by Seniority 06
About Vacancysoft 07
About Oliver James 07
Contents
We are delighted to be partnering yet again with Vacancysoft
to provide insight into recruitment activity in the insurance industry.
For this report we have been analysing online career activity across
insurance sector vacancies in London between 1 February 2015 and 31 January 2017.
Should you like to know more about current activity
in the employee landscape, please contact Oliver James Associates.Nick Godson Group Director
0303
Number of Vacancies
Insurance Vacancies by Three-Month Period
Vacancies by Seniority
700 800 900200100 300 400 500 600
2015 2016
Num
ber o
f Vac
anci
es
FEB
MAR
AP
R M
AY
JUN
JU
L AU
G SE
PO
CT
NO
V DE
CJA
N
FEB
MAR
AP
R M
AY
JUN
JU
L AU
G SE
PO
CT
NO
V DE
CJA
N
10
20
30
40
50
60
Junior Associate/Manager
Senior Associate/Manager
Trend (Junior Associate/Manager)
Trend (Senior Associate/Manager)
3M to 04/15
3M to 07/15
3M to 07/16
3M to 10/16
3M to 10/15
3M to 01/17
3M to 01/16
3M to 04/16
London, Feb 2015 to Jan 2017
London, Feb 2015 to Jan 2017
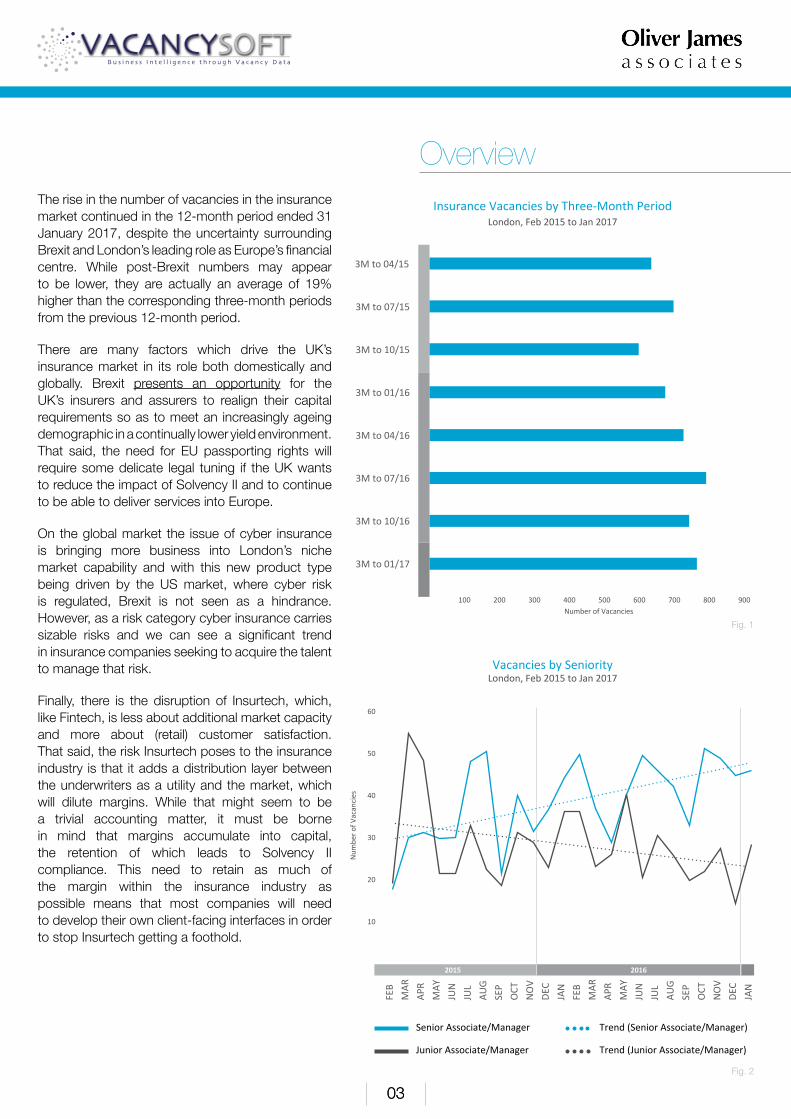
OverviewThe rise in the number of vacancies in the insurance market continued in the 12-month period ended 31 January 2017, despite the uncertainty surrounding Brexit and London’s leading role as Europe’s financial centre. While post-Brexit numbers may appear to be lower, they are actually an average of 19% higher than the corresponding three-month periods from the previous 12-month period.
There are many factors which drive the UK’s insurance market in its role both domestically and globally. Brexit presents an opportunity for the UK’s insurers and assurers to realign their capital requirements so as to meet an increasingly ageing demographic in a continually lower yield environment. That said, the need for EU passporting rights will require some delicate legal tuning if the UK wants to reduce the impact of Solvency II and to continue to be able to deliver services into Europe.
On the global market the issue of cyber insurance is bringing more business into London’s niche market capability and with this new product type being driven by the US market, where cyber risk is regulated, Brexit is not seen as a hindrance. However, as a risk category cyber insurance carries sizable risks and we can see a significant trend in insurance companies seeking to acquire the talent to manage that risk.
Finally, there is the disruption of Insurtech, which, like Fintech, is less about additional market capacity and more about (retail) customer satisfaction. That said, the risk Insurtech poses to the insurance industry is that it adds a distribution layer between the underwriters as a utility and the market, which will dilute margins. While that might seem to be a trivial accounting matter, it must be borne in mind that margins accumulate into capital, the retention of which leads to Solvency II compliance. This need to retain as much of the margin within the insurance industry as possible means that most companies will need to develop their own client-facing interfaces in order to stop Insurtech getting a foothold.
Fig. 1
Fig. 2

0404
Analysis by RoleDuring the period under review the data shows that total Insurance vacancies in London increased by 16.7% in the 12-month period ended 31 January 2017 as compared to the previous 12-month period. As the rolling three-month trend line shows, the increase has been relatively consistent. There might be some signs of a cooling in growth going into 2017, as vacancies in January 2017 were 6.7% lower than in January 2016. Revisiting the data in April of this year will give a better indication.
For top line vacancy analysis we identify 13 key professions; however, as vacancies for Scientists are rare, there are in effect 12. The top five roles (Insurer, IT professional, Marketer, Accountant and Actuary) accounted for 77% of total vacancies in both 2015/6 and 2016/7, with the top three roles taking 60.0% and 64.3% in the same periods. The biggest growth was among demand for IT professionals, which showed a 35.5% year-on-year increase.
Breaking the IT profession down into its specialisations shows that IT management has seen growth in excess of 130%. Drilling down further into the data, analysis of sub-specialisations reveals growth in Change Management (171%), Disaster Recovery Management (400%), Risk Management (370%) and SCRUM Management (267%). In development and engineering the growth specialisations are UI (user interface) and UX (user experience) design and development, application development and software engineering. These vacancy trends are indicative of how the insurance industry is addressing its two biggest challenges: Insurtech and cyber insurance.
According to industry reports policies covering risks from cyber-attacks rose 50% in 2016 and while global premiums for those risks are currently around $2.5billion, they are expected to grow to more than $20 billion by 2025.
The insurance industry is currently having to come to terms with Insurtech, which is an often overlooked niche within Fintech. Like Fintech, Insurtech is about enhancing the client experience, an area often overlooked in traditional insurance.
The increases in demand for IT UI and UX development staff are probably looking to correct this, but one should also note the increase in marketing and PR roles.
Insurance Company Vacancies
2015 2016
2016
Num
ber o
f Vac
anci
es
FEB
MAR
AP
R M
AY
JUN
JU
L AU
G SE
PO
CT
NO
V DE
CJA
N
FEB
MAR
AP
R M
AY
JUN
JU
L AU
G SE
PO
CT
NO
V DE
CJA
N
Total Vacancies
Feb 2015 - Jan 2016 Feb 2016 - Jan 2017
Rolling three-month averageTrend (Total Vacancies)
Number of Vacancies
Insurance Company Vacancies by Selected Profession
IT Vacancies in Insurance Companies
700 800 900200100 300 400 500 600
Actuary
50
100
150
200
250
300
350
IT Management
IT Analyst
IT Development & Engineering
IT Infrastructure
IT Support
IT Security
IT Specialist
IT Consulting
Feb 2015 - Jan 2016 Feb 2016 - Jan 2017
London, Feb 2015 to Jan 2017
London, Feb 2015 to Jan 2017
London, Feb 2015 to Jan 2017
Insurance Industry Specific
Financial Operations
Consultant
Office / Business SupportLawyer
Accountant
IT ProfessionalMarketer / PR
Executive ManagementHR Professional
50 100 150 200 250
Fig. 3
Fig. 4
Fig. 5

0505
Figure 6 uses three-month averages so as to smooth out monthly variations and give a clearer indication of trends. Total vacancies in London for the Insurance industry were up by 16.7%. The mid-tier firms, those with 501 to 5,000 employees, have held a steady share of 33% and delivered year-on-year growth of just under 18%. It has been left to the big firms (i.e. those employing more than 5,000 staff) to maintain overall growth: firms in that segment had 22.3% more vacancies for the 12-month period ended 31 January 2017 than they had had in the previous 12-month period.
Over the 24-month period covered by the data the top ten firms were the source of 63% of all the vacancies in the data; for the 12-month period ending in January 2015 they accounted for 65% of all vacancies. If one applies exponential trend lines to these ten companies, only RSA shows a falling trend, with Direct Line, Willis, Aviva and Hiscox in particular showing strong continuous growth.
Figure 8 illustrates the change in vacancies in selected professions in the ten companies in the data set which advertised the largest numbers of vacancies in London during the 24-month period under review. It shows that, as a general rule, the ten largest firms have followed the same basic trends as the rest of the market; however, in some specific categories they have been announcing proportionately more vacancies than the overall market has announced. Accountancy is one of the professions for which vacancies have exceeded the general trend, with a noticeable emphasis on Financial Planning and Treasury roles. With regard to Executive roles the focus has been on Legal and Compliance, along with Strategy Management.
With revenue growth in 2016 likely to average less than 2%, it is fair to say that vacancy growth is not revenue driven but more likely due to regulatory changes and to changes in the operational landscape. While growth in vacancies for Lawyers seems to be flat, the exponential trend line in fact shows a very slight improvement; however, given the now increased business in cyber insurance and the associated risks connected therewith, to say nothing of the new category for Brexit business disruption claims, one can expect to see a recovery here.
Breakdown by Company
Vacancy Growth in Top 10 Companies
Vacancy Change by Role
2015/6 2016/7 G%
2015/6 2016/7
Top Ten General
G%
Direct Line Insurance
Aon
RSA Insurance
Willis Group Holdings
Aviva
QBE Insurance
Lloyds of London
Domestic and General
Jardine Lloyd Thompson
Hiscox
45.9%
16.7%
-26.5%
92.5%
16.0%
17.2%
50.5%
6.1%
21.1%
43.1%
410
293
189
283
189
157
152
105
109
93
281
251
257
147
163
134
101
99
90
65
Accountant
Actuary
Banker
Consultant
Executive Management
HR Professional
Insurance Industry Specific
IT Professional
Lawyer
Marketer / PR
Office / Business Support
19.9%
-35.5%
12.0%
-45.4%
56.3%
-2.1%
16.6%
35.5%
30.0%
17.9%
59.3%
G%
42.0%
-38.9%
19.3%
-51.6%
59.5%
-7.1%
16.8%
56.4%
100.0%
29.5%
140.0%
159
69
68
15
126
92
605
552
24
202
24
112
113
57
31
79
99
518
353
12
156
10
0
Num
ber o
f Vac
anci
es
Insurance Vacancies by Company Size London, Three-Month Averages, Apr 2015 to Jan 2017
51 to 500 501 to 5,000 5,000 plus
900
700
800
200
100
300
400
500
600
2015 2016
APR
MAY
JUN
JUL
AUG
SEP
OCT
NO
V
DEC
JAN
FEB
MAR
APR
MAY
JUN
JUL
AUG
SEP
OCT
NO
V
DEC
JAN
Fig. 7
Fig. 8
Fig. 6

0606
Analysis by SeniorityOf the 5,649 vacancies which were announced in the period under review (i.e. from 1 February 2015 to 31 January 2017), only two percent were for non-managerial roles, so there will be no commentary in this report about those posts. Figure 9 shows that 65% of the vacancies which were announced were for middle management roles and only 6% were at the level of Divisional Head / Director.
Figure 10 covers period-on-period growth both in terms of the three-month and twelve-month periods which ended on 31 January 2017. It shows that the growth patterns were broadly in line, with the exception of a significant slow-down at the level of Director/Partner vacancies and the continuing contraction in junior vacancies.
If we look at these numbers in terms of linear growth, it becomes possible to gain a little more insight into trends. Junior Associate roles showed a declining trend but note in figure 2 (on page 3) how the January 2017 vacancies have risen above the trend-line. The pattern suggests that we ought to expect a low number for February, but note that February 2016 matched January of that year, so if the number of vacancies in February stays above 15, it is possible that we may see an improvement in this particular trend.
For vacancies at the Director level the trend line is flat but the line showing actual vacancies is continuing to diverge from the trend; if there is no recovery in February/March, we can expect the slowing in growth to continue.
For Department Heads and Senior Associates/Managers the trends are positive and supported by actual vacancy numbers that are either above the trend or tracking it.
Finally, in terms of concentration of seniority, we can see that at all levels the top three professions deliver nearly two thirds of the senior ranks. Given that this report focuses specifically on the insurance sector, we would expect a consistent bias towards insurance professionals, but note how IT professionals are either the most sought-after or the second most sought-after staff at all of the senior managerial levels.
Vacancy Changes by Seniority
Role / Seniority Matrix
DirectorDept.Head
Mdl.Mgr.
Department/Divisional Head
Director/Partner
Junior Associate/Manager
Mid Associate/Manager
Senior Associate/Manager
Gth%
81.8%
7.7%
-20.5%
14.3%
23.9%
Gth%
78.0%
38.2%
-12.3%
16.9%
25.2%
3 M to 01/16
22
13
88
434
113
3 M to01/17
40
14
70
496
140
2016/7
146
76
314
1931
516
2015/6
82
55
358
1652
412
Accountant
Executive Management
Insurer
IT Professional
Marketer / PR
Sales
Top Three Total
27.0%
26.5%
9.9%
63.4%
Sen.Mgr.
11.1%
30.5%
25.4%
7.0%
17.5%
21.1%
21.9%
60.5%
16.8%
38.2%
13.0%
67.9%
Insurance Vacancies by Seniority London, Feb 2015 to Jan 2017
Director/Partner
Mid Associate/Manager Department/Divisional Head
Junior Associate/Manager
Senior Associate/Manager
Fig. 9
Fig. 10
Fig. 11

0707
About Oliver JamesEstablished in 2002, Oliver James Associates is a global specialist recruitment partner to the Financial Services, Professional Services, Commerce & Industry sectors. Our shared values define our working practices and help guide our decisions, actions and behaviours; innovation, passion, adaptability, partnership, respect and excellence. At the core of our six values is the collective aspiration to be the most valued and essential recruitment partner, globally.
We recruit up to C-suite level across key markets in the UK, Ireland, continental Europe, US and Asia Pacific, offering retained, contingency, contract and interim search services. Excellence in delivery is embedded in our culture. We identify and place the best talent for our partners across 14 vertical markets, developing local and international relationships built on trust and uncompromising ethics and integrity. Our global teams of specialist consultants are experts in their vertical markets with an unrivalled network of mid to senior level professionals worldwide. Our consultants anticipate market demand and successfully deliver on identifying, attracting and placing rare talent within their areas of expertise, creating long-term value for our partners.
ojassociates.com
About VacancysoftVacancysoft is a subscription-based data publisher for the Recruitment Industry. Established in 2006, we now have thousands of subscribers worldwide, clients range from FTSE listed businesses to industry specialists, whereby we optimise business development and client care.
Our Vacancy Tracker provides real-time updates of the latest vacancies being published on company websites, with every user having the ability to create their own personalised feed. Sign up for a free trial at vacancysoft.com/FreeTrial
Our Market Reports are written in partnership with leading organisations in the recruitment industry providing unique analysis and insight on the latest trends and are frequently quoted in leading business media. Please email our support team at [email protected] if you have any specific questions regarding this report.
Our Recruitment Industry Insights Newsletter contains all the reports, along with other analysis we produce and are published to all relevant people in the recruitment industry. Register for our newsletter at vacancysoft.com/Newsletter
Our Business Intelligence Unit then works with clients to provide bespoke solutions enabling greater insight on market trends enhancing strategy and planning. Contact us to find out more at [email protected]
vacancysoft.com
Contacts detailsGet in touch with our Client Relationship Team
