the information technology agreement: an assessment · pdf file111 trade and economic profiles...
TRANSCRIPT

109
The Information Technology Agreement: An Assessment
of World Trade in Information Technology
Products
Web version:January 2010
Authors:Michael Anderson and Jacob Mohs1
Abstract
The Information Technology Agreement (ITA), a multilateral agree-ment emerging from the Uruguay Round, eliminates tariffs on specific technology and telecommunications products for member countries. Primary goals of the ITA are increased trade and com-petition through trade liberalization for information technology (IT) products, and the global diffusion of information technology. The ITA went into effect in 1997 with 29 WTO member countries and now includes 72 WTO members. It covers over 95 percent of total world trade in IT products, currently estimated at $4 trillion annually. The emergence of complex global supply chains for IT products, rapid deployment of new technologies, and technol-ogy convergence since the ITA’s inception, shine new light on the role of the ITA in global trade. This paper provides an overview of the ITA, describes the level of tariff liberalization associated with membership, and discusses the changing composition of ITA mem-bership. The paper further examines ITA trade between 1996 and
1 Michael Anderson ([email protected]) is Chief of the Advanced Technology and Machinery Division, U.S. International Trade Commission, and Jacob Mohs is a former agency international trade analyst. This paper represents solely the views of the authors and is not meant to represent the views of the U.S. International Trade Commission or any of its Commissioners.

110
2008, highlighting the changing composition of trade by leading exporting and importing nations and profiles ITA trade by product segment, focusing on computers, semiconductors, and telecommu-nications equipment. The paper finds a significant shift in ITA trade to Asia, particularly China, and to a lesser extent to Eastern Europe. Significant developments in global ITA trade include, increasing diversification of ITA members’ trade and economic profiles and expanding trade participation by developing countries.
Introduction
The Information Technology Agreement (ITA or Agreement), a multilateral agreement emerging from the Uruguay Round, eliminates tariffs on specific technology and telecommunications products by signatory countries. Based on the most favored nation (MFN) principle, the benefits of ITA tariff liberalization are extended to all WTO members. Primary goals of the ITA are increased trade, global diffusion of information technology, and enhanced global economic growth and welfare through trade liberalization for information technology (IT) products. The ITA was concluded in late 1996 with 29 WTO member countries and now includes 72 WTO members. This paper provides a historical perspective on ITA product trade, examining global trade flows and accession of new member countries during the 12 years of the Agreement. Trade patterns for ITA products are examined in the context of increased trade and competition and diffusion of information technology as envisioned in the Agreement.
The paper begins with an overview of the ITA and the level of tariff liberalization associated with membership, continuing with a discussion of the changing composition of ITA membership. Then it examines ITA trade between 1996 and 2008, highlighting the changing composition of leading exporting and importing countries, and profiles ITA trade by product segment, focusing on computers, semiconductors, and telecommunications equipment. The paper highlights a threefold expansion of world trade in ITA products since 1996, facilitated by aggressive tariff liberalization and broadening ITA membership. It finds a significant shift in ITA trade to Asia (particularly China) and to a lesser extent Eastern Europe, evident in the displacement of traditional producers and exporters of IT equipment by rising Asian ITA members. Other key findings include the increasing diversification of ITA members in terms of

111
trade and economic profiles and expanding trade participation by developing countries.2
The Agreement
In December 1996, at the WTO’s Singapore Ministerial Conference, 29 signatory countries3 concluded the Ministerial Declaration on Trade in Information Technology Products (Declaration),4 establishing the ITA. Activation of the provisions in the Declaration was contingent on the ITA’s member countries accounting for 90 percent of world trade in IT products by a deadline four months later (April 1, 1997). The original signatories’ trade coverage, however, was only 83 percent. Through additional negotiations, several other countries signed the Declaration, bridging the gap in trade coverage by the Declaration’s deadline. With the ITA in effect as of April 1, 1997, participants soon after commenced a schedule of phased duty reductions, with all duties slated for elimination by 2000.5 Because commitments under the ITA are on a MFN basis, the bound zero duty rates for ITA products apply to all WTO members, including non-ITA members.
At the outset, the stated goals of raising living standards, enhancing global economic growth and welfare, and facilitating increased trade for IT products rested on aggressive tariff liberalization. In accordance with the ITA, member countries agreed to “bind and eliminate all custom duties and other duties and charges” for IT products specified in the agreement.6 While ITA provisions call for periodic review and consultations on nontariff barriers, the only commitments in the ITA are for tariff elimination.
2 Developing countries status based on World Bank income classifi cations as noted herein.
3 The European Communities (e.g., EU-15) are treated as individual members, with Switzerland and Liechtenstein a single customs union.
4 WTO 1996.5 Several developing countries, including Costa Rica, India, Indonesia, South Korea,
and Chinese Taipei, implemented extended duty staging to 2005 on a product-by-product basis as permitted in the Declaration.
6 WTO 1996.

112
Tariff Rates
A primary objective of the Declaration was to improve market access and promote global trade through elimination of bound duties on IT products on an MFN basis. Initial participants agreed to a series of four equal tariff reductions between 1997 and 2000, with certain exceptions granted to developing countries. While many developed countries had maintained fairly low tariffs on IT goods prior to the Singapore Ministerial, tariff elimination on an MFN basis was central to achieving the trade and economic benefits envisioned in the ITA. Bora and Liu (2006) calculate that simple average tariffs over all ITA products before the Agreement was 3.6 percent for ITA members, compared with 11.2 percent for non-members. According to the WTO, average bound tariff rates for ITA products for developed countries were reduced from 4.9 percent to zero (WTO 2008, 15). These initial rates ranged from 1 percent to 12.1 percent, which compared with 1.2 percent to 66.4 percent for developing countries.7 Because they had considerably higher bound rates before the Agreement, several developing countries implemented significant tariff liberalization to achieve duty free trade under the ITA. The largest concessions, based on pre-ITA bound rates, were by India (66.4 percent), Thailand (30.9 percent), and Turkey (24.9 percent). Similarly, for applied tariff rates, developing countries’ pre-ITA tariffs were generally higher than the average 2.7 percent for developed countries. Notable average applied-tariff reductions for developing countries included those of India (from 36.3 percent), China (from 12.7 percent), and Egypt (from 12.1 percent).
Expanding Membership
Since the inception of the ITA with 29 original signatories, ITA membership has steadily expanded, reaching 72 members in 2009,8 with increasing participation from developing countries. Developed countries accounted for nearly all of the original signatories, with Indonesia and Turkey the only
7 Exceptions included Macao, China, and Hong Kong (China), which already maintained duty-free status for ITA products (WTO 2007).
8 WTO 2008. Peru, the latest member entering the ITA, submitted its ITA schedule to participants for verifi cation and approval in 2008 (USTR 2009).
113
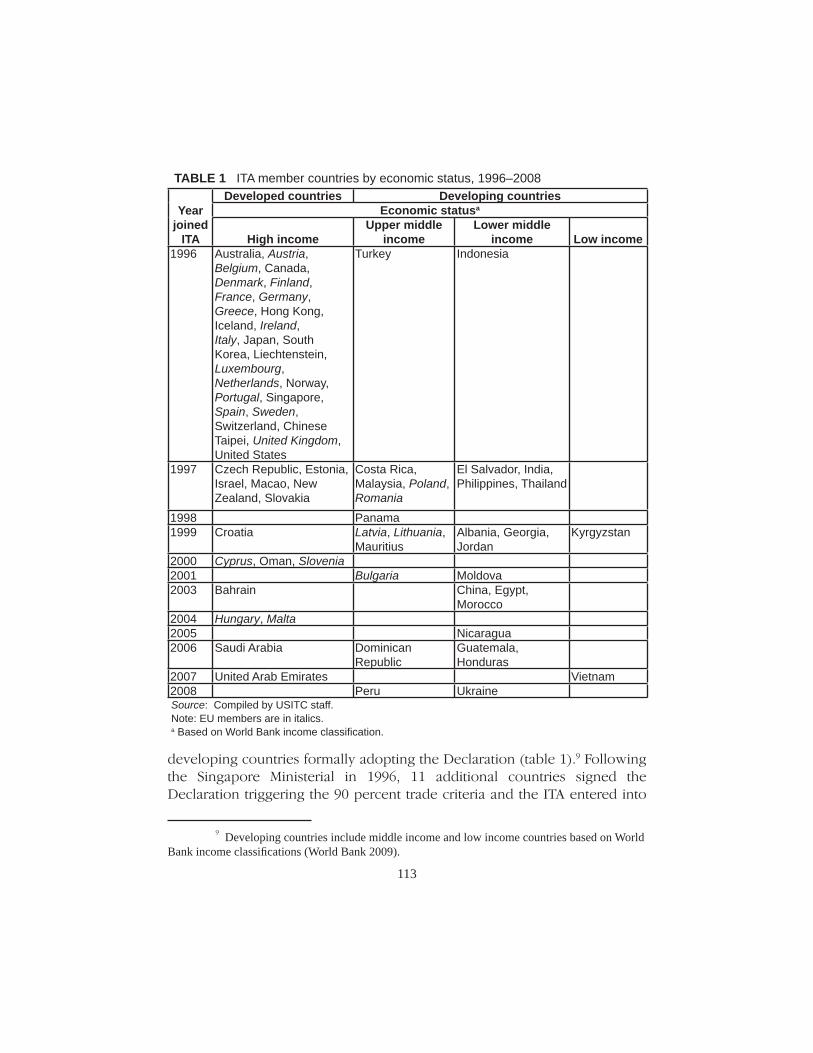
developing countries formally adopting the Declaration (table 1).9 Following the Singapore Ministerial in 1996, 11 additional countries signed the Declaration triggering the 90 percent trade criteria and the ITA entered into
9 Developing countries include middle income and low income countries based on World Bank income classifi cations (World Bank 2009).
TABLE 1 ITA member countries by economic status, 1996–2008
Year joined
ITA
Developed countries Developing countriesEconomic statusa
High incomeUpper middle
incomeLower middle
income Low income1996 Australia, Austria,
Belgium, Canada, Denmark, Finland, France, Germany, Greece, Hong Kong, Iceland, Ireland, Italy, Japan, South Korea, Liechtenstein, Luxembourg, Netherlands, Norway, Portugal, Singapore, Spain, Sweden, Switzerland, Chinese Taipei, United Kingdom, United States
Turkey Indonesia
1997 Czech Republic, Estonia, Israel, Macao, New Zealand, Slovakia
Costa Rica, Malaysia, Poland, Romania
El Salvador, India, Philippines, Thailand
1998 Panama1999 Croatia Latvia, Lithuania,
MauritiusAlbania, Georgia, Jordan
Kyrgyzstan
2000 Cyprus, Oman, Slovenia2001 Bulgaria Moldova2003 Bahrain China, Egypt,
Morocco2004 Hungary, Malta2005 Nicaragua2006 Saudi Arabia Dominican
RepublicGuatemala, Honduras
2007 United Arab Emirates Vietnam2008 Peru UkraineSource: Compiled by USITC staff.Note: EU members are in italics.a Based on World Bank income classifi cation.

114
force April 1, 1997. In total, 14 members, more than half of them developing countries, joined the ITA in 1997, raising total membership to 43 countries. Between 1998 and 2008, developing countries accounted for 20 of the 29 new participants (68.9 percent); developing countries’ participation expanded from 2 to 30 countries, or from 6.9 percent to 41.7 percent of ITA members (figure 1). While the present composition of ITA members, in terms of economic status, differs from that of the WTO (nearly two-thirds of WTO members are developing countries), the steady increase in participation by developing countries is a significant achievement, considering that pre-ITA trade in IT products was highly concentrated among developed countries (Mann and Liu, 4).10
The ITA participants that joined after the original signatory members also presented diverse trade and economic profiles, consistent with the increasing participation of developing countries after 1996. The diversification of membership profiles illustrates increasing interest in liberalized ITA trade. Using total ITA trade (exports and imports) and per capita gross domestic
10 In 1990 Japan, Europe, and the United States accounted for nearly two-thirds (68 percent) of the global export market for IT products (Mann and Liu 2007).
0%
20%
40%
60%
80%
100%
Shar
e by
inco
me
stat
us
1996 1998 2000 2003 2005 2007
High Income Upper-Middle Income Lower-Middle Income Low Income
Source : Compiled by USITC staff from UN Comtrade database.
FIGURE 1 ITA membership composition, share by income status,a 1996-2008
aBased on World Bank income classif ication.

115
product (GDP)11 as indicators of trade activity and economic station makes its possible to illustrate the heterogeneity of the post-1996 entrants. For example, Bahrain and China entered the ITA in 2003 with highly divergent economic and ITA trade profiles. Bahrain, in accordance with its developed country status, showed a relatively high GDP ($13,726) but lower ITA trade activity ($273 million), compared to China’s lower GDP ($1,270) and higher ITA trade activity ($250.2 billion) (table 2 and figure 2). Even within high-income, middle-income, and low-income groups, the economic and trade profile of countries upon ITA entrance varied considerably.
Among the high income countries, Hungary, Israel, and the United Arab Emirates displayed higher GDP and ITA trade activity than Estonia and Croatia. Within the middle-income group of developing countries, Malaysia and China entered the ITA with relatively strong GDP and ITA trade activity, compared with Georgia and Moldova’s lower GDP and nascent ITA trade activity. Despite its developing income status, China’s total ITA trade was $250.2 billion in 2003 when it joined the ITA, exceeding the ITA trade level of Japan ($153.6 billion) in 1996, when it entered the ITA. Notably, China was a leading manufacturer and trader of IT products prior to joining the ITA and deeply engaged in the global IT production chain even before tariff liberalization.
ITA Products
Recognizing the social and economic benefits derived from liberalized trade and diffusion of information technology products (WTO 1996), the drafters of the Ministerial Declaration identified specific products for which duties and other charges would be eliminated. Participants agreed to implement binding duty eliminations through a schedule of concessions covering products in categories such as computers, software, telecommunications, semiconductors, semiconductor manufacturing equipment, scientific and measuring equipment, and related parts. Products covered under the ITA are listed in two annexes to the Declaration, commonly referred to as Attachments A and B.12 Attachment A is a positive list of items at the 6-digit Harmonized Schedule (HS) level, separated into two sections (A1 and A2). Attachment B includes product descriptions but not any corresponding HS code, whether
11 IMF 2009.12 Ibid., Annex.

116
TABLE 2 ITA membership countries by economic status, 1997–2008
CountryYear
joined ITA Economic statusaGDP per capita ($)
Total ITA trade
(Million $)Hungary 2004 High income 10,090 33,673Israel 1997 High income 18,993 8,169Saudi Arabia 2006 High income 8,490 6,600Czech Republic 1997 High income 5,545 5,885United Arab Emirates 2007 High income 40,147 4,000Malta 2004 High income 13,987 2,770New Zealand 1997 High income 17,656 1,942Slovakia 1997 High income 3,984 1,406Slovenia 2000 High income 10,045 1,148Estonia 1997 High income 3,581 788Croatia 1999 High income 5,058 617Cyprus 2000 High income 13,425 278Bahrain 2003 High income 13,726 273Oman 2000 High income 8,271 255Malaysia 1997 Upper middle income 4,693 58,416Poland 1997 Upper middle income 4,064 4,542Romania 1997 Upper middle income 1,567 948Peru 2008 Upper middle income 4,453 948Bulgaria 2001 Upper middle income 1,712 654Costa Rica 1997 Upper middle income 3,508 629Lithuania 1999 Upper middle income 3,098 361Panama 1998 Upper middle Income 3,954 316Latvia 1999 Upper middle income 3,038 275Mauritius 1999 Upper middle income 3,571 144China 2003 Lower middle income 1,270 250,202Thailand 1997 Lower middle income 2,496 22,368Philippines 1997 Lower middle income 1,170 21,460India 1997 Lower middle income 410 3,077Morocco 2003 Lower middle income 1,688 2,664Ukraine 2008 Lower middle income 3,920 2,338Guatemala 2006 Lower middle income 2,325 941Egypt 2003 Lower middle income 1,197 625Honduras 2006 Lower middle income 1,474 361Nicaragua 2005 Lower middle income 843 173Jordan 1999 Lower middle income 1,720 169Moldova 2001 Lower middle income 407 46Georgia 1999 Lower middle income 627 38Albania 1999 Lower middle income 1,130 37El Salvador 1997 Lower middle income 2,077 0Vietnam 2007 Low income 835 5,375Kyrgyz Republic 1999 Low income 260 26
Source: Compiled by USITC staff.Note: EU members are in italicsa Based on World Bank income classifi cation.

117
or not they are included in Attachment A. The descriptive approach in the Attachment B list is designed to cover products regardless of specific HS codes (Mann and Liu, 8) and to address divergent national positions in coverage of complex, multifunction products (Dreyer and Hindley, 4). Common products listed in Attachments A1, A2, and B, along with the number of 6-digit HS codes included in the original list, are noted in table 3. Notable IT products outside the scope of the ITA, mainly consumer electronic products, include CRT television sets, video cameras, and certain photocopiers.13
ITA Trade
Global IT trade has grown substantially under the ITA.14 From 1996 through 2008 total ITA products trade (imports and exports) expanded 10.1 percent annually, albeit unevenly, growing from $1.2 trillion to $4.0 trillion. The strong
13 For details on ITA negotiating history, including product coverage, see Fleiss and Sauvé 1997.
14 Trade data are based on appropriate HS nomenclature for each year. See box 1 for further details regarding the dataset and attendant complexities.
FIGURE 2 Profiles of ITA members, by income and trade levels
0
10,000
20,000
30,000
40,000
50,000
1993
1994
1995
1996
1997
1998
1999
2000
2001
2002
2003
2004
2005
2006
2007
2008
2009
Year Signed ITA
GD
P Pe
r Cap
ita ($
)
China
Bahrain
Indonesia
USA
UAE
Luxembourg
Vietnam
Japan
HungaryUK
Malaysia
Total ITA trade represented by sphere size.Source: Compiled by USITC staff from UN Comtrade database.

118
growth in ITA trade exceeded that of manufactures trade, which expanded 7.1 percent annually during the same period (figure 3). ITA trade expansion was steepest between 1996 and 2000, growing 17.5 percent annually, but declined between 2000 and 2002 (-2.8 percent) as the internet boom of the 1990s abruptly reversed, adversely affecting IT spending and investment (Friar, et
TABLE 3 Representative ITA products and number of HS codes, by attachmentNumber
of HS codes Sample Products
Attachment A1 112 Computers and computer peripherals: Personal computers, laptops, work stations, monitors, keyboards, hard drives, CD-ROM drives, smart cards, printers, scanners, and other input/output unitsTelecommunications equipment: telephone sets, cordless phones, mobile handsets, pagers, answering machines, switches, routers, hubs, modems, fi ber optic cablesSemiconductors: microprocessors, integrated circuits, printed circuits, diodes, resistors Software: magnetic tapes, unrecorded media Offi ce equipment: certain photocopy machines, fax machines, cash registers, adding machines, calculators, automatic teller machines (ATM)Scientifi c and measuring devices: spectrometers, chromatographs, fl ow meters, gauges, optical radiation devices Other: Loudspeakers, still digital cameras, parts
Attachment A2 78 Semiconductor manufacturing equipment (SME): etching and stripping apparatus, vapor deposition devices, sawing and dicing machines for wafers, spinners, ion implanters, wafer transport, handling and storage machines, injection molds, optical instruments, parts and accessories
Attachment B 13a Computers, electric amplifi ers, fl at-panel displays, network equipment, monitors, pagers, CD and DVD drives, plotters, printed circuit assemblies, removable storage devices, set-top boxes
Source: WTO, and data compiled by Commission staff.a Attachment B products are covered regardless of where they are classifi ed in the HS system. ITA Committee members have made attempts to narrow divergences in the customs classifi cation of some Attachment B products (WTO G/IT/W6/Rev.3), though there is no agreed-upon list. This paper uses such codes as a proxy.

119
BOX 1 Data challenges and changing classifi cations
Changes to the HS system resulting from several factors, including technological developments impede attempts to pinpoint precise values in ITA trade. The HS system underwent nomenclature revisions in 2002 and more signifi cantly in 2007, complicating the construction of a consistent times series for ITA product trade. As noted by the WTO, “The ITA committee has already started to discuss how to update the products list into the new nomenclatures, but it proved very diffi cult to reach an agreement due to the complexity of HS amendments and the remaining classifi cation problems under the old nomenclature (HS1996).”a Quantifying trade in Attachment B products is additionally challenging because most countries provided their own list of tariff codes, usually at the national line level (i.e. the 8- or 10-digit level), where these products may be classifi ed, and some countries have not provided a list.
Because no WTO-approved ITA product list exists for HS 2007, the authors have constructed estimates for this analysis. For example, 6-digit codes provided in the ITA for Attachments A1 and A2 refl ect World Customs Organization (WCO) transpositions as a proxy. However, many such products are breakouts (i.e. ex-outs) at the 6-digit level and ITA members have identifi ed specifi c national tariff lines within these subheadings to cover these products. In our estimation, the HS 2007 system includes 354 sets of changes, 70 impacting the ITA. In Attachment A1, 54 of 111 subheadings are affected, as are 53 of 58 subheadings in Attachment A2. For Attachment B, while there is no agreed-upon list, it is estimated that approximately 51 of 72 subheadings are affected for products where a code was listed. Consequently, the veracity of ITA trade data in 2007 and 2008 is likely affected by transposition challenges with HS 2007. For example, uneven 2007-2008 trade in offi ce equipment stems in part from signifi cant classifi cation changes. Despite the challenges posed by the HS 2007 nomenclature, utilizing the HS 2002 list after 2006 may signifi cantly understate trade, as the HS 2002 list fails to capture several ITA products starting in 2007.b To mitigate this, a constructed data set was employed, using the nomenclature appropriate for each year.c The data set also segregates products covered in both Attachments A and B to avoid possible duplication.d Finally, ITA product segments (e.g., computers, semiconductors) are based on HTS product descriptions, and in instances where products are covered in both Attachments and their use may span multiple segments (e.g., printed circuit assemblies), segmentation relied on USITC product digests.e Therefore, this paper presents a conservative approximation of the aggregate ITA trade data. The authors have used this data set to examine changes in trade patterns, product composition, and country market share, as new members adopted tariff liberalization embodied in the ITA.______________
a http://www.wto.org/english/thewto_e/coher_e/wto_wco_e.htm. b For example, cellular telephones, classifi ed in HS 2002 under 8525.20, are classifi ed in HS 2007 under 8517.12, a new 6-digit subheading not contained in HS 2002. c The data for 1996–2001 calculates the total base on the 1996 Ministerial Declaration, while the list for 2002-2006 calculates the total based on the WTO’s transposition into HS 2002. For 2007–2008, the total is calculated using a list transposed into HS 2007. While imperfect and likely understating trade for certain ITA products, using the HS 2007 produces a more representative data set. d Appendix A illustrates ITA total trade by segregated Attachment lists during 1996–2008. e See Shifts in U.S. Merchandise Trade 2008 (2009).

120
al. 2008, 4).15 In 2002, however, ITA products trade growth resumed, but at a comparatively slower pace (10.4 percent).
As a share of global trade, ITA product trade peaked in 2001 at 18.4 percent. While the ITA’s share declined slightly to 15.2 percent in 2008, it remains above the 1996 level of 13.8 percent (table 4). This share, however, likely understates the economic significance of this product group. Since the inception of the ITA, prices of technology products have trended downwards (WTO 2008, 16),16 masking the increasing level of ITA trade.
15 U.S. technology investment was down 7 percent in 2001 and 9 percent in 2002, reacting sharply to excesses associated with the tech bubble (Friar, et al. 2008).
16 Based on U.S. import values between 1996 and 2005, average unit prices for IT products declined 6 percent annually compared with a 1 percent increase for all other manufactured goods (WTO 2008).
100
150
200
250
300
350
400
1996 1997 1998 1999 2000 2001 2002 2003 2004 2005 2006 2007 2008
1996
=100
ITA Manufactures
FIGURE 3 ITA and manufactures total trade, 1996–2008
Source : Compiled by USITC staff from UN Comtrade database.

121
Shifting Trade Patterns
Twelve years of duty-free trade in ITA products triggered substantial changes in trade patterns and market shares for ITA member countries. A prominent feature of expanding ITA trade is the broadening participation of Asian countries, particularly China, and an increasingly important role for other developing countries. While especially high growth rates17 for ITA trade are observed throughout Asian countries, some ITA member countries benefited more than others. Among Asian and developing countries, the rapidly expanding role of China stands out: China has emerged to become the largest single player in the global ITA market. Outside of Asia, several Eastern European countries experienced an upsurge in ITA trade.
Broader Asia Shifts
Asia’s role in ITA trade grew extensively during the last decade. While not all countries within Asia gained equally, several Asian ITA countries are now leading exporters, importers, and centers for global production networks ITA products.
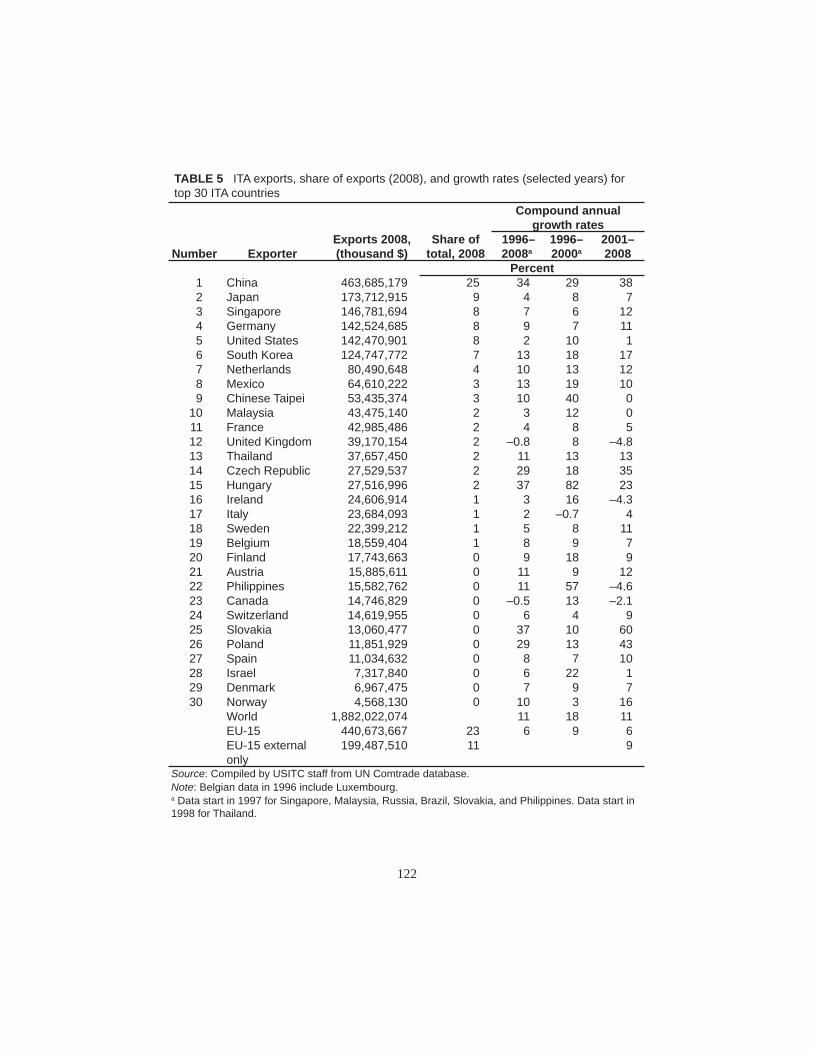
Asian ITA exports grew rapidly between 1996 and 2008, led principally by China and to a lesser extent by Singapore, South Korea, and Thailand. Annual export growth rates were strongest for China (33.5 percent),18 South Korea (13.1 percent), Chinese Taipei (9.8 percent), and Philippines (11.0 percent) (table 5).19 Similarly, import growth rates were strong for several Asian countries, led by China (24.4 percent)20 and including Thailand (9.6 percent),
17 Growth rates are compound annual growth rates unless otherwise indicated.18 ITA exports from Hong Kong, China, grew 13.0 percent annually.19 Malaysia’s ITA trade grew at an annual rate of 10.2 percent from 1997–2006, and then
declined sharply, due largely to incomplete data reporting for HS 2007. 20 ITA imports from Hong Kong, China, increased 14.3 percent annually.
TABLE 4 ITA trade compared with manufactures trade, share and growth rates, selected years
Share of total trade (percent)
Compound annual growth rate (percent)
2008 1996–2008 1996–2000 2001–2008ITA total trade 15 11 18 11Manufactures total trade
66 7 5 10
Source: Compiled by USITC staff from UN Comtrade database.
122
TABLE 5 ITA exports, share of exports (2008), and growth rates (selected years) for top 30 ITA countries
Compound annual growth rates
Number ExporterExports 2008, (thousand $)
Share of total, 2008
1996–2008a
1996–2000a
2001–2008
Percent1 China 463,685,179 25 34 29 382 Japan 173,712,915 9 4 8 73 Singapore 146,781,694 8 7 6 124 Germany 142,524,685 8 9 7 115 United States 142,470,901 8 2 10 16 South Korea 124,747,772 7 13 18 177 Netherlands 80,490,648 4 10 13 128 Mexico 64,610,222 3 13 19 109 Chinese Taipei 53,435,374 3 10 40 0
10 Malaysia 43,475,140 2 3 12 011 France 42,985,486 2 4 8 512 United Kingdom 39,170,154 2 –0.8 8 –4.813 Thailand 37,657,450 2 11 13 1314 Czech Republic 27,529,537 2 29 18 3515 Hungary 27,516,996 2 37 82 2316 Ireland 24,606,914 1 3 16 –4.317 Italy 23,684,093 1 2 –0.7 418 Sweden 22,399,212 1 5 8 1119 Belgium 18,559,404 1 8 9 720 Finland 17,743,663 0 9 18 921 Austria 15,885,611 0 11 9 1222 Philippines 15,582,762 0 11 57 –4.623 Canada 14,746,829 0 –0.5 13 –2.124 Switzerland 14,619,955 0 6 4 925 Slovakia 13,060,477 0 37 10 6026 Poland 11,851,929 0 29 13 4327 Spain 11,034,632 0 8 7 1028 Israel 7,317,840 0 6 22 129 Denmark 6,967,475 0 7 9 730 Norway 4,568,130 0 10 3 16
World 1,882,022,074 11 18 11EU-15 440,673,667 23 6 9 6EU-15 external only
199,487,510 11 9
Source: Compiled by USITC staff from UN Comtrade database.Note: Belgian data in 1996 include Luxembourg.a Data start in 1997 for Singapore, Malaysia, Russia, Brazil, Slovakia, and Philippines. Data start in 1998 for Thailand.
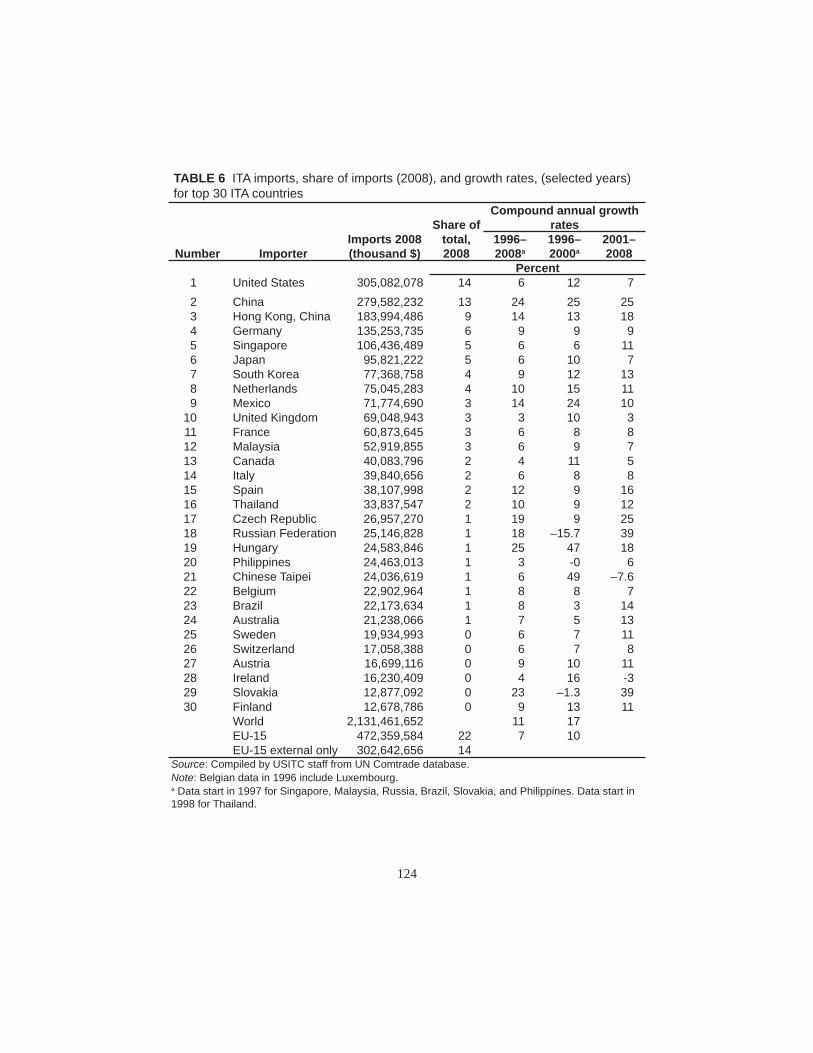
123
South Korea (9.0 percent), Singapore (6.2 percent), and Japan (5.7 percent) (table 6). Asian ITA members now represent 5 of the 10 largest exporters and importers of ITA products.
Japan, formerly the leading exporter of ITA products, is now the second largest Asian exporter behind China, ceding market share due to sharper growth in exports by other Asian countries. Japan’s export market share fell from a 1996 high of 18.6 percent to only 9.2 percent in 2008. Despite the decline in ITA export shares in Japan, the robust increase in ITA market share for several other Asian countries, above all China, indicates a significant shift in manufacturing capabilities for ITA products towards Asian countries, particularly developing Asian countries.
The shifting ITA trade patterns in Asia are consistent with the increasingly fragmented production of goods across the Asian region. Diversified production chains allow producers to benefit from an individual country’s comparative advantages (Capannelli, 3). Because the products covered by the ITA are conducive to this production model, they play a major role in global production networks (Slaughter 2003, 27). Fragmentation-based specialization has become a key component of the economic landscape in Asia (Athukorola, 15), with much of the change taking place since the inception of the ITA.
China
China’s rise to preeminence in the global ITA market is the most significant shift in ITA trade in Asia—and the world. When the original member countries concluded the ITA in 1996, China accounted for 3 percent of total ITA trade. By 2008, China accounted for nearly 19 percent of total ITA trade, surpassing the United States, the next largest trader at 11.2 percent. During this period, China’s total ITA trade value grew at a remarkable annual rate of 29.0 percent, more than twice the global average of 10.7 percent. Presently, China is the largest exporter and second largest importer of ITA products (tables 5 and 6). Through its WTO accession and commitment to join the ITA,21 China gained MFN access to major markets and became an increasingly attractive location for export-oriented foreign direct investment (FDI) (Fung, et al. 2008, 9),22
21 China’s accession to the WTO in 2001 included a commitment to join the ITA, which occurred in 2003.
22 China’s WTO accession was the catalyst for a new surge in FDI infl ows, focused on manufacturing, during a time when worldwide FDI was declining (Fung, et al. 2008).
124
TABLE 6 ITA imports, share of imports (2008), and growth rates, (selected years) for top 30 ITA countries
Share ofCompound annual growth
rates
Number ImporterImports 2008 (thousand $)
total, 2008
1996–2008a
1996–2000a
2001–2008
Percent1 United States 305,082,078 14 6 12 72 China 279,582,232 13 24 25 253 Hong Kong, China 183,994,486 9 14 13 184 Germany 135,253,735 6 9 9 95 Singapore 106,436,489 5 6 6 116 Japan 95,821,222 5 6 10 77 South Korea 77,368,758 4 9 12 138 Netherlands 75,045,283 4 10 15 119 Mexico 71,774,690 3 14 24 10
10 United Kingdom 69,048,943 3 3 10 311 France 60,873,645 3 6 8 812 Malaysia 52,919,855 3 6 9 713 Canada 40,083,796 2 4 11 514 Italy 39,840,656 2 6 8 815 Spain 38,107,998 2 12 9 1616 Thailand 33,837,547 2 10 9 1217 Czech Republic 26,957,270 1 19 9 2518 Russian Federation 25,146,828 1 18 –15.7 3919 Hungary 24,583,846 1 25 47 1820 Philippines 24,463,013 1 3 -0 621 Chinese Taipei 24,036,619 1 6 49 –7.622 Belgium 22,902,964 1 8 8 723 Brazil 22,173,634 1 8 3 1424 Australia 21,238,066 1 7 5 1325 Sweden 19,934,993 0 6 7 1126 Switzerland 17,058,388 0 6 7 827 Austria 16,699,116 0 9 10 1128 Ireland 16,230,409 0 4 16 -329 Slovakia 12,877,092 0 23 –1.3 3930 Finland 12,678,786 0 9 13 11
World 2,131,461,652 11 17EU-15 472,359,584 22 7 10EU-15 external only 302,642,656 14
Source: Compiled by USITC staff from UN Comtrade database.Note: Belgian data in 1996 include Luxembourg.a Data start in 1997 for Singapore, Malaysia, Russia, Brazil, Slovakia, and Philippines. Data start in 1998 for Thailand.

125
contributing to China’s rapidly growing export and import share in the ITA market. Indeed, China’s ITA trade accelerated after implementing its WTO commitments to reduce trade impediments, including eliminating its tariffs on ITA products. In 2001, for example, the value of global ITA exports declined 13.0 percent, but the value of Chinese exports of ITA products grew 19.9 percent. By 2003, when China entered the ITA, it was already the third largest exporter and the fourth largest importer of ITA products. In 2004, China expanded its market share, becoming the world’s largest exporter of ITA products. In 2005, China surpassed both the EU and the United States to become the largest country in terms of overall ITA trade.
Increased FDI had a major role in China’s accelerating ITA exports, as multinational corporations sought to reduce costs by directly adding capacity in China (WTO 2008, 18). Once China joined the WTO, products exported from China were guaranteed MFN access to other countries, providing strong incentives for multinational corporations to establish production and assembly operations in China.
The ITA further improved China’s export capabilities by lowering the cost of intermediate ITA goods through tariff elimination. China recognized that tariffs acted as a tax on Chinese firms seeking to enhance participation in global production networks (Borrus and Cohen 1997, 12–14). One example of China’s expansion into global production networks is the Pearl River delta, which has become the largest location in the world for electronics contract manufacturing (Luthje, 1). Consequently, China has become a critical hub in global production networks for ITA goods and has emerged as the fastest-growing supplier to the world of many ITA products, including computers, telecommunications equipments, and associated ITA parts.23
The rise of China and other developing ITA members in Asia represents a major shift in ITA trade, but not the only shift. The increasing export shares of Eastern European countries are also significant and reflect similar characteristics to the rise of Asia.
Eastern Europe
Eastern European countries are rapidly expanding their share of ITA trade. Four countries, all ITA members, stand out: Hungary, Slovakia, the Czech Republic, and Poland. Between 1996 and 2008, total ITA trade grew by 30.0
23 See section “Shifting Trade in Product Segments” in this article.
126
percent for Hungary, 27.5 percent for Slovakia, 22.9 percent for the Czech Republic, and 15.4 percent for Poland.
For each of these four countries, exports expanded faster than imports. For example, Slovakia’s annual export growth was 60.1 percent between 2001 and 2008, whereas import growth was 38.5 percent over the same period. Slovakia, Czech Republic, Hungary, and Poland combined account for barely 4 percent of global ITA trade, yet their export growth rate is nothing short of remarkable.
The rise of Eastern European countries in ITA trade reflects continued restructuring of production networks in the IT industry (OECD 2008, 107). This region is a critical hub in global supply networks of ITA products, with corporations making export-oriented investments, setting up factories to export to western Europe and the world. For example, according to Radosevic 2002 (14), FDI was the primary vehicle for the integration of Eastern European electronics firms into global supply networks, and “EU demand is a strong focal point” in new production networks. ITA countries in Eastern Europe provide advantages of geographic proximity and cultural ties (Fung, et al. 2008, 7), and therefore have benefited from the location decisions of EU and multinational corporations, particularly following tariff liberalization under the ITA.
In addition to tariff liberalization, the EU integration process also helped to drive the expansion of ITA trade in Eastern Europe (WTO 2008, 18). According to the European Commission, large flows of FDI from traditional EU members have increased the technological content of new EU member countries’24 export baskets (EU 2009, 53).
These shifting trade patterns towards Asia, China, and Eastern Europe illustrate the rise of developing countries and geographic diversification in global trade of ITA products.
Comparison of Developed and Developing Members
Since the launch of the ITA, developing countries have gradually gained market share from developed ones. Developed countries still account for 67.1 percent of world ITA exports, they have expanded at a much slower rate,
24 Hungary, Slovakia, the Czech Republic, and Poland each joined the EU as part of the 2004 expansion.

127
gradually ceding market share to developing countries, China in particular (figure 4). Developing-country ITA members generated 3.4 percent of total ITA exports in 1996, but climbed rapidly to generate 32.9 percent of total exports by 2008.
Between 1996 and 2008, developing countries’ exports expanded at an annual growth rate of 33.6 percent, compared to 7.2 percent for developed countries. Although some of the apparent early growth for developing countries merely reflects improved consistency in reporting of export data, from 2001 to 2008, developing-country ITA exports still expanded more than three times as fast as developed-country ITA exports.
Based on year-over-year measurements of export growth, developing country ITA trade expanded faster than that of developed countries between 1996 and 2000, and declined less sharply during 2000–02. Developing-country ITA exports expanded 33.3 percent in 1999 and 43.6 percent in 2000. In contrast, developed-country ITA exports expanded 10.3 percent in 1999 and 22.5 percent in 2000. Following the peak in the technology boom, developing country exports declined at a slower rate—5.4 percent year-over-year,
0
200
400
600
800
1,000
1,200
1,400
1,600
1,800
2,000
1996 1997 1998 1999 2000 2001 2002 2003 2004 2005 2006 2007 2008
ITA Developing Countries ITA High-income Countries
FIGURE 4 Developing and developed (high-income) countries' ITA exports 1996–2008Bi
llion
$
Source: Compiled by USITC staff from UN Comtrade database.Note: Includes only ITA members.

128
compared to a 15.6 percent decline for developed countries.25 Broadening participation and increasing market share of developing countries in the ITA trade represents another major shift in ITA trade patterns.
Role of non-ITA countries
While ITA member countries account for the vast majority of total ITA trade, with a few non-ITA member countries expanded their share of ITA trade as well. In 2008, non-ITA countries accounted for only 6 percent of total ITA trade, yet several non-ITA countries have a significant and growing foothold. Despite their nonmember status, Mexico, Russia, Brazil, and South Africa have demonstrated strong ITA trade since 1996. Mexico’s export role and Russia’s import growth are both particularly noteworthy.
Mexico is the only non-ITA member in the top 30 ITA exporters, ranking eighth in 2008 (table 5). Since it is a WTO member, its exporters benefit from the MFN nature of the Agreement. Additionally, on the import side, Mexico unilaterally instituted “ITA plus,” which eliminates duties on a wide variety of critical inputs, machinery, and finished products in the electronics and IT sectors (Padiema-Peralta, 2008 1). These lower-cost inputs provide a competitive price advantage to Mexican producers and exporters. Moreover, due to the North American Free Trade Agreement, there are established ITA production networks linking Mexico with the United States and Canada; in 2008, 87 percent of Mexico’s ITA exports went to either Canada or the United States.
Russia is rapidly increasing imports of ITA products despite being outside the WTO and the ITA. While the rest of the world benefited from the technology boom of 1996–2000, Russia’s ITA imports declined by 15.7 percent, with the country suffering a severe financial crisis in 1998. Yet, since 2001, Russian imports of ITA products have grown annually by 38.7 percent (table 6), albeit from a relatively small base. Russia is primarily an importer of ITA products; rather than export ITA goods, it is major exporter of information and communication services (OECD 2008, 91). The ITA does not cover services, but Russia’s strong position in the related services industry may explain its
25 It should be noted that these calculations include countries not yet signed onto the ITA in the given years; the MFN nature of the ITA gives all WTO members tariff duty-free access to all markets for ITA member countries.
129
demand for products covered by the ITA. Russia’s main sources of ITA imports are China, Germany, and Hungary.
Product Segment Profiles
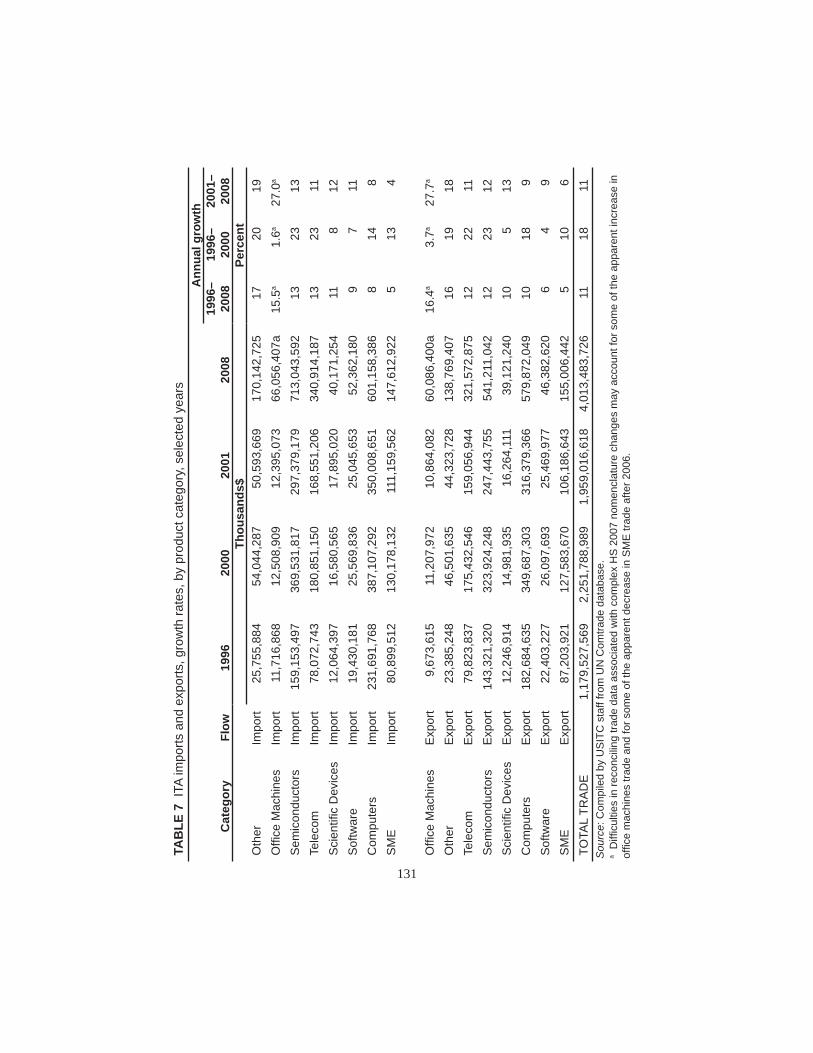
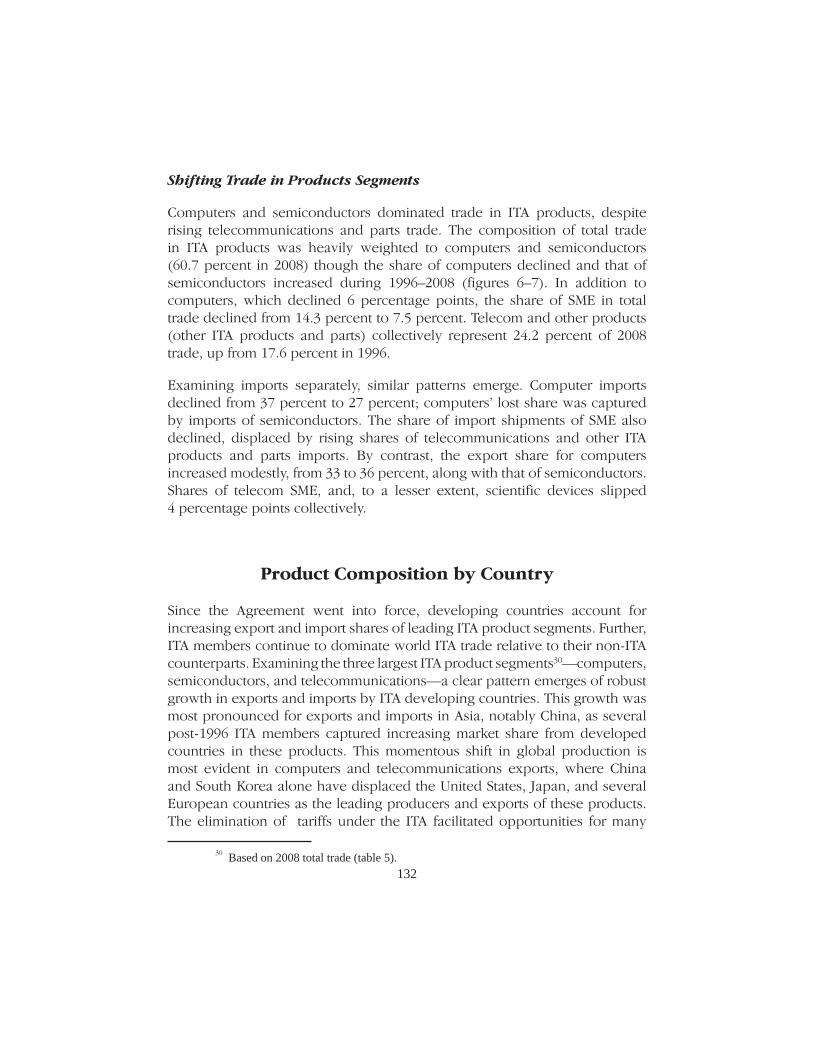
While many ITA products are readily identifiable, others are parts or intermediary products with functions across multiple broad categories. In examining the growth and composition of ITA products, the authors grouped the covered goods into eight general product segments, as noted in table 1, computers and peripherals (“computers”) office equipment, scientific and measuring devices (“scientific devices”), semiconductors, semiconductor manufacturing equipment (“SME”), software, telecommunications equipment, and other ITA products and parts (“other”).26 While annualized growth rates for most product segments exceeded 10 percent, import and export growth rates were strongest for other products (“other ITA products and parts”), office machines,27 semiconductors, and telecommunications during 1996–2008. Rapidly rising trade in other products is consistent with the proliferation of intermediary goods and parts trade fueled by expanding global product networks (Athukorala, 2008, 7). Strong growth rates in semiconductors and telecommunication segments reflects, in part, expanding uses of semiconductors in IT products and advances in cellular communications.
Semiconductors and computer trade dominated the composition of ITA trade during the past 12 years, despite ceding market share to other fast-growing products, including telecommunications and other products. The Internet boom of the 1990s and declining prices for personal computers and semiconductors (Aizcorbe, Flamm, and Khurshid, 2002, 12) spurred increasing demand and trade flows for these products.
Product Segment Growth Rates
Across all ITA product segments, total trade increased by 10.7 percent annually between 1996 and 2008 (figure 5). Annualized growth of ITA trade peeked at 17.5 percent during 1996–2000, then slowed to 10.8 percent between 2001 and 2008; this decline reflected, in part, the sharp decline in IT spending following the Internet boom in the late 1990s. Import growth was led by other products and parts (17.0 percent), with expansion in global imports of
26 Segmented according to 6-digit HS in accordance with USITC product classifi cations.27 Diffi culties in reconciling trade data associated with complex HS 2007 nomenclature
changes may account for some of the increase in offi ce machine trade after 2006.

130
office equipment, semiconductors, and telecommunications ranging between 15.5 percent and 13.1 percent (table 7). Similar product growth patterns emerge in global exports, with office machines and other ITA products and parts exhibiting the strongest annual growth rates (16.4 percent and 16.0 percent, respectively). Increasing trade in parts reflected the increasing fragmentation of the global electronics and IT supply chains. Additionally, significant technology developments surrounding the internet and mobile communications were important drivers behind the rapid trade expansion for telecommunications and office machines.28 29 Further, trade in office machines and other ITA products and parts at the inception of the ITA was relatively low compared with trade in computers and semiconductors, which accounted for the majority of IT trade and attracted considerable attention in the negotiations leading up to the Singapore Ministerial (Fleis and Sauve, 1997, 29–32).
28 Examples of technology developments include the rapid adoption of cellular phones and the increased popularity of multifunction printing machines. Indeed, cell phones, and printing parts and accessories accounted for 35 percent and 88 percent of total imports for their respective product segments in 2008.
29 The unevenness of the fi gures for 2007–08 trade in offi ce equipment stems in part from signifi cant HS classifi cation changes.
0
500
1,000
1,500
2,000
2,500
3,000
3,500
4,000
4,500
1996 1997 1998 1999 2000 2001 2002 2003 2004 2005 2006 2007 2008
Bill
ion
$
Computers Office Machines OtherScientif ic & Measuring Devices Semiconductors SMESoftw are Telecom
Source : Compiled by USITC staff from UN Comtrade database.
FIGURE 5 ITA total trade by product, 1996–2008
131
TAB
LE 7
ITA
impo
rts a
nd e
xpor
ts, g
row
th ra
tes,
by
prod
uct c
ateg
ory,
sel
ecte
d ye
ars
Cat
egor
yFl
ow19
9620
0020
0120
08
Ann
ual g
row
th19
96–
2008
1996
–20
0020
01–
2008
Thou
sand
s$Pe
rcen
tO
ther
Impo
rt25
,755
,884
54,0
44,2
8750
,593
,669
170,
142,
725
1720
19O
ffi ce
Mac
hine
sIm
port
11,7
16,8
6812
,508
,909
12,3
95,0
7366
,056
,407
a15
.5a
1.6a
27.0
a
Sem
icon
duct
ors
Impo
rt15
9,15
3,49
736
9,53
1,81
729
7,37
9,17
971
3,04
3,59
213
2313
Tele
com
Impo
rt78
,072
,743
180,
851,
150
168,
551,
206
340,
914,
187
1323
11S
cien
tifi c
Dev
ices
Impo
rt12
,064
,397
16,5
80,5
6517
,895
,020
40,1
71,2
5411
812
Sof
twar
eIm
port
19,4
30,1
8125
,569
,836
25,0
45,6
5352
,362
,180
97
11C
ompu
ters
Impo
rt23
1,69
1,76
838
7,10
7,29
235
0,00
8,65
160
1,15
8,38
68
148
SM
EIm
port
80,8
99,5
1213
0,17
8,13
211
1,15
9,56
214
7,61
2,92
25
134
Offi
ce M
achi
nes
Exp
ort
9,67
3,61
511
,207
,972
10,8
64,0
8260
,086
,400
a16
.4a
3.7a
27.7
a
Oth
erE
xpor
t23
,385
,248
46,5
01,6
3544
,323
,728
138,
769,
407
1619
18Te
leco
mE
xpor
t79
,823
,837
175,
432,
546
159,
056,
944
321,
572,
875
1222
11S
emic
ondu
ctor
sE
xpor
t14
3,32
1,32
032
3,92
4,24
824
7,44
3,75
554
1,21
1,04
212
2312
Sci
entifi
c D
evic
esE
xpor
t12
,246
,914
14,9
81,9
3516
,264
,111
39,1
21,2
4010
513
Com
pute
rsE
xpor
t18
2,68
4,63
534
9,68
7,30
331
6,37
9,36
657
9,87
2,04
910
189
Sof
twar
eE
xpor
t22
,403
,227
26,0
97,6
9325
,469
,977
46,3
82,6
206
49
SM
E
Exp
ort
87,2
03,9
2112
7,58
3,67
010
6,18
6,64
315
5,00
6,44
25
106
TOTA
L TR
AD
E1,
179,
527,
569
2,25
1,78
8,98
91,
959,
016,
618
4,01
3,48
3,72
611
1811
Sou
rce:
Com
pile
d by
US
ITC
sta
ff fro
m U
N C
omtra
de d
atab
ase.
a D
iffi c
ultie
s in
reco
ncili
ng tr
ade
data
ass
ocia
ted
with
com
plex
HS
200
7 no
men
clat
ure
chan
ges
may
acc
ount
for s
ome
of th
e ap
pare
nt in
crea
se in
of
fi ce
mac
hine
s tra
de a
nd fo
r som
e of
the
appa
rent
dec
reas
e in
SM
E tr
ade
afte
r 200
6.
132
Shifting Trade in Products Segments
Computers and semiconductors dominated trade in ITA products, despite rising telecommunications and parts trade. The composition of total trade in ITA products was heavily weighted to computers and semiconductors (60.7 percent in 2008) though the share of computers declined and that of semiconductors increased during 1996–2008 (figures 6–7). In addition to computers, which declined 6 percentage points, the share of SME in total trade declined from 14.3 percent to 7.5 percent. Telecom and other products (other ITA products and parts) collectively represent 24.2 percent of 2008 trade, up from 17.6 percent in 1996.
Examining imports separately, similar patterns emerge. Computer imports declined from 37 percent to 27 percent; computers’ lost share was captured by imports of semiconductors. The share of import shipments of SME also declined, displaced by rising shares of telecommunications and other ITA products and parts imports. By contrast, the export share for computers increased modestly, from 33 to 36 percent, along with that of semiconductors. Shares of telecom SME, and, to a lesser extent, scientific devices slipped 4 percentage points collectively.
Product Composition by Country
Since the Agreement went into force, developing countries account for increasing export and import shares of leading ITA product segments. Further, ITA members continue to dominate world ITA trade relative to their non-ITA counterparts. Examining the three largest ITA product segments30—computers, semiconductors, and telecommunications—a clear pattern emerges of robust growth in exports and imports by ITA developing countries. This growth was most pronounced for exports and imports in Asia, notably China, as several post-1996 ITA members captured increasing market share from developed countries in these products. This momentous shift in global production is most evident in computers and telecommunications exports, where China and South Korea alone have displaced the United States, Japan, and several European countries as the leading producers and exports of these products. The elimination of tariffs under the ITA facilitated opportunities for many
30 Based on 2008 total trade (table 5).

133
Computers35.1%
SME14.3%
Software3.5%
Semiconductors25.6%
Office machines1.8%Other
4.2%Scientific devices
2%
Telecom13.4%
FIGURE 6 ITA total trade by product segment, 1996
Source : Compiled by USITC staff from UN Comtrade database.
Computers29.4%
SME7.5%
Software2.5%
Semiconductors31.3%
Office machines3.1%
Other7.7%
Scientific devices2%
Telecom16.5%
FIGURE 7 ITA total trade by product segment, 2008
Source: Compiled by USITC staff from UN Comtrade.

134
developing countries to enter global production networks,31 driving shifting trade patterns for these products.
Computers
ITA members continue to dominate global computer trade, representing 98 percent of exports, a level unchanged from 1996. However, as with other ITA goods, the shift to developing ITA members as leading exporters of computers is striking. Led by several Asian countries, particularly China, developing countries’ share of global computer exports surged from 6.5 percent in 1996 to nearly 51 percent in 2008 (figure 8). The rapid expansion of computer exports by developing countries was further characterized by a 30.6 percent annual growth rate, compared with 10.1 percent for developed countries between 1996 and 2008. The composition of the top 10 computer exporters similarly shifted to China and other Asian countries. In 1996, four countries—the United States, Japan, United Kingdom, and the Netherlands accounted for over 50 percent of computer exports. By 2008, China and South Korea alone accounted for nearly half (46.6 percent) of such exports, illustrating an increasing concentration of global computer production and exports (figures 9–10). Other developing ITA members, including Malaysia and Thailand,
31 According to Slaughter 2008, developing countries may enter global production networks by leveraging comparative advantages in importing intermediate goods, adding value through these advantages, and subsequently exporting outputs to other countries.
0
100
200
300
400
500
600
1996 1997 1998 1999 2000 2001 2002 2003 2004 2005 2006 2007 2008
Bill
ion
$
High Income Developing ITA Members Non ITA Members World
Source : Compiled by USITC staff from UN Comtrade database.
FIGURE 8 ITA computer exports, by income and ITA status, 1996–2008

135
0
50
100
150
200
1996 1997 1998 1999 2000 2001 2002 2003 2004 2005 2006 2007 2008
Bill
ion
$
China Korea, South Netherlands United StatesGermany Singapore Chinese Taipei MalaysiaThailand Japan EU-15 External
FIGURE 9 ITA computers: Top 10 exportering countries and the EU, 1996–2008
Source : Compiled by USITC staff from UN Comtrade database.
Malaysia, 4.4%
Thailand, 3.2%Japan, 3.1%
China, 38.3%
Chinese Taipei, 4.7%
South Korea, 6.6%
Netherlands, 5.6%
United States, 5.2%
Germany, 5.2%
Singapore, 5.0%
FIGURE 10 Computers: Top 10 exporters, 2008
Source: Compiled by USITC staff from UN Comtrade database.

136
also experienced a rapid increase in computer exports since joining the ITA, accounting for 4.4 percent and 3.2 percent, respectively, of 2008 exports.
ITA members account for the vast majority of gains in computer imports since 1996 (92 percent of imports in 2008), despite increasing non-ITA member import trade (figure 11). Non-ITA members’ share of computer imports increased 6 percentage points, principally driven by increasing imports from Mexico, Brazil, and Russia. These rising imports reflect two factors: duty-free access to computer products under the MFN principle of the ITA, and general economic expansion since 1996. The share of developing-country imports expanded to 26 percent from 4 percent. Based on annual growth rates, China (29.7 percent), Hong Kong, China (12.8 percent), Mexico (18.4 percent), and Russia (30.7 percent) were principal contributors to developing country import growth since 1996. Among the top 10 importers in 2008, U.S. imports increased to over $100 million, albeit unevenly. China became the second largest importer with the sharpest growth after the 2001–2002 period (figure 12). Overall, shifts in computer imports were less pronounced than those in computer exports. The United States, Japan, Germany, and other original ITA signatories were leading importers of computers in 1996. With the exception of China (12 percent), developed ITA members countries remained the leading importers of computer products in 2008 (figure 13).
0
100
200
300
400
500
600
1996 1997 1998 1999 2000 2001 2002 2003 2004 2005 2006 2007 2008
Bill
ion
$
High Income Developing ITA MembersNon ITA Members World
FIGURE 11 ITA computer imports, by income and ITA status, 1996–2008
Source: Compiled by USITC staff from UN Comtrade database.

137
0
20
40
60
80
100
120
1996 1997 1998 1999 2000 2001 2002 2003 2004 2005 2006 2007 2008
Billi
on $
Grand Total EU-15 External United States ChinaHong Kong, China Germany Netherlands JapanUnited Kingdom Singapore France
FIGURE 12 ITA Computers: Top 10 importing countries and the EU, 1996–2008
Source: Compiled by USITC staff from UN Comtrade database.
Mexico, 3.0%
United States, 18.0%
France, 3.1%
Singapore, 3.4%
United Kingdom, 4.2%
Japan, 4.6%
Netherlands, 5.5%
Germany, 6.3%
Hong Kong, China, 7.0%
China, 11.9%
FIGURE 13 Computers: Top 10 importers, 2008
Source: Compiled by USITC staff from UN Comtrade database.

138
Semiconductors
The preponderance of the global semiconductor trade was conducted by ITA members, who accounted for 94.8 percent and 95.3 percent of exports and imports, respectively, in 2008. These shares have remained fairly constant, indicating that ITA members captured the vast majority of growth in semiconductor trade since 1996 (figure 14). Between 1996 and 2008, Singapore and China emerged as the largest semiconductor exporters, surpassing Japan and the United States (figure 16).32 ITA developing-country members, and to a lesser extent Mexico, led the increase in developing countries’ share of semiconductor exports, which rose from 4.2 percent to 26.5 percent during 1996–2008. However, with the exception of China (13.7 percent of exports), developed ITA members remained leading exporters
32 Annual export growth rates during 1996–2008 were 13.2 percent and 33.9 percent for Singapore and China, respectively, compared with 5.5 percent and 4.1 percent for Japan and the U.S., respectively.
0
100
200
300
400
500
600
1996 1997 1998 1999 2000 2001 2002 2003 2004 2005 2006 2007 2008
Bill
ion
$
High Income Developing ITA Members Non ITA Members World
FIGURE 14 ITA semiconductor exports, by income and ITA status, 1996–2008
Source : Compiled by USITC staff from UN Comtrade database.

139
with Singapore (15.5 percent),33 Japan (12.9 percent), and the United States (9.0 percent) the largest exporters based on 2008 export share (figure 15). The robust expansion of China’s semiconductor exports in part reflects the global fragmentation of back-end production (i.e., packaging and testing) to lower-cost countries, China’s policy shifts and incentives to encourage FDI in semiconductor manufacturing, and semiconductor manufacturers’ desire for proximity to the world’s largest market (Yinug).34
Similar to exports, ITA members accounted for the vast majority of the increase in semiconductor imports since 1996, generating over 95 percent of imports in 2008 (figure 17). The share of developing country imports expanded to 38.2 percent from 9.1 percent during 1996–2008, led principally by China, with an annual import growth rate of nearly 33 percent. Other ITA
33 Singapore has a long history as a leading location for semiconductor device assembly, and more recently, computer peripherals, including hard disk drives (Athulkorala 2008).
34 Yinug 2009 notes that while front-end production (capital-intensive design and fabrica-tion) is emerging in China, foreign semiconductor fi rms’ investments in China remain limited and often entails the use of older-generation production technology.
0
10
20
30
40
50
60
70
80
90
1996 1997 1998 1999 2000 2001 2002 2003 2004 2005 2006 2007 2008
Bill
ion
$
Singapore China JapanUnited States Germany Korea, SouthMexico France Chinese TaipeiThailand EU-15 External
FIGURE 15 ITA semiconductor: Top 10 exporters and EU, 1996–2008
Source : Compiled by USITC staff from UN Comtrade database.

140
France, 2.9%
Mexico, 4.8%
Korea, 6.4%
Germany, 7.9%
United States, 9.0%
Japan, 12.9%
China, 13.7%
Singapore, 15.5%
Chinese Taipei, 2.7%
Thailand, 2.1%
Source : Compiled by USITC staff from UN Comtrade database.
FIGURE 16 Semiconductor: Top 10 exporters, 2008
0
100
200
300
400
500
600
700
800
1996 1997 1998 1999 2000 2001 2002 2003 2004 2005 2006 2007 2008
Bill
ion
$
High Income Developing ITA Members Non ITA Members World
Source : Compiled by USITC staff from UN Comtrade database.
FIGURE 17 ITA semiconductor imports, by income and ITA status, 1996–2008
141
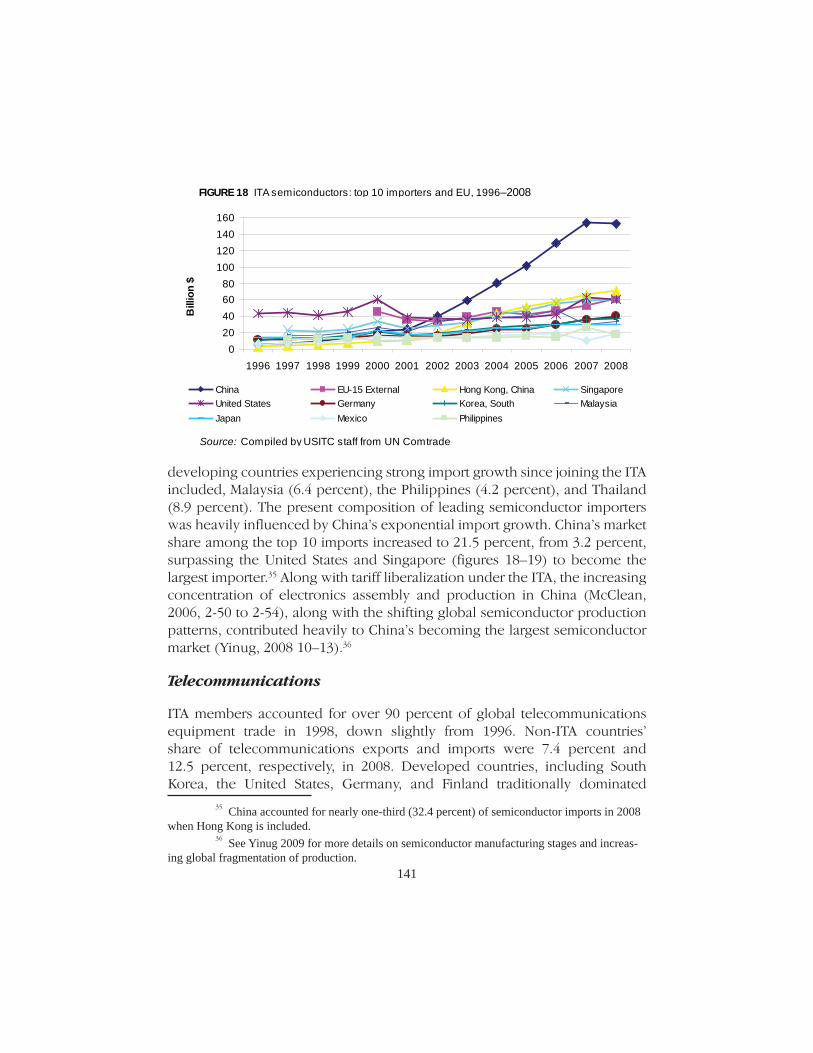
developing countries experiencing strong import growth since joining the ITA included, Malaysia (6.4 percent), the Philippines (4.2 percent), and Thailand (8.9 percent). The present composition of leading semiconductor importers was heavily influenced by China’s exponential import growth. China’s market share among the top 10 imports increased to 21.5 percent, from 3.2 percent, surpassing the United States and Singapore (figures 18–19) to become the largest importer.35 Along with tariff liberalization under the ITA, the increasing concentration of electronics assembly and production in China (McClean, 2006, 2-50 to 2-54), along with the shifting global semiconductor production patterns, contributed heavily to China’s becoming the largest semiconductor market (Yinug, 2008 10–13).36
Telecommunications
ITA members accounted for over 90 percent of global telecommunications equipment trade in 1998, down slightly from 1996. Non-ITA countries’ share of telecommunications exports and imports were 7.4 percent and 12.5 percent, respectively, in 2008. Developed countries, including South Korea, the United States, Germany, and Finland traditionally dominated
35 China accounted for nearly one-third (32.4 percent) of semiconductor imports in 2008 when Hong Kong is included.
36 See Yinug 2009 for more details on semiconductor manufacturing stages and increas-ing global fragmentation of production.
020406080
100120140160
1996 1997 1998 1999 2000 2001 2002 2003 2004 2005 2006 2007 2008
Bill
ion
$
China EU-15 External Hong Kong, China SingaporeUnited States Germany Korea, South MalaysiaJapan Mexico Philippines
FIGURE 18 ITA semiconductors: top 10 importers and EU, 1996–2008
Source: Compiled by USITC staff from UN Comtrade

142
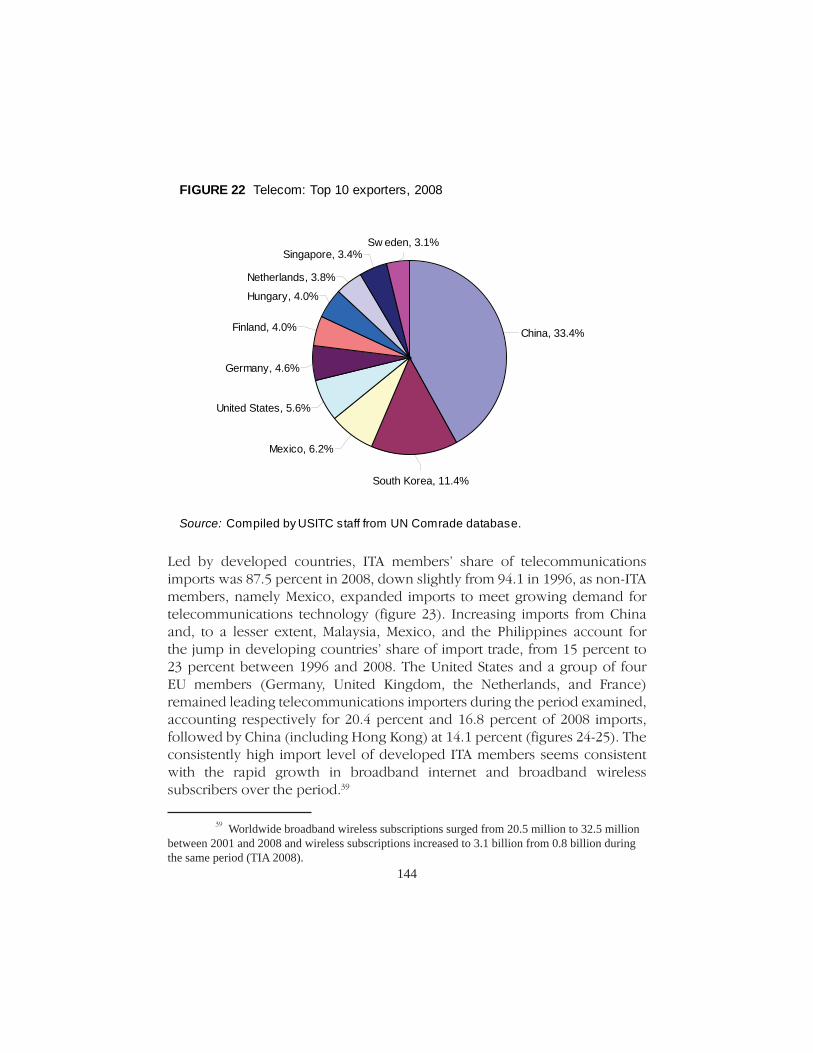
telecommunications trade, but a sizeable shift towards developing-country exporters, namely China, occurred after China joined the WTO and ITA. Developing countries’ export share climbed from 9.5 percent in 1996 to 43.8 percent in 2008 (figure 20). Propelled by robust export growth, China and South Korea moved past the United States as the leading telecommunications exporter (figure 21).37 While leading European exporters collectively accounted for nearly 20 percent of exports, China was the source of one-third (33.4 percent) of world telecommunications exports in 2008, followed by South Korea with 11.4 percent (figure 22), revealing a significant shift in global telecommunications production and export patterns. The elimination of tariffs on several intermediary products, coupled with the strengthening of global electronics production networks in Asia, were catalysts behind China’s exponential export growth.38
37 China and South Korea’s exports grew an annualized 35.0 percent 27.2 percent, respectively during 1996-2008.
38 See Luthje 2004 for an illustration of China’s role in the global production network of cell phones for a major manufacturer.
Japan, 4.2%
Mexico, 2.7%
China, 21.5%Malaysia, 4.8%
Korea, 5.3%
Germany, 5.7%
United States, 8.5%
Hong Kong, China, 10.9%
Singapore, 8.5%
Philippines, 2.6%
Source: Compiled by USITC staff from UN Comtrade.
FIGURE 19 Semiconductor: Top 10 importers, 2008

143
0
50
100
150
200
250
300
350
1996 1997 1998 1999 2000 2001 2002 2003 2004 2005 2006 2007 2008
Bill
ion
$
High Income Developing ITA Members Non ITA Members World
Source: Compiled by USITC staff from UN Comtrade database.
FIGURE 20 ITA Telecom exports, by income and ITA status, 1996–2008
010
20304050
60708090
100110
1996 1997 1998 1999 2000 2001 2002 2003 2004 2005 2006 2007 2008
Bill
ion
$
China Korea, South Mexico United StatesGermany Finland Hungary NetherlandsSingapore Sw eden EU-15 External
Source: Compiled by USITC staff from UN Comtrade database.
FIGURE 21 ITA Telecom: Top 10 exporters and EU, 1996–2008
144
Led by developed countries, ITA members’ share of telecommunications imports was 87.5 percent in 2008, down slightly from 94.1 in 1996, as non-ITA members, namely Mexico, expanded imports to meet growing demand for telecommunications technology (figure 23). Increasing imports from China and, to a lesser extent, Malaysia, Mexico, and the Philippines account for the jump in developing countries’ share of import trade, from 15 percent to 23 percent between 1996 and 2008. The United States and a group of four EU members (Germany, United Kingdom, the Netherlands, and France) remained leading telecommunications importers during the period examined, accounting respectively for 20.4 percent and 16.8 percent of 2008 imports, followed by China (including Hong Kong) at 14.1 percent (figures 24-25). The consistently high import level of developed ITA members seems consistent with the rapid growth in broadband internet and broadband wireless subscribers over the period.39
39 Worldwide broadband wireless subscriptions surged from 20.5 million to 32.5 million between 2001 and 2008 and wireless subscriptions increased to 3.1 billion from 0.8 billion during the same period (TIA 2008).
Netherlands, 3.8%
Singapore, 3.4%Sw eden, 3.1%
South Korea, 11.4%
China, 33.4%
Hungary, 4.0%
Finland, 4.0%
Germany, 4.6%
United States, 5.6%
Mexico, 6.2%
Source: Compiled by USITC staff from UN Comrade database.
FIGURE 22 Telecom: Top 10 exporters, 2008

145
0
50
100
150
200
250
300
350
400
1996 1997 1998 1999 2000 2001 2002 2003 2004 2005 2006 2007 2008
Bill
ion
$
High Income Developing ITA Members Non ITA Members World
Source: Compiled by USITC staff from UN Comtrade database.
FIGURE 23 ITA telecom imports, by income and ITA status, 1996–2008
0
10
20
30
40
50
60
70
80
1996 1997 1998 1999 2000 2001 2002 2003 2004 2005 2006 2007 2008
Bill
ion
$
United States Hong Kong, China GermanyNetherlands United Kingdom ChinaJapan Mexico SingaporeFrance Russia EU-15 External
Source: Compiled by USITC staff from UN Comtrade database.
FIGURE 24 ITA telecom: Top 10 importers and EU, 1996–2008

146
Achieving objectives of the ITA
To what extent have the ITA’s objectives of increasing world IT production and trade, and promoting diffusion of technology, particularly among developing countries been achieved? The social and economic benefits of trade liberalization are well documented, suggesting a positive outcome from the ITA. However, in the case of tariff liberalization framed under the ITA, systematically capturing the effects of increased market access and technology diffusion through tariff elimination remains complex and imperfect (box 2). Most non-empirical work, however, suggests that the ITA has enhanced IT trade and technology diffusion, including among developing countries (Dryer and Hindley, 11–12). Reduced prices for IT products and heightened competition stemming from lower tariffs are commonly linked to the ITA (Suh
Hong Kong, China, 9.8%
Germany, 4.7%
Netherlands, 4.6%
United Kingdom, 4.5%
China, 4.3%
Japan, 4.2%
Mexico, 4.2%
Singapore, 3.0%
United States, 20.4%
France, 3.0%
Source: Compiled by USITC staff from UN Comtrade database.
FIGURE 25 Telecom: Top 10 importers, 2008

147
BOX 2 Empirically estimating the ITA’s impact on global trade
While empirically estimating the overall impact of the ITA remains outside the scope of this paper, several analytical challenges are noted here, which have likely helped to limit empirical research measuring the impact of the ITA on world trade and competition in IT products. A brief review of the challenges and associated literature is provided.
Analytical challenges
The benefi cial effects of the ITA are diffi cult to quantify owing to the complexity of data and several external factors. Because duty elimination on ITA products was staged over multiple years, with differing stages for each country, captur-ing a single point of full implementation is elusive. Changes in product clas-sifi cations since 1996 for several ITA products under the WCO pose transposi-tion challenges as well, particularly changes made in 2007.a Further, data that isolate other duty-free mechanisms outside the ITA encompassing IT products was generally not available. Because the majority of trade data available at the 6-digit HS level is recorded in U.S. dollars, adequately addressing fl uctuations in exchange rates for numerous trading partners poses additional analytical burdens. Finally, the analysis is further complicated by several exogenous factors during the period under examination. Since 1996, the Asian fi nancial crisis, the Internet bubble, the September 11, 2001 terrorist attacks, and the recent global economic slowdown signifi cantly affected values of world trade, and by extension, ITA products.
Limited empirical analysis
A review of prior work empirically assessing the impact of the ITA is limited. Two initial assessments at the outset of the ITA focused on the benefi ts to con-sumers and downward pressure on prices expected from tariff liberalization on ITA products. These estimates ranged between $50 billion and $100 billion in savings from duty free access to ITA goods (UNCTAD 1999, 4). In perhaps the most rigorous assessment of the ITA, Bora and Liu (2006) fi nd signifi cant trade creation under the ITA for developing countries. Comparing trade levels among WTO members participating and not participating in the ITA, they conclude that the value of bilateral trade has increased through ITA participation, and that developing countries account for most of the progress in ITA trade liberaliza-tion. They fi nd that a non-ITA WTO member would increase imports from other WTO members by 14 percent under if it joined the ITA. (Bora and Liu 2006, 1, 14).b, c On the other hand, an assessment covering ITA trade during 1997–2002 concluded that “joining the ITA had no statistically signifi cant impact on the rise in IT imports” (Ares). This analysis examined the economics behind a country’s decision to the join the ITA and postulated that recent growth of IT trade was not closely correlated to ITA tariff reductions. (Continued on page 148.)

148
(Continued from page 147.) Another study examined the extent to which lower prices stemming from ITA tariff liberalization was a catalyst for increasing demand and diffusion of ITA products in developing countries (Joseph and Parayil, 7–8). In comparing ITA trade among developed versus developing countries during 1999–2003, the authors found that the ITA had “only a negli-gible or negative impact in promoting world demand for ICT goods,” based on declining world exports during 2001–03. They further noted that examining IT diffusion in developing countries showed that certain non-ITA countries have achieved greater success than many ITA member countries.d
The paucity of conclusive research on the impact of the ITA on global trade attests to the diffi culties in empirically measuring the effects of the ITA and signals that further work remains.
a According the WTO, the transposition of HS 1996 to HS 2002 for listed ITA product codes had limited impact, as only 14 subheadings were affected, most of which were simple mergers or splits. However, the HS 2007 amendments signifi cantly altered the structure of the HS codes for a signifi cant number of ITA products: 158 of the 241 (over 50 percent) of the HS 2002 subheadings were amended. Owing to the breadth and complexity of the HS 2007 amendments, ITA members continue to review and address these changes.
b Bora and Liu (2006) conclude that a country’s ITA imports would be 7 percent higher if it were an ITA member and the exporter is a non-ITA member of the WTO than if neither trade partner were a WTO member (base line). Conversely, if the importer is not an ITA member, its ITA imports would be 6 percent less compared to the baseline. c Mann and Liu (2007) conclude, based on a review of the empirical literature that ITA participation results in increased bilateral trade. d Joseph and Parayil (2006) used a Network Readiness Index, household IT spending, and measures of telephone usage, among others, to assess ICT diffusion.
Source: Compiled by USITC staff from UN Comtrade database.

149
and Poon 2006, 388).40 Further, the ITA is often is credited as a catalyst for rapid growth in technological advancements and technology diffusion beyond that which would have otherwise occurred (AEA 2008, 2; Slaughter 2003, 26). While considerable discussion and analysis are still needed to determine the magnitude of the ITA’s impact on IT trade and technology diffusion, changes in trade patterns and ITA membership over the past 12 years demonstrate elimination of tariffs on ITA products contributed importantly to these developments in global IT trade.
Conclusions
During the 12 years after the Declaration stated the ITA’s objectives of increased trade and technology diffusion through tariff elimination for many IT goods, remarkable growth in ITA trade occurred. Aggressive tariff liberalization facilitated growth in ITA trade from $1.2 trillion to $4.0 trillion. Notably, the growth in ITA trade was nearly 11 percent annually, despite the bursting of the Internet bubble and the advent of the current global economic downturn. Primarily a domain of developed countries at its inception, the ITA greatly expanded the number of developing countries and, in turn, enhanced IT trade for those countries. WTO member participation in the Agreement more than doubled between 1996 and 2008, with developing countries representing over one-third of the 72 members by 2008. The diversification of ITA membership, previously dominated by developed countries with high trade levels in technology products, reflects significant assimilation of developing countries into the largest WTO sectoral trade agreement and continued liberalization of tariffs in the global IT sector. Further, the increasing diversification of the economic income and trade levels of new ITA entrants after 1996, both for developing and developed countries, suggests an expanding role for ITA products in global IT trade and production.
Commensurate with their expanding membership, developing-country members’ ITA trade has increased substantially, in terms of both volume and share. Developing countries now represent more than one-third of ITA trade,
40 The results of a 2003 survey of Korean computer fi rms showed that fi rms attributed a large portion of the WTO’s impact directly to the tariff reductions that occurred under the ITA. Firms surveyed viewed the WTO as a major factor contributing to improved Korean export performance from 1995 to 2002, compared to 1990–1994 (Suh and Poon 2006).
150
with growth rates frequently outpacing those of their developed-country counterparts. The robust expansion of ITA trade by developing countries is most evident in Asia, with China consistently a dominant force. Already a strong trader in ITA products, China’s ascension to its current position as a leading exporter and importer accelerated in conjunction with implementation of its WTO and ITA obligations. Although China’s role is the most prominent, other developing countries, including other Asian countries, also realized expanded trade opportunities following ITA membership. Further, growth in developing countries’ ITA trade exceeded that of the largest non-ITA countries, demonstrating a positive proposition from ITA membership. Highl ight ing the changes in the composition of ITA products’ trade, was the expanded share of trade in computers and telecommunications products as a percentage of total ITA trade. However, strong growth in imports and exports for all ITA products occurred, with the most significant growth in telecommunications products, office equipment, and semiconductors, paralleling the increasing fragmentation of global production networks for all IT products. The shift in global production and trade patterns is most striking in computers and telecommunications products, where China and South Korea alone have displaced the United States, Japan, and several European countries as the leading producers and exporters.
In conclusion, remarkable growth in global trade of ITA products and appreciably expanding participation in these trade flows by developing countries, with a significant shift to Asia, has occurred in the wake of tariff liberalization under the ITA.

151
References
American Electronics Association (AeA). 2008. The Information Technology Agree-ment: Diffusing technology globally and expanding U.S. tech exports. AeA Com-petitiveness Series 24 June. http://www.aenet.org/Publications/AeA_CS_ITA.asp
Ares, Jeff. 2006. An empirical look at the Information Technology Agreement and its effects on trade. University of Vermont. May 3.
Athukorala, Prema-chandra. 2008. China’s integration into global production net-works and its implications for export-led growth strategy in other countries in the region. Working Paper 2008/4 Australian National University.
Aizcorbe, Ana M., Flamm, Kenneth and Khurshid, Anjum. 2002. The role of semiconductor inputs in hardware price decline: computers vs. communications. FEDS Working Paper 2002-37. August.
Bora, Bijit, and Liu, Xueping. 2006. “Evaluating the impact of the WTO Informa-tion Technology Agreement.” WTO Working Paper.
Borrus, Michael, and Cohen, Stephen S. 1997. Building China’s information technol-ogy industry: Tariff policy and China’s accession to the WTO. Working Paper 105, Trilateral Forum on China-Japan-U.S. Cooperation.
Capannelli, Giovanni. 2009. Asian regionalism: How does it compare with Europe? April 12. http://www.voxeu.org (accessed September 22, 2009).
Dreyer, Ian and Hindley, Brian. 2008. Trade in Information Technology Goods: Adapting the ITA to 21st Century Technological Change. Working Paper 06/2008, European Centre for International Political Economy. June.
Finger, K.M. 2007. An overview of tariff liberalization and world trade for ITA Products 1996–2005. Presentation at WTO ITA Symposium, March, 28–29.
Fliess, Barbara A, and Pierre Sauve. 1997. Of chips, fl oppy disks, and great timing: Assessing the Information Technology Agreement. Paper prepared for the Institut Francais des Relations Internationaels and Tokyo Club Foundation for Global Studies.
Friar, Sarah, James Covello, and Derek R. Bingham. 2008. Independent Insight: IT Spending Survey. US Technology Strategy 43, Goldman Sachs Group. November 2.

152
Fung, K.C., Korhonen, Iikka, Li, Ke, and Ng, Francis. 2008. China and central and eastern European countries: Regional networks, global supply chain or interna-tional competitors? BOFIT Discussion Paper 9/2008. Bank of Finland.
International Monetary Fund (IMF). 2009. World Economic Outlook Database. April. (accessed August 18, 2009).
Joseph, K.J, and Parayil, Govindan. 2006. Trade liberalization and digital divide: An analysis of the Information Technology Agreement of WTO. Centre for Devel-opment Studies.
Lüthje, Boy. 2004. Global production networks and industrial upgrading in China: The case of electronics contract manufacturing. Working Paper 74, Economic Series, East-West Center. October.
Mann, Catherine. 2006. Accelerating the Globalization of America: The Role for Information Technology. Washington, DC: Institute for International Economics. June.
Mann, Catherine, and Liu, Xuepeng. 2007. The Information Technology Agree-ment: Sui Generis or model stepping stone? Presented at the Conference on Multilateralising Regionalism, Geneva, September 10–12.
McClean, William J., Brian P. Matas, Richard D. Skinner, and Trevor Yancey. 2006. The Mclean Report, 2006 Edition: a Complete Analysis and Forecast of the Integrated Circuit Industry. Scottsdale, AZ: IC Insights Inc.
Offi ce of the United States Trade Representative. 2009 (USTR). Information Technology. May 26. http://www.ustr.gov/trade-topics/industry-manufacturing/industry-initiatives/information-technology.
Onodera, Osamu. 2008. Trade and innovation: A synthesis paper.” Trade Policy Working Paper72, OECD.
Organisation for Economic Co-operation and Development (OECD). 2009. OECD Information Technology Outlook 2008. January.
Padiema-Peralta, Julia. 2008. Mexico’s “ITA Plus” duty elimination program. Mexico Reports. United States- Mexico Chamber of Commerce. http://www.usmcoc.org/mexico-reports-1.php (accessed November 5, 2009).

153
Radosevic, Slavo. 2002. The Electronics Industry In Central And Eastern Europe: A New Global Production Location. Working Paper 21, Center for the Study of Economic and Social Change in Europe, School of Slavonic and East European Studies, University College London.
Slaughter, Matthew. 2002. Technology, trade and investment: the public opinion disconnect. Washington, DC. Emergency Committee for American Trade.
Slaughter, Matthew. 2003. Tariff Elimination for Industrial Goods: Why the Gains Will Far Outweigh Any Losses. Background paper, National Foreign Trade Coun-cil.
Suh, Jeongwook, and Poon, Jessie. 2006. The Impact of the WTO on South Ko-rea’s Computer Industry. The International Trade Journal. 20 no. 4, (Winter): 383–405.
UNCTAD. 1999. Trade in Information Technology Products and the WTO Agree-ments: Current situation and views of exports in developing countries. Geneva: International Trade Center.
Telecommunications Industry Association. 2008. TIA 2008 Telecommunications Market Review and Forecast. TIA.
Wasescha, Luzius and Schlagenhof, Markus. 1998. Information Technology Agree-ment (ITA): Towards a new area of sectorial market liberalization in WTO. 53, no. 1: 113–127.
World Bank. 2009. World Bank, Data and Statistics, Country Groups. http://web.worldbank.org/WBSITE/EXTERNAL/DATASTATISTICS/0,,contentMDK:20421402~pagePK:64133150~piPK:64133175~theSitePK:239419,00.html#Low_income (accessed August 10, 2009).
World Trade Organization (WTO). 2009. Current Situation of Schedules of WTO Members G/MA/63/Rev.6. March 17. (Original Document 18 June 1999).
———. 2004. Follow-Up Discussions From the IT Symposium: Indicative List of Issues. Committee of Participants on the Expansion of Trade in Information Technology Products, G/IT/W/14. December.
———. 2006. List Of The Changes Due To The Introduction Of HS2002 Nomen-clature In Relation To The ITA Products: Note by the Secretariat G/IT/W/22. October 20.

154
———. 1996. Ministerial Declaration On Trade In Information Technology Prod-ucts. WT/MIN/(96)/16. December 13.
———. 2008. Status of Implementation: Note by Secretariat G/IT/1/Rev.41. October 23.
———. 2007. World Trade Report 2007. November: 13–24.
Yinug, Falan 2009. Challenges to foreign direct investment in hi-tech semiconductor production in China. Journal of International Commerce and Economics. 2: 97–126.

155
Appendix A
FIGURE APPENDIX A.1 ITA total trade by attachment, 1996-2008
0
500
1,000
1,500
2,000
2,500
3,000
3,500
4,000
4,500
1996 1997 1998 1999 2000 2001 2002 2003 2004 2005 2006 2007 2008
billi
on $
A1 A1B A2 A2B B
Source: Compiled by USITC staff from UN Comtrade database.

156