the influence of warm hydrotherapy on the … · the h-reflex- to quantify the h-reflex, electrical...
TRANSCRIPT

1
THE INFLUENCE OF WARM HYDROTHERAPY ON THECARDIOVASCULAR SYSTEM AND MUSCLE RELAXATION
By: Jerrold Petrofsky, Ph. D., J.D.Jaime Baxter, BS
Jaime Bomgaars, BSCarrie Burgert, BSSara Jacobs, BSDanielle Lyden, BSEverett B. Lohman III, DPTSc, OSC
Send reprint requests to:
Dr. Jerrold Scott PetrofskyProfessor and Director of ResearchDepartment of Physical TherapyLoma Linda UniversityLoma Linda, CA 92350Telephone: (909) 558-7274Fax: (909) 558-0481Email: [email protected]

2
Abstract
Five female and five male subjects with no known cardiovascular abnormalities
nor any neuromuscular disorders were examined during exercise on a cycle ergometer or
a 30 min immersion in warm water with and without exercise to determine the effects of
immersion on cardiac output, heart rate, blood pressure, forearm blood flow, muscle
blood flow, skin blood flow and muscle relaxation. Muscle relaxation was measured by
the resistance to passively moving the leg through a 60° arc and by measurement of the
Hoffman (H) reflex. The results of these experiments showed that 1) passive heating
caused the greatest relaxation in muscle 2) most of the increase in blood flow to the limb
during passive heating or exercise was to skeletal muscle 3) cardiac output increased
modestly as did heart rate during passive exposure or light exercise in a therapeutic pool
and 4) blood pressure was generally decreased during warm water immersion.
Key words: hydrotherapy, muscle, H-reflex, cardiac output, circulation, exercise
3
Introduction
Hydrotherapy has been used for thousands of years. Proto-Indian culture made
use of hydrotherapy as far back as 2400 B.C. (Campion 1998). It was used by Hindus to
combat fever as early as 1500 B.C., and has been used by Japanese, Greeks, Romans, and
many other cultures (Campion 1998). As early as 1697, Sir John Floyer wrote a treatise
on the use of hydrotherapy involving hot and cold water (Kamenetz 1963). While other
uses of hydrotherapy involved medicinal remedies, in World War I and II hydrotherapy
was used for maintenance of fitness (Krizek 1963). In recent years, hydrotherapy has
become an integral part of physical therapy. Hydrotherapy has been attributed to
promoting muscle relaxation (Moor et al. 1964) and increasing tissue temperature and
tissue blood flow (Campion 1998; Cameron 1999). Three types of hydrotherapy can be
used: neutrotherapy, thermotherapy, and cryotherapy, the difference being the varying
temperature of the water (Campion 1999). Thermo-hydrotherapy is defined as the
application of water to an immersed body at a temperature above skin temperature
(Belanger 2002). Immersion in a water bath has been shown to be far more effective in
increasing tissue temperature than hot packs, diathermy, or even ultrasound (Petrofsky
and Laymon 2001; Clarke et al. 1958). Water is a very efficient way to warm tissue
because of its high specific heat and thermal conductivity (Ruoti et al. 1997; Cameron
1999). It also provides a good medium for therapeutic exercise due to the buoyancy
provided to the body reducing weight on joints (Petrofsky et al. 2001). Resistance to
exercise is high due to the high viscosity of water (Cameron 1999).

4
It is certain that limb and muscle temperature increase with warm water
immersion, however, the extent of increase in blood flow to the skin and muscle, and
direct evidence of muscle relaxation have been poorly established with hydrotherapy.
Even less evidence is found combining hydrotherapy with exercise.
Surely, whole limb blood flow increases with either exercise or exposure to a
warm therapeutic pool (Greenberg 1972). This can be assessed with a Doppler flow
meter or various types of volume plethysmography. For example, Clarke et al. (1958)
showed an increase in limb blood flow by volume plethysmography that amounted to an
approximate doubling in limb blood flow for every 2°C increase in limb temperature.
However, it is not known if the flow increase is due to a dilation of skin vessels or an
increase in muscle blood flow or both. It would be important to know if actual muscle
blood flow increases in warm water since it is believed that warm water immersion is
beneficial to muscle healing (Shankar and Randall 2002). Muscle blood flow is under
autoregulation as well as neurogenic control. (Astrand and Rodahl 1970) Absent
exercise, flow increase may be small to muscle and much of the increase in flow during
warm immersion may be to the skin for thermoregulation. Equally, we would like to
know whether or not warm water is sufficient in relaxing muscle.
In recent years, a technique of measuring alpha motor neuron excitability has
been developed called the Hoffman, or the H-reflex. The H-reflex involves stimulating
the motor nerve to a given muscle and assessing, through an electromyogram (EMG)
above the active muscle, the response to a brief stimuli.(Oksa et al 2000) The muscle
twitch that results from stimulation of the motor nerve has 2 components. The first is an
M wave from the direct stimulation of the muscle. The second wave, H wave, results

5
from activation of sensory afferents that reflexively cause a muscle twitch through
activation of the alpha motor neuron pool.( Bell and Lehmann 1987) The H wave and
H/M ratio vary with alpha motor neuron pool excitability (Oksa et al. 2000). The H-
reflex then, is a commonly accepted measure of motor neuron excitability (Bell and
Lehmann 1987). While H-reflex studies have been used to study motor unit excitability
in patients with cerebral palsy (Leonard et al. 1990), during gait (Burke et al. 1999), and
after motor neuron damage (Leonard et al. 1998), few studies have looked at the effect of
heating on both muscle relaxation and H-reflex activity. Interestingly, many studies on
man and animals have looked at the effects of cooling on H-reflex activity. For example,
Bell and Lehmann (1987) found that there were no changes in the H-reflex with cooling
in humans. Chapman, et al. (1979) found that secondary spindle afferents did increase
their response when cooled. In contrast, most studies show a reduced spindle activity
with cooling, an increased H-reflex with cooling (Oksa et al. 2000; Sato 1983) and
reduced reflex responses with heating (Pagliaro and Zamparo 1999). This leads to the
belief that alpha motor neuron excitability and the H-reflex should be reduced with
heating.
Therefore, in the present investigation, we attempted to conduct a more
comprehensive study to provide a basis of evidence for the use of warm hydrotherapy
with and without exercise influence on cardiac output, heart rate, blood pressure limb
blood flow, skin blood flow, and muscle relaxation.

6
Methods
Subjects- Ten subjects participated in these experiments. The subjects were all physical
therapy or medical students and ranged from 20 to 30 years old. Their weights were in
the range of 50 to 100 kg and there was no restriction on height. The general
characteristics of the subjects are shown in Table 1. One half of the subjects were male
and half were female. All subjects were free from any neuromuscular disorders or any
type of cardiovascular disease. All subjects read and signed a statement of informed
consent as approved by the committee on human experimentation.
Table 1- General Characteristics of Subjects- all data shown +/- the SD
Age (years) Height(cm) Weight (kg) numberMales 24+/-2.4 173+/-6.4 84.2+/-16.1 5
Females 25+/-2.1 164.5+/-3.8 66.5+/-14.3 5
Group 24.3+/-2.3 169 +/- 6.2 75.1+/- 18.9 10
Measurement of Muscle Temperature- Muscle temperature was measured by a
thermocouple probe inserted 1-2 cm below the surface of the skin, into the belly of the
medial gastrocnemius muscle, so that the end of the probe was placed half way between
the skin and center of the limb. A 22-gauge needle was first inserted into the muscle. A
thermocouple was then placed down the shaft and the 22-gauge needle was withdrawn
leaving the thermocouple buried in the muscle. Collodion was then applied around the
thermocouple to assure a waterproof junction at the insertion point through the skin. The

7
thermocouple output was then displayed on a digital thermometer, where the temperature
was read to ± 0.1°C.
EMG– Electromyogram (EMG) was recorded through two bipolar vinyl foam adhesive
EMG electrodes (silver-silver chloride) with an active surface area of 0.5 cm2. One
electrode was placed over the belly of the active muscle. The second electrode was
placed 2 cm distal to the active electrode. The EMG was amplified using a four-channel
EMG amplifier with frequency response, which was flat from DC to 1000 Hz. The
common mode rejection ratios of the amplifiers were greater than 120 Db. The EMG
was digitized at 2000 samples per second and displayed and saved on an IBM computer
for later analysis. To waterproof the electrodes, a layer of collodion was applied around
and on top of the electrodes so that the electrodes would stick to the skin under water and
the water would not seep under the electrodes and add to the impedance. We have used
this technique previously and over a period as long as four hours. Throughout the testing
period, there was no variation in EMG amplitude or electrode impedance (Petrofsky and
Lind 1980). Others, who have not used a waterproofing agent, have shown a significant
difference in EMG amplitude in water and on land for a given strength of muscle
contraction (Poyhonen et al. 1999).
The H-Reflex- To quantify the H-reflex, electrical stimulation was applied by two
electrodes above the motor nerve to the gastrocnemius muscle, and one ground electrode
was applied to the Achilles tendon (Figure 1). Two bipolar electrodes were placed on the
surface of the skin over the motor nerve approximately 6 inches from its insertion into the
muscle over the popliteal fossa. An electrical stimulus (single impulse) was applied to
elicit a muscle twitch. The stimulus amplitude peaked at 38 volts (V) and the pulse width

8
was 500 microseconds. The amplitude of the stimulus was increased in 2 V increments
from 2 V to 38 V and the EMG above the muscle was recorded. The amplitude of the H
wave, M wave and the time delay between the M and H wave were measured (Figure 2).
Figure 1- Electrode position for measuring the H reflex

9
Figure 2- Computer display of H reflex recording
Muscle Stiffness- Muscle stiffness was measured by placing the subject in the seated
position with the right leg at 90° at the hip and knee while passively extending the lower
leg through a 60° arc. A belt around the ankle attached to a Sutter CPM 2000 produced a
constant movement of 5° per second. The force of resistance from the subject’s muscle
was measured with a Westin 1971 panel meter.

10
Blood Flow- Skin blood flow was measured by a laser Doppler flow meter produced by
Moor Instruments, Inc. The laser Doppler flow meter is a freestanding device that
produces a beam of red laser light that scans a portion of the body. The device sits on a
stand approximately 2 ft away from the patient. While the patient was prone, the device
rapidly scanned the body and to produce a picture of the blood flow to the skin. This
device is completely non-invasive and has no physical contact with the body.
Arm blood flow- Limb blood flow was calculated by Whitney volume plethysmography.
This technique used a bracelet that contains a strain gage to measure limb volume. A
venous occlusion cuff (40 mmHg) was inflated for 5 sec and deflated for 7 sec on the
upper arm. An arterial occlusion cuff was fastened around the wrists and inflated to 200
mmHg. Changes in limb volume during the first 2 sec after inflation are proportional to
limb blood flow and were recorded to assess the circulation through the entire arm. This
technique has been described previously (Petrofsky et al. 1976).
Pulsatel Skin Blood Flow- Continuous measurements of pulse pressure in the skin and
muscle were measured optically with a Hertzman photoelectric plethysmograph. The
plethysmograph consists of either a small plastic ring that containing a light source and
photocell for skin measurements or is in a 22-gauge needle for muscle measurements.
The light source focused low intensity white light into the skin and the photocell recorded
the beam that is instantly reflected back from the tissue. By amplifying this signal
electronically from the photocell, a Pulsatel output is recorded which is proportional to
the pulse flow in the skin under the light. This technique has been described previously
(Petrofsky 1979).

11
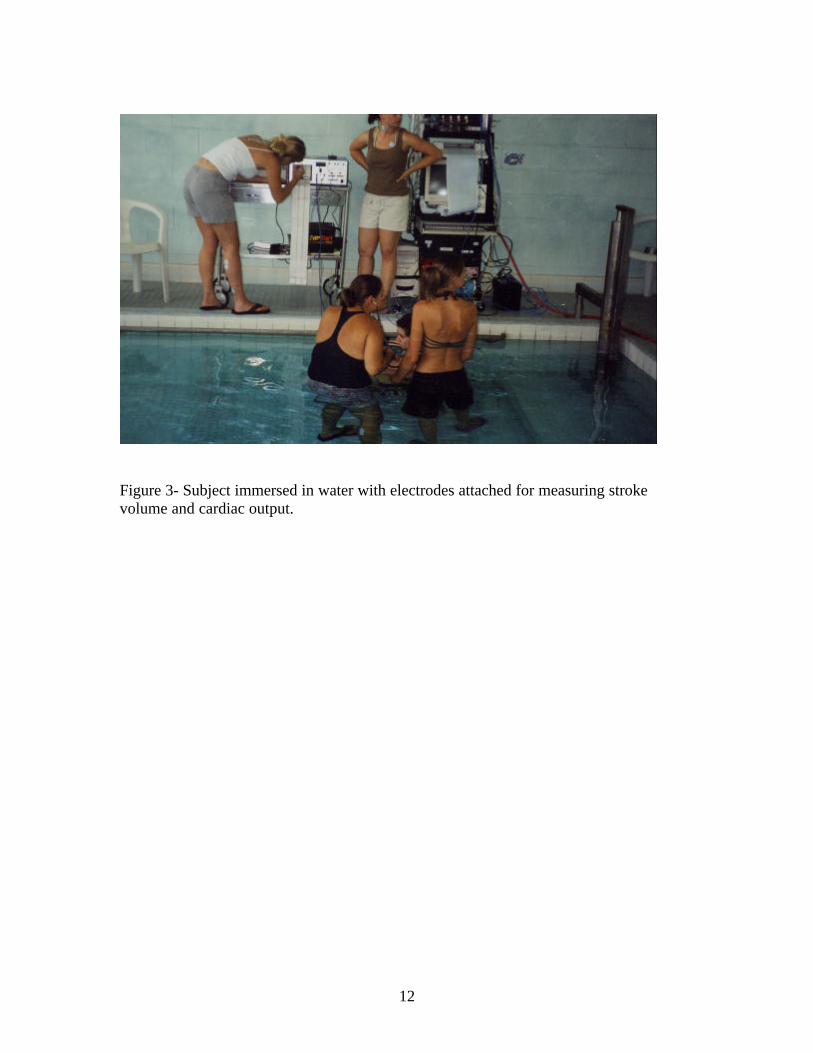
Cardiac Output- Cardiac output was measured by impedance plethysmography. This
technique involves placing 4 electrodes on the body, one each on the neck, on the top of
the chest, on the abdomen and on the thigh. These electrodes pass a minute electrical
current through the outside electrodes and from the inside electrodes electrical impedance
was measured and cardiac output was calculated and displayed. The current was less
than 1 milliamp at a frequency of 50,000 Hz (Figure 3).
Blood Pressure- Blood pressure was measured by auscultation of the inactive limb with
a sphygmomanometer. The systolic blood pressure was determined as the first sound as
the pressure was reduced in the cuff and the diastolic was identified as the change from a
sharp to a muffled sound. The cuff was deflated at 3 mmHg/sec as per the American
Heart Association Standard.
Heart Rate- Heart rate was measured with the impedance plethysmograph as described
above. Heart rate was assessed from measuring the number of heart beats over a 10 sec
period and multiplying by 6.
Cycle ergometer- Subjects cycled on land on a stationary cycle ergometer at 0 Kp and a
speed of 50 rpm for 15 min.
12
Figure 3- Subject immersed in water with electrodes attached for measuring strokevolume and cardiac output.

13
Figure 4- Subject during immersion

14
Procedures
Four series of experiments were conducted. In the first series, the relationship
between skin and muscle blood flow and bath temperature was assessed. Because probes
were inserted into the muscles, no movement was allowed to protect the subjects from
damage to soft tissue due to potential probe movement. The other three series included
the effects of passive immersion, exercise during pool immersion and exercise alone on
motor neuron excitability and the cardiovascular system.
Series 1- During the first series of experiments, the relationship between muscle
temperature, muscle blood flow, and skin blood flow was assessed in 5 subjects during
immersion in a water bath at 36°C °C. At the onset of immersion at 5, 10, 15, 20, 25 and
30 min after immersion, muscle temperatures and skin blood flow (Herztman
plethysmography) and total limb blood flow (Whitney Plethysmography) were measured.
The Hertzman flows in muscles were assessed by inserting the needle tip approximately
½ the distance between the skin and the bone.
Series 2- The purpose of the 2nd series of experiments was to assess the effects of light
exercise alone (an intensity equivalent to the exercise in the pool) on skin blood flow,
muscle relaxation as assessed though H-reflexes, muscle stiffness, and circulation to the
skin. Subjects rested quietly in a thermally neutral room, during which time the blood
flow over the gastrocnemius muscles was measured by the laser Doppler flow meter.
Next, H-reflex was measured with the subject in the prone position, as described under
methods, to measure motor neuron excitability. Finally, with the subject in the seated
position the leg was passively moved through a 60° range of motion and the force

15
generated at the 45° point was measured. EMG was also measured above the quadriceps
muscle and hamstrings during extension of the leg to assess any muscle activity that may
have been present with the subject at rest or during extension. Subject’s then exercised
on a bicycle ergometer for 15 min at 0 Kp, at approximately 50-60 rpm. After the 15 min
exercise period pre-experimental measurements were repeated.
Series 3- In this series of experiments the effect of 30 minutes of only passive immersion
of the body in a 36 deg C pool on muscle stiffness, skin blood flow and the
cardiovascular system was examined. During a rest period prior to the experiments,
subjects rested in a thermally neutral room (22-23°C) and blood pressure, heart rate,
cardiac output, H-reflex activity, and muscle stiffness were measured. EMG was
measured during passive movement of the limb to assess muscle tone. Blood flow to the
skin was measured over the heads of the gastrocnemius muscle with a laser Doppler flow
meter. The subjects were then placed in a 36°C pool for 30 min. During the time in the
pool, cardiac output, heart rate and blood pressure were recorded every 5 min. At 30
min, the pre-experimental measurements were repeated. (Figure 4)
Series 4- The same parameters as series 3 experiments were examined except that light
exercise was accomplished in the hydrotherapy pool. During the 30 min in the pool,
cardiac output, blood pressure, and heart rate were recorded at 5 and 10 min. During the
10-25 min interval, subjects engaged in kicking exercises. Cardiac output, blood
pressure, and heart rate were recorded post exercise. After the 30 min period the pre-
experimental measurements were repeated.

16
Results
Tables 2, 3, 4, and 5 and figures 5 and 6 show the results of the 4 series of
experiment.
Series 1
Figure 5 and 6 depict the results of the first series of experiments. Figure 5 shows
that the resting muscle temperatures for the subjects averaged approximately 30.8
±1.3°C. During the immersion period, temperature rapidly increased from the initial
muscle temperatures toward that of the bath. For example, after 4 min of immersion deep
muscle temperature increased from 30°C to 33°C. By the 12th minute of immersion the
deep muscle temperature was equal to the pool temperature.
28
29
30
31
32
33
34
35
36
37
0 4 8 12 16 20 25 30
Immertion time (min)
Mu
scle
tem
p. (
deg
C)
Figure 5- Deep muscle temperature after immersion in water at 34°C and 37°C

17
Blood flow after immertion
0
50
100
150
200
250
300
350
0 5 10 15 20 25 30
Immertion time (min)
Blo
od
flo
w (
% r
est)
skin
muscle
total
Figure 6- Muscle and skin blood flow after immersion in a bath at 36°C
On a separate day in another experiment, blood flow was measured in skin and
muscle throughout immersion in a 36°C water bath. Total flows were measured by
Whitney strain gauge plethysmography. As such, flows were in cc/100 g tissue/min. In
contrast, flows measured by the Hertzman flow meters were relative flows. These flows
increase or decrease proportionally to changes in circulation in the skin and could not be
calibrated in absolute cc/100 g tissue. Therefore, for simplicity of presentation in the

18
graph, the resting flows prior to immersion were used to normalize flows during
exposure. For example, a blood flow of 200% at rest after immersion would indicate a
tripling of blood flow over the normal resting flows. As shown in figure 6, total flow
increased by approximately 200% from rest to the end of the exposure to heat. Flows
increased rapidly initially, such that after 15 min flows were 110% of the initial flows,
and then increased more slowly over the next 15 min to 200% in excess of the original
flows. Muscle blood flow increased to just over 300% over the original resting flow.
This increase rapidly progressed for the first 20 min then remained steady for the last 10
min. Skin blood flow increased rapidly for the first 20 min to 111% over the original
resting flow and then increased just slightly for the next 10 min to a final figure of 128 %
over the original resting flow.
Series 2, 3, and 4
Muscle stiffness and EMG
Table 2 summarizes the average results of muscle stiffness and EMG activity
above the quadriceps muscle for the 5 subjects. Table 2 illustrates that with resting
exposure to a 36°C water bath, the average force to move the leg to an angle of 45°
through a 60° arc was 0.82 ±0.14 kg before immersion and 0.63 ±0.12 kg after
immersion.
Table 2- Muscle Stiffness and EMG Data
MUSCLE STIFFNESS EMG DATASUMMARY

19
POOL REST POOL EXERCISE BIKE PRE POST PRE POST PRE POSTFORCE MEAN 0.822 0.632 0.808 0.73 0.652 0.634(KG) SD 0.14 0.12 0.131 0.135 0.035 0.04
EMG MEAN 2.5 0.8 2.4 .7 3 2.5(%MX) SD 0.54 0.89 0.8 0.67 0.35 0.68
These differences from pre to post immersion were significant (p<0.05). In
contrast, while the force required to move the lower leg was reduced a small amount pre
and post immersion with exercise in the pool and before and after bicycling on a cycle
ergometer, these differences were not statistically significant. For example, the amount
of force to move the leg in 5 subjects averaged 0.65 ±0.04 kg before bicycle ergometry,
and 0.65 ±0.04 kg post cycle ergometry. Certainly, some of the resistance to movement
may be due to reflex activity from muscle as exemplifies by the low level EMG activity
seen before hydrotherapy as shown in Table 2. EMG activity during movement after
warming, but not after exercise without warm water immersion was reduced
significantly. (p <0.05).
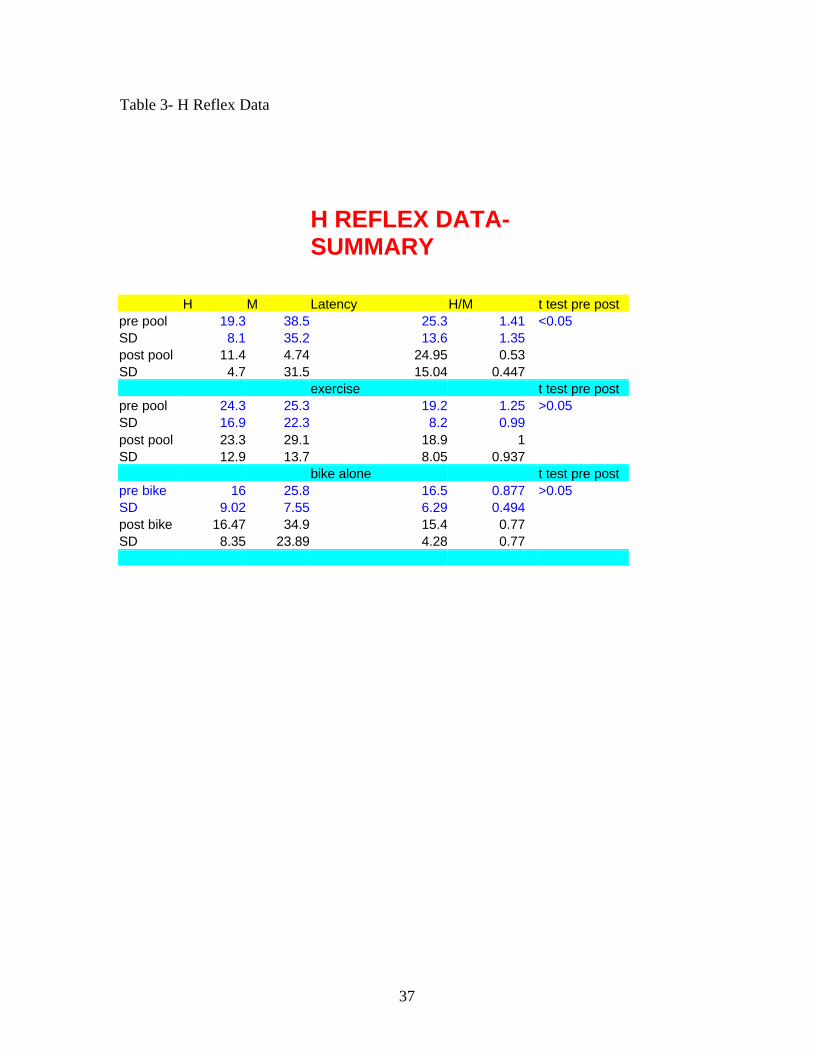
H-reflex data was similar to the muscle stiffness data. Table 3 shows the height
of the H wave, M wave, H-M ratios and latency in all 3 series of experiments. H and M
waves changed under all experimental conditions; therefore, as described previously, to
properly analyze H-reflex the H-M ratio was used.

20
Table 3- H Reflex Data
H REFLEX DATA-SUMMARY
H M Latency H/M t test pre postpre pool 19.3 38.5 25.3 1.41 <0.05SD 8.1 35.2 13.6 1.35post pool 11.4 4.74 24.95 0.53SD 4.7 31.5 15.04 0.447 exercise t test pre postpre pool 24.3 25.3 19.2 1.25 >0.05SD 16.9 22.3 8.2 0.99post pool 23.3 29.1 18.9 1SD 12.9 13.7 8.05 0.937 bike alone t test pre postpre bike 16 25.8 16.5 0.877 >0.05SD 9.02 7.55 6.29 0.494post bike 16.47 34.9 15.4 0.77SD 8.35 23.89 4.28 0.77
Passive immersion in the pool at 36°C caused a significant reduction in the H-M
ratio in the 5 subjects who participated in series 2, 3, and 4. For instance, before pool
immersion the average H-M ratio was 1.41 ±1.35, whereas after 30 min of passive
immersion in the pool the H-M ratio was reduced to 0.53 ±0.45. Exercise in the pool as
an intervention during passive heating also reduced the H-M ratio as shown in table 3.
The H-M ratio went from 1.25 ±0.99 to 1±0.937 with exercise; however, these
differences were not statistically significant. The differences on the bike alone before
and after bicycling at room temperatures, which again showed a downward direction
from 0.88±0.494 to 0.77±0.77, were not statistically significant. Therefore, the only

21
significant relaxation in the alpha motor neuron pool was found in passive immersion
alone. Along with these changes in the neuromuscular system, the results showed
significant changes in the cardiovascular system as well.
Cardiovascular system
The results of the cardiovascular studies are shown in table 4. Table 4 shows
cardiovascular data at rest after 15, 25 and 30 min of pool immersion for both passive
exposure to heating in the pool and exposure with the intervention of exercise. As can be
seen from this table, with passive immersion in the pool stroke volume increased from
36.7 ±8.6 ml/beat to 52.75 ±6.6 ml/beat, and the heart rate under these same conditions
increased from 77.5 ±5 beats/min to 87.5± 9.6 beats/min.
Table 4- Cardiovascular Data
CARDIOVASCULARDATA
Pool Rest stroke volume (cc) heart rate(b/min) cardiac output(l) BP(mmHg)rest 36.7 77.5 2.877 117/76
15 min 51.7 85 4.42 115/69
25 min 51.9 87 4.51 111/67
30 min 52.7 87.5 4.8 110/66
Pool Exercise stroke volume(cc) heart rate(b/min) cardiac output(l) BP (mmHg)rest 37.8 87.5 3.3 117/76
15 min 49 87.5 4.275 ***during exercise

22
25 min 66.7 91 5.83 112/74
30 min 62.5 100 5.65 111/71

23
The cardiac output (the product of stroke volume and heart rate) increased
significantly from the beginning to the end of the immersion period. Cardiac output
increased from 2.87 ±0.807 L/min to 4.77 ±0.91 L/min at the end of the 30 min passive
immersion period. During exercise in the pool, the average stroke volume at rest was
37.75 ±3.3 ml and increased to 62.5 ±3.31 ml per beat at the end of the exercise period.
Heart rate increased from 87.5 ±5 beats/min to 100 ±7.07 beats/min at the end of the 30
min period with exercise. Cardiac output increased from 3.3 ±0.42 ml/beat at rest to 5.65
±1.04 L/min at the end of the 30 min period. The difference between stroke volume after
25 or 30 min, and heart rate and cardiac output, when comparing the exercise exposure to
the passive exposure, were significantly higher (p < 0.05). While stroke volume, heart
rate and cardiac output all were higher with exercise in the pool, there was no significant
difference in blood pressure at 15, 25 or 30 min after immersion in the pool with the
subject at rest or with exercise. While the general trend was for the blood pressure to be
slightly higher during exercise in the pool, there was no statistical difference in this data.
Table 5 shows the blood flow to the skin under all 3 experimental conditions.
Flows are shown as raw flux data and percent increases from the Doppler flow meter.
Comparing the flows before and after immersion in the pool during passive resting, flux
increased from 109 ±23 to 174 ±59 flux units. This was an increase of 173%. For the 5
subjects that participated in this series of experiments, the increase was significant
(p<0.05). Exercise in the pool caused an increase from baseline values of 98 ±21 to 232
±128 flux units.

24
Table 5- Blood flow during immersion
BLOOD FLOW TO SKIN
rest pool exercise- pool bike pre post pre post pre postmean 109 174 98 232 98 114sd 23 59 21 128 3.4 41% increase 173 231 113
This increase of 231% was a significant increase comparing pre to post exercise
and immersion data and was significantly higher than that of the same subjects who were
simply resting in the pool for 30 min. In contrast to these large increases in flow seen
with immersion, bicycling for 15 min resulted in only slight increases in flows. Flows
increased by 113% as indicated by an increase from 98 ±3.4 to 114 ±41 flux units. The
change in flow seen in the pre to post exercise bouts was not statistically significant.
Therefore, blood flow significantly increased during passive immersion in the pool and
exercise in the pool, whereas bicycling had no significant affect on skin blood flow.

25
Discussion
Hydrotherapy has been a mode of medical treatment for thousands of years. For
example in early Greece, hydrotherapy was used for purifying rituals (Diamandopoulos et
al 1997). It was used in England as long as two thousand years ago (Moss 2000).
Recently it has been used for pediatrics (Dumas and Francesconi 2001), paraplegia (Gass
and Gass 2001), for burns (Acikel et al 2001), and to modulate cellular immunity
(Blazickova et al 2000). It has been recommended to increase the circulation in patients
with diabetes (Cox 2000, Bernstein 2000). It has been used in the treatment of low back
injuries (Konlian 1999). Yet, little evidence has been provided as to why hydrotherapy
benefits either the cardiovascular system or the neuromuscular system. Most of these
studies have provided little hard evidence and are no more that anecdotal in nature.
Therefore, the present investigation attempted to look at two different factors allegedly
affected by hydrotherapy, the first muscle relaxation and the second the effect of
hydrotherapy on the cardiovascular system.
The present investigation showed a reduction in the force it took to passively
move the leg after warm water hydrotherapy. Previous studies have shown an increase in
stretch and H reflexes of the lower leg in man during whole body cooling (Oksa et al
2000). Here the converse is true. The reduction in reflex activity and stiffness of the
muscle associated with warmer temperatures could have several possible mechanisms.
There might be changes in the muscle itself, changes in excitability of the alpha motor
neuron pool mediated by muscle spindles or central mediation by increased inhibitory
outflow from the brain associated with whole body heating.

26
Many studies have pointed to whole body relaxation when patients were passively
immersed in a warm water bath (Cammu et al 1994, Campion 1990). The overall effect
of warming the body and input from thermal sensors in the skin may cause an increase in
central inhibition into the upper motor neuron pool which might therefore lower H
reflexes but not directly alter muscle stiffness nor the contractile mechanism in muscle.
While this remains a possibility in the present studies, the present investigation does not
lend itself to determining the influence of central inhibition on the reduction in the H
reflex seen here.
However, studies in man have shown a reduction in the T reflex associated with
cooling and an increase with heating (Bell and Lehmann 1987). The mechanism for the
reduction in the H reflex with heating has been attributed to a reduction in secondary
spindle activity associated with the heating process (Michalski and Seguin 1975).
Whereas primary spindle afferents seem to be unaffected by muscle temperature,
secondary spindle afferents show a reduction in activity associated with heating. This
reduction in activity could lower the excitability of the alpha motor neuron pool. More
telling may be the effect of light exercise. When exercise was accomplished in the pool,
the H reflex was only reduced by a small amount. Further, exercise out of the pool, had
no effect on the H reflex at all when comparing the reflex before and after the exercise.
During exercise, muscle spindles are active and when muscles are activated
both the alpha and gamma systems discharge. Both primary and secondary afferents are
also active from the spindles (Petersen et al 1999). Central and peripheral control fo
alpha motor neuron excitability is so dynamic during exercise that H reflexes are
modulated in various phases of the step cycle from very enhanced to completely inhibited

27
all in one cycle during walking (Petersen et al 1999). This same type of response is seen
during cycling on a bicycle ergometer (Zehr et al 2001). It would seem likely, then, that
exercise may in fact maintain potentiate muscle spindle activity whereas warm water
hydrotherapy would reduce spindle output. Therefore, exercise in a therapeutic pool,
because of the activity of the muscle spindles, will keep spindles active and thereby
negate some of the effect of the warm water exposure alone on muscle spindle activity.
In the present investigation, subjects exercised with light kicking in the middle of the
exposure in the hydrotherapy pool. Therefore, a period of five minutes elapsed from the
end of exercise to the point of when H reflexes were measured after immersion. For this
reason, if H reflexes were measured at the end of the exercise in the warm water, the
results may have been very similar to the light exercise alone on the cycle ergometer
outside of the pool. That is, there may not have been any reduction in H reflex activity.
But H reflexes alone may not have been the only factor influencing the resistance
to passive movement seen in these studies. Certainly, the effect of temperature on
muscle is the opposite of the results seen in the present series of experiments.
Warming muscle increases muscle relaxation (Wang and Kawai 2001), ATP
utilization and the length of attachment and strength of attachment of cross bridges
(Hilber et al 2001). Muscle ATPase activity is highly related to muscle temperature. The
Q10 of skeletal muscle has been shown to vary between 3 and 10 in various studies
(Hilber et al 2001). Therefore, the actual reduction in H reflex activity seen here would
probably have had a much greater effect on muscle relaxation if not for the increase
metabolism in skeletal muscle causing an increase in muscle stiffness associated with
actomyosin ATPase activity. The change in muscle temperature here, was almost 6

28
degrees centigrade, therefore, muscle metabolism, even conservatively, would double or
triple associated with warming of muscle.
Whatever the mechanism, clearly passive light exercise and light exercise in a
pool had a very minimal effect on muscle relaxation. To maximize muscle relaxation
simple passive heating or passive pool emersion is the best mechanism.
But the present study also looked at the cardiovascular responses to immersion
and immersion with light exercise. As seen in the results of these studies the increase in
blood flow to the limb is minimal associated with passive heating. As stated above,
although the Q10 may be as high as 9.7 in skeletal muscle, other studies show that the
Q10 of the skin may be as low as 1.3 (Wang and Kawai 2001). Therefore, metabolism in
skin and many tissues in the limb can be virtually unaffected by changing temperature
even 5 or 6 degrees centigrade. For this reason it is not surprising that resting blood
flows are only increased approximately 3 fold associated with passive heating. Exercise
can cause an increase in flows of as much as 100 fold (Petrofsky 1982). Since the Q10 of
skin is much lower than skeletal muscle it is not surprising, then, that these studies
showed most of the increase in flow not being to the skin, but being to the muscle itself.
Hydrotherapy then, may not have a very large impact on skin flows when using
hydrotherapy for wound healing or to increase circulation to the skin and the body.
However, hydrotherapy does have a more significant impact in increasing blood flow to
muscle and tendons and would therefore work well for helping healing muscle tears and
other soft tissue injuries.
Increases in cardiac output and reduction in blood pressure associated with
hydrotherapy and skin blood flow were only modest. Any potential training effects on

29
the heart or cardiovascular system with the mild change in cardiac output and blood
pressure seen here will be minimal.
In summary, there is evidence that hydrotherapy alone can cause clinically
significant increases in circulation through skeletal muscle and small increases through
skin as well as causing an increase in muscle relaxation. However, if muscle relaxation is
the goal of the therapy, light exercise should not be attempted. If increases in circulation
is the goal of therapy, then light exercise in the pool potentiates the small increase in skin
and muscle circulation and in fact should be recommended as a therapeutic modality.
More studies need to be conducted looking at various types and intensities of exercise as
well as other water temperatures to thoroughly understand the optimal use of
hydrotherapy in clinical medicine.

30
References
Acikel C, Ulkur E, Guler MM. (2001) Prolonged intermittent hydrotherapy and earlytangential excision in the treatment of an extensive strong alkali burn. Burns 27:293-6
Astrand PO, Rodahl K (1970) Physiology of Work Capacity and Fatigue. McGraw Hill,New York
Belanger AY (2002) Evidence-based guide to therapeutic physical agents. Lippincott,Williams & Wilkins, Philadelphia
Bell KR, Lehmann JF (1987) Effect of cooling on H- and T-reflexes in normal subjects.Arch Phys Med Rehabil 68: 490-3
Blazickova S, Rovensky J, Koska J, Vigas M. (2000) Effect of hyperthermic water bathon parameters of cellular immunity. Int J Clin Pharmacol Res;20:41-6
Burke D, Hallett M, Fuhr P, Pierrot-Deseilligny E (1999) H reflexes from the tibial andmedian nerves. The International Federation of Clinical Neurophysiology.Electroencephalogr Clin Neurophysiol Suppl 52: 259-62
Bernstein RK. (2000) Hot-tub therapy for type 2 diabetes mellitus. N Engl J Med20;342:218; discussion 218-9
Cameron MH (1999) Physical agents in rehabilitation from research to practice. W.B.Saunders Company, Philadelphia
Campion, M (1990) Adult Hydrotherapy, a practical approach. Oxford HeinamanBooks
Campion MR, ed. (1998) Hydrotherapy principles and practice. Butterworth- Heinman,Oxford
Cammu H, Clasen K, Van Wettere L, Derde MP. (1994) To bathe or not to bathe' duringthe first stage of labor. Acta Obstet Gynecol Scand 73:468-72
Chapman CE, Michalski WJ, Seguin JJ (1979) The effects of cold-induced musclespindle secondary activity on monosynaptic and stretch reflexes in the decerebrate cat.Can J Physiol Pharmacol 57: 606-14
Clarke RS, Hellon JR, Lind AR (1958) Duration of sustained contractions of the humanforearm at different muscle temperatures. J Physiol 143: 454
31
Cox NH (2000) Hot-tub therapy for type 2 diabetes mellitus. N Engl J Med 342: 218discussion 218-9Diamandopoulos A, Vlachos J, Marketos S. (1997) The survival of the ritualistic over the'scientific' element of hydrotherapy in Greece. Hist Psychiatry 8:21-35
Dumas H, Francesconi S. (2001) Aquatic therapy in pediatrics: annotated bibliography.Phys Occup Ther Pediatr 20:63-78
Gass EM, Gass GC. (2001) Thermoregulatory responses to repeated warm waterimmersion in subjects who are paraplegic. Spinal Cord 39:149-55
Greenberg RS (1972) The effects of hot packs and exercise on local blood flow. PhysTher 52: 273-8
Hilber K, Sun YB, Irving M.(2001) Effects of sarcomere length and temperature on therate of ATP utilisation by rabbit psoas muscle fibres. J Physiol Mar 15;531:771-80
Kamenetz HL (1963) History of American spas and hydrotherapy. In: Licht S, ed.Medical Hydrology. Waverly Press, Baltimore, pp 160-183
Konlian C. (1999) Aquatic therapy: making a wave in the treatment of low back injuries.Orthop Nurs 18:11-8; quiz 19-20
Krizek V (1963) History of balneotherapy. In: Licht S, ed. Textbook of MedicalHydrology. Waverly Press, Baltimore, pp 132-149
Leonard CT, Diedrich PM, Matsumoto T, Moritani T, McMillan JA (1998) H-reflexmodulations during voluntary and automatic movements following upper motor neurondamage. Electroencephalogr Clin Neurophysiol 109: 475-83
Leonard CT, Moritani T, Hirschfeld H, Forssberg H (1990) Deficits in reciprocalinhibition of children with cerebral palsy as revealed by H reflex testing. Dev Med ChildNeurol 32: 974-84
Michalski WJ, Seguin JJ. (1975) The effects of muscle cooling and stretch on musclespindle secondary endings in the cat. J Physiol. 253:341-56.
Moor F, Peterson S, Manwell E, Noble M, Muench G (1964) Manual of hydrotherapyand massage. Pacific Press Publishing Association, Idaho, pp 1-29
Moss GA. (2000) Medicine 2000 years ago: the case of Qumran and other biblical sites. JR Soc Health 120:255-61
Oksa J, Rintamaki H, Rissanen S, Rytky S, Tolonen U, Komi PV. (2000) Stretch- and H-reflexes of the lower leg during whole body cooling and local warming. Aviat SpaceEnviron Med 71: 156-61

32
Pagliaro P, Zamparo P (1999) Quantitative evaluation of the stretch reflex before andafter hydro kinesy therapy in patients affected by spastic paresis. J Electromyogr Kinesiol9:141-8
Petersen N, Morita H, Nielsen J (1999) Modulation of reciprocal inhibition betweenankle extensors and flexors during walking in man. J of Physiology 520:605-19
Petrofsky JS, LaDonne D, Rinehart J, Lind AR (1976) Isometric strength and enduranceduring the menstrual cycle in healthy young women. Europ. J. Appl. Physiol. 35: 1-10
Petrofsky JS, Laymon M (2001) Assessment of muscle temperature after waterimmersion and hot and cold packs in man Submitted Physical Therapy
Petrofsky JS, Lind AR (1980) The influence of temperature on the amplitude andfrequency components of the EMG during brief and sustained isometric contractions.Europ. J. Appl. Physiol. 44: 198-200
Petrofsky JS (1982) Isometric Exercise and its Clinical Implications. Thomas Books,Springfield, pp 30-50
Poyhonen T, Keskinen KL, Hautala A, Savolainen J, Malkia (1999) E Human isometricforce production and electromyogram activity of knee extensor muscles in water and ondry land. EUR J APPL PHYSIOL 80:52-6
Prentice WE (2002) Therapeutic modalities for physical therapists. 2nd edition NewYork, McGraw-Hill pp 271-305
Ruoti RG, Morris DM, Cole AJ (1997) Aquatic rehabilitation. Lippincott Williams &Wilkins, Philadelphia
Sato H. (1983) Effects of skin cooling and warming on stretch responses of the musclespindle primary and secondary afferent fibers from the cat's tibialis anterior. Exp Neurol81: 446-58
Shankar K, Randall K (2002) Therapeutic Physical Modalities. Hanley and Belfus,Philadelphia
Wang G, Kawai M. (2001) Effect of temperature on elementary steps of the cross-bridgecycle in rabbit soleus slow-twitch muscle fibres. J Physiol Feb 15;531:219-34
Zehr EP, Hesketh KL, Chua R.(2001) Differential regulation of cutaneous and H-reflexes during leg cycling in humans. J Neurophysiol 85: 1178-84

33
Table 1- General Characteristics of Subjects- all data shown +/- the SD
Age (years) Height(cm) Weight (kg) numberMales 24+/-2.4 173+/-6.4 84.2+/-16.1 5
Females 25+/-2.1 164.5+/-3.8 66.5+/-14.3 5
Group 24.3+/-2.3 169 +/- 6.2 75.1+/- 18.9 10

34
Figure Legends
Figure 1- Electrode position for measuring the H reflex
Figure 2- Computer display of H reflex recording
Figure 3- Subject immersed in water with electrodes attached for measuring strokevolume and cardiac output.
Figure 4- Subject during immersion
Figure 5- Deep muscle temperature after immersion in water at 34°C and 37°C
Figure 6- Muscle and skin blood flow after immersion in a bath at 36°C

35
Table 1 General Characteristics of Subjects
Subject Age (years) Height (cm) Weight (Kg)
126 161.925 52.272
227 161.29 60.909
323 162.56 67.272
425 170.18 90.227
522 166.37 61.591
mean25 164.465 66.4542
sd2.073644 3.756711 14.3296

36
Table 2- Muscle Stiffness and EMG Data
MUSCLE STIFFNESS EMG DATASUMMARY
POOL REST POOL EXERCISE BIKE PRE POST PRE POST PRE POSTFORCE MEAN 0.822 0.632 0.808 0.73 0.652 0.634(KG) SD 0.14 0.12 0.131 0.135 0.035 0.04
EMG MEAN 2.5 0.8 2.4 .7 3 2.5(%MX) SD 0.54 0.89 0.8 0.67 0.35 0.68
37
Table 3- H Reflex Data
H REFLEX DATA-SUMMARY
H M Latency H/M t test pre postpre pool 19.3 38.5 25.3 1.41 <0.05SD 8.1 35.2 13.6 1.35post pool 11.4 4.74 24.95 0.53SD 4.7 31.5 15.04 0.447 exercise t test pre postpre pool 24.3 25.3 19.2 1.25 >0.05SD 16.9 22.3 8.2 0.99post pool 23.3 29.1 18.9 1SD 12.9 13.7 8.05 0.937 bike alone t test pre postpre bike 16 25.8 16.5 0.877 >0.05SD 9.02 7.55 6.29 0.494post bike 16.47 34.9 15.4 0.77SD 8.35 23.89 4.28 0.77

38
Table 4- Cardiovascular Data
CARDIOVASCULARDATA
Pool Rest stroke volume (cc) heart rate(b/min) cardiac output(l) BP(mmHg)rest 36.7 77.5 2.877 117/76
15 min 51.7 85 4.42 115/69
25 min 51.9 87 4.51 111/67
30 min 52.7 87.5 4.8 110/66
Pool Exercise stroke volume(cc) heart rate(b/min) cardiac output(l) BP (mmHg)rest 37.8 87.5 3.3 117/76
15 min 49 87.5 4.275 ***during exercise
25 min 66.7 91 5.83 112/74
30 min 62.5 100 5.65 111/71

39
Table 5- Blood flow during immersion
BLOOD FLOW TO SKIN
rest pool exercise- pool bike pre post pre post pre postmean 109 174 98 232 98 114sd 23 59 21 128 3.4 41% increase 173 231 113