the influence of the surface roughness of aqueous coated ... · appropriate iso surface roughness...
TRANSCRIPT
science & technology
18 19
defining this property in the evaluation of the light. The methods for surface texture and roughness evaluation can be generally classified as contact and non-contact meth-ods, as well as three dimensional (surface) or two dimen-sional (profiles) methods [7]. For any given rough surface, it is possible to measure its surface profile with a light beam or a mechanical stylus. In principle, from these sur-face profile measurements we can calculate the surface scattering. However, all profile measurements are limited by the instruments’ bandwidth. Even if we know the ex-act surface profile, we still have to know the precise lo-cation of the light beam relative to the surface before we can calculate the exact light scattering numerically. Practi-cally, for almost all applications, we are only interested in the statistical properties of the roughness and their effect on light scattering [8]. Atomic Force Microscopy (AFM) is a contemporary 3D scanning methodology which can cal-culated these statistical properties from a scanned surface and by using additional software we can generate appro-priate 3D data of the surface. The values obtained can be described by numerical numbers and can be used to con-trol the changing of the surface properties and thus by measuring additional values as gloss and colour values the influence of the surface roughness on the colorimet-ric values. Surface roughness is mostly associated with in-terface reflection and less by body reflection, which is governed by the subsurface material. Several papers deal with different roughness correlated reflection values on gloss coated samples as in [9], digital printed samples [10] and the influence of the varnish on the colour values of the prints in [11]. The later papers found that the var-nish (coating) layer doesn’t affect so much the hue, but the saturation and lightness of the samples. In an another paper by [12] goniocolorimetric measurements of coated samples were made and the authors found that lightness, chroma, and hue angle in the gloss angle region suffer as a result of high changes and extremes depending on the gloss of the material tested. This is what complicates color measurements and full determination or definition of the complex appearance of printed materials. The change of Chroma with varnishing of glossless materials was clear-ly elucidated. The colorimetric measurement of these val-ues can yield (change?) considerably depending on the in-strument type and measurement geometry [13] so there are few more problems to be solved in the future regard-ing the quality control of coated samples.
face [3]. The determination of the flow and the formation of the coating materials are influenced by number of fac-tors, which are primarily connected with inter surface pro-cesses. Most of the coating materials have a relative low surface tension and are applied to the surfaces with high-er surface tension that leads to the decrease of the to-tal free surface energy. The process of the layer forming in the dispersion coating materials like the aqueous coat-ings and varnishes is the process of the joining of the pol-ymer particles after the evaporation of the water from the emulsion system. This process enables the connection be-tween the neighbouring polymer particles. Besides the forming of the coating layers surface texture, according to the corpuscular reflection theory which forms a bridge between the Kubelka-Munk coefficients and optical con-stants of particles the particles play significant role in light scattering. The development of this is centred on the the-ory of Mie, which links the physical constants, including particle size, with scattering and absorption properties of the particle [4]. The particle size distribution comes from the statistical analysis of the particle sizes in an ensemble (population). The distribution of the particle size param-eter can be described in terms of particle size distribution curve. One of the most effective ways to plot these val-ues is through the distribution density function. Finer par-ticle size will yield better quality transparency and gloss due in part to film smoothness. In many coatings, espe-cially industrial coatings, a variety of waxes, polyethyl-enes and other special hard polymers are used to impart certain properties to the cured film. Since these materials function by coming to the surface of the cured film, much of their beneficial and adverse effects are dependent on particle size. Since the action of these particles is at the surface of the film, it is obvious that the larger the par-ticle, the greater the effect on film uniformity. Naturally, the larger the particle, the larger the crater and it results in a rougher, less uniform surface. This affects film integri-ty, transparency and gloss in clear coatings, as well as re-flected image in pigmented coatings [5]. Almost all of the surfaces that are treated by some production process are far from an ideal smooth surface and contain more or less some measure of roughness. The properties of the surface texture are defined by the distribution, shape and the size of the elementary particles in the forms of peaks or val-leys compared to the average “ideal” surface. In his PhD thesis [6] has stated a number of experimental data and theories about the influence of the surface roughness on the light scattering and thus defined to the importance of
1. IntroductionThe process of added value printing involves several addi-tional operations besides the basic printing of the ink on the carrying substrate. Additional liquid or solid materials are applied to the original printed surface to enhance the print surface. The change in the reflection is the observed as different light distribution from the changed surface. The most commonly applied liquid materials are coatings that usually come in form of oil-based varnishes, aqueous coatings and UV coatings. All of the materials have dif-ferent physical and chemical properties and are applied through different mechanisms (roller based system, anilox chambered doctor blade system). Different drying pro-cesses beside aforementioned factors will also have in-fluence on the final surface topography. Surface structure and the type of incoming light are one of the most influ-ential parts of the light scattering effect and greatly influ-ence the final printed product appearance. Consistent col-our reproduction and accurate colour prediction is nowa-days an essential part of the contemporary print produc-tion. Changes in appearances due to different types and quantities of coatings applied to the printed surface can cause problems in colour communication. Investigating the changes which certain coating properties like applied quantity and particle size distribution of the applied coat-ing exert in correlation with the final texture of the coated
Igor Karlović, Ivana Tomić, Ivana Rilovski, Dragoljub Novaković, Milica Vasić Vučinić, Uranija Kozmidis Luburić
The Influence of the Surface Roughness of Aqueous Coated Samples and the Particle Size of the Coatings on the Reflection and Colourimetric Values of Offset Printed Samples
Keywords: surface roughness, coating, particle size, colour difference
The visual appearance of the final printed sheet is one of the upmost important characteristics of printed product, especially in the packaging market. Value added printing with a large number of surface and visual enhancement elements is improving the visual appeal and improving the optical properties of the objects. Coating is one of the most often used process not just to protect the printed sheet and speed up drying, but can be very useful in creating interesting visual effects on the surface of the printed substrate. The reflection, which is influenced by the properties of the surface texture and surface materials, can greatly change the final overall appearance. This change can be observed by the observer or recorded in values calculated by the colour or gloss measurement instruments. These changes can cause problems with colour proofing and colour prediction issues that are very important in the packaging industry. The topic of this paper is the investigation of the surface properties of aqueous coated offset prints and the particle sizes of the used coatings. The surfaces were analysed with AFM microscope and the appropriate ISO surface roughness values were determined from the digital data of the scanned areas. The measurement of the particle sizes were done to determine the distribution volume, length of coatings particle sizes because the coating physical and chemical properties can influence the levelling of the coating on the surface and thus influence the forming of the final layer of the print surface. The influence of these factors on the reflection was determined by spectrophotometric measurement of the reflection and the appropriate colorimetric values. We have used two different type of aqueous (matte and glossy), which were applied with two different anilox rollers (60L/cm and 90L/cm), which were applied over conventional offset printing inks. The results show there is a correlation between the coating amount, surface levelling, particle distribution and the calculated colorimetric values.
surface after drying can gives us important process infor-mation’s. This information can be used in process optimi-zation, colour prediction and proofing and in environmen-tal protection because of the optimized and controlled ap-plication of the coatings.
2. Statement of the problemVarnishes (coatings) are applied directly to the substrate by rollers or coating forms in coating units or indirectly via intermediate carriers (e.g. print varnish from the print-ing plate via the blanket on the paper). Roller and blade systems (usually chambered doctor blades in conjunction with anilox rollers) are used to meter the quantity applied. [1] If the layer of the surface enhancing material is intend-ed to be the functional layer or a protective layer it should be continues and without any damages. One of the pre-requisites for forming such a layer is that the coating ma-terial is in liquid form at the moment of the application. One of the principal reasons is that the discrete particles of the coatings that are applied as separate drops should join to form a continous layer on the surface. Principal characteristic of these materials is the flow characteristics of these materials [2]. The flow and the surface levelling are a predicted movement of the coating materials before and after the application on the surface and these pro-cesses influence greatly the appearance of the coated sur-

science & technology
20 21
In Figure 4 the number of particles of matte coating shows that there is larger number of particles in the re-gion from 0.9 to 9 µm. This shows that the matte coating has large particles than the glossy coating.
As we can observe from Figure 1 in the glossy coating there is a high volume ratio around a particle size of 100 µm while for the matte coating there is a larger volume ration for the particles between 1 and 10 µm and a small-er volume of particles with sizes around 100 µm. In the analysis of the number of the particles we can see in Fig-ure 3 that for the glossy coating the largest number of particles are between 0.1 and 0.5 µm.
ent angles. An analytical procedure is then used to de-termine the size distribution of spherically shaped parti-cles that created the patterns. The result of the analysis is the relative distribution of volume (number) of particles in the range of size classes. Measurement parameters were: pump speed 2500 rpm; ultrasonic, off.
For the surface roughness analysis we have used the Veeco CP-II AFM microscope where we have scanned 6 positions on the non coated and coated samples in x and y direction, and from the sample sizes of 80 x 80 µm2 the statistical ISO roughness values were determined and av-eraged. The ISO roughness values and the 3D data were generated by Gwyddion and Image Metrology SPIP soft-ware packages. All the samples before the analysis were corrected with mean plane subtractions. The colorimet-ric data and the reflectance curves were measured with Techkon SpectroDens reflective spectrophotometer. We have used the 0/45° directional measurement geometry, with D50 standard illuminant and 20 standard observer. The relative reflectance was sampled between 400 and 700 nm, and from these data were also the CIE D94 color differences calculated.
3. ExperimentalMethods and materialsIn the experimental part we have printed the prints with conventional offset inks which confirm to the ISO 2864 standard and the inking was done according to the ISO 12647-2:2004 on the glossy coated paper of 130g/m2 which conforms to a Type 1 paper of the same standard. For the coating we have used an inline anilox roller coat-ing system with two different anilox rollers of 60L/cm and 90L/cm to regulate different amounts of the applied aqueous coating. We have used two commercial coat-ings the glossy Prestofix Hochglanzlack H6055/55 and the matte Prestofix Mattlack H260/55 aqueous coating. The drying and the coating were handled on the basis of the offset press and coating supplier recommendations. Af-ter the prints were dried and the final coating layer was formed we have selected the sheets by random sampling method from the OK prints. The presented results are the averaged values of these prints. The liquid coating was tested in regards to its the particle distribution in the lab-oratory with a Malvern Mastersizer 2000 Particle Size An-alyzer. It is capable of analyzing particles between 0.02 and 2000 µm. The Malvern Mastersizer 2000 records the light pattern scattered from a field of particles at differ-
4. ResultsThe analyses of the glossy and matte sample particle siz-es were done by volume, number and length distributions. The distribution curve of the volume analysis of the glossy coating is presented in Figure 1 and matte coating in Figure 2.
Figure 1: Particle size distribution of glossy aqueous coating in terms of volume
Figure 2: Particle size distribution of matte aqueous coating in terms of volume.
Figure 3: Particle size distribution of glossy aqueous coating in terms of number
Figure 4: Particle size distribution of matte aqueous coating in terms of number

science & technology
22 23
sents the typical topography of the observed and meas-ured samples.
To gain a more accessible knowledge of the encountered surface roughness properties we have generated a 3D representation of the surfaces. The Figures 6a to f repre-
As we can see from the results in Figure 5 the average surface roughness of plain paper and printed paper is quite similar (99.11 and 100.52 nm) while with the appli-cation of glossy coating the surface roughness is lower. The higher coating amount transferred with the 60L/cm anilox roller yielded 3.96 g/m2 coating amount and sur-face roughness of 47.93 nm which was the lowest of all samples, while the finer 90L/cm anilox transferred 1.9 g/m2 and had a slightly rougher surface of 66.41 nm which was lower from all samples expect the glossy coat-ed samples with higher amount. The application of the matte coating in a smaller amount (90L/cm roller) result-ed in value of 1.13 g/m2 and rougher surface of 229.42 nm, while a higher amount of transferred matte coat-ing (60L/cm roller) 2.15 g/m2 and the roughest surface of 244.07 nm. We can observe that with higher amount of glossy coating there is a decrease in surface roughness and with higher amount of matte coating there is an in-crease of average surface roughness of the prints.
After the coating particle distribution we have evaluat-ed the surface roughness values from the scanned are-as of the samples. For the quantification of the surface roughness we have chosen the average surface roughness factor Sa that conforms the ISO/DIS 25178-2 and ASME B46.1 standards and recommendations and is calculated with the following expression:
(1)
where M is the number of points per profile, and N is the number of profiles within the sampling area.
The results of surface roughness evaluation of the non-coated printed and coated samples are presented in Figure 5.
Figure 5: The averaged Sa surface roughness values of the measured samples
Figure 6: The surface topography of a) glossy coated paper no ink no coating b) printing ink with no coating c) glossy coating applied with 90L/cm anilox roller d) glossy coating applied with 60L/cm anilox roller e) matte coating applied with 90L/cm anilox roller f) matte coating applied with 60L/cm anilox roller

science & technology
24 25
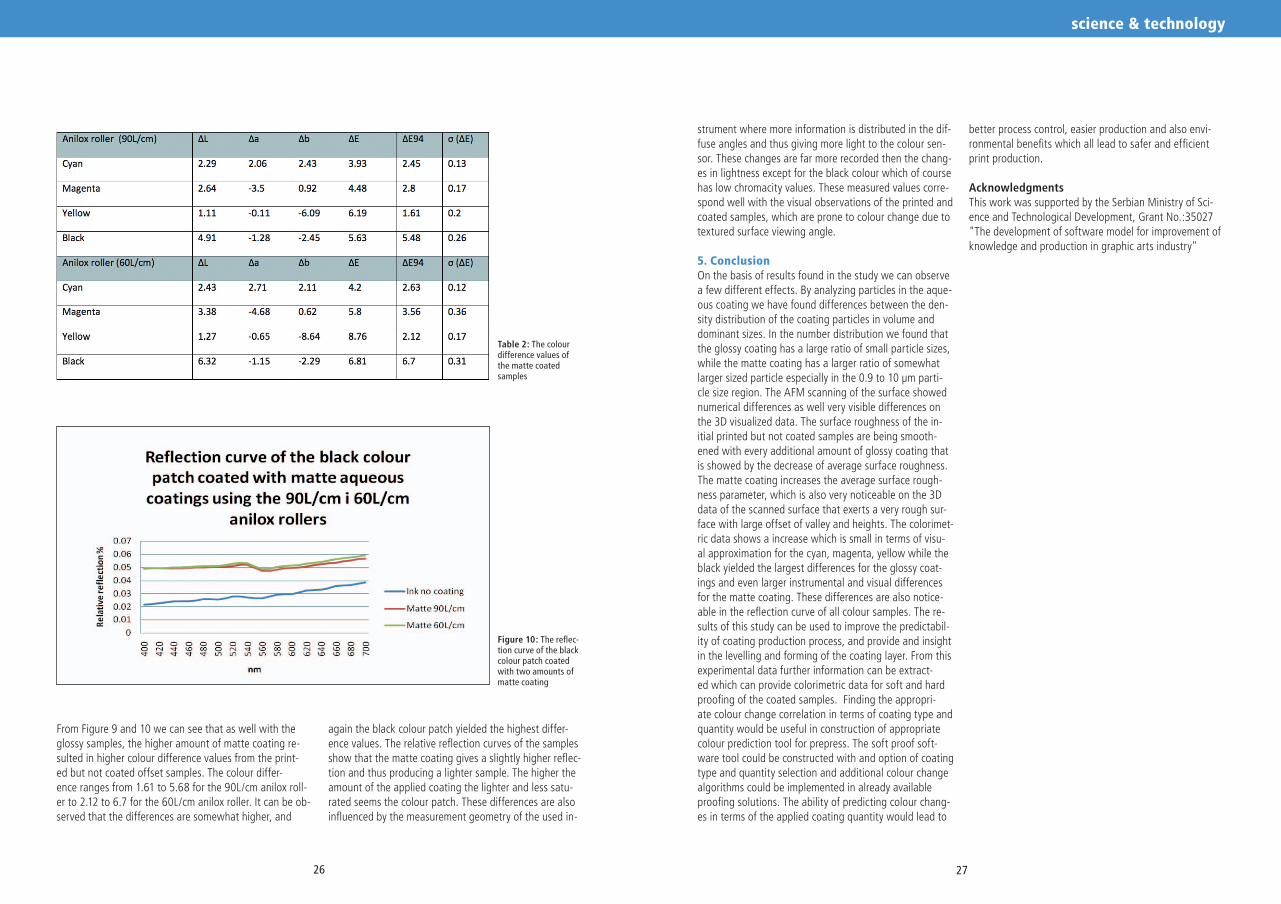
ments of the reflection curves on the patches and the re-sult for the black sample is presented in Figure 8. We can observe that both coated samples have a smaller reflec-tion throughout the measured range then the uncoated sample. The larger applied coating quantity gave slight-ly lower reflection values, which can be due to smooth-er surface, which reflects more in the specular region and thus reflects less to the measurement device sensor, which is recorded as darker lower reflection value. The re-sults for the matte coatings are presented in Figure 9 and Figure 10 and Table 2.
As we can observe from Figure 7 there is a very small but measurable colour difference with the additional amount of glossy coating where the higher amount usually results in a higher colour difference value. The most prominent change is the black colour patch that has the most notice-able visual difference off all samples. All the colour sam-ples have larger differences in the chromatic part (∆a, ∆b) then in the lightness value (∆l) except for the black where the largest difference is in the lightness component of the stimulus. This leads in colour appearance to darker more saturated samples in the coated samples. To verify this throughout the visible spectrum we made the measure-
glossy coated samples are presented in Figure 7. The re-flection spectra of the black colour patch from the coated and non-coated samples is presented in Figure 8. The val-ues for ∆a, ∆b and ∆L of the coated samples are shown in Table 1.
As a final measurement we have measured the reflec-tance spectra and colour differences of the non coat-ed and coated samples. We have measured the values on the full tone (100% tone value) CMYK patches. The re-sults of the colour difference values measurement for the
Figure 7: Colour difference values of different coated CMYK patches
Table 1: The colour difference values of the glossy coated samples
Figure 8: The reflec-tion curve of the black colour patch coated with two amounts of glossy coating
Figure 9: Colour difference values of different coated CMYK patches
science & technology
26 27
better process control, easier production and also envi-ronmental benefits which all lead to safer and efficient print production.
AcknowledgmentsThis work was supported by the Serbian Ministry of Sci-ence and Technological Development, Grant No.:35027 "The development of software model for improvement of knowledge and production in graphic arts industry"
strument where more information is distributed in the dif-fuse angles and thus giving more light to the colour sen-sor. These changes are far more recorded then the chang-es in lightness except for the black colour which of course has low chromacity values. These measured values corre-spond well with the visual observations of the printed and coated samples, which are prone to colour change due to textured surface viewing angle.
5. ConclusionOn the basis of results found in the study we can observe a few different effects. By analyzing particles in the aque-ous coating we have found differences between the den-sity distribution of the coating particles in volume and dominant sizes. In the number distribution we found that the glossy coating has a large ratio of small particle sizes, while the matte coating has a larger ratio of somewhat larger sized particle especially in the 0.9 to 10 µm parti-cle size region. The AFM scanning of the surface showed numerical differences as well very visible differences on the 3D visualized data. The surface roughness of the in-itial printed but not coated samples are being smooth-ened with every additional amount of glossy coating that is showed by the decrease of average surface roughness. The matte coating increases the average surface rough-ness parameter, which is also very noticeable on the 3D data of the scanned surface that exerts a very rough sur-face with large offset of valley and heights. The colorimet-ric data shows a increase which is small in terms of visu-al approximation for the cyan, magenta, yellow while the black yielded the largest differences for the glossy coat-ings and even larger instrumental and visual differences for the matte coating. These differences are also notice-able in the reflection curve of all colour samples. The re-sults of this study can be used to improve the predictabil-ity of coating production process, and provide and insight in the levelling and forming of the coating layer. From this experimental data further information can be extract-ed which can provide colorimetric data for soft and hard proofing of the coated samples. Finding the appropri-ate colour change correlation in terms of coating type and quantity would be useful in construction of appropriate colour prediction tool for prepress. The soft proof soft-ware tool could be constructed with and option of coating type and quantity selection and additional colour change algorithms could be implemented in already available proofing solutions. The ability of predicting colour chang-es in terms of the applied coating quantity would lead to
again the black colour patch yielded the highest differ-ence values. The relative reflection curves of the samples show that the matte coating gives a slightly higher reflec-tion and thus producing a lighter sample. The higher the amount of the applied coating the lighter and less satu-rated seems the colour patch. These differences are also influenced by the measurement geometry of the used in-
From Figure 9 and 10 we can see that as well with the glossy samples, the higher amount of matte coating re-sulted in higher colour difference values from the print-ed but not coated offset samples. The colour differ-ence ranges from 1.61 to 5.68 for the 90L/cm anilox roll-er to 2.12 to 6.7 for the 60L/cm anilox roller. It can be ob-served that the differences are somewhat higher, and
Table 2: The colour difference values of the matte coated samples
Figure 10: The reflec-tion curve of the black colour patch coated with two amounts of matte coating

science & technology
28 29
(first received: 03.03.2011)6. References [1] Kipphan, H. Ed.: “Handbook of Print Media”, Spring-
er, Berlin, 2001. [2] Marrion A.Ed.: “The chemistry and physics of coat-
ings”, Royal society of chemistry, Cambridge, 2004 [3] Bieleman J.: “Additives for coatings”, Wiley VCH,
Weinheim, 2000 [4] Völz H. G. :”Industrial Color Testing”, 2nd Ed., Wiley-
VCH Verlag GmbH, 2002 [5] Himics R.:” The Importance of Particle Size in Liq-
uid Coatings” Product Finishing posted online in 1998,http://www.pfonline.com/articles/the-impor-tance-of-particle-size-in-liquid-coatings [Accessed on 12.1.2011]
[6] Béland,M.-C.: Gloss Variation of Printed Paper:Relationship Between Topography and Light Scattering, Doctoral Thesis, Royal Institute of Tech-nology, Stockholm, Sweden, 2001
[7] ASME, B46.1 - 2002 Surface Texture, Surface Rough-ness, Waviness and Lay, 2002
[8] Lee H.C.:”Introduction to color image science”, Cambridge University Press, 2005
[9] Elias M., de la Rie R., Delaney J.K., Charron E., Mo-rales M. K., Modification of the surface state of rough substrates by two different varnishes and influ-ence on the reflected light, Optics Communications, Vol. 266, Issue 2, pp 586-591, 2006
[10] R. Szentgyörgyvölgyi, I. Endrédy, E. Novotny: Qual-ity of prints printed on papers with different sur-face characteristics of Océ Direct Imaging technolo-gy, In Proceedings of 5th International Symposium in Graphics, Ljubljana 27-29 May, pp. 741-756, 2010
[11] Simonot L., Elias M. Color change due to a varnish layer, Color Research & Application, Vol. 29, Issue 3, pp. 196-204, 2004
[12] Mikula M. , Čeppan M. , Vaško K. (2003) Gloss and goniocolorimetry of printed materials, Color Research and Application, 28 (5), pp. 335 – 342
[13] Novaković D., Karlović I., Pavlović Ž., Dedijer S. (2008) Colorimetric and tone value differences invar-nished samples of offset prints made with conven-tional and hybrid inks measured with different col-our measurement device, In Proceedings of12th Inter-national Confrerence on printing, design and graph-ic communications, Blaž Baromić 08, 21-24.9. Split, University of Zageb, Faculty of graphic arts, pp. 171-176, 2008
Igor Karlović
University of Novi Sad, Faculty of technical sciences, Department for graphic engineering and design, Novi Sad, Serbia
E-Mail: [email protected]
Dragoljub Novaković
University of Novi Sad, Faculty of technical sciences, Department for graphic engineering and design, Novi Sad, Serbia
E-Mail: [email protected]
Ivana Tomić
University of Novi Sad, Faculty of technical sciences, Department for graphic engineering and design, Novi Sad, Serbia
E-Mail: [email protected]
Milica Vasić Vučinić
University of Novi Sad, Faculty of technical sciences, Department for fundamental disciplines, Novi Sad, Serbia
Ivana Rilovski
University of Novi Sad, Faculty of technical sciences, Department for graphic engineering and design, Novi Sad, Serbia
Uranija Kozmidis Luburić
University of Novi Sad, Faculty of technical sciences, Department for fundamental disciplines, Novi Sad, Serbia