the influence of the soil water content in the soil-tool...
TRANSCRIPT

Progress in Agricultural Engineering Sciences 11(2015), 43–70 DOI: 10.1556/446.11.2015.5
1786-335X @ 2015 Akadémiai Kiadó, Budapest
The Influence of the Soil Water Content in the Soil-Tool DEM Model
KORNÉL TAMÁS1,*, ISTVÁN J. JÓRI1
Abstract. The Discrete Element Method (DEM) for describing the action mechanism be-tween soil and sweep tool can be used to perform a detailed analysis of draft force, soil cutting, clod-crushing and loosening by taking into account the tillage speed and the three soil phases. This study describes the simulation of the 3D DEM soil model and a cultivator sweep digitized with a 3D scanner, showing the soil–sweep interaction as a function of implement draft force and implement operating speed.
The suitability of the model is validated by comparing the results of laboratory and simulated shear tests (static validation) with the results of soil bin tests (dynamic validation). The mechanical parameters of the sandy soil used for the soil bin tests were measured using the direct shear box test. Cohesion for the soil model used during simulations was set using the parallel bond contact model, where the determining factors were the Young modulus for particle contact (Ec) and bonding (Ēc), the Poisson’s ratio (nu), the normal ( )σ and shear ( )τ bond strength and the radius of the related volume (cylinder). Once the DEM model parameters were set, the draft force values measured during dynamic testing were harmonized using the value for viscous damping (ci).
The dynamic soil–sweep model was validated using the viscous damping applied based on the simulated and measured draft force values. The validation of the Young modulus to 0.55e6 Pa (Kn = 1.73e4 N/m, Ks = 8.64e3 N/m) enabled us to set the draft force values of the model for different speeds (0.8–4.1 m/s) with an accuracy of 1–4%.
During the analysis of changes in tillage quality, the developed dynamic soil–sweep model showed a high degree of porosity (48%) due to grubbing in the attenuated speed range (0.5–2.1 m/s), and a decreasing tendency (0.41–0.39%) in the non-damped speed range (2.1–4.1 m/s). After the initial equilibrium state, the ratio of average particle contacts for the given porosity decreased in the attenuated speed range (coord number: 4.8), and a slight decrease was also found above speeds of 2.1 m/s (coord number: 5.2). In the model, clod-crushing was examined based on the ratio of sliding contacts, and we found a continuous increase (sliding fraction: 2–15%) in the speed range used for the simulation (0.8–4.1 m/s). Keywords: soil, sweep, cultivator, DEM, modeling, tillage, draft forces
* Corresponding author. Tel.: +36-1-463-3511, Fax: +36-1-463-3510, +36-1-463-3505, E-mail: [email protected]
1Department of Machine and Product Design, Budapest University of Technology and Economics, Műegyetem rkp. 3. H-1111 Budapest, Hungary
Kornél Tamás, István J. Jóri
44
1. Introduction The cultivator is one of our oldest, most general, and most used soil imple-ments. Cultivators are normally used without turning the soil to avoid los-ing too much soil moisture. The most frequent implement shapes have the sweep geometry. The model for describing the action mechanism of the soil implement can be used to perform a detailed analysis of soil cutting, clod-crushing and loosening by taking into account the tillage speed and the three soil phases.
The model created can be used to optimize the geometry of the tool to match draft force needs and optimize energy utilization. The results ob-tained from the energy tests of the sweep (required draft force versus sweep rake angle and speed) are necessary but not sufficient for judging the sweep. Our aim was to create a model that also allows a qualitative analysis of the cultivator sweep (displacements, soil profile, porosity change, clod-crushing).
The soil–tool interaction has already been analyzed by a number of re-searchers. Young and Hanna were the first to analyze soil cutting using the finite element method (Yong and Hanna, 1977). Another 2D model was used to analyze the cutting of a specific soil type (wet clay soil) (Glee-Clough et al., 1994). Like the 2D models, the 3D model of Liu Yan and Zhi-Min also considered soil cutting a static task (Liu Yan and Hou Zhi-Min, 1985). Xie Xiao-Mi and Zhang De-Jun used continuum modeling and the fi-nite element method to design and implement the soil model that also takes into account dynamic effects (Xie Xiao-Mi and Zhang De-Jun, 1995). They used dynamically executed traditional shear and triaxial tests to determine the material parameters they needed for their tests. A comprehensive study by Upadhyaya et al. (2002) used the finite element method to analyze soil–tool interaction. According to this research, finite element models can mostly only be used for continuum modeling and are not suitable for exam-ining soil crack propagation and soil mixing.
The discrete element method (DEM) has become the most promising implement for analyzing the contact between the particle set and the culti-vation implement (Cundall, 1971; Owen et al., 2002). Nonlinear soil behav-ior and soil–implement interaction are easy to describe using the DEM model. Hofstetter (2002) used DEM to create a 3D simulation of the contact between blade and soil.
In the publications listed above, settings parameters were not suffi-ciently validated, despite the numerous models and simulations used. The traditional measurement procedures determine the macro-mechanical
The Influence of the Soil Water Content in the Soil-Tool DEM Model
45
properties of the soil. The DEM model requires setting the soil’s micro-mechanical parameters, making it very difficult to accurately define an ap-propriate soil model (Franco, 2005).
The cohesive forces among soil particles are created by liquid bridges (Sitkei, 1967) and living organisms (Cundall and Hart, 1992). Some re-searchers have already studied the parallel bond model for describing the liquid bridges connecting soil particles and for using it in the so-called cap-illary model. The size of the deformable zone depends on the capillary ef-fect of working speed, which causes the soil water content.
Chen et al. (2013) have created a DEM model they could use to study the introduction of slurry into the soil. The relationships between the dy-namic behavior of the modeled soil and its micro-properties in different speeds have not yet been studied. Sadek et al. (2011) also used the DEM method for analyzing soil-tool interaction based on the parallel bond model. Tsuji et al. (2012) simulated the parallel bonds between particles to model soil moisture. Ono et al. (2013) created a model to describe soil cutting and soil–implement interaction. Ucgul et al. (2013) modeled the interaction us-ing hysteretic springs. The calculated results show a good match with the authors’ results described in their earlier work (Fielke, 1988). In their subse-quent research, Ucgul et al. (2014) also modeled plastic deformations. They proved that increasing particle size does not significantly impair the accu-racy of the DEM method and significantly reduces computation time when using larger particle sizes.
DEM research studies published to date have not highlighted the rela-tionships between micromechanical settings for mechanical soil characteris-tics measured during direct shear box tests, simulated shear box tests, and triaxial tests and the damping speed dependencies. A few publications al-ready discuss the settings parameters of parallel bonds, but none of them provides a detailed analysis of the model or explores the relationships be-tween settings parameters.
The question is how the model can be set for soil micromechanics stud-ies when changing certain parameters of the contact model, in accordance with the principles of soil mechanics.
The 3D-based DEM model needs to be perfected and a geometry for the implement interacting with the soil needs to be created using a 3D scanner in order to arrive at a model that more closely matches reality. We analyze how a 3D-scanned sweep interacts with wet sandy soil created using the DEM method, and analyze the effects of the tillage depth and speed of a specific implement on draft force and tillage quality. We explored the rela-tionship between the tillage speed and the required draft force of a specific

Kornél Tamás, István J. Jóri
46
implement geometry, and performed a detailed quantitative and qualitative analysis of this relationship.
2. Materials and Methods
We used the direct shear box test method to analyze the static mechanical properties of the soil–sweep model, and the soil bin lab dynamic test to ana-lyze the energy and tillage quality effects of the sweep. The results of the tests (soil mechanics properties, required draft force) were then used to set the parameters of the model created using the discrete element method.
In the discrete element simulations, the PFC3D particle flow code was used. The calculations performed in the discrete element method alternate between the application of Newton’s second law to the particles and a force-displacement law at the contacts. Newton’s second law is used to determine the motion of each particle arising from the contact and body forces acting upon it, while the force-displacement law is used to update the contact forces arising from the relative motion at each contact. More complex be-havior can be modeled by allowing the particles to be bonded together (parallel bond) at their contact points such that, when the inter-particle forces acting at any bond exceed the bond strength, that bond is broken. One can then model the interaction of these bonded “blocks,” including the formation of cracks that may cause blocks to fragment into smaller blocks (Itasca, 1999).
The simulations of the soil-sweep interaction were time consuming, be-cause the more particles and the use of damps need smaller timestep (4e-5-1e-6 1/s). The simulations on a modern PC with the use of viscous damp were 20–28 hours, but without damp were 1–8 hours in each speed.
2.1. Investigation of the soil’s shear strength
The calculated soil mechanics properties were validated with a direct shear box testing using a Model INSTRON 5581 floor standing universal me-chanical strength test machine (Fig. 1).

The Influence of the Soil Water Content in the Soil-Tool DEM Model
47
Fig. 1. Shear test configuration (Balássy, 1992).
(1. Soil sample; 2. Shear box; 3. Load arm; 4. Load weight; 5. Load cell mounted on shear box; 6. Cable routed over a pulley; 7. Slider of universal mechanical
measurement equipment; 8. Displacement meter) We have described the method in an earlier work (Tamás et al., 2013). The direct shear test was needed to validate the adjustable parameters of the DEM model.
2.2. The direct shear box test in DEM
The effective surface of the shear box model consisted of the internal sur-faces of the two half-boxes, their corresponding edges, and the upper press-ing face. The examined particle set was randomly generated in the model space. Micro-parameters were set using the values from the direct shear box test.
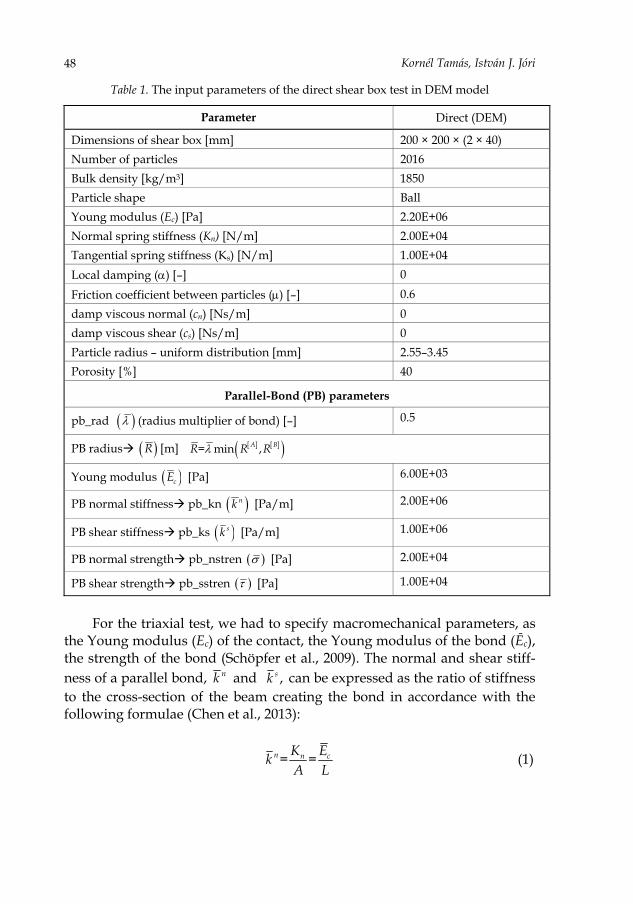
For the virtual direct shear box simulation, we set the micro-mechanical parameters directly (Table 1), then used the simulations to plot the σ–τ dia-gram.
2.3. Triaxial shear testing in the DEM
In order to set the macro-mechanical parameters, we performed the triaxial shear tests already presented in our earlier work (Tamás et al., 2013). Sizes of the samples tested: 0.4 × 0.8 × 0.4m (1632 ball) and 0.5 × 1.0 × 0.5m (3188 ball).
Kornél Tamás, István J. Jóri
48
Table 1. The input parameters of the direct shear box test in DEM model
Parameter Direct (DEM)
Dimensions of shear box [mm] 200 × 200 × (2 × 40) Number of particles 2016 Bulk density [kg/m3] 1850 Particle shape Ball Young modulus (Ec) [Pa] 2.20E+06 Normal spring stiffness (Kn) [N/m] 2.00E+04 Tangential spring stiffness (Ks) [N/m] 1.00E+04 Local damping (α) [–] 0
Friction coefficient between particles (μ) [–] 0.6 damp viscous normal (cn) [Ns/m] 0 damp viscous shear (cs) [Ns/m] 0 Particle radius – uniform distribution [mm] 2.55–3.45 Porosity [%] 40
Parallel-Bond (PB) parameters
pb_rad ( )λ (radius multiplier of bond) [–] 0.5
PB radius ( )R [m] [ ] [ ]( )= min ,A BR R Rλ
Young modulus ( )cE [Pa] 6.00E+03
PB normal stiffness pb_kn ( )nk [Pa/m] 2.00E+06
PB shear stiffness pb_ks ( )sk [Pa/m] 1.00E+06
PB normal strength pb_nstren ( )σ [Pa] 2.00E+04
PB shear strength pb_sstren ( )τ [Pa] 1.00E+04
For the triaxial test, we had to specify macromechanical parameters, as
the Young modulus (Ec) of the contact, the Young modulus of the bond (Ēc), the strength of the bond (Schöpfer et al., 2009). The normal and shear stiff-ness of a parallel bond, nk and ,sk can be expressed as the ratio of stiffness to the cross-section of the beam creating the bond in accordance with the following formulae (Chen et al., 2013):
= =n n cK EkA L
(1)
The Influence of the Soil Water Content in the Soil-Tool DEM Model
49
where the radius is: [ ] [ ]( )= min ,A BR R Rλ (2)
and the length of the beam is: [ ] [ ]( )=2 = ,A BL R R R (3)
The parameters of the parallel bond strength ( ),σ τ must be specified rela-tive to the values ( )cE nk and sk and used to set the soil’s cohesion and tendency for cracking (Table 2).
As particle size is changed, mechanical properties also change. Using macro parameters during the study and converting them to the micro pa-rameters of bonds for the larger particle sizes used made it possible to lower computing requirements. In order to validate the convertibility of the micro- and macro-mechanical parameters used for the discrete element modeling.
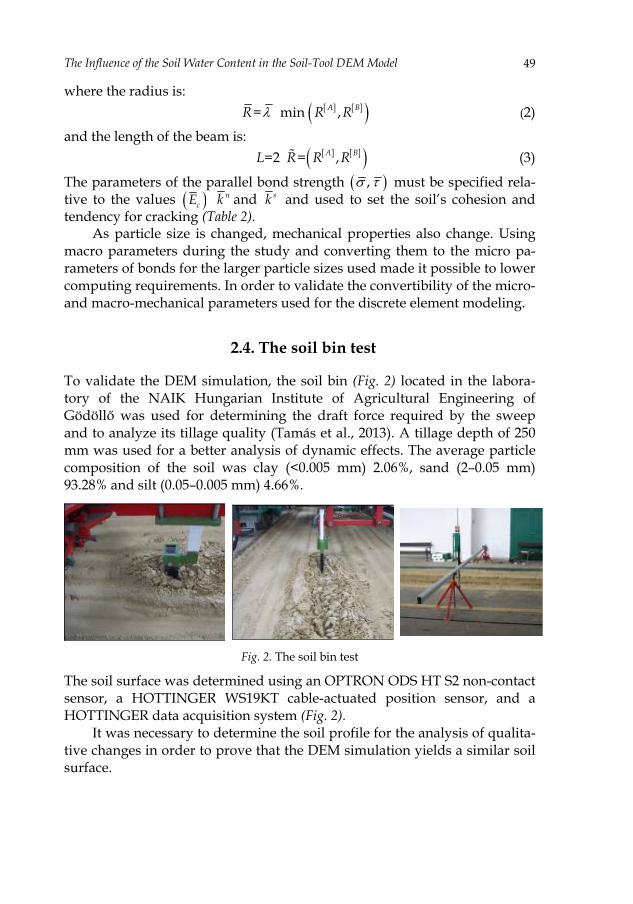
2.4. The soil bin test
To validate the DEM simulation, the soil bin (Fig. 2) located in the labora-tory of the NAIK Hungarian Institute of Agricultural Engineering of Gödöllő was used for determining the draft force required by the sweep and to analyze its tillage quality (Tamás et al., 2013). A tillage depth of 250 mm was used for a better analysis of dynamic effects. The average particle composition of the soil was clay (<0.005 mm) 2.06%, sand (2–0.05 mm) 93.28% and silt (0.05–0.005 mm) 4.66%.
Fig. 2. The soil bin test
The soil surface was determined using an OPTRON ODS HT S2 non-contact sensor, a HOTTINGER WS19KT cable-actuated position sensor, and a HOTTINGER data acquisition system (Fig. 2).
It was necessary to determine the soil profile for the analysis of qualita-tive changes in order to prove that the DEM simulation yields a similar soil surface.

Kornél Tamás, István J. Jóri
50
2.5. The DEM model created for studying draft force
The major dimensions of the 3D DEM model are shown in Fig. 3, where the tool width is 228 mm, the 2γ cutting angle is 70° and the β rake angle is 25°. During the tests, the connecting surface of the implement was generated us-ing a 3D scanner (Next Engine Inc., California). The mesh describing the sweep’s surface consisted of 898 triangle wall elements (Kn = 1e9 N/m; Ks = 0.5e9 N/m). The virtual soil bin was 1000 mm long, 1000 mm wide and 450 m high.
a)
X
Y
Z
11223344
b)
Fig. 3. a) 3D layout and dimensions of the DEM model used to model soil–sweep interaction (length = 1 m, width = 1 m, height = 0.45 m) and b) the positions of the
measurement spheres (11,22,33,44)

The Influence of the Soil Water Content in the Soil-Tool DEM Model
51
During the DEM simulation, soil–sweep interaction was investigated across a broad speed range (0.8–4.1 m/s). During the soil bin test, the primary fo-cus was on lower speeds (0.5–1.5 m/s) because our earlier studies showed the inaccuracy of the DEM model in this speed range (Tamás et al., 2013).
Four measurement spheres were placed along the path of the imple-ment (Fig. 3b). These measurement spheres (meas) were used to determine the porosity generated during sweep use, the coordination number to indi-cate clod-crushing (coord number), and the ratio of bonds currently sliding (sliding fraction) as an indicator of looseness (Itasca, 1999). The sliding frac-tion is defined as the fraction of contacts contained within the measurement sphere that are slipping. Slip is assumed to be occurring at a contact if there is no contact bond and the magnitude of the shear component of the contact force is within one-tenth of a percent of the maximum allowable shear force (Itasca, 1999).
Table 2. Input parameters and values of the discrete element model (DEM)
Parameters and Values Static (Triax test)
Dynamic (Soil–Tool)
Number of particles 1632/3188 10.000 Bulk density [kg/m3] 1850 1850 Particle shape Ball Ball Young modulus (Ec) [Pa] 1.0E+06 5.5E+05 Normal spring stiffness (Kn) [N/m] 3.14E+04 8.00E+03 Tangential spring stiffness (Ks) [N/m] 1.57E+04 4.00E+03 Friction coefficient between particles (μ) [–] 0.6 0.6 Local damp (α) [–] 0 0 damp viscous normal (cn) [Ns/m] 0 function of speed damp viscous shear (cs) [Ns/m] 0 function of speed Particle radius – uniform distribution (rlo-rhi) [mm] 20–26 10–13 Friction coefficient between particle and the tool (μ) [–] 0.6 0.6 Porosity [%] 37.36 37.36
Parallel-Bond (PB) parameters (Result of the iterations) pb_rad ( )λ (radius multiplier of bond) [–] 1 1
PB radius ( )R [m] =R λ min [ ] [ ]( )=A BR R Young modulus ( )cE [Pa] 2.00E+05 2.00E+05
PB normal stiffness pb_kn ( )nk [Pa/m] 5.00E+06 3.00E+07
PB shear stiffness pb_ks ( )sk [Pa/m] 2.50E+06 1.00E+07
PB normal strength pb_nstren ( )σ [Pa] 2.00E+04 2.00E+04 PB shear strength pb_sstren ( )τ [Pa] 1.00E+04 1.00E+04 Time step of the calculation (Δt) [s] 4.0×10⁻⁵

Kornél Tamás, István J. Jóri
52
The parameters and values used during 3D DEM simulation are shown in Table 2. The soil was simulated with 10,000 spheres and the friction coef-ficient defined for particle–particle and particle–wall was μ = 0.6. Initial po-rosity (37.36%), local damping (α = 0.0) and the normal and shear compo-nents of the discreet particles (Kn = 3.14e4 N/m, Ks = 1.57e4 N/m) were also set for a particle radius of 0.01–0.013 m. During the dynamic tests, we used viscous damping in the bonds between soil-constituting particles, com-pletely neglecting local damping.
2.6. Applying damping
As soil loosening can be considered a dynamic process, energy dissipation is described and determined in the model using damping, due to the differ-ent speeds used during simulation. The PFC3D discrete element software al-lows two types of damping to be set: local damping and viscous damping. The ( )
diF damping force for local damping is:
( ) ( ) ( )( )=- signdi i iF Fα ν (4)
Local damping only damps accelerating motion, the damping factor α is a dimensionless quantity and acts against the forces that cause acceleration. This type of damping does not reflect any real physical phenomena and was not used as a possible settings parameter, it was only used during settling for creating the initial equilibrium state.
Viscous damping, when used, works in all bonds (both in normal and shear direction). It works in parallel with the contact model set (which in this case was the parallel bond). Viscous damping does reflect real-world physical processes. When used, a damping force is added to the contact model:
= i i iD c ν (5)
where ci is the damping coefficient, vi is the relative speed in the bond, and the direction of the damping force is opposite to the direction of motion, i is one of the two components of bond force (i = n: normal, s: shear) (Itasca, 2008). During the tests, viscous damping was set to the same value for both normal and shear direction (cn = cs).
The Influence of the Soil Water Content in the Soil-Tool DEM Model
53
2.7. The iterative setting process of dynamic characteristics in the DEM system
The energy consumed for soil tillage is determined by the draft force of the implements. Draft force, in turn, is a function of soil properties, implement geometries, tillage depth and draft speed (Mouazen et al., 1999). The in-creased resistance caused by increasing speed greatly depends on the β rake angle of the tool and on the mechanical properties of the soil (Tamás et al., 2013).
We applied gravitational settling to create the model soil used for ex-ploring the dynamic properties of soil–sweep interaction. The initial equi-librium state of the particle set was created using local damping (α = 0.8) for time efficiency. Local damping used for settling was turned off (α = 0) dur-ing the dynamic tests. Once the particle set settled, none of its other parame-ters, such as normal stiffness (Kn), shear stiffness (Ks) or any other settings of the parallel bond, were changed during simulations. The contact parameters used pertain to quasi-static cases, while loosening is a dynamic process. For this reason, viscous damping was applied when describing the simulated soil–sweep interaction.
During dynamic testing, changes in the structure of the modeled soil were analyzed by examining the von Mises stresses induced and the draft force. The tillage quality of the implement was investigated by studying the change of porosity (looseness), the coordination number (coord number, also looseness), and the ratio of the sliding fraction (clod-crushing).
3. Results and Discussion
3.1. Sensitivity analysis of the soil DEM model During validation, we changed certain parameters within a given interval and analyzed the system’s sensitivity to these changes. In the simulations, we focused on phenomena occurring in real physical behavior.
In our investigations we modeled the inhomogeneity by the differentia-tion in particle size, the soil moisture condition by the parallel bond’s radius multiplier ( ) ,λ the cracking tendency by the bonding stiffnesses ( ),n sk k and the air phase by the pore volume (porosity) of the particle block.
The first step of the test was to change the size of the sheared volume. The boxes used had the following dimensions: (width × depth × length):
Kornél Tamás, István J. Jóri
54
0.4 m × 0.4 m × 0.8 m, and 0.6 m × 0.6 m × 1.0 m. The tests proved that the shear box size does not affect the outcome of the tests, in accordance with the results published by Matthew et al. (2009). We started the test by speci-fying the initial parameters, setting the radius of the smaller particle (rlo = 0.02 m) and the ratio of smaller (rlo) to larger (rhi) particle size (rhi/rlo = 1.3) in uniform distribution.
In the pre-compacted soil sample, we determined the minimum num-ber of contacts for a single particle (coord number = 4). This was necessary to ensure that the porosity of the test specimen is close to that of the virtual soil bin (Table 2).
3.2. Impact of the parallel bond radius and the friction coefficient on the mechanical properties of the modeled soil
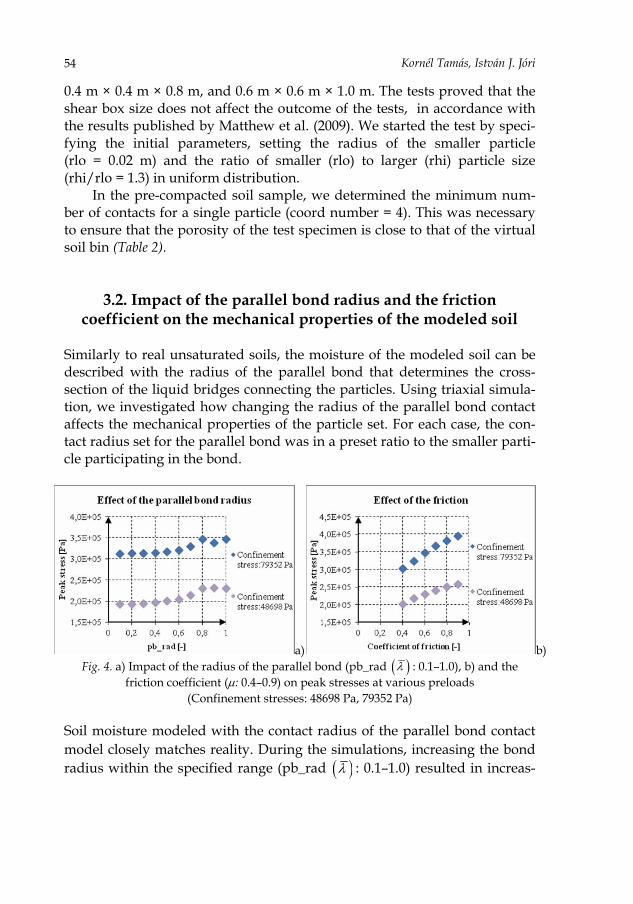
Similarly to real unsaturated soils, the moisture of the modeled soil can be described with the radius of the parallel bond that determines the cross-section of the liquid bridges connecting the particles. Using triaxial simula-tion, we investigated how changing the radius of the parallel bond contact affects the mechanical properties of the particle set. For each case, the con-tact radius set for the parallel bond was in a preset ratio to the smaller parti-cle participating in the bond.
a) b)Fig. 4. a) Impact of the radius of the parallel bond (pb_rad ( )λ : 0.1–1.0), b) and the
friction coefficient (μ: 0.4–0.9) on peak stresses at various preloads (Confinement stresses: 48698 Pa, 79352 Pa)
Soil moisture modeled with the contact radius of the parallel bond contact model closely matches reality. During the simulations, increasing the bond radius within the specified range (pb_rad ( )λ : 0.1–1.0) resulted in increas-

The Influence of the Soil Water Content in the Soil-Tool DEM Model
55
ing peak stress values (Fig. 4a), reflecting real-life observations in accor-dance with the results, published by Wulfsohn et al. (1994). Even in real soils, cohesion only increases to a certain limit as moisture is increased (Mouazen, 2002).
As the triaxial simulation showed, peak stress during shear also in-creased as we increased the friction coefficient (0.4–0.9) between particles (Fig. 4b).
3.3. The effect of the average number of particle contacts
In the simulated triaxial shear test, changes in the particle set were studied using the coordination number (coord number), a quantity with an effect close to that of porosity after Kruyt and Rothenburg (2001), Kruyt and Rothenburg (2002).
Fig. 5. Young modulus values versus coord number
Young modulus increases (Fig. 5) as the number of ball contacts increases and has impact on the mechanical behavior of the particle set created dur-ing triaxial testing.
Kornél Tamás, István J. Jóri
56
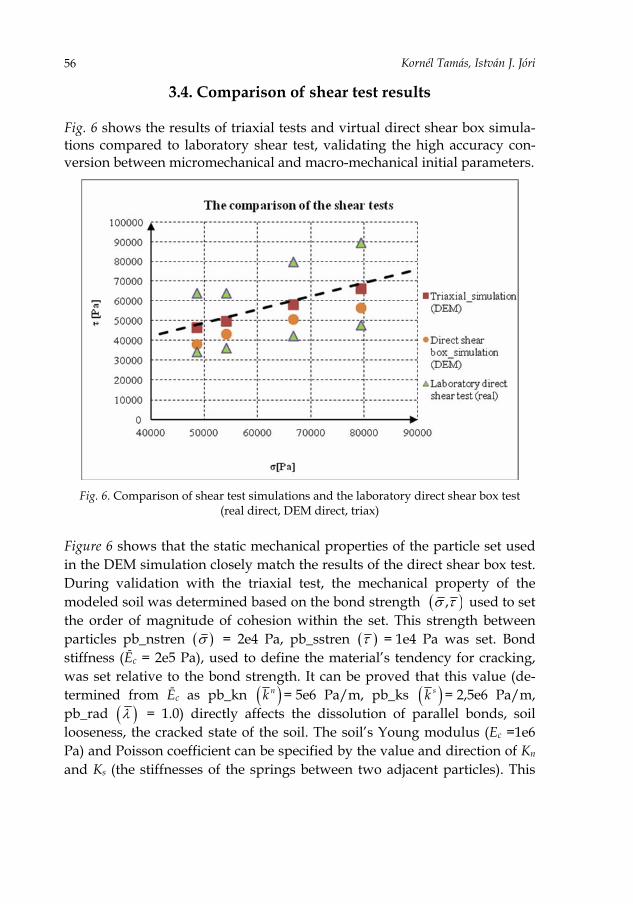
3.4. Comparison of shear test results Fig. 6 shows the results of triaxial tests and virtual direct shear box simula-tions compared to laboratory shear test, validating the high accuracy con-version between micromechanical and macro-mechanical initial parameters.
Fig. 6. Comparison of shear test simulations and the laboratory direct shear box test
(real direct, DEM direct, triax) Figure 6 shows that the static mechanical properties of the particle set used in the DEM simulation closely match the results of the direct shear box test. During validation with the triaxial test, the mechanical property of the modeled soil was determined based on the bond strength ( ),σ τ used to set the order of magnitude of cohesion within the set. This strength between particles pb_nstren ( )σ = 2e4 Pa, pb_sstren ( )τ = 1e4 Pa was set. Bond stiffness (Ēc = 2e5 Pa), used to define the material’s tendency for cracking, was set relative to the bond strength. It can be proved that this value (de-termined from Ēc as pb_kn ( )nk = 5e6 Pa/m, pb_ks ( )sk = 2,5e6 Pa/m, pb_rad ( )λ = 1.0) directly affects the dissolution of parallel bonds, soil looseness, the cracked state of the soil. The soil’s Young modulus (Ec =1e6 Pa) and Poisson coefficient can be specified by the value and direction of Kn and Ks (the stiffnesses of the springs between two adjacent particles). This
The Influence of the Soil Water Content in the Soil-Tool DEM Model
57
value reflected the behavior of the sandy soil taken from the bin in a range of Kn = 3.14e4, Ks = 1.57e4 N/m, which values correspond to macro-mechanical variables of a Young modulus (Ec) of 1e6 Pa and a Poisson coef-ficient (nu) of 0.281.
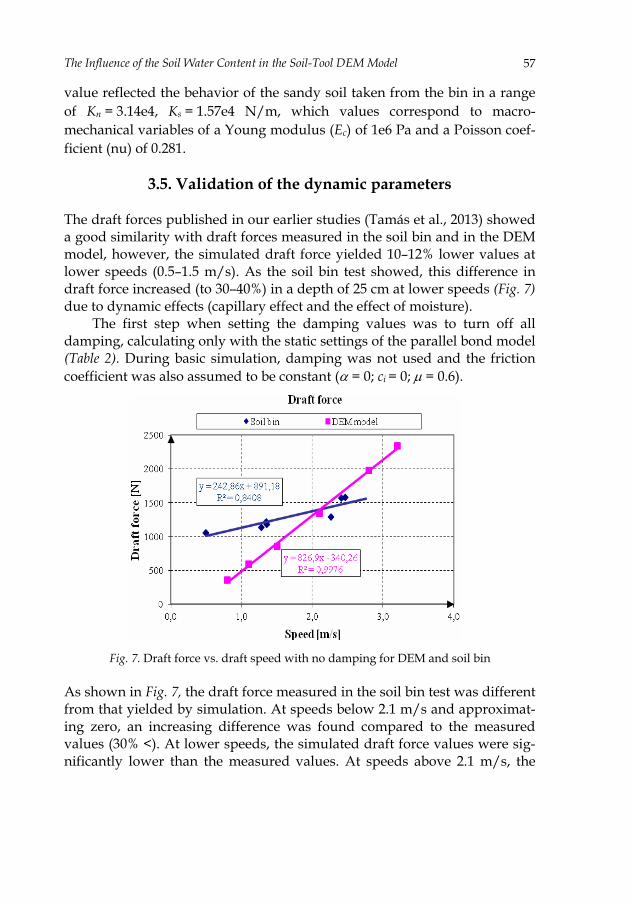
3.5. Validation of the dynamic parameters The draft forces published in our earlier studies (Tamás et al., 2013) showed a good similarity with draft forces measured in the soil bin and in the DEM model, however, the simulated draft force yielded 10–12% lower values at lower speeds (0.5–1.5 m/s). As the soil bin test showed, this difference in draft force increased (to 30–40%) in a depth of 25 cm at lower speeds (Fig. 7) due to dynamic effects (capillary effect and the effect of moisture).
The first step when setting the damping values was to turn off all damping, calculating only with the static settings of the parallel bond model (Table 2). During basic simulation, damping was not used and the friction coefficient was also assumed to be constant (α = 0; ci = 0; μ = 0.6).
Fig. 7. Draft force vs. draft speed with no damping for DEM and soil bin
As shown in Fig. 7, the draft force measured in the soil bin test was different from that yielded by simulation. At speeds below 2.1 m/s and approximat-ing zero, an increasing difference was found compared to the measured values (30% <). At lower speeds, the simulated draft force values were sig-nificantly lower than the measured values. At speeds above 2.1 m/s, the

Kornél Tamás, István J. Jóri
58
simulated draft force is greater than the measured value as speed is in-creased. We started new tests to harmonize this relationship (see Section 3.8).
3.6. The sensitivity of draft force to variations in the friction coefficient
As shown in Fig. 7, the sensitivity to the friction coefficient was tested at a highly accurate speed (2.1 m/s). The test results (Fig. 8) showed that within the interval used (0.1–1), the friction coefficient has a significant effect on draft force.
Fig. 8. Draft force versus friction coefficient at a speed of 2.1 m/s
The results obtained during simulation show a doubling of the draft force (1300 N–2600 N).
Since the friction coefficient was set based on static validations (and hence was considered a static parameter), it was left unchanged at a con-stant value of 0.6 during the dynamic tests.
3.7. The sensitivity of draft force to variations in porosity Simulations performed on the discrete element model were used to test the interaction between the scanned sweep tool and the created soil model at different porosity (33–43%). The initial porosity of the modeled soil was set using the growth process. The draft force at a depth of 25 cm was studied at different porosity (33–43%).
The Influence of the Soil Water Content in the Soil-Tool DEM Model
59
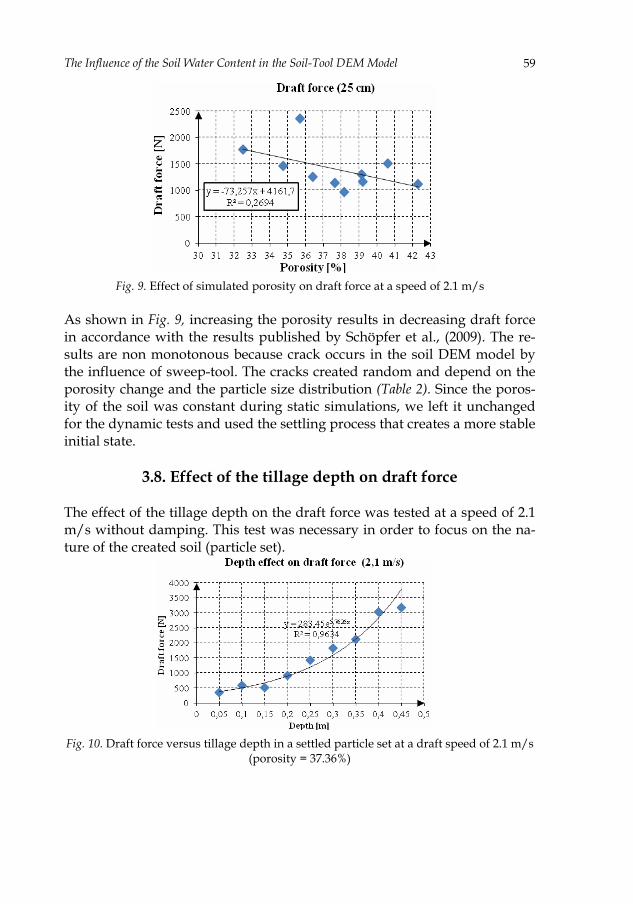
Fig. 9. Effect of simulated porosity on draft force at a speed of 2.1 m/s
As shown in Fig. 9, increasing the porosity results in decreasing draft force in accordance with the results published by Schöpfer et al., (2009). The re-sults are non monotonous because crack occurs in the soil DEM model by the influence of sweep-tool. The cracks created random and depend on the porosity change and the particle size distribution (Table 2). Since the poros-ity of the soil was constant during static simulations, we left it unchanged for the dynamic tests and used the settling process that creates a more stable initial state.
3.8. Effect of the tillage depth on draft force The effect of the tillage depth on the draft force was tested at a speed of 2.1 m/s without damping. This test was necessary in order to focus on the na-ture of the created soil (particle set).
Fig. 10. Draft force versus tillage depth in a settled particle set at a draft speed of 2.1 m/s
(porosity = 37.36%)
Kornél Tamás, István J. Jóri
60
The simulation results shown in Fig. 10 show a good match with in situ test results mentioned in the literature (Sitkei, 1967). Increasing the tillage depth (0.05 m–0.45 m) increases the required draft force (480–3100 N). The result in the depth of 0.45 m is inappropriate because of closeness of the bottom wall of the soil bin model.
3.9. Dynamic setting of the soil DEM model using viscous
damping
The analyses discussed above show the multiple factors that play a role in determining the draft force acting on the implement. During dynamic vali-dation, we took into account the fact that the draft resistance obtained when testing the implement during loosening at low speeds (0.5–2.1 m/s) was similar to those explained by the authors with the capillary effect caused by liquid bridges among the soil particles. The capillary effect, depending on the soil’s moisture content, affects the size of the compaction zone in front of the sweep and the stresses generated in it. In the light of these test results, we deemed it important to accurately adjust viscous damping, more closely reflecting physical reality, to the given speeds. The additional validation used to determine the speed-dependent parameters of damping showed no-ticeable differences in the compaction zones in front of the implement that corresponded to the values of viscous damping (ci). During validation, the damping values set for the different speeds showed a linear tendency.
As a result, and assuming a linear relationship between viscous damp-ing and speed, the value of viscous damping for a given speed (0.5–4.1 m/s) can be determined automatically in the simulations. The static macro ( ), ,nuc cE E and micro ( ), , , , , ,n s
n s c cK K k kλ σ τ model parameters were not changed during the dynamic validation. As damping was not used at speeds of 2.1 m/s and up, the compaction zone was not studied in the speed range 2.1–4.2 m/s. In our study, we analyzed (a) the viscous damping validated for a given speed; (b) the stress distribution in front of the imple-ment for a constant damping of 0.5 Ns/m; (c) the stress distribution in front of the implement at a viscous damping value of zero (Figs 11–13).
The Influence of the Soil Water Content in the Soil-Tool DEM Model
61
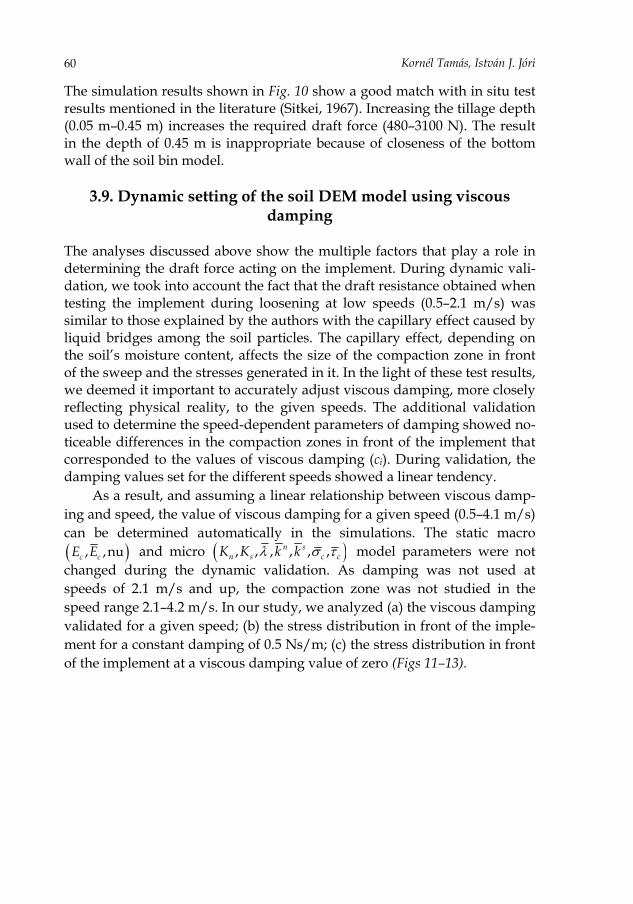
a) ci = 11.1 Ns/m b) ci = 0.5 Ns/m c) ci = 0
Fig. 11. Stresses around the sweep for different values of viscous damping at a speed of 1.5 m/s
a) ci = 16.5 Ns/m b) ci = 0.5 Ns/m c) ci = 0
Fig. 12. Stresses around the sweep for different values of viscous damping at a speed of 1.1 m/s
a) ci = 20.6 Ns/m b) ci = 0.5 Ns/m c) ci = 0
Fig. 13. Stresses around the sweep for different values of viscous damping at a speed of 0.8 m/s
During soil cutting, a certain stress field is formed within the deformation zone in accordance with the results, published by Mouazen and Nemenyi (1999). The highest stress is found on the implement surface or on the sur-face of the compact zone. The stress within the compact zone is close to con-stant and is equal to the maximum stress. Stress distribution is symmetrical and follows the shape of the deformation zone. The decrease of the defor-mation zone causes a decrease in the resistance of the implement.
Kornél Tamás, István J. Jóri
62
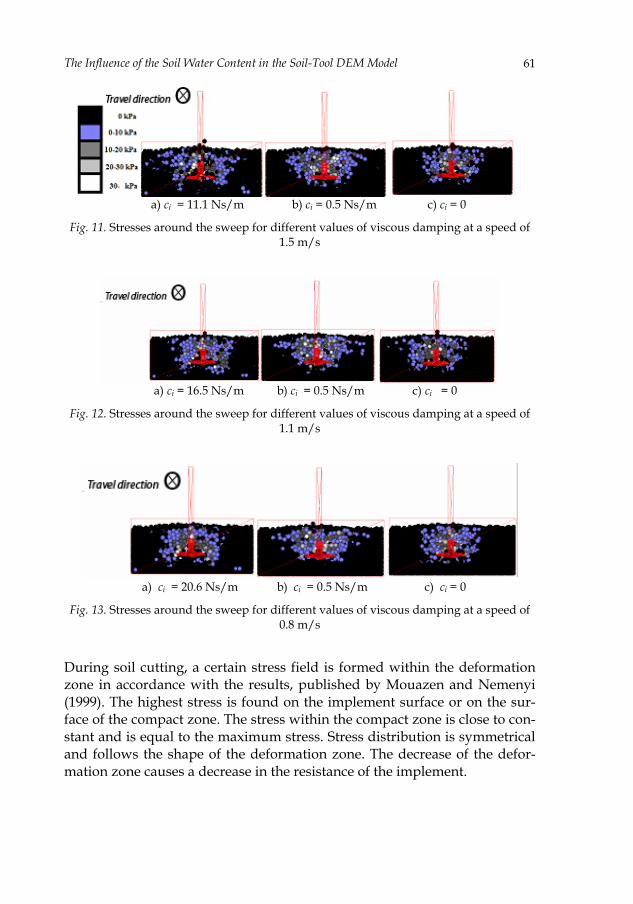
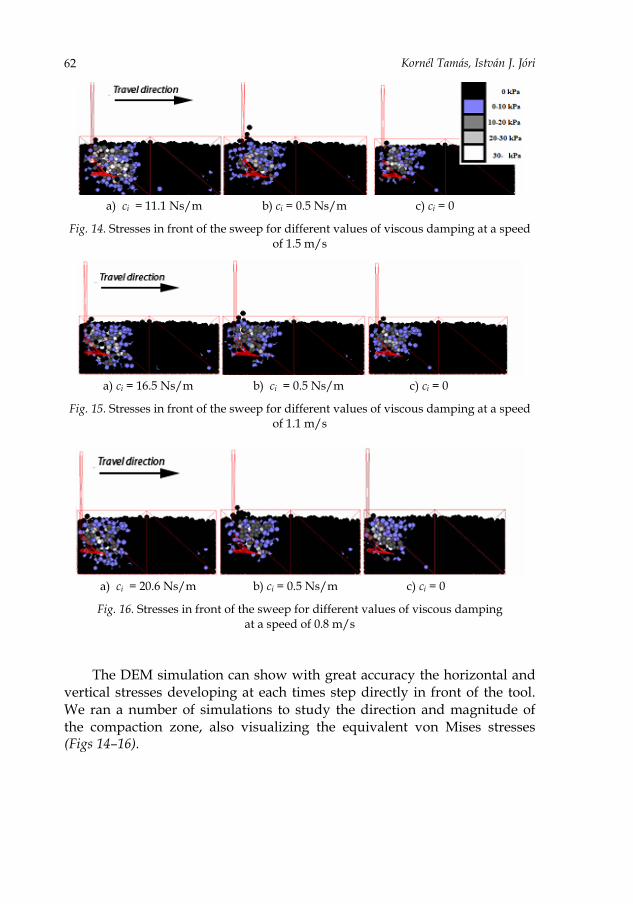
a) ci = 11.1 Ns/m b) ci = 0.5 Ns/m c) ci = 0
Fig. 14. Stresses in front of the sweep for different values of viscous damping at a speed of 1.5 m/s
a) ci = 16.5 Ns/m b) ci = 0.5 Ns/m c) ci = 0
Fig. 15. Stresses in front of the sweep for different values of viscous damping at a speed of 1.1 m/s
a) ci = 20.6 Ns/m b) ci = 0.5 Ns/m c) ci = 0
Fig. 16. Stresses in front of the sweep for different values of viscous damping at a speed of 0.8 m/s
The DEM simulation can show with great accuracy the horizontal and
vertical stresses developing at each times step directly in front of the tool. We ran a number of simulations to study the direction and magnitude of the compaction zone, also visualizing the equivalent von Mises stresses (Figs 14–16).

The Influence of the Soil Water Content in the Soil-Tool DEM Model
63
The cultivator sweep generates the compaction zone in front of the tool (Figs 14–16) and the ruptures and clods by moving through the soil. The simulation results contribute to a better understanding and analysis of the loosening process. The soil bin measurement and the DEM simulation showed a linear relationship between speed and required draft force (Fig. 17), which matches the results described in the literature (Saunders et al., 2000; Telischi et al., 1956; Rowe and Barnes, 1961).
During the soil–sweep interaction simulations, the relationship be-tween viscous damping factor and speed was as follows:
viscdamp[n,s] = –13.6 × tillage speed + 31.5. (6)
The normal and the shear component of viscous damping (ci) were as-
sumed to be identical. Viscous damping can not only be used for describing a sweep tool, but also for extending the model to other implement geome-tries and the entire spectrum of tillage speeds. In addition to analyzing the required draft force, we used the statically and dynamically validated model of the implement to also study the qualitative changes that occur in the soil structure. In the last step of dynamic validation, the value of the Young modulus used in the static test (Fig. 17a) was decreased from 1 MPa to 0.55 MPa (Kn: 1.73e4 N/m; Ks: 8.64e3 N/m, nk : 5e6 Pa/m, sk : 2.5e6 Pa/m, nσ : 2e4 Pa, τ : 1e4 Pa), resulting in the parallel draft force versus speed lines to coincide (Fig. 17b).
This change to the basic contact parameter was justified by the positive deviation simulated in the static validation of the shear tests.
a) b)Fig. 17. a) Validation of viscous damping (Ec = 1e6 Pa); b) result of the last step of
dynamic validation (Ec = 0.55e6 Pa) The test results prove that the soil–sweep interaction model built in the DEM system can be used to accurately analyze the phenomena occurring in the soil.
Kornél Tamás, István J. Jóri
64
The designed soil–tool model, together with the viscous damping set for the different speeds, could be used to simulate real-life soil bin meas-urements (draft force vs. speed) with an accuracy of 1–4% (Fig. 17b) in the range of tillage speeds (0.8–4.2 m/s) normally used in practice.
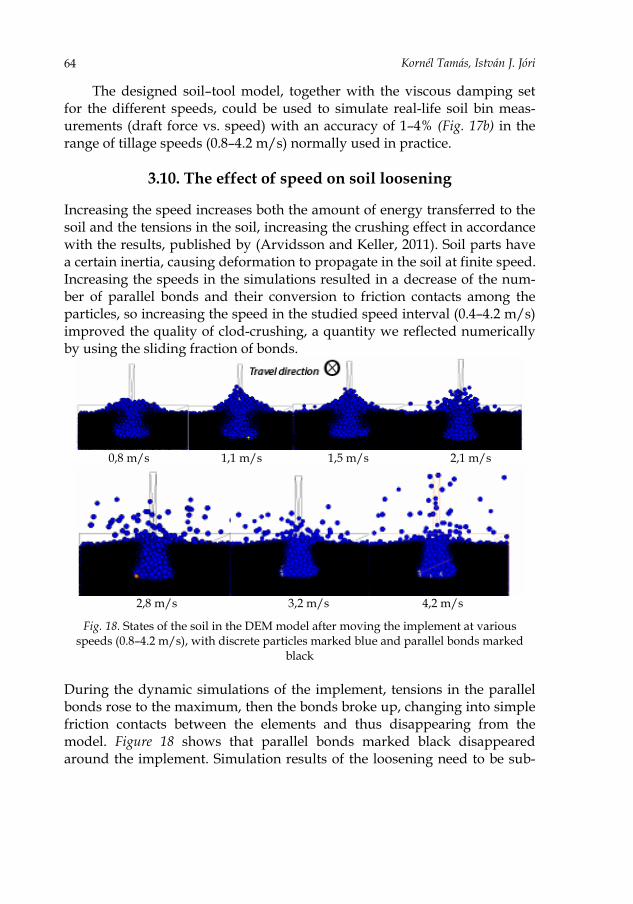
3.10. The effect of speed on soil loosening Increasing the speed increases both the amount of energy transferred to the soil and the tensions in the soil, increasing the crushing effect in accordance with the results, published by (Arvidsson and Keller, 2011). Soil parts have a certain inertia, causing deformation to propagate in the soil at finite speed. Increasing the speeds in the simulations resulted in a decrease of the num-ber of parallel bonds and their conversion to friction contacts among the particles, so increasing the speed in the studied speed interval (0.4–4.2 m/s) improved the quality of clod-crushing, a quantity we reflected numerically by using the sliding fraction of bonds.
0,8 m/s 1,1 m/s 1,5 m/s 2,1 m/s
2,8 m/s 3,2 m/s 4,2 m/s
Fig. 18. States of the soil in the DEM model after moving the implement at various speeds (0.8–4.2 m/s), with discrete particles marked blue and parallel bonds marked
black During the dynamic simulations of the implement, tensions in the parallel bonds rose to the maximum, then the bonds broke up, changing into simple friction contacts between the elements and thus disappearing from the model. Figure 18 shows that parallel bonds marked black disappeared around the implement. Simulation results of the loosening need to be sub-
The Influence of the Soil Water Content in the Soil-Tool DEM Model
65
jected to quantitative as well as qualitative analysis, i.e. the phenomena un-der the soil surface can also be examined. Similarities discovered during the tests add to the usability of the created model, making it possible, for exam-ple, to analyze soil surface elevation (Fig. 18). The snapshots taken at vari-ous speeds clearly show that bulldozing effect occurs in the damped speed range (0.5–1.5 m/s), appearing in the model as a set of particles pushed to the wall of the soil bin. At higher speeds (2.8–4.1 m/s), the energy scattering the particles increases (ci = 0). The increasing scattering is due to the energy conveyed by the increasing speed of the implement.
3.11. Effect of the validated dynamic soil–implement model on changes in soil state
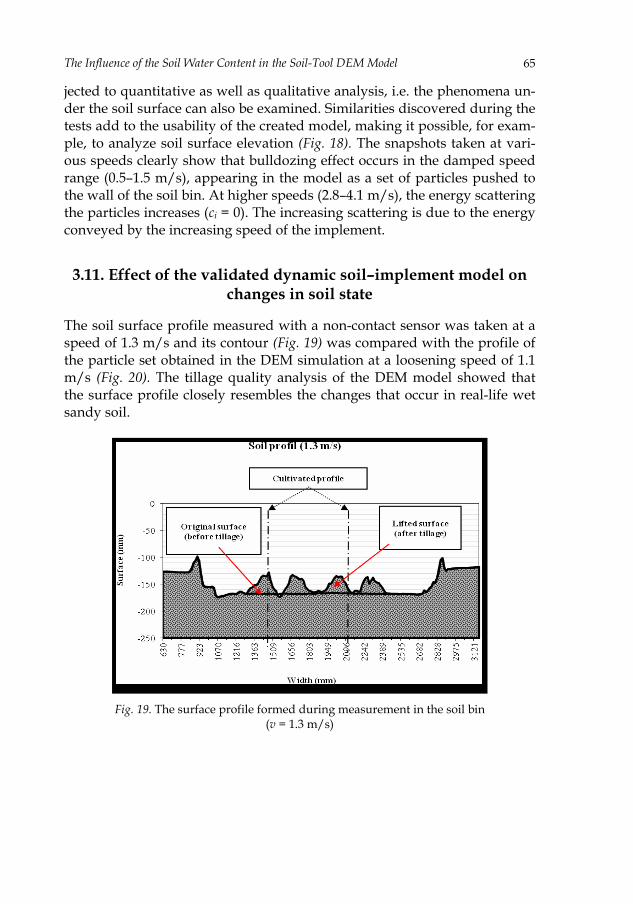
The soil surface profile measured with a non-contact sensor was taken at a speed of 1.3 m/s and its contour (Fig. 19) was compared with the profile of the particle set obtained in the DEM simulation at a loosening speed of 1.1 m/s (Fig. 20). The tillage quality analysis of the DEM model showed that the surface profile closely resembles the changes that occur in real-life wet sandy soil.
Fig. 19. The surface profile formed during measurement in the soil bin
(v = 1.3 m/s)
Kornél Tamás, István J. Jóri
66
X Y
Z
Fig. 20. The surface profile formed during DEM simulation in 1.5 m/s
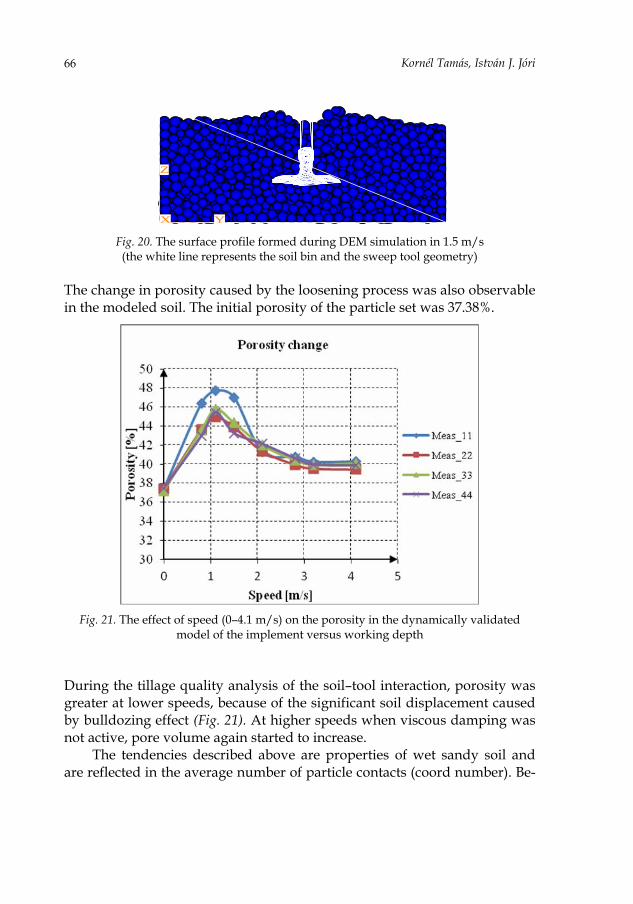
(the white line represents the soil bin and the sweep tool geometry) The change in porosity caused by the loosening process was also observable in the modeled soil. The initial porosity of the particle set was 37.38%.
Fig. 21. The effect of speed (0–4.1 m/s) on the porosity in the dynamically validated
model of the implement versus working depth During the tillage quality analysis of the soil–tool interaction, porosity was greater at lower speeds, because of the significant soil displacement caused by bulldozing effect (Fig. 21). At higher speeds when viscous damping was not active, pore volume again started to increase.
The tendencies described above are properties of wet sandy soil and are reflected in the average number of particle contacts (coord number). Be-

The Influence of the Soil Water Content in the Soil-Tool DEM Model
67
fore the simulation of soil loosening, a particle had an average of 6.23 con-tacts to other particles.
a) b)
Fig. 22. The effect of speed (0–4.1 m/s) on (a) the number of particle contacts and (b) on the number of sliding fractions (obtained using measurement spheres 1–4) in the
dynamically validated model of the implement The average number of particle contacts first decreased at low speeds,
then decreased again from a higher value in the non-damped speed range (Fig. 22a).
The sliding fraction represents the ratio of parallel bonds that changed to Coulomb friction state. The sliding fraction can be used to study the effect of speed on clod-crushing. The sliding fraction shows a definite increase across the entire speed range (0.5–4.1 m/s) regardless of damping (Fig. 22b).
In the deformation zone, the implement also crushes the soil. Crushing increases as the energy absorbed by the deformation zone increases. The energy transmitted to the soil at increasing speeds increases with the square of the speed (Sitkei, 1967).
4. Conclusions
During our research, we created a discrete element model suitable for studying the soil–sweep interaction during dynamic tillage. The results of direct shear box tests were used to validate the soil model obtained with the discrete element method.
Kornél Tamás, István J. Jóri
68
We found that high-precision conversion is possible between values of the micro and macro parameters applied in the direct shear box tests and the triaxial shear tests (DEM).
As shown by the simulated sensitivity tests performed on the soil–sweep interaction model, the draft resistance is significantly influenced by the friction coefficient, the porosity, and the tillage depth.
The model can also be used to analyze surface elevation, the resulting surface profile, and the clod-crushing effect of the sweep tool.
The developed soil–sweep interaction model uses viscous damping ( ) set for various speeds to simulate the measurement results of soil bin meas-urements (speed vs. draft force) with an accuracy of 1–4% within the 0.8–4.2 m/s speed range.
An accurate implement model combined with a soil model validated on the mechanical properties of real-world soil can be used to determine the required draft force and tillage quality of any implement with a high degree of accuracy. The static and dynamic validation methods of the developed model help decrease the need for expensive tests.
Acknowledgement
The authors gratefully acknowledge the assistance of the staff of the NAIK Hungarian Institute of Agricultural Engineering of Gödöllő for allowing the use of the soil bin testing facilities and providing the practical support dur-ing measurement.
References
Arvidsson, J., Keller, T., 2011. Comparing penetrometer and shear vane measurements
with measured and predicted mouldboard plough draught in a range of Swedish soils. Soil Tillage Res. 111, 219–223.
Balássy, 1992. A készülék alakjának, méretének és a figyelembe vett mérési pontok számának befolyása a csúsztatási mérések eredményére. Járművek Ép. És Me-zőgazdasági Gépek 39. évf., 281–284.
Chen, Y., Munkholm, L.J., Nyord, T., 2013. A discrete element model for soil–sweep in-teraction in three different soils. Soil Tillage Res. 126, 34–41. doi:10.1016/j.still.2012.08.008
Cundall, P.A., 1971. A computer model for simulation progressive large scale movement in blocky rock system. Proc Symp Int Soc Rock Mech Nancy 2.
Cundall, P.A., Hart, R.D., 1992. Numerical modelling of discontinua. Eng. Comput. 101–113.
The Influence of the Soil Water Content in the Soil-Tool DEM Model
69
Fielke, J.M., 1988. The Influence of the Geometry of Chisel Plough Share Wings on Till-age Forces in Sandy Loam Soil. Dep. Civ. Agric. Eng. Univ. Melb. Master Eng.
Franco, Y., 2005. Determination of discrete element model parameters for soil–bulldozer blade interaction. Master’s Thesis Agric. Eng. Tech.-Isr. Inst. Technol.
Glee-Clough, D., Wang, J., Kanok-Nukulchai, W., 1994. Deformation and Failure in Wet Clay Soil: Part 3, Finite Element Analysis of Cutting of Wet Clay by Tines. J Agric Eng Res 58, 121–131.
Hofstetter, K., 2002. Analytic method to predict the dynamic interaction of dozer blade with earthen material. Proc. 14th Int. Conf. ISTVS Vicksbg. MS USA.
Itasca, 1999. PFC2D theory and background manual. Itasca, C.G.I., 2008. PFC3D (Particle Flow Code in 3 Dimensions), Version 4.0. Minneapo-
lis: ICG. Kruyt, N.P., Rothenburg, L., 2001. Statistics of the elastic behaviour of granular materi-
als. Int. J. Solids Struct. 4879–4899. Liu Yan, Hou Zhi-Min, 1985. Three Dimensional Nonlinear Finite element Analysis of
Soil Cutting by Narrow Blades. Soil Dyn. Relat. Tillage Mach. Syst. Conference on Soil Dynamics, Auburn, Alabama, 322–337.
Matthew, R., Kuhn, M.A., Bagi, K., 2009. Specimen Size Effect in Discrete Element Simu-lations of Granular Assemblies. J. Eng. Mech. 135, 485–492.
Mouazen, A., 2002. Mechanical behaviour of the upper layers of a sandy loam soil under shear loading. J. Terramechanics 39, 115–126.
Mouazen, A.M., Nemenyi, M., 1999. Finite element analysis of subsoiler cutting in non-homogeneous sandy loam soil. Soil Tillage Res. 51, 1–15.
Mouazen, A.M., Neményi, M., Schwanghart, H., Rempfer, M., 1999. Tillage tool design by the finite element method: Part 2. Experimental validation of the finite element results with soil bin test. J. Agric. Eng. Res. 72, 53–58.
Ono, I., Nakashima, H., Shimizu, H., Miyasaka, J., Ohdoi, K., 2013. Investigation of ele-mental shape for 3D DEM modeling of interaction between soil and a narrow cut-ting tool. J. Terramechanics 50, 265–276. doi:10.1016/j.jterra.2013.09.001
Owen, D.R.J., Feng, Y.T., De Souza Neto, E.A., Cottrell, M., Wong, F., Andrade Pires, F.M., Yu, J., 2002. The modeling of multi-fracture solids and particulate media. Proc. Fifth World Congr. Comput. Mech. WCCN V Vienna Austria.
Rowe, R.J., Barnes, K.K., 1961. Influence of speed on elements of draft of a tillage tool. Trans. Am. Soc. Agric. Eng. 4, 55–57.
Sadek, M.A., Chen, Y., Liu, J., 2011. Simulating shear behavior of a sandy soil under dif-ferent soil conditions. J. Terramechanics 48, 451–458. doi:10.1016/j.jterra. 2011.09.006
Saunders, C., Godwin, J.R., O’Dogherty, M.J., 2000. Prediction of soil forces acting on mouldboard ploughs. Fourth Int. Conf. Soil Dyn. Adel. Aust.
Schöpfer, M.P.J., Abe, S., Childs, C., Walsh, J.J., 2009. The impact of porosity and crack density on the elasticity, strength and friction of cohesive granular materials: In-sights from DEM modelling. Int. J. Rock Mech. Min. Sci. 46, 250–261. doi:10.1016/j.ijrmms.2008.03.009
Sitkei, G., 1967. Mezőgazdasági gépek talajmechanikai problémái. Akadémiai kiadó, Bu-dapest.
Tamás, K., Jóri, I.J., Mouazen, A.M., 2013. Modelling soil–sweep interaction with discrete element method. Soil Tillage Res. 134, 223–231. doi:10.1016/j.still.2013.09.001
Kornél Tamás, István J. Jóri
70
Telischi, B., McColly, H.F., Erickson, E., 1956. Draft measurement for tillage tools. Agric. Eng. 37, 605–608, 617.
Tsuji, T., Nakagawa, Y., Matsumoto, N., Kadono, Y., Takayama, T., Tanaka, T., 2012. 3-D DEM simulation of cohesive soil-pushing behavior by bulldozer blade. J. Terra-mechanics 49, 37–47. doi:10.1016/j.jterra.2011.11.003
Ucgul, M., Fielke, J.M., Saunders, C., 2014. Three-dimensional discrete element model-ling of tillage: Determination of a suitable contact model and parameters for a co-hesionless soil. Biosyst. Eng. 121, 105–117. doi:10.1016/j.biosystemseng. 2014.02.005
Ucgul, M., Fielke, J.M., Saunders, C., 2013. 3D DEM tillage simulation. Part 2: Validation of a hysteretic spring (plastic) contact model for a sweep tooloperating in a cohe-sionless soil. Soil Tillage Res. doi:10.1016/j.still.2013.10.003
Upadhyaya, S.K., Rosa, U.A., Wulfsohn, D., 2002. Application of the finite element method in agricultural soil mechanics. Adv. Soil Dyn. ASAE St Joseph M 2, 117–153.
Wulfsohn, D., Adams, B.A., Fredlund, D.G., 1994. Triaxial testing of unsaturated agricul-tural soils. Am. Soc. Agric. Eng. Pap. No 94-1036 St Joseph MI ASAE.
Xie Xiao-Mi, Zhang De-Jun, 1995. An Approch to 3D Nonlinear FE Simulative Method for Investigation os Soil- Tool Dynamic System. Soil Dyn. Relat. Tillage Mach. Syst. International Conference on Soil Dynamics, Proceedings.
Yong, R.N., Hanna, A.W., 1977. Finite element Analysis of Plane Soil Cutting. J. Terra-mechanics Vol. 14, 103–125.
Zhang, R., Li, J.Q., Li, Y.W., 2003. Development of simulation on mechanical dynamic behavior of soil by distinct element method. Trans. Chin. Soc. Agric. Eng. 19, 9–16.