the influence of the macroeconomic factors as measured by ... · inflation(%) pdb (%) bi rate (%)...
TRANSCRIPT
IOSR Journal of Business and Management (IOSR-JBM)
e-ISSN: 2278-487X, p-ISSN: 2319-7668. Volume 20, Issue 5. Ver. V (May. 2018), PP 25-40
www.iosrjournals.org
DOI: 10.9790/487X-2005052540 www.iosrjournals.org 25 | Page
The Influence of The Macroeconomic factors As Measured by
Inflation, Interest (BI Rate) and GDP Growth, Market Share as
measured by the share of bank financing and Bank Health Level
measured by CAR, FDR, NPF, ROA to Return On Assets (ROA)
Islamic Banking in Indonesia
Zakizamani*1,Hermanto2,Rr.Sripancawatimartiningsih3 1Student of Magister of accounting,University of Mataram,Indonesia
2,3Lecturer of Magister of accounting,UniversityofMataram,Indonesia
CorrespondingAuthor:ZakiZamani
Abstract: This research was conducted to examine the influence of macroeconomic factors, as measured by
inflation, BI rate and GDP growth, market share as measured by the share of bank financing and the
characteristics measured by CAR, FDR, NPF, BOPO to Return On Assets (ROA) Islamic Banking in Indonesia.
Data used in this study was obtained from the Financial Report of Bank Indonesia publications, and bank
reports through the website. The samplingtechnique used was purposive sampling. The sample in this study 15
Islamic banks. Data analysis techniques used in this study is multiple regression analysis where previously the
data had been tested with the classical assumptions include normality test data, heteroscedasticity,
multicollinearity and autocorrelation.
During the period pangamatan research data shows that the normal distribution. Under the normality test,
multicollinearity, heteroscedasticity test, andtest variables autokorelasitidak found that deviate from the
classical assumptions.This shows the available data has been qualified using multiple linear regressionequation
model. The results of this study indicate that the variable inflation growthand, BI Rate, GDP growth and FDR
shows no significant impact on ROA. CAR and market share variables has a significant positive of ROA, while
NPF and BOPO variabels significant negative effect on ROA. Predictive ability of the eight variable onthe ROA
in this study amounted to 62,40%, while the rest is not influenced by other factors included in the research
model.
Keywords: Macroeconomics, Market Share, Characteristics of the Bank, Profitability, Regression
----------------------------------------------------------------------------------------------------------------------------- ----------
Date of Submission: 03-05-2018 Date of acceptance: 18-05-2018
----------------------------------------------------------------------------------------------------------------------------- ----------
I Introduction The Bank is a financial intermediary institution that channel funds from the surplus funds to the party
in need of funds (deficit units). Banks are also called the agency of trust. In addition to functioning as an agent
of trust bank also serves for the development of the national economy (agent of development) in order to
improve equity, economic growth, and national stability. In Indonesia the banking system used is a dual banking
system which operates two types of bank business namely syariah bank and conventional bank. Thus, the policy
taken by the government through Bank Indonesia is different for both types of banks. In sharia banks do not
recognize the system of interest, so the profit that can be sourced from the profit sharing with business actors
who use funds from Islamic banks and investment from Islamic banks themselves (Antonio, 2001).
The occurrence of monetary crisis in Indonesia since mid-1997 has an impact on the banking sector.
Monetary crisis resulted in the number of banks that experienced bad credit. This affects the investment climate
of the capital market in the banking sector either directly or indirectly. This affects the investment climate of the
capital market in the banking sector either directly or indirectly. According Pohan (2002), the monetary crisis in
Indonesia in general can be said is the impact of the weakness of the quality of the banking system. The
liberalization of the banking sector since 1988 has more implications for increasing quantity than the quality of
banking institutions, thus the efficiency and stability of banks is still far from being expected. This banking
condition encourages the parties involved in it to conduct an assessment of the health of the bank. One of the
parties who need to know the performance of a bank is the investor because the better the bank's performance
then the security guarantee of the funds invested is also getting bigger.

The Influence Of The Macroeconomic Factors As Measured By Inflation, Interest (BI Rate) And GDP
DOI: 10.9790/487X-2005052540 www.iosrjournals.org 26 | Page
One of the indicators used to measure profitability is Rerturn On Asset (ROA). ROA is important for
banks because ROA is used to measure the company's effectiveness in generating profits by utilizing its assets.
ROA is the ratio between profit after tax to total assets. The greater the ROA shows the better the company's
performance, because the rate of return (return) is greater (Husnan, 1998). Research on factors affecting bank
profitability is done by Demirguic-Kunt and Harry Huizinga. In his research Kunt and Huizinga prioritize macro
economic factors and financial structure of a State. Meanwhile, to know the internal performance of banks, used
variable characteristics of banks that contain size, bank financial ratios ranging from total financing, capital,
bank activity and productive assets. In addition Pratomo and Ghafar (2006) examined the relationship between
capital structure proxyed by DER on the performance of Islamic banks in Malaysia and the result there is a
significant influence.
The following is a table 1.1 which describes the macroeconomic effect on Return On Assets (ROA) in
sharia banking in Indonesia.
Table 1.1 Macroeconomic Condition and Performance of Sharia Banking Types of
Sharia Bank
Year ROA
(%)
INFLATION(%) PDB
(%)
BI RATE
(%)
Sharia Bank,
UUS, BPRS
2010 1,67 6,96 6,1 6,5
2011 1,79 3,79 6,5 6
2012 2,14 4,30 6,2 5,75
2013 2,00 8,38 5,8 7,5
2014 0.80 8,36 5,1 7,75
Source: Indonesia Economic Report BI and Banking Statistics
Sharia OJK, 2015
In Table 1.1 there are some data gaps that are not in accordance with existing theories, especially on
the effect of macroeconomic conditions on ROA. In 2013 inflation increased by 8.38% from the previous year at
4.30%. However, these conditions do not have a significant effect on Return On Assets (ROA) of sharia banking
which is still in the position of ROA of 2% compared to the previous year by 2.14%. The inflation rate in 2013
was 8.38% and in 2014 remained stable at 8.36% but the condition had a negative effect on the sharia bank's
ROA which decreased from 2% in 2013 to 0.80% in 2014. As an institution whose function primarily as
mediation, banks are very vulnerable to inflation risks associated with the mobility of funds so that inflation can
reduce the level of bank profitability. Rivai (2009) explains in his research that inflation lowers profitability
because it bears the burden of interest. From the above data, the increase of inflation did not significantly affect
the profitability of sharia banks and the stability of inflation caused the sharia banking ROA to decrease
significantly by 57% from the previous year by 2% to 0.80% in 2014. This is also contrary to the research of
Hasan Basher ( 2002) explaining that inflation has a negative effect on the profitability of sharia banks.
This banking condition encourages the parties involved to assess the bank's health ratio. One of the
parties who need to know the performance of a bank is the investor because the better the bank's performance
then the security guarantee of the funds invested is also getting bigger. By using financial ratios, investors can
know the performance of a bank. This is in accordance with Muljono's (1999) statement that comparison in the
form of ratios yields more objective figures, since the performance measurement is more comparable with other
banks or with the previous period. Banking performance can be reviewed from the level of bank soundness
measured by using financial ratios. The ratios used in this study are financing ratio (FDR), Risk financing
(NPF), and Efficiency ratio (BOPO) and Capital Ratio (CAR).
The following performance of sharia banking in 2010 to 2014 is related to bank soundness.
Table 1.2 Sharia Banking Performance Types of
Sharia Bank
Year ROA
(%)
CAR
(%)
NPF
(%)
FDR
(%)
BOPO
(%)
DPK
(Miliar)
PBY
(Miliar)
Sharia Bank,
UUS, BPRS
2010 1,67 16,25 3,02 89,67 80,59 76.04 68.181
2011 1,79 16,63 2.52 88,94 78,41 115.415 102.655
2012 2,14 14,13 2,22 100 74,97 147.512 147.505
2013 2,00 14,42 2,62 100,3 78,21 183.534 184.122
2014 0.80 16.10 4,33 91,50 79,28 217,858 199.330
Source: Sharia Banking Statistics OJK, 2015
Table 1.2 shows that the increase of CAR in 2014 by 16.10% compared to the previous year of 14.42%
has a negative effect on the ROA of sharia banks that is decreased from 2.00% to 0.80%. This study is in
accordance with research conducted by Limpaphayon and Polwiton (2004) but contrary to research conducted

The Influence Of The Macroeconomic Factors As Measured By Inflation, Interest (BI Rate) And GDP
DOI: 10.9790/487X-2005052540 www.iosrjournals.org 27 | Page
by Gelos (2006) and Suyono (2005) which shows a significant positive effect between CAR and ROA. One
indicator to see the progress of sharia banking industry in Indonesia is to see the growth maket share Islamic
banks. From the data in table 1.2 it can be seen that financing growth and deposits of syraiah banks continue to
increase from 2010 to 2014. In 2010 pembiyaan and DPK of sharia banks only amounted to 68.181 Trillion and
76.04 Trillion. The growth of sharia banking continues to increase every year until 2014 financing reaches
199,330 Trillion and DPK of 217,858 Trillion. In terms of market share, Islamic banks have a very small share
compared with conventional banks. In theory, the increase in market share should also be followed by an
increase in profitability. However, based on data from sharia banking statistics 2015 increase in the amount
pembiyaan cause decrease in ROA more than 50% compared with the previous year.
From the description of the problems faced by Islamic banks at this time and the difference of research results
then the research questions formulated as follows:
1. Are the macroeconomic conditions proportional to inflation, GDP and BI Rate affect the profitability of
sharia banking?
2. Is the bank's health ratio projected by CAR, NPF, FDR, and BOPO affect the profitability of sharia
banking?
3. Is the market share proportioned to sharia bank financing affect the profitability of sharia banks?
II Literature Review Keynesian Theory
Keynes's theory of inflation is based on his macro theory. According to Keynes inflation occurs
because a society wants to live beyond the limits of its economic capabilities. Thus the public demand for goods
exceeds the amount available. This happens because people know what they want and make the desire in the
form of demand for effective goods. Inflation affects the banking world as one of the financial institutions. As
an institution whose main function as mediation, banks are particularly vulnerable to inflation risks associated
with their funding mobility.
Structure Conduct Performance (SCP) Structure-Conduct-Performance (SCP) paradigm is a paradigm in industrial economics that is used to
link elements of market structure to the behavior and performance of an industry. Structur, refers to the market
structure typically defined by the ratio of market concentration. Where the ratio of market concentration is the
ratio that measures the distribution of market share in the industry. Conduct, is a corporate behavior in the
industry. This behavior is comparative or collusive, such as price fixing, advertising, production, and predation.
While performance or performance is a measure of social efficiency that is usually defined by the ratio of
market power (where the greater the market power the lower the social efficiency). In the theory of Structure
Conduct Performance (SCP) where it is believed that the market structure will affect the performance of an
industry. This flow is based on the assumption that the market structure will affect the performance of the
company in aggregate (Gilbert, 1984). From a business competition point of view, a concentrated market
structure tendsto lead to various unhealthy business competition behaviors in order to maximize profit.
Companies can maximize profits due to market power, something that is common for companies with dominant
market share.
Profitability
Management is the main factor affecting bank profitability. All bank management, including capital
management, asset quality management, general management, profitability management and liquidity
management will ultimately affect and lead to profitability in banking companies (Payamta, Machfoedz, 1999).
According Siamat (1995), profitability ratios are used to measure the effectiveness of banks in obtaining profit.
Besides can be used as a measure of financial health, these profitability ratios are very important to observe
given the adequate benefits needed to maintain the flow of capital sources. This profitability analysis technique
involves the relationship between certain items in the profit and loss statement to obtain measures that can be
used as indicators to assess the efficiency and ability of the bank to make a profit. Therefore, this analysis
technique is also called income statement analysis.
III Hypotesis Macroeconomic Influence On Profitability
In the conventional financial system there is no link between the monetary sector and the real sector.
Monetaryization of all assets and economic activities controlled by interest-based transactions is one of the
reasons people demand money for speculative motives and the tendency to abandon transaction motives has
become a globalized phenomenon so that the development of the monetary sector away from the real sector.

The Influence Of The Macroeconomic Factors As Measured By Inflation, Interest (BI Rate) And GDP
DOI: 10.9790/487X-2005052540 www.iosrjournals.org 28 | Page
In Islamic banking there must be an entanglement and a balance between the monetary sector and the
real sector. The monetary sector should not walk alone leaving the real sector. Attachment to syariah contracts is
absolute, then on the asset side there will be no change in the margin even if the interest change, because the
selling price has been agreed upon at the beginning of the contract. While in financing contracts such as
mudharabah and musyarakah, revenue sharing of banks will be greatly influenced by the performance of the real
sector.
According to Choudury (2007) an expert on Islamic economics suggests the amount of money in
circulation should be associated with the real sector or in accordance with the needs of this sector, so that the
growth of money supply equal to output growth. In contrast to the interest system, where money supply is far
above the real sector, this also makes instability in the price of money that invites speculation in money demand.
Economic growth with these characteristics leads to very fragile economic growth or commonly referred to as
the bubble growth economy.
The income of Bank Islam is not interest, therefore this system will not directly deal with negative
spreads such as conventional banks. Bank Islam's main revenues are focused on how much banks can raise the
profits from investments in the real sector.
The statement is in accordance with the basic concept of Islamic economics that does not regard money
as a commodity and not recognize time value of money. However (Rivai, 2009) explains the economic
development of Islam, especially about inflation. Although theoretically inflation has no effect but in fact
inflation has also impacted on sharia banking especially in the last 2 years. According to his theory that inflation
directly does not affect the absence of the concept of interest and time value of money, but so indirectly still
affect the profitability. This is related to bank investment in the real sector is also not free from the impact of
inflation. With so inflation still affect the profitability of banks only different levels and ways of influencing.
Research Unche (1996) and Ogewewo (2006) states that the relationship between profitability and
inflation is negative and very influential on the banking world. While research conducted (Naceur, 2005)
contradict with both studies. According to him, inflation has no significant effect on bank profitability,
especially in Tunisia.Research from Athanasoglou, Brissinis ett all (2008), states that GDP per capita has no
significant effect on increasing net interest margin if this variable is included in the profitability equation.Unlike
the study Williams (2003), states that GDP Growth, affect the level of bank profitability. Study conducted in
Australia against foreign banks in the country. The result of GDP growth The country where the operation of
foreign banks, in this case Australia, has a significant influence.
Bank Indonesia has the duty to maintain monetary stability among others through interest rate instruments in
open market operations. Monetary policy through the implementation of interest rates that are too tight, will
tend to be deadly economic activity. Vice versa. The increase in BI rate resulted in tight banking liquidity, so
that the bank difficulty getting cheap funds from third parties (demand deposits, savings deposits, deposits).
This resulted in the cost of funds of banks increased / high. As a result, when there is a high increase in loan
interest, the value of the customer's business is no longer proportional to the financing provided. If the customer
has already started to object to a high interest rate then it will raise the possibility of bad credit. This theory is
supported by Oktavia (2009) which states interest rates have a positive effect on ROA.Hypothesis formulated:
- H1a1: Inflation growth negatively affects the profitability of sharia banks
- H1a2: GDP growth positively affects the profitability of sharia banks
- H1a3: Interest rates have a positive effect on the profitability of sharia banks
Market Share to Profitability
Market share shows the strength of a company against its competitors. According to the theory of
Structure Conduct Performance (SCP) market share makes the company has a better performance which further
impact on profitability (Ariyanto, 2004).
Several studies on profitability were measured using market share variables. Several US studies have
found that efficiency is the dominant variable in explaining the profitability of banks in the US (William, 1994).
Gary Whalen (1987) examines factors affecting the profitability of banks in non-metropolitan statistical areas in
the states of Ohio and Pensylvania. Regression results indicate that market share as measured by market funds
has a significant positive relationship to bank profitability. Profitability relationship with bank market share was
also investigated by Schuster (1984) and the result there was no positive relationship between market share and
profitability.
According to Shepherd (1982) in the theory of market power states that only companies that have large
market share and differentiated products that can apply market control will obtain supernormal profit. From
research conducted by Gary Whalen (1987) and Shepherd (1982) on the influence of market share on
profitabiltas showed a positive relationship.
From this study, hence in this research formulated hypothesis as follows:

The Influence Of The Macroeconomic Factors As Measured By Inflation, Interest (BI Rate) And GDP
DOI: 10.9790/487X-2005052540 www.iosrjournals.org 29 | Page
- H2: The share of financing positively affects the profitability of sharia banks
Influence of Bank Health Ratio To Profitability
Factors that influence a banking company's management decision is to look at internal factors and
external factors. Internal factors can be attributed to policy making and bank operational strategies such as
decisions related to bank capital, financing and risk management. While external factors (factors that come from
outside the company), include monetary policy, exchange rate fluctuations, and inflation rate, interest rate
volatility, and innovation of financial instruments (Siamat, 2005)
Indicators used in this bank's ratios include CAR, FDR, NPF, and BOPO. There has been a lot of
research done on these variables but the results are different from each other. The research of Limpaphayom and
Polwitoon (2004) showed different results from Gelos (2006), Suyono (2005), Williams (1998), Hasan and
Bashir (2003).
Rivai (2009) explains that in the existing banking theory concepts the influence of each variable is
different from each other. CAR in the bank is very good if the value is above 8%, for FDR the higher the value
is also better if the range of 80% to 110%. As for BOPO and NPF the effects tend to be negative if associated
with profitability.
Research on the characteristics of banks in this case is indicated by CAR, FDR shows a negative
influence between CAR and ROA. (Limpaphayom and Polwitoon, 2004). However, Limpaphayom and
Polwitoon (2004) research is contradictory to the research conducted by Gelos (2006) and Suyono (2005) which
shows a significant positive effect between CAR and FDR with ROA. Non Performing Loans (NPLs) studied by
Limpaphayom and Polwitoon (2004), show that NPLs have a positive effect on ROA. The result of
Limpaphayom and Polwitoon (2004) study is contradictory to the Gelos (2006) study which showed a
significant negative effect of NPL on ROA.
Research conducted Mawardi 2005, concluded that BOPO negatively affect the performance of banks
proxied with ROA. This shows that the greater the ratio of total operational costs to operating income will result
in lower ROA.Given the differences in the results of these studies and the theory of banking, it is necessary to
review the factors that affect the profitability of banks. The difference of this research with the previous research
is the object of research using syariah bank which apply free interest based system.
In table 1.2 shows that the increase of CAR in 2014 amounted to 15.75% compared to the previous
year of 14.42% have a negative effect on ROA on sharia banks that is down from 2.00% to 0.85%. This study is
in accordance with research conducted by Limpaphayon and Polwiton (2004) but contrary to research conducted
by Gelos (2006) and Suyono (2005) which shows a significant positive effect between CAR and ROA.
- H3a2: FDR adversely affects the profitability of sharia banks.
The results of research on LDR studied by Limpaphayom and Polwitoon (2004) showed a negative
influence between LDR on ROA. The results of Limpaphayom and Polwitoon (2004) study were contradictory
to Gelos (2006) and Suyono (2005) studies which showed a significant positive effect between LDR and ROA.
Table 1.2 shows FDR decline in 2014 of 91.90% causing a decrease in ROA by 0.85%.
- H3a1: CAR positively affects the profitability of sharia banks.
NPL is a ratio that indicates the degree of collectability of the funds already disbursed. The higher the
level of Non Performing Loan (NPL) or in terms of non-performing banking (NPF) sharia banking performance
is worse and profitability is low. Non Performing Loans (NPLs) studied by Limpaphayom and Polwitoon
(2004), show that NPLs have a positive effect on ROA. The result of Limpaphayom and Polwitoon (2004) study
is contradictory to the Gelos (2006) study which showed a significant negative effect of NPL on ROA. In table
1.2 shows the increase in NPF in 2014 amounted to 4.33% resulting in a decrease in ROA of 0.85%
- H3a3: NPF negatively affect the profitability of sharia banks.
BOPO is a ratio that shows the bank's ability to run its operations in an efficient manner. The existing
theory explains that the relationship between BOPO and ROA is inversely proportional. The standard rate for
BOPO ratio is below 90% (PBI), if the ratio of BOPO generated by a bank is more than 90%, it can be
concluded that the bank is inefficient in carrying out its operations. Research conducted by Mawardi (2005),
concluded that BOPO had an effect negative impact on bank performance proxyed by ROA. In table 1.2 shows
the increase in BOPO in 2014 by 94.16% causing a decrease in ROA by 0.80%
- H3a4: BOPO negatively affects the profitability of sharia banks.
IV Research Method
1.1. Types of research
The Influence Of The Macroeconomic Factors As Measured By Inflation, Interest (BI Rate) And GDP
DOI: 10.9790/487X-2005052540 www.iosrjournals.org 30 | Page
The type of research conducted is associative research that aims to determine the relationship between
two or more variables (Siregar, 2014: 15) with a causal relationship (causal). The causal relationship represents
a relationship between two or more variables (Siregar, 2014: 24). The type of data used in this study is
quantitative data that is the financial statements of Islamic banks in Indonesia.
1.2. Population and Sample
This study uses the entire population of sharia banks in Indonesia until December 2014. The total
number of sharia banks that exist is 196 banks include 12 sharia commercial banks, 22 units of sharia business,
and 162 shariah BPR. The following is a detailed table on the population of sharia banks:
Table 3.1 Population
Bank Group Center Office
Sharia of Banks 12
Sharia Business Units 22
Sharia Rural Banks 162 TOTAL 196
Source: Sharia Banking Statistics OJK, 2015
Of the total population above is used purposive sampling technique to select the sample that will be
used in this research. The reason for using this method is because of limited data access from the researcher so
that not all bank data can be accessed. Terms of the bank to be sampled are as follows:
1. Has submitted the financial statements and published by Bank Indonesia in the period 2010-2014.
2. For UUS having separate financial statements from its parent bank
3. For BPR sharia, has published the financial report 2010 - 2014.
Of these three conditions, the filtered to be sampled a number of 16 banks. The data used is quarterly
data for four years in the period 2010 - 2014. From the number of samples of 16 companies then the point of
observation can be determined a number of 240 points
1.3. Types and Sources of data
The type of data used in this study is the type of secondary data, ie research data obtained indirectly or
through intermediary media in the form of annual reports published from the period January 2010 to December
2014. In addition, other secondary data used comes from Journal, Thesis and Business Magazine.
1.4. Data Collection Techniques
Data collection techniques used in this study is the documentation technique is the way of data
collection by taking data that has been processed by certain institutions and in this study the institutions that
provide the data are Bank Indonesia and the Financial Services Authority.
3.5. Research Variables and Operational Definition
This study uses two variables, namely independent variables (independent) and dependent variables
(dependent). The independent variables in this research are inflation rate, interest rate, GDP, share of financing,
CAR, NPF, FDR, and BOPO. The only dependent variable in this study is the profitability of sharia banks. The
following describes the operational definitions of each variable.
3.5.1 Independent Variables
This study uses several independent variables in the form of financial variables in the form of financial
ratios are:
1. Inflation Growth
Inflation is a presentation of the speed of rising prices in a given year. Or in other words a decline of
the value of the prevailing currency (Rivai, 2009). Inflation provided in Bank Indonesia and Central Bureau of
Statistics consist of monthly inflation data. In this research use quarterly data inflation growth. Therefore
inflation is calculated based on the average growth of inflation per three months. More detailed calculations
used in this study as follows:
Growth Inflation = inflation TW0 - inflation TW1
2. GDP growth (Gross Domestic Product)
Understanding GDP (Gross Domestic Product) is the output of production in an economy by not taking
into account the owner of the factors of production and only calculate the total production in an economy alone
(Khizer, 2009). GDP growth is measured by comparing the GDP of time period t with GDP of time t-1. The data

The Influence Of The Macroeconomic Factors As Measured By Inflation, Interest (BI Rate) And GDP
DOI: 10.9790/487X-2005052540 www.iosrjournals.org 31 | Page
used is quarterly growth in accordance with other data used. Direct data is taken from BPS growth of GDP. The
data provided is in the form of quarterly data. GDP can be calculated by the formula (BPS 2008): GDP growth:
GDP t0- GDP t1
3. Interest Rate
BI Rate is the interest rate of Bank Indonesia policy which become the reference of interest rate in
money market, such as deposit interest rate, inter money market interest rate (PUAB) and loan interest rate in
2010-2014 as determined by Bank Indonesia and expressed in percentage . Thus, the BI rate used is the data of
interest rate recorded and issued by Bank Indonesia every 3 months.
4. Financing Share
What is meant by the share of financing here is the comparison between the amount of financing
disbursed by sharia banks with the amount of credit disbursed by national Sharia banks in general. This ratio
will also show the relative efficiency of sharia banks towards national Sharia banks in general (Bank Indonesia,
2009).
Share of Financing = Total Financing of Sharia Bank x 100%
Total Financing of Bank Syariah Indonesia
5. CAR
Capital adequacy ratio is a comparative of its own capital with tertibang asset according to risk owned (Kuncoro
and Suhardjono, 2002). Own capital used in this study refers to the book Susilo (2000) and slightly modified in
accordance with the book Islamic banking Muhamad (2005). Own capital includes paid up capital, share
premium, reserves, retained earnings, as well as complementary capital including quasi capital and subordinated
loans of up to 100% of core capital. As for the weight of bank risk is almost the same as conventional banks
where the lowest risk is cash in hand (0%) and the highest is financing to other parties and securities issued by
private (100%).Here's the formula for capital adequacy ratio:
CAR = Own Capital x 100%
ATMR
6. Non Performing Finance (NPF)
Non Performing Finance (NPF) is the level of risk faced by banks. NPF is a bad credit amount and may
not be billed. The greater the NPF value the worse the bank's performance (Muhamad, 2005).
NPF = Total of Non-Performing Financing x 100%
Total Financing
7. Financing to Deposit Ratio
FDR (Financing to Deposit Ratio) is an indicator of bank liquidity in which this variable is measured
by comparing the total financing disbursed with the total public savings funds collected. This ratio is also called
banking ratio.
Here is the formula for measuring financing to deposit ratio (Muhamad, 2005):
FDR = Amount Financed x 100%
Total Deposit
This ratio states how far the ability of banks to repay the withdrawal of funds made by depositors by relying on
credit / financing given as liquidity. The higher the ratio gives an indication of the lower ability of the bank
concerned. This is because the amount of funds needed for financing becomes greater.
8. BOPO
Is a ratio that shows the efficiency of a bank's operations. BOPO compares the bank's operational costs with the
Bank's Operating Income (Dendawijaya, 2005).
The BOPO formula is as follows:
BOPO = Operational Cost x 100 %
Operating Income
3.5.2. Dependent Variables
In this research use dependent variable Return on Asset. Return on assets illustrates the bank's ability to generate
net income through the use of a number of bank assets (Husnan, 1998).
ROA = Profit Before Taxx 100%
Total Asset

The Influence Of The Macroeconomic Factors As Measured By Inflation, Interest (BI Rate) And GDP
DOI: 10.9790/487X-2005052540 www.iosrjournals.org 32 | Page
The choice of ROA to measure profitability is to know the performance of the asset in printing profit.
That is, how many capabilities per Rp. 1.00 assets owned by the bank in printing profit so that it can be assessed
efficiency of bank performance in rotating its assets.
3.6. Data analysis technique
This study uses a quantitative approach. Analyzer used in this research is multiple linear regression
analysis. This method describes a relationship where one or more variables (independent variables) affect other
variables (dependent variable).
Based on the purpose of this research, the method of data analysis used in this study consists of several steps as
follows, among others:
1. Test of Classical Assumption Diversion
Classical assumption testing is performed to ensure that autocorrelation, multicollinearity, and
heterocedasticity are not present in this study or the resulting data is normally distributed (Ghozali, 2001). If it is
not found then the classical assumption of regression has been fulfilled. Testing this classical assumption
consists of:
a) Normality test
This normality test aims to determine whether the data used has been normally distributed. This test
can be done by using statistical analysis that is through Skweeness value of descriptive statistic where if the
statistical value of Skweeness is near zero then the data in this research has been normally distributed and also
through normal graph analysis probability plot where the line depicting the real data will follow the diagonal
line.
b) Heteroscedasticity testing
This test aims to see the spread of data. This test can be done by looking at the plot graph between the
independent variable predictor value (ZPRED) with its residual (SRESID). If the graph does not exist certain
patterns are regularly identified there is no heteroscedasticity.
c) Multicollinearity test
Multicollinearity test aims to test whether the regression model found a correlation between independent
variables. A good regression model should not be correlated between independent variables. The results of this
test can be seen from the Variance Inflation Factor (VIF) value with the VIF equation = 1 / tolerance. If the VIF
value is less than 10 then there is no multicollinearity.
d) Autocorrelation test
This test is used to test the classical assumption of regression related to the presence of autocorrelation.
This test uses Durbin - Watson (DW test) model. If the DW value lies between the upper bound (du) and (4 - du)
means it meets the classical assumption of regression or means there is no autocorrelation.
2. Model testing with multiple linear regression analysis techniques
In this study using multiple linear regression method (multiple linier regression method). In the regression
analysis, in addition to measuring the strength of the relationship between two or more variables, it also shows
the direction of the relationship between the dependent variable with the independent variable.
The form of the equation is as follows:
Y = a + b1x1 + b2x2 + b3x3 + b4x4+ b5x5 + b6x6 + b7x7+
b8x8 + E
Dimana, Y = = Profitabilitas
A = Constanta
b1 – b7 = koefisien regresion each of variable
X1 = Inflation
X2 = GDP X3 = Interest rate (BI Rate)
X4 = Market Share
X5 = CAR X6 = FDR
X7 = NPF
X8 = BOPO

The Influence Of The Macroeconomic Factors As Measured By Inflation, Interest (BI Rate) And GDP
DOI: 10.9790/487X-2005052540 www.iosrjournals.org 33 | Page
E = error term atau residual
Hypothesis testing
1. Partial influence test of Independent Variables (Test statistic t)
The t test is aimed at knowing whether there is a significant relationship (influence) between one
independent variable individually or partially in explaining the dependent variable version with the condition
that the other independent variable is considered fixed (Ghozali, 2012: 84). The t test decision criterion is
performed by looking at the significant probability values of the relationships among the variables found in the
SPSS output. If the probability value is significant t less than 0.05 or t count> table, then it can be said that there
is a significant partial influence between the independent variable and the dependent variable (Ghozali, 2012:
85).
The purpose of this test is to find out whether each independent variable influences the dependent variable
significantly. Testing is done by t test or t-test, that is compare between t-count with t-table. This test is
conducted on condition:
If -t table <t arithmetic <t table, then H0 accepted that the independent variable has no effect on the
dependent variable
If t arithmetic> t table or -t count> - t table, then H0rejected which means independent variables have a
significant effect on the dependent variable.
Testing can also be done through observation of significance value t at the level of α used (this study used a
rate of αsebesar 5%). The analysis is based on the comparison between the significance value t with a
significance value of 0.05, where the conditions are as follows:
If significance t <0.05 then H0 rejected, which means independent variables have a significant effect on the
dependent variable
If significance t> 0.05 then H0 accepted that the independent variable has no effect on the dependent
variable.
2. Coefficient of Determination
The calculation of the coefficient of determination (R ^ 2) illustrates or shows the level of model
capability that includes the independent variable in explaining the variation of the dependent variable. The value
of determination coefficient is between 0 and 1. The small value of R ^ 2 means that the ability of the
independent variables to explain the dependent variable is very limited. A value close to one means the
independent variables provide almost all the information needed to predict the dependent variables. Calculation
coefficient of determination will be used and tested in test F. The formula calculation as follows (Ghozali, 2012:
83):
`𝑅2 = 1 - ∑𝑒12
∑𝑦12
R ^ 2 = Coefficient of determination
e = Residual or error
y = data
3. Test the simultaneous influence of independent variables (Test staticic F)
The statistical test F basically shows whether all independent or independent variables included in the model
have a mutual influence on the dependent or dependent variable (Ghozali, 2012: 98). Here is the statistical test
formula F to simultaneously test independent variables with the dependent variable.
F𝑘−1,𝑛−𝑘 ,𝛼 =𝑅2− / (𝑘−1)
1− 𝑅2 𝑛−𝑘
K = Number of variables
N = Number of data or embedding
R ^ 2 = Coefficient of determination
The provisions used in the F test are as follows:
a. If probablility significance> 0.05 and F arithmetic <F table then Ho accepted and Ha rejected
b. If the probability significance <0.05 and F arithmetic> F table then Ho is rejected and Ha accepted
V. Research Result
5.1. Data Anaysis
5.1.1 Descriptive Statistik
Descriptive statistics in this study refer to the mean (average) value and standard deviation, minimum
and maximum value and from all variables in this study are the growth of Inflation (X1), interest rate (X2), GDP
The Influence Of The Macroeconomic Factors As Measured By Inflation, Interest (BI Rate) And GDP
DOI: 10.9790/487X-2005052540 www.iosrjournals.org 34 | Page
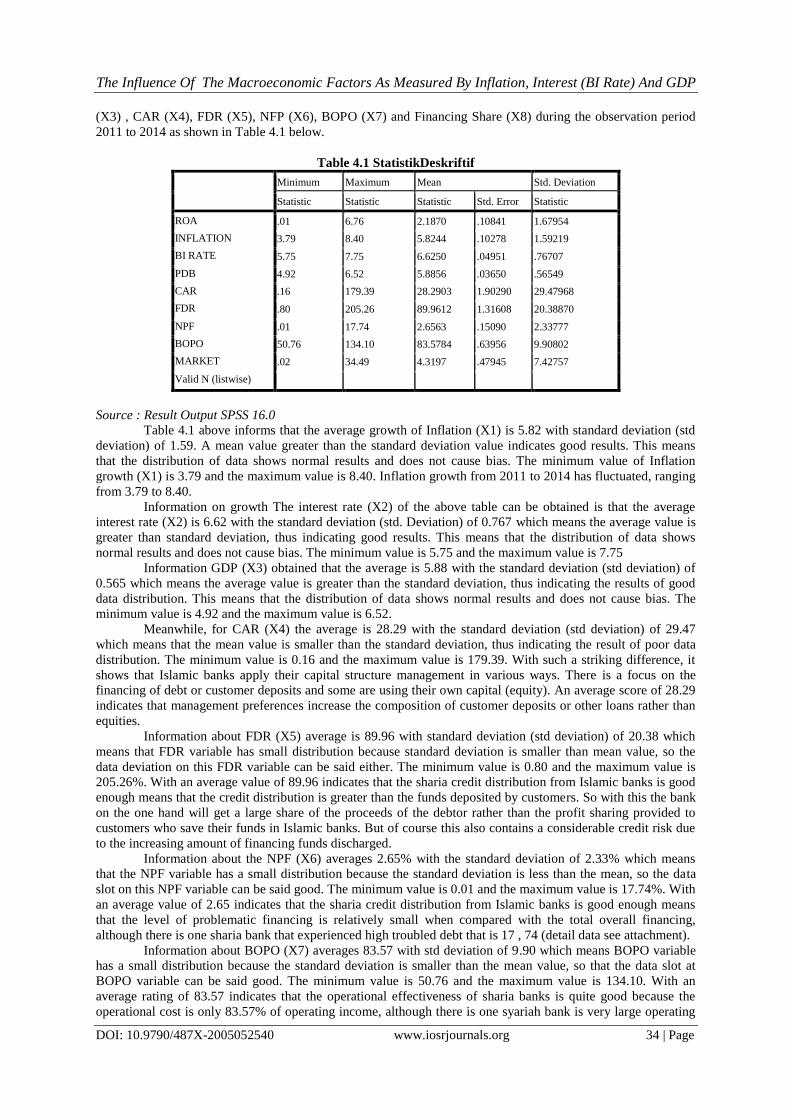
(X3) , CAR (X4), FDR (X5), NFP (X6), BOPO (X7) and Financing Share (X8) during the observation period
2011 to 2014 as shown in Table 4.1 below.
Table 4.1 StatistikDeskriftif
Minimum Maximum Mean Std. Deviation
Statistic Statistic Statistic Std. Error Statistic
ROA .01 6.76 2.1870 .10841 1.67954
INFLATION 3.79 8.40 5.8244 .10278 1.59219
BI RATE 5.75 7.75 6.6250 .04951 .76707
PDB 4.92 6.52 5.8856 .03650 .56549
CAR .16 179.39 28.2903 1.90290 29.47968
FDR .80 205.26 89.9612 1.31608 20.38870
NPF .01 17.74 2.6563 .15090 2.33777
BOPO 50.76 134.10 83.5784 .63956 9.90802
MARKET .02 34.49 4.3197 .47945 7.42757
Valid N (listwise)
Source : Result Output SPSS 16.0
Table 4.1 above informs that the average growth of Inflation (X1) is 5.82 with standard deviation (std
deviation) of 1.59. A mean value greater than the standard deviation value indicates good results. This means
that the distribution of data shows normal results and does not cause bias. The minimum value of Inflation
growth (X1) is 3.79 and the maximum value is 8.40. Inflation growth from 2011 to 2014 has fluctuated, ranging
from 3.79 to 8.40.
Information on growth The interest rate (X2) of the above table can be obtained is that the average
interest rate (X2) is 6.62 with the standard deviation (std. Deviation) of 0.767 which means the average value is
greater than standard deviation, thus indicating good results. This means that the distribution of data shows
normal results and does not cause bias. The minimum value is 5.75 and the maximum value is 7.75
Information GDP (X3) obtained that the average is 5.88 with the standard deviation (std deviation) of
0.565 which means the average value is greater than the standard deviation, thus indicating the results of good
data distribution. This means that the distribution of data shows normal results and does not cause bias. The
minimum value is 4.92 and the maximum value is 6.52.
Meanwhile, for CAR (X4) the average is 28.29 with the standard deviation (std deviation) of 29.47
which means that the mean value is smaller than the standard deviation, thus indicating the result of poor data
distribution. The minimum value is 0.16 and the maximum value is 179.39. With such a striking difference, it
shows that Islamic banks apply their capital structure management in various ways. There is a focus on the
financing of debt or customer deposits and some are using their own capital (equity). An average score of 28.29
indicates that management preferences increase the composition of customer deposits or other loans rather than
equities.
Information about FDR (X5) average is 89.96 with standard deviation (std deviation) of 20.38 which
means that FDR variable has small distribution because standard deviation is smaller than mean value, so the
data deviation on this FDR variable can be said either. The minimum value is 0.80 and the maximum value is
205.26%. With an average value of 89.96 indicates that the sharia credit distribution from Islamic banks is good
enough means that the credit distribution is greater than the funds deposited by customers. So with this the bank
on the one hand will get a large share of the proceeds of the debtor rather than the profit sharing provided to
customers who save their funds in Islamic banks. But of course this also contains a considerable credit risk due
to the increasing amount of financing funds discharged.
Information about the NPF (X6) averages 2.65% with the standard deviation of 2.33% which means
that the NPF variable has a small distribution because the standard deviation is less than the mean, so the data
slot on this NPF variable can be said good. The minimum value is 0.01 and the maximum value is 17.74%. With
an average value of 2.65 indicates that the sharia credit distribution from Islamic banks is good enough means
that the level of problematic financing is relatively small when compared with the total overall financing,
although there is one sharia bank that experienced high troubled debt that is 17 , 74 (detail data see attachment).
Information about BOPO (X7) averages 83.57 with std deviation of 9.90 which means BOPO variable
has a small distribution because the standard deviation is smaller than the mean value, so that the data slot at
BOPO variable can be said good. The minimum value is 50.76 and the maximum value is 134.10. With an
average rating of 83.57 indicates that the operational effectiveness of sharia banks is quite good because the
operational cost is only 83.57% of operating income, although there is one syariah bank is very large operating

The Influence Of The Macroeconomic Factors As Measured By Inflation, Interest (BI Rate) And GDP
DOI: 10.9790/487X-2005052540 www.iosrjournals.org 35 | Page
costs because it already exceeds the operating income of 134, %. This condition occurred in PaninSyariah bank
in March 2011 but in 2012 until the year 2014 normal returns in the range of 60% to 88%.
Furthermore, for financing share (X8) it is obtained that the average is 4.31 with the standard deviation
(std deviation) of 7.42 which means the average value is smaller than standard deviation, thus indicating the
result of poor data distribution. The minimum value of 0.02% (in this case is the share of financing from BPRS
BuanaMitra and BPRS HartaInsanKarimah - see attached data) and its maximum value of 34.49 (in this case is
the share of financing from Bank SyariahMandiri - see attached data ). With an average rating of 4.31 this shows
that the average level of financing of the entire Islamic bank is not large and uneven range is also shown with
the difference in the minimum value and maximally far striking. Therefore, a more creative and aggressive
market financing and market expansion strategy of sharia banks is needed.
The last descriptive statistic statistic, the average ROA (Y) is 2.18 with the standard deviation (std
deviation) of 1.68% which means that the ROA variable has a small distribution because the standard deviation
is smaller than the mean value (mean) , so the data deviation on this ROA variable can be said good. The
minimum value is 0.01 and its maximum value is 6.76. With an average value of 2.18 this shows that the
profitability of sharia banks is quite small because the company's net profit is only 2% of its total assets,
although there is one syariah bank whose ROA value is 6.76 and even the lowest by 0.01%. However, this
overall value is quite good because there is no syariah bank that became the sample of this study is a loss.
5.1.2. Classic Assumption Test
Before Before testing hypothesis with F test and t test first test deviation of classical assumption. This
test is conducted to test the validity of the results of multiple linear regression analysis. The test used is the
Normality Test, Autocorrelation Test, multicollinearity test, and heteroscedasticity test.
a. Normality Test
Normality test aims to test whether in the regression model, dependent variables and independent variables both
have a normal distribution or not. A good regression model is to have normal or near-normal data distribution.
To test the normality of data used digram Plot Normal P- P. Normality test results can be shown in the following
figure:
Table. 4.1. Normal P-P Plot
In addition to the normality test using the Plot Normal P-P diagram can also use the One Sample Kolmogorov-
Smirnov test. Here are the test results :
Table 4.2.One-Sample Kolmogorov-Smirnov Test
One-Sample Kolmogorov-Smirnov Test
Unstandardized
Residual
N 240
Normal Parametersa Mean .0000000
Std. Deviation 1.01262395

The Influence Of The Macroeconomic Factors As Measured By Inflation, Interest (BI Rate) And GDP
DOI: 10.9790/487X-2005052540 www.iosrjournals.org 36 | Page
Based on Figure
4.1 using the Plot diagram of Normal P-P it can be seen that the points formed spread around the diagonal line
while in Table 4.2 using the One Sample Kolmogorov-Smirnov test yields Z calculated (Kolmogorov-Smirnov)
of 0.984 and Asymp. Sig. (2-tailed) of 0.288 is greater than 0.05 so that the data is normally distributed and
feasible for linear regression testing.
b. Heteroskedastisitas Test
To detect heteroscedasticity can be done Park Test by regressing the natural logarithm value of residual
squares (Lne2) with independent variables (X1, X2, X3, X4, X5 X6 X7, and X8). If the significance value
between the independent variable and the absolute value is greater than 0.05 then there is no heteroscedasticity
problem. Park Test results can be seen in the table below:
Table 4.3.Heteroskedastisitas test
Coefficientsa
Model
Unstandardized Coefficients Standardized Coefficients
t Sig. B Std. Error Beta
1 (Constant) -6.623 3.412 -1.941 .055
INFLASI .035 .072 .075 .490 .625
BI Rate -.063 .190 -.063 -.333 .740
PDB .073 .211 .051 .345 .731
CAR .004 .003 .152 1.381 .170
FDR .006 .007 .082 .807 .421
NPF -.033 .044 -.085 -.746 .457
MARKET -2.071E-8 .000 -.143 -1.461 .147
BOPO 3.154 1.692 .192 1.864 .065
a.Dependent Variable: LNRes
Source : Result Output SPSS 16.0
Based on the results in Table 4.3.above the parameter coefficient for all independent variables is not
significant at the 0.05 level. This means that in the regression equation there is no problem of heteroscedasticity.
c. Multikolinieritas Test
Table 4.4 Multikolinieritas Test
Based on Table 4.3 above the VIF value for all independent variables consisting of Inflation (X1),
Interest Rate (X2), GDP (X3), CAR (X4), FDR (X5), NPF (X6), BOPO (X7) and The financing share (X8) has
Most Extreme Differences Absolute .064
Positive .064
Negative -.055
Kolmogorov-Smirnov Z .984
Asymp. Sig. (2-tailed) .288
Sumber : Output SPSS 16.0
Coefficientsa
Model
Collinearity Statistics
Tolerance VIF
INFLATION .460 2.173
BI RATE .303 3.303
PDB .450 2.221
CAR .793 1.261
FDR .938 1.066
NPF .850 1.176
BOPO .870 1.150
MARKET .925 1.081
a. Dependent Variable: ROA

The Influence Of The Macroeconomic Factors As Measured By Inflation, Interest (BI Rate) And GDP
DOI: 10.9790/487X-2005052540 www.iosrjournals.org 37 | Page
a tolerance value greater than 0.10 and VIF is smaller than 10, so the regression model proposed in this study
does not contain Multicollinearity symptoms.
d. Autokorelasi Test Runs Test
Unstandardized Residual
Test Valuea -.14437
Cases < Test Value 120
Cases >= Test Value 120
Total Cases 240
Number of Runs 120
Z -.129
Asymp. Sig. (2-tailed) .897
a. Median
Based on table data 4.5.it can be seen that the value of Asymp. Sig. (2-tailed) of 0.897 greater than
0.05, it can be concluded that there are no symptoms or problems of autocorrelation.
5.1.3. Regression Analysis
1. Multiple Linear Regression Analysis
The test results on the multiple regression model of factors affecting ROA in Sharia Banks in Indonesia.
Regression analysis results can be shown in the following table :
Based on table 4.6 above can be seen constant value of 8,297 and coefficient value of each variable
equal to 0,003 for Inflation, 0,114 for Interest rate, 0,174 for GDP, 0,17 for CAR, 0,01 for FDR, 0,107 for NPF,
-0,104 for BOPO and -0.025 for the market. Then the regression model in this study is as follows:
Y = 8,297 + 0,003.X1 + 0,114.X2 + 0,174.X3 + 0,17.X4+ 0,01.X5 + 0,107.X6-0,104.X7 -0,025.X8
The result of this regression model shows the direction of influence of each independent variable consisting of
Inflation, Interest rate, GDP, CAR, FDR, NPF, BOPO and Market share to dependent variable that is ROA.
Inflation (X1), interest rate (X2), GDP (X3), CAR (X4), FDR (X5), and NPF (X6) have a positive influence on
profitability (ROA), while BOPO (X7) and Market Share (X8 ) has a negative influence on the profitability of
sharia banks.
5.1.4. Hypothesis Testing
Hypothesis testing in this study using F test and t test. F test is performed to prove the effect of simultaneously
independent variable to dependent variable, while t test is used to prove the partial influence of independent
variable to dependent variable.
1. F tes&RSquare
Coefficientsa
Model
Unstandardized Coefficients
Standardized
Coefficients
T Sig. B Std. Error Beta
1 (Constant) 8.297 1.861 4.458 .000
INFLASI .003 .062 .003 .044 .965
BI RATE .114 .158 .052 .720 .472
PDB .174 .176 .059 .991 .323
CAR .017 .003 .306 6.870 .000
FDR .001 .003 .016 .388 .698
NPF .107 .031 .149 3.461 .001
BOPO -.104 .007 -.613 -14.420 .000
MARKET -.025 .009 -.111 -2.695 .008
a.Dependent Variable: ROA

The Influence Of The Macroeconomic Factors As Measured By Inflation, Interest (BI Rate) And GDP
DOI: 10.9790/487X-2005052540 www.iosrjournals.org 38 | Page
Table 4.7.Rseult Test Anova ANOVAb
Model Sum of Squares Df Mean Square F Sig.
1 Regression 429.114 8 53.639 50.559 .000a
Residual 245.072 231 1.061
Total 674.186 239
a. Predictors: (Constant), MARKET, INFLASI, FDR, NPF, BOPO, CAR, PDB, BI RATE
b. Dependent Variable: ROA
Sumber :Hasilolah data SPSS 16.0
Based on table 4.7 above can be F arithmetic of 50,559 with probability of 0,000 whose value is much
smaller than 0.05 then Ha accepted and rejected Ho (hypothesis rejected). This shows that Inflation (X1),
Interest rate (X2), GDP (X3), CAR (X4), FDR (X5), NFP (X6), BOPO (X7) and Market Share (X8)
simultaneously affect the Bank ROA -bank Sharia in Indonesia.
Tabel 4.8
From table 4.8 above can be known coefficient of determination (Adjusted R Square) of 0.624. With
the value of determination coefficient of 0.624, it can be interpreted that 62.40% ROA can be explained by the
eight independent variables consisting of Inflation (X1), Interest rate (X2), GDP (X3), CAR (X4), FDR (X5) ,
NPF (X6), BOPO (X7) and Market Share (X8). While the rest of 37.60% influenced by other variables that are
not included in the research model.
2. T tes
T test is used to determine the partial influence of independent variable to dependent variable. This test
is by comparing the probability or p-value (sig-t) with a significance level of 0.05. if the p-value is less than 0.05
then Ha is accepted and if the p-value is greater than 0.05 then Ha is rejected.
Tabel 4.9 Result Ttes Coefficientsa
Model
Unstandardized Coefficients
Standardized
Coefficients
T Sig. B Std. Error Beta
1 (Constant) 8.297 1.861 4.458 .000
INFLASI .003 .062 .003 .044 .965
SUKU BUNGA .114 .158 .052 .720 .472
PDB .174 .176 .059 .991 .323
CAR .017 .003 .306 6.870 .000
FDR .001 .003 .016 .388 .698
NPF .107 .031 .149 3.461 .001
BOPO -.104 .007 -.613 -14.420 .000
MARKET -.025 .009 -.111 -2.695 .008
a. Dependent Variable: ROA
Source : Result output SPSS 16.0
Result of t test on variable of Inflation (X1) as in table 4.9 above obtained t arithmetic equal to 0,044
with probability equal to 0,965 whose value far above 0,05. Thus H1 is rejected, meaning there is no significant
influence Inflation (X1) partially to ROA (Y). Thus, these findings do not support the research hypothesis which
states that "Inflation negatively affects the profitability of sharia banks.".
Model Summary
Model R R Square Adjusted R Square Std. Error of the Estimate
1 .798a .636 .624 1.03001
a. Predictors: (Constant), MARKET, INFLASI, FDR, NPF, BOPO, CAR, PDB, BI RATE

The Influence Of The Macroeconomic Factors As Measured By Inflation, Interest (BI Rate) And GDP
DOI: 10.9790/487X-2005052540 www.iosrjournals.org 39 | Page
Result of t test on variable of Interest rate (X2) as in table 4.6 above obtained t arithmetic equal to
0,720 with probability equal to 0,472 whose value far above 0,05. Thus H2 is rejected, meaning there is no
significant effect of interest rate partially to ROA (Y).
Result of t test on variable of PDB (X3) as in table 4.6 above obtained t count equal to 0,991 with
probability equal to 0,472 whose value far above 0,05. Thus H3 is rejected, meaning there is no significant
effect of GDP (X3) partially on ROA (Y).
Result of t test on variable of CAR (X4) as in table 4.6 above obtained t arithmetic equal to 6,870 with
probability equal to 0,000 whose value under 0,05. Thus H4 is accepted, meaning there is a significant influence
CAR (X4) partially to ROA (Y).
Result of t test on variable of FDR (X5) as in table 4.6 above obtained t arithmetic equal to 0,388 with
probability equal to 0,698 whose value far above 0,05. Thus H5 is rejected, meaning there is no significant
influence FDR (X2) partially to ROA (Y).
Result of t test on variable of NPF (X6) as in table 4.6 above obtained t arithmetic equal to 3,461 with
probability equal to 0,001 which value is under 0,05. Thus H6 is accepted, meaning that there is a significant
influence of NPF (X6) partially to ROA (Y).
Result of t test on variable of BOPO (X7) as in table 4.6 above obtained t count equal to -14,920 with
probability equal to 0.000 whose value far below 0,05. Thus H7 is accepted, meaning that there is significant
influence of BOPO (X2) partially to ROA (Y).
Result of t test on Market Share variable (X8) as in table 4.6 above obtained t arithmetic equal to -
2,695 with probability equal to 0,008 which value less than 0,05. Thus H8 accepted, meaning there is a
significant influence Market share (X2) partially to ROA (Y).
VI. Conclusions, Implications, Limitation And Recommendation This study aims to determine whether there are partial and simultaneous influences of macroeconomic
factors, Bank Health and Market Share on profitability (ROA) in sharia banking companies registered in the
Financial Services Authority period 2011-2014. From the data processing in chapters previously, the following
research findings were produced :
1. Simultaneously Inflation (X1), Interest Rate (X2), GDP (X3), CAR (X4), FDR (X5), NPF (X6), BOPO
(X7) and Financing Share (X8) have an effect on ROA of Sharia Bank in Indonesia.
2. Partially CAR (X4), NPF (X6), BOPO (X7) and Market Share (X8) have significant effect on ROA in
Syariah Banks in Indonesia, so there are 4 accepted hypotheses and 4 hypotheses rejected. Meanwhile,
Inflation (X1), Interest (X2) GDP (X3) and FDR (X5) have no significant effect on ROA so the hypothesis
is rejected
3. R square value of 63.6%, which means there are still 36.4% other variables outside this study that affect the
ROA so it can be used as an upcoming research agenda to find what variables are strongly alleged to affect
the bank's ROA- sharia bank in Indonesia
VII. Limitations And Recommendation This study has limitations that can be corrected in subsequent research. Limitations to be observed and
suggestions on the limitations encountered by researchers in the study, among others :
1. This research is limited to ROA variable as a tool to measure performance of keuanngan. In addition to
ROA, there are several ratios that can be used to measure a company's ability to generate profits such as
Gross Profit Margin (GPM), Net profit margin (NPM) and Return on Equity (ROE). For further research, it
is necessary to use other financial ratios to measure the level of proficiency to the factors that influence it.
2. This study is limited to the share of financing in measuring the market share of sharia banking. Researchers
can measure the market share of sharia banks by looking at the amount of third party funds (DPK) and
sharia banking assets.
3. This study is limited to the data period used in 2011 until 2014. Researchers then need to add observation
period or use the latest period data so that later expected results obtained better and can be generalized
4. This research only focuses on syariah banking which the number of sharia bank is only 12 syariah bank
while the rest is syariah business unit and BPRS. Researchers can only get 15 banks that can be sampled
because of limited access to data so that only banks that publish the complete financial statements that can
be sampled. Suggestions for the next researcher can use the population in all sectors of banking both
conventional and sharia to obtain more samples
5. For sharia banks, in order to be able to publish financial statements in detail, in order to facilitate
researchers so that later can provide input to develop Islamic banks in the future.
The Influence Of The Macroeconomic Factors As Measured By Inflation, Interest (BI Rate) And GDP
DOI: 10.9790/487X-2005052540 www.iosrjournals.org 40 | Page
Impilcations research
As a measure of ROA profitability it is important to assess how large a company can generate profits
from the assets it uses. In this study, some variables were found to positively and negatively affect the ROA.
Therefore, management needs to increase the following variables, namely financing share (X3), CAR (X4),
FDR (X5) so that company ROA will increase. On the other hand, management also needs to lower the
following variables: NPF (X6), and BOPO (X7) and optimize Market Share (X8) or assets to be more
productive. With proper monitoring of management and proper policy selection is expected to increase the
growth of Islamic banks in the future.
References [1]. Achmad, tarmizidanwillyantokartikokusuno. 2003. Analisisrasio-rasiokeuangansebagai predictor
dalammemprediksipotensikebangkrutanperbankan di indonesia. mediaekonomidanbisnis. vol.XV, No.1 [2]. AdiwarmanKarim. 2004. Bank Islam. PT Raja Grafindo, Jakarta
[3]. Ahmed, Rifaat. Abdel Karim. 1989. DetermenantsOf The Financial Strategy Of Islamic Banks. Journal of business finance
&acconting .ABI/INFORM Global. [4]. Almilia&herdaningtyas. 2005. Analisisrasio camel terhadapprediksikondisibermasalahpadalembagaperbankan 2000-2002
,JurnalAkuntansidankeuangan,vol 7, no.2.
[5]. Anthonasoglou, Brissimis, 2005, Bank spesific industry, and spesificmakroekonomic determinant of bank profitabilitas. Working paper, bankof greece. No. 25.june
[6]. Arianto, Taufik. 2005. ProfilPersaingan Usaha DalamIndustriPerbankanIndonesia ,Perbanas Finance & Banking Journal, Vol. 6,
No. 2, Desember2004; 95–108 [7]. Ascaryadan Diana Yumanita.2005. MencariRendahnyaPembiayaanBagiHasil Di PerbankanSyariah Indonesia. Jakarta:
BuletinEkonomiMoneterdan Perbankan. [8]. Awdeh, Ali. 2005 Domestic bank’s and foreign bank’s profitabilitas : differences and their determinants. Cass Busines School, City
of London Paper.
[9]. Biro PerbankanSyariah Bank Indonesia. 2002. StatistikPerbankanSyariahDesember 2002. Bank Indonesia, Jakarta. [10]. Biro PerbankanSyariah Bank Indonesia. 2015. StatistikPerbankanSyariahFebruari 2015.Bank Indonesia, Jakarta.
[11]. Dendawijaya, Lukman,. 2005, ManajemenPerbankan, PenerbitGhalia Indonesia, Jakarta.
[12]. Demirgüç-Kunt, A. and A. Huizinga (1998). “Determinants of Commercial BankInterest Margins and Profitabilitas: Some International Evidence,”World Bank Economic Review 13, 379-408
[13]. Ghazali, Imam. 2001. AplikasiAnalisis Multivariate Dengan Program SPSS. BP UniversitasDiponegoro, Semarang.
[14]. Hasibuan, Drs. H. Malayu S.P.,2007, Dasar-dasarperbankan, PT BumiAksara, Jakarta. [15]. Hassan dan Bashir. 2002. Determinants of Islamic Banking Profitabilitas. International Journal.ERF paper.
[16]. Kasmir. 2005. Bank danlembagakeuangan lain. PT. Raja Grafindo Perkasa Edisi 6, Jakarta.
[17]. Kuncoroningrat. 1997. Metode-MetodePenelitianMasyarakat.Gramedia, Jakarta. [18]. Kuncoro, Mudrajad, danSuhardjono. 2002. Manajemenperbankanteoridanaplikasinya. BPFE, Yogyakarta.
[19]. Levine, Ross. 1996. Financial development and economic growth.Policy Research Paper.1678, The World Bank (forthcoming in
Journal ofEconomic Literature). [20]. Limpaphayon, piman, dansiraphatpolwitoon (2004)’’ bank relationship and firmperformance: evidence from Thailand before the
asian financial crisis, “journal of business finance and accounting
[21]. Lloyd-Williams, D.M, Molyneux, P. and Thornton, J. (1994).“Market Structureand Performance in Spanish Banking”, Journal of Banking and Finance18(3), pp. 433-443.
[22]. Mawardi, Wisnu. 2005. Analisisfaktor-faktor yang mempengaruhikinerjakeuangan bank umum di indonesia (studikasuspada bank
umumdengan total asset kurangdari 1 Trilliun). Jurnalbisnisstrategi, Vol.14,No.1. [23]. Meythi. (2005). Rasiokeuangan yang paling baikuntukmemprediksipertumbuhanlaba: suatustudiempirispadaperusahaanmaufaktur
yang terdaftar di Bursa Efek Jakarta, JurnalEkonomidanBisnis. VolXI, No.2, September, 2005
[24]. Muhammad. 2004. TeknikPerhitunganBagiHasil Dan Profit Margin PadaBank Syariah.UII press, Yogyakarta. [25]. Syafi’i Antonio. 2001. Bank Syariah: Dari TeorikePraktik.GemaInsani Press, Jakarta.
[26]. Nasser, Etty M danTitikAryati 2000, “Model Analisis CAMEL untukmemprediksi financial distress padasektorperbankan yang go
publik,” JAAI, Vol 4 No.2 [27]. Neceur, Summy, 2005, The determinant the tunisian banking industryprofitabilitas. panel evidence, ERF Research follow,
department of finance,universitelibre de tunis.
[28]. Payamta, Machfoed, 1999. Evaluasikinerjaperusahaanperbankansebelummenjadiperusahaanpublik di bursa efekjakarta (BEJ). Kelola No. 26 /VIII
[29]. Rivaidan Andria. 2009. Bank and Financial Institution Management. Jakarta: PT Raja GrafindoPersada.
[30]. Siamat, Dahlan. 2005. ManajemenLembagakeuangan, edisikeempat, badanpenerbitFakultasEkonomiUniversitas Indonesia. Jakarta [31]. Sinungan, Muchdarsyah. 2000, Manajemen Dana Bank, Edisikedua, PT. BumiAksara, Jakarta
[32]. Sudarini, Sinta (2005). Penggunaanrasiokeuangandalammemprediksilabamasa yang akandatang. Jurnalakuntansidanmanajemen, vol
XVI No 3desember 2005, 195-207 [33]. Tarawneh, Medhat. 2006. A comparison of financial performance in the bankingsector : some evidence from omani commercial
bank, international reaserch journal of finance and economics. euro journals publising.
[34]. Werdaningtyas, H. 2002.”Faktor-Faktor yang mempengaruhiProfitabilitasBank take over pre Merger” .JurnalManajemen Indonesia Vol.I No.2
[35]. Weston, J. Fred dan E. Thomas Copeland, 1995, ManajemenKeuangan(terjemahan) :Jilid 1, EdisiKedelapan, Erlangga, Jakarta.
ZakiZamani. "The Influence Of The Macroeconomic Factors As Measured By Inflation, Interest (BI
Rate) And GDP Growth, Market Share As Measured By The Share Of Bank Financing And The
Characteristics Measured By CAR, FDR, NPF, ROA To Return On Assets (ROA) Islamic Banking In
Indonesia." IOSR Journal of Business and Management (IOSR-JBM) 20.5 (2018): 25-40.