the influence of staff turnover on project …
TRANSCRIPT

THE INFLUENCE OF STAFF TURNOVER ON PROJECT PERFORMANCE
IN THE BANKING SECTOR IN KENYA: A CASE OF FAMILY BANK
FRIDAH GATHIGIA MAINA
16S03EMBA013
AN APPLIED RESEARCH PROJECT SUBMITTED IN PARTIAL
FULFILMENT OF THE REQUIREMENTS FOR THE AWARD OF MASTER
OF BUSINESS ADMINISTRATION DEGREE IN THE BUSINESS SCHOOL
OF AFRICA NAZARENE UNIVERSITY
JUNE 2021

ii
DECLARATION
I declare that this document and the research that it describes are my original work and
that they have not been presented in any other university for academic work.
Name: FRIDAH GATHIGIA MAINA 16S03EMBA013
10/6/2021
Student signature Date
This research was conducted under our supervision and is submitted with our approval as
university supervisors.
Supervisor Name: DR PETER MAGERO
10/6/2021
University supervisor signature Date
Africa Nazarene University,
Nairobi, Kenya

iii
DEDICATION
This research project is dedicated to my entire family for their prayers, support and
motivation throughout the study period. Your inspiration, love, encouragement and
support in diverse forms will always be remembered and cherished.

iv
TABLE OF CONTENTS
DECLARATION ................................................................................................................ ii
DEDICATION ................................................................................................................... iii
TABLE OF CONTENTS ................................................................................................... iv
ABSTRACT ..................................................................................................................... viii
ACKNOWLEDGEMENT ................................................................................................. ix
DEFINITION OF TERMS ................................................................................................. x
LIST OF ABREVIATIONS .............................................................................................. xi
LIST OF FIGURES .......................................................................................................... xii
LIST OF TABLES ........................................................................................................... xiii
CHAPTER ONE ................................................................................................................. 1
INTRODUCTION AND BACKGROUND OF THE STUDY .......................................... 1
1.1 Introduction ............................................................................................................... 1
1.2 Background to the Study ........................................................................................... 1
1.2.1 Banking Industry in Kenya .................................................................................... 4
1.2.2 Background of Family Bank Ltd ............................................................................ 6
1.3 Statement of the Problem .......................................................................................... 7
1.4 Purpose of the Study ................................................................................................. 8
1.5 Objectives of the Study ............................................................................................. 8
1.6 Research Questions ................................................................................................... 9
1.7 Significance of the Study .......................................................................................... 9
1.8 Scope of the Study................................................................................................... 10
1.9 Delimitations of the Study....................................................................................... 10
1.10 Limitations of the Study ........................................................................................ 10
1.11 Assumptions of the Study ..................................................................................... 11
1.12 Theoretical Review ............................................................................................... 11
1.13 Conceptual Framework ......................................................................................... 15
v
CHAPTER TWO .............................................................................................................. 17
LITERATURE REVIEW ................................................................................................. 17
2.1 Introduction ............................................................................................................. 17
2.2 Review of the Literature .......................................................................................... 17
2.2.1 The influence of cost on project performance ...................................................... 17
2.2.2 The influence of productivity on project performance ......................................... 19
2.2.3 The influence of staff morale on project performance ......................................... 21
2.2.4 The influence of Project Performance on project................................................. 23
2.3 Summary of the Reviewed Literature ..................................................................... 24
2.4 Knowledge Gap ....................................................................................................... 25
CHAPTER THREE .......................................................................................................... 26
RESEARCH DESIGN AND METHODOLOGY ............................................................ 26
3.1 Introduction ............................................................................................................. 26
3.2 Research Design ...................................................................................................... 26
3.3 Research Site and Rationale .................................................................................... 26
3.4 Target Population .................................................................................................... 27
3.5 Study Sample........................................................................................................... 27
3.5.1 Sampling Procedure ............................................................................................. 27
3.5.2 Study Sample Size ................................................................................................ 28
3.6 Data Collection ........................................................................................................ 29
3.6.1 Data Collection Instruments ................................................................................. 29
3.6.2 Pilot Testing of Research Instruments ................................................................. 29
3.6.3 Reliability of Research Instruments ..................................................................... 29
3.6.4 Validity of Findings ............................................................................................. 30
3.6.5 Data Collection Procedure ................................................................................... 30
3.7 Data Analysis and Presentation ............................................................................... 31
3.10 Ethical Considerations........................................................................................... 31
CHAPTER FOUR ............................................................................................................. 33
DATA ANALYSIS AND PRESENTATION OF FINDINGS ........................................ 33

vi
4.1 Introduction ............................................................................................................. 33
4.2 Response Rate ......................................................................................................... 33
4.3 Reliability Statistics................................................................................................. 34
4.4 Demographic Characteristics .................................................................................. 34
4.4.1 Gender of the Respondents .................................................................................. 34
4.4.2 Academic Qualification........................................................................................ 35
4.4.3 Position Held in the Organization ........................................................................ 36
4.4.4 Working Duration at Family Bank ....................................................................... 36
4.4.5 Turnover rate in past 5years ................................................................................. 37
4.4.6 Factors influence on turnover ............................................................................... 38
4.4.7 Career Change ...................................................................................................... 38
4.5 Influence of Costs on Project Performance ............................................................. 39
4.5.1 Influence to general financial position. ................................................................ 39
4.5.2 Influence of Costs on Project Performance .......................................................... 40
4.6 Influence of Productivity on Project Performance. ................................................. 42
4.6.1 Influence of Productivity on Project Performance ............................................... 43
4.6.2 Quality of service during staff turnover period .................................................... 46
4.6.3 Time spent by new staffs ...................................................................................... 46
4.7 Influence of Staff Morale on Project Performance ................................................. 48
4.8 Project Performance ................................................................................................ 50
CHAPTER FIVE .............................................................................................................. 54
SUMMARY OF FINDINGS, CONCLUSION AND RECOMMENDATIONS ............. 54
5.1 Introduction ............................................................................................................. 54
5.2 Discussions .............................................................................................................. 54
5.2.1 Cost on project performance ................................................................................ 54
5.2.2 Productivity on project performance .................................................................... 55
5.2.4 Project Performance ............................................................................................. 58
5.3 Summary of the findings ......................................................................................... 59
5.4 Conclusion ............................................................................................................... 60
5.5 Recommendation ..................................................................................................... 61
vii
5.6 Area for further research ......................................................................................... 61
REFERENCES ................................................................................................................. 62
APPENDICES .................................................................................................................. 67
APPENDIX I: RESEARCH QUESTIONNAIRE ............................................................ 67
APPENDIX II: ANU LETTER OF RESEARCH AUTHORIZATION........................... 73
APPENDIX III: RESEARCH PERMIT ........................................................................... 74
APPENDIX IV: ROAD MAP .......................................................................................... 75

viii
ABSTRACT
Most organization’s performance and productivities are influenced by the staff turnover.
To survive and remain competitive in the evolving and highly competitive environment,
organizations need the human touch to work. This study aimed at investigating the
influence of staff turnover on project performance in the banking sector. The study was
guided by three objectives: determining the influence of staff turnover in terms of costs
on the organization's performance, finding out the influence of staff turnover in terms of
productivity on the organization's performance and finding out the influence of staff
turnover in terms of staffs' morale on the organization's performance. The study was also
guided by three theories namely; Abraham Maslow’s hierarchy of needs theory,
Herzberg’s to factor theory and Vroom’s expectancy theory. The study adopted a
descriptive research design. The study target population was 80 staffs from the family
bank headquarter in Nairobi with a sample size of 67 staffs. Primary data was collected
using a semi-structured questionnaire. The validity and reliability of the questionnaires
was tested through a pilot study that was conducted at Family Bank Kasarani branch. The
reliability of the research instrument was done using the Cronbach’s Alpha. The data
analysis for this study was conducted through Statistical Package for Social Sciences
(SPSS) in form of frequencies, means, and standard deviation as descriptive statistics.
Findings were presented in form of figures and tables which concluded that high staff
turnover has a negative impact on the financial performance on banking sector.
Recommendations were generated based on the outcomes of the data analysis whereby
the main recommendation was for banks to retain its staff so as to reduce on costs.
ix
ACKNOWLEDGEMENT
First and foremost, I would like to express my highest gratitude to God for the blessings,
love, opportunity, health and mercy to complete this research project.
I would also like to thank and appreciate my supervisor, Dr. Peter Magero, for his
support, patience, great suggestions and advise he gave me.
To the Management of Family Bank, thank you for accepting my request to undertake my
research project at your organization and also allowing me to use various information
sources for the purpose of my research work.
To my beloved parents and siblings thank you so much for your endless love, prayers,
support and motivation.
Finally, thank you to all those who took their time to assist me in one way or the other
while I undertook this research project.

x
DEFINITION OF TERMS
Cost: The amount that has to be paid or spent to buy or obtain something
Functional Quality: Classification of service quality dimension that represents how the
service is delivered and pertains to the interpersonal and relational part of service process
(Kandam, 2002)
Productivity: The rate of production per unit of time (Munsaka, 2004)
Production Cost: The total price paid for resources used to manufacture a product or
create a service to sell to consumers including raw materials, labor, and overhead.
Project Performance: The degree of achievement of a project goal within the stipulated
project period and budget (Chapelier & Shah, 2013)
Staff Morale: The overall outlook, attitude, satisfaction, and confidence that employees
feel at work. (Osarenkhoe, 2007)
Staff Turnover: The analysis of the numbers of people leaving or entering employment
(Nwagbara, Smart, Ugorji&Ennsra, 2013)
Work life Balance: The state in which staff can maintain a happy personal life while
being successful at work giving them a sense of personal fulfillment (Nel, 2009)
xi
LIST OF ABREVIATIONS
CBK Central Bank of Kenya
EPS Earnings Per Share
HR Human Resource
KPI Key Performance Indicator
MFI Mobile Financial Services
NII Net Interest Income
NIM Net Interest Margin
SACCOs Savings and Credit Cooperative Organizations
SOPs Standard Operation Procedures
SPSS Statistical Package for Social Sciences
TIB Tanzania Investment Bank

xii
LIST OF FIGURES
Figure 1.1 Conceptual Framework ................................................................................... 16

xiii
LIST OF TABLES
Table 3. 1 Sample size ...................................................................................................... 28
Table 4. 1 Response Rate .................................................................................................. 33
Table 4. 2 Reliability Statistics ......................................................................................... 34
Table 4. 3 Respondents Gender ........................................................................................ 35
Table 4. 4 Respondents’ academic qualification .............................................................. 35
Table 4. 5 Position Held.................................................................................................... 36
Table 4. 6 Duration worked .............................................................................................. 36
Table 4.7 Rate of turnover ................................................................................................ 37
Table 4. 8 Influence of factors .......................................................................................... 38
Table 4. 9 Consider career change .................................................................................... 39
Table 4. 10 Influence to general financial position ........................................................... 39
Table 4. 11 Influence of Costs on Project Performance ................................................... 40
Table 4. 12 Influence of Productivity on Project Performance ........................................ 43
Table 4. 13 Quality of Service .......................................................................................... 46
Table 4. 14 New staff spend too much time ..................................................................... 47
Table 4. 15 Influence of Staff Morale on Project Performance ........................................ 48
Table 4. 16 Project Performance ....................................................................................... 51

1
CHAPTER ONE
INTRODUCTION AND BACKGROUND OF THE STUDY
1.1 Introduction
This study intends to investigate the influence of staff turnover on project performance in the
banking sector in Kenya. This chapter looks into the background of the study, statement of the
problem, the objectives of the study, significance of the study, scope of the study, limitations and
de-limitations of the study, and conceptual framework.
1.2 Background to the Study
Over the last decade, staff turnover in organizations has received massive attention among
academicians and practitioners in equal measures globally. While much of the focus has been
given on understanding the causes of staff turnover, Muhammad N., Muhammad R. and Riaz
(2013) points out that the ultimate end-result of staff turnover is quite disastrous to organizations.
The failure or success of an organization can be summed up to the inputs initiated from its
human resource, its technology and the type of materials it has. Technology and materials cannot
operate in isolation, they need the human touch and hands to make an organization perform
effectively and efficiently. It is a general fact that highly satisfied & motivated staffs following a
pattern of daily work management have been the core strength of most successful organizations.
According to Armstrong (2003), staff turnover or wastage is the analysis of numbers of people
leaving an organization. Staff turnover can also be defined as the rate at which staffs leave or
enter employment (Nwagbara, Smart, Ugorji, &Ennsra, 2013). In the human resource context,
staff turnover is the rate at which an employer gains and losses staffs. Staff turnover is measured
for individual companies and for the industry as a whole. If an employer is said to have a high
2
staff turnover relative to its competitors, it means that staffs of that company have a shorter
average tenure than those of other companies in the same industry. High turnover may impact on
a company’s productivity if high performing staff are leaving and those left contain a high
percentage of inexperienced or novice workers (Armstrong, 2003).
Staff turnover in organizations is one of the main issues that extensively influence the overall
performance of an organization. It is often suggested that organizations should adopt the clear
Standard Operation Procedures (SOPs) that decrease the gap among the top management and the
middle management in order to identify and resolve the issue of staff turnover in the
organization. According to Song, Martens, McCharen, and Ausburn (2011), staff turnover is a
critical concern because turnover results in the loss of valuable knowledge assets from an
organization’s experienced staffs.
Turnover can be classified into; involuntary and voluntary turnover. Involuntary turnover is
initiated by the organization often among people who would prefer to stay while voluntary
turnover is initiated by staffs often whom the company would prefer to keep (Noe, Hollenbeck,
Gerhart & Wright, 2003). Kazi and Zedah (2011) observed that involuntary turnover is
considered to depend on factors that are outside of management control. Marti, MacLeod and
Clarke (2009) named these as uncontrollable factors and mentioned perceived alternative, staff
opportunity and job-hopping as examples. Staff deaths, chaos in the country, in fulfillment of
essential needs of life and health matters has been declared by Kazi and Zedah (2011), as
examples of involuntary turnover. On the other hand, voluntary turnover is dependent on staff
him/herself and can be experienced by a staff to realize individual achievement comparable to
job. Marti et al. (2009) names these controllable factors and mentioned satisfaction with pay,

3
nature of work and supervision, organizational commitment, distributive justice and procedural
justice as examples of voluntary turnovers. Stovel and Bontis (2002) comments that involuntary
turnover refers to the discharge of staffs, whereas voluntary turnover take place when staffs leave
the job. Organizations place a high value on retaining staffs, which is a strategic value of
replacing human capital. Intention to leave an organization, while not always actually leading to
turnover, is an important outcome variable when determining a good predictor of turnover
behavior for staffs (Chang, Wang, & Huang, 2013).
Staff turnover analysis provides data for use in supply forecasting so that calculations can be
made on the number of losses that may be replaced. More importantly the analysis of numbers of
leavers and the reasons why they leave provides information which will indicate whether any
action is required to improve retention rates. It can prompt further investigations to establish
underlying causes and identify remedies (Armstrong, 2003). Turnover always rises when the
economy is strong and jobs are plentiful because there are more opportunities available for
people to change employers. Conversely, during recessions staff turnover falls because relatively
few attractive permanent positions are advertised (Torrington, Hall, & Taylor, 2005).
Torrington et al. (2005) argued that the attrition rates which may inflict measurable damage to
organizational performance vary from organization to organization. For example some chains of
fast foods restaurants are widely reported as managing turnover rates in excess of 300% with an
average tenure for each staff at only four months, yet the companies concerned are some of the
most successful in the world (Ritzer, 1996; Cappelli, 2000).
According to Torrington et al. (2005), further research studies undertaken annually in the U.K.by
the Chartered Institute of Personnel and Development persistently show retailing and catering to

4
be the sectors with the highest turnover levels, with the rates averaging over 40 per cent in recent
years. By contrast the most stable workforces are to be found in the public services, where
reported annual turnover rates are only 10 or 11 per cent.
1.2.1 Banking Industry in Kenya
The Companies Act, the Central Bank of Kenya (CBK) Act and the Banking Act are the main
regulators and governors of Banking Industry in Kenya. These Acts are used together with the
prudential guidelines which Central bank of Kenya issues from time to time. As at 31st
December 2017, the Kenyan banking sector comprised of the Central Bank of Kenya, as the
regulatory authority of 28 domestic and 14 foreign commercial banks with branches, agencies,
and other outlets throughout the country; one mortgage finance company; eight representative
offices of foreign banks; eleven licensed deposit taking microfinance institutions; 49 insurance
companies; the Post Office Savings Bank with a large network of branches around the country;
79 foreign exchange (forex) bureaus; three licensed credit reference bureaus, 14 money
remittance providers and about 200 deposit-taking licensed savings and credit cooperative
organizations (SACCOs) with a membership of over 3 million Kenyans. However, the banking
sector is essentially dominated by four major commercial banks, namely Equity Bank, Kenya
Commercial Bank, Barclays Bank of Kenya and Standard Chartered. In addition smaller banks
have emerged and experienced tremendous growth in recent years (CBK, 2016).
The banking sector was liberalized in 1995 and exchange controls lifted. The CBK, which falls
under the Minister for Finance, is responsible for formulating and implementing monetary policy
and fostering the liquidity, solvency and proper functioning of the financial system (‘Overview
5
of banking industry’ Retrieved from http://www.equitybank.co.ke-Equity Annual reports and
financial Statements 2005, 2006, 2007, 2008,2011,2012) for Equity Bank.
Over the last few years, the banking sector in Kenya has continued to grow in assets, deposits,
profitability and products offering. The growth has been mainly underpinned by; firstly; an
industry wide branch network expansion strategy both in Kenya and in the East African
community region. Second; automation of a large number of services and a move towards
emphasis on the complex customer needs rather than traditional “off-the shelf’ banking products
(‘Overview of banking industry’ Retrieved on 05 December 2009 from
http:www.kcbbankgroup.com.ke-KCB Annual reports & financial statements 2007, 2008) for
Kenya Commercial Bank (K) Ltd.
Financial inclusion in Kenya has continued to rise with the percentage of the population living
within 3 kilometers of a financial services access point rising to 77.0% in 2016 from 59.0% in
2013. This has been driven by digitization, with Mobile Financial Services (MFS) rising to be
the preferred method to access financial services in 2016. However, Kenya’s listed banks
recorded a negative EPS growth of 13.8% in H1’ 2017, compared to an average positive growth
of 15.5% in H1’ 2016. The poor performance was on the back of a decline in Net Interest Income
(NII) following the capping of interest rates. The Net Interest Margin (NIM) declined to7.7% in
H1’ 2017 from 8.4% in H1’ 2016.
Listed banks recorded gross loans and advances growth of 9.3% to Kshs1.9 trillion in H1’ 2017
from Kshs. 1.7 trillion in H1’ 2016, slowing down from the 5 year average growth rate of 14.6%.
On the other hand, deposits grew 14.4% to Kshs. 2.4 trillion in H1’ 2017 from Kshs. 2.1 trillion
in H1’ 2016, faster than the 5 year average of 12.8%.

6
Major issues facing the banking industry includes: competition for clients and talents, staff
turnover, fraud, minimum core capital requirements, Terrorism and Money laundering. Global
crisis in 2010 affected banking industry in Kenya and more so the mobilization of deposits and
the decline of Interest margins. Banks are very conservative with negative information; however
recruitment statistics from (Manpower & PWC, 2012) revealed a standard staff turnover rate to
be 10 percent, meaning 3000 staffs from the estimated 30000 voluntary leave employment, this
is considered as normal and healthy statistics.
1.2.2 Background of Family Bank Ltd
Family Bank became a fully-fledged commercial bank in May 2007 from only one branch in
1985. The Bank has grown over time and currently enjoys a network of over 90 branches
countrywide. It was the first Bank in Kenya to introduce paperless banking through smart card
technology that enables customers to transact without having to fill in deposit or withdrawal
slips. In 2013, the Bank hit the one Billion Shilling mark for the first time ever doubling its pre-
tax profit by 108% growth to 1.78 billion.
In 2019 the Bank attained a profit after tax of Ksh 364.397 billion up from Ksh 90.651 billion
over a similar period in 2018 buoyed by increased lending, aggressive deposits growth and
growth in customer base. The Bank has significantly expanded its balance sheet over the past
few years with the loan book, assets showing tremendous growth trajectory. The bank has over
1.7 million customers with a growing balance sheet and deposit base.
(http://familybank.co.ke/about-us/profile)

7
Today many customers have graduated to higher levels economically and are involved in
complex and sophisticated activities including imports and exports as well as local and
international money transfer. Family bank has widened its capacity to serve all their customer
needs including cheque books, clearing electronic funds transfer, mobile banking, foreign
exchange and international banking.
1.3 Statement of the Problem
Staffs are the main pillars and the most important factor in driving the success of the
organization. They are the people who have the function and ability to organize and manage the
outcome of one certain assignment. In the banking industry, staffs are expected to demonstrate a
very high performance in order to achieve the organization’s mission, goal and objective each
year which highly depend on the sales volume of their products and services. Compared to other
industries, banking industry is well known with high workload and stringent time frame for their
staffs to adhere with, which can be recognized as major contributions to the increase of turnover
rate.
According to Dlamini-Zuma (2009), staff turnover is of great concern to organizations because it
is very costly to companies considering the costs of recruiting, orienting and training a
replacement (estimated cost stands at 50% of that person’s annual salary). This involves
incurring large costs in terms of time and money to ensure a flawless transition and adaptation to
the organisation’s working environment and demonstration of the required skills and experience
(Maxwell, 2010). Staff turnover can also lead to personal tensions in other staffs and this has
potential to further increase turnover and organizational ineffectiveness because those who
remain do additional work until the replacement performs at an acceptable level.

8
Philip (2008) also states that staff turnover involves allocation of tasks to less skilled and
inexperienced employees who may not have the technical know-how on how to execute the
required services, leading to the realization of lower customer satisfaction. This has ripple effects
on decline in sales revenue and hence further loss in organizational efficiency by affecting
internal business processes. Family bank ltd in the banking industry in Kenya has been facing
stiff competitive pressures from other banks in terms of their products and services forcing them
to achieve competitive advantage through cost leadership strategies and product leadership and
yet be able to offer unmatchable quality.
Tighter labour market conditions are mounting more pressure for these employers in the
recruitment and selection process in addition to motivation without necessarily improving the
pay levels (Paul, 2009). However, organizational ability to retain employees is dependent on
many functional factors. Studies conducted on employee turnover particularly on countries in the
West have revealed conflicting results on the factors leading and contributing to employee
turnover (Mungumi, 2000). Previous findings concluded that labour is related to a wide array of
factors ranging from industrial, economic and demographic factors to factors such as education,
sex, age and duration of service amongst others (Roller et al., 2001). This study tried to fill the
gap in knowledge on the influence of staff turnover on project performance at Family Bank
Limited.
1.4 Purpose of the Study
The study tried to fill in the gap on the knowledge on the influence of staff turnover on project
performance at Family Bank Limited in the banking sector in Kenya.
1.5 Objectives of the Study
This study was guided by general and specific objectives as follows:

9
1.5.1 General objectives
The main objective of the study was to establish the influence of staff turnover on project
performance in the banking sector in Kenya a case study of Family bank.
1.5.2 Specific objectives
i. To determine the influence of cost on project performance in the banking sector in
Kenya.
ii. To find out the influence of productivity on project performance in the banking sector in
Kenya.
iii. To find out the influence of staffs' morale on project performance in the banking sector in
Kenya.
1.6 Research Questions
i. What is the influence of costs on project performance in the banking sector in Kenya?
ii. What is the influence of productivity on project performance in the banking sector in
Kenya?
iii. What is the influence of staffs' morale on project performance in the banking sector in
Kenya?
1.7 Significance of the Study
The study sought to find out the influence of staff turnover on project performance in the
banking sector. According to Armstrong (2003), staff turnover provides a valuable means of
benchmarking the effectiveness of HR policies and practices in organizations.
The researcher aimed to contextualize the findings, information and new knowledge to improve
project performance in the banking industry. The research will also assist future researchers who
wish to extend studies concerning staff turnover within the banking industry. The researcher also

10
aimed at providing suggestions to the organization on how to remedy the problem at hand based
on the feedback by the respondents. The research will give the researcher the opportunity to gain
deep knowledge on the influence of staff turnover and its relation with performance of projects.
1.8 Scope of the Study
The study was limited in scope to Family bank headquarter in Nairobi registered with the Kenya
Bankers Association. Data was collected for the period 2013-2019. The period span is key to
establish trends that yield unbiased results that can be generalized to some larger population. The
researcher assessed how turnover decisions influence the bank’s performance in the areas of
operations, productivity and ultimately profitability.
1.9 Delimitations of the Study
The study covered only Family bank headquarter in Nairobi, Kenya. The research population
was composed of 80 staffs. The study aimed at looking at the influence of staff turnover only.
The study also confined itself to interviewing and questioning each staff as one unit of measure
as opposed to all the participants in the organization involved in the projects.
1.10 Limitations of the Study
Limitations are conditions beyond the control of the researcher that may place restrictions on the
successful accomplishment of the study and their application to other situations.
The topic of research has not been scholarly undertaken in the banking industry hence the
researcher lacked enough scholarly evidence. The researcher therefore used the available
information to assist her in the study.

11
The researcher used questionnaires and interviews to get all questioned answered. However, the
researcher may not get responses from all staffs due to time constraints and also some of the
staffs may be out of office on other duties while the research is being conducted.
Some of the respondents were reluctant to give information because of fear of being victimized
by the management of the organization while others chose to give false information deliberately
to impress the researcher. The researcher assured the respondents of discretion on the
information given to her by the respondents.
These limitations were encountered by the researcher informing the respondents of the
significance of the study and assuring them that the information provided would be treated with
utmost confidentiality and used only for research and academia purposes and never to any other
person whatsoever.
1.11 Assumptions of the Study
The study assumed that the respondents would respond to the questionnaires honestly and
truthfully.
1.12 Theoretical Review
A theoretical framework is defined as a reasoned set of prepositions, which are derived and
supported by data or evidence and explains a phenomenon (Michael, 2009). The researcher
focused on the motivational theories namely Abraham Maslow’s hierarchy of needs theory,
Herzberg’s two-factor theory and Victor Vroom’s expectancy theory.
1.12.1 Abraham Maslow’s Hierarchy of Needs Theory
Abraham Maslow developed the hierarchy of needs theory that places staffs' needs into five
progressive categories beginning with basic physical needs and progressing up to needs for
personal growth and career development (Maslow, 1943). This theory emphasizes on the need of

12
organizations to consider the basic requirements of their staffs including health, job security and
payment then later advance to the position of the staff in the organization. Maslow claimed that
employers must meet each level of staffs' needs for staffs to truly commit themselves to
workplace goals and increase the work performance.
Maslow enhanced that failure to meet staffs’ needs at any level in the hierarchy can create lack
of fulfillment in the staffs' professional lives, causing them to eventually try to fulfill these needs
on their own, possibly by finding a new employer who provides better opportunities hence
increasing turnover in your organization (Maslow, 1954). When staffs know that you care about
their health and that their job is guaranteed, they will be committed to the company. The
Maslow's Hierarchy of Needs clarifies the motivation components. Staff motivation is a critical
element essential for performance and objectives accomplishment. An unmotivated staff that is
not inspired won't bring the ideal output. Stain (2013) proposed that a motivated workforce can
improve performance and customer satisfaction.
In line with this study, Maslow’s hierarchy of needs theory implies that organizations need to
understand the stages at which different employees are at and what motivates them in terms of
management styles, work environment and reward management, in order to come up with
programs or policies that satisfy unfulfilled and emerging needs since many lower level needs
are felt time and again. High levels of performance occur when leaders establish motivational
styles that inspire followers to achieve objectives. Using the hierarchy concept, managers are
also responsible for creating an environmental climate where employees can develop their full
potential. Inability to provide such an environment would leave many employees dissatisfied and
frustrated, leading to poor performance and withdrawal from the organisation. Maslow’s
Hierachy of needs theory will therefore help the management of an organization to establish

13
what kind of reward packages appeal to employees at different levels to ensure they are paid
competitively and in line with their motivation to avoid exit which will influence project
performance.
1.12.2 Herzberg’s Two-Factor Theory
Herzberg believed that the two dimensions of job satisfaction are dissatisfiers also called them
hygiene issues and satisfiers, also called motivators. His theory was that staffs can be retained
through minimizing dissatisfaction and maximizing satisfaction (John, 2005). Dissatisfiers
include factors such as administration, company policy, working conditions, supervision,
relationships and salary. Satisfiers include the job, promotion, achievement, responsibility and
recognition.
According to John (2005), Herzberg’s theory focused on two broad categories of factors, which
determine staff retention rate. They include motivator and hygiene factors. The motivator factors
lead to staff satisfaction whereas the hygiene elements cause dissatisfaction. According to
Herzberg, staffs are motivated by recognition, achievement, work, growth, and advancement. On
the other hand, they are dissatisfied by relationship with boss, supervision, salary, relationship
with colleagues, work conditions and the company’s policy.
Herzberg believes that if the hygiene factors such as salary, working conditions, work
environment, safety and security are unsuitable (low level) at the workplace, this can make
individuals unhappy and dissatisfied with their job. On the other hand motivation can increase
job satisfaction which is based on an individual's need for personal growth. If these elements are
effective, then they can motivate an individual to remain in the organization and achieve above-
average performance and effort.

14
1.12.3 Vroom’s Expectancy Theory
Victor Vroom's (1964) expectancy theory aims to explain how people choose from the available
actions. Vroom defines motivation as a process that governs our choices among alternative forms
of voluntary behavior. The basic rationale of this theory is that motivation stems from the belief
that decisions will have their desired outcomes.
The expectancy theory puts forth the premise that staff will put forth an amount of work and
commitment equal to what they expect to receive in return. Commission compensation structures
leverage this theory by allowing staffs to earn as much money as they desire, completely based
on their job performance.
According to John (2005), Vroom believes that making sure that staffs always expect future pay
raises and potential job promotions can keep them working hard to achieve personal goals. If
staffs expect little compensation and no growth opportunities in return for their work, they may
put forth only minimal effort until they eventually look to a new employer for new opportunities.
The expectancy theory places an emphasis on the process and on the content of motivation as
well, and it integrates needs, equity and reinforcement theories.
The motivation to engage in an activity is determined by appraising three factors. These three
factors are the following;
Expectancy: The person’s belief that more effort will result in success. If you work harder it will
result in better performance.
Instrumentality: The person’s belief that there is a connection between activity and goal. If you
perform well, you will get rewards.
Valence: the degree to which a person values the reward, the results of success.

15
The staff ought to have the conviction that the more his effort, the better his performance and the
better the execution of his job, the higher will be the reward. The reward must captivate the
individual or urge him to work for it i.e. there ought to be a positive co-relationship between a
person's exertion in performing a job and an attractive result in which the person values. This
theory is mostly based on job performance as staffs expect potential job promotions and pay
raises which will keep them working hard so as to achieve personal goals. In this theory, there is
a relationship between compensation and rate of performance of the staffs. Therefore, for an
organization to reduce the staff turnover rate, the employer should increase the staff expectations
which will also lead to above average rate of performance among the staff of the organization.
The above theories related to my study in that, the greater the job satisfaction the less likely is
the turnover intention. Thus, a person with a high level of job satisfaction holds positive attitude
toward the job and conversely the person who is dissatisfied with the job holds negative attitude
about the job. It means that staffs who are satisfied on their job will retain their jobs and not quit
so increase in job satisfaction results in decrease in employee turnover.
1.13 Conceptual Framework
The conceptual framework illustrates the relationship between the independent and dependent
variables. This study presents a relationship between the independent variable which is the
influence of staff turnover and the dependent variable which is the project performance in three
primary independent variables that form the basis of the research.
First is cost which is narrowed down to production cost, recruitment cost and training cost.
Secondly is productivity which is broken down to supervision, innovation and product
development and technical expertise. Lastly, is staff morale which is broken down to conflict at

16
work place, staff absenteeism and job stress. The dependent variable is project performance
which is measured in terms of scope, quality of delivery, budget and stakeholder interest.
Independent Variables Dependent Variables
Figure 1.1 Conceptual Framework
(Researcher, 2019)
Cost
Production cost
Recruitment cost
Training cost
Productivity
Supervision
Innovation and product
development
Technical expertise
Staff Morale
Conflict at workplace
Staff absenteeism
Job stress
Project Performance of the
Organization
Project Scope
Quality of the delivery
Within Budget
Meet stakeholder interest
17
CHAPTER TWO
LITERATURE REVIEW
2.1 Introduction
This chapter focused on the works of previous scholars who have studied the influence of staff
turnover in organizations. The chapter presents a theoretical and empirical review on the subject.
The chapter's focus was on influence of staff turnover in the banking sector and its effect on
project performance.
2.2 Review of the Literature
The researcher used variables like cost, productivity and staff morale to indicate how staff
turnover influences project performance in the banking sector.
2.2.1 The influence of cost on project performance
Achieving optimal financial performance is one of the key performance goals in every
organization, as indicated by Armstrong and Armstrong (2011). High staff turnover within
organizations has been empirically found to have negative influence on the financial
performance of organizations. Steers (2002) states that staff turnover is costly and disruptive.
Costly, as it reduces the output and disruptive, as it requires that schedules and programmes to be
modified. This is true because staff turnover causes the organization to lose a lot of money
because they have to employ other agency staff to come and help. The agency staff is paid from
the organization’s coffers and it becomes very expensive. A study by Woods and Macaulay
(1989) revealed that for employers, the worst impact of turnover is lost profitability. Woods and
Macaulay (1989) were two of the pioneers studying the correlation between turnover rate,

18
performance and profitability. In their study they highlighted the linkage and alerted hospitality
employers to the harm associated with high employee turnover rates on the business profitability.
Mboya Deogratius (2009) research on investigation of the impact of labor turnover in Public
organizations, in his case study research design, sampled 250 respondents in Ilala Municipal. He
concluded that differences in payment of salaries and provision of fringe benefits forced those
who are lowly paid to seek for greener pastures in other organizations, also lack of working
facilities and equipment leads to turnover, for example, lack of teaching and learning facilities in
school forced teachers to seek for alternative jobs. Mboya Deogratius (2009) recommended that
work environment in all municipals sections should be improved and also improved management
styles in all sections, training on better management practice should be done to management
staffs.
Phillips and Gully (2013) argue that dysfunctional staff turnover can hurt organizational
performance if top performers leave and replacement cost increases. For example, it has been
estimated that on average, it costs an organization one-third of a new hire’s annual salary to
replace a staff (Scott & Byrd, 2012). This underscores the need raised by Boella and Goss
(2013), for organizations to analyze the incidence and nature of staff turnover so that action may
be taken to influence the turnover and its potential impacts on key result areas such as
recruitment and training costs, on overall profitability and service quality levels.
Marsh and Mannari (2007) observed that costs that emanate from staff turnover are derived
from a number of different sources, a few of which include: recruitment and replacements of
staffs including administrative expenses, advertising, screening and interviewing, and services
associated with selection, such as security checks, processing of references, and, possibly,

19
psychological testing; administrative hiring costs. According to Muhammad et al. (2013),
replacing staffs can cost an organization three times more than the value that the staffs will
contribute to the organization within a year. This is because new staffs need to be trained, as the
outgoing staffs also need to be compensated based on the reason why the staff left the
organization.
2.2.2 The influence of productivity on project performance
According to Voudouris, Owusu, Dorne and Lesaint (2008), the basics of good customer service,
availability, accessibility and responsiveness, remain at the core of service delivery and these can
be affected by staff turnover; and more so, when it relates to functional quality. The term
functional quality is defined by Kandampully (2002) as a classification of service quality
dimension that represents how the service is delivered and pertains to the interpersonal and
relational part of the service process. Curtis (2012) argues that service quality in relationship
marketing terms is as much managing the quality of the relationships as the management of the
quality of service.
Munsaka (2014) defines productivity as the rate of production per unit of time. According to
Muhammad et al. (2013), staffs who are experienced in producing a particular unit of output use
less energy in producing the unit within a shorter period of time than non-experienced ones.
According to Robbins (2003), staff turnover is costing South African organizations millions of
rands in decreased efficiency. He further states that in the United States, staff turnover is
estimated at $40 billion a year, in Canada $12 billion and in Germany DM 60 billion (Robbins,
2003). The cost of staff turnover and the impact thereof on productivity alone is enough to
depress any human resource manager and the organization. This is because there might be a

20
delay of service delivery while waiting for the replacement staff to arrive. In addition, there
might be production losses while assigning and employing replacement staff (Ziel&Antointette,
2003). Often the organization experiences a waste of time due to inexperienced replacement of
staff. Management and other staff spend valuable time not doing their job but trying to orientate
the replacement staff.
Vance (2009) measures staff productivity using factors like production, billable hours, ill rate,
and degree of supervision, among others. Marsh and Mannari (2007) claimed that indirect costs
of staff turnover are about 70-85% of hidden costs such as lost productivity and opportunity
costs. Marsh and Mannari (2007) specifies that lost productivity includes those associated with
the interim period before a replacement can be placed on the job; lost productivity due to the
time required for a new worker to get up to speed on the job; lost productivity associated with the
time that co-workers must spend away from their work to help a new worker; costs associated
with the period prior to voluntary termination when workers tend to be less productive. A study
conducted by Talent Management Alliance (2013) in manufacturing sector in Saudi Arabia
revealed that staff with lower job tenure struggled with attaining production goals than their
experienced counterparts. As such, it can be argued that high staff turnover impacts negatively
on productivity within the organization.
According to Marsh and Mannari (2007), a departing staff may cause additional indirect
expenditures or losses to the company, such as monetary compensation to outside substitute
staffs, in order to compensate temporarily for the performance downfall and the financial value
of the loss of production and/or customers to competitors due to failure to deliver products or
services on schedule which can be directly attributed to dysfunctional turnover losing good

21
performers. This loss will continue until a replacement is found and becomes productive at the
level of his or her predecessor.
Research done by Milanzi (2008) on Assessment of the causes and effects of labor turnover on
banking industry, the case study design sampled 82 respondents to represent a population of
Tanzania Investment Bank staff, she found out that the turnover was mainly caused by low
remuneration packages, unequal treatment among TIB staffs and lack of communication between
the management and staff of other department.
Milanzi (2008) recommended that promotion and salary increments should be clear and open to
every staff. Staffs should be encouraged to read and understand human resources policy. Also all
members of staff need to have information about organization production, its customers, its
performance compared to the competitors, the strategy to win the market and their benefits.
2.2.3 The influence of staff morale on project performance
Staff morale points to the health of internal relationship which is as important as external
relationships (Osarenkhoe, 2007). It is therefore ultimate that the success or failure of service
delivery is due to the efforts of the organization’s staffs (Pride & Ferrell, 2014). Internal
responsiveness capability of the security firm has a direct impact on the responsiveness of the
customers. Therefore, for effective service delivery, relationships must be good not only between
the front-line staff and the customer, but also with all the internal stakeholders in the
organization supporting the front-line staff (Curtis, 2012). To that end, Berndt (2004) suggests
that it is essential that staffs be motivated and satisfied.
22
Boxall et al (2003) New Zealand study found out that the main reason for people leaving their
employer was for more interesting work elsewhere. It is generally accepted that the effect of job
satisfaction on turnover is less than that of organizational commitment.
A 2002 study by Kirshenbaum and Weisberg of 477 employees in 15 firms examined
employees’ job destination choices as part of turnover process. One of their main findings was
that coworkers’ intentions have a major significant impact on all destination options. The more
positive the perception of their coworkers desire to leave, the more employees themselves
wanted to leave. Kirshenbaum and Weisberg therefore suggest that a feeling about co-workers
intention to change jobs or workplace acts as a form of social pressure or justification on the
employee to make a move.
In a study done on the turnover impact on health care organizations, Waldman, Kelly, Arora, and
Smith (2004) found that a constantly high turnover rate de-motivated the remaining employees
by imposing repetitive training obligation to them. This was found to be the case in the
hospitality industry in the U.S. as early as 1989 (Woods & Macaulay, 1989)
Staff turnover can also have a negative impact on other staffs by disrupting group socialization
processes and increasing internal conflict, which can lead to triggering additional absenteeism
(Neo, Hollenbeck, Gerhart & Wright, 2006). In addition, the interpersonal bond that is developed
between staffs is central to the communication patterns that are characteristic and unique to any
organization. People grow professionally and personally, and good employers are able to
accommodate these changes in the circumstance. A highly satisfied workforce is far more
capable of meeting organizational goals and customer needs than an apathetic and uninspired one
(Swanepoel, Erusmus, Van Wyk& Schenk, 2003). Tyani (2001) states that cost is not only
23
financial but must also be measured by the damage to staff morale and deficits in meeting
community demand.
Changes occurring due to staff turnover may require that staffs work extra hours to mitigate
temporary production shortfall and this affects their work-life balance (Armstrong, 2009). Nel
(2009) defined work-life balance as a state in which staff can maintain a happy and healthy
personal life while being successful at work, which gives them a sense of personal fulfillment.
Feld and Cohen (2010) argued that work-life balance manifest in the congruence of different
roles each of us choose to perform in our lives, blending in with our work role in a way which
energizes us to do and be all that we want. It shows that work-life balance is achieved when there
is harmony between five aspects of life namely: our work, our personal lives, our family, our
friends and the community in which we live.
2.2.4 The influence of Project Performance on project
Mbogo (2016) found that a well performing project is one that achieves deliverables that are
prior agreed upon to satisfy the project customer. Krzysztof, Potkańsk, and Stanisław, (2011)
discovered that project management is key in planning how a project should be done just at the
very point of planning. Nyonje, Ndunge and Mulwa (2012) found that in study of qualities of
projects that are deemed to have perfomed well, is when all the stakeholders interest are
met(Tonea, 2013).
Pillai, Joshi and Rao (2002) found that two models developed to measure project performance
are the Integrated Performance Index and Key Performance Indicators. The Integrated
Performance Index was developed by Pillai et al. (2002) to measure the performance of R&D
projects, while Key Performance Indicators (KPIs) are the UK construction industry’s measure

24
project performance based on ten identified parameters. These parameters consist of seven
project performance indicators (construction cost, construction time, cost predictability (design
and construction), time predictability (design and construction), defects, client satisfaction with
the product and client satisfaction with the service) and three company performance indicators
(safety, profitability and productivity)(Nguyen & Watanabe, 2017). The use of such indicators to
evaluate project performance is very common. Many industries employ industry-specific KPI
systems to measure process performance that is critical to the success of a project. Mir and
Pinnington (2014) indicated that notwithstanding their popularity, KPIs seem to be more
appropriate for assessing performance at the project level. As a result, in this study, the KPIs
were adapted with the need to consider the accessibility of data collection because of the
multifaceted project’s outcome (Carvalho, Patah, & Bido, 2015)]. This method of determining
performance indicators was considered a reasonable approach to assess the performance quality
and success of a project (Sage, Dainty, & Brookes, 2014).
2.3 Summary of the Reviewed Literature
The literature presented the motivational theories such as Maslow’s hierarchy of needs, Herzberg
and Vroom’s expectancy theory to support the topic of influence of staff turnover on projects
performance.
The situation of turnover can turn to be a vicious cycle. As discussed from the three theories,
motivation issue leads to turnover, and the turnover may reduce motivation of remaining
employees (Kim &Jogaratnam, 2010). Waldman et al (2004) stated that constantly high turnover
rate leads to repetitive training obligation of remaining employees. Experienced colleagues are
responsible to train new comers. When the turnover rate remains high, there are always new

25
comers. This situation certainly escalates the usual workload of remaining employees. In
addition, they have less time to perform their own tasks. Given that their focus was partly shifted
to conduct training, they may perceive limited opportunity to actualize their value in their job
and hence de-motivated.
2.4 Knowledge Gap
The researchers have tried to find out the reasons for staff turnover in which their conclusion was
based on the job satisfaction. However, they did not indicate the influence of staff turnover in the
banking sector and specifically at Family Bank limited in Kenya. This therefore created a
knowledge gap on the link between these variables with a specific reference to Family Bank
Limited in Kenya. The findings obtained will influence how Family Bank manages staff turnover
and in turn will be able to realize the benefits in terms of improved project performance.

26
CHAPTER THREE
RESEARCH DESIGN AND METHODOLOGY
3.1 Introduction
This chapter addressed the following areas; research design, research site and rationale, target
population, sampling procedure, sample size, data collection procedure, research instrument, data
analysis techniques and presentation and ethical consideration.
3.2 Research Design
According to Cooper and Schindler (2006), research design is a detailed plan which guides a
research study towards its objectives so conceived to obtain answers to the research questions.
This study used descriptive design which is the method of collecting information by interviewing
or administering a questionnaire to a sample of individuals (Orodho, 2003). It can further be used
when collecting information about people’s attitudes, opinions, habits or any variety of
education. In the views of Houser (2011), the research design provides in-depth information
about the characteristics of subjects within a particular field of study. Houser further argues that
descriptive studies can also help identify relationships between variables. This research design
was adopted because of its power to determine the relationship between study variables. In this
study, the descriptive design assisted the researcher determine the relationship between
independent variable as staff turnover and the dependent variable as project performance.
3.3 Research Site and Rationale
The research site for the study was Family Bank head quarter in Nairobi. This is because it
helped provide the necessary required information for the study on influence of staff turnover on
project performance in the banking sector. The rationale for choosing Family bank as a case
27
study is that the bank is a Tier II bank and it has faced a serious problem of staff turnover in both
managerial and clerical positions.
3.4 Target Population
According to Saunders, Lewis and Thornhill (2003), a population is the full group of potential
participants to whom the researcher wants to conduct the research for the study. In this study, the
population was comprised of 80 staff of Family Bank (Records from human resource, Family
Bank headquarter in Nairobi).
3.5 Study Sample
The researcher used sampling procedures and sample size to determine the study sample.
3.5.1 Sampling Procedure
Sampling refer to a procedure by which a relatively modest number of people, objects or events
is chosen and analyzed in order to discover something about the whole population from which it
is chosen, (McDaniel & Gates 2004). According to David (2005) and Mercado (2006), sampling
essentially involves a system of selecting a population representation from the general population
depending on the objective of the study, availability of money, time and effort in gathering
research data. Mugenda and Mugenda (2003) stated that a 10% of the population is considered a
good sample to effectively represent the entire population even if the findings were generalized
provided that the sample is evenly distributed and homologous in nature.
In order to reach the desired number of respondents, the researcher used simple random
sampling. This is because Simple random sampling enabled the researcher to choose the
respondents based on the fact that they had desirable characteristics and variables related to the
issue that was being studied.

28
3.5.2 Study Sample Size
An analysis was conducted among the staffs of Family bank. The respondents were both male
and female staffs of Family bank. The sample was obtained from the formula from (Nassiuma,
2000).
Where:
- sample size
-population size which is 80 staffs
- Confidence level will be 95%
– Error margin which is 5%
The sample size was 67 respondents.
Table 3. 1 Sample size
Category Population Sample Size
Finance
Human Resource
Treasury
Credit Administration
Personal Banking
Corporate Banking
Service Delivery
Total
10
5
9
11
15
10
20
80
8 ( )
4
8
9
13
8
17
67
Source: Family Bank

29
3.6 Data Collection
The researcher used data collection instruments to gather information which were analyzed to get
the desired results.
3.6.1 Data Collection Instruments
The data was collected by the use of questionnaires. This was accomplished by approaching
staffs within sampled bank branches, explaining the objective of the research and handing them
the questionnaire to fill. Glaser and Strauss (2009) explain that questionnaires are an important
instrument for research as a tool for data collection. The use of questionnaires was justified to
the extent that questionnaires are an effective way of collecting information from a large literate
sample in a short span of time and at a reduced cost than other methods.
3.6.2 Pilot Testing of Research Instruments
According to Connelly (2008), a pilot study sample should be 10% of the sample. In our
research, the researcher administered 7 questionnaires to the staff at Family bank Kasarani
branch prior to the main study. This allowed the researcher sufficient time to seek clarification
for suggestion and necessary corrections from the respondents.
3.6.3 Reliability of Research Instruments
According to Mugenda and Mugenda (2003), reliability is a measure of the degree to which a
research instrument yields consistent results after repeated trials. The researcher conducted the
pre testing to ensure the questionnaire’s reliability and to make sure that measures were free
from error and therefore yielded consistent result. The researcher also used the Cronbach’s alpha
to test the reliability of the questionnaire. The Cronbach‘s Alpha helped the researcher find out
how well the item in a set positively correlate to one The Cronbach’s alpha reliability coefficient

30
ranges between 0 and 1. The closer the Cronbach’s alpha coefficient is to 1.0, the greater the
consistency and reliability. According to Sekaran (2007), reliability less than 0.60 are poor, those
in the 0.07 range are acceptable and those over 0.80 are good. As a rule of thumb, Sekaran
(2007) interpreted Cronbach‘s Alpha as follows:
3.6.4 Validity of Findings
According to Joubert and Ehrlich (2007), validity denotes the degree to which a measurement
instrument actually measures what it is intended to measure. . The validity of a measure is not
absolute; rather, it is relative to the situation in which the selection device is being used. Face
validity though done through proof reading of the questionnaires by Family Bank staff and
strong references drawn through Meta-analysis on previous research and related theory on the
variables. Expert’s opinions was included on the content of questionnaires guide.
Operationalization was done to eliminate threats to construct validity. Evaluator apprehension to
eliminate fear from the respondents was performed.
3.6.5 Data Collection Procedure
The study used questionnaires to gather data because according to Mugenda&Mugenda (2003),
questionnaires are the most favored on the ground because they are easy to administer and they

31
are time saving. The questionnaires were formulated according to the research objectives. The
questionnaire contained both closed ended and open ended questions. The researcher employed
drop and pick method of collecting the questionnaires to allow the respondents adequate time to
sufficiently answer the questionnaires in a free environment.
3.7 Data Analysis and Presentation
According to McDaniel and Gates (2004), the objective of data analysis is to translate and make
inferences huge amount of collected data. For order, interpretation and drawing conclusion to
facilitate decision making, data was exported to SPSS for coding, editing to facilitate
computation of inferential statistics to develop generalization from sampled population.
Measures of central tendencies (mean), measures of distribution (percentages) and means of
variation (standard deviation) were used to analyze indicators of the variables. Due to the non-
numerical nature of qualitative data, thematic analysis was used to identify common themes in
the responses for the open-ended questions (Jha, 2014). Qualitative data was organized into
themes that are in line with the research objectives. Qualitative and quantitative analysis were
combined to enable a rich description of the findings. Data was presented in bar graphs, pie
charts, frequency distribution, and percentages.
3.10 Ethical Considerations
According to Mugenda and Mugenda (2003), researchers must be concerned about other
peoples’ quality of life. They must, therefore, be people of integrity who would not take research
for self-gain or research that have negative effect on others. The researcher explained the
purpose of the study to the respondents and information given by the respondents treated as
confidential with non-disclosure of respondents’ identities. The researcher gave ample time to
clarify the purpose of the research to the participants. Research permit was acquired and consent

32
from all the participants obtained while keeping the objectives as the greatest consideration
throughout the research period.

33
CHAPTER FOUR
DATA ANALYSIS AND PRESENTATION OF FINDINGS
4.1 Introduction
The chapter addressed the analysis of the data that was collected from the questionnaire. In
addition, the analyses involved the research objectives and basic information of the respondents.
The chapter begins with the identification of the response rate, analysis of the general
information, the descriptive analysis and determining the relationships on the variables.
4.2 Response Rate
The researcher distributed a total of 67 questionnaires which were administered to the Finance,
human resource, treasury, credit administration, personal banking, corporate banking and service
delivery. The researcher could not obtain 100% of the questionnaires because 4 were not filled
because the respondents went on leave leaving the questionnaire an unanswered while two were
ineligible hence could not be included analyzing the data. Also, the willingness of the
respondents to participate in the study ensured high response rate. The response was determined
and represented in the table 4.1.
Table 4. 1 Response Rate
Frequency Percentages
Returned 61 91.04
Not returned 6 8.96
Total 67 100
Source: Primary Data

34
Table 4.1 indicates that those questionnaires that were duly filled and received for analysis
accounted for 91.04%. According to Mugenda and Mugenda (2012), a response rate of 50%
is considered adequate , 60% is good and 70% and above is excellent for a study. Thus, a
response rate of 91.04 % was fit and reliable indicating that the analysis could be done using the
above questionnaires.
4.3 Reliability Statistics
The Cronbach’s alpha coefficient, alpha coefficient was determined from the constructs of the
questionnaires. The results were indicated in table 4.2
Table 4. 2 Reliability Statistics
Cronbach's Alpha N of Items
.854 21
Source: The Researcher
Table 4.2 indicates that a Cronbach ‘s Alpha coefficient, alpha coefficient was 0.854 that
indicates it was good for further statistical manipulations
4.4 Demographic Characteristics
The general information for the study involved the analysis of gender, the position held by the
respondents in the organization, number of years the respondents had worked for the
organization and the level of education. The analyses were presented in section that follows.
4.4.1 Gender of the Respondents
The study sought to determine whether there was significance of gender on the influence of
technological innovations on projects performance. The results were presented on the table 4.2.

35
Table 4. 3 Respondents Gender
Category Frequency Percentage
Female
Male
Total
40
21
61
65.57
34.43
100
Source: Primary Data
Table 4.3 showed that 65.57% of the respondents were female and 34.43% were male. This
implied that more female staff than male staff at Family bank responded to the research. It can be
attributed to the fact that, there are more female employee at study site than males.
4.4.2 Academic Qualification
The researcher sought to find out the academic background of some of respondents, the project
manager, project members and office members. The results indicate that all the respondents had
cleared their secondary school and were in college. This verifies that the respondents were able
to read and respond to the data collection tool.
Table 4. 4 Respondents’ academic qualification
Category Frequency Percentage
PHD
Masters
Undergraduate
Diploma
Total
1
16
29
15
61
1.64
26.23
47.54
24.59
100
Source: Primary Data

36
4.4.3 Position Held in the Organization
The study sought to determine whether there was significance of position held in the
organization on the influence of staff turnover on projects performance. The position held was
categorized into project manager, project member and office member. The results were presented
on the table 4.4 below.
Table 4. 5 Position Held
Category Population Percentage
Project Manager
Project Member
Office Member
Total
7
29
25
61
11.48
47.54
40.98
100
Source: Primary Data
4.4.4 Working Duration at Family Bank
The respondents were requested to indicate the number of years they have served at Family
Bank. Their responses is as indicated that 5% have been in the Family bank for duration of above
ten years, 33% a duration of between 5& 10 years, 46% 1 & 5 years while below one year was
16%.
Table 4. 6 Duration worked
Category Frequency Percentage

37
Above 10years
5-10 years
1-5 years
Below 1 year
Total
3
20
28
10
61
4.92
32.79
45.90
16.39
100
Source: Primary Data
4.4.5 Turnover rate in past 5years
This aimed at establishing the influence of staff turnover and hence the study sought to find the
rate of staff turnover at family bank. The result findings as shown below clearly indicated the
rate of staff turnover was very high 81% while 19% said it was medium while none indicated
that the rate was low.
Table 4.7 Rate of turnover
Category Population Percentage
High
Medium
Low
Total
26
6
0
32
81.25
18.75
0
100
Source: Primary Data
The researcher aim of collecting demographic data was to ensure fair representation of males and
females in the study and to ensure even distribution of staff per department in the study.

38
4.4.6 Factors influence on turnover
The respondents were asked how factors such as salaries and benefits, job security, working
environment and promotion, recognition and growth would influence staff turnover at the scale
of 1. A very great extent 2. Great extent 3. Moderate extent 4. Low extent. The result finding
showed that 62.30% mentioned that the factors influenced staff turnover to a very great extent
while 32.79 said that the factors influenced staff turnover to a great extent, 4.92% said that the
factors influenced staff turnover to a moderate extent and no individual said that the factors
influenced staff turnover to low extent
Table 4. 8 Influence of factors
Extent Frequency Percentage
Low extent 0 0.00
Moderate extent 3 4.92
Great Extent 20 32.79
A very great extent 38 62.30
Total 58 100
4.4.7 Career Change
The respondents were asked if they would consider career change or move. The result of the
finding shows that a considerable number would like to change career i.e. (37) 60.66% while
(24) 39.34% said they would not consider changing career or moving to another institution. The
results clearly show that there would be high staff turnover if the respondent got an opportunity
to fulfill their desire to move.

39
Table 4. 9 Consider career change
Category Population Percentage
Yes
No
Total
37
24
61
60.66
39.34
100
Source: Primary Data
4.5 Influence of Costs on Project Performance
Second part of the questionnaire contained information the researcher wanted to find out
regarding influence of staff turnover to costs on project performance.
4.5.1 Influence to general financial position.
The study requested the respondents to give their opinion on whether staff turnover influenced
the general financial position of their organization. The figure below shows that the majority of
respondents 70% believed that general financial position of family bank was influenced by high
rate of staff turnover while 30% which is the minority of the respondents believed that the
general financial position financial position of family bank was not influenced by high rate of
staff turnover as shown in table 4.10
Table 4. 10 Influence to general financial position
Category Percentage
Yes
No
Total
70
30
100
Source: Primary Data

40
4.5.2 Influence of Costs on Project Performance
The respondents were request to indicate the level of their agreement to statements provided in
Likert scale of 1-5 where 1 = to strongly disagree to 5 strongly agree. The findings are shown in
table 4.11 below
Table 4. 11 Influence of Costs on Project Performance
Sta
tem
en
ts
Str
on
gly
Agre
e
Agre
e
Neu
tral
Dis
agre
e
Str
on
gly
Dis
agre
e
Mea
n
ST
D
DE
V
Staff turnover has negative
impact on the financial
performance in this organization
31(50.8) 30(49.2) 0 0 0 4.49 0.50
Staff turnover leads to more use
of money and resources to train
new staff members
12(19.7) 44(72.1) 5(8.2) 0 0 4.11 0.51
Turnover increase costs per unit
in your department 14(23) 44972.1) 3(4.9) 0 0 4.18 0.50
Staff turnover influence the
general financial position of
your organization
23(37.7) 38(62.3) 0 0 0 4.37 0.48
Source: Research data
The majority of the respondents i.e. 31 (50.8%) strongly agreed to the statement that staff
turnover had negative impact on financial performance in this organization and 30 (49.2%)
agreed on the same statement. The statement had a mean of 4.49 and std. dev. of 0.50 implying
that, staff turnover had a negative impact on financial performance in family bank. The findings
of this study are in agreement with Armstrong and Armstrong (2011) who stated that high staff
turnover within organizations have negative influence on the financial performance of
organizations and Steers (2002) who added that staff turnover is costly and disruptive

41
On the statement that staff turnover leads to more use of money and resources to train new staff
members, 12 (19.7%) strongly agreed with the statement and 44 (%) agreed while 5 (8.2%) were
neutral to the statement. Descriptively, the statement had a mean of 4.49 and std. dev. of 0.50
implying that more money and resources were spent in training new staff members in family
bank. The findings of this study concurs with Muhammad et al. (2013), who found that,
replacing staffs can cost an organization three times more than the value that the staffs will
contribute to the organization within a year. This is because new staffs need to be trained, as the
outgoing staffs also need to be compensated based on the reason why the staff left the
organization. This is true because staff turnover causes the organization to lose a lot of money
because they have to employ other agency staff to come and help further digging into the
organization’s coffers to pay them which is generally very expensive.
The respondents were asked to agree or disagree with the statement that staff turnover increase
costs per unit in your department. 44 (72.1%) of the study respondents agreed that staff turnover
increased per unit costs in departments and 14 (23%) and strongly agreed while 3 (4.9%) were
neutral that staff turnover increased departmental costs. Descriptively, the statement had a mean
of 4.18 and std. dev. of 0.50 implying that staff turnover increased departmental costs per unit in
family bank. Such costs per unit were revealed by Marsh and Mannari (2007) who observed that
costs that emanate from staff turnover are derived from a number of different sources, a few of
which include: recruitment and replacements of staffs including administrative expenses,
advertising, screening and interviewing, and services associated with selection, such as security
checks, processing of references, and, possibly, psychological testing; administrative hiring
costs.

42
The fourth statement was to find out the influence of costs on project performance asked the
respondents to agree or disagree on “staff turnover influence the general financial position of
your organization”. The majority of the study respondents i.e. 38 (62.3%) agreed with that
statement and 23 (37.7%) strongly agreed that staff turnover influenced general financial
position of family bank. The statement had a mean of 4.37 and std. dev. of 0.48 implying that
staff turnover influence the general financial position of family bank. Optimal financial
performance is one of the key performance goals in every organization and the finding of this
study revealed that staff turnover affects the general financial performance.
The study findings concurs with Phillips and Gully (2013) added to it by stating that high staff
turnover can hurt organizational financial performance by increasing staff replacement costs
especially if top performers leave. Philip (2008) also stated that staff turnover involves allocation
of tasks to less skilled and inexperienced employees who may not have the technical know-how
on how to execute the required services, leading to the realization of lower customer satisfaction.
This has ripple effects on decline in sales revenue and hence further loss in organizational
efficiency by affecting internal business processes.
4.6 Influence of Productivity on Project Performance.
On the third section the researcher wanted to find out the influence of staff turnover to
productivity on project performance. First question contained six statements that required the
respondents to indicate the level of agreement to question on Likert scale 5) Strongly Agree 4)
Agree 3) Neutral, 2) Disagree and 1) Strongly Disagree. The other two questions focused on the
influence of turnover on time and quality of service rendered.

43
4.6.1 Influence of Productivity on Project Performance
The respondents were asked rate the turnover influence of productivity on project performance.
The result findings are shown in the table below.
Table 4. 12 Influence of Productivity on Project Performance
Sta
tem
en
ts
Str
on
gly
Agre
e
Agre
e
Neu
tral
Dis
agre
e
Str
on
gly
Dis
agre
e
Mea
n
ST
D
DE
V
Staff turnover influences staffs
meeting their deadlines and
targets
7
(11.5)
47
(77)
7
(11.5) 0 0 4 0.48
Staff turnover has negative
impact on innovation and
continuity in this organization
14
(23)
45
(73.7)
2
(3.3) 0 0 4.19 0.47
Staff turnover reduces efficiency
in your department
9
(14.8)
49
(80.3)
3
(4.9) 0 0 4.09 0.43
Staff turnover leads to wastage of
resources in this organization
12
(19.7)
43
(70.5)
6
(9.8) 0 0 4.09 0.53
The organization meets the
customer needs during the high
staff turnover period
0 7
(11.5)
14
(23)
40
(65.6) 0 2.45 0.7
Source: Primary data
The researcher asked the respondents whether staff turnover influenced staffs meeting their
deadlines and targets. The majority of the respondents i.e. 47 (77%) agreed on the statement that
staff turnover indeed influenced staff meeting their deadlines and targets, while 7 (11.5%)
strongly agreed and equated together to those who were neutral still at 11.5%. the statement had
a mean of 4.0 and std. dev. of 0.48. This was in agreement with Ziel & Antointette, (2003) who
stated that, often the organization experiences a waste of time due to inexperienced replacement
of staff. Management and other staff spend valuable time not doing their job but trying to

44
orientate the replacement staff. Marsh and Mannari (2007) added that indirect costs of staff
turnover are about 70-85% of hidden costs such as lost productivity and opportunity costs. One
respondents wrote “when a staff leaves a vacuum is created and it’s like a broken conveyer belt
that halts production line”.
The second statement sought to find out if staff turnover had negative impact on innovation and
continuity in Family Bank. The respondents who agreed to the statement that staff turnover had a
negative impact on innovation and continuity were 45 (73.7%), 14 (23%) strongly agreed while 2
(3.3%) were neutral. The statement had a mean of 4.19 and std. dev. of 0.47 denoting that, staff
turnover have negative impact on innovation and continuity of an organization. This findings are
in agreement with Talent Management Alliance (2013) whose study findings in manufacturing
sector in Saudi Arabia revealed that staff with lower job tenure struggled with attaining
production goals than their experienced counterparts. As such, it can be argued that high staff
turnover impacts negatively on continuity within the organization. One study respondent
commented that “it’s usually a huge blow when tech gurus leave”, meaning that a person who
was conversant with the system
The research further sought to find out whether staff turnover reduced efficiency in various
departments. Majority of the respondents i.e. 49 (80.3%) agreed to the statement that, Staff
turnover reduces efficiency in your department and 9 (14.8%) strongly agreed while 3 (4.9%)
were neutral. That statement had a mean of 4.09 and std. dev. of 0.43 implying that Staff
turnover reduced efficiency in departments.
Further 43 (70.5%) of the respondents agreed to the statement that staff turnover leads to wastage
of resources in your organization, 12 (19.7%) strongly agreed to the statement and 6 (9.8%) were
neutral. The statement that staff turnover leads to wastage of resources in your organization had a

45
mean of 4.09 and std. dev. of 0.43 implying that staff turnover actually led to wastage of
resources at family bank. Marsh and Mannari (2007), stated that departing staff may cause
additional indirect expenditures or losses to the company, such as monetary compensation to
outside substitute staffs, in order to compensate temporarily for the performance downfall and
the financial value of the loss of production and/or customers to competitors due to failure to
deliver products or services on schedule which can be directly attributed to dysfunctional
turnover losing good performers. This statement is in agreement with findings of this study.
Further, 40 (65.6%) of the respondents disagreed on the statement that, the organization meets
the customer needs during the high staff turnover period while 14 (23%) were neutral and
7(11.5%) agreed that customers’ needs were met in spite of high staff turnover. The statement
had a mean of 2.5 and std. dev. of 0.70 implying that the customer needs were partially met
during the high staff turnover period. Aden and Gichiga (2016) found out that, customer
satisfaction, quality service delivery, good customer care relationship management had positive
and significant effect on productivity and organizational performance. The study findings
revealed that, service points were always covered even if front-line staff left so as to ensure
seamless flow of services to customers. Internal responsiveness capability of the organizations
has a direct impact on the responsiveness of the customers. Therefore, as (Curtis, 2012) argued to
ensure effective service delivery, relationships must be good not only between the front-line staff
and the customer, but also with all the internal stakeholders in the organization supporting the
front-line staff. This was found to be implemented by family banks which ensured frontline
desks were always operational in spite of staff turnover.

46
4.6.2 Quality of service during staff turnover period
The respondents were asked whether the level of service quality was high or low during the high
staff turnover period. The findings are as shown in the table below
Table 4. 13 Quality of Service
Category Population Percentage
High
Low
Total
54
7
61
89
12
100
Source: Primary Data
The majority responded that the quality of service was high during staff turnover period i.e. 54
(89%) while 7 (12%) were of the opinion that the level of quality was low during the staff
turnover period. Therefore, the study revealed that, the quality of service was not affected by
staff turnover as indicated by the majority of the respondents. This was contrary to Philip (2008)
also stated that staff turnover involves allocation of tasks to less skilled and inexperienced
employees who may not have the technical know-how on how to execute the required services,
leading to the realization of lower customer satisfaction. Quality of service was not affected
mainly because those replaced to stand-in or as permanent replacement were skilled and had
prior training and experience for the tasks assigned and in some instances agency staff were
hired.
4.6.3 Time spent by new staffs
The respondents were requested to give their opinion on whether new staff members spent too
much time while doing little. The study findings are as shown in the table below

47
Table 4. 14 New staff spend too much time
Category Population Percentage
No
Yes
Total
49
12
61
80.33
19.67
100
Source: Primary Data
49 (80.33%) of the respondents disagreed to the statement that new staff members spent too
much time while doing little while 12 (19.67%) respondents agreed to the statement that newly
employed staff spent too much time while doing little. Marsh and Mannari (2007) specified that
lost productivity includes those associated with the interim period before a replacement can be
placed on the job; lost productivity due to the time required for a new worker to get up to speed
on the job; lost productivity associated with the time that co-workers must spend away from their
work to help a new worker; costs associated with the period prior to voluntary termination when
workers tend to be less productive. Productivity on project performance entails output in term of
quality and quantity, hours spent at work, relationships at workplace, and production per unit in
regard to time. Contrary to this Yang (2018) conducted a study on individual performance he
concluded that individuals’ output cannot be substantiated. The finding of this study revealed
that newly employed staff spent less time in catching up with working standard at family bank.
One of the study respondent stated that, Staff employed in banking sector are trained and
experienced and only requires induction and hence requires less time in catching up and minimal
supervision.

48
4.7 Influence of Staff Morale on Project Performance
Rate whether you agree that staff morale influence project performance? Base your answer on a
five point Likert scale: 5) Strong Agree 4) Agree 3) Neutral, 2) Disagree and 1). Strongly
Disagree. The findings of the study are as shown in table 4.15 below
Table 4. 15 Influence of Staff Morale on Project Performance
Sta
tem
e
nts
Str
on
gly
Agre
e
Agre
e
Neu
tral
Dis
agre
e
Str
on
gly
Dis
agre
e
Mea
n
ST
D
DE
V
Staff turnover disrupts
teamwork in this
organization
27(44.3) 34(55.7) 0 0 0 4.44 0.50
Staff turnover increase the
workload of every remaining
staff in your department
0 52(85.2) 6(9.8) 3(4.9) 0 3.80 0.51
Staff turnover increases
work stress to the remaining
staff in your department
8(13.1) 47(77) 6(9.8) 0 0 4.03 0.48
Staff turnover leads to long
working hours every time
some staffs leave the
organization
3(4.9) 51(88.6) 4(6.6) 3(4.9) 0 3.88 0.55
The newly employed staff
catch up with the working
standards fast
0 31(50.8) 30(49.2) 0 0 3.51 0.50
Source: Primary data
The study generated five statement to seek the influence of staff morale on project performance.
The first statement asked the respondents if staff turnover disrupts teamwork in this organization.
34 (55.7%) of the study respondents agreed with the statement and 27 (44.3%) strongly agreed
that staff turnover disrupted teamwork. The statement had a mean of 4.44 and std. dev. of 0.50
implying that, staff turnover disrupted teamwork in family bank. The study findings are in
agreement with Neo, Hollenbeck, Gerhart & Wright, (2006) who stated that staff turnover have a

49
negative impact on other staffs by disrupting group socialization processes and increasing
internal conflict, which can lead to triggering additional absenteeism. In addition, the
interpersonal bond that is developed between staffs is central to the communication patterns that
are characteristic and unique to any organization. The situation worsens is a team leader and
deputy happens to leave the organization at the same period.
The study further asked the respondents to agree or disagree on whether staff turnover increased
the workload of every remaining staff in respective departments. The majority of the study
respondents i.e. 52 (85.2%) agreed to the statement that, staff turnover increase the workload of
every remaining staff in your department 6 (9.8%) strongly agreed while 2 (4.9%) were neutral.
Descriptively, the statement had a mean of 3.80 and std. dev. of 0.51 implying that staff turnover
increased the workload of every remaining staff in respective departments. The findings of this
study concurs with Marsh and Mannari (2007) who singled out that lost productivity due to the
time required for a new worker to get up to speed on the job and the lost productivity associated
with the time that co-workers must spend away from their work to help a new worker directly
increasing the workload.
The study asked the respondents whether staff turnover increased work stress to the remaining
staff in departments, the results revealed that 47 (77%) agreed; 8 (13.1%) strongly agreed and 6
(9.8%) were neutral. The statement had a mean of 3.88 and std. dev. of 0.55 implying that, staff
turnover increased work stress to the remaining staff in respective departments. Highly satisfied
workforce is far more capable of meeting organizational goals and customer needs than an
apathetic and uninspired one. Therefore there is urgency to formulate policies to minimize high
staff turnover. Therefore it is the duty of the management to motivate the remaining employees

50
because poorly motivated and disgruntled workforce have lower productivity output which
directly translate to poor organizational financial performance.
The study further asked the respondents whether staff turnover led to long working hours every
time some staffs left the organization; the results revealed that, 51 (83.6%) agreed, 4 (6.6%) were
neutral, 3 (4.9%) strongly agreed and 3 (4.9%) disagreed. Descriptively, the statement had a
mean of 4.03 and std. dev. of 0.48 implying that staff turnover led to long working hours every
time some staffs left the organization. The findings concurs with Armstrong, (2009) who
observed that changes occurring due to staff turnover may require that staffs work extra hours to
mitigate temporary production shortfall and this affects their work-life balance.
On the last item on influence of staff morale to project performance, the study respondents i.e. 31
(50.8%) agreed with the statement that newly employed staff were fast in catching up with the
working standards while 30 (49.2%) were neutral. Descriptively, the statement had a mean of
3.51 and std. dev. of 0.50 implying that the newly employed staff catch up with the working
standards fast. The finding of this study revealed that newly employed staff spent less time in
catching up with working standard at family bank. As one of the study respondent stated that,
staff employed in the banking sector are trained and experienced and only requires induction and
hence requires less time in catching up and minimal supervision.
4.8 Project Performance
Rate whether you agree that technological innovations influence project performance? Base your
answer on a five-point Likert scale: 5) Strong Agree 4) Agree 3) Neutral, 2) Disagree and 1).
Strongly Disagree. The result of the study findings are as show in table 4.13 below.

51
Table 4. 16 Project Performance
Sta
tem
en
ts
Str
on
gly
Agre
e
Agre
e
Neu
tral
Dis
agre
e
Str
on
gly
Dis
agre
e
Mea
n
ST
D
DE
V
Well performing project is one
that stays within the scope 39(63.9) 22(36.1) 0 0 0 4.64 0.48
A project that delivers what was
prior agreed upon to satisfy the
project customer is considered as
a performing project.
50(82) 11(19) 0 0 0 4.82 0.38
Quality of the deliverables from
the organizations projects is a
key determinate of the projects
performance which technological
innovations supports
36(59) 25(41) 0 0 0 4.59 0.49
The organization aims to have
projects stay within budgets and
technological innovations
supports this
32(52.5) 29(47.5) 0 0 0 4.52 0.5
Source: Primary data
The study developed four statement to find out whether technological innovations influenced
project performance. The first statement asked the respondents to agree or disagree on whether
well performing project is one that stays within the scope. 39 (63.9%) of the respondents
strongly agreed with the statement that Well performing project is one that stays within the scope
and 22 (36.1%) agreed with that statement. The statement had a mean of 4.64 and std. dev. of
0.48 this implying that, for a project to be considered to be well performing it should stays within
the scope. Krzysztof, Potkańsk, and Stanisław, (2011) discovered that project management is key
in planning how a project should be done just at the very point of planning that it achieves
intended targets.

52
In the second statement, the study further revealed that 50 (82%) and 11 (18%) of the study
respondents strongly agreed and agreed respectively to the statement that a well performing
projects delivered what was prior agreed upon to satisfy its customers. The statement had a mean
of 4.82 and std. dev. of 0.38 denoting that for a project to be said to be well performing it should
deliver what was prior agreed upon to satisfy its customers. This is in agreement with Mbogo
(2016) who found that, a well performing project is one that achieves deliverables that are prior
agreed upon to satisfy the project customer. Therefore more efforts need to be employed to
ensure customers get what was agreed upon and in time.
The third statement asked the study respondents to agree or disagree on the statement “Quality of
the deliverables from the organizations projects is a key determinate of the projects performance
which technological innovations supports”, 36 (59%) of the respondents strongly agreed and 25
(41%) agreed that project performance is determined by technological innovations and delivers
quality. The statement had a mean of 4.59 and std. dev. of 0.49 implying that quality of the
deliverables from the organizations projects was a key determinate of the projects performance
which technological innovations supported. Nyonje, Ndunge and Mulwa (2012) found that in
study of qualities of projects that are deemed to have perfomed well, is when all the stakeholders
interest are met.
The fourth statement asked the respondents to agree or disagree with the statement that, project
performance is influenced by the organization aims to have projects stay within budgets and
technological innovations supports this; 32 (52.5%) strongly agreed and 29 (47.5%) agreed with
the statement. The statement got a mean of 4.52 and SD of 0.50, implying that a well performing
project stays within the budget and is supported by technological innovations. This findings

53
concurs with Agarwal and Dev (2013) who stated that technological innovations leads to long
term organizational success.

54
CHAPTER FIVE
SUMMARY OF FINDINGS, CONCLUSION AND RECOMMENDATIONS
5.1 Introduction
In this chapter the summary of the results finding from chapter four was discussed. Conclusion
and recommendation was also discussed based on the research findings. From the analysis and
data collected, the following discussions, conclusion and recommendations were made based on
the objectives of the study which were to determine the influence of cost on project performance
in the banking sector in Kenya, to find out the influence of productivity on project performance
in the banking sector in Kenya and to find out the influence of staffs' morale on project
performance in the banking sector in Kenya.
5.2 Discussions
The research findings are discussed below as per each research objective and research question.
5.2.1 Cost on project performance
Based on the first objective of the study on the influence of costs on project performance, the
study established that high staff turnover had negative impact on the financial performance at
family bank. This was in agreement with Steers (2002) who stated that, staff turnover is costly
and disruptive as well as reducing the output.
The study also revealed that staff turnover impacted the general financial position of family bank
concurring with Phillips and Gully (2013) who added to it by stating that high staff turnover can
hurt organizational financial performance by increasing staff replacement costs especially if top
performers leave. Philip (2008) also stated that staff turnover involves allocation of tasks to less
skilled and inexperienced employees who may not have the technical know-how on how to

55
execute the required services, leading to the realization of lower customer satisfaction. This has
ripple effects on decline in sales revenue and hence further loss in organizational efficiency by
affecting internal business processes.
The findings of the study established that staff turnover increased cost per unit and cost of
replacement. These findings are line with Scott & Byrd (2012) who estimated that it cost
organizations an average of one-third of new hire’s annual salary to replace a staff.
The result findings revealed that more money and resources were used to train new staff
members and influenced project performance thus directly influencing the general financial
performance at family bank. This findings concur with Muhammad et al. (2013) who of the
opinion that replacing staffs can cost an organization three times more than the value that the
staffs will contribute to the organization within a year. This is prompted by the fact that new
staffs need to be trained, as the outgoing staffs also need to be compensated based on the reason
why the staff left the organization.
5.2.2 Productivity on project performance
The second objective was to find out the influence of productivity on project performance. The
rate of production per unit of time defines the productivity (Munsaka, 2014) defines productivity
as the rate of production per unit of time. The study established that staff turnover influenced
staffs meeting their deadlines and targets. This was in agreement with Ziel & Antointette, 2003)
who stated that, often the organization experiences a waste of time due to inexperienced
replacement of staff. Management and other staff spend valuable time not doing their job but
trying to orientate the replacement staff.
The study also established that staff turnover had a negative impact on innovation and continuity
in the financial institution and reduced efficiency various department. This go hand in hand with

56
Muhammad et al. (2013) who stated that more experienced staff use less energy and less time in
producing a definite unit that less experienced staff. The study also found strong positive
correlation between influences of productivity on project performance. The study also
established that, turnover led to wastage of resources in family bank reason being that, the
money and resources spent on replacing leaving by hiring new staff could have been used on
project development. Productivity on project performance entails output in term of quality and
quantity, hours spent at work, relationships at workplace, and production per unit in regard to
time. Contrary to this Yang (2018) conducted a study on individual performance he concluded
that individuals’ output cannot be substantiated.
The study found out that quality of service was not impacted by staff turnover. This can be
attributed by the fact that, newly employed staff have prior working experience in banking centre
and where there was urgency, the institution engaged agency staff though a little bit expensive
before hiring .
Aden and Gichiga (2016) found out that, customer satisfaction, quality service delivery, good
customer care relationship management had positive and significant effect on organizational
performance. According to Kotler (2006) organizations are increasingly being customer centric
and are embracing customer-driven initiatives that seek to understand, attract, retain and build
intimate long term relationship with profitable customers. The results also agree with Hassan,
and Ali, (2013) who investigated the relationship between customer service and organizational
growth and found that there is appositive relationship between customer service and growth

57
5.2.3 Influence of staffs' morale on project performance
The study found strong positive correlation between staff morale and project performance.
According to Osarenkhoe (2007) staff morale points to the health of internal relationship which
is as important as external relationships. Motivation boosts staff morale and impacts on
productivity positively. Shanks (2012) referred to motivation as a personal concept that arouses
energy or drive within an individual igniting certain behaviours that give one sense of direction,
urge and consistency to perform and energy needed for achieving a task.
The study established that, staff turnover disrupted teamwork thus negatively influencing project
performance in family bank. This is factual as when a team leader leaves, especially the pleasing
one, everything seems disoriented. This can be attributed to communication channel and the
interpersonal bonds already established being severed.
The turnover influenced staff morale by increasing work stress to the remaining staff at family
bank. To avoid work stress Dobre (2013) urged managers to learn what motivated individual
employee because each person is different from others and may be motivated by different object,
management should learn this through a systematic process. Motivation is generally associated
with, achievement, improved efficiency and improved individual employee performance (Dobre,
2013). Better work environment motivates employees increasing their level of job satisfaction.
The study established that staff turnover led to long working hours every time some staffs leave
the organization. The study findings concurs with Armstrong (2009) who stated that when
changes occurs as a result of staff turnover, remaining staffs are required to work extra hours to
mitigate temporary production shortfall. Therefore it is the duty of the management to motivate
the employee because poorly motivated and disgruntled workforce have lower productivity
output which directly translate to poor organizational financial performance.

58
The study found that staff turnover increased the workload of remaining staff members, however
newly employed staff rate of catching up with working standard.
5.2.4 Project Performance
Chapelier & Shah (2013) defined project performance as the degree of achievement of a project
goal within the stipulated project period and budget.
The study establish that when a project stays within the scope it can be considered as a well
performing project. The findings are in addition to Agarwal and Dev (2013) who stated there are
two major dimensions that can be used to measure project. Objective performance and
judgmental or subjective dimension. The first dimension involves capacity utilization, market
share and profitability as financial and market based factors. The second dimension entails
customers and employees’ satisfaction and services quality as people based measures. Subjective
measure are very critical for they for they advocate for the attention that must be paid on
customer and employee satisfaction as well as quality of services being offered for this are the
prerequisite for organization profitability as and successful project performance. The study
further established that the organization aims to have projects stay within budgets and
technological innovations influenced project performance.
The study established that a well performing project is the one that delivers what was prior
agreed upon to satisfy the project customer. This findings are in agreement with Mbogo (2016)
who stated that a well performing project is the one that achieves deliverables that are prior
agreed upon to satisfy the project customer.
The study established that quality of the deliverables from the organizations projects was a key
determinate of the projects performance with support of technological innovations. Though
technological innovations leads to long term organizational success, innovations and technology

59
can also lead to risky activities for example changes in operations, high costs of installation and
training, exposure to market risks and employee dissatisfaction Simpson (2016). He added that
large organizations were more likely to embrace technological and innovations thus higher
chances of increased level of project performance as opposed to smaller organizations.
5.3 Summary of the findings
The main objective of the study was to establish the influence of staff turnover on project
performance in the banking sector in Kenya a case study of Family bank. The result findings
indicated the rate of staff turnover was very high and that considerable number of the
respondents would like to change career accounting or move to another institution. The results
clearly shows that there would be high staff turnover if the respondent got an opportunity to fulfil
their desire to move. In this study, cost, productivity and staff morale on project performance
were the variables that were used to determine the influence of staff turnover.
The study revealed that staff turnover had negative impact on the financial performance at family
bank. It also revealed more money and resources were used to train new staff members and this
direct increased cost per unit thus influencing the general financial performance at family bank.
On the number of years served at family bank, the study found that the majority of the
respondents had served for a period of less than five years.
On the influence of productivity on project performance the study established that high staff
turnover negatively influenced staffs meeting their deadlines and targets and had negative impact
on innovation and continuity of the institution. The study revealed that turnover reduced
efficiency in various departments and it also led to wastage of resources. During high staff
turnover period the study established customer needs were not met adequately.

60
The study found that the staff morale influenced project performance in that turnover disrupted
teamwork and increased the workload of every remaining staff in various department. Staff
turnover increased work stress to the remaining staff and resulted to long working hours
whenever some staffs left the organization. The study also established that the newly employed
staff caught up with the working standards fast.
The study established that a well performing project stayed within the scope and delivered what
was prior agreed upon to satisfy the project customer. The study also found out that, quality of
the deliverables from the organizations projects was a key determinant of the projects
performance which technological innovations supported so long as project stayed with the
budget.
5.4 Conclusion
The study concludes that that high staff turnover have a negative impact on the financial
performance on banking sector. This was occasioned by costs of hiring and training new staff
members.
On the influence of productivity on project performance the study established that high staff
turnover negatively influenced staffs meeting their deadlines and targets had negative impact on
innovation and continuity of the institution. The study revealed that turnover reduced efficiency
in various departments and it also led to wastage of resources and affected the organization
meeting the customer needs adequately.
Staff turnover influenced remaining staff with delays in meeting their deadlines and targets
because of vacuum created by leaving staff. During staff turnover, staff morale was affected as a
result of intrapersonal bonds that had been created over a period of time. The study concluded

61
that staff turnover had a relatively moderate impact on working hours as lower level staff normal
working hours was not affected.
5.5 Recommendation
Based on the findings of this research, the following was recommended;
To ensure staff retention and thus cut on costs on project performance the bank should employ
both intrinsic and extrinsic motivation factors in order to retain staff to avoid high staff turnover.
Job security, remuneration, and good work place environment should be assured by the
management before higher level need are met which includes; promotion, added responsibility
and higher status. Employees’ welfare should be taken care of properly and their performance
recognized through transparent reward systems for they are the instruments in which the
organizational project performance is hinged.
The bank should perform an internal staff audit based on the reasons of staff turnover.
Organizational ability to retain employees is dependent on many functional factors such as
controllable factors. Involuntary turnover refers to the discharge of staffs, whereas voluntary
turnover take place when staffs leave the job, the banking sector should strive to contain the
controllable factors.
5.6 Area for further research
The study main objective was to find out the influence of staff turnover on project performance
in the banking sector. Turnover was found to have influence of costs performance, productivity,
staff morale and affected the project performance as a whole. The study recommend further
research using different variables and on other economic sectors like manufacturing industry.

62
REFERENCES
Armstrong, M. (2003). Human resource management practice. (8thed.). London: Kogan Page
Limited.
Armstrong, M. (2009). Armstrong's Handbook of Performance Management: An Evidence-
Based Guide to Delivering High Performance. London: Kogan Page Publishers.
Armstrong, M. & Armstrong, M. (2011). Armstrong’s handbook of strategic human resource
management (1st ed.). London: Kogan Page Limited.
Berndt, A. (2004). Customer Relationship Management and Customer Service. Cape Town: Juta
and Company Limited.
Boella, M. J. & Goss, T. S. (2013). Human Resource Management in the Hospitality Industry: A
Guide toBest Practice. London, UK: Routledge Publishers.
Boxall P., Macky K. & Rasmussen E. (2003), ‘Labour turnover and retention in NewZealand;
the causes and consequences of leaving and staying with employers’,Asia Pacific Journal
of Human Resources
Carvalho, M., Patah, L., & Bido, D. (2015). Project management and its effects on project
success: Cross-country and cross-industry comparisons. . International Journal of Project
Management
Central Bank of Kenya. (2012). Annual Report. Retrieved August 12, 2013 from
http://www.centralbank.go.ke/index.php/cbk-annual-reports.
Chang, W. A., Wang, Y., & Huang, T. (2013). Work design-related antecedent of turnover
intentions: Amultilevel approach. Human Resource Management, 52(1), 1-26.
doi:10.1002/hrm.21515.
Chapelier, C., & Shah, A. (2013). Improving communication between humanitarian aid agencies
and crisis-affected people: Lessons from the infoasaid project. Network Paper, Available
at: http:// www.odihpn.org/hpn-resources/network-papers/ improving-communication-
between-aid-agenciesand-crisis-affected-people-lessons-from-the-infoasaid-project.
Connelly, L. M. (2008). Pilot studies. Medsurg Nursing.
Cooper, D. R., & Schindler, P. S. (2006). Business Research Methods (9th ed.). USA: McGraw-
Hill.
Curtis, T. (2012). CIM Coursebook 07/08 Marketing in Practice. London, UK: Routledge.
David F.P. (2005). Understanding and doing research: A handbook for beginners. Iloilo City:
Social Science Institute, CPU.

63
Dlamini-Zuma, N.C. (2009). Government Home: Economic Planning and Development
AdministrationUnit. Online. Available at: www.gov/home.asp?.
Feld, B. & Cohen, D. (2010). Do More Faster: TechStars Lessons to Accelerate Your Startup.
New York, NY: John Wiley & Sons.
Glaser, B. G. & Strauss, A. L. (2009). The discovery of grounded theory: Strategies for
qualitative research. Chicago: Aldine.
Herzberg, Frederick (January–February 1964). The Motivation-Hygiene Concept and Problems
of Manpower. Personnel Administrator (27).
Houser, J. (2011). Book Alone: Nursing Research. Sadbury: Jones & Bartlett Publishers
Jha, A. S. (2014). Social research methods. Delhi, India: Tata McGraw-Hill Education.
John B. Miner (2005). Organizational behavior 1: Essential theories of motivation and
leadership. New York: Routledge.
Joubert, G & Ehrlich, R. (2007). Epidemiology A Research Manual for South Africa. Southern
Africa: Oxford University Press.
Kazi G.F. &Zedah Z.F (2011). The contribution of individual variables: job satisfaction and job
turnover. Interdisciplinary journal of contemporary research in business.
Kim, K., &Jogaratnam, G. (2010). Effects of individual and organizational factors on job
satisfaction and intent to stay in the hotel and restaurant industry. Journal of Human
Resources in Hospitality & Tourism
Krzysztof, J., Potkańsk, T., & Stanisław, A. (2011). Internal Project M&E System and
Development of Evaluation Capacity Experience of the World Bank-funded Rural
Development, World Bank.
Marsh, R.M., &Mannari, H. (2007). Organizational Commitment and turnover: A prediction
Study. Administration Science Quarterly.
Marti, MacLeod, D & Clarke, N. (2009). Engaging for success: Enhancing performance through
employee engagement (Department for Business, Innovation and Skills).
Maslow Abraham H., (1954). Motivation and Personality. New York: Harper and Brothers
Publishers.
Maslow, A. H. (1943). A theory of human motivation. Psychological Review.

64
Mbogo, W. W. (2016). Factors Affecting Performance Of HIV/AIDS Programs In Kenya The
Case of Eastern Deanery AIDS Relief Program, Masters thesis, United States
International University.
Mboya, W. J. (2009). A Model for Determinants of Labour Mobility in the Banking Industry of
Tanzania: Employees’ Perspective.” University of Dar Es Salaam Business School.
Milanzi M. M. (2008). Assessment of the causes and effect of Labour turnover on Banking
Industry. A case of Tanzania Investment Bank Limited. Unpublished.
Mir, F., & Pinnington, A. (2014). Exploring the value of project management: Linking project
management performance and project success. International Journal Of Project
Management.
Mugenda O. M. &Mugenda A. G. ( 2003). Research Methods: Quantitative and Qualitative
Approach. Nairobi: Acts press.
Muhammad, N.T, Muhammad, R. &Riaz, A. (2013). The impact of employee turnover on the
efficiency of the organization’, Interdisciplinary Journal of Contemporary Research in
Business, Institute of Interdisciplinary Business Research, 4(9): 1-27.
Munsaka, T. (2014). Human resources management: A critical analysis of Zimbabwe’s
unemployment crisis from 1990 to 2012. Johannesburg, SA: Grin Verlag GmbH.
Nassiuma, D. K. (2000). Survey sampling: Theory and methods. . Nairobi: University of Nairobi
Press
Nguyen, L. H., & Watanabe, T. (2017). The Impact of Project Organizational Culture on the
Performance of Construction Projects. Sustainability, 9(1), 1-21.
Nel, R. (2009). Puppets or People: People and Organisational Development: an Integrated
Approach. Cape Town, SA: Juta and Company Ltd.
Neo, A.R., Hollanbeck, R.J., Gerhart, B. & Wright, P.M. (2006). Human Resource Management
(3rd Ed.). New York: McGraw-Hill.
Noe H. &Gerhet Wright. (2003). Fundamentals of Human Resource Management. Graw−Hill
Companies
Nwagbara, U., Smart Oruh, E., Ugorji, C., &Ennsra, M. (2013). The impact of effective
communication on employee turnover intention at First Bank of Nigeria. Economic
Insights - Trends & Challenges, 65(4), 13-21. Retrieved from http://www.upg-bulletin-
se.ro/archive_en
Orodho ,J.A (2003). Regional Inequalities In Education ,Population and Poverty Patterns In
Kenya :Emerging Issues and policy directions ,Population of Kenya Journal 1.
65
Osarenkhoe, A. (2007). An Exploratory Study of Implementation of Customer Relationship
Management Strategy. Business Process Management Journal, 13 (1), 170-199.
Oso, W., &Onen, D. (2009). A general guide to writing research project and report. A hand book
of beginning researchers (revised edition).
Overview of banking Industry Retrieved on 05.12.09 from http://www.equitybank.co.ke
EquityAnnual reports and financial Statements 2005, 2006, 2007 & 2008) for
Equity Bank.
Overview of banking Industry Retrieved on 05.12.09 from http:www.kcbbankgroup.co.ke KCB
Annual reports & financial statements 2007, 2008) for Kenya Commercial Bank
(K) Ltd.
Phillips, J. & Gully, S. (2013). Human Resource Management. New York, NY: Cengage
Learning.
Pillai, A., Joshi, A., & Rao, K. (2002). Performance measurement of R&D projects in a multi-
project, concurrent engineering environment. International Journal of Project
Management,
Pride, W. & Ferrell, O. C. (2014). Foundations of Marketing. New York, NY: Cengage
Learning.
Ritzer, G. (1996). Contemporary sociological theory. New York: Irwin McGraw-Hill.
Robbins, S.P. (2003). Organisational Behaviour: Concepts, Controversies and Applications (8th
Ed.). London: Prentice Hall.
Sage, D., Dainty, A., & Brookes, N. (2014). A critical argument in favor of theoretical pluralism:
Project failure and the many and varied limitations of project management. International
Journal of Project Management, 32(1), 544–555.
Saunders, M., Lewis, P. &Thornhill, A. (2003). Research Methods for Business Students (3rd
Ed.). New York: Pearson Education.
Sekaran, U. (2007). Research Methods for Business: A Skill Building Approach. . (6th. Ed.). New
York: John Wiley & Sons, Inc.
Schell, J. (2008). The Art of Game Design. A Book of Lenses. Florida: CRC Press.
Scott, C. L. & Byrd, M. Y. (2012). Handbook of Research on Workforce Diversity in a Global
Society:Technologies and Concepts. Hershey, PA: IGI Global Snippet.

66
Song, J.H., Martens, J., McCharen, B., &Ausburn, L. (2011). Multi-structural relationships
among organizational culture, job autonomy, and CTE teacher turnover intention. Career
and Technical Education Research, 36(1), 3-26. DOI: 10.5328/cter36.1.3.
Steers, R.M. (2002). Organisational effectiveness: A behavioral view. Santa Monica, CA:
Goodyear.
Stovel, M. &Bontis, N. (2002). Voluntarily turnover; knowledge management friend or foe.
Canada.
Swanepoel, B., Erusmus, B., Van Wyk, M. & Schenk, H. (2003). Human Resource
Management: Theory and Practice (2nd Ed.). Cape Town: Juta.
Talent Management Alliance (2013). Talent management strategies to drive business growth in
APAC and the Middle East. People in the Energy East Proceedings, 19th to 18th March
2014.
Tonea, D. (2013). ICTs: an effective way to improve beneficiary complaint mechanisms? .
ONTRAC Newsletter, (55), 6. Available at: http://www.intrac.org/
data/files/resources/775/OnTRAc-55-new-technologies-in-monitoring-and-evaluation.pdf
.
Torrington, D., Hall, L., & Taylor, S. (2005). Human resource management (6thed.). England:
PearsonEducation Limited.
Tyani, B.I.N. (2001). Absenteeism: A nursing service problem in the Republic of Transkei.
Pretoria: UNISAPress.
Vance, D. (2009). Corporate Restructuring: From Cause Analysis to Execution. New York, NY:
Springer Science & Business Media.
Waldman, J. D., Kelly, F., Arora, S., &Smith , H. L. (2004). The shocking cost of turnover in
health care. Health Care Management Review.
Woods, R. H., &Macauley, J. F. (1989). Rx for turnover: Retention programs that work. Cornell
Hotel and Restaurant Administration Quarterly.
Ziel, C.B. &Antointette, C.T. (2003). Psychology in the Work Context (2nd Ed.). Cape Town:
Oxford University Press.

67
APPENDICES
APPENDIX I: RESEARCH QUESTIONNAIRE
The information provided will only be for the purpose of this study. Read carefully and give
appropriate answers by ticking or filling the blank spaces. The information will be treated as
confidential.
Your participation is highly appreciated.
Part A: Demographic Background
1. Kindly indicate your gender.
Male [ ]
Female [ ]
2. Indicate your level of education
Certificate level [ ]
Diploma level [ ]
Undergraduate level [ ]
Master Degree level [ ]
PhD Level [ ]
3. What is your position at Family bank?
Project Manager [ ]
Project Member [ ]
Office Member [ ]
4. How long have you worked for Family bank?
Below 1 Years [ ]
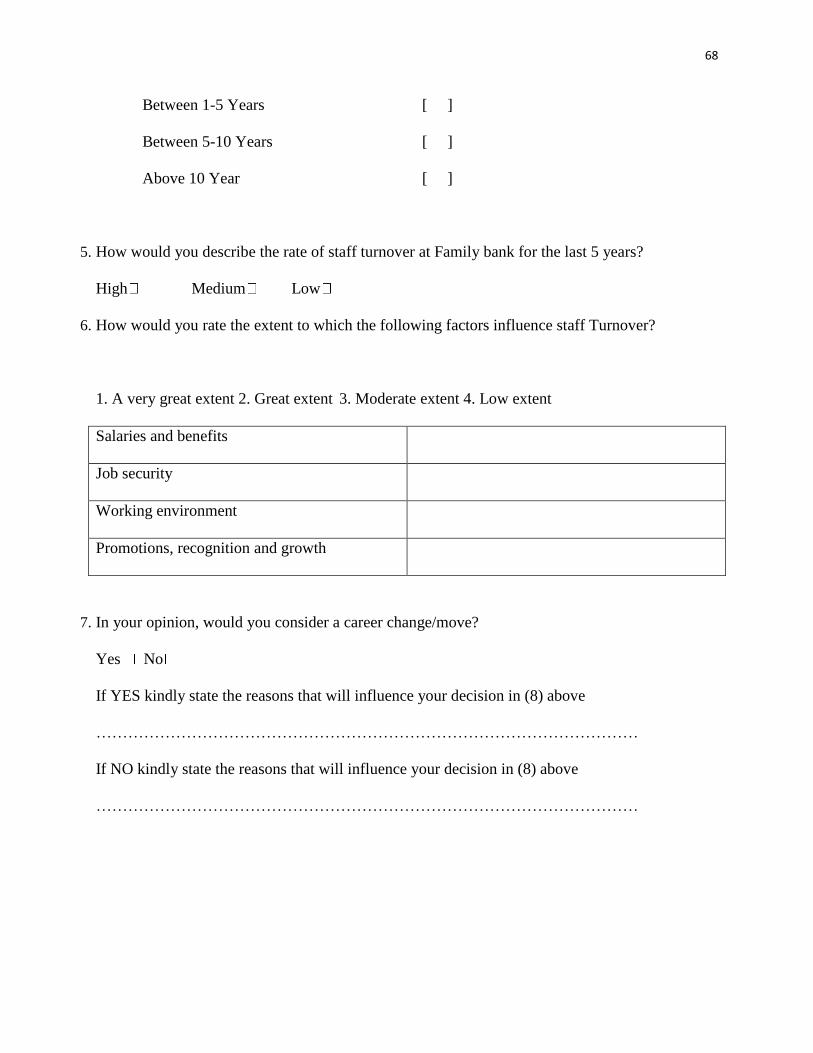
68
Between 1-5 Years [ ]
Between 5-10 Years [ ]
Above 10 Year
[ ]
5. How would you describe the rate of staff turnover at Family bank for the last 5 years?
High Medium Low
6. How would you rate the extent to which the following factors influence staff Turnover?
1. A very great extent 2. Great extent 3. Moderate extent 4. Low extent
Salaries and benefits
Job security
Working environment
Promotions, recognition and growth
7. In your opinion, would you consider a career change/move?
Yes No
If YES kindly state the reasons that will influence your decision in (8) above
…………………………………………………………………………………………
If NO kindly state the reasons that will influence your decision in (8) above
…………………………………………………………………………………………

69
Part B: Influence Costs on Project Performance
8. In your view, does high staff turnover influence the general financial position of your
organization?
Yes No
9. Rate whether you agree that cost influence project performance? Base your answer on a five
point Likert scale: 5) Strong Agree 4) Agree 3) Neutral, 2) Disagree and 1) Strongly Disagree
5 4 3 2 1
i.) Staff turnover has negative impact on the financial
performance in this organization
ii.) Staff turnover leads to more use of money and
resources to train new staff members
iii.) Turnover increase costs per unit in your department
iv.) Staff turnover influence the general financial position
of your organization
Please comment on your answers above …………………………………………………

70
Part C: Influence of Productivity on Project Performance.
10. Rate whether you agree that productivity influence project performance? Base your answer on a
five point Likert scale: 5) Strong Agree 4) Agree 3) Neutral, 2) Disagree and 1) Strongly
Disagree
5 4 3 2 1
i.) Staff turnover influences staffs meeting their deadlines
and targets
ii.) Staff turnover has negative impact on innovation and
continuity in this organization
iii.) Staff turnover reduces efficiency in your department
iv.) staff turnover leads to wastage of resources in this
organization
v.) The organization meets the customer needs during the
high staff turnover period
vi.) The newly employed staff catch up with the working
standards fast
Please comment on your answers above …………………………………………………
11.How is the service quality during the high staff turnover period?
High Low

71
12.Do new staffs spend too much time in doing little?
Yes No
Part D: Influence of Staff Morale on Project Performance
13. Rate whether you agree that staff morale influence project performance? Base your answer on a
five point Likert scale: 5) Strong Agree 4) Agree 3) Neutral, 2) Disagree and 1) Strongly
Disagree
5 4 3 2 1
i.) Staff turnover disrupts teamwork in this organization
ii.) Staff turnover increase the workload of every
remaining staff in your department
iii.) Staff turnover increases work stress to the remaining
staff in your department
iv.) Staff turnover leads to long working hours every time
some staffs leave the organization
v.) The newly employed staff catch up with the working
standards fast
Please comment on your answers above …………………………………………………

72
Part E: Project Performance
14. Rate whether you agree that technological innovations influence project performance? Base your
answer on a five-point Likert scale: 5) Strong Agree 4) Agree 3) Neutral, 2) Disagree and 1)
Strongly Disagree
5 4 3 2 1
i.) Well performing project is one that stays within the
scope
ii.) A project that delivers what was prior agreed upon to
satisfy the project customer is considered as a
performing project.
iii.) Quality of the deliverables from the organizations
projects is a key determinate of the projects
performance which technological innovations supports
iv.) The organization aims to have projects stay within
budgets and technological innovations supports this.
…………………………..Thank you for your participation……………………..
73
APPENDIX II: ANU LETTER OF RESEARCH AUTHORIZATION

74
APPENDIX III: RESEARCH PERMIT

75
APPENDIX IV: ROAD MAP