the influence of social motivations on performance and
TRANSCRIPT

The Influence of Social Motivations on
Performance and Trust in Semi-virtual Teams
A Thesis
Submitted to the Faculty
of
Drexel University
by
Deborah Mary LaBelle
in partial fulfillment of the
requirements for the degree
of
Doctor of Philosophy
October, 2008

ii
Dedications
This paper is dedicated to my husband Chris and my two sons Joe and Bill who supported
me throughout this endeavor.
iii
Table of Contents
List of Tables ..................................................................................................................... vi
List of Figures .................................................................................................................. viii
Abstract .............................................................................................................................. ix
1 Introduction.......................................................................................................................1
2 Literature Review..............................................................................................................8
2.1 Virtual Teams and Semi-Virtual Teams ................................................................. 11
2.2 Technology Support for Virtual Teams .................................................................. 13
2.3 Communication and Socio-Emotional Support ...................................................... 16
2.4 Virtual Team Performance...................................................................................... 22
2.5 Trust in Virtual Teams............................................................................................ 26
2.6 The Challenges That Face Virtual Teams............................................................... 34
2.7 Social Motives and McClelland’s Acquired Needs Theory ................................... 37 2.7.1 Social Motives in the Workplace ................................................................................................41 2.7.2 Social Motives and Virtual Teams..............................................................................................45
2.8 Conclusion .............................................................................................................. 48
3 Methodology...................................................................................................................50
3.1 Introduction............................................................................................................. 50
3.2 Participants and Materials....................................................................................... 51 3.2.1 Survey Instruments .....................................................................................................................52 3.2.2 The Personal Values Questionnaire (PVQ).................................................................................53 3.2.3 The Social Motives Satisfaction Survey .....................................................................................54 3.2.4 The Trust Survey ........................................................................................................................58 3.2.5 The Communication Survey .......................................................................................................59
3.3 The Pilot Study ....................................................................................................... 60 3.3.1 Reliability and Construct Validity of the Social Motives Satisfaction Survey ...........................60 3.3.2 Reliability of the Trust Survey....................................................................................................61
3.4 Procedure ................................................................................................................ 62 3.4.1 Selection of the Courses Eligible to Participate ..........................................................................62 3.4.2 The Instructor’s Role in the Online Project ................................................................................63 3.4.3 The Project Specifications ..........................................................................................................64 3.4.4 The Online Learning Environment and Campus Context ...........................................................65 3.4.5 Construction of the Teams ..........................................................................................................66 3.4.6 Computing the Social Motive Satisfaction Score .......................................................................67 3.4.7 Computing the Trust Score .........................................................................................................69 3.4.8 Computing the Team Performance Score ...................................................................................70
3.5 Summary................................................................................................................. 70

iv
4 Results.............................................................................................................................72
4.1 Introduction............................................................................................................. 72
4.2 Communications Survey Results ............................................................................ 74
4.3 Individual Data........................................................................................................ 76 4.3.1 Comparison of Social Motive Strength (PVQ scores) and Social Motive Satisfaction Scores...77 4.3.2 Analysis of Social Motive Satisfaction Scores where Individuals are Grouped by Social Motive
Strength (PVQ scores) .........................................................................................................................82 4.3.3 Relationship of Social Motive Strength (PVQ scores) and Individual Trust Scores...................86 4.3.4 Summary of Results for Individual Data ....................................................................................88
4.4 Team Data............................................................................................................... 89 4.4.1 Analysis of Team Social Motive Satisfaction and Team Performance .......................................91 4.4.2 Analysis of Team Social Motive Satisfaction and Team Trust...................................................96 4.4.3 Analysis of Team Social Motive Strength with Performance .....................................................96
4.5 Summary................................................................................................................. 97
5 Discussion .....................................................................................................................102
5.1 Discussion of Results............................................................................................ 102
5.2 Limitations ............................................................................................................ 108
6 Conclusion and Recommendations...............................................................................111
6.1 Conclusion ............................................................................................................ 111
6.2 Recommendations for Researchers....................................................................... 111
6.3 Implications for Practitioners................................................................................ 112
List of References ............................................................................................................114
Appendix A: Personal Values Survey..............................................................................123
Appendix B: PVQ Scoring Instrument ............................................................................124
Appendix C: Social Motives Survey Used in the Pilot Study .........................................125
Appendix D: Social Motives Survey Used in the Dissertation Study .............................126
Appendix E: Trust Survey ...............................................................................................127
Appendix F: Communications Survey.............................................................................128
Appendix G: Projects used in the Dissertation Study......................................................129
Appendix H: PVQ Raw Scores - Ordered by Team ........................................................136
Appendix I: Factor Analysis for Social Motive Satisfaction Survey...............................138

v
Appendix J: Individual Data for Analyses.......................................................................141
Appendix K: Results of Principal Component (Exploratory) Factor Analysis................143
Vita...................................................................................................................................144

vi
List of Tables
Table 2-1 Asynchronous Communication tasks and Corresponding Social Motives........48
Table 3-1 Comparison of PVQ Items and Social Motives Satisfaction Survey Items Used
in this Study .......................................................................................................................57
Table 3-2 Social Motives Survey Questions, and Social Motive Category.......................68
Table 3-3 Example of Calculation of Individual and Team Social Motive Satisfaction
Scores.................................................................................................................................69
Table 3-4 Example of Individual Trust Score and Team Trust Score ...............................70
Table 4-1 Chemistry Data Set - Communications between Team Members.....................74
Table 4-2 Chemistry Data Set - Communications between Instructor and Team .............75
Table 4-3 English Data Set - Communications between Team Members .........................75
Table 4-4 English Data Set - Communications between Instructor and Team..................76
Table 4-5 Median, Mean, and SD for PVQ Score for each Social Motive Strength –
Chemistry data set..............................................................................................................78
Table 4-6 Median, Mean, and SD PVQ Score For Each Social Motive Strength – English
Data Set ..............................................................................................................................78
Table 4-7 Chemistry Data Set – Correlations for Social Motive Strength (PVQ Scores)
and Social Motive Satisfaction Score ................................................................................81
Table 4-8 English Data Set – Correlations for Social Motive Strength (PVQ Scores) and
Social Motive Satisfaction Scores .....................................................................................82
Table 4-9 Chemistry data set - Affiliation Social Motive Satisfaction Scores for each
Social Motive Strength group ............................................................................................83
Table 4-10 English Data Set - Affiliation Social Motive Satisfaction Scores for Each
Social Motive Strength Group ...........................................................................................83
Table 4-11 Chemistry data set - Achievement Social Motive Satisfaction Scores for each
Social Motive Strength group ............................................................................................84
Table 4-12 English data set - Achievement Social Motive Satisfaction Scores for each
Social Motive Strength group ............................................................................................84
Table 4-13 Chemistry data set - Power Social Motive Satisfaction Scores for each Social
Motive Strength group .......................................................................................................85

vii
Table 4-14 English data set - Power Social Motive Satisfaction Scores for Each Social
Motive Strength group .......................................................................................................86
Table 4-15 Chemistry Data Set – Mean and Median Trust Scores for Each Social Motive
Strength Group...................................................................................................................87
Table 4-16 English Data Set – Mean and Median Trust Scores for Each Social Motive
Strength Group...................................................................................................................87
Table 4-17 Chemistry Team Data Set................................................................................90
Table 4-18 English Team Data Set ....................................................................................91
Table 4-19 Chemistry Teams Data Set - Measured Performance, and Performance
Calculated using Theil’s Incomplete Method ....................................................................93
Table 4-20 English Teams Data Set - Measured Performance, and Performance
Calculated Using Theil’s Incomplete Method ...................................................................93
Table 4-21 Summary of Statistical tests ............................................................................98

viii
List of Figures
Figure 4-1 Chemistry Data Set - Mean Social Motive Satisfaction Score – Grouped by
Social Motive .....................................................................................................................79
Figure 4-2. English Data Set - Mean Social Motive Satisfaction Score – Grouped by
Social Motive Strength (PVQ score) .................................................................................80
Figure 4-3 Chemistry Teams - Theil’s Incomplete Method of Regression for Social
Motive Satisfaction on Performance..................................................................................94
Figure 4-4 English Teams - Theil’s Incomplete Method of regression for Social Motive
Satisfaction on Performance ..............................................................................................95

ix
Abstract
The Influence of Social Motivations on
Performance and Trust in Semi-virtual Teams
Deborah M. LaBelle
Susan Weidenbeck, Ph.D.
This empirical study investigates the use of McClelland’s social motives of power,
achievement, and affiliation to form teams that work in a semi-virtual environment. The
study seeks to determine if such teams exhibit trust and perform successfully while
working in an online environment. Although many studies of social motives in face-to-
face working situations exist, most are anecdotal. None has explored social motives in
semi-virtual teams. The results of this exploratory study are of interest because to date
there is no study that employs social motives to structure teams of students that work
online. Sixty undergraduate students in two different courses, chemistry and English,
used a web-based learning tool to collaborate on a team project in an online environment.
Each team had three members. The Personal Values Questionnaire measures social
motive strength and was used to guide the construction of the teams. Each team had one
power strength individual and two other members both with strength in either the
affiliation or the achievement motive. Measurements for trust, performance, and social
motive satisfaction were taken at the completion of the project. The English and
chemistry courses provided two separate sets of teams to study. Separate analysis of the
two data sets determined whether social motive strength, social motive satisfaction and
team construction by social motive strength showed significant correlation with trust and
performance. The analysis showed that the formation of these semi-virtual teams by

x
social motives influenced trust and team performance for the chemistry data set, but
further research is needed to verify and expand these results. No significant results were
found for the English data set.

1
1 Introduction
The goal of this study was to examine the affects of social motivation on performance
and trust in teams of students working together in an online environment. Social
motives are motivations that lead an individual to engage with others in some kind of
social interactions. This research, examines the social motives of affiliation,
achievement and power (McClelland, 1961) because these motives have shown to
positively influence trust and performance for teams working in a face-to-face
environment; however, they have not been studied in online teams (Harrell & Stahl,
1984; McClelland, 1988). This study is motivated chiefly by the ubiquity of online
teams in education today and the lack of knowledge about social motivations in online
teams.
A virtual team is typically a group of people working together across
geographical and organizational boundaries to achieve a common goal, using electronic
means to interact (Jarvenpaa & Leidner, 1998; Rad & Levin, 2003). Virtual teams tend
to be small and agile, carrying out specific work assignments and then disbanding until
they are called to collaborate online again (Lipnack & Stamps, 1997; Powell, Piccoli, &
Ives, 2004 ). Although virtual team models are derived mostly from face-to-face work
teams, the virtual team concept can be, in part, a good model to apply to student teams
in blended courses. In the case of a blended course, an online team is a small group of
students assigned to collaborate on projects during the online portion of the course.
Students in the team work together for just one assignment or at most for the duration
of the course. The students may or may not know each other prior to assembling as a

2
team, especially if the face-to-face instruction occurs in a large lecture room using the
traditional lecture instruction format (Marsh, McFadden & Price, 2003). In a blended
course, if the team has the opportunity to work together face-to-face, it may choose to
do so, and not follow the true virtual team model. Thus, researchers have coined the
term “semi-virtual” to describe teams that meet both online and face-to-face to
collaborate (Griffith & Neale, 2001; LeRouge, Blanton, & Kittner, 2002). LeRouge et
al. (2002) surveyed students to determine their preferred methods of collaboration.
Their findings indicated that scheduling, geographical dispersion and convenience often
determined the choice of communication media. In addition, discussions that utilize
asynchronous discussion boards, online chat, telephone, and other social networking
software were commonly used communication tools. However, they also found that if
team members happened to be on campus at the same time, they would meet face-to-
face. LeRouge et al. (2002) found that students would choose the most convenient
mode of communication available at any given time during the assignment. To
complete the project, teams that set out to work as a virtual team would often use a
blend of communication media, and actually become semi-virtual to reach their
objective most expeditiously (D’Eredita & Chau, 2005; Griffth & Neale, 2001;
LeRouge et al., 2003).
The teams in this research study were college students enrolled in undergraduate
courses that required them to work collaboratively online to complete a course project.
The course in which the students were enrolled also met face-to-face in a traditional
classroom for other learning activities. In effect, the teams were part of a course that
blended technology based learning with face-to-face learning activities. The original

3
intent of this study was for teams of students to have no face-to-face interactions during
the online project, and thus work as virtual teams. However, given that this study was
conducted in a realistic blended learning environment with real courses and students, it
was not surprising that some teams reported working both virtually and face-to-face on
the project. Therefore, the student teams should more rightly be referred to as semi-
virtual teams, the term that will be used in the rest of this dissertation.
A student assigned to work together with others possesses his or her own social
motives, that is, motivators that drive the individual to engage and cooperate with
others. Social motives are “motives that are acquired through experiences and
interaction with others” (Wood, Wood, & Boyd, 2004, p. 487). Social motives inspire
action and give purpose to one’s goals and behaviors in the social situation. According
to psychologist David McClelland (1961), the three social motives of power,
achievement, and affiliation appear in varying degrees in all individuals and correlate
with a person’s pattern of behavior. These three social motives were chosen for this
research because they have been shown to influence a person’s motivation in certain
job functions, and to influence performance in face-to-face only work (Harrell & Stahl,
1984; McClelland, 1988). The research herein seeks to examine the influence these
social motive have on work performed in the online educational environment.
The need for power is the desire to exercise control over others. An individual
motivated by the need for power is willing to take risks and be responsible for others
(McClelland, 1961). The need for achievement is the desire to accomplish difficult
tasks and to maintain a high standard of quality. An individual that is motivated by
achievement prefers to work alone as he or she sets his or her own personal goals and

4
does not want to be held back by others’ inability to meet those goals. This person
needs to receive feedback on his or her progress and prefers a schedule to flexibility
(McClelland, 1961). A person that is motivated by the need for affiliation avoids
conflict and enjoys close relationships with his or her co-workers. This person is
considered a team player, but needs opportunities to interact with team members to be
satisfied with his or her work (McClelland, 1961).
The social motives of power, achievement, and affiliation have been studied in
situations where people work face-to-face. Research on McClelland’s needs theory
shows that the three social motives can be satisfied in many face-to-face settings and
that satisfaction of these social motives is related to successful performance (Harrell &
Stahl, 1984; McClelland, 1988). However, the social motives have not been studied in
situations that involve online interaction. Some researchers have hypothesized that
these social motives may not translate to an online environment, therefore making it
difficult to satisfy the needs of individuals working in virtual teams (Rad & Levin,
2003). For example, in the online setting, the power-motivated individual may not be
able to notice his or her influence over others, the achievement motivated individual
may not receive adequate recognition and feedback, and the interactions of a virtual
team may not satisfy the social interactions needed for the affiliation motivated
individual. Thus, the effects of social motives in online settings, either virtual or semi-
virtual, remain an open question.
Instructors often look for creative ways to construct successful teams. Some of
these methods include grouping by grades, grouping by students’ self-reported interests
and abilities, random grouping, and even allowing students to group themselves. One

5
method of grouping that has not been tried for virtual or semi-virtual teams is grouping
by social motivational needs of the individual team members. Yet the success of
grouping by social motives in face-to-face work suggests that grouping by social
motives in online settings should be investigated.
Currently, there is no absolute agreement on the definition of a blended course,
but it is widely accepted that a blended course combines traditional face-to-face
instruction with online learning activities (Graham, 2006). Graham describes blended
learning as the use of virtual communities to facilitate collaborative learning activities
in a course. According to Graham, the online portion of the blended course requires that
the students meet asynchronously and collaborate by means of discussion. The students
contribute to the discussion at their convenience by posting messages or replying to
others’ messages using an online discussion tool. Students enjoy the flexibility and
convenience of meeting asynchronously for online course activities, while instructors
value the greater opportunities for student-to-student interaction, collaboration, and
knowledge discovery (Graham, 2006). This study investigates the affects of the social
motives of power, achievement, and affiliation on semi-virtual teams in a blended
course where students are assigned to work collaboratively online in order to complete
a project that requires teamwork. This study is exploratory because it is the first to
study these social motives with semi-virtual teams in the blended learning paradigm.
Performance is one important measure of success, but team trust may be equally
important to the success of a team. However, it is not certain that trust develops online
to the same degree that it does in face-to-face collaboration; some research has shown
that it is more difficult to establish trust in the virtual team than in a face-to-face team

6
(Rocco, 1998). However, there is a gap in research knowledge on both performance and
trust in the semi-virtual team. Thus, the motivation behind this study is to find out if
students’ satisfaction of social motives influences trust and performance in the semi-
virtual setting, and if different compositions of the teams with respect to students’
social motives result in different trust and performance levels.
The first research question examines the relationship between an individual’s
social motive strength and social motive satisfaction. The purpose of this question is to
determine if the individual was satisfied with his or her motivations during the project
task.
1. Is there an association between social motive strength and social motive
satisfaction scores?
The second research question examines the possibility that social motive strength may
indicate the level of trust an individual may establish during the project task:
2. Will individual trust scores vary by social motive strength?
The third and fourth research question examines the influence of social motive
satisfaction on team trust and team performance:
3. Is there a relationship between team social motive satisfaction and team
performance?
4. Is there a relationship between team social motive satisfaction and team
trust?
The fifth research question compares the teams with majority social motive strength of
affiliation to the teams with majority social motive strength of achievement to see if
social motive strength influences team performance.
5. Is there a relationship between team social motive strength and team
performance?
7
An empirical analysis of semi-virtual teams of students enrolled in two undergraduate
blended courses is conducted to investigate the influence of affiliation, power, and
achievement social motives on team performance and trust.

8
2 Literature Review
The literature review begins with an overview of the relevant research in the area of
interest: virtual and semi-virtual teams, technology support for teams, communication
and socio-emotional support, virtual team performance, trust in virtual teams, and
social motives. In following sub-sections the literature is discussed in further detail.
This research study measures trust and performance of teams formed deliberately
using team members’ social motive strength to determine the composition of semi-
virtual teams, i.e., teams that are not entirely virtual because team members sometimes
meet face-to-face. While studies on virtual teams and trust are plentiful, there is a lack
of research in how social motives can be used to form successful teams working
together online. The research in the area of social motives and face-to-face teams
helped to explain the common issues of teamwork, be they face-to-face or virtual
teams.
The review of the literature revealed that the study of virtual teams is broad and
includes virtual teams in the workplace and academia. Although work is needed to
improve the software technology that serves the needs of virtual teams, research has
already led to improvements in the technology used for virtual teamwork (Barnatt,
1995; Lipnack & Stamps, 1997). For example, features that allow students to create
their own groups encourage students to communicate together online. Improvements in
user interfaces have helped to shorten the learning curve of the communications
technology. The implementation of asynchronous discussion boards and chat rooms

9
with time stamps and archive features allow students to use the discussion as an
information resource (Sharpe, Benfield, Roberts & Richards, 2006).
Other research on virtual teams has focused more on the social and
communication issues related to working together in a virtual environment and less on
the improvement of the features of the software technology (Jarvenpaa & Knoll, 1995;
Kelly & Bostrom, 1995; Ravoi & Jordan 2004). The research on the communication
aspects of working together online is most important to this dissertation; in addition, the
research of Watson and Barone (1976), Yamaguchi (2003) and Balthzard, Potter and
Warren (2004) suggests that social profiling may contribute to the formation of a
productive team is very interesting to this dissertation.
While studies on virtual teams and trust are plentiful, there is a lack of research
in how social motives can be used to form successful teams working together online.
The results of studies on the use of social motives to form face-to-face teams show how
social motives can be used to benefit teamwork and productivity (Harrell & Stahl,
1988; McClelland, 1984; McClelland & Burnham, 2003; Smits, McLean, & Tanner,
1993). Furthermore, the results of the studies contained in this review suggest that if the
social motivational needs of individuals are satisfied, then the team will perform well
(Harrell & Stahl, 1984; McClelland, 1961; McClelland, 1988; McClelland & Burnham,
2003; Yamaguchi, 2003). Thus, this research fills a gap in the study of semi-virtual
teams and social motive needs.
The literature on trust reveals that trust is a factor that positively affects
motivation and performance between individuals working together (Alexander, 2002;
McKnight, Cummings, & Cervany, 1998; Michaelsen, Knight, & Fink, 2002). This

10
review, however, focuses on the research of interpersonal trust in virtual teams. The
review of the literature in this area of trust revealed that trust develops between
individuals working in a virtual environment as long as the environment allows for it
(Kreijens, Kirschner, & Jochems, 2003; Mark, 1998; Rocco, 1998; Zheng, Veinott,
Bos, Olson, & Olson, 2002). The virtual environment must encourage social and
emotional support for the team members. For example, the technology features may
provide socio-emotional support by providing communication features that encourage
socializing with team members. In addition, the design of the tasks to be performed by
the team may encourage socializing while working on the tasks.
As mentioned above, trust can be formed in online relationships when the
communication environment allows trust to develop. Thus, this dissertation study
measures trust and performance of teams formed deliberately using team members’
social motive strength to determine the composition of the teams.
This dissertation explores the relationship between social motive strength and the
success of semi-virtual teams of students in terms of interpersonal trust and team
performance. David McClelland (1961) identified three key social motives of
achievement, power, and affiliation. Social motives needs are learned needs that
develop from social experiences. All three social motive needs are present to some
degree in all of us; however, most of us have strength in one need over another. Social
motive strength describes the social motive need most valued by an individual.
11
2.1 Virtual Teams and Semi-Virtual Teams
The teams involved in this research were teams of college students that met in a
traditional classroom for lecture and note taking activities, and worked collaboratively
online to complete a required project for the course. A course that offers two or more
pedagogical approaches to learning that include traditional coursework blended with
online coursework is a hybrid or blended course. (This paper will use the term
‘blended’.) In essence, a blended course is a traditional face-to-face course that includes
online or e-learning activities as a requirement (Graham, 2006). Graham further states
that blended learning includes only two pedagogical approaches: face-to-face in class
learning activities and online asynchronous collaborative learning activities.
A virtual team is distinctly different from a face-to-face team primarily in that
the virtual team rarely or never meets face-to-face and, therefore, relies on computer-
mediated communication tools to complete its assigned task. Virtual teams are defined
by Powell, Piccoli, and Ives (2004) as “groups of geographically, organizationally and
or time dispersed workers brought together by information and telecommunication
technologies to accomplish one or more organizational tasks” (p. 7). Sarker, Valacich,
and Sarker (2003) define a virtual team as “a temporary collection of individuals linked
primarily through computer and communication technologies working across space and
time to complete a specific project” (p. 36). Generally, virtual teams are short lived.
They assemble to perform specific required tasks within organizational or educational
settings. As the technology to support online collaboration has improved, virtual teams
have become a viable alternative to face-to-face teams in industry and in education.
Online projects assigned as a component to a traditional course provide students the
12
opportunity to work as a virtual team and formulate ideas, refine their ideas through
discussion, develop specific skills, and generally enhance their understanding of the
subject matter. Students also learn how to collaborate effectively online, an increasingly
important skill in the world of work (Bonk, Kim, & Zeng, 2006).
As the research on virtual teams has grown, the definition of a virtual team has
become fuzzy (Martins, Gilson, & Maynard, 2004). Griffith and Neale (2001) indicate
that the proliferation of virtual tools such as online chat, asynchronous discussion and
social networking software has allowed many traditional teams to operate in the virtual
setting, causing ambiguity in the definition of the virtual team. Some researchers have
suggested using the term semi-virtual to describe teams that do not fit the earlier
definition of virtual as a team that never meets face-to-face (LeRouge et al., 2002).
In this research study, most teams worked primarily online, but due to the
realistic environment of a blended course, the students also met face-to-face for other
learning activities, and some teams reported frequent face-to-face interactions. Hence,
teams in this study were semi-virtual teams.
The term semi-virtual is new to the research and there are scant empirical
studies that focus on trust and performance in semi-virtual teams. Therefore, most of
the background information found on teams working together online is in the literature
that studied virtual teams. This chapter reviews the literature related to the study of
virtual teams, interpersonal trust between members of virtual teams, performance of
virtual teams, and the use of social motives to form virtual teams.
13
2.2 Technology Support for Virtual Teams
Recent technological advances have increased the demand for use of virtual
environments for teaching and learning (Graham, 2006). The use of computer
technology for communication is not new; however, increases in data transmission
speed have decreased the delay time between responses during a synchronous
discussion, thus reducing the level of anxiety a user can experience waiting for a reply
from team members (Sharpe, Benfield, Roberts, & Richards, 2006). Virtual
environments have become much more than a repository for course materials (Graham,
2006). Software tools that track and time-stamp discussion board entries allow for
better awareness of an individual’s asynchronous activities (Sharpe et al., 2006). As
instructors in traditional classrooms recognize the value in using the virtual
environment, students are increasingly expected to use the computer as a learning tool
(Sharpe et al., 2006). McGreal (2004) states that learning tools such as groupware
technology (the software technology used to enhance group work online), email, and
instant messaging are also called learning objects. McGreal’s definition of a learning
object is a reusable artifact that has an educational purpose (McGreal, 2004). The
learning objects in a traditional classroom, such as a chalkboard and overhead projector
for example, have become virtually invisible to the students and teacher. Thus, the
learning objects in a traditional learning environment are ubiquitous. Nash (2005)
studied the use of learning objects in online courses. Nash argues that research on best
practices of learning theory and behavioral psychology, including social motivation,
should be considered in the research of digital learning objects (Nash, 2005).

14
There has been a shift to develop new computer-based learning tools to support a richer
learning environment for traditional face-to-face and blended classrooms, rather than to
support purely distance learning courses (Lajoie, 2000). In recent years, educational
institutions have experimented with applications of virtual learning activities and
virtual teams within the traditional face-to-face course (Graham, 2006). These
experiments have led to studies on communication and collaboration online (Powell,
Piccoli, & Ives, 2004). One such study showed that the asynchronous nature of
communication in virtual teams helps support reflection as the permanent record of
conversations are available to all team members (Alexander, 2002). Alexander
compared face-to-face team collaboration to virtual team collaboration. He found
evidence of “information overload” in the face-to-face teams. In other words, too much
information was coming at the team members too quickly to absorb. In addition, the
team members lost focus on the conversations and without a permanent record of the
conversation, there was no way for the team members to review the meeting notes. In
the asynchronous environment, the permanent record of information exchanged gave
the team members opportunity not only to reflect on what was said in the past, but also
to better prepare for future meetings online.
Stahl (2008) suggests we look for new ways to measure online interaction.
Stahl’s current research is with the Virtual Math Teams project (Stahl, 2006) where the
focus is on math students, working in an online community and collaborating to solve
math problems. Stahl suggests researchers consider a shift from the term “human
computer” interaction to “human human” interaction, which takes place over the
Internet with the help of computers. This perspective on the study of online interaction

15
could help to focus the research on the interactions and allow the technology to become
a part of the background. This shift could also help focus the research less on
technology and more on three important components of successful collaboration as
proposed by Graham and Misanchuk (2003): the collaborative learning activity, group
interaction, and group formation.
Blended courses are increasing in popularity on college campuses. Bonk, Kim,
and Zeng (2006) surveyed members of MERLOT, a web-based community for
improving the effectiveness of online teaching, to investigate future trends in blended
learning. Over 550 college instructors participated in the survey. The respondents
predicted that in five years time, 20 percent of college courses will be blended courses.
Sixty-five percent of the respondents indicated that collaborative assignments are likely
to be the most common tasks developed for the online component of blended courses.
Further, the respondents predicted that blended learning would become such an
important pedagogical phenomenon that in the near future educational institutions will
offer a Master’s degree in blended learning. “The 2003 Sloan Survey of Online
Learning polled academic leaders … [and] asked [them] to compare the online learning
outcomes with those of face-to-face instruction; a majority said they are equal: two out
of every three responded that online learning is critical to their long-term strategy”
(Roach, 2003, p. 1).
However, in spite of Bonk et al.’s (2006) enthusiastic predictions of increasing
numbers of blended course offerings and virtual teams of students collaborating online,
there is limited research on group interaction and group formation of virtual teams in
blended courses.

16
2.3 Communication and Socio-Emotional Support
A good deal of the research on virtual teams has focused on the technical expertise of
the members of the virtual team and their ability to use the technology successfully. For
example, a qualitative study on a tool called BSCW (Basic Support for Cooperative
Work) examined the tool’s shared workspace features. The BSCW tool, originally
designed for distributed research groups, is currently used in higher education, mainly
due to its low cost and high accessibility (Sikkel, Gommer, & van der Veen, 2002).
This study by Sikkel et al., carried out in the Netherlands, set out to determine the
successes of using such a system for shared workspaces in higher education and its
relationship to the virtual team’s performance. The authors performed seven different
case studies on the use of BSCW in higher education. The study showed that the use of
the shared workspace for archiving and course information dissemination was generally
successful. However, collaborative authoring and discussion were not successful due
mostly to the slowness of the system and the fact that the groups had established face-
to-face meetings from prior collaborative projects. The study concluded that the system
effectiveness would decline if the system were not efficient. In other words, the success
of the virtual team was somewhat dependent on the collaborative tool itself. In addition,
the authors predicted that a groupware system that offers tools to suit specific purposes,
such as discussion, would be most useful.
Outside of academia, some research studies have focused on communication
issues and performance. As the technology for communicating from a distance became
17
available, managers were willing to utilize this form of communication so that workers
in geographically disperse locations could communicate more easily (Freedman, 1993).
Researchers studied managerial hierarchy during the early deployment of virtual teams.
In 1985, Symons (1997) began a ten-year longitudinal study of virtual teams to research
patterns in electronic hierarchy. Symons’ study took place from 1985 to 1995. He
studied three midsized firms (three thousand to five thousand employees). Each firm
was involved in the use of internet communications technologies (ICT) to support
several virtual departments. Symons studied the virtual departments by conducting
interviews with several different types of stakeholders including chief information
officers (CIO), computer network managers, department managers, and human resource
managers. The results of his study showed that while some managerial “power”
positions did not budge, new network-based hierarchies emerged from the virtual
departments. Around the time of Symons’ research, others found that the virtual
department eradicated power structures (Gillespie, 1993; McGowan, 1991; Tapscott,
1993). However, Symons found that power structures would remain, but the shift of
power from one manger to another or from worker to manager would occur, due to the
ability of managers and workers alike to communicate and view others’ transcripts of
communications and take action when needed. Symons argued that the availability of
information and the ease of communicating with different levels of management made
the traditional hierarchical structures of management invisible to those working online.
Although these studies took place outside of academia, the implication is that the
breakdown of hierarchy between teacher and student could take place in an academic
virtual environment. A breakdown in the student-teacher hierarchy could create an

18
environment where the students do not recognize the teacher’s opinions to be superior,
repressing their opposing opinions so as not to jeopardize their grade. A study
performed in the academic environment by Watts and Greenlaw (2003) suggests a
breakdown of hierarchy that allowed for constructive discussion between students. The
researchers studied the use of a groupware system called FORUM in an undergraduate
economics course. Two courses were observed, one section used FORUM and one
section did not. While the authors admit that the observations are subjective, as they
studied their own students, they laid the foundation for a more formal study. The
researchers observed that the FORUM group had a higher quality in class discussion,
longer essays, and a more honest constructive criticism of each other’s work.
A seminal study on the use of computer-mediated collaborative learning in the
classroom (Alavi, 1994) supports the value of groupware tools to enhance the
traditional classroom instruction. In her study, Alavi compared the outcomes of two
course sections, one conducted as a traditional face-to-face course and the other as a
face-to-face course enhanced by computer-mediated communication tools. Although
this study was performed in 1994, before the term “blended” was widely used, Alavi
was indeed experimenting with a blended learning environment by mixing traditional in
class activities with online activities. The study revealed that the students’ learning
experience was more positive in a traditional face-to-face classroom using a computer-
mediated tool than in a similar face-to-face classroom without the use of a computer-
mediated tool. Specifically, the author concluded that the students in the course section
that used computer-mediated communication tools contributed more to in-class
participation, achieved better scores on their final exams, and had greater overall

19
collaboration than in the traditional course section. Other research studies on the
communication issues in virtual teams suggested that online collaboration is not as
effective as face-to-face collaboration in that it takes longer to understand team
members during online communication tasks (Sproull & Kiesler, 1986; Walther, 1993).
However, the uses of virtual teams within and across organizations were relatively new
in the mid 1990’s. Their implementation was brought about in part by the development
of technologies such as Internet, groupware and videoconferencing (Barnatt, 1995;
Lipnack & Stamps, 1997). Virtual teamwork has become integrated into everyday work
and education, creating more complex work arrangements and allowing for a variety of
tasks to be performed online.
Other research on group work (Kreijens, Kirschner, & Jochems, 2003) suggests
that working collaboratively is a skill, and that students need to develop specific skills
to further their ability to collaborate, including socio-emotional skills. Kreijens et al.
(2003) have identified two important pitfalls in working in virtual collaborative
environments: taking social interaction for granted and restricting group interaction to
cognitive work processes. Often times, students perform in a collaborative online
learning environment while the emphasis of the task is solely on the academic
undertaking, failing to take into account socio-emotional processes for building the
relationships among team members needed for successful collaboration. In turn,
students focus solely on “getting the job done.” As a result, students use the online
collaborative tool simply to coordinate tasks, not to truly collaborate. They work
independently to complete their assigned tasks, and then come back to the virtual

20
environment to join their independent work products together into one complete
deliverable.
As the research on virtual teams has shifted its focus from the human interface
factors of the technology to the socio-emotional and relationship characteristics of
virtual teams themes such as community, relationship building and trust, emerge in the
research.
Kelly and Bostrom (1995) studied the socio-emotional component of virtual
team meetings. They warned that the task should not overshadow the social and
relationship needs of team members and were concerned that group support systems
were not addressing these issues. They suggested that a facilitator be assigned to
maintain awareness of the team members’ socio-emotional dimension.
Jarvenpaa and Knoll (1995) studied the process and outcome of virtual
teamwork. They suggested that the social use of technology is vital to the collaborative
process, which in turn is vital to positive outcomes – performance. They suggested that
people learn to use the technology to facilitate the social process. In their study, the
teams that showed a higher level of cohesiveness were the teams that had a better social
component in their communications. Such teams communicated more frequently and
exchanged personal information with one another. In addition, the cohesive teams often
showed more humor in their communications.
Rovai and Jordan (2004) studied the sense of community developed among
graduate students in courses offered in one of three different delivery methods,
traditional, exclusively online, and blended. The authors used McMillan and Chavis’s
(1986) definition of a “sense of community” – “a feeling that members have of
21
belonging, a feeling that members matter to one another and to the group, and a shared
faith that members’ needs will be met through their commitment to be together” (p. 9).
Rovai and Jordan used the community index survey developed by McMillan and
Chavis as a guide to create a Likert-type survey instrument to measure classroom
community (Rovai, 2002). In Rovai and Jordan’s study, the students self-reported their
sense of community using this instrument. The results of the study showed that students
in the blended courses had a better sense of community than those in the traditional or
exclusively online courses. The authors acknowledged that the students were a fairly
homogeneous and motivated group (graduate level students studying for a Masters in
Education), and their results may not apply to other groups.
Recent research (Powell et al., 2004) has focused on the human needs of the
people interacting with the technology rather than the software support. The need for
socio-emotional support of virtual team members is a key area of research. Socio-
emotional processes support relationship building, team unity, cohesion, and trust.
These factors are important to open communication, idea sharing, collaboration and
continued support of one’s team and its members (Jarvenpaa, Knoll, & Leidner, 1998;
Jarvenpaa & Leidner, 1999; Sarker et al., 2001). Although the typical non-verbal cues
common to face-to-face communication are not visible in online communication, Park
(2007, 2008) indicates that online communicators have found ways to communicate
gestures and facial expressions online. Aside from the common use of emoticons to
wink, sigh etc., non-verbal cues can be observed in the actual text of the messages
between users. For example, a user may emphasize by using a string of dots (…) or
using altered word spelling (noooooooo) in an attempt to emote while typing. Park
22
acknowledges that emotional expressions implemented with the keyboard takes more
time than the naturalistic emoting with facial expressions. However, as people begin to
communicate at a younger and younger age, expressing one’s self online may become
second nature in the near future.
Marjchrzak, Rice, Malhorta, King and Ba (2000) focused on the importance of
virtual team research and provided a model for incorporating research on virtual teams
into the conventional research of information technology. They proposed a model for
research of virtual teams that accounts for the adaptation of the user to the technology
throughout the use of the technology. They suggest that the designers of collaborative
technology account for the changing needs of users as the collaboration develops
throughout the project. Some of the needs may include searching for information about
how to use the technology during the process of communicating and accounting for
communication cues that are present in face-to-face collaboration, but only when
needed by the collaborators.
The research on communication and socio-emotional support for virtual teams
suggest looking for novel approaches to study virtual teams that promote the
understanding of virtual team development and collaboration (Sarker & Sahay, 2002).
This dissertation supports this aim by exploring to use social motive profiling to form
teams and to examine the productivity of such teams.
2.4 Virtual Team Performance
Recall that the virtual teams in this research study are teams that worked primarily
online. Although some teams had face-to-face interaction and did not work exclusively

23
online, virtual team is the key term used to discover literature written about teams
working in an online environment. Surprisingly, research that focuses exclusively on
the performance of teams working in an online environment in an educational setting is
limited. A review of the current literature on virtual teams (Powell et al., 2004) has
revealed that much of the research concentrates on a comparison of traditional and
virtual teams, rather than the study of how to improve the functioning of virtual teams.
Nevertheless, research on performance in virtual teams, as described below, shows that
a virtual team can perform as well as face-to-face teams. Other studies show a need for
better support of the online teaching and learning process in order to improve
performance.
Several research studies on college students compared the performance of
student teams in traditional face-to-face courses, with the performance of student teams
that worked exclusively online, and teams that experienced a blended course. Rivera
and Rice (2002) conducted a study to compare all three methods of delivery, face-to-
face, blended, and exclusively online, in an undergraduate introductory course on
management information systems. The online component in the blended and
exclusively online courses served as a repository for subject matter information and as a
drop box for depositing completed work. Minimal discussion-based learning took place
online. Class performance for all three of the delivery methods was analyzed by
comparing the scores of a multiple-choice final examination taken by all three groups.
This study found no difference in test performance between different delivery methods.
The authors had assumed the face-to-face students would perform better than the other
groups. The authors viewed the results as positive because students working online

24
were able to achieve the same level of success without meeting face-to-face in the
traditional classroom.
In another study that compared students in exclusively online courses with
students in traditional courses, Ury (2004) found that students fell behind easily in
online courses. Ury cited the lack of interaction with their fellow students and the
instructor as possible reasons. Some students reported problems with hardware and
software. This may indicate a lack of support or a lack of awareness of the availability
of support, an “out of sight out of mind” mentality. Uhlig (2002) talks about the rapid
development of online courses and cautions that both the teacher and student must be
prepared to teach and learn online. He cautions that the student must have a strong
sense of responsibility, a commitment to succeed and be self-motivated to stay on task
in the online learning environment. Cooper (2001) also reported that the success of
online instruction depends on the strength of the teacher, the student, and the subject
matter.
While the previous studies did not indicate a significant collaborative
component in the learning activity, the following study examined student teams in
traditional courses to virtual teams of students in blended courses with required online
problem-based learning activities. The research studied undergraduate medical students
in an elective physiology course (Taradi, Taradi, Radić, & Pakrajac, 2005). The
researchers examined two groups of students. One group experienced traditional face-
to-face delivery methods including face-to-face problem-based learning activities. The
other group experienced a blended course. The students in the blended course attended
a traditional face-to-face course for some of their learning activities, but used a web-

25
based collaborative learning tool for their problem-based learning activities. Taradi et
al. examined the learning outcomes of the course by administering a final examination
that assessed the recall of information and the ability of the students to solve problems
in their domain. The results of the study showed a significant difference in the final
exam scores of the two groups. The group of students in the blended course
outperformed the students in the traditional course. The authors attributed this
difference to the richer discussion experienced by the students in the online discussion
groups, and the support afforded by the online tool to record discussions and retrieve
the discussions for study purposes.
Balthazard, Potter, and Warren (2004) studied the performance differences
between face-to-face teams and virtual teams as a way to understand if virtual teams
have the same performance characteristics as face-to-face teams. They studied teams of
students completing a class assignment as part of a traditional class (offered face-to-
face). Some teams completed the task online using a tool called FirstClass® and other
teams worked face-to-face. In their study, Balthazard et al. found that the
communications tool supported some forms of communication behavior but that
personality traits determined how a virtual team interacts and performs. The research of
Balthazard et al. suggests that too much variation in personality style leads to less
productive interactions in virtual teamwork. They also found that successful teams
consisted of members whose expertise was similar. Balthazard et al. (2004) suggested
that educators take advantage of using a pre-test to determine personality styles to form
teams that are more likely to engage in the productive process. This study indicates that

26
profiling of team members for their compatibility in motivation may be a good way to
form productive teams. Thus giving support to the idea of using social motive profiling.
Although the study of virtual team performance is limited, the literature reveals
that the virtual team could perform as well or better than teams that meet face-to-face.
Some of the factors that contributed to performance included the ability of the software
to archive or record discussions, and the compatibility of team members.
2.5 Trust in Virtual Teams
Trust is a key ingredient in a high performing team (Alexander, 2002; McKnight,
Cummings, & Chervany, 1998). In contrast to individual work, the members of a team
must be willing to rely on others to share responsibilities and be willing to take risks in
accepting that others are performing as expected. The next section discusses trust in
virtual teams.
Research on the performance and effectiveness of small groups of workers and
learners in virtual settings often focuses on the aspect of trust, as trust is important to
relationship building. In addition, the level of trust in small groups of college students
is one of the key factors to group success (Michaelsen, Knight, & Fink, 2002).
Deficiencies in our understanding of trust include the narrow definition of trust,
understanding in how trust develops and grows, and the role emotion plays in one’s
likelihood to trust another person (McKnight et al., 1995). McKnight et al. challenge
the definition of trust and urge research to delineate the various concepts of trust such
as interpersonal trust, institutional trust, and dispositional trust.

27
Institutional trust is the trust in social structures (Luhmann, 1991; Lewis &
Weigert, 1985; Shapiro, 1987). This type of trust is important for organizing and
maintaining social structures, such as those provided by the government or business
organizations. Institutional trust may also be called organizational trust or system trust
(Mayer, Davis, & Schoorman, 1995). This type of trust may not concern virtual team
studies, unless the trust in the organization or system is vital to the success of the team.
Dispositional trust is the intention of one person to trust another until that other
person gives cause not to trust him or her (Gambetta, 1988). Gambetta suggests that
dispositional trust is the reason team members will initially trust their team leaders.
Dispositional trust may also be the reason for a mechanism to trust that McKnight et al.
(1995) calls ‘unit grouping’. Unit grouping is the willingness to trust others because of
being in the same ‘unit’ or group. Therefore, people are willing to trust others in their
group because they all have the same assignment and tasks to perform. Another
mechanism of dispositional trust called ‘stereotyping’ (McKnight et al., 1995) may be a
positive or negative influence on trust. Stereotypes are formed by one’s physical
appearance or voice (Baldwin, 1992; Lewis & Weigert, 1985; Riker, 1971).
Stereotyping may cause initial trust to erode (McKnight, 1995). Stereotyping on these
experiences may be hindered in a virtual environment, as the team members may not be
able to detect physical attributes such as gender, race, ethnicity or physical abilities and
disabilities, or voice.
Interpersonal trust in a work relationship is the belief that all parties in the
relationship have their best interest in achieving the assumed objective (Mayer, Davis,
& Schoorman, 1995). Research in trust tells us that trust requires a willingness to be
28
vulnerable (Malhorta, 2003), and that it is necessary to be open to different points of
view (Falcone & Castelfranchi, 2001). Willingness to be vulnerable allows the
members to feel safe in asking questions and learning from others. Interpersonal trust is
deliberate; the person decides that he or she will trust or depend on others in a given
situation (McKnight et al., 1995). McKnight also urges researchers to study trust while
studying other social control mechanisms because the interplay of the different types of
trust may positively influence trust itself.
Virtual teams have only a short time to establish trust because, as a team, they
are charged to complete a task or project (Jarvenpaa & Knoll, 1988; Lipnack & Stamps,
1997) within a particular period of time and often do not take time online to socialize
(Kreijens et al. 2003). In the face-to-face world, trust develops over time as people
share their experiences and gradually get to know one another. In a virtual team, time is
at a premium. With a limited amount of time allotted to the virtual team, the members
do not have the opportunity to get to know each other before they begin their tasks;
they have to establish swift trust. Myerson, Weick, and Kramer (1996) coined the term
“swift trust” for a trust that develops by the mere assumption of team members that
everyone is trustworthy. There are two elements to swift trust, one is that participants
must be willing to suspend their own stereotyping of other individuals in order to trust;
the second element in swift trust is that the participants must have a positive
expectation towards others in the group. Myerson et al. posit that swift trust may
develop in short-lived teams because the team members simply do not have the luxury
not to trust each other. Thus, swift trust may be like “blind faith,” but the actions of the

29
group members at the early stages of the teamwork affect its growth and
maintainability.
The swift trust concept applies to many team projects in educational settings. It
may be especially relevant to teams in blended or virtual courses that lack a strong prior
history of interactions with other classmates. Swift trust was found to be an important
factor to the success of virtual teams in an exploratory study by Cappola, Hiltz, and
Rotter (2004). The study examined online courses and student virtual teams within the
online courses. The results of this study indicated that while swift trust was important to
performing initial team tasks, frequent communication and interactions between team
members online helped to maintain that trust. Their study agreed with previous research
(Kreijens et al. 2003) that expressed the importance of social interactions to build trust
and ultimately enhance performance. Cappola et al. emphasize that swift trust is very
important at the beginning of a virtual team project because the social interactions that
take place in a trusting environment help to ameliorate the feeling of isolation prevalent
in an asynchronous learning environment.
Feng, Lazar and Preece (2004) performed an empirical study to investigate
different online communication styles. They found that “likeability” is a key factor to
online trust. Likeability may occur with feelings of empathy that may develop when
people are willing to tell personal stories about themselves. Feng et al. (2004) caution,
however, that empathetic feelings must be accurate in order to generate trust. Bos,
Olson, Gergle, Olson, and Wright, (2000) found that software systems that support the
sharing of background information helped to develop trust. Feng et al. emphasize that
background information may help to know each other and thus may produce empathy;
30
trust depends on correctly understanding other’s feelings and providing the correct
response to those feelings, Feng et al. call this “empathetic accuracy”. Thus, the
communication style of the individual’s response to others will influence trust
development. The research of Feng et al. suggest that a software system that allows for
individuals to find members with similar interests, experiences, or other attributes, such
as home town, alma mater, disabilities, ethnicity etc., will help to promote empathetic
accuracy, that is, empathy that is grounded in common conditions such as gender,
home town etc., thus develop trusting relationships. The notion of empathetic accuracy
may give insight to the popularity of social networking sites where people with like
backgrounds and experience find each other and share personal information. Students
assigned to work in virtual teams do not have the luxury to organize their team by
choosing members with similar backgrounds and experiences. Perhaps if they did, they
would develop trusting relationships quickly.
The lack of face-to-face communication in virtual teams is believed to hinder
trust building. Research shows that face-to-face interactions are the best method to
encourage trust (Rocco, 1998). Other researchers have determined that developing trust
among members in a virtual team is difficult because members rely heavily on
technology to interact and have few opportunities for face-to-face meetings (Zolin,
Hinds, Fruchter, & Levitt, 2004). Further, research suggests that a way to develop trust
in a virtual team is to coordinate at least one, and possibly several, short face-to-face
meetings before assigning the virtual team project (Rocco, 1998; Suthers, Hundhausen
& Girardeau, 2003). However, as discussed previously, even in blended courses

31
students may not have the opportunity of face-to-face interaction before the virtual
project begins.
Expanding on Rocco’s work, Bos, Gergle, Olson, and Olson (2001) studied the
emergence of trust in face-to-face environment as compared to three other mediated
environments, namely video, phone, and text chat. The research of Bos et al. concluded
that while trust takes more time to emerge in a mediated environment, it does emerge.
More research is needed to say whether trust is sustained in mediated environments, but
the fact that trust does emerge is encouraging and allows researchers to continue to look
for ways to help trust emerge between members of online groups.
An alternative to face-to-face interactions before the virtual project is social
interactions online before the virtual project. Rovai (2002) posits that virtual groups
will develop trust if socialization is encouraged. Indeed, research in computer mediated
communication has shown that pre-task “get acquainted” online activities help establish
trust in virtual communication (Zheng, Veinott, Bos, Olson, & Olson, 2002). Zheng et
al. compared groups that met face-to-face for pre-task social activities with groups that
did not meet face-to-face, but instead performed pre-task social activities online. The
online activities included social chat, exchanging a photo, and completing a personal
information sheet. The face-to-face groups met in a private room for 10 minutes. Their
task was to become acquainted with each other. The online groups met in a chat room
for 15 minutes with the purpose of getting to know each other. Free form conversations
were expected; there was no specific strategy for either group to follow. The results
showed that the pre-task interactions did help to establish trust among the team
members. The online social chat interactions were found to be almost as effective in

32
establishing trust as the pre-task face-to-face interactions. The research of Zheng et al.
acknowledged that although it took longer to achieve high levels of trust, trust was
achieved.
Mark (1998) performed an ethnographic study of virtual teams. She observed
workers in globally distributed organizations over a period of three months. In addition
to her role as a silent observer in the ethnographic study, she also used questionnaires to
obtain information about communication and trust. In this study, Mark found that the
quality of the team facilitator was important to the coordination of tasks and helped to
keep the team on task and working towards the project goal. Mark also found that the
virtual teams benefit from having all of the data in one place, as in the discussion group
transcript, or in a common file storage area. The teams used these data repositories to
reflect on the process of the project, and it enhanced the team’s awareness of each other
as they contributed to the conversations and intermediate deliverables. This research
goes along with the idea that trust is facilitated by team members knowing what each
other is doing. Carroll et al. (2003) studied awareness with the use of notification tools,
with the help of a Java-based collaborative learning tool called the “Virtual School.”
The notification tools were designed for collaborators to be made aware of each other’s
activities in a learning task. The study analyzed the affects of the notification tool by
analyzing breakdowns in awareness. The study indicated “breakdowns in group factors
were caused by misperceptions of group member abilities, inadequate trust and non-
collaborative patterns of goal-related activity” (Carroll et al., 2003, p.621). Carroll et al.
conclude that the virtual system needs to provide ways for collaborators to “get to know
each other more easily” (p.621). In addition to online social chat, the researchers

33
further suggest using avatars, developing integrated histories of all interactions, and
providing incentives for members to collaborate within the groups.
Several other researchers (Iacono, 1997; Jarvenpaa & Liedner, 1988; Sarker &
Sahay, 2002; Zolin et al. 2004;) found that the development of interpersonal trust
among team members in virtual teams was directly connected to the type and frequency
of online communications. Zolin et al. (2004) showed that the trust plays an important
part in the willingness of an individual to contribute to the permanent record of the
online discussion. Continuous interaction (keeping the thread of conversations lively
and relevant), frequent interactions (fewer gaps between replies) and the willingness to
ask questions of one another during the online interactions led to higher trust teams.
(Cappola, Hiltz, & Rotter, 2001; Iacono, 1997; Jarvenpaa & Leidner, 1998; Sarker, &
Sahay, 2002).
Current research focuses on how trust develops. We know that swift trust takes
place at the beginning of the team formation, but new models are needed to determine
what really influences trust and trust development and maintenance (Hung, 2004;
Sarker, Lau, & Sahay, 2003). Tuckman (1965) defined four stages of group behavior as
“Forming, Storming, Norming, and Performing.” The forming state occurs at the
beginning of group interaction when the group members are highly dependent on an
outside coach or instructor for direction. Storming subsequently occurs when the group
becomes more independent; members begin to disagree as they define their goals, and
they are still in need of much coaching to overcome their disparate opinions. Norming
is the stage in which the group members begin to form an agreement on the goals and
objectives of their tasks. Finally, performing is the stage where the team members

34
understand their relationships and expectations. The tasks are accomplished in this
stage. A method to form groups that allows the members to reach the stage of
performing quickly is important in virtual teams, since they do not have the luxury of
time and they may not have access to an outside leader or coach to help them through
the earlier stages (Smith, 2005).
A systematic method to form virtual teams that can develop collective trust
without first having a shared history of meeting face-to-face may benefit team members
in both education and industry. Such a “matching” system could help bring isolated
individuals together with peers from diverse cultural or geographic backgrounds. In
turn, the sharing of knowledge among diverse groups builds social capital and trust.
2.6 The Challenges That Face Virtual Teams
In the mid-1990s researchers studied communications technology and groupware that
facilitated virtual teams. Some of the research of this era warned that groupware was
not yet standardized. Groupware features did not address the problems of how people
actually work in teams and this could lead to potential abuse of leadership when
implemented for virtual teamwork (Johansen et al. 1993). These researchers warned of
overselling groupware tools and were concerned that businesses and schools would
begin to force the implementation of virtual teamwork on people, even though many of
the individuals would be more productive if they continued to work alone. Researchers
warned educators not to assume that a group of students in a virtual setting with
adequate computer support to solve a carefully developed problem would collaborate
effectively or achieve successful outcomes (Carroll, Neale, Isenhour, Rosson, &

35
McCrickard, 2003; Guzdial et al., 1997; Kreijens et al., 2003). Carroll et al. (2003)
claims that the system needs to provide some way for online collaborators to be
acquainted easily. He further suggests that chat, use of avatars, and integrated histories
of all interactions may provide support in this direction. In addition, he found that
groups need a social incentive to collaborate.
The broad area of research on virtual teams has shown that while some were
researching the technology, others had already turned their focus to collaboration and
ways to make the virtual environment rich with the sort of communication objects that
exist in the face-to-face environments, such as informal discussion, social emotional
connections, and trust. Researchers began to recognize that the concept of virtual teams
became reality with the advances in collaborative technologies (Jarvenpaa & Ives,
1994). Although it was an advantage to be able to communicate and work together at a
distance, there were challenges to the virtual environment that were not well known.
The research of Paré and Dubé (1994) revealed three challenges of virtual
teams. They argued that it is a challenge for a virtual team to ‘gel’, keep the synergy
flowing, and monitor the work of team members (Paré & Dubé, 1994). The success or
failure of these challenges depends on the task, the equipment, the software availability
and compatibility, and the computer skills of team members (Paré & Dubé, 1994). Paré
and Dubé recognized that managing a virtual team was unlike managing a traditional
face-to-face team, and that a variety of human and technological factors need to be
studied. In particular, researchers need to study the need to communicate informally as
face-to-face workers do during gatherings in the office hallways or at the water cooler.
In addition, Paré and Dubé suggested that evaluating the process of team development

36
was important to understanding how to measure team performance. One such way to
measure process is to require frequent deliverables, and to examine stakeholder
satisfaction levels rather than a dichotomous outcome measure of success or failure.
While the earlier research on virtual teams focused mainly on the technology
used to facilitate the teams, newer research began to consider the human factors of
virtual teams. As groupware systems developed, new designs of groupware began to
address the issues of earlier research. However, some researchers believed that the
software or communications technology was driving the way people collaborate, and
not the other way around. A panel of researchers chaired by Sajda Qureshi (Vogel,
Jarvenpaa, & Chudoba, 2000) discussed the main challenges facing researchers of
virtual teams. They called attention to a lack of fundamental concepts driving the
research and suggest that research use the socio-cultural learning model to examine
aspects of virtual teamwork processes and outcomes. The socio-cultural model asserts
that knowledge is socially and culturally constructed (Vygotsky, 1978, 1986). What and
how the student learns depends on opportunities provided. Thus, Vogel et al. (2000)
suggest research shift its focus away from the technology and towards a learning model
and team members’ interactions, thereby challenging the technology designers to adapt
the technology to the learners.
The shifts of focus of virtual teams’ research from the technology factors to the
human factors lead researchers to more unanswered questions. Thus, research began to
explore and examine how to measure team effectiveness, the online collaborative
process and team performance (Balthazard, Potter & Warren, 2004; Clear &
Kassabova, 2005; Kelly & Bostrom, 1995; Kreijens, Kirschner, & Jochems, 2002).

37
Although the literature on the study of virtual teams has progressed from a focus on
features to support learning in groupware technology to a focus on the learner and
group interactions that affect learning outcomes, research on virtual teams is still
evolving. Research on virtual teams is challenging the very definition of a virtual team
and is examining how teams co-opt ubiquitous collaborative technology to support
teamwork (D’Eredita & Chau, 2005; LeRouge et al., 2002; Martins, Gilson, &
Maynard, 2004).
This research study is concerned with social motives and their effect on the
interactions in a semi-virtual team. The research questions in this study focus on the use
of social motives for team formation. More specifically this research examines the
effects social motives may have on trust and performance outcomes of semi-virtual
teams. The next section will examine the literature on social motives.
2.7 Social Motives and McClelland’s Acquired Needs Theory
Social motives are learned motivational needs. People learn what motivates them by the
feelings they experience in social situations (Wood et al., 2004). Social motives differ
among individuals, but it is safe to say that every individual in a social setting has
motivations that drive him or her to participate in order to fulfill personal social-
emotional needs. Social motives are important because they encourage collaborative
behavior in a social setting.
In 1961 Harvard research psychologist, David C. McClelland proposed a theory
of motivation called the ‘acquired needs theory’ which focused on three needs for
motivation: the needs for achievement, the need for affiliation, and the need for power.

38
He found that these three motivations are the three key motivational needs of
individuals within groups and social settings (McClelland, 1961). He based his theory
on the work of Henry A. Murray who studied personality profiling with the use of the
Thematic Apperception Test (TAT) (Morgan & Murray, 1935).
McClelland found that early life experiences help to form these needs, thus
social experiences in early life help an individual acquire these needs. For example, if a
child experiences enjoyment from the control of others, then that child will exhibit the
need for power as an adult. If a child experiences satisfaction from the comfort and
closeness of others then that need will continue to develop into a need for affiliation as
an adult. McClelland’s theory states that these needs are acquired by learned
experiences. Thus, the needs acquired as a child can be strengthened through training
and continued positive experiences in adulthood.
McClelland and his colleagues have studied the three social motivational needs
in many different settings. A longitudinal study of male college graduates showed that
married men’s need for power negatively affected their wife’s career level (Winter,
McClelland, & Stewart, 1977). Another study of adults in their late twenties showed
that their parent’s child-rearing practices correlated with their need for achievement or
power (McClelland & Pilon, 1983). The study showed that child-rearing practices such
as a rigid feeding schedule and toilet training correlated with the need for achievement
in adults, and practices such as allowing aggression and permissive sexual behavior
correlated with the need for power in adults.
McClelland also studied the effects of motivation on the treatment of illness and
found that individuals with a dominant need for power reported more serious medical

39
problems and higher frequency of illness. Patients with a dominant need for affiliation
responded quicker to medical treatment and had fewer illnesses overall (McClelland,
1989). In this study, McClelland applied an “affiliation motivation treatment” to the
patients with a dominant need for power, and the results showed that the patients
responded better to the medical treatments and had fewer repeat illnesses. This study
showed not only a breakthrough in medical treatment but also that social motivations
are learned.
The need for power can have two aspects, one negative and one positive. The
negative aspect occurs when an individual is selfish and insists on his or her own way.
The more positive aspect of power is the pursuit for the resources and authority to make
things happen. The individual who leads others to achieve exhibits the positive need for
power, but does not wish to dominate others in the pursuit of the goals. The individual
who has a strong need for power in the positive sense is likely to be an excellent
candidate for group leadership (Harrell & Stahl 1984; McClelland, 1988). Thus, a
person’s need for power can be one of two types, personal power, the need to direct
other people, or institutional power, the need to direct others towards a common goal
(McClelland, 1988).
The need for achievement manifests itself in an individual who enjoys situations
where he or she can take personal responsibility for solving difficult problems. This
person likes to set realistic goals and work to achieve those goals. The individual with a
strong need for achievement is driven by the sense of accomplishment. This individual
needs to receive ample feedback on his or her progress from collaborators, because he
or she uses this feedback as a measure of progress for achieving a goal.

40
The person with a strong motivation for affiliation is driven by the need for
friendly relationships. This person enjoys interacting with co-workers. This person also
possesses the need to be liked by others in the work place and social settings. The
affiliation oriented person prefers team activities to working alone. McClelland (1988)
believed this person might not be a task oriented worker since the drive to develop
personal relationships with co-workers is stronger than the individual’s motivation to
achieve the goal of work. However, a more recent study (Yamaguchi, 2003) has shown
that the person with a strong need for affiliation can be a good contributor to a group.
This person is likely to be the one to develop group cohesiveness and to possess the
most group spirit, social elements that ease the relationships of group members and lead
to effective interactions in work.
In addition to the studies mentioned above, McClelland argues that standard
intelligence tests do not adequately measure potential career success (McClelland,
1973). McClelland states that quantitative test questions do not take into account an
individual’s ability to lead or be influential in social groups as a power motivated
individual. The test also does not predict whether an individual would take action when
needed, as a person with a strong need for achievement would do.
McClelland was also interested in studying social motivations on whole
societies. In his book titled The Achieving Society, (McClelland, 1961) he linked high
achieving societies with greater economic growth and entrepreneurship. In another
book, Power: The Inner Experience (McClelland 1975) he emphasizes that the need for
power is not the need for domination, but the need to have an impact on something.
McClelland discusses the four stages of personal development and the power source

41
and object in each stage are either “other” or “self.” In the fourth stage of personal
development, one sees “other” as both the source and the object, and thus we have
power without domination. In this fourth stage, the individual empowers others through
his or her own actions.
Although McClelland has applied his acquired needs theory to many different
areas of society, this research study focuses on group work in a virtual team setting.
Therefore, the remainder of this literature review will focus on McClelland’s theory as
it applies to functioning with others in a workplace.
2.7.1 Social Motives in the Workplace
The social motives of power, achievement, and affiliation have been studied in
situations where people work face-to-face. Research on McClelland’s social needs
theory shows that the three social motives can be satisfied in many face-to-face settings
and that satisfaction of these social motives is related to successful performance
(Harrell & Stahl, 1984; McClelland, 1988).
In a study of Information Systems (I/S) professionals (Smits, McLean, &
Tanner, 1993) found that I/S professionals enjoy a high need for achievement.
Achievement oriented employees look forward to challenging work and will reward
their employer with dedication and performance, as needs energize behavior. If their
job is not challenging they will not be satisfied. The I/S professionals observed in this
research expressed a lack of challenge in their workplace and as a result most quit their
jobs to pursue a more challenging job elsewhere. Thus, this study indicates that a
proper job preview must be given to I/S professionals, since many I/S jobs may not

42
present the proper level of challenging work to these professionals. This study supports
pre-screening individuals to determine their social motivations and to match their social
motivations with appropriately challenging work.
Another empirical study of job satisfaction and performance of certified public
accountants (CPAs) showed support for McClelland’s theory that job satisfaction and
performance are results of an appropriate work environment that matches one’s social
motivational needs (Harrell & Stahl, 1984). The study showed that the need for
achievement correlated positively with the number of hours per day the employee
worked. The CPA professionals with high need for achievement considered their work
a challenge and were willing to put in long hours to achieve success. In addition, the
need for power correlated positively with job satisfaction of junior level employees in
large CPA firms where upward mobility was a viable reward for hard work. Harrell and
Stahl suggest that profiling potential employees for their social motivational needs
could help the hiring process. They concluded that individuals with a high need for
achievement would fit best in large CPA firms where long hours are expected, and the
power strength individual would enjoy working for a firm where hard work is rewarded
with opportunities for upward mobility. An affiliation motivated individual would not
enjoy working for long hours with little opportunity for socializing with co-workers.
In 1976, McClelland and David Burnham published an article about their
research on the style and behavior of over 50 managers in large U.S. corporations
(McClelland & Burnham, 1976). Although the article was published over thirty years
ago, it was included in the January 2003, Special Motivational Issue of the Harvard
Business Review. McClelland and Burnham’s research showed that managers scoring

43
highest in the affiliation motive were judged poor managers by their subordinates.
Managers with strength in affiliation were considered too friendly and did not “stick to
their guns” when it came time to disciplining low performing workers, thus alienating
the well performing workers. The workers perceived this as favoritism or lack of
management ability. McClelland and Burnham concluded that the affiliative manager
was not an effective manager. Their affiliative need to be on good terms with other
workers made it difficult for them to make the type of decisions necessary for good
management.
This study by McClelland and Burnham (1976, 2003) also showed that
managers who scored high in achievement were not as good at empowering others as
those who scored high in the power strength. Achievement strength managers were
more concerned with their own achievements than influencing their subordinates. They
often preferred to work alone, and would claim the success of a project as their own
rather than share the success with co-workers.
McClelland and Burnham found that the best managers or bosses are motivated
by the need for power. This may seem expected, but McClelland and Burnham stress
that the need for power is a desire to influence others to achieve. They call this power
motivated manager an institutional manager, because the institutional manager is
concerned with the institution and not his or her own individual accomplishments and
glory. These managers kept teams on track and encouraged workers to excel but were
not afraid to call out workers with low productivity and push them to perform better.
This relates back to McClelland’s work on the four stages of personal development.
The best power motivated manager is in the fourth stage of personal development,

44
where the source and object of power is the other. The research indicates that while the
best managers score highest in the power motive, they also score high in achievement,
and not too low in affiliation. The best managers have an “empire building” personality.
The power motivated individual works to attain the continuous goals of the institution
to grow. Researchers caution that this is the reason big businesses needs some
government regulation to prevent authoritarianism and monopolies.
Other studies of managers using McClelland’s motivation orientations have
shown that the motivational profile of managers in relation to their success is similar,
regardless of their ethic and cultural backgrounds (Watson & Barone, 1976;
Yamaguchi, 2003). Watson and Barone compared a group of white managers to a group
of black managers. The managers were chosen from large corporations so that one
member in each group would specifically be of the same supervisory level, age, and
years in the position so that the two groups would consist of a similar set of managers
regardless of racial background. The study found no significant difference in the
motivational profiles of white managers as compared to black managers. Yamaguchi
studied over 240 Japanese university students and found that the behaviors of
individuals according to their motivational needs correlated to the behaviors of
individuals in studies carried out in Western culture.
Although the studies of McClelland’s motivational needs have been applied to
various workplace group and team situations, there is scant work on the motivational
needs of college students and how profiling the needs of college students can be used to
motivate learning and working together in groups.

45
2.7.2 Social Motives and Virtual Teams
A search for articles on social motives in situations that involve online interactions
produced no substantial results. This search result indicates a gap in the research on
teams working in the online environment; hence this dissertation study of social
motives and online team performance and trust is warrented.
Rad and Levin (2003) constructed a formula for potential project success in
virtual teams by carefully defining the appropriate activities to fulfill each motivational
need. These activities and their rationales are discussed in the following paragraphs.
First, Rad and Levin believe that the achievement oriented person is well suited
to the virtual team process, because this type of need does not demand a high degree of
established interpersonal relationships or face-to-face communications in order to
satisfy the need to complete the assigned work. The achievement oriented person is
driven to accomplish the task and will adapt to the group in order to succeed. However,
a danger in an educational online collaboration is that the achievement oriented person
will work alone to achieve the task, if that is what it takes to complete the work. This is
not the mark of a good team player and indeed would be contrary to educational goals.
Second, effective communication plays a key role in team project success. Rad
and Levin suggest that the affiliation oriented person is the least suited for virtual
teamwork, based on the premise that his or her need for personal interaction will not be
satisfied in the virtual environment. However, they also assume that such individuals
possess social and interpersonal talents that may be an asset to a virtual team. These
talents can be revealed by giving the affiliation oriented person key roles in team
building activities. These individuals may be quite good at facilitating communication

46
between team members and making sure that all team members get to know one
another (Rad & Levin, 2003).
Third, Rad and Levin also suggest that the power oriented person may not find
satisfaction in the virtual team because the virtual environment may not provide a
satisfactory platform to exhibit his or her work. Power individuals need to be
recognized for their work and may find that their accomplishments remain hidden
because the team accomplishment, and not that of the individual, is recognized. To
satisfy the needs of this type of individual he or she may be assigned such roles as team
leader. A power individual might also be given the task of spokesperson for the team or
responsibility for transferring information to the higher authority or manager to whom
the team reports. This person should be the person that helps direct the project and
keeps the team on task.
Based on the roles described above, Rad and Levin (2003) carried out an
empirical study of the social motives of individuals assigned to a virtual team in a
corporate environment. Individuals were pre-assigned to the virtual team before the
study began; the researchers did not have the opportunity to assign the roles in the
virtual team based on members’ social motives. Instead, in the beginning of the study,
the social motive strengths of individuals in the virtual teams were measured. During
the team project, the researchers looked at the types of tasks these individuals
spontaneously took on during the team project and studying the individual’s work
behavior to see how it corresponded to the individual’s social motive strength. They
found that team members did generally adopt the roles and activities predicted above by
Rad and Levin, i.e., those that fit with the individuals’ measured social motives. As a

47
result, of the study, they developed a tool to facilitate project team success by managing
the behavioral attributes of the team’s members. The results of Rad and Levin’s study
are encouraging for incorporating the factor of social motives in virtual teams.
However, to date, there has been no research on team performance and trust in an
educational environment based on formation of virtual teams using the social needs of
power, achievement and affiliation.
In sum, this study aims to investigate the formation of semi-virtual teams
without regard to specific technology or the software in which teams are
communicating. While there is much evidence virtual environments can hinder social
interactions resulting in less effective task outcomes (Handy, 1995; Larsen &
McInerney, 2001; Rad & Levin, 2003; Rocco 1998). Jarvenpaa and Liedner (1998)
studied trust in virtual teams and found that it can exist; however, this study attempts to
use social motives as a tool to ensure that trust will develop. There are many roles to
play in a virtual team environment, such as coordinating communications, meeting
deadlines, organizing the work in progress, and staying focused on the required task.
Adapted from Rad and Levin (2003), Table 2-1 illustrates potential tasks and types of
social motivation that may be a good fit for virtual teams in a blended course in an
educational environment.

48
Table 2-1 Asynchronous Communication tasks and Corresponding Social Motives
Power Achievement Affiliation
Organize deadlines for postings and replies X
Determine how to post and share interim
deliverables X
Reply to postings rather than lead by posting new
information X
Stay on task X
Develop socio-emotional ties among members X
Anticipate obstacles X X
Motivate team members to achieve X
2.8 Conclusion
This chapter presented a review of the literature on virtual teams and social motives
most relevant to this research. The research project’s main objective is to explore the
question of whether individual’s social motives can be a factor that helps to create a
semi-virtual team of individuals that develop trust and perform well on the assigned
tasks.
The literature reveals that social motives have been a factor in forming
productive teams that work face-to-face, but to our knowledge there is nothing found in
the literature that indicates social motives have been tested in the virtual environment.
Some research has suggested that individual social motives may not be satisfied in the
virtual environment. The assumption is that the interactivity between members is not at
the level that could satisfy affiliation motivated individuals, and the achievement
motivated individual is not visible to the team’s supervisor. Visibility is important to
the achievement motivated individual because he or she needs feedback for his or her
efforts and achievements. This research attempts to challenge the assumption that social

49
motives are not satisfied in the online environment between members of semi-virtual
teams.
Trust has been shown to be an important factor to performance. While this
research did not intend to study the theory of trust by itself, it does hypothesize that
trust may develop between individuals working in a semi-virtual team.
In summary, the literature supports the need for further research on virtual and
semi-virtual teams. This study aims to further the research in this area by examining
social motives as a factor to form productive and trusting teams of students
collaborating online. The next chapter discusses in detail the methodology of this
research study.

50
3 Methodology
3.1 Introduction
The motivation of this research was to determine whether the social motives were
effectual in the online environment and hence could be used to form productive teams.
The literature review revealed that social motives influence job satisfaction among co-
workers in the face-to-face environment; however, the study of social motives among
co-workers and teammates in the semi-virtual environment has not been studied. In
fact, some researchers have made the assumption that social motives cannot be satisfied
in the online environment. Therefore, this study was designed to investigate the
possibility that social motives can be satisfied in the online environment, and that a
result of that satisfaction may be higher performance and trust among team members.
This research study examined students working as a semi-virtual team during a required
online learning assignment as part of an undergraduate course. The undergraduate
courses used in this study were blended courses; the instructors blended face-to-face
classroom instruction with required online learning assignments.
Each team of undergraduate students collaborated online via asynchronous
communication to develop a written solution to a human behavioral problem. Thus, the
problem required the team to work together online to discuss and synthesize the data
they had gathered into a consensus solution.

51
3.2 Participants and Materials
Sixty undergraduate students attending Penn State University Delaware County campus
participated in this study. There were 25 female and 35 male participants. The students
were enrolled in a general chemistry course or in one of two sections of a first-year
English course. As part of these courses, the students were required to work
collaboratively online to research, discuss, and ultimately generate a feasible solution to
a complex human problem. This study focuses on the online team project and not on
the course as a whole. The study uses social motives to form the teams and measures
performance and trust to determine the influence of social motives as a factor for team
formation. Most of the participants in this study were freshmen. They ranged in age
from eighteen to twenty-six years old.
Participants’ social motivations were assessed by employing McClelland’s (1991)
Personal Values Questionnaire (PVQ). Teams of three students each were created using
their social motivation strength as a guide. One member of each team had strength in
the power motive and the other two members both had strength in the same motive.
Thus, the teams comprised one power strength individual and two affiliation strength
individuals, or one power strength individual and two achievement strength individuals.
Teams were assigned to a project that required them to collaborate by sharing thoughts
and ideas and ultimately to propose a solution to a difficult human problem online
using an asynchronous discussion board tool. Although the requirement of the project
was that the students work only online, at the end of the experiment several teams,
mostly from the English course, reported having face-to-face interactions with their
fellow teammates.

52
At the completion of the online team assignment, the student participants’
satisfaction with their social motives in the online environment was assessed using a
post-survey questionnaire based on the PVQ. Construction and validation of the post-
survey questionnaire is discussed in a subsequent section of this chapter. Trust was
assessed using a trust questionnaire designed by Jarvenpaa and Leidner (1998). The
course instructors assessed project performance.
A statistical analysis of the social motives strength scores, collected before the
project, and social motives satisfaction scores, collected after the project, was
performed to find out if explicit social motives of achievement, affiliation, and power
could be satisfied in an online environment. In addition, trust and project performance
were analyzed against social motive strength to find out if there were any significant
relationships.
3.2.1 Survey Instruments
Three main survey instruments were used in this research. These surveys included the
Personal Values Questionnaire (PVQ) used to determine one’s social motive strength,
the Social Motives Satisfaction Survey administered after the online project to assess
one’s satisfaction with their social motives, and the Trust Survey. In addition, at the
conclusion of the project, the students completed a Communications Survey aimed at
gathering background information about their prior experience working in online
environments and their online communication behavior during this study. The purpose
of this survey was to supplement the quantitative analysis with self-reported behaviors.
The data for this study were not used in the analysis of the research questions but is

53
discussed in the discussion of the analysis in chapter 5. The instruments are discussed
in the following sections.
3.2.2 The Personal Values Questionnaire (PVQ)
Physiologist David C. McClelland studied human motivation and developed the
acquired needs theory which states that humans are motivated by one of three learned
social motivations: achievement, affiliation or power. McClelland and his colleagues at
McBer & Co. in Boston, now the HayGroup, developed the Personal Values
Questionnaire (PVQ) tool in 1991 (McClelland, 1991; HayGroup, 1993). The PVQ is a
self-scoring instrument that measures one’s values in the three social motives of
achievement, affiliation, and power (Hay Group, 1993). The administrative simplicity
of the PVQ and the short time it takes to complete the questionnaire made the PVQ the
preferred tool for this study to measure students’ social motives.
The PVQ consists of 36 items and uses a 6-point Likert-type scale ranging from
0 to 5. Example of PVQ items representing each of the three social motives of power,
achievement, and affiliation along with the 6-point scale are shown below:
“Please use the scale below to rate how important each item is to you.”
Power motive example - Important positions and projects that can give me recognition
Achievement motive example- Personally do things better than they have been done before Affiliation motive example - To be able to spend a great deal of time in contact with other people 0 = Not important to me 1 = Of little importance to me 2 = Of some importance to me 3 = Important to me 4 = Very important to me 5 = Extremely important to me

54
The complete Personal Values Questionnaire appears in Appendix A. The PVQ uses 10
unique items to measure each of the three motivations; six items on the PVQ are filler
items that are not included in the social motive score calculations. (See the PVQ
Scoring Instrument in Appendix B.) Social motive scores are calculated by averaging
the responses of the 10 items in each of the three categories. Cronbach’s alpha score for
internal consistency was calculated on the PVQ data to measure the reliability that the
PVQ measured three constructs consistently. Typically, an alpha score of 70 percent or
higher indicates an acceptable reliability but lower thresholds are acceptable in social
science research (Nunally, 1978). Using SPSS, Cronbach’s alpha reliability score for
the PVQ instrument indicated adequate reliability for each of the three constructs as
follows: achievement = .74, affiliation = .72, and power = .88. For reference, the PVQ
data collected for the pilot study for this research showed the following alpha reliability
scores for the three constructs: achievement = .80, affiliation = .67 and power = .86.
Other literature that employed the PVQ in research showed alpha scores of
achievement = .90, affiliation = .87, and power = .90 (Langens, 2007). The measures
above support that the PVQ is a reliable instrument for measuring the three constructs
of achievement, affiliation, and power.
3.2.3 The Social Motives Satisfaction Survey
The student participants completed a “social motive satisfaction” survey to assess the
satisfaction, or fulfillment, of the participants’ social motivations while interacting
online in the online environment. The PVQ instrument was not designed to measure
satisfaction of social motives during a project; therefore, the researcher developed an

55
easy-to-administer survey, guided by the items in the PVQ instrument that tests for
satisfaction of the three social motives. An explanation of the creation of the Social
Motives Satisfaction Survey is given in the following paragraphs. For ease of
readability, the Social Motives Satisfaction Survey will occasionally be referred to as
the “post-survey” to promote understanding of the sequence of events in this research
study.
The Social Motives Satisfaction Survey was administered to the students after
completion of their online team project. This survey instrument was designed to
measure the student’s satisfaction with his or her social motives while working in a
semi-virtual team environment. In industry contexts, most measures of social motive
satisfaction have been studied via one-on-one interviews including questions about job
satisfaction and interactions with co-workers and supervisors (Harrell & Stahl, 1984;
McClelland, 1989; McClelland & Burnham, 1976; Yamaguchi, 2003). Understandably,
the in-depth interview process precludes large numbers of interviewees. However, to
investigate student satisfaction dealing with large numbers of students, a survey
instrument was needed.
Each item on the Social Motives Satisfaction Survey was aligned with an item
on the PVQ survey. However, some of the items on the PVQ survey were eliminated
for use on the satisfaction survey for various reasons. For example, six of the PVQ
items (items 4, 11, 15, 20, 25, and 29) were not used to evaluate social motive strength
in the PVQ scoring instrument, and therefore did not relate to social motives
satisfaction; these questions were not considered for inclusion in the design of the
Social Motives Satisfaction Survey. An explanation for excluding these items was not
56
given in the documentation for the scoring instrument; however, a representative from
the HayGroup explained that these items were included in the PVQ to disguise the
intent of other items and were not needed to measure the social motive strength. In
addition, several of the thirty remaining PVQ items focused specifically on a person’s
position within his or her family and work environment. For example, the PVQ asks
respondents to rate the importance of “Possessions that are impressive to others” (item
number 3 on the PVQ) and the importance of “Not being separated from the people I
really care about” (item number 12 on the PVQ). These questions are not related to the
satisfaction of social motives within an academic virtual team environment. Therefore,
six additional items, numbers 3, 9, 12, 19, 30, and 33 on the PVQ, were eliminated
from consideration in the design of the Social Motives Satisfaction Survey. The
remaining twenty-four items from the PVQ informed the design of items for the Social
Motives Satisfaction Survey.
It was important to preserve the intent of the PVQ items in the Social Motives
Satisfaction Survey and to rephrase them so that they related specifically to satisfaction
of social motives in an online team within an academic setting. For example, item 16
on the PVQ, an item in the power motive category, asks users to rate the importance of
“Doing things that have a strong effect on others.” In the post-survey for social motives
satisfaction, this item corresponds to “In the virtual team project I was satisfied with my
opportunity to have a strong effect on others in my group”. The key terms used to
assess the power motive “strong effect on others” was maintained in the wording for
the post-survey. See Table 3-1 for a comparison of the phrasing of the items from the
PVQ and the items on the post-survey for social motives satisfaction.

57
In summary, the items on the post-survey were designed to retain the phrasing
of the items used to assess each social motive construct in the PVQ, so that the post-
survey questions for social motives satisfaction would be consistent with the PVQ.
Table 3-1 Comparison of PVQ Items and Social Motives Satisfaction Survey Items
Used in this Study Social Motives Survey (Appendix D)
PVQ (Appendix A) Prompt: “Please rate how important each item is to you” Prompt: “In the virtual team I was
satisfied with my opportunity to…”
1 Close, friendly, cooperative relations with others at work.
Develop close, friendly, cooperative relations with the others in my group
2 Continual opportunities for personal growth and development.
Grow and Develop
3 Possessions that are impressive to others. Not used
4 A calm, orderly, well-organized environment in which to work and live.
Not used
5 Opportunities to take on more difficult and challenging goals and responsibilities.
Take on more difficult tasks
6 The freedom and opportunity to talk and socialize with others at work.
To talk and socialize with others in my group
7 Continuously new, exciting, and challenging goals and projects.
Find new and challenging goals within the project
8 Important positions and projects that can give me recognition.
Have a position that gave me recognition within my group
9 Having plenty of time to spend with my family. Not Used
10 Feedback on how well I am doing or progressing toward my objectives.
Receive adequate feedback on how well I was progressing toward my goals
11 The confidence that my family is financially secure. Not Used
12 Not being separated from the people I really care about. Not Used
13 Opportunities to create new things. To create new things
14 Opportunities to influence others. Influence others
15 Independence to do as I see fit, without interference from others.
Not Used
16 Doing things that have a strong effect on others. Have a strong effect on others in my group
17 A position with prestige. Hold a position of prestige
18 Concrete ways to be able to measure my own performance.
Measure my own performance
19 To be able to work with people who are also my close friends.
Not Used
20 Freedom from petty restrictions and red tape that get in my way.
Not Used
21 Taking forceful action. Take forceful action
22 Personally doing things better than they have been done before.
Do things better than I have done them before
23 Maintaining a close relationship with the people I really care about.
Become friends with the people I worked with
24 To be in a leadership position in which others work for me or look to me for direction.
Be in a leadership position

58
Table 3-1 (continued) 25 A clear sense of what others expect of me. Not Used
26 To be able to spend a great deal of time in contact with other people.
Have a good deal of contact with others in my group
27 Maintaining high standards for the quality of my work. Maintain a high standard for the quality of my work
28 Opportunities to influence the decisions that are made in any group I am part of.
To influence the decisions that were made in my group
29 Clear tasks and responsibilities. Not Used
30 Opportunities to become widely known. Not Used
31 The opportunity to be part of a team. Become a part of the team
32 Projects that challenge me to the limits of my ability. Challenge the limits of my ability
33 Having plenty of free time to spend with my friends. Not Used
34 Personally producing work of high quality. Personally produce work of high quality
35 Being well liked by people. Be well liked by my team members
36 The opportunity to exercise control over an organization or group.
To exercise control over the group
3.2.4 The Trust Survey
The Trust Survey was a twelve-item 5-point Likert-type survey designed by Jarvenpaa
and Leidner (1998) to assess trust in global virtual teams. The rating scale for the
survey ranged from 1 (Strongly Disagree) to 5 (Strongly Agree). The Trust Survey is
located in Appendix E. Jarvenpaa and Leidner developed the 12 items from two pre-
existing validated trust surveys developed by Mayer, Davis, and Schoorman (1995) and
Pearce, Sommer, Morris, and Frideger (1992). The questions from these two validated
trust surveys measured two kinds of trust: the concepts of trust and of trustworthiness.
In a factor analysis, Jarvenpaa and Leidner found that the combined items loaded as
expected into two factors corresponding to the two surveys. However, in their study of
virtual teams, the alpha reliability statistic for the complete set of 12 questions was low.
To improve the reliability they included only the items from the Pearce et al. (1992)
survey and removed items in the Pearce study that had a factor loading of less than .4.
As a result, Jarvenpaa and Leidner used four items to measure trust in virtual teams.
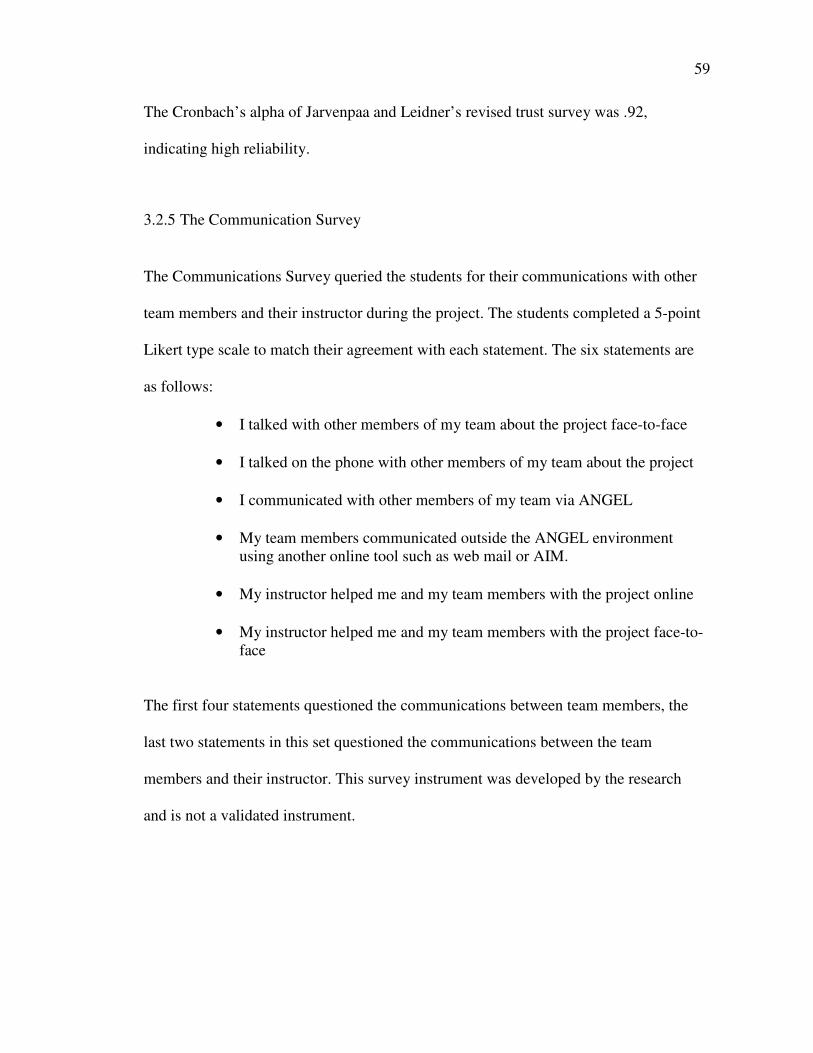
59
The Cronbach’s alpha of Jarvenpaa and Leidner’s revised trust survey was .92,
indicating high reliability.
3.2.5 The Communication Survey
The Communications Survey queried the students for their communications with other
team members and their instructor during the project. The students completed a 5-point
Likert type scale to match their agreement with each statement. The six statements are
as follows:
• I talked with other members of my team about the project face-to-face
• I talked on the phone with other members of my team about the project
• I communicated with other members of my team via ANGEL
• My team members communicated outside the ANGEL environment
using another online tool such as web mail or AIM.
• My instructor helped me and my team members with the project online
• My instructor helped me and my team members with the project face-to-
face
The first four statements questioned the communications between team members, the
last two statements in this set questioned the communications between the team
members and their instructor. This survey instrument was developed by the research
and is not a validated instrument.

60
3.3 The Pilot Study
A pilot study was carried out at Penn State University Delaware County. The pilot
study was meant to test the instruments and procedures to be used in the dissertation
study. The participants in the pilot study were students enrolled in courses taught by
several different instructors at Penn State University Delaware County. The courses
included two English composition courses, two information science courses, and one
course in the geosciences. Seventy-three students participated in the pilot study.
3.3.1 Reliability and Construct Validity of the Social Motives Satisfaction Survey
An exploratory factor analysis was performed on the data collected from the Social
Motives Satisfaction Survey to evaluate its construct validity. The exploratory factor
analysis suggested the presence of six factors with Eigenvalues greater than 1. For this
research, it was expected that the data would show only three factors corresponding to
the social motives of power, achievement, and affiliation. However, examining the data
closely it appeared that four of the factors were sub-factors that, when grouped, explain
the achievement motive. The other two factors clearly corresponded to the affiliation
and power motives. This six-factor solution explained 68 percent of the systematic
covariance among the items.
Next, a confirmatory factor analysis using a three-factor solution was carried
out. The three-factor solution explained 56 percent of the systematic covariance among
the items. Cronbach’s alpha reliability measure on the three constructs showed that the
internal consistency of the achievement items was .70, the internal consistency of the

61
affiliation items was .90 and the internal consistency of the power items was .87. These
reliability measures indicate that the set of questions measuring each construct are
significantly correlated within the set.
As a result of the pilot study data, some improvements in ordering and wording
were made. The data items on the Social Motives Satisfaction Survey for the
dissertation study were organized to match their corresponding order on the PVQ
instrument. In addition, the initial prompt on the Social Motives Satisfaction Survey
was changed from “During your group project you were given the opportunity to…” to
“In the virtual team project I was satisfied with my opportunity to…” The new phrasing
allowed the students to respond to the items from the perspective of satisfaction with
their opportunities rather than from the perspective of being given an opportunity. The
revised Social Motives Satisfaction Survey, incorporating these changes, is shown in
Appendix D. Refer back to Table 3-1 for a comparison of the items used in the PVQ
and the Social Motives Satisfaction Survey.
3.3.2 Reliability of the Trust Survey
The trust survey was taken from an instrument developed by Jarvenpaa and Leidner
(1998). Jarvenpaa and Leidner’s instrument was used to study trust among members
working in a virtual team. A Cronbach’s alpha reliability measure calculated on the
trust data collected in the pilot study showed very similar results as Jarvenpaa and
Leidner (1998). Using SPSS, Cronbach’s alpha reliability score was .42 when all 12
questions were included, indicating that some items were less than optimal indicators of

62
the underlying domain of trust. Including only the for items determined by Jarvenpaa
and Leidner (1998) to be valid for measuring trust, the Cronbach’s alpha reliability for
the pilot study data was .83. Thus, the pilot study data show that the reliability of the
trust instrument was consistent with the results of the reliability testing used in the
research on virtual teams performed by Jarvenpaa and Leidner (1998).
3.4 Procedure
3.4.1 Selection of the Courses Eligible to Participate
All instructors at Penn State University Delaware County who assigned an online
project in a blended learning course during the fall semester of 2005 were invited to
participate in the study. Courses were chosen based on their fit to the researcher’s
project specifications, including the length of the online team project and the weight of
the project towards students’ final grade. This study required that the student teams
work for approximately three weeks online to provide students with ongoing
collaboration in the virtual setting. In addition, this study required that the grading
weight of the online team project be substantial, approximately 10% of the final grade,
in order to encourage students to participate and contribute conscientiously to the
project.
Ultimately, the courses chosen for this study were two sections of an English
composition course and one section of Principles of Chemistry. One instructor taught
both of the English courses. A different instructor taught the chemistry course. Both
courses are general education requirements that fulfill either a literature or a science
63
core requirement. Although English and chemistry are quite different in discipline, the
virtual team projects were similar in that they required the student to perform research
and to collaborate online to synthesize a report that reflected the work, efforts, and
ideas of all team members.
The data were separated into two data sets for the analysis of the research
questions because the students may have had different experiences due to the nature of
the course work that could affect their social motive satisfaction and performance. The
data collected from the student participants from the English course became one data
set, and the student participants from the chemistry course became the other data set.
Thus, this study analyzes the research questions on two separate data sets.
3.4.2 The Instructor’s Role in the Online Project
The instructor’s role was to design the required tasks for the project, explain and
enforce the rules of the online project, that all communication occur only online, and
that the team rely on the leader to communicate to the instructor. In addition, the
instructor was to assign the team performance grade at the end of the project. The
project specifications required online communication and collaboration for the
successful completion of the project. The instructors’ involvement with the student
teams during the project varied somewhat with the complexity of the project. In the
online project, instructors were allowed to intervene via the message board or email to
ensure the students’ progress towards their goals. However, the instructors explicitly
agreed not to discuss the project face-to-face with the students.

64
3.4.3 The Project Specifications
The specifications of the online projects in both the English and chemistry courses
included some common aspects. Both projects required a collaborative effort to
complete it, and students were required to communicate only online by posting
messages and replying to others’ messages online. In order to receive a passing grade
on the project, the students had to demonstrate to the instructor that they worked
together and collaborated on the online team project. All projects were approximately
three weeks in length and to ensure that the project really was online, the students were
clearly instructed not meet to discuss the project face-to-face while they were working
on their projects. To ensure coordination and continuous communication, there were at
least two intermediate deliverables required from the students. The exact requirements
for the deliverables depended on the project. Some of the intermediate deliverables
were rough drafts of essays and others were specific components of the project
requirements, such as a partial proposed solution to the problem at hand.
The English project required the student teams to write an essay that exhibited a
collaborative approach to research (see Appendix G). The teams researched the
phenomena and trends of human behavior as related to the book “The Bone Woman”
by Clea Koff. The teams were assigned first to do research online to gain perspective
on the topic and then to choose a specific human phenomenon such as war, human
rights, and genocide to study in depth. Team members posted their research sources in
their online group folder along with a summary of what was gleaned from each source.
Then using an online discussion board, the team members brainstormed together to
develop a consensus on the causes of the specific phenomenon or trend of human
65
behavior they chose to study. The team then compiled a list of questions that their essay
would answer. Once the questions were determined, the team decided on a target
audience for their essay and made a list of assumptions about their audience. The team
was required to deliver a rough draft of the essay midway through the project, and then
produce a final 5 to 6 page essay.
The chemistry project was similar to the English project except that the subject
matter of the research project was the use and abuse of environmental pollutants as
related to human behavior (see Appendix G). First, the chemistry teams researched a
common environmental pollutant and, via online discussion, reached a consensus on
why this pollutant was important to study. Next, the team developed the exact chemical
structure of the pollutant and then produced a cohesive essay describing their findings
about the danger this pollutant posed to the environment. Finally, they had to discuss
alternative ways to manage the pollutant to lessen the danger to the environment
without enforcing sweeping changes to the current practices of using this chemical. As
in the English project, the chemistry project required that each student team develop a
unified solution that demonstrated a collaborative effort.
3.4.4 The Online Learning Environment and Campus Context
The participants used the web-based ANGEL online learning environment to carry out
their online team projects. Every student and faculty member at Penn State University
has access to the ANGEL environment. ANGEL is designed to support collaborative
learning. Features in ANGEL include chat rooms, drop boxes, message boards, and
team file space. ANGEL provides the ability for small groups of individuals to set up
66
an ANGEL “group” so that those individuals can communicate privately, either
synchronously or asynchronously, to support the work of the group. Students at Penn
State University Delaware County are given basic instructions on how to use ANGEL
in a required freshman seminar course.
Penn State University Delaware County is a commuter campus. The students
travel to campus from many different communities around the Philadelphia area. There
is little active student life on campus. Many of the students squeeze in class time
between heavy work schedules. Several of the students in each of the classes in the
pilot study had reported to the researcher verbally that they preferred working
asynchronously online because it gave them more time outside of class for other
activities. Many students also reported that they did not know their team members in
advance of the project, and had little contact with them before and after the project.
From these student comments, the researcher assumed that students participating in the
online project would not be friends or acquaintances before the project, and
consequently that they would not be very likely to meet and talk face-to-face during the
online team project. Nevertheless, students continued to attend class during at least part
of the three weeks, which opened opportunities for face-to-face discussion. At the end
of the project, the Communications Survey was administered to the students to gauge
how much face-to-face interaction occurred.
3.4.5 Construction of the Teams
The PVQ questionnaire, administered prior to the start of the project, produced three
scores for each participant. Recall that these three scores indicated a strength measure

67
for each of the three personal values of power, achievement, and affiliation. As
expected, each participant showed a higher score in one of the three social motives over
the other two (See Appendix H for the individual scores). The highest of the three
scores indicated the social motive strength of that individual participant.
Each student team had three members. Each team was constructed to have one
member with highest social motive strength of power. This member was designated the
team leader. The other two members of the team both had social motive strength in
either achievement or affiliation. Therefore, the three-member teams consisted of
individuals with social motive strength of “power, achievement, achievement”, or
“power, affiliation, affiliation” respectively. In one case, a team leader was needed but
the only person available had a very high score in power, but an even higher score in
achievement; the individual was assigned strength in the power motive. That person
was teamed with two other individuals with strength in affiliation.
3.4.6 Computing the Social Motive Satisfaction Score
As indicated earlier in this chapter, the design of the post-survey Social Motive
Satisfaction Survey was based on the items in the PVQ survey. Therefore, each of the
items on the Social Motives Satisfaction Survey fell into one of three categories for
social motives of power, achievement, and affiliation. Table 3-2 shows the social
motive category for each item.
The individuals’ responses to the items on the Social Motives Satisfaction
Survey were separated into the three social motive categories. The average rating from
each category produced three scores for each individual. The individual’s social motive

68
satisfaction score was the score from the same category as his or her social motive
strength (determined earlier by the PVQ survey). For example, a participant with social
motive strength in the power motive would be assigned a social motive satisfaction
score by averaging that participant’s ratings of the power items, numbers 6, 9, 10, 11,
13, 16, 19, and 24 in Table 3.2.
Table 3-2 Social Motives Survey Questions, and Social Motive Category
Social Motives Survey Item Motive Category
1. develop friendly relationships with others Affiliation
2. grow and develop Achievement
3. take on difficult Tasks Achievement
4. socialize with others Affiliation
5. find challenging goals Achievement
6. be recognized by others in the group Power
7. Receive adequate feedback on progress Achievement
8. to create new things Achievement
9. influence others Power
10. have a strong effect on others in my group Power
11. hold a position of prestige Power
12. measure your performance Achievement
13. take forceful action when needed Power
14. do things better than before Achievement
15. become friends with group members Affiliation
16. be in a leadership position Power
17. have a good deal of contact with others Affiliation
18. maintain high standards Achievement
19. influence group decisions Power
20. become part of a Team Affiliation
21. challenge the limits of your abilities Achievement
22. produce work of high quality Achievement
23. be well liked by team members Affiliation
24. exercise control over the group Power

69
The team social motive satisfaction score was calculated by taking the average
of the individual social motive satisfaction scores for all members of the team. Table 3-
3 shows the results of a fictitious set of four teams.
Table 3-3 Example of Calculation of Individual and Team Social Motive Satisfaction
Scores
Social Motive Score
Team Number
Student Number
PVQ Strength Power Achievement Affiliation
Individual Social Motive Satisfaction Score
Team Social Motive Satisfaction Score
1 1 Affiliation 3.10 3.10
1 2 Power 3.30 3.30
1 3 Affiliation 2.90 2.90 3.10
2 4 Achievement 3.90 3.90
2 5 Achievement 4.00 4.00
2 6 Power 4.30 4.30 4.07
3 7 Affiliation 2.90 2.90
3 8 Power 3.40 3.40
3 9 Affiliation 3.30 3.30 3.20
4 10 Power 3.40 3.40
4 11 Achievement 3.30 3.30
4 12 Achievement 3.60 3.60 3.43
3.4.7 Computing the Trust Score
The trust score for each individual was calculated by averaging the scores of the four
trust items on the Trust Survey. The score for team trust is the average of the trust
scores for all members of a team. Table 3- 4 illustrates the calculations of the team trust
score for a fictitious data set.

70
Table 3-4 Example of Individual Trust Score and Team Trust Score
3.4.8 Computing the Team Performance Score
The instructors ranked their students’ online team projects from best to worst. In the
case of the two English course sections taught by the same instructor, the instructor
treated the two sections as one. A numerical value of 1 was assigned to the best team; 2
was assigned to the second best and so on until all teams had a score that corresponded
to the performance ranking.
3.5 Summary
In summary, the method for testing social motives satisfaction while working online
started with measuring individuals for their social motive strength (PVQ) and using this
social motive strength measure to define which individuals would work together as an
online team. Next, the teams worked collaboratively in the online environment to
Team
Number
Student
Number
Individual
TRUST
Team
TRUST
1 1 3.50
1 2 4.40
1 3 4.10 4.00
2 4 3.60
2 5 2.90
2 6 3.10 3.20
3 7 2.00
3 8 2.80
3 9 2.10 2.30
4 10 1.80
4 11 2.90
4 12 3.80 2.83

71
complete a project that involved information gathering and synthesizing a cohesive
proposed solution to a difficult human problem. At the conclusion of the online project,
individuals completed the Social Motives Satisfaction Survey to assess the satisfaction
of social motive strength. A team social motive satisfaction score was also calculated
by averaging the individual team members’ satisfaction scores. Individual students also
completed a trust survey to assess individual and team trust. The instructor for each
course assigned a team performance score. The data collected included the social
motive strength (PVQ) scores, the social motive satisfaction scores, trust scores and
team performance. These scores were analyzed to determine whether social motives
can be satisfied in an online environment, and whether they have an influence on trust
and performance. The next two chapters present the results and discussion of this
research.

72
4 Results
4.1 Introduction
The purpose of this study was to examine a method of using social motives to establish
semi-virtual teams of college students that are likely to be successful collaborating
online. In particular, this research explored the relationship between social motive
strength, social motive satisfaction, trust, and team performance. The major focus of
this study was to examine social motives in the online environment and to find out
whether they can guide the formation of a productive team. Recall from earlier chapters
that the data were divided into two groups, English and chemistry.
Although all three social motives appear to some degree in each individual,
people working with others will most likely exhibit behavior that is motivated by one of
the three over the other two (McClelland, 1988). These social motives have been shown
to direct a person’s behavior when working with others face-to-face (Harrell & Stahl,
1984; McClelland, 1988). However, social motives have not been previously studied in
teams of people working in online environments.
Recall that research method for investigation of social motive satisfaction in the
teams included the PVQ pre-survey to determine social motive strength, a post-survey
to determine social motive satisfaction, and a trust survey. The instructor assigned each
team a team project performance score, which in effect ranked the team projects in
order from best to worst.
Likert-type surveys provided the data to establish students’ social motive
strength, social motive satisfaction, and trust, thereby creating ordinal data to analyze.

73
In addition, the team performance score was also a ranking. Hence, nonparametric
methods were used to analyze the data for this research.
This chapter contains several sections according to the data analyzed. Section 4.2
reports the results of the Communications Survey. Section 4.3 presents the descriptive
statistics from the PVQ, the Social Motives Satisfaction Survey, the Trust Survey and
an analysis of these data for individuals. Section 4.3 examines the following research
questions that ask whether there is a relationship between social motive strength and
social motive satisfaction, and whether social motive strength can influence trust:
1. Is there an association between social motive strength (PVQ scores) and
social motive satisfaction scores?
2. Will individual trust scores vary by social motive strength?
Section 4.4 presents the descriptive statistics and analyses of these data for teams and
examines the following research questions that ask whether social motive satisfaction
can be used to develop a team that performs well and develops trust:
3. Is there a relationship between team social motive satisfaction and team
performance?
4. Is there a relationship between team social motive satisfaction and team
trust?
5. Is there a relationship between team social motive strength and team
performance?
Section 4.5 concludes with a brief summary of the results.
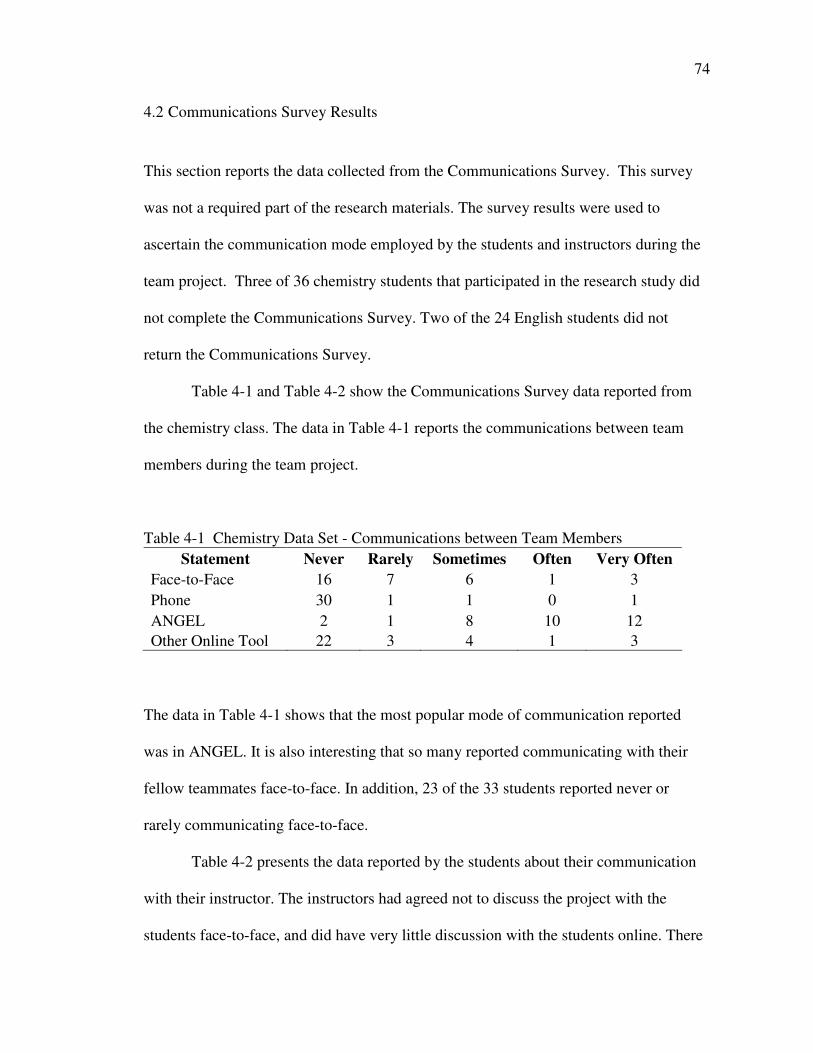
74
4.2 Communications Survey Results
This section reports the data collected from the Communications Survey. This survey
was not a required part of the research materials. The survey results were used to
ascertain the communication mode employed by the students and instructors during the
team project. Three of 36 chemistry students that participated in the research study did
not complete the Communications Survey. Two of the 24 English students did not
return the Communications Survey.
Table 4-1 and Table 4-2 show the Communications Survey data reported from
the chemistry class. The data in Table 4-1 reports the communications between team
members during the team project.
Table 4-1 Chemistry Data Set - Communications between Team Members
Statement Never Rarely Sometimes Often Very Often
Face-to-Face 16 7 6 1 3
Phone 30 1 1 0 1
ANGEL 2 1 8 10 12
Other Online Tool 22 3 4 1 3
The data in Table 4-1 shows that the most popular mode of communication reported
was in ANGEL. It is also interesting that so many reported communicating with their
fellow teammates face-to-face. In addition, 23 of the 33 students reported never or
rarely communicating face-to-face.
Table 4-2 presents the data reported by the students about their communication
with their instructor. The instructors had agreed not to discuss the project with the
students face-to-face, and did have very little discussion with the students online. There

75
was some intervention if a team had a problem with their progress or did not understand
something about the project. Depending on the severity of the problem, this may have
resulted in a face-to-face consultation.
Table 4-2 Chemistry Data Set - Communications between Instructor and Team
Statement Never Rarely Sometimes Often Very Often
Online 14 6 6 4 3
Face-to-Face 18 6 5 3 1
Table 4-3 and 4-4 show the Communications Survey data reported from the
English class. The data in Table 4-3 shows the report of communications between team
members during the team project.
Table 4-3 English Data Set - Communications between Team Members
Statement Never Rarely Sometimes Often
Very
Often
Face-to-Face 0 1 2 10 9
Phone 9 3 4 4 2
ANGEL 10 2 2 5 3
Other Online
Tool 3 2 3 5 9
The data in Table 4-3 shows that the most popular mode of communication reported
was face-to-face. This is much different from the data reported by the chemistry class,
where the most reported mode of communication was in the virtual environment.
Table 4-4 presents the data reported by the students about their communication
with their instructor. The instructors had agreed not to discuss the project with the
students face-to-face, and to have very little discussion with the students online. There

76
was some intervention by the instructor if a team had a problem with their progress or
did not understand something about the project. Depending on the severity of the
problem, this may have resulted in a face-to-face consultation between student and
instructor.
Table 4-4 English Data Set - Communications between Instructor and Team
Statement Never Rarely Sometimes Often Very Often
Online 8 2 4 4 4
Face-to-Face 0 1 6 8 7
Overall, the data from the Communications Survey report that the majority of the
chemistry students rarely or never talked face-to-face, while the English students talked
face to face more often. These data indicate that the chemistry students worked “more
virtual” than the English students did.
4.3 Individual Data
This section presents the results of the individual scores collected from the PVQ
survey, the Social Motives Satisfaction post-survey and the Trust Survey. The
individual data from 60 students were separated into two categories, one for the
students enrolled in the Principles of Chemistry course and one for the students enrolled
in the two English composition course sections. There were 36 participants from the
chemistry course and 24 participants from the English course sections. The majority of
the students were freshmen and sophomores. (See Appendix J for the data sets.)

77
The major goal of looking at the individual scores is to examine the research
questions that ask whether there is a relationship between social motive strength and
social motive satisfaction, and whether trust differs between individuals with different
social motive strengths. Recall that students were assigned teammates based on their
social motive strength (PVQ scores) and a post-survey was given to assess social
motive satisfaction and trust after the teams worked together. The level of acceptable
statistical significance for this study is at or above 95%. This level is the typical
acceptance level for social science research.
The analysis of the first research question regarding the relationship between the
social motive strength and social motive satisfaction for individual data was not
significant. The results of the data analysis investigating the relationship between
individuals’ trust scores and social motive strength showed significance, indicating that
individual trust scores do vary by social motive strength, and thus a positive result for
the second research question. The statistical analyses for the first two research
questions are explained in the next two sections.
4.3.1 Comparison of Social Motive Strength (PVQ scores) and Social Motive
Satisfaction Scores
Recall that the PVQ questionnaire was administered before the teams were assigned
their online project. The PVQ instrument determined the participants’ social motive
strength. The participants’ data were divided into three groups representing social
motive strength of affiliation, achievement, and power. Table 4-5 shows the median,
mean, and standard deviation for the social motive satisfaction score for each of the

78
three social motive strength groups for the chemistry data set, and Table 4-6 shows the
same information for the English data set.
Table 4-5 Median, Mean, and SD for PVQ Score for each Social Motive Strength –
Chemistry data set
Social Motive
Strength
(PVQ)
N
Median Social
Motive Strength
(PVQ) Score
Mean Social Motive
Strength (PVQ)
Score
Standard
Deviation
Affiliation 14 3.85 3.74 .47
Achievement 10 3.45 3.64 .55
Power 12 3.95 3.97 .43
Table 4-6 Median, Mean, and SD PVQ Score For Each Social Motive Strength –
English Data Set
Social Motive
Strength
(PVQ)
N
Median Social
Motive Strength
(PVQ) Score
Mean Social
Motive Strength
(PVQ) Score
Standard
Deviation
Affiliation 10 3.90 3.96 .55
Achievement 6 3.65 3.63 .40
Power 8 3.80 3.91 .57
The Social Motives Satisfaction Survey was administered after the online
project was completed. The purpose of the Social Motives Satisfaction Survey was to
determine whether the students were satisfied with their opportunity to do the things
that motivate them socially in an online team setting. The scale for each of the Social
Motives Satisfaction Survey scores was from 1.00 to 5.00, 5.00 is the highest score, and
1.00 is the lowest. See Appendix C for the Social Motives Satisfaction Survey
instrument.
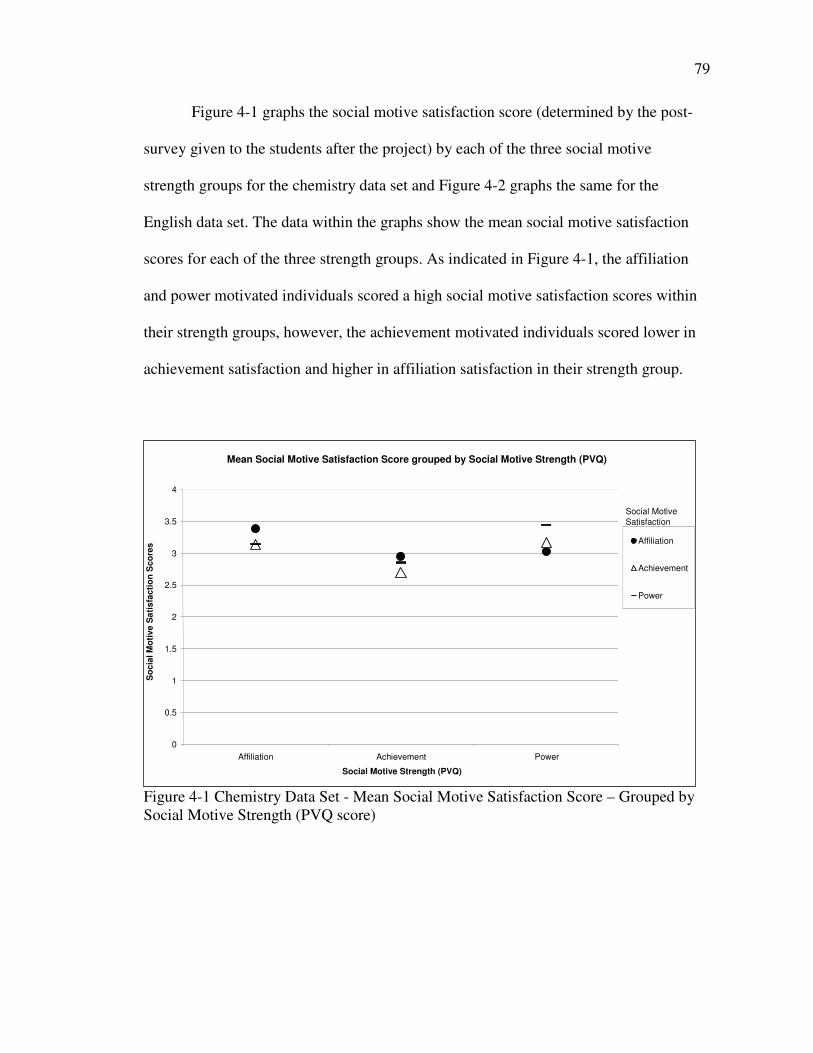
79
Figure 4-1 graphs the social motive satisfaction score (determined by the post-
survey given to the students after the project) by each of the three social motive
strength groups for the chemistry data set and Figure 4-2 graphs the same for the
English data set. The data within the graphs show the mean social motive satisfaction
scores for each of the three strength groups. As indicated in Figure 4-1, the affiliation
and power motivated individuals scored a high social motive satisfaction scores within
their strength groups, however, the achievement motivated individuals scored lower in
achievement satisfaction and higher in affiliation satisfaction in their strength group.
Figure 4-1 Chemistry Data Set - Mean Social Motive Satisfaction Score – Grouped by
Social Motive Strength (PVQ score)
Mean Social Motive Satisfaction Score grouped by Social Motive Strength (PVQ)
0
0.5
1
1.5
2
2.5
3
3.5
4
Affiliation Achievement Power Social Motive Strength (PVQ)
Affiliation
Achievement
Power
Social Motive
Satisfaction
So
cia
l M
oti
ve
Sa
tis
fac
tio
n S
co
res

80
The graph of the English data set (Figure 4-2) shows that the group of
individuals with social motive strength of affiliation scored a higher mean score for
achievement satisfaction than for affiliation satisfaction.
Mean Social Motive Satisfaction Score grouped by Social Motive Strength (PVQ)
1
1.5
2
2.5
3
3.5
4
4.5
5
Affiliation Achievement Power
Social Motive Strength (PVQ)
So
cia
l M
oti
ve S
ati
sfa
cti
on
Sc
ore
Affiliation
Achievement
Power
Social Motive
Satisfaction
Figure 4-2. English Data Set - Mean Social Motive Satisfaction Score – Grouped by
Social Motive Strength (PVQ score)
It was expected that if a person has a social motivation of a particular strength,
then his or her social motive satisfaction score would be highest for that motivation if
he or she were indeed satisfied with the opportunity to utilize that strength. To look for
a correlation between the social motive strength scores and the social motive
satisfaction scores a Kendall’s tau correlation was performed on the two variables.
Kendall’s tau correlation is equivalent to Pearson’s correlation; however, Kendall’s tau

81
is used with ordinal data and is preferred over Spearman’s Rho and other nonparametric
measures of association when the dataset has many ties (Norman & Streiner, 1986) or
when the number of observations is less than 20 (SPSS for Windows, 2005). The
results of the correlation for the chemistry data set showed that Kendall’s tau = 0.05 did
not indicate a statistically significant correlation above the 95% acceptance level (p =
0.70.) The results of the correlation for the English data set showed that Kendall’s tau =
0.09 also did not indicate a statistically significant correlation above the 95%
acceptance level (p = 0.57.) Thus, we cannot conclude a statistically significant
correlation between social motive strength and the social motive satisfaction scores.
Additional Kendall’s tau correlations in the chemistry and English data sets
were performed for each social motive strength. Results are shown in Table 4-7 and
Table 4-8.
Table 4-7 Chemistry Data Set – Correlations for Social Motive Strength (PVQ Scores)
and Social Motive Satisfaction Score
Social Motive Strength (PVQ) N Kendall’s tau Correlation
Affiliation 14 0.61
Achievement 10 0.08
Power 12 0.01
There is a significant correlation (p = .001) for the Power PVQ scores and the Power
Social Motive Satisfaction scores.

82
Table 4-8 English Data Set – Correlations for Social Motive Strength (PVQ Scores) and
Social Motive Satisfaction Scores
Social Motive Strength (PVQ) N Kendall’s tau Correlation
Affiliation 10 0.31
Achievement 6 0.70
Power 8 0.52
The English data set did not show any significant correlations between the Social
Motive Strength (PVQ scores) and the Social Motive Satisfaction scores.
4.3.2 Analysis of Social Motive Satisfaction Scores where Individuals are Grouped by
Social Motive Strength (PVQ scores)
Once again, the participants’ data from chemistry and English data sets were separated
into three social motive strength groups (affiliation, achievement, and power). The
Kruskal-Wallis analysis of ranks is a nonparametric test equivalent to the ANOVA
method for testing differences between independent groups. Three Kruskal-Wallis tests
were performed on the three strength groups to see if there was a significant difference
in each of the three social motive satisfaction scores between the groups. Table 4-9
shows the median, mean and standard deviation for the affiliation social motive
satisfaction score for each of the three social motive strength groups for the chemistry
data set, and Table 4-10 shows the same for the English data set.

83
Table 4-9 Chemistry data set - Affiliation Social Motive Satisfaction Scores for each
Social Motive Strength group
Table 4-10 English Data Set - Affiliation Social Motive Satisfaction Scores for Each
Social Motive Strength Group
Using social motive strength (PVQ) as the independent variable, and mean
affiliation social motive satisfaction score as the dependent variable, the Kruskal-Wallis
test was not significant for both the chemistry data set (X2
= 0.66, p = 0.72) and the
English data set (X2
= 1.50, p = 0.47). This result indicates that the Affiliation score was
not statistically different between the three social motive strength groups at or above
the 95% acceptance level.
A Kruskal-Wallis test was performed to determine whether the achievement
social motive scores differed significantly between the three social motive groups.
Table 4-11 shows the median, mean, and standard deviation for the achievement social
Social Motive
Strength (PVQ) N
Median
Affiliation Social
Motive
Satisfaction Score
Mean
Affiliation Social
Motive
Satisfaction Score
Standard
Deviation
Affiliation 14 3.67 3.38 0.81
Achievement 10 3.20 3.13 1.37
Power 12 3.25 3.14 0.74
Social Motive
Strength
(PVQ)
N
Median
Affiliation Social
Motive
Satisfaction Score
Mean Affiliation
Social Motive
Satisfaction Score
Standard
Deviation
Affiliation 10 3.67 3.57 0.72
Achievement 6 4.17 3.94 0.80
Power 8 3.33 3.25 1.26

84
motive satisfaction scores for each of the three social motive groups in the chemistry
data set, and Table 4-12 shows the same for the English data set.
Table 4-11 Chemistry data set - Achievement Social Motive Satisfaction Scores for
each Social Motive Strength group
Table 4-12 English data set - Achievement Social Motive Satisfaction Scores for each
Social Motive Strength group
A Kruskal-Wallis test was performed on these data using social motive strength
(PVQ) as the independent variable, and achievement social motive satisfaction score as
the dependent variable. The results of these tests also were not significant for both the
chemistry data set (X2
= 0.94, p = 0.63) and for the English data set (X2
= 3.39, p =
Social Motive
Strength
(PVQ)
N
Median
Achievement
Social Motive
Satisfaction
Score
Mean
Achievement
Social Motive
Satisfaction
Score
Standard
Deviation
Affiliation 14 3.20 2.95 0.84
Achievement 10 2.70 2.70 0.68
Power 12 2.75 2.85 0.93
Social Motive
Strength
(PVQ)
N
Median
Achievement
Social Motive
Satisfaction Score
Mean
Achievement
Social Motive
Satisfaction Score
Standard
Deviation
Affiliation 10 3.70 3.69 0.59
Achievement 6 3.70 3.73 0.62
Power 8 3.15 3.23 0.67
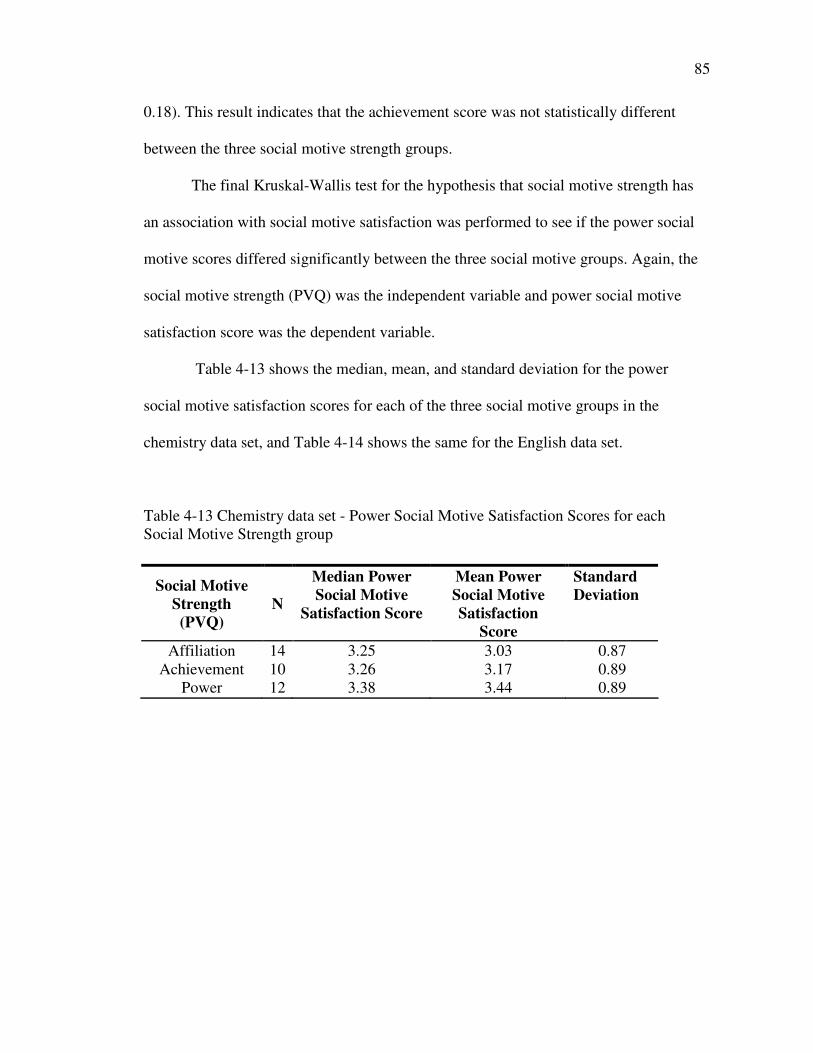
85
0.18). This result indicates that the achievement score was not statistically different
between the three social motive strength groups.
The final Kruskal-Wallis test for the hypothesis that social motive strength has
an association with social motive satisfaction was performed to see if the power social
motive scores differed significantly between the three social motive groups. Again, the
social motive strength (PVQ) was the independent variable and power social motive
satisfaction score was the dependent variable.
Table 4-13 shows the median, mean, and standard deviation for the power
social motive satisfaction scores for each of the three social motive groups in the
chemistry data set, and Table 4-14 shows the same for the English data set.
Table 4-13 Chemistry data set - Power Social Motive Satisfaction Scores for each
Social Motive Strength group
Social Motive
Strength
(PVQ)
N
Median Power
Social Motive
Satisfaction Score
Mean Power
Social Motive
Satisfaction
Score
Standard
Deviation
Affiliation 14 3.25 3.03 0.87
Achievement 10 3.26 3.17 0.89
Power 12 3.38 3.44 0.89

86
Table 4-14 English data set - Power Social Motive Satisfaction Scores for Each Social
Motive Strength group
The
results of the Kruskal-Wallis test on both the chemistry data set (X2
= 0.67, p = 0.72)
and English data set (X2
= 0.54, p = 0.76) was not significant. This result indicates that
the power score was not statistically different between the three social motive strength
groups.
It was expected that the individuals of specific social motive strength, such as
power, would show a significant difference in their social motive satisfaction score for
that strength than individuals of the other strengths. The results of these tests indicate
that we cannot conclude with any certainty that individuals were satisfied with their
opportunity to pursue their social motive satisfaction in the semi-virtual team project.
4.3.3 Relationship of Social Motive Strength (PVQ scores) and Individual Trust Scores
The second research question in this study asks whether an individual’s trust score will
vary significantly with respect to social motive strength (PVQ). To test this hypothesis
the participants were separated into three social motive strength groups: affiliation,
achievement, and power. A Kruskal-Wallis analysis of ranks was conducted on each of
the social motive strength groups. The social motive strength score was the independent
variable, and trust score was the dependent variable.
Social Motive
Strength
(PVQ)
N
Median Power
Social Motive
Satisfaction
Score
Mean Power
Social Motive
Satisfaction
Score
Standard
Deviation
Affiliation 10 3.44 3.43 0.57
Achievement 6 3.50 3.48 0.80
Power 8 3.69 3.80 0.73

87
Table 4-15 shows the median, mean, and standard deviation for the trust scores
for all 36 participants from the chemistry data set, categorized by their social motive
strength of affiliation, achievement, or power. Table 4-16 shows the same for the 24
participants from the English data set.
Table 4-15 Chemistry Data Set – Mean and Median Trust Scores for Each Social
Motive Strength Group
Table 4-16 English Data Set – Mean and Median Trust Scores for Each Social Motive
Strength Group
The results of the Kruskal-Wallis test on the chemistry data set showed a
significant difference above the 95% acceptance level (X2=9.85, p=0.01) in trust across
the social motive strength category. A follow up Bonferroini post-hoc test for the non-
parametric Kruskal-Wallis test indicates that the group with social motive strength of
power had significantly different trust scores that the group with social motive strength
Social Motive
Strength (PVQ) N
Median Trust
Score
Mean Trust
Score
Standard
Deviation
Affiliation 14 4.00 3.93 0.90
Achievement 10 3.75 3.63 0.78
Power 12 3.25 3.19 0.59
Social Motive
Strength (PVQ) N
Median Trust
Score
Mean Trust
Score
Standard
Deviation
Affiliation 10 3.88 3.90 0.74
Achievement 6 3.88 3.92 1.03
Power 8 3.75 3.66 0.68

88
of affiliation (p = 0.02). The post-hoc test did not reveal significant differences in the
trust scores between the other groups.
The results of the Kruskal-Wallis test for the English data set were not significant
(X2=0.39, p=0.83). The size of the data set may be an influencing factor in the results of
this test.
4.3.4 Summary of Results for Individual Data
The first research question of this study examines the relationship between an
individual’s social motive value and social motive satisfaction during the project task:
1. Is there an association between social motive strength (PVQ scores) and
social motive satisfaction scores?
The analysis of the data shown in the previous sections indicates that there is no
significant relationship between the social motive strength of individuals and the
satisfaction of their social motives during this online project.
The second research question examined the level of trust an individual may
establish during the project task:
2. Will individual trust scores vary by social motive strength?
The results of the data analysis showed significance for the chemistry group; note that
the chemistry teams had little or no face-to-face interaction. Trust scores for the
individuals from the chemistry group were significantly different across the social
motive strength categories. However, the trust scores for the individuals from the
English group, from the teams that had more face-to-face interaction showed no

89
significant difference in trust across the social motive categories. This may indicate that
trust developed better in the teams that met face-to-face, thus providing little significant
difference. However, it is also interesting to note that the mean trust score of affiliation
motivated individuals was highest for both the English and chemistry data sets, and
about the same. The English mean trust score for affiliation motivated individuals was
3.90 and for chemistry, the mean was 3.93. The second highest mean trust score for
both English and chemistry groups was for achievement individuals, followed by power
individuals. In addition, the mean trust scores for achievement and power individuals
were higher for the English data set than for the individuals in the chemistry data set
(Table 4-10). The same ranking of mean trust scores from high to low for both groups
may indicate that the social motive strength of an individual could determine his or her
level of trust as compared to his or her colleagues in the online environment as it may
in the face-to-face environment.
4.4 Team Data
This section presents the results of the analysis of the data collected for the teams. Sixty
students participated in this study; they formed 20 teams of three students each. The
team data include a social motive strength, which categorizes the team into one of two
groups, more affiliation motivated members or more achievement motivated members.
The other team data include the social motive satisfaction score, which is the average of
the individual team members’ social motive satisfaction scores, interpersonal trust
score, which is the average trust score of the individual team members, and team
performance on the team project as assigned by the instructor.
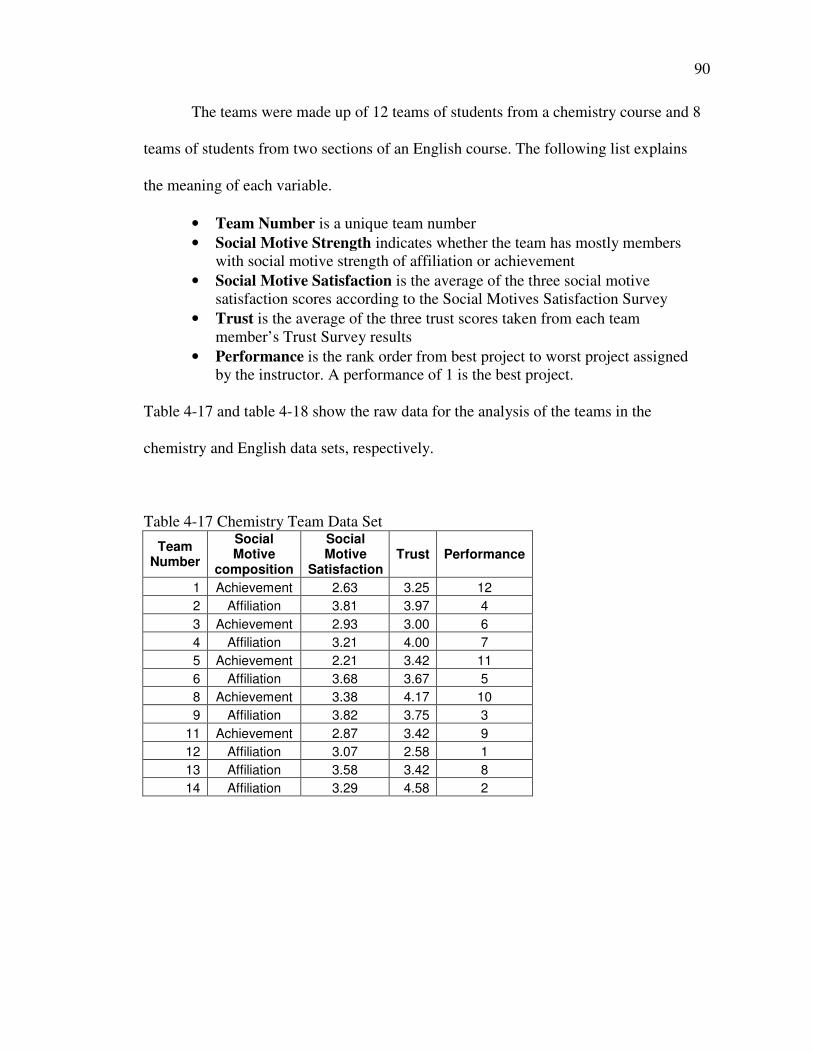
90
The teams were made up of 12 teams of students from a chemistry course and 8
teams of students from two sections of an English course. The following list explains
the meaning of each variable.
• Team Number is a unique team number
• Social Motive Strength indicates whether the team has mostly members
with social motive strength of affiliation or achievement
• Social Motive Satisfaction is the average of the three social motive
satisfaction scores according to the Social Motives Satisfaction Survey
• Trust is the average of the three trust scores taken from each team
member’s Trust Survey results
• Performance is the rank order from best project to worst project assigned
by the instructor. A performance of 1 is the best project.
Table 4-17 and table 4-18 show the raw data for the analysis of the teams in the
chemistry and English data sets, respectively.
Table 4-17 Chemistry Team Data Set
Team Number
Social Motive
composition
Social Motive
Satisfaction Trust Performance
1 Achievement 2.63 3.25 12
2 Affiliation 3.81 3.97 4
3 Achievement 2.93 3.00 6
4 Affiliation 3.21 4.00 7
5 Achievement 2.21 3.42 11
6 Affiliation 3.68 3.67 5
8 Achievement 3.38 4.17 10
9 Affiliation 3.82 3.75 3
11 Achievement 2.87 3.42 9
12 Affiliation 3.07 2.58 1
13 Affiliation 3.58 3.42 8
14 Affiliation 3.29 4.58 2

91
Table 4-18 English Team Data Set
Team Number
Social Motive
composition
Social Motive
Satisfaction Trust Performance
16 Affiliation 3.74 4.08 2
18 Affiliation 4.14 4.00 4
19 Affiliation 2.93 3.83 8
20 Affiliation 3.71 4.00 7
21 Achievement 3.84 3.92 3
22 Affiliation 4.00 3.42 5
23 Achievement 4.01 4.42 6
25 Achievement 3.11 2.92 1
The following research questions were analyzed using the team data:
3. Is there a relationship between team social motive satisfaction and team
performance?
4. Is there a relationship between team social motive satisfaction and team
trust?
5. Is there a relationship between team social motive strength and team
performance?
The analysis of these data showed that there were significant results in the relationship
between team social motive satisfaction and team performance, and in the relationship
between team social motive strength and team performance. The following sections
will present the analysis of these questions using the data shown in Table 4-17 and table
4-18.
4.4.1 Analysis of Team Social Motive Satisfaction and Team Performance
The performance score was a rank assigned by the instructors. The Kendall’s tau rank
correlation is equivalent to the Pearson correlation coefficient test for normally
distributed data. Since the team performance score was based on a ranking, it was

92
treated as ordinal data. Therefore, Kendall’s tau rank correlations were conducted to
assess the association between social motive satisfaction and performance for each data
set.
The Kendall’s tau was statistically significant (X2 = 0.44) above the 95%
acceptance level (p = 0.02), indicative of a significant correlation between social
motive satisfaction and performance in the chemistry class. The same test showed a
non-significant correlation (around the 90% acceptance level) for the English class
(Kendall’s tau = -.357, p=.108). The fewer number of teams tested in the English data
set may have influenced the results.
The next step of this analysis was to determine whether team social motive
satisfaction predicted performance. The data for this study were collected using a
Likert-type survey instrument and therefore is considered non-parametric data. “Theil’s
Incomplete Method” is a linear regression method for non-parametric data (Glaister &
Glaister 2004; Hussain & Sprent, 1983; Theil, 1950). In Theil’s Incomplete Method,
first the slope between all possible pairs of data points is determined. Then the median
value of the calculated slopes determines the trend line.
The data used to perform Theil’s Incomplete Method for the chemistry team’s
data set is shown in Table 4-19. The English team’s data set is shown in Table 4-20.
The independent variable used in this test is social motive satisfaction and the
dependent variable is performance.

93
Table 4-19 Chemistry Teams Data Set - Measured Performance, and Performance
Calculated using Theil’s Incomplete Method
Team
Social Motive
Satisfaction Score
Measured Performance
Non parametric fit performance
5 2.21 11 -2.54
1 2.63 12 -0.65
11 2.87 9 0.43
3 2.93 6 0.70
12 3.07 1 1.33
4 3.21 7 1.96
14 3.29 2 2.32
8 3.38 10 2.72
13 3.58 8 3.62
6 3.68 5 4.07
9 3.82 3 4.70
2 3.87 4 4.93
Table 4-20 English Teams Data Set - Measured Performance, and Performance
Calculated Using Theil’s Incomplete Method
Team
Social Motive
Satisfaction Scores
Measured Performance
Non parametric
fit performance
19 2.93 8 12.36
25 3.11 1 10.60
20 3.71 7 9.94
16 3.74 2 8.61
21 3.84 3 8.48
22 4.00 5 7.38
23 4.01 6 4.15
18 4.14 4 3.40
The result of Theil’s Incomplete Method for the chemistry team’s social motive
satisfaction and performance is shown in Figure 4-3. As shown in the figure, the non-
parametric regression method fits a straight line to the data points that represent the
non-parametric performance.

94
Chemistry Team
Social Motive Satisfaction on Performance
R2 = .33
-4.00
-2.00
0.00
2.00
4.00
6.00
8.00
10.00
12.00
14.00
0 0.5 1 1.5 2 2.5 3 3.5 4 4.5 5
Social Motive Satisfaction Scores
Perform
ance
Figure 4-3 Chemistry Teams - Theil’s Incomplete Method of Regression for Social
Motive Satisfaction on Performance
The solid line in Figure 4-3 represents the fit of the performance scores to the
independent variable social motive satisfaction, using Theil’s Incomplete method. The
result of the non-parametric regression for the chemistry teams’ data set show that there
is a predictive relationship between social motive satisfaction and performance (r2 =
.33). While this is a low score, Cohen (1988) offered guidelines for the interpretation of
a correlation coefficient in social science research. Cohen suggested that a correlation
coefficient between .3 and .5 shows a medium strength relationship as compared to a
weak or strong relationship. Therefore, we can conclude that there is a relationship,
albeit a moderate relationship. The relationship is positive, indicating that as the social
motive satisfaction scores increase, performance increases as well.
The statistically significant correlation between social motive satisfaction and
performance in the English course dataset was below the 95% acceptance level.

95
However, the significance value was around 90% (p = .11) and because the data set was
small a 90% statistical significance could be considered practical significant. Therefore,
a Theil’s Incomplete Method of regression was performed on the English team’s data
set. The results of this test are shown in Figure 4-4.
Social Motive Satisfaction on Performance
y = -1.9x + 10.3
Theil's R2 = .12
0
1
2
3
4
5
6
7
8
9
0 1 2 3 4 5
Social Motive Satisfaction Scores
Perform
ance
Figure 4-4 English Teams - Theil’s Incomplete Method of regression for Social Motive
Satisfaction on Performance
Theil’s Incomplete method produces a slope from which we can create a trend
line; however, according to Cohen (1988) it shows a weak relationship (r2 = .12).
Therefore, it is safe to conclude that the English data set does not show a strong
significant predictive relationship between the social motive satisfaction scores and
performance.

96
4.4.2 Analysis of Team Social Motive Satisfaction and Team Trust
A Kendall’s tau rank correlation was conducted to assess the association between the
team social motive satisfactions. The Kendall’s tau rank correlation for the chemistry
teams was not statistically significant (X2= -.13, p = 0.19) indicating no statistically
significant correlation between the team social motive satisfaction and team trust for
the chemistry teams. In addition, the Kendall’s tau test for correlation for the English
teams was not significant (X2 =
-.07, p = .26).
Because neither correlation showed an acceptable statistical significance at the
95% acceptance level, it was not necessary to run regression tests on these data.
4.4.3 Analysis of Team Social Motive Strength with Performance
One of the goals of these analyses was to determine whether there is a relationship
between team social motive strength and performance. Recall that each team had three
students, two of which had the same social motive strength, either affiliation or
achievement. The third member of the team had social motive strength of power.
Therefore, each team had membership social motive strength of either achievement or
affiliation.
To ascertain whether the performance scores varied significantly with respect to
team social motive strength, the Kruskal-Wallis analysis of ranks was conducted. The
Kruskal-Wallis test is a nonparametric test equivalent to the ANOVA method for
testing differences between independent groups. The independent variables for this test
were the two groups, the affiliation strength teams and the achievement strength teams.

97
The Kruskal-Wallis test analyzed whether there was a difference in performance
between the two groups.
The Kruskal-Wallis test for the chemistry teams showed a statistically
significant difference above the 95% acceptance level (X2=6.336, p=0.012) between the
affiliation strength and the achievement strength teams. In the chemistry class, the
mean rank of the teams composed mostly of affiliation strength members was 4.20. The
mean rank for teams composed mostly of achievement strength members was 9.60.
Since low scores represent better performance, this means that the teams composed
mostly of affiliation strength individuals out-performed the teams composed mostly of
achievement strength individuals.
The Kruskal-Wallis test for the English teams was not significant (X2=1.09,
p=0.30). Again, the low number of data sets in the test may have affected the results.
4.5 Summary
Table 4-21 summarizes the results of the statistical tests performed on the two data sets
included in this research study.

98
Table 4-21 Summary of Statistical Tests
Individual Data Analysis
Ind
ep
en
den
t V
ari
ab
le
Dep
en
den
t V
ari
ab
le
Sta
tisti
cal
Test
Ch
em
istr
y D
ata
Set
- S
ign
ific
an
ce L
evel
En
gli
sh
Data
Set
- S
ign
ific
an
t L
evel
Social Motive Strength Score
Social Motive Satisfaction Score
Kendall’s tau
Correlation 30% 43%
Social Motive Strength Category
Affiliation Social motive Satisfaction Score
Kruskal-Wallis
(ANOVA) 28% 53%
Social Motive Strength Category
Achievement Social motive Satisfaction Score
Kruskal-Wallis
(ANOVA) 38% 82%
Social Motive Strength Category
Power Social motive Satisfaction Score
Kruskal-Wallis
(ANOVA) 32% 34%
Social Motive Strength Category Trust Score
Kruskal-Wallis
(ANOVA) 99% 82%
Team Data Analysis
Team Social Motive Satisfaction
Team Performance
Kendall’s tau
Correlation 98% 89%
Team Social Motive Satisfaction
Team Performance
Theil’s Incomplete Method of
Regression r2 = .33 r
2 = .12
Team Social motive Satisfaction Team Trust
Kendall’s tau
Correlation 81% 74%
Team Social Motive Strength
Team Performance
Kruskal –Wallis
(ANOVA) 99% 70%
99
The purpose of the first research question was to examine the relationship
between an individual’s social motive strength and social motive satisfaction during the
project task. As shown in Table 4-21, a Kendall’s tau correlation showed there was no
significant correlation between individual social motive strength scores and individual
social motive satisfaction scores in either the English or the chemistry data sets. In
addition, a non-parametric Kruskal-Wallis test showed no significant difference
between the individual social motive strength scores and the individual social motive
satisfaction scores when the data were grouped by social motive strength category.
Therefore, we cannot conclude from this data analysis that there is a relationship
between an individual’s social motive strength and his or her satisfaction with social
motive during the project task.
The second research question examined the possibility that social motive
strength may indicate the level of trust an individual may establish during the project
task. This question was tested using the nonparametric Kruskal-Wallis test for
difference between groups. The results indicate that the English data set did not show a
significant difference in trust between the three social motive strength categories. The
results from the chemistry data set, however, did show a significant difference in trust
levels between different social motive strength categories. It is interesting to note that
the chemistry data set was “more virtual” than the English data set in that they had little
or no contact outside the asynchronous discussion board. This may indicate that the
effects of social motive strength do play a role in the virtual or online environment
more than in the face-to-face environment.

100
The third and fourth research question examined the influence of social motive
satisfaction on team performance and team trust. The data analysis of these research
questions showed a significant correlation between team social motive satisfaction and
team performance in the chemistry data set, but did not show a significant correlation
for the English data set. A Theil’s incomplete method of regression showed a moderate
predictive relationship between social motive satisfaction and performance for the
chemistry data set. This result is promising; perhaps with a larger data set the predictive
relationship may be stronger.
The data analysis for both the English and chemistry groups showed no
significant relationship between team social motive satisfaction and team trust. This
indicates that team social motive satisfaction did not influence team trust for these data
sets.
The fifth research question compared the teams with majority social motive
strength of affiliation to the teams with majority social motive strength of achievement
to see if the teams differ in performance according to social motive strength. This
research question was tested using the nonparametric Kruskal-Wallis test and showed
that the performance of the teams in the chemistry data set varied significantly
according to social motive strength. The English data sets did not show a significant
difference between team formations, but the small data set may have caused lower
results. Therefore, we can conclude that for the chemistry teams, team performance
differed significantly between teams with differing social motive strength. In fact, the
teams with more affiliation motivated members performed better.

101
The results for the chemistry data set indicate that social motive satisfaction is
significantly correlated with team performance and that social motive strength is also
significantly related to performance. These results may indicate that the affiliation
motivated individuals are motivated to perform in the online environment and are good
candidates to work in the online team environment. This finding conflicts with
assumptions made by previous research (Rad & Levin, 2003) that affiliation motivated
individuals would not be good candidates for online work.

102
5 Discussion
5.1 Discussion of Results
The purpose of this research was to examine the effects of social motives on trust and
performance of team members working in an online asynchronous discussion
environment. The instructors for the courses included in this experiment were carefully
selected for their willingness to participate and adhere to the guidelines of the study.
One important guideline for this study was for students to interact only online during
the team project. However, at the end of the study the self-report communications
survey indicated that more face-to-face interaction took place during the study than
expected. The student teams included in this study were part of a blended course and,
since humans are social beings, it was entirely natural for some face-to-face discussion
to take place when the class met in person. Therefore, rather than call the teams virtual
teams the teams in this study are semi-virtual teams, because while they did work
online in the “virtual” environment, they may have had some face-to-face meetings. It
was difficult to determine just how many face-to-face meetings occurred during the
online project. However, the responses on the communications survey indicated that the
chemistry teams either rarely or never interacted face-to-face during the project while
some of the English teams had frequently interacted face-to-face. The data sets for the
two groups, English and chemistry, were analyzed as separate data sets.
The first research question examined the relationship between an individual’s
social motive strength and social motive satisfaction to determine if the student was
satisfied with his or her social motivation during the project task.

103
1. Is there an association between social motive strength (PVQ scores) and
social motive satisfaction scores?
As suggested by previous research (Balthazard, Potter & Warren, 2004) features
in groupware technology can contribute to social motives satisfaction. The students in
this study worked in the ANGEL environment, and team members communicated via
the message board, all members of the team could follow the discussion and the
progress of project objectives. Message board features of time stamping and outlined
organization of the threaded discussion on the asynchronous discussion board provided
a built-in feedback mechanism that should have satisfied the achievement oriented
individual’s need to stay on task (Balthazard et al., 2004).
The results of the statistical analysis in Chapter 4 showed there was no
significant correlation between individual social motive strength scores and individual
social motive satisfaction scores in either the English or the chemistry data sets.
Therefore, we cannot conclude from this research that there is a relationship between an
individual’s social motive value and his or her satisfaction with social motive during
the project task. This may not mean, however, that the students were not satisfied with
their social motivations during the project task. It is possible that the method used to
measure social motive satisfaction is not adequate. Perhaps a qualitative study
including student interviews and open-ended survey questions may yield different
results.
The purpose of the second research question was to find out if social motive
strength affects individual trust:
2. Will individual trust scores vary by social motive strength?
104
The results for this research question indicate that the English data set did not
show a significant difference in trust between the three social motive strength
categories. The results from the chemistry data set, however, did show a significant
difference in trust levels between different social motive strength categories. The post-
hoc test showed that trust was significantly different between the power strength and
affiliation strength individuals, but did not show a significant result for power and
achievement or achievement and affiliation strength. However, the data collected from
this study provide evidence that both the English and the chemistry teams with a higher
level of social motive satisfaction showed a higher level of trust. The computer-
mediated communication literature suggests that it is difficult to attain trust in a virtual
team, if there is no opportunity for face-to-face interaction or pre-task online
interactions to get-acquainted (Rocco, 1998; Zolin, Hinds, Fruchter, & Levitt, 2004).
Research on face-to-face teams versus virtual teams has shown that participants in
online discussions become more attentive and participative during the asynchronous
discussion. In addition, they are also more participative when they return to in-class
discussions (Alavi, 1994; Hightower & Sayeed, 1996). Trust is an important component
of team cohesiveness, which in turn helps the team collaborate and improve its
performance (Alexander, 2002; McKnight et al., 1998). The asynchronous nature of a
message board discussion may help the student participate in a discussion with his or
her peers by giving them the opportunity to interject their opinions without interrupting
someone else or vying for class time. These observations have been reported in
research on online education (Alavi, 1994; Graham, & Misanchuk, 2004; Lajoie, 2000).

105
LeRouge, Blanton and Kittner (2002) studied students to determine their
preferred mode of communication and found that the student teams that planned to
meet face-to-face and online tended to “hold off” on trust until after the face-to-face
meeting. The study found that the teams that did not plan to meet face-to-face
developed trust more quickly, and maintained their trust throughout the project. Perhaps
the English data set held off on trust until face-to-face meetings, and the chemistry data
set did not hold off on trust because they did not plan to meet face-to-face.
The third and fourth research questions examined the influence of social motive
satisfaction on team trust and team performance:
3. Is there a relationship between team social motive satisfaction and team
performance?
4. Is there a relationship between team social motive satisfaction and team
trust?
The data analysis of these research questions showed a significant correlation between
team social motive satisfaction and team performance in the chemistry data set, but did
not show a significant correlation for the English data set. Although the statistical test
results for the chemistry data set showed only a moderate predictive relationship, it
suggests that using social motives to form teams that work primarily online may benefit
team performance. Perhaps with a larger data set the predictive relationship may be
stronger.
The data analysis for both the English and chemistry groups showed no
significant relationship between team social motive satisfaction and team trust.
Research on social motive satisfaction in the work place performed by Harrell and Stahl

106
(1988) included longitudinal studies that follow a worker for several years. Perhaps a
qualitative study including in-depth interviews of the students, and a study of the
students’ online transcripts of their communications during the project would provide
more insight.
The fifth research question studied team social motive strength to see if the
teams differed in performance according to social motive strengths.
5. Is there a relationship between team social motive strength and team
performance?
The results once again showed that the performance of the teams in the
chemistry data set varied significantly according to social motive strength. The English
data sets did not show a significant difference between team formations. Perhaps the
small data set may have affected the results of the English data set. However, we can
conclude that for the chemistry data set, team performance differed significantly
between teams with differing social motive strength.
Rad and Levin (2003) suggested that achievement motivated individuals would
be more satisfied in virtual teams than would affiliation motivated individuals. Building
on their work, the researcher expected that teams with achievement oriented members
would show higher performance. This study showed that for the chemistry data set,
there was a significant difference between performance of teams with affiliation
motivated members and teams with achievement motivated members. However, it must
be noted that the teams with more affiliation motivated members performed better
overall than the teams with more achievement motivated individuals. Rad and Levin
(2003) predicted that the affiliation motivated individuals would not perform well while
working in an online environment because of the lack of social contact. Rad and Levin

107
(2003) also argued that the individuals chosen for a virtual team based on social
motivation must be given specific tasks to be satisfied with their needs. In this study,
the power individuals were assigned the position of team leader. The online platform
provided recognition of the leader by placing the leader’s name first in the team roster.
In addition, the project required the leaders to contact the other members for an initial
meeting online. Therefore, other team members knew who the leader was before the
project work began. The leaders also set up the discussion boards, communicated to the
instructor, and posted the deliverables in the drop boxes. The achievement and
affiliation motivated members of the team were not given specific tasks related to their
motivational needs because the research was designed not to interfere too much in the
instructors’ project design. However, assigning specific tasks appropriate to
achievement and affiliation motivated members might have been beneficial, as well. A
larger study to examine the relationship of performance on teams with members that
hold a variety of different social motivations, and are given specific tasks according to
their social strengths, could provide a better understanding of this issue.
To summarize the team analyses, the results indicate that there was a significant
correlation between social motives satisfaction and performance and between team
composition and performance. This result, however, was only significant for the
chemistry data set. The results give some encouraging early evidence about social
motives and work performance in the online environment. It also inspires reasoning
about possible variables that might mediate the relationship of social motives
satisfaction and performance. For example, the satisfaction of social motives might help
to create online teams that work quickly and stay on task. Also, the satisfaction of
108
social motives might make members more aware of their role in the project, and this
might lead to reduced friction among team members. The role of mediating variables is
likely to be important in further research on social motives satisfaction and
performance in the online environment.
The online team project that requires students to collaborate to solve complex
problems without the constraints of time and space is becoming the focus of blended
courses. Educators recognize semi-virtual team activity as an opportunity to enhance
learning in undergraduate courses (Graham, 2006). McClelland’s study of motivational
needs (1961) showed that the three motivations of power, achievement, and affiliation
inform the social dynamics between individuals working in face-to-face groups. The
results of this study suggest that team formation by social motivational needs may have
an effect on performance, in online teams. On the other hand, perhaps face-to-face
interaction is more complex and adds factors to the relationship between team members
that these research questions did not address. The most positive result of this study is
that social motives may influence teams working online. Further research should be
conducted to help students understand their own social motives and those of their
teammates, so that they may become more productive team members in the online
environment.
5.2 Limitations
Although the data analysis for this study showed positive results for some of the
research questions, there are significant limitations to the study. The research was
quasi-experimental; it was not a controlled experiment. The study took place in a

109
naturalistic setting in order to promote realism and generalizability. Indeed, in the
education research community most classroom studies are quasi-experimental for these
very reasons. However, the impact of the naturalistic approach in this study was that the
researcher did not have the ability to control events to the extent that one might have
liked.
A limitation of this study that must be acknowledged is the difference between
the chemistry and English data sets. The differences between the courses may have
affected the results within the data sets. First, the English course was taught in a
classroom suitable for approximately 30 students and the chemistry course was taught
in a large group room, stadium seating, with a 250-person capacity. Second, the focus
of both projects was to research a human caused problem. However, the English class
studied genocide and the chemistry course studied atmospheric pollutants. Third, a
female teacher taught the English course and a male teacher taught the chemistry
course. The student populations in both courses were similar; there was a mix of male
and female students, non-majors, taking the course for liberal studies credit. The
English course project had an additional requirement at the end of the online
assignment; each team presented their conclusions in class.
In addition to the differences in the courses participating in this study, the
communications survey administered at the end of the project revealed that the majority
of the students from the chemistry course rarely or never talked about the project to one
another face-to-face, while the majority of the English students reporting having some
face-to-face contact. It is difficult to ascertain what effect this face-to-face contact had
on the results, but the results for the two data sets were very different. Recall that the
110
research questions applied to the English data set showed no significant results and the
chemistry data set showed several significant results. The differences in the course as
discussed in the previous paragraph combined with the variation of face-to-face
communication reported in the communications survey may have affected the divergent
results.
The students included in this study attended one college campus, and therefore
the subject pool may not be as diverse as it could have been, if the study had taken
place over several different college campuses of varying size and location.
Additionally, while college students are often considered a readily accessible subject
pool, using students in research is a complicated issue. In a longitudinal study, such as
this one, there is the problem of loss of participants because of their failure to attend
class on the key days of data collection. Unfortunately, in this study the loss of data of
one member of a team eliminated the entire team from the analysis. More control of the
teams, and larger numbers of teams may help to produce results that are more
definitive.

111
6 Conclusion and Recommendations
6.1 Conclusion
This study separated the two courses, English and chemistry into two data sets, which
led to the study of two very different data sets, as described in the previous chapter. The
results from the two data sets were also very different. One data set, chemistry, showed
significant results that indicate social motives may help to create teams that perform
well and trust each other as they work in the online environment. The other data set,
English, did not report significant results. There has been a steady flow of comments
from researchers that the online environment is not as “good” (for lack of a better word)
as the face-to-face environment. Although this research set out to study teams that
worked exclusively online, the naturalistic setting of the experiment did not allow full
control over students’ interactions.
6.2 Recommendations for Researchers
A review of the current research shows that few empirical studies on the subject of
social motives and teamwork have taken place. Most of the studies on social motives
are anecdotal and describe specific work situations, and do not have results from
experimental studies. This exploratory study has provided some insight into the
relationships of social motive strength, team trust, and performance. This research
studied student teams working semi-virtually to complete projects that were
components of undergraduate blended courses on one college campus. The results
indicated that in the chemistry teams, team social motive strength varied significantly

112
with performance, individual trust varied significantly with social motive satisfaction,
and team social motive satisfaction varied significantly with performance. Replicating
this study in more sections of the same course taught by the same instructor would
provide a larger data set in terms of more teams. In addition, a more researcher-
controlled study could also help to make conclusions that are more definitive in nature.
In addition, a variety of data from other types of blended courses, such as graduate or
international courses, may provide further insight into the results.
Further research on the social motivations of power, achievement and affiliation
of individuals in virtual teams could help us understand the broader impact of these
motivations on trust and performance. A study that examines specific ways to increase
the satisfaction of motivational needs could inform both research on the curricular
design for online projects in blended courses and the design of groupware technology.
6.3 Implications for Practitioners
The social motives of power, achievement, and affiliation continue to help form face-
to-face teams, employee selection, and the placement of employees in departments
within organizations (HayGroup, 2003). This study provides an examination of social
motive needs in the educational semi-virtual environment and helps us to understand
how social motives in semi-virtual teams might encourage higher trust and better
performance. Indeed, the outcome of this study shows some partial evidence that team
member selection using social motives might help create effective online teams. If
further research substantiates the value of social motives in online project team
formation, it may become a useful tool for educational institutions.

113
The results of this exploratory study is in line with current research that suggests
practitioners not concentrate exclusively on the technology tools available, but rather
on the project specifications and the formation of the teams (Graham, 2006; Powell et
al., 2004). Today, social motivations are not widely considered when forming teams of
people that will work in an online educational setting, but perhaps they should be. The
instructors in this study were surprised about the choice of some of the team leaders
(i.e., the power motivated individuals), who emerged via the PVQ survey. The
instructors mentioned that they would not have suspected those students to score high
in the power social motive and thus would not have assigned some of these individuals
to be team leader. Perhaps in a classroom setting affiliation motivated individuals are
mistaken for power motivated individuals because they speak up in class, whereas the
true power motivated individual may not feel a need to interact in class.
A future research study that uses a refined PVQ instrument that focuses on a
college student’s social motive strength may help improve the results. In addition,
qualitative data gathering techniques including interviews and the study of student
transactions may help to improve the measurement of social motive satisfaction. A
study that helps to create an online instrument to develop semi-virtual and virtual teams
using social motive strength would help to streamline team formation. This may help
students understand their own social motivations and encourage better performance and
trust by becoming a member of a team specifically designed to work well together.
114
List of References
Alavi, M. (1994). Computer-Mediated Collaborative Learning: An empirical
evaluation. MIS Quarterly, 18(2), 159-175.
Alexander, P.M. (2002). Teamwork, Time, Trust and Information. Proceedings of
SAICSIT 2002. Port Elizabeth, South Africa.
Aronow, E., Weiss, D. A., & Rezinokoff, M. (2001). A practical guide to the thematic
apperception test. Philadelphia: Brunner-Routledge.
Baldwin, M.W. (1992). Relational schemas and the processing of social information.
Psychological Bulletin, 112, 461-484.
Balthazard, P., Potter, R. E., & Warren, J. (2004). Expertise, extraversion and group
interaction styles as performance indicators in virtual teams: how do perceptions
of IT's performance get formed? SIGMIS Database, 35(1).
Barnatt, C. (1995). Office Space, Cyberspace and Virtual Organization. Journal of
General Management, 20(4), 78-91.
Benson, L. T. (1997). Information Technology and the Liberal Arts College. The
Technology Source. Retrieved October 17, 2008, from
http://technologysource.org/article/information_technology_and_the_liberal_art
s_college/
Bonk, C.J., Kim K. & Zeng T. (2006). Future Directions of blended Learning in Higher
Education and Workplace Learning Settings. Handbook of blended learning:
Global Perspectives, local designs. San Francisco, CA: Pfeiffer Publishing.
Bos, N., Olson, J., Gergle, D., Olson, G., & Wright, Z. (2002). Effects of four
computer-mediated communications channels on trust development.
Proceedings of the SIGCHI Conference on Human Factors in Computing
Systems: Changing Our World, Changing Ourselves. Minneapolis, MN.
Bos, N., Gergle, D., Olson, J. S., & Olson, G. M. (2001). Being there versus seeing
there: trust via video. CHI '01 Extended Abstracts on Human Factors in
Computing Systems. Seattle, WA.
Cappola, N. W, Hiltz, S. R, & Rotter, N. (2001). Building trust in virtual teams.
Proceedings of IEEE Professional Communication Society 2001 International
Professional Communication Conference. Santa Fe, NM.

115
Carroll, J. M., Neale, D. C., Isenhour, P. L., Rosson, M. B. & McCrickard, D. S.
(2003). Notification and awareness: synchronizing task-oriented collaborative
activity. International Journal of Human-Computer Studies, 58(5), 605-632.
Clear, T. & Kassabova, D. (.2005). Motivational patterns in virtual team collaboration.
Australasian Computing Education Conference 2005, Newcastle, Australia.
Cooper, L. W. (2001). A comparison of online and traditional computer applications
classes. THE Journal, 28(8), 52-55.
Corritore, C., Kracher, B., & Wiedenbeck, S. (2003). On-line trust: concepts, evolving
themes, a model. International Journal of Human Computer Studies, 58(6),
737-758.
D’Eredita, M. A., & Chau, C. (2005). Coaching from Afar: How Ubiquitous
Information Technology Was Used to Develop a Successful Semi-Virtual
Team. Electronic Journal of Knowledge Management, 3(2) 65-74.
Falcone, R. & Castelfranchi, C. (2001). The socio-cognitive dynamics of trust: does
trust create trust? Trust in Cyber-societies (55-72). LNAI 2246. Springer.
Feng, J., Lazar, J., & Preece, J. (2004). Interpersonal Trust and Empathy Online.
Behaviour and Information Technology, 23(2), 97-106.
Freedman K. (1997). Visual Art/Virtual Art: Teaching technology for meaning
Art Education, 50(4), 6-12.
Fisher, R.A. (1970). Statistical Methods for Research Workers (14th
ed.) Edinburgh:
Oliver and Boyd.
Gambetta, D. (1988). Trust: Making and breaking cooperative relations. New York:
Blackwell.
Gillespie, A. (1993). Telematics and its implications for industrial and spatial
organization. Regional Development Dialogue, (14) 139-150.
Graham, C. A. (2006). Blended learning systems: Definition, current trends and future
directions. In C. J. Bonk & C. R. Graham (Eds.), The handbook of blended
learning: Global perspectives, local designs (pp. 3-21). San Francisco: Pfeiffer.
Graham, C. R., & Misanchuk, M. (2004). Computer-mediated learning groups: benefits
and challenges to using groupwork in online learning environments. Online
collaborative learning theory and practice (pp. 160-180). Hershey, PA:
Information Science Publishing.

116
Guzdial, M., Hmelo, C., Hubscher, R., Nagel, K., Newstetter, W., Puntambeaker, S.,
Shabo, A., Turns, J., & Kolodner, J.L. (1997). Integrating and Guiding
Collaboration: Lessons Learned in Computer-Supported Collaborative Learning
Research at Georgia Tech. Proceedings in CSCL 199.Toronto, Ontario.
Handy, C. (1995). Trust and the virtual organization. Harvard Business Review, 73(3),
40-50.
Harrell, A. M., & Stahl, M. J. (1984). McClelland's trichotomy of needs theory and the
job satisfaction and work performance of CPA firm professionals. Accounting,
Organizations and Society, 9(3-4), 241-252.
HayGroup. (1993). Personal Values Questionnaire. Hay Resources Direct. 116
Huntington Avenue, Boston, MA.
Hightower, R. T., & Sayeed, L. (1996). Effects of communication mode and pre-
discussion information distribution characteristics on information exchange
groups. Information Systems Research, 7(4), 451-465.
Hillocks, G. (1999). Ways of Thinking/Ways of Teaching. New York: Teachers
College Press.
Hung, C. Y-T., Dennis, A. R., & Robert, L. (2004). Trust in Virtual Teams: Towards an
Integrative Model of Trust Formation. Proceedings of the 37th
Hawaii
International Conference on System Sciences (HICSS'04). Waikoloa, HI.
Iacono, S. C. & Weisband S. (1997). Developing Trust in Virtual Teams. Proceedings
of the 30th
Hawaii International Conference on System Sciences. Honolulu, HI.
Jarvenpaa, S. L., & Ives, B. (1994). The global network organization of the future:
Information management opportunities and challenges. Journal of Management
Information Systems, 10(4), 25-57.
Jarvenpaa, S. L., L., Knoll, K., & Leidner, D. E. (1998). Is anybody out there?
Antecedents of trust in global virtual teams. Journal of Management
Information System, 14(4), 29-64.
Jarvenpaa, S. L., & Leidner, D. E. (1998). Communication and trust in global virtual
teams. Journal of Computer-Mediated Communication, 3(4). Retrieved
December 10, 2004 from http://jcmc.huji.ac.il/vol3/issue4/jarvenpaa.html
Johansen, D., Sibbet, D., Benson, S., Martin, A., Mittman, R., & Saffo, P. (1993).
Leading business teams: How teams can use technology and group process tools
to enhance performance. Journal of Organizational Behavior, 14(3), 291-292.

117
Kelly, G. & Bostrom, R. (1995). Facilitating the socio-emotional dimensions in group
support systems. Proceedings of the ACM SIGCPR 1995 Conference. Nashville,
TN.
Kim, Jae-On & Mueller, C. W. (1978). Factor analysis: Statistical methods and
practical issues. Quantitative Applications in the Social Sciences Series.
Thousand Oaks, CA: Sage Publications.
Kreijns, K., Kirschner, P. A. & Jochems, W. (2003). Identifying the pitfalls for social
interaction in computer-supported collaborative learning environments: a review
of the research. Computers in Human Behavior, 19(3), 335-353.
LaRouge, C., Blanton, E., & Kittner, M. (2002). The other semi-virtual team: Using
collaborative technologies to facilitate team projects. Proceedings of the 17th
Annual conference of the International Academy for Information Management.
Barcelona, Spain.
Lewis, J. D. & Weigert, A. (1985). Trust as a Social Reality. Social Forces. (pp. 967-
985). Chapel Hill, NC: University of North Carolina Press.
Luhmann, N. (1991). What is Communication? Communication Theory, 2, 251-259.
Lajoie, S. P. (2000) Computers as cognitive tools: No more walls (Vol. 2). Mahwah,
NJ: Lawrence Earlbaum Associates, Publishers.
Larsen, K. R. T, & McInerney, C. R. (2001). Preparing to work in the virtual
organization. Information and Management, (39), 445-456.
Lipnack, J., & Stamps, J. (1997). Virtual teams: Reaching across space, time, and
organization with technology. New York, NY: John Wiley.
MacCallum, R.C., Widaman, K.F., Zhang, S., & Hong, S. (1999). Sample size in factor
analysis. Psychological Methods, (4), 84-99.
Majchrzak, A., Rice, R.E., Malhotra, A., King, N. & Ba, S. (2000). Technology
adaptation: The case of a computer-supported inter-organizational virtual team.
MIS Quarterly, 24(4), 569-600.
Malhorta, D. (2003). Trust and reciprocity decisions: The differing perspectives of
trustors and trusted parties. Organizational Behavior and Human Decision
Processes, 94(2), 61-73.
Mark, G. (1998). Building virtual teams: Perspectives on communication, flexibility
and trust. SIGGROUP Bulletin, 19(3), 38-41.

118
Mayer, R. C., Davis J.H., & Schoorman F. D. (1995). An integrative model of
organizational trust. The Academy of Management Review, 20(3), 709-734.
McClelland, D. C. (1961). The Achieving Society. New York, NY: Van Nostrand
Reinhold.
McClelland, D. C. (1975). Power: The inner experience. New York, NY: Irvington.
McClelland, D. C. (1988). Human motivation. Cambridge, MA: Cambridge University
Press.
McClelland, D. C., & Burnham, D. H. (1976). Power is the great motivator. Harvard
Business Review, 54(2), 100-110.
McClelland, D. C., & Pilon, D. A. (1983). Sources of adult motives in patterns of
parent behavior in early childhood. Journal of Personality and Social
Psychology, 44(3), 564-574.
McGowan, W. G. (1991). Preface: How IT reshapes organizations. In Revolution in
real time: Managing information technology in the 1990’s. Boston, MA:
Harvard Business School Press.
McGreal, R. (2004). Learning objects: A practical definition. Retrieved September 5,
2005 from http://www.itdl.org/Journal/Sep_04/article02.htm
McKnight, D. H., Cummings, L. L. & Chervany, N. L. (1998), Initial trust formation in
new organizational relationships. Academy of Management Review, 23(3), 473-
490.
McMillan, D. W., & Chavis, D. M. (1986). Sense of community: A definition and
theory. Journal of Community Psychology, 14(1), 6-23.
Meyerson, D., Weick K. E., & Kramer, R. M. (1996). Swift trust and temporary groups.
In Kramer, R. M., & Tyler, T. R. (Eds), Trust in Organizations: Frontiers of
Theory and Research, (pp.166-195). London, England: Sage Publications.
Michaelsen, L. K., Knight, A. B., & Fink, L. D. (2002). Team-based learning: a
transformative use of small groups in college teaching. Sterling, VA: Stylus
Publishing.
Morgan, C. D., & Murray, H. A. (1935). A method for investigating fantasies: The
Thematic Apperception Test. Archives of Neurology and Psychiatry, 34, 298-
306.

119
Nash, S. S. (2005). Learning objects, learning object repositories, and learning theory:
Preliminary best practices for online courses. Interdisciplinary Journal of
Knowledge and Learning Objects, 1, 217-228.
Norman, G. R., & Streiner, D. L. (1986). PDQ Statistics. Toronto: Ontario, Canada: BC
Decker.
Nunnally, J. C. (1978). Psychometric theory (2nd
ed.). New York: McGraw-Hill.
Osborne, J. W. & Costello A. B. (2004). Sample size and subject to item ratio in
principal components analysis. Practical Assessment, Research & Evaluation,
9(11). Retrieved November 2, 2006 from http://PAREonline.net
Park, Jung-ran. (2007). Interpersonal and Affective Communication in Synchronous
Online Discourse. Library Quarterly, 77(2), 133-155.
Park, Jung-ran. (2008). Solidarity and Rapport in Social Interaction through Computer
Mediated Communication Channel. In Sigrid Kelsey (ed.) Handbook of
Research on Computer Mediated Communication. Idea Group Reference-IGI-
Global.
Pampel, F. C. (2000). Logistic Regression: A Primer. Thousand Oaks, CA: Sage
Publications.
Paré, G. & Dubé, L. (1994). Virtual teams: An exploratory study of key challenges and
strategies. Proceedings of the 20th international Conference on information
Systems. Charlotte, NC.
Pearce, J. L., Sommer, S. M., Morris, A., & Frideger, M. (1992). A configurational
approach to interpersonal relations: Profiles of workplace social relations and
task interdependence. Graduate School of Management, University of
California, Irvine.
Penn State University. (2007). Building Blocks for Teams. Retrieved on September 15,
2007 from http://tlt.its.psu.edu/suggestions/teams/manage/virtualteam.html
Powell, A., Piccoli, G., & Ives, B. (2004). Virtual teams: A review of current literature
and directions for future research. The Database for Advances in Information
Systems, 35(1), 6-36.
Rad, P. F. & Levin, G. (2003). Achieving project management success using virtual
teams. Boco Raton, FL: J. Ross Publishing, Inc.
Riker, W.H. (1971). The nature of trust. In Tedeschi, J.T. (Ed.) Perspectives on Social
Power (pp. 63-81). Chicago, IL: Aldine Publishing Company.

120
Rivera, J.C., & Rice, M.L. (2002). A comparison of student outcomes & satisfaction
between traditional & web based course offerings. Online Journal of Distance
Learning Administration, 5(3).
Roach, R. (2003). Survey says online learning equal to classroom instruction. Black
Issues in Higher Education, 20(16), 44.
Robey, D., Koo, H. M., & Powers, C. (2000). Situated learning in cross-functional
virtual teams. Technical Communication, 47(1), 51-66.
Rocco, E. (1998). Trust breaks down in electronic contexts but can be repaired by some
initial face-to-face contact. Proceedings of the SIGCHI conference on Human
Factors in Computing Systems. Los Angeles, CA.
Rogoff, B., Matusov, B., & White, S. (1996). Models of teaching and learning:
Participation in a community of learners. In D. Olson & N. Torrance (Eds.), The
Handbook of Cognition and Human Development (pp. 388-414). Oxford, UK:
Blackwell.
Rovai, A. P. (2002). Development of an instrument to measure classroom community.
Internet and Higher Education, 5(3), 197 – 211.
Rovai, A. P., & Jordan, H. M. (2004). Blended Learning and sense of community: A
comparative analysis with traditional and fully online graduate courses. The
International Review of Research in Open and Distance Learning, 5(2).
Sarker, S., Valacich, J. S., & Sarker, S. (2003). Virtual team trust: Instrument
development and validation in an IS educational environment. Information
Resources Management Journal, 16(2), 35-55.
Sarker, S., Lau, F., & Sahay, S. (2001). Using an adapted grounded theory approach for
inductive theory building about virtual team development. Database for
Advances in Information Systems, 32(1), 38-56.
Shapiro, S. P. (1987). The social control of impersonal trust. The American Journal of
Sociology, 93(3), 623-658.
Sharpe, R., Benfield, G., Roberts, G., & Richard, F. (2006). The undergraduate
experience of blended e-learning: a review of UK literature and practice. The
Higher Education Academy.
Sikkel, K., Gommer, L. & van der Veen, J. (2002). Using shared workspaces in higher
education. Innovations in Education and Teaching International, 39 (1), 26-45.

121
Smith, M. K. (2005). Bruce W. Tuckman – Forming, storming, norming, and
performing in groups. The encyclopedia of informal education. Retrieved on
January 25, 2005 from www.infed.org/thinkers/tuckman.htm
Smits, S. J., McLean, E. R., & Tanner, J. R. (1993). Managing high-achieving
information systems professionals. Journal of. Management. Information
Systems, 9(4), 103-120.
Sproull, L., & S. Kiesler. (1986).Reducing social context cues: Electronic mail in
organizational communication. Management Science, 32(1) 1492-1512.
SPSS Inc. (1999). SPSS Base 10.0 for Windows User's Guide. SPSS Inc., Chicago IL.
Suthers, D. D., Hundhausen, C. D. & Girardeau, L. E. (2003). Comparing the roles of
representations in face-to-face and online computer supported collaborative
learning, Computers and Education, 41(4), 35-351.
Stahl, G. (2006). Virtual Math Teams project: An overview of VMT. Retrieved from:
http://www.mathforum.org/vmt/TheVMTProject.pdf
Stahl, G. (2008). Human-human interaction and group learning. Paper presented at the
Human-Computer Interaction Consortium, Frasier, CO. Retrieved from
http://www.cis.drexel.edu/faculty/gerry/pub/hcic2008.pdf.
Symons, F. (1997). Virtual departments, power, and location in different organizational
settings. Economic Geography, 73(4), 427.
Tabachnick, B. G., & Fidell, L. S. (2001). Using Multivariage Statistics. Boston: Allyn
and Bacon.
Tapscott, D. (1993). Paradigm shift. Paper prepared for High Tech High Stakes:
Canada’s Telecommunications Future Conference. Ottawa-Carleton Economic
and Development Corp. (OCEDCO) and Bell Canada, Ottawa.
Taradi, S. K., Taradi, M., Radic, K. & Pokrajac, N. (2005). Blended problem-based
learning with web technology positively impacts student learning in acid-base
physiology. Advances in Physiology Education, 29, 35-39.
Thurstone, L. L. (1947). Multiple Factor Analysis. Chicago, IL: University of Chicago
Press.
Tuckman, Bruce. (1965). Developmental sequence in small groups. Psychological
bulletin, 63, 384-399.
Uhlig, G. E. (2002). The present and future of distance learning. Education, 122(4),
670- 673.

122
Ury, G. (2004). A comparison of undergraduate student performance in online and
traditional courses. Journal of Computing Sciences in Colleges,19(4), 99-107.
Vogel, D., Jarvenpaa, S., & Chudoba, K. 2000. Fundamental concepts and approaches
for investigating virtual teamwork (panel session). International Conference on
Information Systems. Atlanta, GA.
Vygotsky, L. S. (1978). Mind in society: The development of higher psychological
processes. Cambridge, MA: Harvard University Press.
Vygotsky, L. (1934/1986). Thought and Language. (A. Kozulin, Ed. and Trans.)
Cambridge, MA: Harvard University Press.
Vygotsky, L. (1956). Selected psychological investigations. Moscow: Izdstel’sto
Pedagogical Academy. Nauk: SSR.
Walther, J. B. (1992). Interpersonal effects in computer-mediated interaction: A
relational perspective. Communication Research, 19(1), 52-90.
Watson J. G., & Barone S. (1976). The self-concept, personal values, and motivational
orientations of black and white managers. The Academy of Management
Journal, 19(1), 36-48.
Winter, D. G., Stewart, A. J. & McClelland, D. C.(1977). Husband’s motives and
wife’s career level. Journal of Personality and Social Psychology, 35(3), 159-
166.
Wood, S. E., Wood, E. G, & Boyd, D (2004). The World of Psychology (5th
ed.).
Boston: Allyn and Bacon.
Yamaguchi, I. (2003). The relationships among individual differences, needs and equity
sensitivity. Journal of Managerial Psychology, 18(4), 324-344.
Zheng, J., Veinott, E., Bos, N., Olson, J. S., & Olson, G. M. (2002). Trust without
Touch: Jumpstarting long distance trust with initial social activities.
Proceedings of CHI2002. Minneapolis, MN.
Zolin, R., Hinds, P. J., Fruchter R., & Levitt, R. E. (2004). Interpersonal trust in cross-
functional, geographically distributed work: A longitudinal study. Information
and Organization, 14, 1-26.

123
Appendix A: Personal Values Survey
The Personal Values Questionnaire (PVQ) Profile and Interpretive Notes are
proprietary and belong to the HayGroup. While I had permission to use and discuss the
PVQ for my dissertation, I do not have permission to re-print the PVQ tool with the
accompanying Scoring Instrument. Contact www.haygroup.com for these instruments.

124
Appendix B: PVQ Scoring Instrument
The Personal Values Questionnaire (PVQ) Profile and Interpretive Notes are
proprietary and belong to the HayGroup. While I had permission to use and discuss the
PVQ for my dissertation, I do not have permission to re-print the PVQ tool with the
accompanying Scoring Instrument. Contact www.haygroup.com for these instruments.

125
Appendix C: Social Motives Survey Used in the Pilot Study
Please use the scale below to rate your agreement with the following statements.
Strongly
Disagree
Disagree Neither Disagree,
nor Agree
Agree Strongly
Agree
1 2 3 4 5
During your group project you were given the opportunity to
_____ 1. grow and develop?
_____ 2. take on more difficult tasks?
_____ 3. find new and challenging goals within the project?
_____ 4. to create new things?
_____ 5. measure your own performance?
_____ 6. do things better than you had done them before?
_____ 7. maintain a high standard for the quality of your work?
_____ 8. challenge the limits of your ability?
_____ 9. personally produce work of high quality
_____ 10. Receive adequate feedback on how well you were progressing toward your goals?
_____ 11. develop close, friendly, cooperative relations with the others in your group?
_____ 12. to talk and socialize with others in your group?
_____ 13. become friends with the people you worked with?
_____ 14. have a good deal of contact with others in your group?
_____ 15. become a part of the team?
_____ 16. be well liked by your team members?
_____ 17. have a position that gave you recognition within the group?
_____ 18. influence others?
_____ 19. have a strong effect on others in your group?
_____ 20. hold a position of prestige?
_____ 21. take forceful action?
_____ 22. be in a leadership position?
_____ 23. to influence the decisions that were made in your group?
_____ 24. to exercise control over the group?

126
Appendix D: Social Motives Survey Used in the Dissertation Study
Please use the scale below to rate your agreement with the following statements.
Strongly
Disagree
Disagree Neither Disagree,
nor Agree
Agree Strongly
Agree
1 2 3 4 5 In the virtual teams project I was satisfied with my opportunity to
_____ 1. develop close, friendly, cooperative relations with the others in my group.
_____ 2. grow and develop.
_____ 3. take on more difficult tasks.
_____ 4. to talk and socialize with others in my group.
_____ 5. find new and challenging goals within the project.
_____ 6. have a position that gave you recognition within the group.
_____ 7. Receive adequate feedback on how well I was progressing toward my goals.
_____ 8. to create new things.
_____ 9. influence others.
_____ 10. have a strong effect on others in my group.
_____ 11. hold a position of prestige.
_____ 12. measure my own performance.
_____ 13. take forceful action.
_____ 14. do things better than I had done them before.
_____ 15. become friends with the people I worked with.
_____ 16. be in a leadership position.
_____ 17. have a good deal of contact with others in my group.
_____ 18. maintain a high standard for the quality of my work.
_____ 19. to influence the decisions that were made in my group.
_____ 20. become a part of the team.
_____ 21. challenge the limits of my ability.
_____ 22. personally produce work of high quality
_____ 23. be well liked by my team members.
_____ 24. to exercise control over the group.
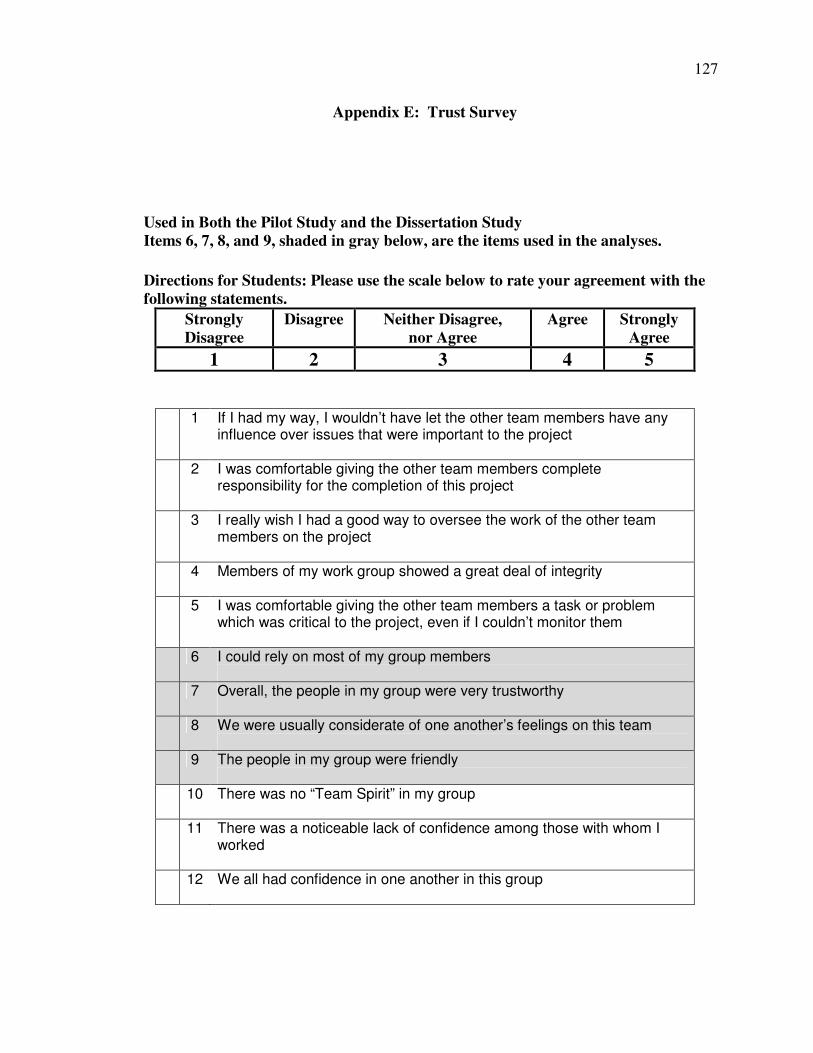
127
Appendix E: Trust Survey
Used in Both the Pilot Study and the Dissertation Study
Items 6, 7, 8, and 9, shaded in gray below, are the items used in the analyses.
Directions for Students: Please use the scale below to rate your agreement with the
following statements.
Strongly
Disagree
Disagree Neither Disagree,
nor Agree
Agree Strongly
Agree
1 2 3 4 5
1 If I had my way, I wouldn’t have let the other team members have any
influence over issues that were important to the project
2 I was comfortable giving the other team members complete responsibility for the completion of this project
3 I really wish I had a good way to oversee the work of the other team members on the project
4 Members of my work group showed a great deal of integrity
5 I was comfortable giving the other team members a task or problem which was critical to the project, even if I couldn’t monitor them
6 I could rely on most of my group members
7 Overall, the people in my group were very trustworthy
8 We were usually considerate of one another’s feelings on this team
9 The people in my group were friendly
10 There was no “Team Spirit” in my group
11 There was a noticeable lack of confidence among those with whom I worked
12 We all had confidence in one another in this group

128
Appendix F: Communications Survey
NOTE TO STUDENTS: This information will not be shared with your instructor, and I will not
view the responses to this questionnaire until after the final grades for this course are submitted.
Please answer the following questions honestly.
Have you ever taken a course that is taught exclusively online? (World Campus course etc.)
Yes – more than once, approximately how many ____________
Yes – only once
No
Prior Experience with Online Environments Use the following scale to answer each question about your experience in online
environments prior working on this project.
Never Rarely Sometimes Often Very Often
1 2 3 4 5 a. 1 2 3 4 5 I have used ANGEL or another similar online learning tool
b. 1 2 3 4 5 I have used ANGEL or another similar tool to gather information about
coursework but have not worked with others on a project in ANGEL
c. 1 2 3 4 5 I have used the ANGEL Group feature or a similar feature in another tool to
establish a study group with fellow students
d. 1 2 3 4 5 I have used ANGEL or a similar tool to work alone on an online project
e. 1 2 3 4 5 I have worked with others to complete a group project exclusively online
f. 1 2 3 4 5 I was friends with some or all of the members of my team before the project
began
g. 1 2 3 4 5 I was not friends with my team partners but we knew each other prior to the
beginning of this project
h. 1 2 3 4 5 I talked with some or all of my team members face to face about the project
before the project began
During the project Use the following scale to answer each question about your experience during this project.
Never Rarely Sometimes Often Very Often
1 2 3 4 5
a. 1 2 3 4 5 I talked with other members of my team about the project face-to-face
b. 1 2 3 4 5 I talked on the phone with other members of my team about the project.
c. 1 2 3 4 5 I communicated with other members of my team via ANGEL
d. 1 2 3 4 5 My team members communicated outside the ANGEL environment using
another online tool such as web mail, or AIM.
e. 1 2 3 4 5 My instructor helped me and my team members with the project online
f. 1 2 3 4 5 My instructor helped me and my team members face-to-face about the project
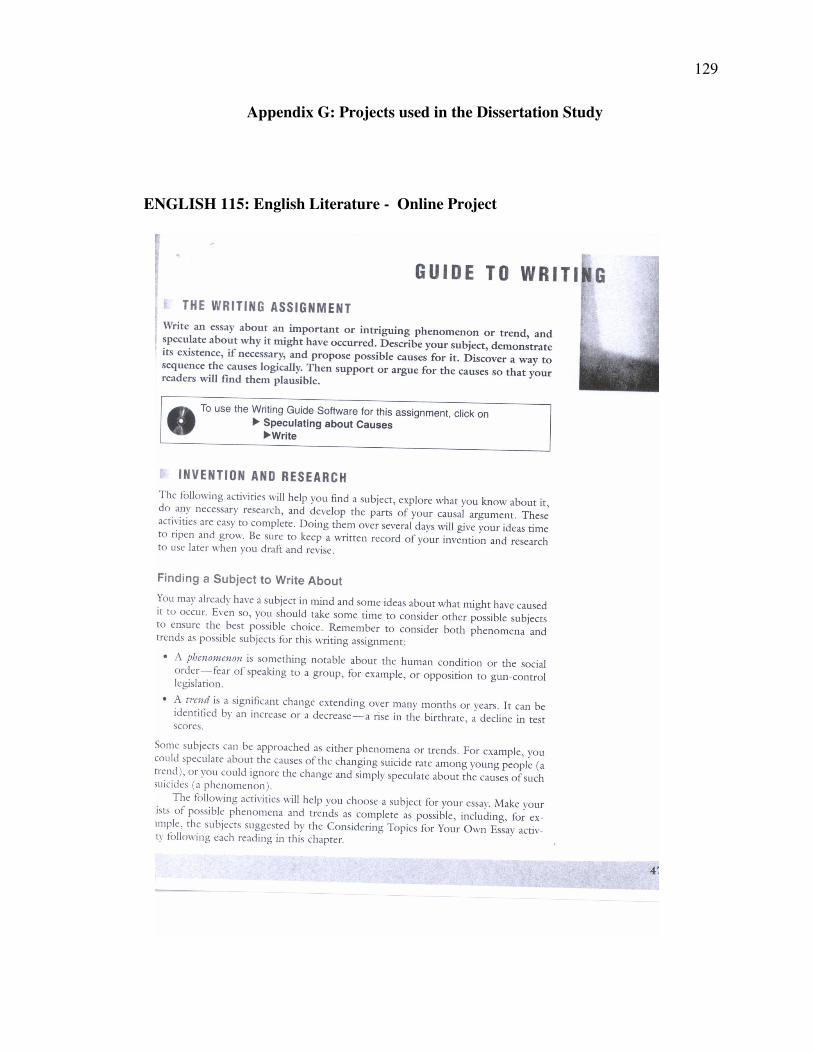
129
Appendix G: Projects used in the Dissertation Study
ENGLISH 115: English Literature - Online Project
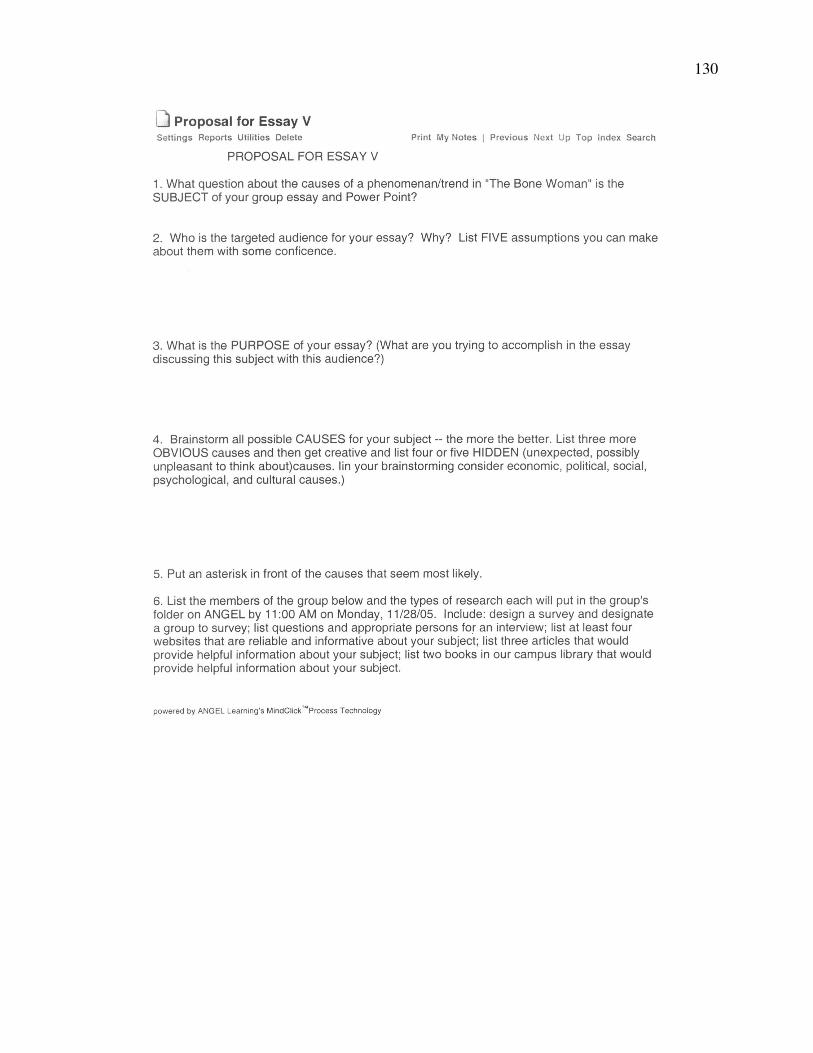
130

131

132

133
CHEM12 – Principles of Chemistry - Online Project
Project Description: You will work in teams of three online. You will not discuss the
project at all in person, ALL COMMUNICATION BETWEEN TEAM MEMBERS
MUST BE ONLINE! The details of the project are described below. This project will
be worth 50 points (10 % of your grade).
Project Details: You have been assigned to a team of three, consisting of two team
members and one team leader. The role of the team leader is to represent the team, to
keep the team on task by delegating tasks such as setting up the chat room discussions.
The role of the team members is to contribute to the discussion and respect the role of
the team leader. All members, including the leader must contribute equally to the
project and discussions.
This is a Team Project. Sign in to ANGEL and click on “Class” and next to your name
you will see a letter that indicates which team you are in. Your team’s message board
should be available to you in the “Lessons” tab. Your team discussions will take place
on these message boards. Your team’s leader has been notified via ANGEL, he or she
will identify themselves in the introduction.
There will also be a Folder titled Team Research where you will find helpful links. All
students will have access to this folder. Only team members will have access to team
folders.
Evaluation:
You will be evaluated individually on
- how many times you entered and contributed to the discussions
- the range of your contributions: asking questions, replying to others’
questions, replying to replies
- the quality of your contributions: insights from your perspective and specific
references from your independent research
- your skill at civil discourse – lively but respectful discussion
Your team evaluation will include:
- Submitting on time
- The discussion of the chemical equation describing the reactant and
products from the chemical process that generates the pollutant
- The discussion on conclusion and recommendations as to the state of alert
which should be given to addressing issues relating to your pollutant and the
process your team studied

134
Steps to follow:
1. Pick one common pollutant (including carbon dioxide, sulfur dioxide, carbon
monoxide, hydrocarbon gases, etc) generated in the United States that negatively
affect the world’s atmospheric environment. Open a chat session on ANGEL and
discuss together.
2. Use a message board to discuss the processes that contribute to the significant
accumulation of your chosen pollutant. Decide on ONE major process that
contributes to significant accumulation of your chosen pollutant.
At this point I will either give your team the go ahead or suggests required
modifications of your proposal. Once you have the go ahead from me, your team
will begin to work on steps 3-7 on your research.
3. Work together online to write an accurate chemical equation describing the
reactant and products from the chemical process that generates the pollutant.
4. Research the process to determine an estimate of annual quantities of pollutant
generated by this process.
5. Research alternatives or improvements being explored to make this process
more environmentally friendly
6. Evaluate how the producers of your pollutant (from the process you are
researching) try to minimize the waste stream of your pollutant.
7. Make a conclusion or recommendation as to the state of alert which should be
given to addressing issues relating to your pollutant and the process your team
studied.

135
Checklist of Deliverables
Date What’s Due How to Submit (Points)
Nov 11 – Place in
Drop Box
Chemical Equation Discuss and Drop your
solution in the drop box
provided. (10 points)
Nov 13 – First check
Nov 16 – Final Check
Discussion on
Research about
annual quantities
generated
Discuss your research in the
Message Board and Drop
your solution in the drop box
provided.(10 points)
Nov 15 – First check
Nov 18 – Final check
Discussions on
alternatives and
improvements to
the process
generating the
pollutant
Discuss your research on the
Message Board and Drop
your recommendations in the
drop box provided.(10 points)
Nov 17 – First check
Nov 19 – Final check
Discussion on the
producers
Research how the producers
try to minimize the waste
stream and discuss your
findings together on the
message board or chat
room.(10 points)
Document due in
ANGEL Drop box
Nov. 22 by 6PM
Discussion and
Document
describing your
Conclusion and
Recommendations
Together write a summary of
your findings using the
discussions. Post the
document in ANGEL. (10
points)
Instructions for Posting on the Message Board
Click on ‘Post a Message” to post a message on the board
Click on “Reply” to reply to message
Click on “Threaded View” to see all messages and replies together

136
Appendix H: PVQ Raw Scores - Ordered by Team Note: Student Number was assigned sequentially in the order in which the PVQ questionnaires were handed in. There is no affiliation to the student’s identity.
Student Number Team Affiliation Achievement Power Strength
18 1 4.30 4.70 4.60 Power
27 1 3.10 3.30 2.50 Achievement
53 1 3.20 3.60 3.50 Achievement
34 2 3.70 4.00 4.00 Power
11 2 4.00 3.90 2.60 Affiliation
26 2 4.10 3.10 3.10 Affiliation
36 3 3.20 3.80 3.90 Power
22 3 2.60 3.30 1.90 Achievement
23 3 3.20 3.30 2.30 Achievement
42 4 4.00 3.70 4.00 Power
25 4 3.80 3.40 2.20 Affiliation
39 4 4.20 3.60 3.40 Affiliation
33 5 4.30 3.70 4.00 Power
21 5 1.90 3.00 1.30 Achievement
40 5 1.80 3.20 1.40 Achievement
32 6 3.20 3.50 3.50 Power
12 6 3.90 3.30 3.20 Affiliation
29 6 4.10 3.20 2.70 Affiliation
45 8 3.30 3.40 3.50 Power
44 8 3.10 3.80 3.00 Achievement
55 8 3.50 3.90 3.50 Achievement
41 9 3.10 3.10 3.30 Power
20 9 3.20 2.90 2.00 Affiliation
47 9 3.10 2.50 1.30 Affiliation
35 11 2.80 4.30 4.60 Power
31 11 3.00 4.20 3.50 Achievement
49 11 4.00 4.80 3.50 Achievement
16 12 4.10 4.10 4.50 Power
24 12 3.40 2.70 1.20 Affiliation
46 12 4.50 4.10 3.10 Affiliation
48 13 3.80 2.90 3.80 Power
14 13 2.80 2.70 2.30 Affiliation
19 13 3.60 2.90 2.30 Affiliation
54 14 3.20 3.60 3.90 Power
56 14 3.80 2.90 2.80 Affiliation
57 14 3.90 3.10 2.90 Affiliation
84 16 3.80 3.70 3.70 Power
83 16 3.90 3.20 3.20 Affiliation

137
91 16 4.50 3.60 2.90 Affiliation
95 18 2.90 3.10 3.20 Power
80 18 3.20 3.20 2.40 Affiliation
82 18 3.80 3.30 2.40 Affiliation
97 19 3.30 2.80 3.30 Power
92 19 3.20 3.00 2.40 Affiliation
94 19 3.60 3.10 3.10 Affiliation
100 20 3.70 3.50 3.60 Power
87 20 4.80 3.20 3.40 Affiliation
101 20 4.10 3.10 2.50 Affiliation
68 21 4.90 4.60 4.60 Power
62 21 3.80 3.60 2.90 Achievement
65 21 3.00 3.10 2.50 Achievement
67 22 3.80 4.30 4.70 Power
63 22 3.90 2.70 2.60 Affiliation
64 22 4.60 4.50 4.30 Affiliation
61 23 3.80 3.20 4.30 Power
60 23 3.00 3.40 0.90 Achievement
66 23 3.50 3.70 2.90 Achievement
72 25 3.10 3.60 3.90 Power
73 25 3.60 3.70 3.10 Achievement
86 25 3.50 4.30 3.50 Achievement

138
Appendix I: Factor Analysis for Social Motive Satisfaction Survey
Exploratory Factor Analysis for 60 participants showing cross loading of items 11, 12,
and 13, questions are numbered for readability
Component
Rotated Component Matrix 1
Affiliation 2
Power 3
Achievement
Q1. Grow and Develop .73
Q2. Take on Difficult Tasks .47
Q3. Find challenging goals .73
Q4. Create New things .70
Q5. Measure Your Performance .69
Q6. Do things better than before .73
Q7. Maintain high standards .75
Q8. Challenge the limits of your abilities .76
Q9. Produce work of high quality .74
Q10. Receive adequate feedback on progress .45
Q11. Develop friendly relationships with others .50 .73
Q12. Socialize with others .47 .63
Q13. Become Friends with group members .53 .69
Q14. Have a good deal of Contact with others .78
Q15. Become part of a Team .83
Q16. Be well liked by team members .73
Q17. Be recognized by others in the group .77
Q18. Influence others .66
Q19. Have a strong effect on others .70
Q20. Hold a position of Prestige .75
Q21. Take forceful Action when needed .70
Q22. Be in a leadership position .83
Q23, Influence group decisions .65
Q24. Exercise control over the group .81
Initial Eigenvalues
Eigenvalue 2.91 4.19 7.64
% of Variance Explained 8.79 17.45 31.85
Cumulative % of Variance Explained 8.79 26.24 58.09
Cronbach alpha reliability statistic .90 .82 .88

139
Confirmatory factor analysis for 24 participants, items 11, 12, and 13 have been
removed from the analysis
Component Rotated Component Matrix
1 Affiliation
2 Power
3 Achievement
Q1. Grow and Develop .73
Q2. Take on Difficult Tasks .79
Q3. Find challenging goals .862
Q4. Create New things .82
Q5. Measure Your Performance .86
Q6. Do things better than before .77
Q7. Maintain high standards .65
Q8. Challenge the limits of your abilities .88
Q9. Produce work of high quality .74
Q10. Receive adequate feedback on progress .57
Q14. Have a good deal of Contact with others .92
Q15. Become part of a Team .82
Q16. Be well liked by team members .75
Q17. Be recognized by others in the group .83
Q18. Influence others .76
Q19. Have a strong effect on others .54
Q20. Hold a position of Prestige .66
Q21. Take forceful Action when needed .50
Q22. Be in a leadership position .76
Q23, Influence group decisions .57
Q24. Exercise control over the group .78
Initial Eigenvalues
Eigenvalue 2.26 5.28 6.46
% of Variance Explained 10.76 25.12 30.76
Cumulative % of Variance Explained 10.76 35.88 66.64
Cronbach alpha reliability statistic .84 .87 .92

140
Confirmatory factor analysis for 60 participants, items 11, 12, and 13 have been
removed from the analysis
Component
Rotated Component Matrix 1
Affiliation 2
Power 3
Achievement
Q1. Grow and Develop .72
Q2. Take on Difficult Tasks .48
Q3. Find challenging goals .77
Q4. Create New things .74
Q5. Measure Your Performance .72
Q6. Do things better than before .74
Q7. Maintain high standards .78
Q8. Challenge the limits of your abilities .79
Q9. Produce work of high quality .72
Q10. Receive adequate feedback on progress .42
Q14. Have a good deal of Contact with others .86
Q15. Become part of a Team .87
Q16. Be well liked by team members .74
Q17. Be recognized by others in the group .79
Q18. Influence others .65
Q19. Have a strong effect on others .67
Q20. Hold a position of Prestige .78
Q21. Take forceful Action when needed .67
Q22. Be in a leadership position .85
Q23, Influence group decisions .64
Q24. Exercise control over the group .82
Initial Eigenvalues
Eigenvalue 2.00 3.91 6.51
% of Variance Explained 9.50 18.61 31.00
Cumulative % of Variance Explained 9.50 28.11 59.11
Cronbach alpha reliability statistic .90 .83 .88

141
Appendix J: Individual Data for Analyses
T
ea
m
Stu
de
nt N
um
PV
Q S
tre
ng
th
Cla
ss
SM
S s
co
re
Tru
st
PV
Q s
co
re
SM
S A
ch
SM
S A
ff
SM
S P
ow
er
PV
Q A
ff
PV
Q A
ch
PV
Q P
ow
er
2 11 Affiliation Chem 4.00 4.00 4.0 3.4 4.00 3.88 4.0 3.9 2.6
6 12 Affiliation Chem 3.00 3.25 3.9 2.9 3.00 1.13 3.9 3.3 3.2
13 14 Affiliation Chem 2.00 3.75 2.8 2.9 2.00 3.25 2.8 2.7 2.3
12 16 Power Chem 2.88 2.00 4.5 2.2 2.67 2.88 4.1 4.1 4.5
1 18 Power Chem 2.38 3.25 4.6 3.9 3.33 2.38 4.3 4.7 4.6
13 19 Affiliation Chem 4.00 4.00 3.6 2.5 4.00 3.00 3.6 2.9 2.3
9 20 Affiliation Chem 4.67 4.25 3.2 3.1 4.67 3.75 3.2 2.9 2.0
5 21 Achievement Chem 2.10 3.50 3.0 2.1 1.33 2.00 1.9 3.0 1.3
3 22 Achievement Chem 1.90 4.25 3.3 1.9 4.00 3.63 2.6 3.3 1.9
3 23 Achievement Chem 3.90 2.25 3.3 3.9 3.00 3.50 3.2 3.3 2.3
12 24 Affiliation Chem 1.00 1.25 3.4 3.4 1.00 2.13 3.4 2.7 1.2
4 25 Affiliation Chem 2.33 4.25 3.8 1.7 2.33 1.25 3.8 3.4 2.2
2 26 Affiliation Chem 3.67 4.00 4.1 1.0 3.67 3.25 4.1 3.1 3.1
1 27 Achievement Chem 2.90 3.75 3.3 2.9 3.00 3.38 3.1 3.3 2.5
6 29 Affiliation Chem 3.67 4.00 4.1 4.0 3.67 3.75 4.1 3.2 2.7
11 31 Achievement Chem 3.30 3.75 4.2 3.3 4.67 2.88 3.0 4.2 3.5
6 32 Power Chem 4.38 3.75 3.5 2.9 4.00 4.38 3.2 3.5 3.5
5 33 Power Chem 2.63 3.00 4.0 1.8 3.67 2.63 4.3 3.7 4.0
2 34 Power Chem 3.75 3.75 4.0 1.7 3.00 3.75 3.7 4.0 4.0
11 35 Power Chem 2.13 3.50 4.6 2.2 3.00 2.13 2.8 4.3 4.6
3 36 Power Chem 3.00 2.50 3.9 3.9 2.67 3.00 3.2 3.8 3.9
4 39 Affiliation Chem 3.67 4.00 4.2 3.5 4.00 3.50 4.2 3.6 3.4
5 40 Achievement Chem 1.70 3.75 3.2 1.7 5.00 5.00 1.8 3.2 1.4
9 41 Power Chem 3.13 3.25 3.3 2.6 3.33 3.13 3.1 3.1 3.3
4 42 Power Chem 3.63 3.75 4.0 4.1 4.33 3.63 4.0 3.7 4.0
8 44 Achievement Chem 2.60 4.50 3.8 2.6 4.00 3.75 3.1 3.8 3.0
8 45 Power Chem 4.75 3.25 3.5 3.5 2.33 4.75 3.3 3.4 3.5
12 46 Affiliation Chem 3.33 4.50 4.5 3.6 3.33 3.38 4.5 4.1 3.1
9 47 Affiliation Chem 3.67 3.75 3.1 3.3 3.67 3.25 3.1 2.5 1.3
13 48 Power Chem 4.75 2.50 3.8 1.7 1.67 4.75 3.8 2.9 3.8
11 49 Achievement Chem 3.20 3.00 4.8 3.2 2.00 2.38 4.0 4.8 3.5
1 53 Achievement Chem 2.60 2.75 3.6 2.6 3.67 3.13 3.2 3.6 3.5
14 54 Power Chem 3.88 3.75 3.9 3.7 3.67 3.88 3.2 3.6 3.9
8 55 Achievement Chem 2.80 4.75 3.9 2.8 2.67 3.38 3.5 3.9 3.5

142
14 56 Affiliation Chem 2.00 5.00 3.8 3.7 2.00 2.25 3.8 2.9 2.8
14 57 Affiliation Chem 4.00 5.00 3.9 2.3 4.00 3.25 3.9 3.1 2.9
23 60 Achievement English 3.60 5.00 3.4 3.6 4.33 3.25 3.0 3.4 0.9
23 61 Power English 3.75 3.25 4.3 3.1 4.00 3.75 3.8 3.2 4.3
21 62 Achievement English 4.10 4.00 3.6 4.1 4.33 4.00 3.8 3.6 2.9
22 63 Affiliation English 3.00 2.75 3.9 2.6 3.00 2.63 3.9 2.7 2.6
22 64 Affiliation English 4.00 3.00 4.6 3.6 4.00 3.50 4.6 4.5 4.3
21 65 Achievement English 3.80 3.50 3.1 3.8 3.00 3.75 3.0 3.1 2.5
23 66 Achievement English 4.70 5.00 3.7 4.7 5.00 4.63 3.5 3.7 2.9
22 67 Power English 5.00 4.50 4.7 4.5 5.00 5.00 3.8 4.3 4.7
21 68 Power English 3.63 4.25 4.6 2.9 4.33 3.63 4.9 4.6 4.6
25 72 Power English 3.13 2.75 3.9 3.4 1.00 3.13 3.1 3.6 3.9
25 73 Achievement English 3.00 2.25 3.7 3.0 3.00 2.75 3.6 3.7 3.1
18 80 Affiliation English 4.00 3.75 3.2 3.7 4.00 3.50 3.2 3.2 2.4
18 82 Affiliation English 3.67 4.00 3.8 3.7 3.67 3.25 3.8 3.3 2.4
16 83 Affiliation English 4.33 5.00 3.9 4.5 4.33 3.88 3.9 3.2 3.2
16 84 Power English 3.88 3.75 3.7 3.2 3.33 3.88 3.8 3.7 3.7
25 86 Achievement English 3.20 3.75 4.3 3.2 4.00 2.50 3.5 4.3 3.5
20 87 Affiliation English 4.33 5.00 4.8 4.1 4.33 4.13 4.8 3.2 3.4
16 91 Affiliation English 3.00 3.50 4.5 4.1 3.00 2.50 4.5 3.6 2.9
19 92 Affiliation English 2.00 3.75 3.2 2.9 2.00 3.38 3.2 3.0 2.4
19 94 Affiliation English 3.67 4.00 3.6 3.5 3.67 3.25 3.6 3.1 3.1
18 95 Power English 4.75 4.25 3.2 2.1 3.33 4.75 2.9 3.1 3.2
19 97 Power English 3.13 3.75 3.3 3.5 2.67 3.13 3.3 2.8 3.3
20 100 Power English 3.13 2.75 3.6 3.1 2.33 3.13 3.7 3.5 3.6
20 101 Affiliation English 3.67 4.25 4.1 4.2 3.67 4.25 4.1 3.1 2.5

143
Appendix K. Results of Principal Component (Exploratory) Factor Analysis
Component
Rotated Component Matrix 1 2 3 4 5 6
Aff
ilia
tio
n
Po
wer
Ach
iev
emen
t
Ach
iev
emen
t
Ach
iev
emen
t
Ach
iev
emen
t
Q1. Grow and Develop 0.53
Q2. Take on Difficult Tasks 0.76
Q3. Find challenging goals 0.59
Q4.Create New things 0.70
Q5. Measure Your Performance 0.79
Q6. Do things better than before 0.57
Q7. Maintain high standards 0.43 0.45
Q8. Challenge the limits of your abilities 0.57
Q9. Produce work of high quality 0.77
Q10. Receive adequate feedback on
progress 0.45 0.56
Q11. Develop friendly relationships with
others 0.85
Q12. Socialize with others 0.79
Q13. Become Friends with group members 0.86
Q14. Have a good deal of Contact with
others 0.79
Q15. Become part of a Team 0.81
Q16. Be well liked by team members 0.71
Q17. Be recognized by others in the group 0.49
Q18. Influence others 0.57
Q19. Have a strong effect on others 0.58
Q20. Hold a position of Prestige 0.63
Q21. Take forceful Action when needed 0.84
Q22. Be in a leadership position 0.83
Q23, Influence group decisions 0.71
Q24. Exercise control over the group 0.88
Initial Eigenvalues
EigenValue 7.56 3.17 2.13 1.24 1.09 1.08
% of Variance Explained 31.55 13.22 8.88 5.18 4.55 4.49
Cumulative % of Variance Explained 31.55 44.77 53.65 58.83 63.38 67.87
Cronbach alpha reliability statistic 0.91 0.87 0.65 0.51 0.64 0.76
Cronbach alpha reliability statistic 0.91 0.87 .79 (grouped together)
Another factor analysis with the extraction criteria changed to present factors with
Eigenvalues greater than 1.5 found three principle components relating to affiliation,
power, and achievement.

144
Vita
Deborah M. LaBelle is Associate Professor and Director of the Information Technology
program at Nazareth College in Rochester, New York. She has held this position since
2006. Prior to coming to Nazareth College, she taught at Penn State, Delaware County
campus in Media, Pennsylvania from 2000 to 2006 and at Monroe Community College
in Rochester, New York from 1982 until 2000. She has held numerous committee posts
and served as the chairperson for the Computer Information Systems department at
Monroe Community College from 1994 until 1997. Prior to teaching, she worked as a
Systems Analyst at Eastman Kodak in Rochester, New York and GTE Sylvania in
Needham, Massachusetts. She also lived in the country of Sweden from 1997 until
1998 and worked as a Systems Analyst at Astra Arcus, in Sodertalje, Sweden.
Deborah received a B.A. in Mathematics, cum laude, from the State University College
of Potsdam, New York, and concurrently completed an M.A. in Mathematics in a
double degree BA-MA accelerated program. She also holds a permanent New York
State certificate for teaching Mathematics in grades 7 – 12. She was a member of both
the Pi Mu Epsilon Mathematics Honor Society and Kappa Delta Pi Honor Society for
Education.
Publications
VanLeuvan P., LaBelle D., & Margle J. (2006). Collaboration to Increase Young Women's
Interest in Technology and Related Career Options. Poster presented at the Hawaii
International Conference on Education, Honolulu, Hawaii, January 2006.
LaBelle D. (2005) Before the Team Project: Cultivate a Community of Collaborators.
Information Systems Education Journal, v. 3, n. 28, August 2005. Presented at the Information
Systems Education Conference ISECON2004, Newport, RI, November 2004.
Wiedenbeck, S., LaBelle D., Kain V. (2004). Self-Efficacy and Mental Models in Learning to
Program. ACM SIGCSE Bulletin, v.36 n.3, September 2004
Wiedenbeck, S., LaBelle D., Kain V. (2004) Factors Affecting Course Outcomes in
Introductory Programming. Proceedings PPIG 2004: Psychology of Programming Interest
Group. Carlow, Ireland.
Wiedenbeck, S., LaBelle D., Kain V. (2004). Self-Efficacy and Mental Models in Learning to
Program. Proceedings ITICSE04: Innovation and Technology in Computer Science Education.
June 28 – 30, 2004. Leeds, UK.
Guertin L., LaBelle D. (2004). Collaborative Student Research Involving Handheld Computers.
Conference of Council on Undergraduate Research, June 2004, La Crosse, Wisconsin.