the influence of shopping characteristics and socio
TRANSCRIPT

Article
Southern African Business Review https://doi.org/10.25159/1998-8125/3832 https://upjournals.co.za/index.php/SABR Online ISSN 1998-8125 Volume 22 | 2018 | #3832 | 30 pages
© The Author(s) 2018
Published by Unisa Press. This is an Open Access article distributed under the terms of the Creative Commons Attribution-ShareAlike 4.0 International License (https://creativecommons.org/licenses/by-sa/4.0/)
The Influence of Shopping Characteristics and Socio-Demographic Factors on Selected In-Store Buying Practices in Different Socio-Economic Regions Rodney Graeme Duffett
https://orcid.org/0000-0002-4568-6988
Cape Peninsula University of Technology
Crystal Foster
Cape Peninsula University of Technology
Abstract The aim of this paper is to ascertain the usage of price comparisons and avoidance of impulse purchases regarding in-store food-buying practices among consumers who reside in low, middle and high socio-economic status (SES) regions. The article will also focus on the effect of shopping characteristics and socio-demographic factors on in-store food-buying practices. A quantitative consumer intercept survey was conducted among 400 low, 400 middle and 400 high SES region consumers in retail stores. Statistical analysis of in-store food-buying practices was conducted via a generalised linear model analysis of variables, utilising the Wald’s Chi-square statistic distribution. Consumers who live in the low SES region exhibited the largest price comparison usage tendency, whereas the high SES region consumers showed the highest predisposition to make impulse purchases. Several shopping characteristics and socio-demographic factors resulted in significant associations in terms of price comparisons and the avoidance of impulse purchases. Food manufacturers, marketers and retailers should consider implementing the study’s primary results in their marketing activities among consumers in the different SES regions. Additionally, shopping characteristics and socio-demographic factors of in-store food-buying practices require further research to add to the limited theoretical discourse.
Keywords: price comparisons; avoidance of impulse purchases; in-store food-buying practices; socio-economic status (SES) regions
Introduction Since the start of the current period of economic recession in South Africa, consumer debt has escalated (South African Reserve Bank 2018, 1–17). Most South Africans find it difficult to repay their debt, save money and have an adequate amount of money available for household expenses. Increases in VAT, energy (electricity) and transport prices (fuel levy), as well as the depreciation of the Rand (imports), have not only negatively affected the debt-repayment capacity of households, but are also the most influential factors that affect the cost of food

2
(National Agricultural Marketing Council 2018, 1–32; South African Reserve Bank 2018, 1–17; Speckman and Anetos 2018, 11). Furthermore, the Community Survey 2016 revealed that 20 per cent of South African households did not have sufficient funds to purchase food (Statistics South Africa 2016, 87–89). Therefore, it is to be expected that consumers would employ strategies such as food-buying practices to help cut back on spending and to protect themselves financially, as household expenses continue to increase and loaning money becomes more difficult and expensive, essentially as a result of the recession (Bellini, Cardinali and Grandi 2017, 164–171; Hampson and McGoldrick 2017, 404–414; Speckman and Anetos 2018, 11). The National Agricultural Marketing Council’s (2018, 1–32) Food Price Monitor Report (May 2018) mentions that the poorest 30 per cent of South African consumers are affected most by food price increases, because they spend 57.6 per cent of their income on food compared to 20 per cent of the wealthiest consumers, who only spend up to 3.1 per cent of their income on food. Therefore, consumers who fall within the higher income categories may have more funds available for discretionary spending, compared to lower-income consumers who should spend their money as effectively as possible. Hence, higher-income consumers may need to adjust their usual money-spending/saving practices less dramatically than lower- or middle-income consumers, as food prices increase (Mittal 2016, 20–31; National Agricultural Marketing Council 2018, 1–32). Income is a strong predictor of food-purchasing behaviour, since most households adhere to strict food budgets to ensure that their monetary income goes further to cover all of their expenses (Du and Kamakura 2008, 109–131; Mittal 2016, 20–31; Tariq, D’Souza and Allaway 2016, 574–584). This means that shopping strategies may vary according to socio-economic status (SES) region and income level (Ellaway and Macintyre 2000, 52–59; Mittal 2016, 20–31). South African consumers use a variety of money-saving practices, especially during tough recessionary economic periods. However, this shopping behaviour has received limited focus in research (Harper and Crafford 2011). Hampson and McGoldrick’s (2017, 404–414) study in the United Kingdom (UK) asserted that further inquiry was necessary to ascertain the variables that have an effect on consumers’ price consciousness in other turbulent economies and cultures. This has resulted in a number of studies, mostly in developed countries, that have considered various aspects of price comparisons and/or impulse purchases (Bellini et al. 2017, 164–171; Bossuyt, Vermeir, Slabbinck, De Bock and Van Kenhove, 2017, 60–76; Dhaundiyal and Coughlan 2016, 923–939; Ferreira, Brandãob and Bizarrias 2017, 431–442; Hampson and McGoldrick 2017, 404–414; Harris, Riley, Riley and Hand 2017, 419–445; Mittal 2016, 20–31; Sheikh, Hosseinikia and Abri 2017, 55–62; Styvén, Foster and Wallström 2017, 416–431; Tariq et al. 2016, 574–584). However, few have considered shopping characteristics and socio-demographic factors (such as education, income and occupation) as independent variables, but these were rather used to describe the samples. Amos, Holmes and Keneson (2014, 86–97) suggest that the role of socio-demographics regarding impulse purchases remains unclear. Bellini et al. (2017, 164–171) confirm that future research should consider the profile of shoppers’ (socio-demographic factors) influence on food-buying practices, such as impulse purchases. Geetha and Bharadhwaj (2016, 49–66) assert that more research should consider

3
food-buying practices (impulse purchases), as well as the influence of shopping characteristics in developing countries. Styvén et al. (2017, 416–431) indicate that there is a lack of inquiry addressing impulse purchases and other independent variables. Price comparisons and avoidance of impulse purchases were also identified as the two most common in-store food-buying practices in a South African study by Harper and Crafford (2011). The Food Marketing Institute (2014, 1–22) confirmed that the aforementioned in-store food-buying practices were popular among consumers. It is clear that further research of in-store food-buying practices, shopping behaviour, and different socio-economic groups among South African households, is warranted. Therefore, the main research questions of this study are the following:
• Is there a difference in price comparisons and avoidance of impulse purchases regarding in-store food-buying practices among consumers who reside in different SES regions?
• Do shopping characteristics (shopping frequency, shopping length, co-shopping, and payment method) have an effect on the usage of price comparisons and the avoidance of impulse purchases?
• Do socio-demographic factors (gender, age, marital status, household numbers, education level, employment status, population group, and household monthly income) have an influence on price comparisons and the avoidance of impulse purchases?
Literature Review Socio-Economic Status (SES) Kamakura and Mazzon (2012, 4–18) and the American Psychological Association (2018) state that SES emphasises education and income, which serve as causes and effects of occupational status. Education qualifies an individual for an occupation, while income is the consequence of occupational status. The recession in South Africa resulted in a large number of job losses and unemployment levels in 2017 (South African Reserve Bank 2018, 21–25). The white population group exhibits the lowest unemployment levels, whereas coloured and black population groups display the highest unemployment levels in South Africa (Statistics South Africa 2018, 39–40). Personal disposable income is the portion of personal income which households can spend or save once direct income tax and credit (loans from banks and other institutions) have been deducted. The amount of personal disposable income is connected to consumers’ employment status and, frequently, education levels (American Psychological Association 2018; Mittal 2016, 20–31). Therefore, the large differences in South African consumers’ wealth, educational levels and occupations have resulted in disproportionate personal income distributions, which are apparent among the different population groups (Petzer and De Meyer 2013, 382–390; Statistics South Africa 2016, 1–97; Statistics South Africa 2018, 39–40). However, the establishment of a democracy a little over two decades ago, has instigated an increase of average household incomes for all population groups (Speckman and Anetos 2018, 11). It is generally accepted that there is an inverse relationship between income level and the amount of money allocated to food purchasing (National Agricultural Marketing Council 2018, 1–32; Sanlier and Karakus 2010, 140–150). Consequently, lower-income households devote a larger

4
percentage of their total expenditure to food, while in each successively higher income group the amount that is spent on food declines as a percentage of total expenditure (Darmon and Drewnowski 2015, 643–660; KPMG 2016; National Agricultural Marketing Council 2018, 1–32). In-store Food-buying Practices The main aims of food-buying practices are to reduce food costs or to spend less money, while other objectives include, amongst others: to save time when shopping; obtain bargains; make intelligent choices; avoid unnecessary or wasteful purchases; obtain good information; gain enjoyment from shopping; save effort and gain convenience; and obtain the most value and quantity for the amount of money spent (Friedman and Rees 1988, 284–302; Harper and Crafford 2011; Harris et al. 2017, 419–445; Mortimer 2012, 790–810; Mittal 2016, 20–31; Tariq et al. 2016, 574–584). A planned purchase is described as a deliberate, thoughtful search and evaluation, which normally results in rational, accurate and better decisions, whereas unplanned food shopping results in negative consequences such as unhealthy food choices and overpaying (Bellini et al. 2017, 164–171; Machado, Claro, Canella, Sarti and Levy 2017, 381–388; Thiagarajan, Ponder, Leug, Worthy and Taylor 2009, 207–215). More than two-thirds of purchase decisions involve some type of in-store decision-making (Bellini et al. 2017, 164–171). Lysonski and Durvasula (2013, 75–97), Mittal (2016, 20–31), Bellini et al. (2017, 164–171), Harris et al. (2017, 419–445) and Hampson and McGoldrick (2017, 404–414) suggest different shopping “types,” which have an influence on in-store food buying practices: price conscious; impulsive; brand conscious; quality conscious; prepared shoppers; recreational; novelty conscious; and brand loyal. Price comparisons and avoidance of impulse purchases were identified by Harper and Crafford (2011) as the two most popular in-store food-buying practices in South Africa, and confirmed by the Food Marketing Institute (2014, 1–22). These two practices are also the focus of this research. Price Comparisons Since brands are so similar and there tends to be a variation in prices within a product category, it is an efficient strategy for consumers to observe and compare prices when purchasing a product (Hampson and McGoldrick 2017, 404–414; Kumar, Karande and Reinartz 1998, 401–426). Consumers use both internal and external reference prices when comparing the prices of different brands. External reference prices are based on the prices of all brands in the product category at the time of the consumer’s purchase, whereas a consumer’s internal reference price is an internal standard against which observed prices are compared (Steckel, Shampanier, O’Laughlin, Shea and Fair 2017, 1–5). A deal-prone consumer is one who is price conscious and, therefore, willing to compare prices of different brands. Deal-prone consumers aim to save money by purchasing the cheapest product. These consumers, consequently, place more emphasis on external reference prices compared to internal references (Hampson and McGoldrick 2017, 404–414; Mittal 2016, 20–31). Dickson and Sawyer (1990, 42–53), Lysonski and Durvasula (2013, 75–97), Mittal (2016, 20–31) and Hampson and McGoldrick (2017, 404–414) reveal several reasons for comparing

5
the prices of different products/brands: to save money; to find a good deal/bargain; simply out of habit; to assist in making a brand choice; to help to decide on the purchase quantity; to aid in deciding whether or not to buy from the product category; and to remember until the next time they shop. Mittal (2016, 20–31) also identified shopping enjoyment, decision confidence, satisfaction with choice and buying gratification as other elements that influence price comparisons in the United States (US). A majority of the price comparison studies were conducted in developed countries, and did not consider the influence of shopping characteristics and socio-demographic factors on in-store food-buying practices. Hence, this inquiry seeks to address the aforementioned research gaps from a developing country perspective. Avoidance of Impulse Purchases Impulse buying occurs when a consumer experiences a sudden, often powerful, unintended and persistent urge to buy something immediately without planning (Bossuyt et al. 2017, 60–76; Sheikh et al. 2017, 55–62). The consumer consequently feels compelled to make the purchase, and is less likely to consider the consequences of the purchase or to think carefully before buying the item (Bellini et al. 2017, 164–171; Geetha and Bharadhwaj 2016, 49–66; Pornpitakpan and Han 2013, 85–93). Major differences between an impulse and planned purchase include the amount of information that can be sought prior to the purchase decision, and the length of time that is spent on the decision process (Bellini et al. 2017, 164–171; Lee and Kacen 2008, 265–272). Consumers who purchase on impulse do not engage in a great deal of evaluation. As a result of their impulse purchases consumers may experience financial problems, suffer a disappointment with their impulsively purchased product, and even feel guilty about the purchase (Bellini et al. 2017, 164–171; Bossuyt et al. 2017, 60–76; Hampson and McGoldrick 2017, 404–414; Wilson 2017, 169–180). Mikolajczak-Degrauwe and Brengman (2014, 65–73) found that among Belgium consumers with positive attitudes towards advertising, this mind-set could lead to impulse purchases. Garcia (2018) reported that up 70 per cent of consumers regularly made in-store impulse purchases in the US. Hampson and McGoldrick (2017, 404–414) found that British shoppers were more knowledgeable and concerned about prices, which reflected an increase in purchase planning and price consciousness with a simultaneous concern to reduce impulse purchases. The incidence of impulse purchases continues to grow and constitutes a large of portion of retailer turnover (Amos et al. 2014, 86–97; Bellini et al. 2017, 164–171; Bossuyt et al. 2017, 60–76; Chang, Yan and Eckman 2014, 289–314; Xiao and Nicholson 2013, 333–356). A number of factors may influence impulse purchases, such as a person’s personality, emotional/affective state, psychological variables and mood, which are beyond the control of the consumer (Bellini et al. 2017, 164–171; Lucas and Koff 2014, 111–115, Ozen and Engizek 2014, 78–93; Sheikh et al. 2017, 55–62; Styvén et al. 2017, 416–431). Impulse purchases have been found to have an effect on emotional responses, where consumers may experience happiness, gratification, excitement and fear (Chang et al. 2014, 289–314; Li, Deng and

6
Moutinho 2015, 191–209; Mohan, Sivakumaran and Sharma 2013, 1711–1732; Sheikh et al. 2017, 55–62). Dhaundiyal and Coughlan (2016, 923–939) investigated the effect of personality traits and established that sociability had a positive influence on affective and cognitive impulse buying, whereas shyness had a favourable impact on cognitive impulse buying tendencies among Irish consumers. Bellini et al. (2017, 164–171) established that higher pre-shopping preparation led to lower impulse purchases. The degree to which consumers’ knowledge of a store’s environment affects an impulse purchase depends on the time that is available for shopping. The presence of time pressure may result in low store knowledge, ultimately instigating an unplanned purchase. This occurs under time pressure, because exposure to in-store information is reduced among consumers (Kim and Park 1997, 501–517; Machado et al. 2017, 381–388). Conversely, Bellini et al. (2017, 164–171) reveal that (in Italy) impulsive purchasing rises relative to the rise of shopping time. Thus, the longer consumers take to shop, the more chance there is of them making an impulse purchase in Italian stores. In-store stimuli such as background music, product displays, promotions, store congestion and store personnel, play an important role in consumers’ tendency to purchase on impulse (Bell, Corsten and Knox 2011, 31–45; Bellini et al. 2017, 164–171; Karbasivar and Yarahmadi 2011, 174–181; Machado et al. 2017, 381–388). Some consumers enter the store with an intention to buy only certain items, while these in-store stimuli lead them to make unplanned purchases; hence in-store marketing efforts play a significant role in inducing impulse purchasing (Bellini et al. 2017, 164–171; Wilson 2017, 169–180). A majority of impulse-purchase research was conducted in first-world nations, and did not consider the influence of shopping characteristics and socio-demographic factors of this in-store food buying practice. Hence, this study aims to address the abovementioned gaps in research from a developing nation perspective. Methodology Sampling This study comprised consumers who shopped (those visiting a shop with the intention of examining or purchasing food products) and dwelled in three different regions in South Africa. The sample frame included consumers who reside in Delft, Maitland or Meadowridge. These areas were selected for participation based on their demographic and socio-economic profile Census 2011 data, provided by the City of Cape Town (2013a; 2013b; 2013c). The combined education, occupation, employment rate and income levels were extracted from the census data profiles, and were used to determine the aforementioned low, middle and high socio-economic status (SES) regions. For example: 87 per cent of Meadowridge residents had completed Grade 12 or higher, versus 59 per cent in Maitland, and 27 per cent in Delft; 97 per cent of Meadowridge residents (aged 15 to 64) were employed, versus 86 per cent in Maitland, and 59 per cent in Delft; 52 per cent of Meadowridge households had a monthly income of over R25 600, versus nine per cent in Maitland, and one per cent in Delft. Over 50 per cent of Meadowridge residential occupations were professional or legislators, senior officials and managers; 45 per cent of Maitland residents were clerks, service workers, shop and sales

7
workers, or technicians and associate professionals; and over 60 per cent of Delft residential occupations included elementary occupations, plant and machine operators, or craft and related trade workers. The respondents (consumers) included adults aged between 18 to 66 years and older: 400 consumers who resided in Delft (a low SES region) and shopped at the local uSave supermarket; 400 consumers who resided in Maitland (a middle SES region) and shopped at the local Shoprite supermarket; and 400 consumers who resided in Meadowridge (a high SES region) and shopped at the local Checkers supermarket (Shoprite Holdings 2017a; 2017b; 2017c). A systematic sampling procedure was used to obtain the envisaged sample number. The researcher first randomly chose the first respondent via systematic sampling. A random starting number of two was used, which means that the second person who entered the grocery store was approached by the fieldworkers and asked to participate in the survey. All respondents remained anonymous and were informed that they could withdraw from the survey at any stage. Questionnaire Design The questionnaire was accessible in English and Afrikaans to circumvent possible comprehension problems owing to language, since many of Delft’s respondents were mainly Afrikaans speaking (City of Cape Town 2013a). Three pre-screening questions were posed in order to identify and verify possible respondents. Only respondents who lived in the respective regions (Meadowridge, Maitland or Delft), who indicated that they are one of the main decision-makers regarding the purchase of food products within their household, and who are one of the main buyers of food products within a household, were eligible to participate in the survey. The first section comprised four questions regarding the consumers’ shopper factors, which included consumer shopping frequency, shopping duration, whether someone and/or who accompanied them on shopping excursions, and payment method. The next section included in-store food-buying practice constructs, namely price comparisons and the avoidance of impulse purchases, which were identified by Friedman and Rees (1988, 284–302). The price comparisons’ scale items were adapted from Lichtenstein, Ridgway and Netemeyer (1993, 234–245), and Manzur et al. (2011, 286–291). The avoidance of impulse purchase scale items were adapted from Verplanken and Herabadi (2001, S71–S83), and Manzur et al. (2011, 286–291). Each in-store food-buying practice was represented by six structured questions, which allowed for four response options (1 = Frequently; 2 = Sometimes; 3 = Seldom; and 4 = Never). The same response options were used by Herrmann and Warland (1990, 307–325) in their assessment of food-buying practices. The final section considered the socio-demographic factors of the consumers, namely age, gender, marital status, level of education, household size, population group, employment status and monthly household income. The socio-demographic factors were taken from the Census 2011 household questionnaire (Statistics South Africa 2012, 14–55). Shoprite Holdings gave permission for the research to be conducted at the respective Checkers, Shoprite and uSave stores (Shoprite 2016). Every respondent provided informed consent by completing and signing a consent form, which was attached to the questionnaire’s cover page. The Ethics Committee at the Faculty of Applied

8
Sciences Research, Cape Peninsula University of Technology, also gave the mandatory ethical approval. Collection of Data and Statistical Analysis The consumer intercept survey was implemented over five successive weekends (on Saturdays) in order to include consumers who may not have sufficient time to shop for food products during the week. Two fieldworkers assisted with the dissemination and collection of the self-administered questionnaires, while assisting consumers to complete the questionnaire upon request. Nine out of 10 consumers chose to complete the self-administered questionnaire without any assistance from the fieldworkers. The collected data were captured by the SPSS (version 23) statistical program. A generalised linear model analysis of variance, utilising the Wald’s Chi-square distribution and Bonferroni pair-wise comparisons, were used to determine significant differences between respondents’ use of in-store food-buying practices (dependant variables) and SES region groups, shopper characteristics and socio-demographic factors (independent variables). Confirmatory factor analysis (CFA) was conducted to evaluate the in-store food-buying practice constructs in terms of reliability and validity. The CFA displayed high factor loadings, which were all above 0.7. The reliability of the two in-store food-buying practice constructs was evaluated by means of composite reliability (CR) and Cronbach’s α coefficient. The CR and Cronbach’s α coefficient were greater than 0.9 for the compare prices and avoidance of impulse purchases constructs, which reflected strong internal consistencies between the construct items (Bagozzi and Yi 2012, 8–34) (Table 1).

9
Table 1: In-store food-buying practices (price comparisons and avoidance of impulse purchases) descriptive statistics, confirmatory factor analysis (factor loadings), Cronbach’s α, CR, AVE and Pearson’s correlation
In-store food-buying practices M SD Factor loadings AVE CR Cronbach’s
α Pearson’s correlation
1 2 3 4 5 6 Price comparisons Compare prices for same type of food products (1) 1.90 1.049 0.859
0.731 0.942 0.926
1.000
Buy a cheaper food brand (2) 1.95 1.062 0.886 0.727* 1.000 Compare prices of food brands (3) 1.76 1.033 0.924 0.797* 0.791* 1.000
Look for cheapest food brand (4) 1.99 1.019 0.846 0.629* 0.727* 0.732* 1.000
Consider the price difference (5) 1.93 0.983 0.805 0.642* 0.589* 0.727* 0.610* 1.000 Purchase the cheapest food brand (6) 2.27 1.011 0.805 0.589* 0.713* 0.644* 0.658* 0.557* 1.000 Avoidance of impulse purchases Only buy planned food products (1) 2.20 1.097 0.949
0.782 0.955 0.944
1.000 Consider if a food product on special is needed (2) 2.24 1.090 0.936 0.929* 1.000
Resist buying unplanned food products (3) 2.24 1.083 0.920 0.886* 0.875* 1.000 Only buy food products intended (4) 2.46 1.018 0.827 0.719* 0.699* 0.717* 1.000 Avoid buying appealing or tempting food products (5) 2.68 1.006 0.760 0.636* 0.634* 0.598* 0.588* 1.000
Only purchase food products on list (6) 2.35 1.094 0.898 0.833* 0.819* 0.794* 0.667* 0.592* 1.000
* Correlation is significant at the 0.01 level (2-tailed)

10
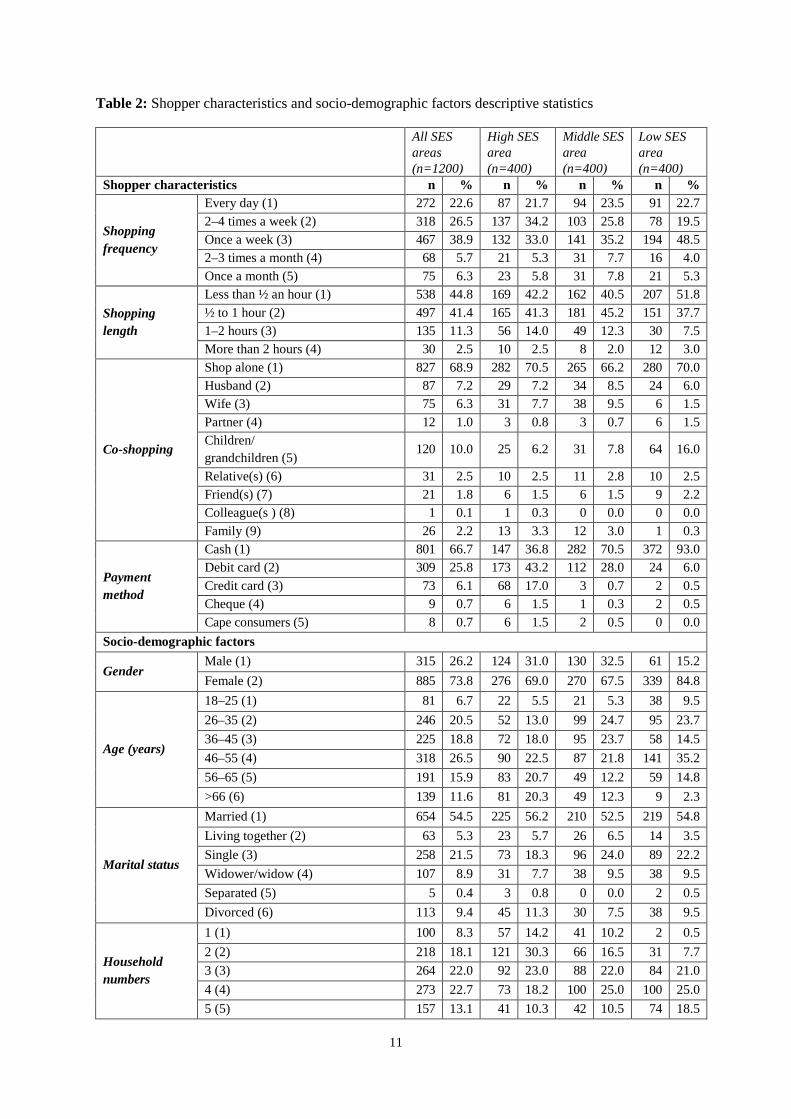
The convergent validity of the compare prices and the avoidance of impulse purchases constructs was tested by calculating the average variance extracted (AVE). The AVE of the compare prices and avoidance of impulse purchases constructs were greater than 0.7 (Table 1), which is suggestive of robust convergent validity. Discriminant validity was evaluated by utilising the AVE of the constructs, which should be larger than squared correlations between the constructs (Bagozzi and Yi 2012, 8–34). The AVE values of the compare prices and avoidance of impulse purchases constructs (Table 1) were larger than the squared correlation score (0.038), thereby confirming discriminant validity. Pearson’s correlation coefficient analyses also displayed a strong positive relationship (r > 0.5) for all of the items in the “compare prices” and “avoidance of impulse purchases” constructs, which is indicative of a general convergence of responses (Table 1). Results The education level, employment status and monthly household income descriptive statistics were representative of the three SES regions (Table 2). Over half (54%) of the respondents in the high SES region specified that they had obtained a post-matric diploma or certificate, degree or post-graduate degree compared to a majority (75.4%) of the middle SES region respondents, who indicated that they had completed Grade 12 or less. Most of the low SES region respondents (81.2%) indicated that they had completed Grade 11 or less. The larger percentage of the high (47.7%), middle (55.2%) and low (37.7%) SES regions specified that they were employed on a full-time basis. However, there was a discernible difference regarding the unemployment levels in each region, with the high SES region displaying the lowest levels (2.0%) in comparison to the middle (6.2%) and low (22.8%) SES regions. More (14.3%) respondents in the high SES region, compared to the middle (5.1%) and low (2%) SES regions, indicated that they were self-employed. The monthly household income for a majority (65%) of respondents in the high SES region was located in the higher income categories (R12 801 upward). In the middle SES region, most (77.5%) respondents’ monthly household income was located in the lower to middle income groupings (from R801 to R12 800), whereas seven out of 10 respondents in the low SES region indicated that their average monthly household income was less than R3 200.
11
Table 2: Shopper characteristics and socio-demographic factors descriptive statistics
All SES areas (n=1200)
High SES area (n=400)
Middle SES area (n=400)
Low SES area (n=400)
Shopper characteristics n % n % n % n %
Shopping frequency
Every day (1) 272 22.6 87 21.7 94 23.5 91 22.7 2–4 times a week (2) 318 26.5 137 34.2 103 25.8 78 19.5 Once a week (3) 467 38.9 132 33.0 141 35.2 194 48.5 2–3 times a month (4) 68 5.7 21 5.3 31 7.7 16 4.0 Once a month (5) 75 6.3 23 5.8 31 7.8 21 5.3
Shopping length
Less than ½ an hour (1) 538 44.8 169 42.2 162 40.5 207 51.8 ½ to 1 hour (2) 497 41.4 165 41.3 181 45.2 151 37.7 1–2 hours (3) 135 11.3 56 14.0 49 12.3 30 7.5 More than 2 hours (4) 30 2.5 10 2.5 8 2.0 12 3.0
Co-shopping
Shop alone (1) 827 68.9 282 70.5 265 66.2 280 70.0 Husband (2) 87 7.2 29 7.2 34 8.5 24 6.0 Wife (3) 75 6.3 31 7.7 38 9.5 6 1.5 Partner (4) 12 1.0 3 0.8 3 0.7 6 1.5 Children/ grandchildren (5)
120 10.0 25 6.2 31 7.8 64 16.0
Relative(s) (6) 31 2.5 10 2.5 11 2.8 10 2.5 Friend(s) (7) 21 1.8 6 1.5 6 1.5 9 2.2 Colleague(s ) (8) 1 0.1 1 0.3 0 0.0 0 0.0 Family (9) 26 2.2 13 3.3 12 3.0 1 0.3
Payment method
Cash (1) 801 66.7 147 36.8 282 70.5 372 93.0 Debit card (2) 309 25.8 173 43.2 112 28.0 24 6.0 Credit card (3) 73 6.1 68 17.0 3 0.7 2 0.5 Cheque (4) 9 0.7 6 1.5 1 0.3 2 0.5 Cape consumers (5) 8 0.7 6 1.5 2 0.5 0 0.0
Socio-demographic factors
Gender Male (1) 315 26.2 124 31.0 130 32.5 61 15.2 Female (2) 885 73.8 276 69.0 270 67.5 339 84.8
Age (years)
18–25 (1) 81 6.7 22 5.5 21 5.3 38 9.5 26–35 (2) 246 20.5 52 13.0 99 24.7 95 23.7 36–45 (3) 225 18.8 72 18.0 95 23.7 58 14.5 46–55 (4) 318 26.5 90 22.5 87 21.8 141 35.2 56–65 (5) 191 15.9 83 20.7 49 12.2 59 14.8 >66 (6) 139 11.6 81 20.3 49 12.3 9 2.3
Marital status
Married (1) 654 54.5 225 56.2 210 52.5 219 54.8 Living together (2) 63 5.3 23 5.7 26 6.5 14 3.5 Single (3) 258 21.5 73 18.3 96 24.0 89 22.2 Widower/widow (4) 107 8.9 31 7.7 38 9.5 38 9.5 Separated (5) 5 0.4 3 0.8 0 0.0 2 0.5 Divorced (6) 113 9.4 45 11.3 30 7.5 38 9.5
Household numbers
1 (1) 100 8.3 57 14.2 41 10.2 2 0.5 2 (2) 218 18.1 121 30.3 66 16.5 31 7.7 3 (3) 264 22.0 92 23.0 88 22.0 84 21.0 4 (4) 273 22.7 73 18.2 100 25.0 100 25.0 5 (5) 157 13.1 41 10.3 42 10.5 74 18.5

12
6+ (6) 188 15.7 16 4.0 63 15.8 109 27.3
Education level
Grade 1–7 (1) 131 10.9 7 1.7 40 10.0 84 21.0 Grade 8–11 (2) 452 37.6 56 14.0 155 38.7 241 60.2 Grade 12 (3) 296 24.7 121 30.3 107 26.7 68 17.0 Post-matric diploma or certificate (4) 162 13.5 102 25.5 58 14.5 2 0.5 Degree (5) 98 8.2 65 16.2 33 8.3 0 0.0 Post-graduate degree (6) 61 5.1 49 12.3 7 1.8 5 1.3
Employment status
Employed (full-time) (1) 563 46.9 191 47.7 221 55.2 151 37.7 Employed (part-time) (2) 82 6.8 27 6.7 26 6.5 29 7.3 Self-employed (3) 85 7.1 57 14.3 20 5.1 8 2.0 Unemployed (looking for work) (4) 73 6.1 5 1.3 18 4.5 50 12.5 Unemployed (not looking for work) (5) 51 4.2 3 0.7 7 1.7 41 10.3 Housewife/homemaker (6) 129 10.8 24 6.0 31 7.8 74 18.5 Pensioner/retired (7) 187 15.5 86 21.5 67 16.7 34 8.5 Student (8) 21 1.8 7 1.8 6 1.5 8 2.0 Not working – other (9) 9 0.8 0 0.0 4 1.0 5 1.2
Population group
Black African (1) 134 11.2 24 6.0 70 17.5 40 10.0 Coloured (2) 804 67.0 134 33.5 312 78.0 358 89.5 Indian/Asian (3) 15 1.2 11 2.8 3 0.8 1 0.2 White (4) 238 19.8 227 56.7 10 2.5 1 0.3 Other (5) 9 0.8 4 1.0 5 1.2 0 0.0
Monthly household income
Less than R800 (1) 63 5.3 2 0.5 9 2.3 52 13.0 R801–R3 200 (2) 356 29.7 28 7.0 100 25.0 228 57.0 R3 201–R6 400 (3) 241 20.0 43 10.7 116 29.0 82 20.5 R6 401–R12 800 (4) 190 15.8 67 16.8 94 23.5 29 7.2 R12 801–R25 600 (5) 183 15.3 115 28.7 61 15.2 7 1.8 R25 601–R51 200 (6) 105 8.7 86 21.5 17 4.2 2 0.5 R51 201+ (7) 62 5.2 59 14.8 3 0.8 0 0.0
Influence of SES Regions on In-store Food-buying Practices (Price Comparisons and Avoidance of Impulse Purchases) The Wald’s Chi-Square distribution revealed that there were significant differences at p<0.001 for both in-store food-buying practices, namely price comparisons (M = 1.97, SD = 0.877) and avoidance of impulse purchases (M = 2.36, SD = 0.941) owing to the three SES regions. The Bonferroni correction pairwise comparisons showed significant differences between the SES regions as follows:
• High SES region respondents (M = 2.22, SE = 0.50) showed a lower tendency to compare prices than middle (M = 1.91, SE = 0.38) and low (M = 1.77, SE = 0.38) SES region respondents (Table 3).
• Respondents within the low SES region (M = 2.22, SE = 0.47) displayed a larger inclination to avoid impulse buying compared to the middle (M = 2.43, SE = 0.43) and high (M = 2.44, SE = 0.50) SES region respondents (Table 3).

13
Table 3: Influence of SES regions on in-store food-buying practices
Price comparisons M SE p High SES area (1) 2.22 0.50 0.000*
(1) – (2)A (1) – (3) A
Middle SES area (2) 1.91 0.38 Low SES area (3) 1.77 0.39 Avoidance of impulse purchases High SES area (1) 2.44 0.50 0.000*
(1) – (3) A (2) – (3) A
Middle SES area (2) 2.43 0.43 Low SES area (3) 2.22 0.47
* Wald Chi-square test showed a significant difference at p<0.001 * A Bonferroni correction pairwise comparisons mean difference is significant at the 0.001 level
In-store Food-buying Practices’ Association with Shopping Characteristics No significant differences were established for shopping frequency price comparisons and avoidance of impulse purchases in any of the SES regions. The Bonferroni correction pairwise comparisons showed significant differences between the following elements (Tables 4 and 5):
• Shopping length: Respondents in the middle SES region who indicated that they took less than half an hour (M = 2.36, SE = 0.27) showed a significantly (p<0.001) lower inclination to compare prices than those who indicated that they took half an hour to one hour (M = 2.07, SE = 0.26) and one to two hours (M = 1.95, SE = 0.26) to shop for food (Table 4).
• Co-shopping: Respondents in all SES regions who shopped alone (M = 2.08, SE = 0.15) had a significantly (p<0.05) lower predisposition to compare prices in comparison to those who shopped with their wives (M = 1.89, SE = 0.18) or with their children/grandchildren (M = 2.03, SE = 0.16) (Table 4). Respondents in the low SES region who shopped alone (M = 1.60, SE = 0.46) displayed a significantly (p<0.001) lower propensity to avoid impulse purchases compared to those who shopped with their husbands (M = 2.59, SE = 0.48) (Table 5).
• Payment method: Respondents in all SES regions who paid with a debit card (M = 2.40, SE = 0.17) had a significantly (p<0.05) lower tendency to avoid impulse buying than those who paid by means of cash (M = 2.18, SE = 0.16) (Table 5). The aforementioned result was replicated for both the low (M = 2.34, SE = 0.46) and middle (M = 2.45, SE = 0.21) SES region respondents who paid by means of a debit card, and were also found to have a significantly (p<0.05) lower inclination to avoid impulse purchases in comparison to those who paid with cash in the low (M = 1.71, SE = 0.43) and the middle (M = 2.28, SE = 0.20) SES region (Table 5).

14
Table 4: Influence of shopping characteristics on price comparisons
All SES areas (n=1200) High SES area (n=400) Middle SES area (n=400) Low SES area (n=400) Shopper characteristics M SE p M SE p M SE p M SE p Shopping frequency
Every day (1) 2.02 0.18
0.350
2.36 0.31
0.363
2.03 0.27
0.64
1.46 0.41
0.849 2–4 times a week (2) 1.95 0.18 2.18 0.29 2.10 0.27 1.43 0.41 Once a week (3) 2.04 0.17 2.41 0.29 2.14 0.27 1.44 0.41 2–3 times a month (4) 1.95 0.19 2.20 0.33 1.95 0.30 1.47 0.44 Once a month (5) 2.14 0.19 2.36 0.33 2.13 0.29 1.65 0.43
Shopping length
Less than ½ an hour (1) 2.14 0.17
0.115
2.38 0.28
0.112
2.36 0.27 0.001*
(2 & 3) – (1)A
1.47 0.41
0.619 ½ to 1 hour (2) 2.06 0.17 2.44 0.28 2.07 0.26 1.49 0.41 1–2 hours (3) 2.11 0.18 2.58 0.29 1.95 0.26 1.65 0.42 More than 2 hours (4) 1.77 0.23 1.80 0.42 1.90 0.37 1.35 0.45
Co-shopping Shop alone (1) 2.08 0.15
0.044** (3 & 5) – (1)B
2.35 0.26
0.264
2.12 0.26
0.944 0.765
1.71 0.40
0.106
Husband (2) 1.91 0.17 1.95 0.33 2.24 0.28 1.57 0.42 Wife (3) 1.89 0.18 2.06 0.32 1.99 0.28 2.28 0.52 Partner (4) 1.59 0.29 1.88 0.66 1.84 0.52 1.26 0.48 Children/ grandchildren (5)
2.03 0.16 2.39 0.29 2.15 0.28 1.59 0.42
Relative(s) (6) 1.71 0.20 1.93 0.39 2.07 0.34 1.31 0.46 Friend(s) (7) 1.82 0.23 2.30 0.46 1.99 0.40 1.29 0.47 Colleague(s ) (8) 3.12 0.86 3.30 0.99 0.00 0.00 0.00 0.00 Family (9) 2.04 0.22 2.54 0.37 2.16 0.33 .90 0.84
Payment method
Cash (1) 1.98 0.15
0.321
2.30 0.26
0.465
1.83 0.18
0.572
1.52 0.37
0.286 Debit card (2) 1.99 0.15 2.32 0.27 1.88 0.18 1.21 0.40 Credit card (3) 1.91 0.18 2.25 0.28 2.15 0.46 1.31 0.66 Cheque (4) 1.71 0.31 1.82 0.47 1.94 0.75 1.93 0.69 Cape consumers (5) 2.51 0.33 2.82 0.47 2.55 0.55 0.00 0.00
* Wald Chi-square test showed a significant difference at p<0.001 ** Wald Chi-square test showed a significant difference at p<0.05 A Bonferroni correction pairwise comparisons mean difference is significant at the 0.001 level B Bonferroni correction pairwise comparisons mean difference is significant at the 0.05 level

15
Table 5: Influence of shopping characteristics on avoidance of impulse purchases
All SES areas (n=1200) High SES area (n=400) Middle SES area (n=400) Low SES area (n=400) Shopper characteristics M SE p M SE p M SE p M SE p Shopping frequency
Every day (1) 2.30 0.19
0.174
2.02 0.32
0.189
3.12 0.30
0.874
1.50 0.47
0.261 2–4 times a week (2) 2.43 0.19 2.26 0.31 3.03 0.30 1.77 0.46
Once a week (3) 2.31 0.19 2.04 0.31 3.06 0.30 1.58 0.47
2–3 times a month (4) 2.50 0.21 2.36 0.34 3.19 0.33 1.62 0.50
Once a month (5) 2.28 0.21 1.98 0.34 3.03 0.33 1.37 0.49
Shopping length
Less than ½ an hour (1) 2.44 0.19
0.356
2.10 0.29
0.204
3.25 0.30
0.239
1.77 0.47
0.066 ½ to 1 hour (2) 2.36 0.19 2.00 0.29 3.08 0.29 1.82 0.47
1–2 hours (3) 2.43 0.20 2.33 0.30 3.01 0.30 1.51 0.48
More than 2 hours (4) 2.22 0.25 2.09 0.43 3.01 0.41 1.18 0.51
Co-shopping Shop alone (1) 2.46 0.16
0.134
2.31 0.27
0.781
3.19 0.29
0.944 0.765
1.60 0.46
0.000* (2) – (1)A
Husband (2) 2.65 0.19 2.06 0.35 3.09 0.32 2.59 0.48
Wife (3) 2.31 0.19 2.05 0.33 3.02 0.31 1.41 0.59
Partner (4) 1.78 0.32 1.92 0.69 2.62 0.58 0.96 0.55
Children/ grandchildren (5)
2.40 0.18 2.40 0.30 3.16 0.32 1.45 0.48
Relative(s) (6) 2.33 0.22 2.04 0.41 3.03 0.38 1.61 0.53
Friend(s) (7) 2.59 0.25 1.94 0.48 3.58 0.45 1.82 0.54
Colleague(s ) (8) 2.44 0.95 2.25 1.03 0.00 0.00 0.00 0.00
Family (9) 2.32 0.24 2.21 0.38 3.02 0.37 1.11 0.97
Payment method
Cash (1) 2.18 0.16
0.021** (1) – (2)B
2.09 0.27
0.279
2.28 0.20
0.004** (1) – (2)B
1.71 0.43
0.007** (1) – (2)B
Debit card (2) 2.40 0.17 2.32 0.28 2.45 0.21 2.34 0.46
Credit card (3) 2.30 0.20 2.17 0.29 2.92 0.52 1.19 0.75
Cheque (4) 2.16 0.35 1.77 0.49 4.07 0.84 1.03 0.79
Cape consumers (5) 2.78 0.36 2.32 0.49 3.73 0.61 0.00 0.00
* Wald Chi-square test showed a significant difference at p<0.001 ** Wald Chi-square test showed a significant difference at p<0.05 A Bonferroni correction pairwise comparisons mean difference is significant at the 0.001 level B Bonferroni correction pairwise comparisons mean difference is significant at the 0.05 level

16
In-store Food-buying Practices’ Association with Socio-Demographic Factors No significant differences were established for age and education level for price comparisons and avoidance of impulse purchases in any of the SES regions. The Bonferroni correction pairwise comparisons showed significant differences between the following elements (Tables 6 and 7): • Gender: Female respondents (M = 1.63, SE = 0.41) in the low SES region exhibited a
significantly (p<0.05) lower predisposition to compare prices than male respondents (M = 1.35, SE = 0.41) (Table 6). Additionally, female respondents in all SES regions (M = 2.45, SE = 0.19) and the middle SES region (M = 3.28, SE = 0.30) also displayed a significantly (p<0.05 and p<0.001, respectively) lower propensity to avoid impulse buying in comparison to male respondents in all SES regions (M = 2.28, SE = 0.19) and the middle (M = 2.89, SE = 0.30) SES region (Table 7).
• Household numbers: Households with two members in all (M = 2.09, SE = 0.18) and the high (M = 2.47, SE = 0.29) SES region showed a significantly (p<0.05) lower tendency to compare prices than households with five members in all (M = 1.80, SE = 0.18) and the high (M = 2.01, SE = 0.31) SES region (Table 6).
• Employment status: Self-employed respondents (M = 2.15, SE = 0.19) in all SES regions exhibited a significantly (p<0.001) lower propensity to compare prices than employed (full-time) (M = 1.89, SE = 0.17), employed (part-time) (M = 1.95, SE = 0.19), unemployed (looking for work) (M = 1.91, SE = 0.19) and housewife/homemaker respondents (M = 1.88, SE = 0.18) (Table 6).
• Population group: Black respondents (M = 1.98, SE = 0.33) in the high SES region showed a significantly (p<0.05) larger tendency to compare prices in comparison to coloured (M = 2.42, SE = 0.27) and white respondents (M = 2.08, SE = 0.26).
• Monthly household income: Respondents in all SES regions with monthly household incomes of R25 601–R51 200 (M = 2.29, SE = 0.19) and R51 200+ (M = 2.44, SE = 0.21) displayed a significantly (p<0.001) lower predisposition to compare prices than those with monthly incomes of less than R800 (M = 1.57, SE = 0.20), R801–R3 200 (M = 1.87, SE = 0.18) and R3 201–R6 400 (M = 1.87, SE = 0.18) (Table 6). Respondents in the high SES region with a monthly household income of R51 200+ (M = 2.86, SE = 0.31) exhibited a significantly (p<0.05) lower inclination to compare prices than those with a monthly income of R3 201–R6 400 (M = 2.33, SE = 0.31) and R12 801–R25 600 (M = 2.38, SE = 0.28) (Table 6). Additionally, respondents in the low SES region with a monthly household income of R6 401–R12 800 (M = 1.82, SE = 0.43) showed a significantly (p<0.05) lower propensity to compare prices compared to those with a monthly income of less than R800 (M = 1.27, SE = 0.42) (Table 6). Furthermore, respondents in all SES regions resulted in analogous findings to the aforementioned in-store food-buying practice, since those with a monthly household income of R51 200+ (M = 2.66, SE = 0.23) displayed a significantly (p<0.001) lower propensity to avoid impulse purchases in comparison to those with monthly incomes of less than R800 (M = 2.10, SE = 0.22) and R801–R3 200 (M = 2.24, SE = 0.20) (Table 7).

17
Table 6: Influence socio-demographic characteristics on price comparisons
All SES areas (n=1200) High SES area (n=400) Middle SES area (n=400) Low SES area (n=400) Socio-demographic characteristics M SE p M SE p M SE p M SE p Gender Male (1) 2.06 0.17
0.166 2.44 0.29
0.054 2.12 0.27
0.286 1.35 0.41 0.018**
(1)–(2)B Female (2) 1.98 0.17 2.17 0.28 2.02 0.27 1.63 0.41
Age (years) 18–25 (1) 1.99 0.20
0.171
2.13 0.35
0.127
1.88 0.31
0.739
1.56 0.42
0.085
26–35 (2) 2.16 0.18 2.53 0.32 2.16 0.27 1.58 0.40
36–45 (3) 1.98 0.18 2.11 0.30 2.06 0.27 1.54 0.41
46–55 (4) 2.06 0.18 2.42 0.30 2.12 0.28 1.43 0.41
56–65 (5) 1.96 0.18 2.39 0.30 2.06 0.28 1.17 0.42
>66 (6) 1.96 0.20 2.22 0.31 2.13 0.32 1.65 0.48
Marital status Married (1) 1.99 0.16
0.496
2.05 0.27
0.446
2.00 0.27
0.755
1.64 0.39
0.346
Living together (2) 2.16 0.19 2.42 0.32 2.14 0.29 1.41 0.46
Single (3) 2.07 0.16 2.30 0.28 2.12 0.27 1.62 0.40
Widower/widow (4) 1.89 0.18 2.21 0.33 2.00 0.28 1.34 0.41
Separated (5) 2.01 0.41 2.70 0.63 0.00 0.00 1.31 0.66
Divorced (6) 2.00 0.18 2.13 0.30 2.09 0.30 1.61 0.41
Household numbers
1 (1) 2.12 0.20
0.002** (5)–(2)B
2.35 0.32
0.019** (5)–(2)B
2.06 0.29
0.304
1.72 0.70
0.189
2 (2) 2.09 0.18 2.47 0.29 2.12 0.27 1.54 0.41
3 (3) 1.94 0.17 2.19 0.28 2.13 0.27 1.35 0.40
4 (4) 2.12 0.18 2.59 0.31 2.15 0.27 1.54 0.40
5 (5) 1.80 0.18 2.01 0.31 1.84 0.28 1.28 0.40
6+ (6) 2.04 0.18 2.20 0.36 2.13 0.27 1.50 0.40
Education level Grade 1–7 (1) 2.04 0.19
0.167
2.55 0.47
0.127
1.97 0.29
0.797
1.69 0.41
0.052
Grade 8–11 (2) 1.90 0.18 2.04 0.30 1.96 0.27 1.46 0.40
Grade 12 (3) 2.05 0.18 2.37 0.29 2.09 0.27 1.54 0.41
Post-matric diploma or certificate (4)
2.11 0.18 2.46 0.29 2.15 0.28 0.72 0.67
Degree (5) 2.01 0.19 2.19 0.29 2.13 0.28 0.00 0.00
Post-graduate degree (6) 2.03 0.20 2.19 0.30 2.12 0.39 2.02 0.50

18
Employment status
Employed (full-time) (1) 1.89 0.17
0.001* (1, 2, 4 & 6)
– (3)A
2.07 0.28
0.143
1.85 0.26
0.242
1.51 0.39
0.350
Employed (part-time) (2) 1.95 0.19 1.86 0.32 2.16 0.30 1.66 0.42
Self-employed (3) 2.15 0.19 2.37 0.30 2.05 0.30 1.42 0.48
Unemployed (looking for work) (4)
1.91 0.19 2.59 0.50 2.18 0.31 1.34 0.42
Unemployed (not looking for work) (5)
2.15 0.20 3.04 0.61 1.84 0.38 1.72 0.42
Housewife/homemaker (6) 1.88 0.18 1.98 0.34 1.86 0.29 1.45 0.42
Pensioner/retired (7) 2.11 0.19 2.25 0.31 2.12 0.30 1.68 0.43
Student (8) 2.05 0.25 2.25 0.46 2.38 0.41 1.26 0.48
Not working – other (9) 2.08 0.32 0.00 0.00 2.20 0.45 1.37 0.53
Population group
Black African (1) 2.05 0.18
0.096
1.98 0.33
0.028** (1) – (2 & 4)B
2.20 0.26
0.391
1.41 0.31
0.887 Coloured (2) 2.13 0.16 2.42 0.27 2.21 0.25 1.37 0.29
Indian/Asian (3) 2.07 0.26 2.32 0.38 1.78 0.49 1.23 0.81
White (4) 1.88 0.17 2.08 0.26 2.45 0.34 1.94 0.86
Other (5) 1.97 0.32 2.70 0.56 1.71 0.40 0.00 0.00
Monthly household income
Less than R800 (1) 1.57 0.20
0.000* (1, 2 & 3) –
(6 & 7)A
1.10 0.77
0.020** (3 & 5)–(7)B
1.86 0.36
0.162
1.27 0.42
0.024** (1)–(4)B
R801–R3 200 (2) 1.87 0.18 2.41 0.31 1.85 0.27 1.57 0.41
R3 201–R6 400 (3) 1.87 0.18 2.33 0.31 1.87 0.27 1.54 0.42
R6 401–R12 800 (4) 2.02 0.18 2.33 0.30 2.07 0.27 1.82 0.43
R12 801–R25 600 (5) 2.08 0.18 2.38 0.28 2.10 0.27 2.01 0.49
R25 601–R51 200 (6) 2.29 0.19 2.70 0.30 2.31 0.31 0.72 0.68
R51 201+ (7) 2.44 0.21 2.86 0.31 2.42 0.51 0.00 0.00
* Wald Chi-square test showed a significant difference at p<0.001 ** Wald Chi-square test showed a significant difference at p<0.05 A Bonferroni correction pairwise comparisons mean difference is significant at the 0.001 level B Bonferroni correction pairwise comparisons mean difference is significant at the 0.05 level

19
Table 7: Influence socio-demographic characteristics on avoidance of impulse purchases
All SES areas (n=1200) High SES area (n=400) Middle SES area (n=400) Low SES area (n=400) Socio-demographic characteristics M SE p M SE p M SE p M SE p Gender Male (1) 2.28 0.19 0.020**
(1)–(2)B 2.09 0.30
0.467 2.89 0.30 0.000*
(1)–(2)A 1.50 0.47
0.278 Female (2) 2.45 0.19 2.18 0.29 3.28 0.30 1.64 0.46
Age (years) 18–25 (1) 2.37 0.22
0.946
2.06 0.36
0.167
2.79 0.35
0.068
1.75 0.49
0.688
26–35 (2) 2.33 0.20 1.90 0.33 3.23 0.31 1.58 0.46
36–45 (3) 2.37 0.20 2.06 0.31 3.37 0.31 1.43 0.47
46–55 (4) 2.38 0.20 2.27 0.31 3.26 0.31 1.54 0.47
56–65 (5) 2.32 0.20 2.09 0.31 3.01 0.32 1.48 0.48
>66 (6) 2.41 0.21 2.41 0.33 2.87 0.36 1.62 0.56
Marital status Married (1) 2.25 0.18
0.323
1.99 0.28
0.481
3.03 0.30
0.184
1.55 0.45
0.068
Living together (2) 2.51 0.21 2.21 0.33 3.32 0.33 1.43 0.53
Single (3) 2.35 0.18 2.07 0.29 2.94 0.30 1.84 0.46
Widower/widow (4) 2.38 0.19 2.30 0.34 2.90 0.32 1.78 0.47
Separated (5) 2.30 0.45 2.37 0.65 0.00 0.00 0.89 0.75
Divorced (6) 2.39 0.20 1.87 0.31 3.24 0.33 1.92 0.47
Household numbers
1 (1) 2.31 0.21
0.211
2.26 0.33
0.647
2.94 0.33
0.404
1.98 0.80
0.069
2 (2) 2.42 0.19 2.25 0.30 3.14 0.30 1.58 0.47
3 (3) 2.28 0.19 2.19 0.29 2.98 0.31 1.29 0.46
4 (4) 2.31 0.20 2.04 0.32 3.09 0.31 1.40 0.45
5 (5) 2.49 0.20 2.20 0.32 3.10 0.32 1.73 0.46
6+ (6) 2.37 0.20 1.86 0.38 3.27 0.31 1.43 0.46
Education level Grade 1–7 (1) 2.24 0.21
0.272
2.21 0.49
0.872
3.30 0.32
0.329
1.50 0.47
0.217
Grade 8–11 (2) 2.41 0.19 1.98 0.31 3.20 0.30 1.74 0.46
Grade 12 (3) 2.34 0.19 2.12 0.30 3.19 0.30 1.57 0.47
Post-matric diploma or certificate (4)
2.36 0.20 2.13 0.30 3.10 0.31 1.41 0.77
Degree (5) 2.52 0.21 2.25 0.31 3.25 0.32 0.00 0.00
Post-graduate degree (6) 2.33 0.22 2.11 0.31 2.48 0.43 1.61 0.58

20
Employment status
Employed (full-time) (1) 2.25 0.18
0.272
2.09 0.29
0.128
2.81 0.29
0.273
1.52 0.45
0.525
Employed (part-time) (2) 2.32 0.21 2.20 0.33 2.79 0.34 1.67 0.48
Self-employed (3) 2.44 0.21 2.30 0.31 3.01 0.34 1.63 0.54
Unemployed (looking for work) (4)
2.36 0.21 2.77 0.52 3.02 0.34 1.59 0.48
Unemployed (not looking for work) (5)
2.46 0.22 2.14 0.63 3.14 0.43 1.63 0.48
Housewife/homemaker (6) 2.30 0.20 1.84 0.35 2.80 0.32 1.64 0.48
Pensioner/retired (7) 2.11 0.21 1.74 0.33 3.15 0.33 1.32 0.49
Student (8) 2.20 0.27 1.98 0.47 3.49 0.46 1.10 0.55
Not working – other (9) 2.85 0.36 0.00 0.00 3.56 0.50 2.04 0.61
Population group
Black African (1) 2.44 0.20
0.278
2.32 0.34
0.211
3.17 0.29
0.642
1.54 0.36
0.336 Coloured (2) 2.55 0.18 2.45 0.28 3.12 0.28 1.81 0.34
Indian/Asian (3) 2.17 0.28 2.10 0.39 2.56 0.55 1.33 0.93
White (4) 2.42 0.19 2.25 0.27 3.39 0.38 1.60 0.98
Other (5) 2.24 0.35 1.54 0.58 3.20 0.45 0.00 0.00
Monthly household income
Less than R800 (1) 2.10 0.22
0.000* (1 & 2)–(7)A
1.42 0.80
0.095
2.78 0.40
0.052
1.35 0.48
0.837
R801–R3 200 (2) 2.24 0.20 2.54 0.32 2.78 0.30 1.46 0.47
R3 201–R6 400 (3) 2.32 0.20 1.98 0.32 3.02 0.30 1.47 0.48
R6 401–R12 800 (4) 2.35 0.20 2.11 0.31 3.03 0.30 1.58 0.50
R12 801–R25 600 (5) 2.44 0.20 2.14 0.29 3.28 0.30 1.82 0.56
R25 601–R51 200 (6) 2.44 0.21 2.26 0.31 2.94 0.35 1.73 0.78
R51 201+ (7) 2.66 0.23 2.49 0.32 3.78 0.57 0.00 0.00
* Wald Chi-square test showed a significant difference at p<0.001 ** Wald Chi-square test showed a significant difference at p<0.05 A Bonferroni correction pairwise comparisons mean difference is significant at the 0.001 level B Bonferroni correction pairwise comparisons mean difference is significant at the 0.05 level

21
Discussion The price comparisons in-store food-buying practice shows an increasing trend among the three different SES regions. The low SES region’s consumers show the largest inclination, and the high SES region’s consumers exhibit the lowest incidence of price comparisons. It is likely that the low SES region’s consumers characteristically have limited financial resources and are more price-sensitive and, therefore, it is essential to save money by comparing prices for the same type of food products, different food brands, and purchasing the cheapest food brands. Mittal (2016, 20–31) suggests that deal-prone consumers are price conscious and continually seek bargains by comparing prices; hence, it can be posited that respondents within the low and middle SES regions are more inclined to be deal-prone owing to their price sensitivity. The avoidance of impulse purchases regarding in-store food-buying practice displays an incremental trend among the three SES regions. The low SES region’s consumers exhibit the highest incidence of impulse buying avoidance, whereas the high SES region’s consumers show the lowest propensity of this in-store food-buying practice. It is conceivable that low SES region consumers commonly have limited funds and, hence, it is important to conserve resources by only buying planned food products, and avoiding the purchase of food products that are not necessities. Mittal (2016, 20–31) and Hampson and McGoldrick (2017, 404–414) confirm that consumers who have a low disposable income, are less likely to make impulse purchases and/or compare prices. The higher usage of price comparisons by consumers who spend longer time periods shopping for groceries could be as a result of consumers taking more time to compare prices. Hampson and McGoldrick (2017, 404–414) reveal that time-pressured consumers search less for price information in grocery stores. This may be because convenience is a higher priority than saving money, or because these consumers simply do not like the effort involved in finding the lowest prices (Hampson and McGoldrick 2017, 404–414; Machado et al. 2017, 381–388; Thiagarajan et al. 2009, 207–215). However, consumers who stay longer in the shop may be less time pressured and more likely to engage in food-buying practices such as price comparisons and impulse purchases (Bellini et al. 2017, 164–171; Geetha and Bharadhwaj 2016, 49–66). Consumers who shopped with their husbands were less susceptible to impulse purchases than when shopping alone. Couples in low SES regions most likely carefully plan what to buy on shopping trips owing to financial constraints. Lee and Kacen (2008, 265–272) found that consumers often decide not to make an impulse purchase after consulting a friend or family member. Luo (2005, 288–294) also asserts that co-shopping decreases the likelihood of impulse purchasing, whereas Geetha and Bharadhwaj (2016, 49–66) found that co-shopping had no influence on impulse purchases. Consumers who shopped alone were less likely to compare prices than when they were accompanied by their wives and children/grandchildren. It is probable that the co-shoppers would suggest purchase options, which would necessitate price comparisons. The concept of pester power is another well-known consumer behaviour concept, where

22
children/grandchildren play a major role in the accompanying adult’s purchase decisions, which necessitates the implementation of food-buying practices such as price comparison, most likely as a result of unplanned purchases (Mompei 2017, 5; Tariq et al. 2016, 574–584). Consumers who paid with a debit card were more likely to succumb to impulse purchases in comparison to those who paid by means of cash. The increasing use of debit cards as a payment method means that consumers are not restrained by the amount of cash that they have on them. This also reduces security risks of carrying large sums of cash (Arango and Taylor 2009, 1–23), and confirms the mandate for research regarding the payment method as a shopping characteristic (Geetha and Bharadhwaj 2016, 49–66). The use of debit cards results in a higher incidence of impulse purchases, since this payment method provides consumers with immediate access to “electronic” money at the point of purchase (Arango and Taylor 2009, 1–23). Male consumers in low SES regions were found to show a higher incidence of price comparisons than female consumers. It was previously found that men consider low prices to be an important criterion when purchasing products in comparison to women (Williams 2002, 249–276). Therefore, men displayed a higher propensity regarding external reference prices. Conversely, females show a greater predisposition in terms of internal reference prices, since they are already aware of the prices and availability of various brands. Therefore, female consumers may bypass the need to compare prices (i.e. external reference prices), since they usually perform the task of shopping for food and dominate decisions regarding what groceries to purchase when they shop for food (Flagg, Bisakha, Kilgore and Locher 2014, 2061–2070; Tariq et al. 2016, 574–584). Female consumers displayed a greater tendency to make impulse purchases in comparison to male consumers. It is also a fair notion that male consumers are less susceptible to impulse purchases in comparison to female consumers, who collectively spend more time in-store. Amos et al. (2014, 86–97), Chang et al. (2014, 289–314), Lucas and Koff (2014, 111–115) and Styvén et al. (2017, 416–431) concur that women have a higher tendency to shop impulsively compared to men, whereas Geetha and Bharadhwaj (2016, 49–66) found that gender had no influence on impulse purchases. However, women felt better and happy after impulse shopping, whereas most men felt regret (Chang et al. 2014, 289–314; Li et al. 2015, 191–209). The lower inclination of smaller households to use price comparisons is a rational supposition, as larger households commonly need to use several in-store food-buying practices to secure the best deal in a bid to save money, since larger households are likely to require a larger quantity and variety of products (Tariq et al. 2016, 574–584). Murthi and Rao (2012, 34–46) also established that large households tend to have a higher tendency to compare prices as a mechanism to save money. Self-employed consumers, who are more prevalent in high SES areas, are less likely to compare prices as they generally have less time and higher incomes than other employment groups, and do not feel the need to perform price comparisons (Mittal, 2016, 20–31; Sreeram, Kesharwani

23
and Desai, 2017, 107–132). Black consumers displayed a higher incidence of price comparisons. The black middle class has grown by more than 60 per cent over the last decade (an estimated 6 million people), but a quarter reported not to have sufficient food during the course of the year, which is unusual for the middle class segment. Furthermore, one in five of all South African households (predominantly black) did not have enough resources to purchase food, and the black population group also displayed the highest unemployment rate (almost 42%) among the different population groups, which would necessitate the increased use of in-store shopping practices such as price comparisons (Cooper 2018; Speckman and Anetos 2018, 11; Statistics South Africa 2016, 87–89; Statistics South Africa 2018, 39–40). The higher usage of in-store food-buying practices by lower monthly income households is because these consumers need to save money by making price comparisons and by avoiding impulse purchases. Mittal (2016, 20–31) revealed that high income consumers were not compelled to compare prices in order to save money, and more likely to make impulse purchases (Styvén et al. 2017, 416–431). As mentioned previously, lower-income households spend a larger percentage of their total income on food and, hence, are more price-sensitive owing to budget constraints, which necessitates the implementation of cost-saving measures (Hampson and McGoldrick 2017, 404–414; National Agricultural Marketing Council 2018, 1–32). Limitations and Further Research Directions This study considered two in-store food-buying practices, whereas future research could investigate other food-buying practices, which were identified by Harper and Crafford (2011). As described above, the frequency responses were coded as: 1 = Frequently; 2 = Sometimes; 3 = Seldom; and 4 = Never, which correspond with several studies (Herrmann and Warland 1990, 307–325; Mortimer 2012, 790–810; Smith and Carsky 1996, 73–80). However, other research allocated or coded contrastingly to aid a more rational interpretation of the mean values, since larger mean values would signify a higher tendency to use an in-store food-buying practice and vice versa. Although this study provided important insights into in-store grocery-shopping patterns and buying practices, it did not seek to examine reasons for variations regarding in-store food-shopping behaviour among consumers. Qualitative research would provide a deeper understanding of the reasons for consumers’ in-store food-buying shopping behaviour. Mortimer (2012, 790–810), Harris et al. (2017, 419–445), Tariq et al. 2016, 574–584 and Sreeram et al. (2017, 107–132) assert that shopper profiles and behaviour will change over time. This investigation used a cross-section of consumers’ in-store food-buying practices, whereas further research could consider price comparisons and avoidance of impulse purchases over an extended period of time via a longitudinal approach. The in-store buying practices of all potential household members were not investigated, since only the primary decision-makers were eligible to participate in the study. Hence, further inquiry could investigate all decision-makers and shoppers. Online food shopping is expected

24
to gather a substantial share of the retail market in future (Benn, Webb, Chang and Reidy 2015, 265–273; Harris et al. 2017, 419–445; Sreeram et al. 2017, 107–132; Styvén et al. 2017, 416–431). Therefore, the use of online food-buying practices should also be investigated in further research, which will assist to establish the extent of the physical retail environment and atmosphere, as well as other in-store marketing tactics and their influence on in-store food-buying practices. This inquiry only considers urban shoppers, whereas further investigation could be conducted in rural regions to establish possible differences regarding in-store food-buying practices in comparison to urban regions.
Conclusions and Implications The low SES region consumers exhibited the largest predisposition of comparing prices as an in-store food-buying practice. Food manufacturers, marketers and retailers should facilitate this process by ensuring that low-priced food products are prominently displayed in-store. They should also explore the increased use of online, mobile and other digital platforms, especially in low SES region outlets. The use of online and mobile platforms reduces impulse purchases and facilitates price comparisons via digital flyers, online price comparisons, mobile apps, digital shopping lists and other digital interactive conduits (Bellini et al. 2017, 164–171; Garcia, 2018; Harris et al. 2017, 419–445; Mittal 2016, 20–31). The high SES region consumers showed the largest susceptibility in making impulse purchases. Food manufacturers, marketers and retailers should ensure that common impulse-purchase food products in high SES regions are conspicuously displayed in these outlets. It can be concluded that consumers who spend increased lengths of time shopping, have a larger inclination to compare prices. Retailers should create shopping environments and atmospheres that encourage consumers to shop for longer periods of time (for example, free Wi-Fi and in-store coffee shops), which could have a positive impact on sales. Consumers who shop alone are less likely to compare prices and are more prone to impulse purchases in comparison to co-shoppers (Lee and Kacen 2008, 265–272; Mompei 2017, 5; Tariq et al. 2016, 574–584). Accordingly, retailers should boldly display prices to facilitate price comparisons among co-shoppers, as well as increase the use of mobile and digital conduits. However, they should also ensure that commonly purchased impulse food products are prominently displayed in-store for lone shoppers. Consumers who use debit cards are more prone to impulse purchases. Therefore, discerning retailers should ensure that they boldly promote and display whether they accept debit card payments, which may result in a higher turnover as a result of impulse purchases. It can be concluded that female consumers are more prone to impulse purchases and less likely to compare prices in low SES regions. Food manufacturers, marketers and retailers should ensure that they promote price deals to facilitate price comparisons and increase the use of mobile and digital channels. They should also conspicuously promote high impulse goods to take advantage of female consumers’ favourable predisposition. Larger households are more inclined to use price comparisons. Food manufacturers, marketers and retailers should boldly display discount deals to facilitate price comparisons among these consumer groups. South African retailers should consider the increased use of such online digital platforms, which will

25
enable easy price-checking across employment groups, since the majority of South Africans own mobile devices and two-thirds of South African internet browsers come from mobile devices (Duffett 2016, 1–21; Du Plessis 2018). However, food manufacturers, marketers and retailers should continue to distribute printed promotional catalogues, especially among consumers in low SES regions who show the greatest incidence of advertisement usage. Such printed advertising will facilitate price comparisons in the event that these consumers do not have access to online digital platforms or may have insufficient funds for data (Bellini et al. 2017, 164–171; Duffett and Foster 2017, 2880–2902).
References American Psychological Association. 2018. “Education and Socioeconomic Status.” Accessed 18
August 2018. http://www.apa.org/pi/ses/resources/publications/education.aspx. Amos, C., Holmes, G., and Keneson, W. 2014. “A Meta-Analysis of Consumer Impulse Buying.”
Journal of Retailing and Consumer Services 21 (2): 86–97. https://doi.org/10.1016/j.jretconser.2013.11.004.
Arango, C., and Taylor, V. 2009. “The Role of Convenience and Risk in Consumers’ Means of
Payment.” Discussion paper, Bank of Canada, Ottawa: 1–23. Bagozzi, R. P., and Yi, Y. 2012. “Specification, Evaluation, and Interpretation of Structural Equation
Models.” Journal of the Academy of Marketing Science 40 (1): 8–34. https://doi.org/10.1007/s11747-011-0278-x.
Bell, D. R., Corsten, D., and Knox, G. 2011. “From Point of Purchase to Path to Purchase: How
Preshopping Factors Drive Unplanned Buying.” Journal of Marketing 75: 31–45. https://doi.org/10.1509/jmkg.75.1.31.
Bellini, S., Cardinali, M. G., and Grandi, B. 2017. “A Structural Equation Model of Impulse Buying
Behaviour in Grocery.” Journal of Retailing and Consumer Services 36: 164–171. https://doi.org/10.1016/j.jretconser.2017.02.001.
Benn, Y., Webb, T. L., Chang, B. P. I., and Reidy, J. 2015. “What Information do Consumers
Consider, and how do they Look for it, when Shopping for Groceries Online?” Appetite 89: 265–273. https://doi.org/10.1016/j.appet.2015.01.025.
Bossuyt, S., Vermeir, I., Slabbinck, H., De Bock, T., and Van Kenhove, P. 2017. “The Compelling
Urge to Misbehave: Do Impulse Purchases Instigate Unethical Consumer Behavior?” Journal of Economic Psychology 58: 60–76. https://doi.org/10.1016/j.joep.2016.12.002.
Chang, H. J., Yan, R. N., and Eckman, M. 2014. “Moderating Effects of Situational Characteristics on
Impulse Buying.” International Journal of Retail and Distribution Management 42 (4): 289–314. https://doi.org/10.1108/IJRDM-04-2013-0074.
City of Cape Town. 2013a. “Census Suburb Delft.” Accessed 21 June 2016.
http://resource.capetown.gov.za/documentcentre/Documents/Maps%20and%20statistics/2011_Census_CT_Suburb_Delft_Profile.pdf.
City of Cape Town. 2013b. “Census Suburb Maitland.” Accessed 21 June 2016.
http://resource.capetown.gov.za/documentcentre/Documents/Maps%20and%20statistics/2011_Census_CT_Suburb_Maitland_Profile.pdf.

26
City of Cape Town. 2013c. “Census Suburb Meadowridge.” Accessed 21 June 2016.
http://resource.capetown.gov.za/documentcentre/Documents/Maps%20and%20statistics/2011_Census_CT_Suburb_Meadowridge_Profile.pdf.
Cooper, N. 2018. “Connecting with Ever-Connected, Ever-Younger African Consumers.” Accessed
18 August 2018. http://www.bizcommunity.com/Article/196/424/171671.html #more. Darmon, N., and Drewnowski, A. 2015. “Contribution of Food Prices and Diet Cost to
Socioeconomic Disparities in Diet Quality and Health: A Systematic Review and Analysis.” Nutrition Reviews 73 (10): 643–660. https://doi.org/10.1093/nutrit/nuv027.
Dhaundiyal, M., and Coughlan, J. 2016. “Investigating the Effects of Shyness and Sociability on
Customer Impulse Buying Tendencies.” International Journal of Retail and Distribution Management 44 (9): 923–939. https://doi.org/10.1108/IJRDM-12-2014-0166.
Dickson, P. R., and Sawyer, A. G. 1990. “The Price Knowledge and Search of Supermarket
Shoppers.” Journal of Marketing 54 (3): 42–53. https://doi.org/10.2307/1251815. Du Plessis, G. 2018. “Start Thinking in a ‘Mobile First’ Mindset.” Accessed 16 August 2018.
http://www.bizcommunity.com/Article/196/78/171706.html#more. Du, R. Y., and Kamakura, W. A. 2008. “Where Did all that Money Go? Understanding how
Consumers Allocate their Consumption Budget.” Journal of Marketing 72: 109–131. https://doi.org/10.1509/jmkg.72.6.109.
Duffett, R. G. 2016. “Effect of Instant Messaging Advertising on the Hierarchy-Of-Effects Model
Attitude Stages amid Teenagers in South Africa.” Electronic Journal of Information Systems in Developing Countries 72 (6): 1–21. https://doi.org/10.1002/j.1681-4835.2016.tb00523.x.
Duffett, R. G., and Foster, C. 2017. “Shopping List Development and Use of Advertisements’ Pre-
Store Food-Buying Practices within different Socio-Economic Status Areas in South Africa.” British Food Journal 119 (12): 2880–2902. https://doi.org/10.1108/BFJ-11-2016-0556.
Ellaway, A., and Macintyre, S. 2000. “Shopping for Food in Socially Contrasting Localities.” British
Food Journal 102 (1): 52–59. https://doi.org/10.1108/00070700010310632. Ferreira, M. O. C., Brandãob, M. M., and Bizarrias, F. S. 2017. “Understanding Consumer’s
Responses to Negative Emotions Related to Crowding on Satisfaction and Impulse Purchase in Retail: The Mediating Role of Coping.” Revista de Administração 52: 431–442. https://doi.org/10.1016/j.rausp.2017.08.005.
Flagg, L. A., Bisakha, S., Kilgore, M. L., and Locher. J. L. 2014. “The Influence of Gender, Age,
Education, and Household Size on Meal Preparation and Food Shopping Responsibilities.” Public Health Nutrition 17 (9): 2061–2070. https://doi.org/10.1017/S1368980013002267.
Food Marketing Institute. 2014. U.S. Grocery Shopping Trends 2014. Bellevue, WA: The Hartman
Group. Friedman, M., and Rees, J. 1988. “A Behavioural Science Assessment of Selected Principles of
Consumer Education.” Journal of Consumer Affairs 22 (2): 284–302. https://doi.org/10.1111/j.1745-6606.1988.tb00228.x.

27
Garcia, K. 2018. “Online Impulse Buys Get Lost in Translation.” Accessed 16 August 2018. https://retail.emarketer.com/article/online-impulse-buys-lost-translation/5b6ca29debd40005bc4dc75e?ecid=NL1014.
Geetha, M., and Bharadhwaj, S. 2016. “Impulse Buying Behavior in India: An Overview.” Asian
Journal of Business Research 6 (1): 49–66. https://doi.org/10.14707/ajbr.160021. Hampson, D. P. and McGoldrick, P. J. 2017. “Antecedents of Consumer Price Consciousness in a
Turbulent Economy.” International Journal of Consumer Studies 41: 404–414. https://doi.org/10.1111/ijcs.12344.
Harper, C., and Crafford, S. 2011. “A Comparison of 1993 and 2011 Consumers’ Use of
Recommended Food-Buying Practices at a Cape Town Supermarket.” Bachelor thesis, Cape Peninsula University of Technology, Cape Town.
Harris, P., Riley, F. D., Riley, D., and Hand, C. 2017. “Online and Store Patronage: A Typology of
Grocery Shoppers.” International Journal of Retail and Distribution Management 45 (4): 419–445. https://doi.org/10.1108/IJRDM-06-2016-0103.
Herrmann, R. O., and Warland, R. H. 1990. “Consumers’ Use of Recommended Food-Buying
Practices.” Journal of Consumer Affairs 24 (2): 307–325. https://doi.org/10.1111/j.1745-6606.1990.tb00271.x.
Kamakura, W. A., and Mazzon, J. A. 2012. “Socioeconomic Status and Consumption in an Emerging
Economy.” International Journal of Research in Marketing 30: 4–18. https://doi.org/10.1016/j.ijresmar.2011.12.001.
Karbasivar, A., and Yarahmadi, H. 2011. “Evaluating Effective Factors on Consumer Impulse Buying
Behavior.” Asian Journal of Business Management Studies 2 (4): 174–181. Kim, B., and Park, K. 1997. “Studying Patterns of Consumer’s Grocery Shopping Trip.” Journal of
Retailing 73 (4): 501–517. https://doi.org/10.1016/S0022-4359(97)90032-4. KPMG. 2016. “African Consumer and Retail Sector Report 2016.” Accessed 1 July 2017.
https://www.sablog.kpmg.co.za/2016/09/african-consumer-retail-sector-report-2016/. Kumar, V., Karande, K., and Reinartz, W. J. 1998. “The Impact of Internal and External Reference
Prices on Brand Choice: The Moderating Role of Contextual Variables.” Journal of Retailing 74 (3): 401–426. https://doi.org/10.1016/S0022-4359(99)80102-X.
Lee, J. A., and Kacen, J. J. 2008. “Cultural Influences on Consumer Satisfaction with Impulse and
Planned Purchase Decisions.” Journal of Business Research 61: 265–272. https://doi.org/10.1016/j.jbusres.2007.06.006.
Li, Z., Deng, S., and Moutinho, L. 2015. “The Impact of Experience Activities on Tourist Impulse
Buying: An Empirical Study in China.” Asia Pacific Journal of Tourism Research 20 (2): 191–209. https://doi.org/10.1080/10941665.2013.877043.
Lichtenstein, D. R., Ridgway, N. M., and Netemeyer, R. G. 1993. “Price Perceptions and Consumer
Shopping Behavior: A Field Study.” Journal of Marketing Research 30 (2): 234–245. https://doi.org/10.2307/3172830.
Lucas, M., and Koff, E. 2014. “The Role of Impulsivity and of Self-Perceived Attractiveness in
Impulse Buying in Women.” Personality and Individual Differences 56 (1): 111–115. https://doi.org/10.1016/j.paid.2013.08.032.

28
Luo, X. 2005. “How Does Shopping with Others Influence Impulse Purchasing?” Journal of
Consumer Psychology 15 (4): 288–294. https://doi.org/10.1207/s15327663jcp1504_3. Lysonski, S., and Durvasula, S. 2013. “Consumer Decision Making Styles in Retailing: Evolution of
Mindsets and Psychological Impacts.” Journal of Consumer Marketing 30 (1): 75–87. https://doi.org/10.1108/07363761311290858.
Machado, P. P., Claro, R. M., Canella, D. S., Sarti, F. M., and Levy, R. B. 2017. “Price and
Convenience: The Influence of Supermarkets on Consumption of Ultra-Processed Foods and Beverages in Brazil.” Appetite 116: 381–388. https://doi.org/10.1016/j.appet.2017.05.027.
Manzur, E., Olavarrieta, S., Hidalgo, P., Farias, P., and Uribe, R. 2011. “Store Brand and National
Brand Promotion Attitudes Antecedents.” Journal of Business Research 64: 286–291. https://doi.org/10.1016/j.jbusres.2009.11.014.
Mikolajczak-Degrauwe, K. and Brengman, M. 2014. “The Influence of Advertising on Compulsive
Buying: The role of Persuasion Knowledge.” Journal of Behavioral Addictions 3 (1): 65–73. https://doi.org/10.1556/JBA.2.2013.018.
Mittal, B. 2016. “Psychographics of Comparison Shoppers.” Journal of Consumer Marketing 33 (1):
20–31. https://doi.org/10.1108/JCM-12-2014-1268. Mohan, G., Sivakumaran, B., and Sharma, P. 2013. “Impact of Store Environment on Impulse Buying
Behavior.” European Journal of Marketing 47 (10): 1711–1732. https://doi.org/10.1108/EJM-03-2011-0110.
Mompei, P. 2017. “Going to Town.” Sunday Times Generation Next 2017: 5, May 2. Mortimer, G. 2012. “Toward a Shopping Typology of Primary Male Grocery Shoppers.”
International Journal of Retail and Distribution Management 40 (10): 790–810. https://doi.org/10.1108/09590551211263191.
Murthi, B. P. S., and Rao, R. C. 2012. “Price Awareness and Consumers’ Use of Deals in Brand
Choice.” Journal of Retailing 8 (1): 34–46. https://doi.org/10.1016/j.jretai.2011.07.001. National Agricultural Marketing Council. 2018. Food Price Monitor – May 2018, National
Agricultural Marketing Council, Pretoria. Ozen, H., and Engizek, N. 2014. “Shopping Online without Thinking: Being Emotional or Rational?”
Asia Pacific Journal of Marketing and Logistics 26 (1): 78–93. https://doi.org/10.1108/APJML-06-2013-0066.
Petzer, D. J., and De Meyer, C. F. 2013. “Trials and Tribulations: Marketing in Modern South
Africa.” European Business Review 25 (4): 382–390. https://doi.org/10.1108/EBR-02-2013-0016.
Pornpitakpan, C., and Han, J. H. 2013. “The Effect of Culture and Salespersons’ Retail Service
Quality on Impulse Buying.” Australasian Marketing Journal 21 (2): 85–93. https://doi.org/10.1016/j.ausmj.2013.02.005.
Sanlier, N., and Karakus, S. S. 2010. “Evaluation of Food Purchasing Behaviour of Consumers from
Supermarkets.” British Food Journal 112 (2): 140–150. https://doi.org/10.1108/00070701011018824.

29
Sheikh, N., Hosseinikia, S. M. T., and Abri, A. G. 2017. “The Effect of Psychological, Individual,
Product Strategy, and Situational Factors on Customers’ Impulse Purchase Behavior: The Case of Refah Stores in Tehran City.” Journal of Industrial Strategic Management 2 (1): 55–62.
Shoprite Holdings Ltd. 2016. “Annual Financial Statements 2015.” Accessed 4 July 2017.
http://www.shopriteholdings.co.za/InvestorCentre/Pages/Annual-Financial-Statements.aspx. Shoprite Holdings. 2017a. “Checkers.” Accessed 1 July 2017.
https://www.shopriteholdings.co.za/group/ brands/Checkers_and_Checkers_Hyper.html.. Shoprite Holdings. 2017b. “Shoprite.” Accessed: 1 July 2017.
https://www.shopriteholdings.co.za/group/ brands/shoprite.html. Shoprite Holdings. 2017c. “uSave.” Accessed 1 July 2017.
https://www.shopriteholdings.co.za/group/brands /uSave.html. Smith, M. F., and Carsky, M. L. 1996. “Grocery Shopping Behaviour: A Comparison of Involved and
Uninvolved Consumers.” Journal of Retailing and Consumer Services 3 (2): 73–80. https://doi.org/10.1016/0969-6989(95)00048-8.
South African Reserve Bank. 2018. Quarterly Bulletin, June 2018. Pretoria Statistics: South Africa. Speckman, A., and Anetos, P. 2018. “Downsizing or Dumped, Middle Class is Tightening its Belt
again.” Sunday Times: 7, May 11. Sreeram, A., Kesharwani, A., and Desai, S. 2017. “Factors Affecting Satisfaction and Loyalty in
Online Grocery Shopping: An Integrated Model.” Journal of Indian Business Research 9 (2): 107–132. https://doi.org/10.1108/JIBR-01-2016-0001.
Statistics South Africa. 2012. Census 2011: In Brief. Pretoria Statistics: South Africa Statistics South Africa. 2016. Community Survey 2016. Pretoria Statistics: South Africa. Statistics South Africa. 2018. Quarterly Labour Force Survey, Quarter 2: 2018. Pretoria Statistics:
South Africa. Steckel, J., Shampanier, K., O’Laughlin, L., Shea, J., and Fair, R. K. 2017. What Consumers Really
Think about Reference Price Labels. New York: Portfolio Media. Styvén, M. E., Foster, T., and Wallström, A. 2017. “Impulse Buying Tendencies among Online
Shoppers in Sweden.” Journal of Research in Interactive Marketing 11 (4): 416–431. Tariq, A., D’Souza, G., and Allaway, A. W. 2016. “Grocery Shopping, A One Man Job?
Understanding the single shopper.” Journal of Consumer Marketing 33 (7): 574–584. https://doi.org/10.1108/JCM-11-2015-1623.
Thiagarajan, P., Ponder, N., Leug, J. E., Worthy, S. L., and Taylor, R. D. 2009. “The Effects of Role
Strain on the Consumer Decision Process for Groceries in Single-Parent Households.” Journal of Retailing and Consumer Services 16: 207–215. https://doi.org/10.1016/j.jretconser.2008.11.016.

30
Verplanken, B., and Herabadi, A. G. 2001. “Individual Differences in Impulse Buying Tendency: Feeling and no Thinking.” European Journal of Personality 15 (S1): S71–S83. https://doi.org/10.1002/per.423.
Williams, T. G. 2002. “Social Class Influences on Purchase Evaluation Criteria.” Journal of
Consumer Marketing 19 (3): 249–276. https://doi.org/10.1108/07363760210426067. Wilson, D. 2017. “For Richer or Poorer in Sickness for Wealth: What Price Consumerism?” Integral
Ecology and Sustainable Business. In Contributions to Conflict Management, Peace Economics and Development 26: 169–180.
Xiao, S. H., and Nicholson, M. 2013. “A Multidisciplinary Cognitive Behavioural Framework of
Impulse Buying: A Systematic Review of the Literature.” International Journal of Management Reviews 15 (3): 333–356. https://doi.org/10.1111/j.1468-2370.2012.00345.x.