the influence of roughness on the wear and friction ... surface roughness to provide an approach to...
TRANSCRIPT
International Journal of Scientific & Engineering Research, Volume 3, Issue 4,April-2012 1
ISSN 2229-5518
IJSER © 2012
http://www.ijser.org
The Influence of Roughness on the Wear and Fric-tion Coefficient under dry and lubricated sliding
Riyadh A. Al-Samarai1 ,Haftirman
1,Khiarel Rafezi Ahmad
2,Y. Al-Douri
3
Abstract— The aim of the present research was to the effect of surface roughness of aluminum-silicon casting alloy on the friction and wear is inves-
tigated. Various surface roughness average (Ra) of different degrees were verified via different grades of grinding, polishing and have been evaluated
using a pin-on-disc as well as three different loads 10, 20 and 30 N, speeds 200, 300 and 400 rpm and relative humidity 70%. Different surface prepara-
tion techniques are resulted in different surface roughness of (Ra) = (4,6) µm .The monitor effects on the friction coefficient and wear are through
the test dry and lubricated sliding. It was noted that the weighted and volumetric wear rate decreases as degree of roughness decreases, as well as coefficient of friction is considered as a function of the stability state. This paper attempts to bridge the gap between the damage mode, sliding conditions
and surface roughness to provide an approach to evaluate the surface finishing as a factor in friction and wear damage processes.
Index Terms —Surface roughness, Lubrication, Dry sliding, Casting alloy, Coefficient of friction, Wear rate, Damage.
—————————— ——————————
1. INTRODUCTION
urface roughness is a major problem produced during the
production process and greatly affect the quality of the prod-
uct [1]. Can affect the surface roughness during the process of
sliding through the contact between the surfaces at the Tops and
this leads to cut and deformation these peaks during the slide and
thus can cause economic damage so it is best to be a better under-
standing of the roughness[2] as well as affect the surface rough-
ness coefficient of friction on the side by side with the frequencies
and vibration incurred during sliding between the surfaces, and
there are variables affecting the coefficient of friction when slid-
ing[3][4]. is important to know the quality of the roughness of
surfaces that require a process of coating and treatment to protect
it from damage[5] That the installation and texture surface can
increase the load hydrodynamic as well as increasing the thick-
ness of film when the structure of surfaces of linear and moderate
and thus increases the life of surfaces and reduce the cost [6]. of
either rough surfaces usually lead to speed the process of wear
and damage surfaces when working must take into account the
mechanical properties and factors affecting when sliding between
surfaces[7] .In these experiments we will notice the impact of this
roughness is actually a coefficient of friction and wear rate be-
tween the surfaces sliding at the contact between the areas of no-
minal and actual handling of this effect by carrying out treatments
on the surface of the coating, and other processes that help in
smoothing the surface and the things that affect the advance on
the surface is the manufacturing process of the basic surfaces and
the surface termination phase[8]. Menezes et al. [9].have been
studied the effects of roughness parameters on the friction of
aluminum alloy under conditions of lubrication. They concluded
that the coefficient of friction and wear are depending on the
roughness It is important to know the quality of the surfaces
roughness that requires a process of coating and treatment to pro-
tect it of damage [10]. Karpenko and Akay [11] have been studied
the effect of roughness between two surfaces using an algorithm
to calculate the coefficient of friction between them. They
concluded that there is a flexible deformation and shearing
resistance depend on external loads, mechanical properties and
topography surfaces to give the approximate limits of influence.
To increase the process of wear and damaged surfaces, we must
take into consideration the mechanical properties affect the
process [12]. . Chowdhury and Maksud [13] have been searched
the effect of humidity on surface roughness and found that the
friction is very high at low roughness and tends to be increased at
high horizontal vibration. Wieleba [14] had been studied
roughness and stiffness of composite materials against steel and
showed its effect on the friction and wear. Al-Si alloys have been
studied interestingly, but did not take into consideration the
roughness study. Xing et al. [15] have been prepared the
hypereutectic Al-17.5Si (wt pct) and Al-25Si (wt pct) alloys with
various content of rare earth Er by conventional casting technique.
They investigated the effect of Er on the microstructure and
properties of hypereutectic Al-Si alloys using optical microscopy,
scanning electron microscopy (SEM) as well as friction and wear
tests and noticed an improvement of the anti-wear properties and
the friction coefficient of the hypereutectic Al-Si alloys. Finally, Li
et al. [16] have been prepared and fabricated hypereutectic Al-Si
alloys by hot extrusion. They investigated the tensile fracture me-
S
————————————————
1School of Mechatronic Engineering, University Malaysia Perlis,
Ulu Pau, Perlis, Malaysia
2School of Materials Engineering, University Malaysia Perlis,
02600 Arau, Perlis, Malaysia
3Institute of Nano Electronic Engineering, University Malaysia
Perlis, 01000 Kangar, Perlis, Malaysia
International Journal of Scientific & Engineering Research, Volume 3, Issue 4,April-2012 2
ISSN 2229-5518
IJSER © 2012
http://www.ijser.org
chanisms using SEM and proved an improvement of Al-Si alloy
and wear resistance due to silicon particles refining.
In this work, to best of our knowledge, there is not available
in the literature investigation of roughness on the wear rate with
sliding distance and velocity of Al-Si casting alloy, on the volume-
tric wear rate and friction coefficient with normal load. It was
attempted to bridge the gap between the damages resulting from
the sliding surfaces and surface roughness effect on the friction
and wear to provide an approach for evaluation the surface
finishing operations. All of these are divided into the followings:
Section 2 displays the experimental process, while results and
discussion are given in section 3. Finally, section 4 concluded the
obtained results.
2. Experimental Procedure
For the purpose of this investigation, aimed at investigating
influence of surface preparation on roughness parameters and
correlation between roughness parameters and friction and wear,
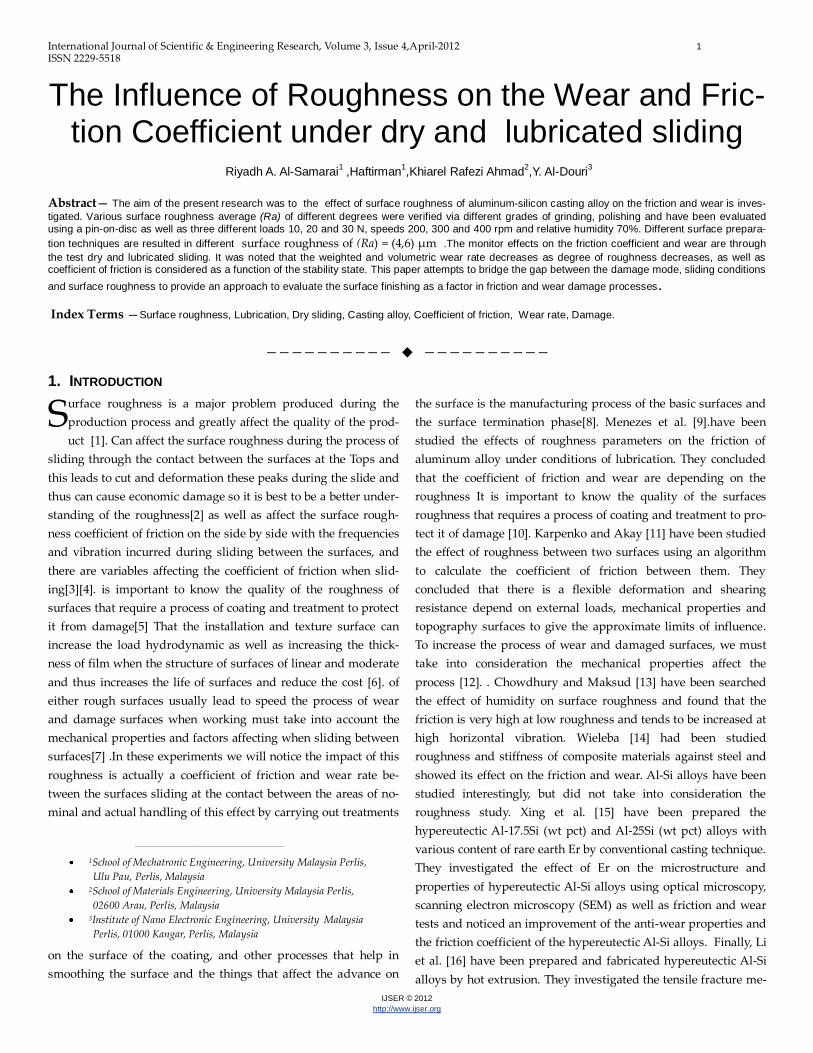
A pin-on-disk tribological test rig was used for the investigation
shown in Fig. 1 The upper specimen was a fixed (10 mm) diame-
ter Al-16Si casting alloy Ra = (4,6 ) ± 0.03 µm, Hv= 112.65
±12kg/mm2), on disc, made of AISI 1045 steel (Ra = 0.15±0.05µm,
Hv= 312±20kg/mm2), ,were tested. The applied load was (10,20,30)
N and the sliding speed, (200,300,400) rpm (1.32,1.885.3) m/s. be-
fore the start of effective wear samples of aluminum silicon disc
was cleaned and dried using cotton and acetone as the weight of
the samples was measured using a digital balance and recording
the values before and after the test in each test is calculated slid-
ing distance. The wear tracks were observed by scanning electron
microscopy (SEM) combined with energy dispersive X-ray spec-
troscopy (EDX).Surface roughness was also measured by a stylus
surface analyzer, with the effective measure length 0.350 mm and
the cutoff length,0.05mm. The work hardening of contact surfaces
due to the friction shear was identified by their hardness increase
as determined by micro-Vickers indentation test.
Fig. 1 Pin-on-Disc wear testing machine
Chemical analysis was conducted for the aluminum-silicon
casting alloy, also density, hardness and tensile strength are stu-
died due to its widely used in industry, particularly in pistons as
well as the cylinders, the resulted chemical analysis is given in
the Table 1, and testing of mechanical properties are cleared in
Table 2. while the surface roughness parameters (Ra) are calcu-
lated in Table 3.
Table 1: Compositional analysis of Al-Si casting alloy.
Si Mg Cu Fe Ni Mn Sn Pb Zn
16.69 1.176 1.30 1.13 1.22 0.02 0.012 0.026 0.01
Table 2: Investigated hardness, density and tensile strength of Al-Si
casting alloy.
Hardness 112.65 VHN
Density 2.72 gm/cc
Tensile strength 250 MPa
Table 3: The calculated surface roughness average (Ra) of Al-Si
casting alloy.
Reference surface
Sample area
Ra (μm)
Sample 1 4
Sample 2 6
International Journal of Scientific & Engineering Research, Volume 3, Issue 4,April-2012 3
ISSN 2229-5518
IJSER © 2012
http://www.ijser.org
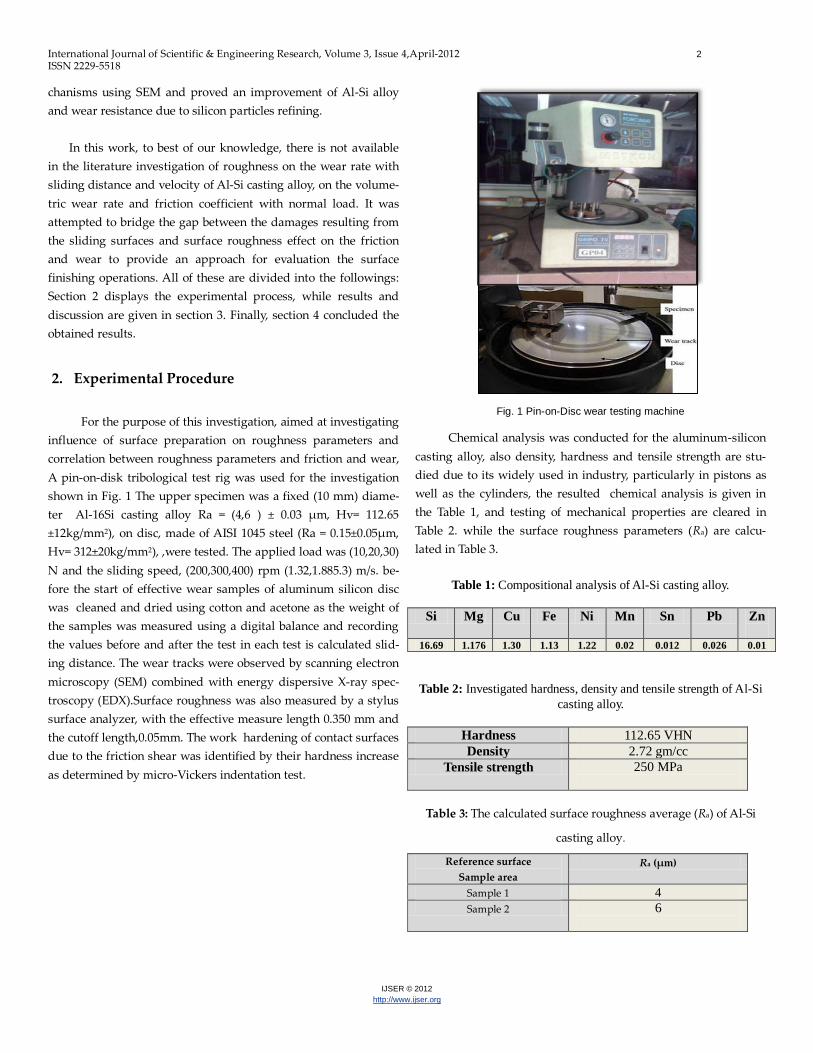
The microscopic structure and the composition of microscopic
samples are examined and shown in Fig. 2. It is shown that Si
particles are distributed uniformly, while the Si seems a bulk, we
have used the following materials manifesting:
∎ 190 ml of water distil
∎ 3 ml from hydrochloric
∎ 2 ml from hydrofluoric acid
.
primary Si particles Si
Fig. 2 The SEM images of microscopic structures of Al-Si casting alloy.
Al-Si casting alloy. Was cleaned then starting an actual test of
wear process and the hard substance acetone with cotton and dry
well was registered height and weight of samples accurately to
provide a very precise and digital recording of all data using a
stopwatch to set a time slip and post-test .
Wear rate was estimated by measuring the mass loss in the spe-
cimen after each test and mass loss, (ΔW) in the specimen was
obtained. Cares have been taken after each test to avoid entrap-
ment of wear debris in the specimen. It is calculated to the mass
loss to sliding distance (S.D) using:
W.R= ΔW/ S.D (1)
The volumetric wear rate Wv of the composite is related to densi-
ty (ρ) and the abrading time (t), using:
Wv = ΔW / ρt (2)
The friction force was measured for each pass and then averaged
over the total number of passes for each wear test. The average
value of coefficient of friction, μ of composite was calculated from
μ = Ff / Fn (3)
where Ff is the average friction force and Fn is the applied load
with an assumption that the temperature is constant at 31 oC.
Ws = Wv / S.S Fn (4)
where S.S is the sliding velocity.
3. Results and discussion
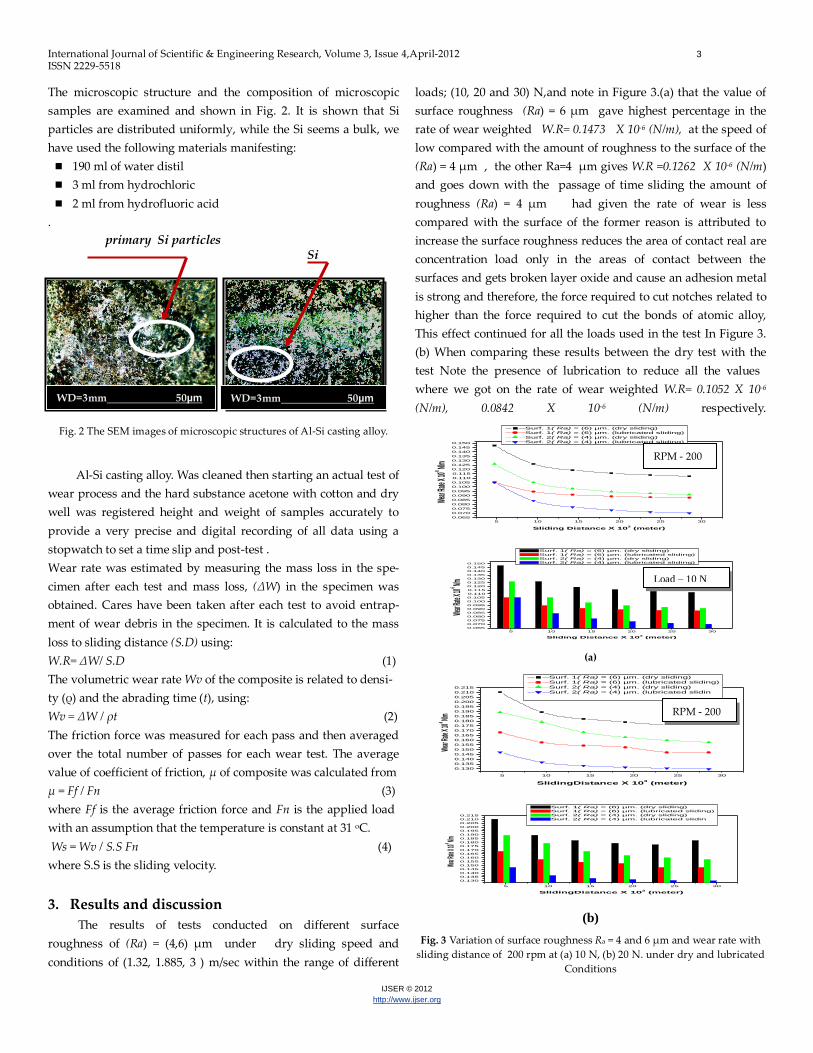
The results of tests conducted on different surface
roughness of (Ra) = (4,6) µm under dry sliding speed and
conditions of (1.32, 1.885, 3 ) m/sec within the range of different
loads; (10, 20 and 30) N,and note in Figure 3.(a) that the value of
surface roughness (Ra) = 6 µm gave highest percentage in the
rate of wear weighted W.R= 0.1473 X 10⁻⁶ (N/m), at the speed of
low compared with the amount of roughness to the surface of the
(Ra) = 4 µm , the other Ra=4 µm gives W.R =0.1262 X 10⁻⁶ (N/m)
and goes down with the passage of time sliding the amount of
roughness (Ra) = 4 µm had given the rate of wear is less
compared with the surface of the former reason is attributed to
increase the surface roughness reduces the area of contact real are
concentration load only in the areas of contact between the
surfaces and gets broken layer oxide and cause an adhesion metal
is strong and therefore, the force required to cut notches related to
higher than the force required to cut the bonds of atomic alloy,
This effect continued for all the loads used in the test In Figure 3.
(b) When comparing these results between the dry test with the
test Note the presence of lubrication to reduce all the values
where we got on the rate of wear weighted W.R= 0.1052 X 10⁻⁶
(N/m), 0.0842 X 10⁻⁶ (N/m) respectively.
5 10 15 20 25 30
0.065
0.070
0.075
0.080
0.085
0.090
0.095
0.100
0.105
0.110
0.115
0.120
0.125
0.130
0.135
0.140
0.145
0.150 W
ear Ra
te X 1
0-6 N/m
Sliding Distance X 103 (meter)
Surf. 1( Ra) = (6) µm. (dry sliding)
Surf. 1( Ra) = (6) µm. (lubricated sliding)
Surf. 2( Ra) = (4) µm. (dry sliding)
Surf. 2( Ra) = (4) µm. (lubricated sliding)
5 10 15 20 25 30
0.065
0.070
0.075
0.080
0.085
0.090
0.095
0.100
0.105
0.110
0.115
0.120
0.125
0.130
0.135
0.140
0.145
0.150
Wear R
ate X 1
0-6 N/m
Sliding Distance X 103 (meter)
Surf. 1( Ra) = (6) µm. (dry sliding)
Surf. 1( Ra) = (6) µm. (lubricated sliding)
Surf. 2( Ra) = (4) µm. (dry sliding)
Surf. 2( Ra) = (4) µm. (lubricated sliding)
(a)
5 10 15 20 25 30
0.130
0.135
0.140
0.145
0.150
0.155
0.160
0.165
0.170
0.175
0.180
0.185
0.190
0.195
0.200
0.205
0.210
0.215
Wear
Rate
X 10-6 N/
m
SlidingDistance X 103 (meter)
Surf. 1( Ra) = (6) µm. (dry sliding)
Surf. 1( Ra) = (6) µm. (lubricated sliding)
Surf. 2( Ra) = (4) µm. (dry sliding)
Surf. 2( Ra) = (4) µm. (lubricated slidin
5 10 15 20 25 30
0.130
0.135
0.140
0.145
0.150
0.155
0.160
0.165
0.170
0.175
0.180
0.185
0.190
0.195
0.200
0.205
0.210
0.215
Wear R
ate X 1
0-6 N/m
SlidingDistance X 103 (meter)
Surf. 1( Ra) = (6) µm. (dry sliding)
Surf. 1( Ra) = (6) µm. (lubricated sliding)
Surf. 2( Ra) = (4) µm. (dry sliding)
Surf. 2( Ra) = (4) µm. (lubricated slidin
(b)
Fig. 3 Variation of surface roughness Ra = 4 and 6 µm and wear rate with
sliding distance of 200 rpm at (a) 10 N, (b) 20 N. under dry and lubricated
Conditions
Load – 10 N
RPM = 200
RPM - 200
WD=3mm 50µm
RPM - 200
WD=3mm 50µm
International Journal of Scientific & Engineering Research, Volume 3, Issue 4,April-2012 4
ISSN 2229-5518
IJSER © 2012
http://www.ijser.org
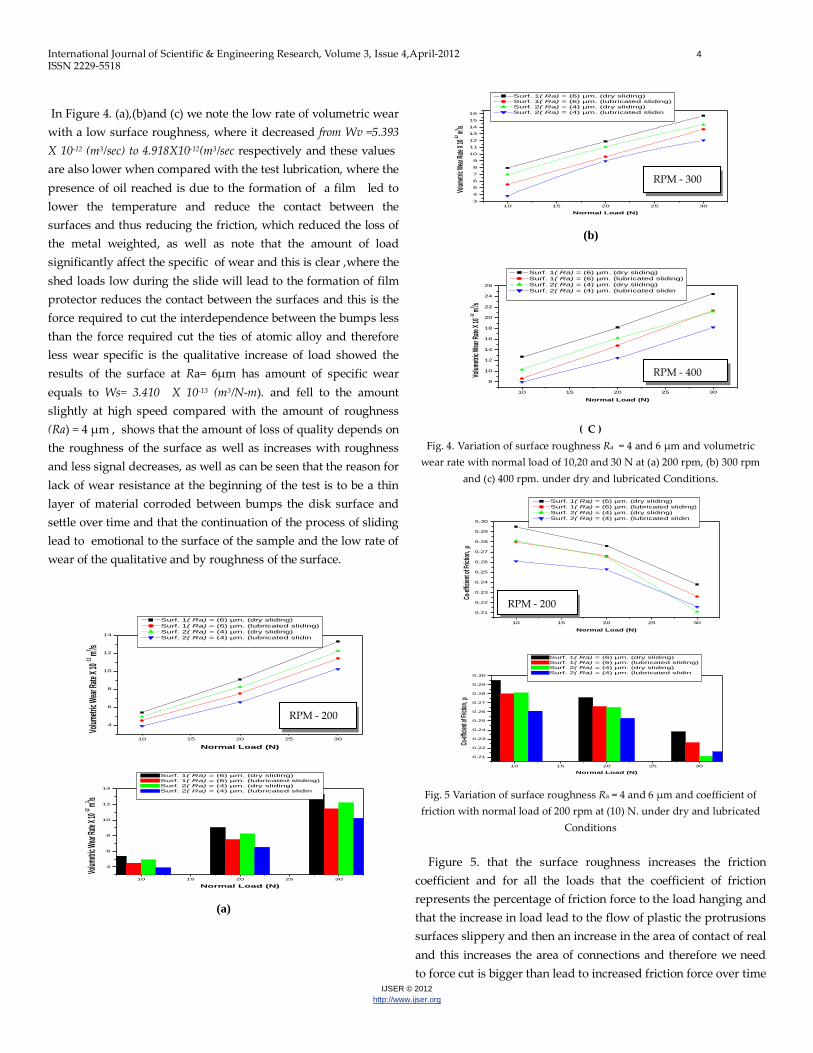
In Figure 4. (a),(b)and (c) we note the low rate of volumetric wear
with a low surface roughness, where it decreased from Wv =5.393
X 10-12 (m3/sec) to 4.918X10⁻¹²(m3/sec respectively and these values
are also lower when compared with the test lubrication, where the
presence of oil reached is due to the formation of a film led to
lower the temperature and reduce the contact between the
surfaces and thus reducing the friction, which reduced the loss of
the metal weighted, as well as note that the amount of load
significantly affect the specific of wear and this is clear ,where the
shed loads low during the slide will lead to the formation of film
protector reduces the contact between the surfaces and this is the
force required to cut the interdependence between the bumps less
than the force required cut the ties of atomic alloy and therefore
less wear specific is the qualitative increase of load showed the
results of the surface at Ra= 6µm has amount of specific wear
equals to Ws= 3.410 X 10⁻¹³ (m3/N-m). and fell to the amount
slightly at high speed compared with the amount of roughness
(Ra) = 4 µm , shows that the amount of loss of quality depends on
the roughness of the surface as well as increases with roughness
and less signal decreases, as well as can be seen that the reason for
lack of wear resistance at the beginning of the test is to be a thin
layer of material corroded between bumps the disk surface and
settle over time and that the continuation of the process of sliding
lead to emotional to the surface of the sample and the low rate of
wear of the qualitative and by roughness of the surface.
10 15 20 25 30
4
6
8
10
12
14
Volu
met
ric W
ear R
ate X
10 -1
2 m3 /s
Normal Load (N)
Surf. 1( Ra) = (6) µm. (dry sliding)
Surf. 1( Ra) = (6) µm. (lubricated sliding)
Surf. 2( Ra) = (4) µm. (dry sliding)
Surf. 2( Ra) = (4) µm. (lubricated slidin
10 15 20 25 30
4
6
8
10
12
14
Volum
etric
Wear
Rate
X 10 -12
m3 /s
Normal Load (N)
Surf. 1( Ra) = (6) µm. (dry sliding)
Surf. 1( Ra) = (6) µm. (lubricated sliding)
Surf. 2( Ra) = (4) µm. (dry sliding)
Surf. 2( Ra) = (4) µm. (lubricated slidin
(a)
10 15 20 25 30
3
4
5
6
7
8
9
10
11
12
13
14
15
16
Volum
etric
Wea
r Rate
X 10
-12 m
3 /s
Normal Load (N)
Surf. 1( Ra) = (6) µm. (dry sliding)
Surf. 1( Ra) = (6) µm. (lubricated sliding)
Surf. 2( Ra) = (4) µm. (dry sliding)
Surf. 2( Ra) = (4) µm. (lubricated slidin
(b)
( C )
Fig. 4. Variation of surface roughness Ra = 4 and 6 µm and volumetric
wear rate with normal load of 10,20 and 30 N at (a) 200 rpm, (b) 300 rpm
and (c) 400 rpm. under dry and lubricated Conditions.
10 15 20 25 30
0.21
0.22
0.23
0.24
0.25
0.26
0.27
0.28
0.29
0.30
Co-e
ffici
ent o
f Fric
tion,
µ
Normal Load (N)
Surf. 1( Ra) = (6) µm. (dry sliding)
Surf. 1( Ra) = (6) µm. (lubricated sliding)
Surf. 2( Ra) = (4) µm. (dry sliding)
Surf. 2( Ra) = (4) µm. (lubricated slidin
10 15 20 25 30
0.21
0.22
0.23
0.24
0.25
0.26
0.27
0.28
0.29
0.30
Co-ef
ficien
t of F
rictio
n, µ
Normal Load (N)
Surf. 1( Ra) = (6) µm. (dry sliding)
Surf. 1( Ra) = (6) µm. (lubricated sliding)
Surf. 2( Ra) = (4) µm. (dry sliding)
Surf. 2( Ra) = (4) µm. (lubricated slidin
Fig. 5 Variation of surface roughness Ra = 4 and 6 µm and coefficient of
friction with normal load of 200 rpm at (10) N. under dry and lubricated
Conditions
Figure 5. that the surface roughness increases the friction
coefficient and for all the loads that the coefficient of friction
represents the percentage of friction force to the load hanging and
that the increase in load lead to the flow of plastic the protrusions
surfaces slippery and then an increase in the area of contact of real
and this increases the area of connections and therefore we need
to force cut is bigger than lead to increased friction force over time
10 15 20 25 30
8
10
12
14
16
18
20
22
24
26
Volu
met
ric W
ear R
ate
X 10
-12 m
3 /s
Normal Load (N)
Surf. 1( Ra) = (6) µm. (dry sliding)
Surf. 1( Ra) = (6) µm. (lubricated sliding)
Surf. 2( Ra) = (4) µm. (dry sliding)
Surf. 2( Ra) = (4) µm. (lubricated slidin
RPM - 300
RPM - 200
RPM - 400
RPM - 200

International Journal of Scientific & Engineering Research, Volume 3, Issue 4,April-2012 5
ISSN 2229-5518
IJSER © 2012
http://www.ijser.org
increase the temperature of the surfaces and increase the flow of
plastic to the protrusions, leading to flattening gradually
protrusions become surfaces smooth and for the case become
surfaces smooth and obtain steady-state and that higher speed
leads to high temperature instant during the slide, leading to
softer bumps, which reduces the shear force required to cut the
connections and this leads to reduce the friction coefficient and
when the test with a lubricant and all forms of the results were
better and dropped all values for the wear rate and volumetric
and weighted as well as specific addition to the coefficient of
friction and be because they are to the layer of film between the
surfaces reduces the contact between them, leading to lower the
temperature.while Low coefficient of friction with increasing load
and sliding speed of the lubrication situation, compared with the
dry state When test conditions similar. The micrographs wear
surface increases with increasing load as shown in Fig. 6. It is ob-
served for the same velocity, the wear rate on the surface is in-
creased as load increases.
Fig. 6. The SEM images of micrographs before and after wear surface of 400 rpm and load (a) 10 N, (b) 20 N and (c) 30 N. under lubricated Conditions.
4 CONCLUSION
In summary, using the investigated results, we concluded
the followings: The use of lubrication has led to lower wear rate
the weighted and volumetric and specific,
compared with dry sliding tests With low surface
roughness.
For dry contact, the friction conditions increase as
the surface roughness increases. and low status of
lubrication at the same test conditions.
The roughness parameter of Al-Si casting alloy
attributes to the shape of asperities of Ra and has the
strongest influence on the wear rate.
The wear rate increases as load and roughness aver
age increase, while it correlates inversely with slid
ing distance.
The specific wear rate decreases as load increases, it
correlates inversely with sliding velocity, which is
attributed to thin film of material eroded between
bumps of the disk surface.
The smoothness of surface as well as sliding dis-
tance reduces the volumetric wear rate due to lack-
ing wear resistance of material thin film.
(a) (b) (c)
small groove large groove
(a) (b) (c)
EHT=10.00KV-WD=3mm 50µm
EHT=10.00KV-WD=3mm 50µm EHT=10.00KV-WD=3mm 50µm
EHT=10.00KV-WD=3mm 50µm EHT=10.00KV-WD=3mm 50µm
EHT=10.00KV-WD=3mm 50µm
large groove

International Journal of Scientific & Engineering Research, Volume 3, Issue 4,April-2012 6
ISSN 2229-5518
IJSER © 2012
http://www.ijser.org
The friction increases as the surface roughness in-
creases, it correlates inversely with load.
The higher value of friction is attributed to the high-
er value of Ra.
ACKNOWLEDGMENT
I wish to thank everyone who contributed to the success of
this work and the resident on it.
REFERENCES
[1] Ro. t S. M. ski, Sc .D Bishop & Associates Inc ,Connector Degrada
tion Mechanisms: Wear ,Bishop & Associates, Inc. 2010.
[2] K.J. Kubiak ., T.G. Math., S. F., Interface rough. effect on friction map
under fretting contact cond ., France Tribo.;43:pp. 1500- 507. 2010.
[3] P.L. Menezes, Kishre and S. V.Influence of roughness parame ters on
coefficient of friction. Part 3, India;33:pp. 181–190. , 2008.
[4] M. A. Chowdhury, M. Helali., Mechanical Engineering, The Effect
0f Relative Humidity and Roug . on the Friction. 2:pp.128-135. 2008.
[5] S. Ekinci, A. Akdemir and M.T.Demirci3,university of Selcuk, Effect
of Surface Roughness of Salt Bath Nitrided., Techno , Turkey2011.
[6] R. Takat Dr. ,Effects of small-scale texturing on ring/liner fric tionVic
tor , Sacramento CA, Wong ICEF 2006.
[7] K. Ka., M. M. Noor, M. M. Raman, Mechanical Engineering, Universi
ty Malaysia Pahang, European J. of Scientific Research, 25: pp.250-
256. , 2009.
[8] A. Le Boot, E. Boo-Chakra† G. Micron, Dissipation of vibration in
rough contact Laboratories., France , Trib . Letters .41:pp. 47-53. 2011.
[9] W. R.B., I wabuchi A., 1985. The effect of ion implantation on the
fretting. New York, 471–484.
[10] Ka. K., Noor M., Raman M.M.,. Surface Roughness Pre diction
Model 6061-T6. J. Scientific Research. 25, pp.250-256. 2009.
[11] Kar.Y.A., Akay A.,. Mechanical Engineering, A numerical model of
friction between rough surfaces. Tribo. Inter. l. 34, pp.531 545. 2001.
[12] Tak. R . Effects of small-scale texturing on ring liner friction
Victor, Sacramento CA, USA. 2006.
-
[13] Cho. A.M., Helali M.,. The Effect of Relative Humidity and Rough
ness. J. Mechanical Eng. 2,pp.128-135,2008.
[14] Wie . W., The statistical correlation of the coefficient of fric tion and
wear rate of PTFE composites. J. Wear; 252,pp.719–729. 2002.
[15] Xing P.,Gao B., Zhuang Y., Liu K. ,Tu G., On the medication of
hypereutectic Al- Si alloys using earth Er, Acta Metall. Sin. (Engl.
Lett.). 23, pp.327-333. 2010.
[16] Li Y.Y., Zhang D., Ngat T.L., Zhang W., Rapidly solidified hypereu
tectic Al-Si alloys prepared by powder hot extrusion, Trans. Non
ferrous Met. Soc. China. 12, pp.878-881,2002.
[17] Gupta M. Ling S. Microstructure and mechanical properties of
hypo/hypereutectic Al–Si alloys synthesized using a near-net shape
forming technique, J. Alloys Com.; 287:pp.284–294,1999.
[18] Li YY. Zhang D. Ngat TL. Zhang W. Rapidly solidified hypereutectic
Al-Si alloys prepared by powder hot extrusion, Trans. Nonferrous
Met. Soc. China;12:pp.878-881. , 2002.
[19] Gu. M., Ling S..Microstructure and mechanical properties of hy
po/hypereutectic Al–Si alloys synthesized using a near-net shape
forming technique, J. Alloys & Comp. 287,pp.284–294. 1999.
[20] Men. PL, K. KSV. Surface texture and thus roughness parame
ters influence coefficient; 33:pp. 181–190. , 2008.
[21] Ku KJ, Math TG. Interface roughness effect on friction map under
fretting contact Conditions'. Tribo. Intern; 43:pp.1500- 1507. 2010.