the influence of neutral salts on the ph of · pdf filesalt to the phosphate buffer system...
TRANSCRIPT

THE INFLUENCE OF NEUTRAL SALTS ON THE pH OF PHOSPHATE BUFFER MIXTURES.
BY HOWARD W. ROBINSON.*
(From the Depadment of Biochemistry, Vanderbilt University School of Medicine, Nashville.)
(Received for publication, April 5, 1929.)
The results embodied in this report were obtained as preliminary data for a systematic study of the magnitude of errors produced by the presence of various substances in the use of phenol red for calorimetric determinations of hydrogen ion concentration in biological fluids. Neutral salts, present in all body fluids, are known to have an influence on dye color. There are available many tables of salt errors of indicators. In most cases these are given for one buffer mixture and one indicator concentration. The question arises as to the constancy of the salt error with change in indicator concentration, with change in the buffer concentra- tion, and with change in the pH. Before this can be definitely answered it is necessary to study the effect of neutral salts on the true hydrogen ion concentration (as measured by the hydrogen electrode) for the entire range of the buffer and at various dilu- tions. S#rensen and Palitzsch (1) drew attention to the fact that the addition of neutral salt to buffer solutions altered the electro- metric pH and pointed out that the entire change as observed by a calorimetric reading could not be called a salt error of the indicator.
It is a well recognized fact that the addition of small amounts of neutral salt to dilute buffer solutions increases the hydrogen ion concentration as determined by the potential of the hydrogen electrode. At the present time all other electrometric and also calorimetric, titrimetric, and gasometric methods for the deter- mination of H+ are standardized directly or indirectly by a hydro- gen electrode system. In order to note the effects produced by a
* Presented to the Graduate School of Vanderbilt University in partial fulfilment of the requirements for the Degree of Doctor of Philosophy.
775
by guest on May 10, 2018
http://ww
w.jbc.org/
Dow
nloaded from
by guest on May 10, 2018
http://ww
w.jbc.org/
Dow
nloaded from
by guest on May 10, 2018
http://ww
w.jbc.org/
Dow
nloaded from

776 Neutral Salts on Phosphate Buffers
substance on these simpler and under most conditions more con- venient methods, it is necessary that their effects as measured by the hydrogen electrode be carefully considered.
It was decided to study first the effects of addition of neutral salt to the phosphate buffer system because it is the one used extensively in biological studies, both as a buffering agent and as standards for calorimetric pH determinations with phenol red in the range of pH 7 to 8. S@rensen used the salts Na2HP04.2Hz0 and KHzPOd in ~/15 concentration. Some investigators have experienced trouble with Na2HP04. 2HzO in that it became more hydrated. The acid salt crystallizes out of solution easily and the anhydride is stable. Therefore, Clark and Lubs (2) recommended that the phosphate standards be prepared from KH2POI and standardized NaOH solution. Cullen (3) has used the ~/15 phosphate mixtures of Serensen. When, because of war condi- tions, it became impossible to import the Na2HP04.2H20 salt, he asked Merck and Company, Inc. to prepare it. They prepared instead the anhydrous salt which has been entirely satisfactory for many years. This method is more convenient for most biological laboratories as it does not involve the preparation and keeping of pure, COz-free, sodium hydroxide. It has been the experience in this laboratory that the salts as furnished by the above manufac- turer are reliable and convenient for the preparation of the solu- tions. The values obtained for the pH of mixtures made from these salts have checked consistently within experimental errors the values as given by Hastings and Sendroy (4) when the system was standardized in the same manner. Myers and Muntwyler (5) have recently used these salts in the preparation of their stand- ards to be used in the wedges of the Myers calorimeter. As these salts are being generally used, it seemed advisable to continue their use in the present study. Considerable new information has been obtained. An attempt has been made to interpret these results in accordance with the Debye-Hiickel concept of the in- fluence of interionic forces (6, 7).
EXPERIMENTAL.
Preparation of Xolutions.
Solutions of ~/7.5 Na2HP04, ~/7.5 KH2POI, and 10 per cent solutions (10 gm. of salt dissolved in water and made up to 100 cc.
by guest on May 10, 2018
http://ww
w.jbc.org/
Dow
nloaded from
H. W. Robinson 777
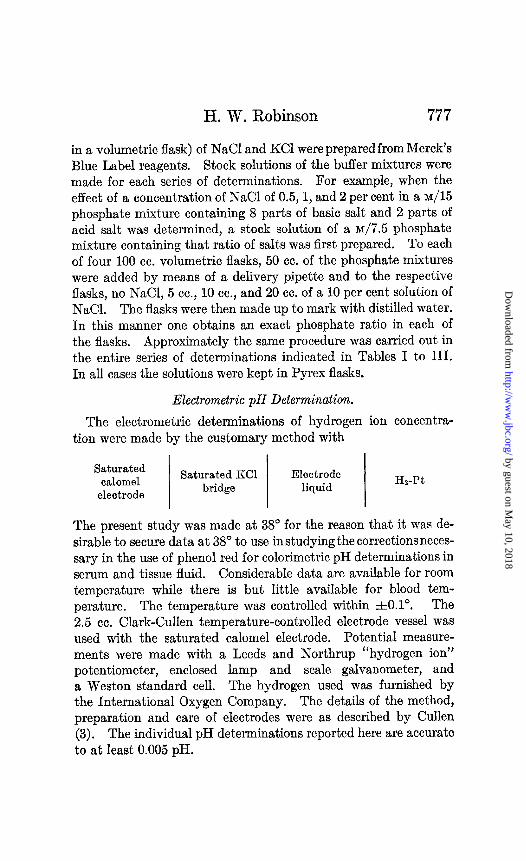
in a volumetric flask) of NaCl and KC1 were prepared from Merck’s Blue Label reagents. Stock solutions of the buffer mixtures were made for each series of determinations. For example, when the effect of a concentration of NaCl of 0.5,1, and 2 per cent in a ~/15 phosphate mixture containing 8 parts of basic salt and 2 parts of acid salt was determined, a stock solution of a M/7.5 phosphate mixture containing that ratio of salts was first prepared. To each of four 100 cc. volumetric flasks, 50 cc. of the phosphate mixtures were added by means of a delivery pipette and to the respective flasks, no NaCl, 5 cc., 10 cc., and 20 cc. of a 10 per cent solution of NaCl. The flasks were then made up to mark with distilled water. In this manner one obtains an exact phosphate ratio in each of the flasks. Approximately the same procedure was carried out in the entire series of determinations indicated in Tables I to HI. In all cases the solutions were kept in Pyrex flasks.
Electrometric pH Determination.
The electrometric determinations of hydrogen ion concentra- tion were made by the customary method with
Saturated calomel
electrode
Saturated KC1 bridge
Electrode liquid
Hz-Pt
The present study was made at 38” for the reason that it was de- sirable to secure data at 38” to use in studying the correctionsneces- sary in the use of phenol red for calorimetric pH determinations in serum and tissue fluid. Considerable data are available for room temperature while there is but little available for blood tem- perature. The temperature was controlled within f0.1”. The 2.5 cc. Clark-Cullen temperature-controlled electrode vessel was used with the saturated calomel electrode. Potential measure- ments were made with a Leeds and Northrup “hydrogen ion” potentiometer, enclosed lamp and scale galvanometer, and a Weston standard cell. The hydrogen used was furnished by the International Oxygen Company. The details of the method, preparation and care of electrodes were as described by Cullen (3). The individual pH determinations reported here are accurate to at least 0.005 PH.
by guest on May 10, 2018
http://ww
w.jbc.org/
Dow
nloaded from

778 Neutral Salts on Phosphate Buffers
At the beginning of a series of determinations 0.1 N HCl, pre- pared from constant boiling acid obtained by the method of Hulett and Bonner (8), was placed in the electrode vessel and the poten- tial measured. The pH of 0.1 N HCl was given the value of 1.08
E.M.F. f3 and the e of the system was calculated, pHs80 = 0~169
This was the method used for most of the determinations. In a few the value of e was determined with a phosphate mixture that had previously been standardized with 0.1 N HCI. In every case the standardizing solution was again run at the end of the series in order to make sure that no change had taken place in the system. Determinations were made in duplicate and refills were made un- til the readings of the two cells were constant and in agreement.
Standardization and Use of the Term pH.
0.1 N HCI, with the pH value assigned at 1.08, has been used as the final standard of reference as suggested by Cullen (3). The reasons for using this standard were again discussed by Cullen, Keeler, and Robinson (9). It is now widely used in American biological laboratories. The value of 1.08 at 38” was obtained by the use of the activity values for 0.1 N HCl given by Noyes and Ellis (10). Owing to the lack of information on the change of activity values with temperature the value 1.08 was adopted for all temperatures between 1540”. In practically all the work that has been done in the past with the use of M/15 phosphate buffers, the pH values given to the various mixtures are those of Soren- sen. His values were obtained at 18” by using the Bjerrum ex- trapolation for liquid junction potential and assigning to hydro- chloric acid a value based on conductivity measurements. It has been previously pointed out (Cullen, Keeler, and Robinson (9), Hastings and Sendroy (4)) that the values of t(he pH of ~/15 phosphate buffer mixtures at 20”, determined electrometrically without correction for liquid junction potentials and with the Cullen standardization, check within 0.01 pH unit the pH values given by Sorensen for 18”, and that at 38” the phosphate mixtures give a pH value approximately 0.03 pH more acid. The latter difference has been obtained repeatedly and used by Cullen, Keeler, and Robinson and by Hastings and Sendroy. It seems to be constant for the entire range of the phosphate buffer mixture. In
by guest on May 10, 2018
http://ww
w.jbc.org/
Dow
nloaded from

H. W. Robinson 779
view of the present lack of knowledge of the absolute value of the hydrogen ion activity in a reproducible standard solution, and since it is hoped that the present data will prove useful in connection with previous work, it seems logical to continue to use the HCI standard and to retain the term pH instead of adopting the term pan+ suggested by Serensen and Linderstrgm-Lang (11). At the present time there is a confusion in regard to t,his latter term. It is important to realize that the pH values given in this paper are identical with the pH values of Cullen, Keeler, and Robinson (9), the pH values of Hastings and Sendroy (4) (1924), the pan+ values of Hastings and Sendroy (12, 13) (1925, 1926) the pan+ values of Stadie and Hawes (14) (1928), but are not identical with the pan+ values of Sorensen and Linderstrom-Lang. Their present value for pan+ is about 0.04 pH units higher than the pH values given here or the pan+ values of the above authors. All the pH values referred to are those based on the hydrogen elec- trode. While we agree with the suggestion of Sorensen and Lin- derstr@m-Lang that the problem of standardization should be treated according to the Lewis-Bjerrum activity theory, it appears better to accept Clark’s suggestion (2) that the use of the term pH be continued. This avoids confusion in connecting new work with what has been done in the past. Hastings, Murray, and Sendroy (13) also emphasize the confusion in terms. The confu- sion that must be avoided is the apparent correction of values such as those of Cullen, Keeler, and Robinson by subtracting -0.04 when the difference is in the notation rather than in values.
RESULTS.
General Efects of Neutral Salt on pH of Buffer Solutions.
The influence of neutral salt on the hydrogen ion concentration of buffer solutions has been studied by many investigators (Michaelis and Kruger (15), Michaelis and Kakinuma (16), Leeper and Martin (17), Kolthoff and Bosch (18), Morton (19)).
The conclusions reached have been the same. The effect of a given concentration of salt is increased if the concentration of buffer is decreased. The effect is not the same in different, buffer systems. Michaelis and Kakinuma find that the effect of NaCl upon the pH of 0.01 M acetic acid and 0.01 M sodium acetate is considerably less than Michaelis and Kruger found for phosphates.
by guest on May 10, 2018
http://ww
w.jbc.org/
Dow
nloaded from

780 Neutral Salts on Phosphate Buffers
The effect is much greater as the valence of the buffer increases. The cation effect seems to be the dominant factor in this change which increases in the order K < Na< Li. The present data show that these effects at 38” are similar to those found by the above
~PH I Change of pH in Presence of Salt at 38’
-#I
750
--we- Adztic Acid-Acefate Mixlure
Plosph~te,~fjxtureM/rS
a
FIG. 1. Relative influence of various salts on the pH of ~/15 phosphate buffers at 38”; also comparative effect of NaCl on PO1 and acetate systems.
authors in the neighborhood of 18”. Fig. 1 shows the relative re- duction, A pH, in the pH due to the presence of sodium chloride in phosphate and acetic acid-acetate mixtures when the salt-acid ratio is 1: 1, and also the comparative effects of sodium chloride,
by guest on May 10, 2018
http://ww
w.jbc.org/
Dow
nloaded from

H. W. Robinson
potassium chloride, lithium chloride, potassium bromide, and potassium sulfate on the 1:l phosphate mixture. The bromide and chloride effects are practically the same, which confirms
what has been previously reported. Potassium sulfate cannot be called a true neutral salt and it is felt that its deviation is due to the secondary hydrolytic reaction SO*- + H+ = HSOa. In line with this observation, Kolthoff and Bosch found that the effect of K&04 on the H+ concentration in the carbonate-bicar- bonate system was much less than that of KC1 although thecal- culated ionic strength of the latter was only 0.5 and that of KzSO4 was 0.75, and Morton (19) also not’ed deviations with this salt.
Variation of pH Values with Salt-Acid Ratio and Concentration of Phosphate Buffers.
Summaries of the experiments on the effect of the changes in
pH of phosphate solutions of various ratios of sd due to the pres-
ence of 1,2, and 3 per cent of sodium chloride and potassium chlo- ride are given in Tables I and II. The concentration of PO1 was varied from ~/15 to ~/60. From Experiments 1 to 3 of Tables I and II it is evident that the effect of salt on the pH of a phosphate buffer containing the same ratios of di- and mono-salts is greater in the weaker phosphate solutions than in the stronger, also that the A pH for KC1 is less than for NaCl. From the experiments of equal PO1 concentrations but different salt-acid ratios, in Experi- ments 1,4, and 6 of Table II, it is evident that the change in pH is not the same throughout the entire range of buffer. Thus in the ~/15 PO4 system, 1 per cent NaCl gives a A pH of 0.178 when the salt 8 salt 2 acid
ratio is 2 but a A pH of 0.220 when the f ratio is - acid
3. This
difference far exceeds experimental error. With each total PO, salt
cormentration the A pH increases as T ratio decreases. acid
In analyzing these A pH values it was noticed that the A pH values for NaCl in a ~/15 phosphate mixture containing a ratio of NaJtP04
KHzPO4 = 0.25 were approximately the same as that produced
by the same amounts of salt in a ~/30 phosphate solution con-
by guest on May 10, 2018
http://ww
w.jbc.org/
Dow
nloaded from
782
“Gzz NO.
1
2
3
4
5
6
7
8
Neutral Salts on Phosphate Buffers
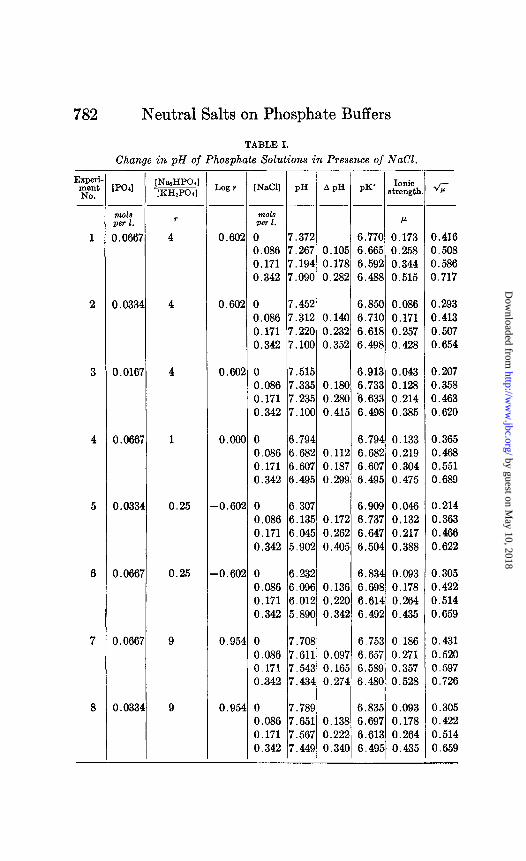
TABLE I.
Change in pH of Phosphate Solutions in Presence of NaCl.
m41
mols per 1.
0.0667
0.0334
0.0167
0.066i
0.0334
0.0667
0.0667
0.0334
[NMHPOII
[XHtPOal
r
4
4
4
1
0.25
0.25
I I
Lwr / WC11) PH j APHI PK’ !BE$,
0.602 0 7.372 6.770 0.173 0.086 7.267 0.105 6.665 0.258 0.171 7.194 0.178 6.592 0.344 0.342 7.090 0.282 6.488 0.515
-
/
,
I
0.416 0.508 0.586 0.717
0.602 0 7.452 6.850 0.086 0.293 0.086 7.312 0.140 6.710 0.171 0.413 0.171 7.220 0.232 6.618 0.257 0.507 0.342 7.100 0.352 6.498 0.428 0.654
0.602 0 7.515 6.913 0.043 0.207 0.086 7.335 0.180 6.733 0.128 0.358 0.171 7.235 0.280 '6.633 0.214 0.463 0.342 7.100 0.415 6.498 0.385 0.620
o.ooo 0 6.794 6.794 0.133 0.365 0.086 6.682 0.112 6.682 0.219 0.468 0.171 6.607 0.187 6.607 0.304 0.551 0.342 6.495 0.299 6.495 0.475 0.689
-0.602 0 6.307 6.909 0.046 0.214 0.086 6.135 0.172 6.737 0.132 0.363 0.171 6.045 0.262 6.647 0.217 0.466 0.342 5.902 0.405 6.504 0.388 0.622
-0.602 0 6.232 6.834 0.093 0.305 0.086 6.096 0.136 6.698 0.178 0.422 0.171 6.012 0.220 6.614 0.264 0.514 0.342 5.890 0.342 6.492 0.435 0.659
0.954 0 7.708 6.753 0.186 0.431 0.086 7.611 0.097 6.657 0.271 0.520 0.171 7.543 0.165 6.589 0.357 0.597 0.342 7.434 0.274 6.480 0.528 0.726
0.954 0 7.789 6.835 0.093 0.305 0.086 7.651 0.138 6.697 0.178 0.422 0.171 7.567 0.222 6.613 0.264 0.514 0.342 7.449 0.340 6.495 0.435 0.659
-
by guest on May 10, 2018
http://ww
w.jbc.org/
Dow
nloaded from

H. W. Robinson 783
Experi merit
No.
9
10
11
-
[pod
Wd8 pa 2.
0.066i
0.0667
0.0667
[NazHPOaI [KFLPOII
r
7.48
6.69
2.33
TABLE I-~OnChded.
h3r [NaCll pH A pH PK' &$h
------
m01.3 per 1. P
0.874 0 7.633 6.759 0.184 0.086 7.538 0.095 6.664 0.269 0.171 7.468 0.165 6.595 0.355 0.34i 7.358 0.275 6.485 0.526
0.429 0.518 0.596 0.725
0.826 0 7.581 6.755 0.183 0.427 0.086 7.483 0.098 6.657 0.268 0.518 0.171 7.411 0.170 6.585 0.354 0.594 0.342 7.306 0.275 6.480 0.525 0.724
0.368 0 7.142 6.774 0.160 0.400 0.086 7.040 0.102 6.672 0.245 0.495 0.171 6.964 0.178 6.596 0.331 0.575 0.342 6.854 0.288 6.486 0.502 0.708
Na2HP04 taining a ratio of KIIP04 = 9 (see Experiments 6 and 7, Table
I). These mixtures have the same ionic strength. “Ionic strength” is a concept introduced by Lewis and Randall
(20) when studying activity coefficients in dilute solutions. They make the generalization that “in dilute solutions the activity coefficients of a given strong electrolyte are the same in all solu- tions of the same ionic strength.” In the present paper the symbol p, called ionic strength, is defined in mols per liter of solu- tion instead of mols per 1000 gm. of water.
p = t (m121~ + m222 + m322 + . . . . . . . . . .etc.) ml, m2, ms.. . . . . . . . . = mols per liter of ions, Al, AZ, Aa,. . . . . . . . 21, 22, 23.. * . . . . . . . . . = valence of ions, Al, As, At.. . . . . . . . . . . . . .
This is the quantity that is employed in the Debye-Hiickel equa- tion. Disodium hydrogen phosphate and dihydrogen potassium phosphate are strong electrolytes and in the dilute solutions are assumed to be completely ionized. The basic salt gives rise to three ions Bf, B+, and HP04”, whereas the acid salt gives rise to two ions Bf and HzP04- (when B = Na or K). From the above relationship it can be calculated that the ionic strength of a
by guest on May 10, 2018
http://ww
w.jbc.org/
Dow
nloaded from

TABLE II.
Change in pH of Phosphate Solutions in Presence of KCl.
E;h”t
NO.
1
2
3
4
5
0
7
8
9
[PO41
nol.3 per 1.
0.066
0.033
0.016
0.066
0.033
0.066
0.033
0.066
0.066'
-
- -
7
4
7
7
4
7
4
7
7
-
[NazHPOJ [KHsPOII
r
2.57 0.411
2.57 0.411
2.57 0.411
1.00 0.001
0.25 -0.60
0.25 -0.60:
9.00
7.47
0.20
0.95
0.87
-0.69:
Log +
--
0
0
0
0
2
2
4
4
8 1 I I
-
[KC11 PH APH PK' st;$l
----- mols per 1. P
0 7.178 6.768 0.163 0.067 7.112 0.066 6.702 0.229 0.134 7.063 0.115 6.653 0.296 0.268 6.994 0.184 6.584 0.431
0 7.267 6.857 0.082 0.067 7.163 0.104 6.753 0.148 0.134 7.100 0.167 6.690 0.216 0.268 7.017 0.250 6.607 0.350
0 7.340 6.930 0.041 0.067 7.196 0.144 6.786 0.108 0.134 7.123 0.217 6.713 0.175 0.268 7.030 0.310 6.620 0.309
0 6.789 6.789 0.133 0.067 6.710 0.079 6.710 0.200 0.134 6.661 0.128 6.661 0.268 0.268 6.591 0.197 6.591 0.402
0 6.304 6.906 0.046 0.067 6.171 0.133 6.773 0.113 0.134 6.097 0.207 6.699 0.180 0.268 6.007 0.297 6.609 0.314
0 6.232 6.834 0.093 0.067 6.137 0.095 6.739 0.160 0.134 6.076 0.156 6.678 0.227 0.268 5.996 0.236 6.598 0.361
0 7.789 6.835 0.093 0.067 7.693 0.096 6.739 0.160 0.134 7.635 0.154 6.681 0.227 0.268 7.555 0.234 6.601 0.361
0 7.633 6.759 0.184 0.067 7.570 0.063 6.696 0.251 0.134 7.525 0.108 6.651 0.319 0.268 7.455 0.178 6.581 0.453
0 6.127 6.825 0.089 0.067 6.033 0.094 6.731 0.156 0.134 5.973 0.154 6.671 0.223 0.268 5.891 0.236 6.589 0.357
734
0.403 0.479 0.544 0.656
0.286 0.385 0.464 0.591
0.202 0.328 0.418 0.556
0.365 0.447 0.517 0.634
0.214 0.336 0.425 0.561
0.305 0.400 0.477 0.601
0.305 3.400 3.476 0.600
0.429 0.501 0.564 0.673
0.298 0.395 3.472 9.597
by guest on May 10, 2018
http://ww
w.jbc.org/
Dow
nloaded from

H. W. Robinson 785
phosphate mixture is equal to the molal concentration of the uni-univalent BH2P04 and 3 times that of the uni-bivalent B~HPOI. A phosphate mixture consisting almost entirely of BgHPOr will
Fm. 2. Influence of p of phosphate on NaCl effect on phosphate pH.
have a much higher ionic strength than a mixture that consists mostly of BHzPOl although the total PO4 concentration is the same. The changes in the concentrations of the ions HPOd and HzP04- due to the change of the hydrogen ion concentration
by guest on May 10, 2018
http://ww
w.jbc.org/
Dow
nloaded from

786 Neutral Salts on Phosphate Buffers
(HPOh= + H+ 5 HzP04-) are negligible overthe pH range studied here because the changes in H+ are negligible in comparison to the concentration of phosphate ions. The last column in Tables I and II gives the square root of the ionic strength of the solutions.
It is clearly shown by the results that the change in pH due to the presence of a particular electrolyte in a phosphate mixture is
bp~o &f’f’ect of KC/ on PO, &dV’et- pH
FIG. 3. Influence of p of phosphate on KC1 effect on phosphate pH.
related to the ionic strength of the buffer solution and not directly to the total PO4 concentration. The A pH varies over the entire range of the buffer because the ionic strength varies with the ratio of uni-bivalent BzHP04
in&univalent BH2P04 ’ Figs. 2 and 3 show the A pH effects of NaCl and KC1 when pres-
ent up to concentrations of 0.3 N in solutions of phosphate mix- tures of known ionic strength.
by guest on May 10, 2018
http://ww
w.jbc.org/
Dow
nloaded from
H. W. Robinson 787
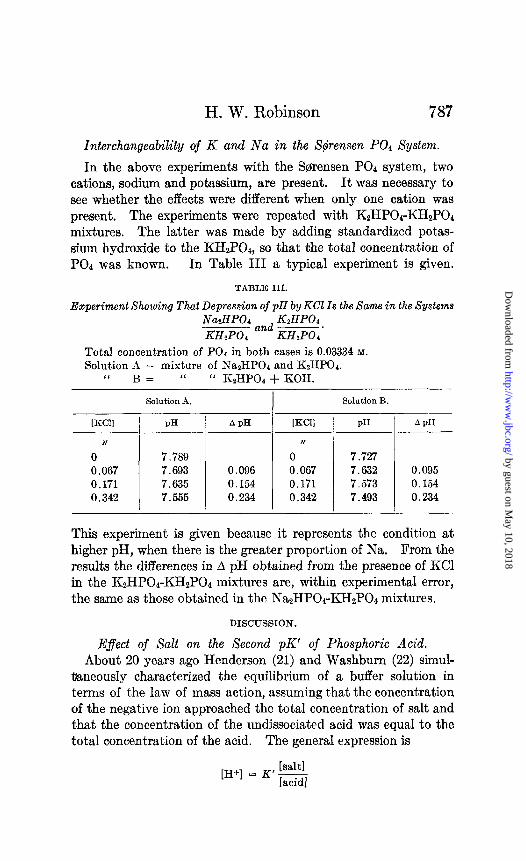
Interchangeability of K and Na in the S@ensen PO, System.
In the above experiments with the S#rensen PO1 system, two cations, sodium and potassium, are present. It was necessary to see whether the effects were different when only one cation was present. The experiments were repeated with KzHPO*-KH2P04 mixtures. The latter was made by adding standardized potas- sium hydroxide to the KH2P04, so that the total concentration of PO4 was known. In Table III a typical experiment is given.
TABLE III.
Experiment Showing That Depression of pH by KC1 Is the Same in the Systems NazHPOd and KzHPO~ -. KHzPOd KHzPO,
Total concentration of POS in both cases is 0.03334 M.
Solution A = mixture of Na*HPOd and K~HPOI. ‘I B= “ “ KtHPOa + KOH.
Solution A. Solution B.
w-J1
N
0 0.067 0.171 0.342
PB
7.789 7.693 7.635 7.555
API-I
0.096 0.154 0.234
[KC11
N
0
0.067 0.171 0.342
PB APH ---
7.727 7.632 0.095 7.573 0.154 7.493 0.234
This experiment is given because it represents the condition at higher pH, when there is the greater proportion of Na. From the results the differences in A pH obtained from the presence of KC1 in the K2HPOa-KH2P04 mixtures are, within experimental error, the same as those obtained in the Na2HPOk-KH2P04 mixtures.
DISCUSSION.
Efect of Salt on the Second pK’ of Phosphoric Acid. About 20 years ago Henderson (21) and Washburn (22) simul-
taneously characterized the equilibrium of a buffer solution in terms of the law of mass action, assuming that the concentration of the negative ion approached the total concentration of salt and that the concentration of the undissociated acid was equal to the total concentration of the acid. The general expression is
[H+] = K’s
by guest on May 10, 2018
http://ww
w.jbc.org/
Dow
nloaded from

788 Neutral Salts on Phosphate Buffers
Influence of ffa C/and Difufion on pK’
. \I\ 3. I I I I
. 1 I I
I 0.2 0.3 0.4 0.5 r I II I
FIG. 4.
al, u2, u3, ad, ~/60 POc containing 0, 0.5, 1, 2 per cent NaCl respectively. bl, bz, bs, b4, ~130 IL ” 0, 0.5, 1, 2 “ “ “ “ Cl, Cz, Cs, C4, M/15 “ “ 0, 0.5, 1, 2 “ “ “ “ Line clbla,, dilution with water of n1/15 PO4 to ~/30 and ~/60. ~2, bz, ~2, ~/60, ~/30, ~/15 PO* containing 0.5 per cent (0.086 N) NaCl. as, bf, c3, ~/60, 430, ~/15 “ “ 1.0 “ “ (0.172 “) “ a+ 64, ~4, ~/60, ~/30, ~/15 “ “ 2.0 “ “ (0.344 1‘) “
by guest on May 10, 2018
http://ww
w.jbc.org/
Dow
nloaded from
H. W. Robinson 789
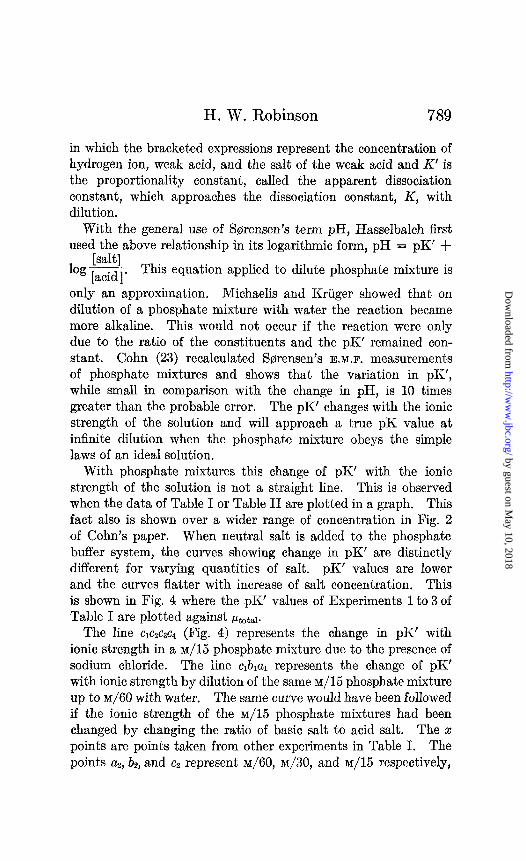
in which the bracketed expressions represent the concentration of hydrogen ion, weak acid, and the salt of the weak acid and K’ is the proportionality constant, called the apparent dissociation constant, which approaches the dissociation constant, K, with dilution.
With the general use of Sorensen’s term pH, Hasselbalch first used the above relationship in its logarithmic form, pH = pK’ +
[salt] __ log [acid]’ This equation applied to dilute phosphate mixture is
only an approximation. Michaelis and Kruger showed t,hat on dilution of a phosphate mixture with water the reaction became more alkaline. This would not occur if the reaction were only due to the ratio of the constituents and the pK’ remained con- stant. Cohn (23) recalculated Sorensen’s E.M.F. measurements of phosphate mixtures and shows that the variation in pK’, while small in comparison with the change in pH, is 10 times greater than the probable error. The pK’ changes with the ionic strength of the solution and will approach a true pK value at infinite dilution when the phosphate mixture obeys the simple laws of an ideal solution.
With phosphate mixtures this change of pK’ with the ionic strength of the solution is not a st,raight line. This is observed when the data of Table I or Table II are plotted in a graph. This fact also is shown over a wider range of concentration in Fig. 2 of Cohn’s paper. When neutral salt is added to the phosphate buffer system, the curves showing change in pK’ are distinctly different for varying quantities of saIt. pK’ vaIues are Iower and the curves flatter with increase of salt concentration. This is shown in Fig. 4 where the pK’ values of Experiments 1 to 3 of Table I are plotted against ,uLtotai.
The line c1czc3c4 (Fig. 4) represents the change in pK’ with ionic strength in a ~/15 phosphate mixture due to the presence of sodium chloride. The line cl&al represents the change of pK’ with ionic strength by dilution of the same ~/15 phosphate mixture up to ~/60 with water. The same curve would have been followed if the ionic strength of the ~/15 phosphate mixtures had been changed by changing the ratio of basic salt to acid salt. The x points are points taken from other experiments in Table I. The points uz, bz, and q represent M/~O, ~/30, and M/E respectively,
by guest on May 10, 2018
http://ww
w.jbc.org/
Dow
nloaded from

790 Neutral Salts on Phosphate Buffers
containing 0.5 per cent (0.086 N) NaCI, US, bs, and c3 represent the same phosphates containing 1 per cent (0.171 N) NaCl and u4, b4, and cd represent the same phosphates containing 2 per cent (0.342 N) NaCl. The presence of salt flattens the curves of the change of pK’ with ionic strength.
Another fact brought out by Fig. 4 is the stabilizing action on the pH of a buffer solution containing neut;ral salt when the solu- tion is diluted with the neutral salt solution. If we start at c4 (Fig. 4) we have a ~/15 phosphate solution containing 2 per cent (0.342 N) sodium chloride. If this solution is diluted once wit,h water, the PO4 concentration becomes ~/30 and the sodium chloride 0.171 N, which on the curve is point bl. The pH is 0.12 more alkaline. If, however, the dilmion had been made with a 2 per cent (0.342 N) sodium chloride solution, the point b4 is reached and the change in pH would have been only about 0.005. Likewise in diluting this same M/15 phosphate + NaCl (c4) solution to ~j60 with water, the change in pH is 0.245 (c4 to a*), whereas the dilution with 2 per cent sodium chloride makes a change of only 0.01 pH (c4 to a4).
Application of Debye-Hiickel Equation to Phosphate Bu$ers Containing Neutral Salt.
Cohn (23) has studied the phosphate buffer solutions according to the modern conception of act,ivity and has been able to account for the deviations by means of the Debye-Hiickel equation, which assumes that in completely ionized strong electrolytes the devia- tion from the ideal law of mass action in dilute solutions is caused mainly by the interionic electrical effects.
The mass law equation for the second dissociation constant for phosphoric acid may be written
aH+ aHPOr =K (1)
aH2POr
where (In+ = activity of H+, onpoe’ = activity of HPOaZ, and o&pod- = activity of HzPOd-; or in logarithmic form
%po4= pH - log - = PI< (2)
%*PO,-
by guest on May 10, 2018
http://ww
w.jbc.org/
Dow
nloaded from

H. W. Robinson 791
The activity coefhcient y is defined as the factor by which the concentration must be multiplied to give the activity.
Substituting for anpoa= its equivalent [HP04=] Yz and for uH2p04- its equivalent [H,P04-] ~1 where [HP04=] and [HzPO~-] signify concentrations of these ions and ~2 and ~1 are the activity coefficients of the HPOh and H,POd- respectively, the following equation is obtained
[HPO,=] pH - log [H,po,-] + log : = pK (3)
Assuming complete ionization of the phosphate salts, the total concentrations of the salts may be substitut,ed for the concentra- tion of the ions.
[HzP04-] = [KH2POJ and [HPOCI = [NazHPOa]
therefore
INazHPOJ 71 PH = PK + log IKHzpoll - log y, (4)
According to the theory of Debye and Hiickel, in solutions which are not too concentrated the activity coefficient y of an ion may be defined in the following manner
where
- log y = 0.5 22 &
1 + 3.29 X 10’ X a d,L
z = valence of the ion
p = ionic strength of solution
a = average effective diameter of all the ions
The constants 0.5 and 3.29 X lo-’ are only approximations, in- volving variables that may change slightly in different media. In Table 66 (p. 500) of Clark (2) it is shown that the effect of tem- perature is practically negligible on these constants.
- log 0.5 71 4 = 1 + 3.29 X lo7 X a 1/
by guest on May 10, 2018
http://ww
w.jbc.org/
Dow
nloaded from

Neutral Salts on Phosphate Buffers
TABLE Iv.-Application of Debye-HCckel Equation to Phos 3
i? PK’ diT
2
ti ‘i: cl &
d (1) (2) (3) (4) (5) (6) (7) (8) (9) (10) (11)
1 6.770 0.416 0.380 2 6.850 0.293.0.300 3 6.913 0.207 0.237 4 6.794 0.365 0.356 5 6.834 0.305 0.316 6 6.909 0.214 0.241 7 6.753 0.431 0.397 8 6.835 0.305 0.315 9 6.759 0.429 0.391
10 6.755 0.427 0.395 11 6.774 0.400 0.376
Without salt.
0.384 0.305 0.237 0.354 0.314 0.243 0.393 0.314 0.391 0.390 0.375
0.086 N NaCl.
-0.004 6.665 0.508 0.485 0.432 -0.005 6.710 0.413 0.440 0.383
0.000 6.733 0.358 0.417 0.349 j-0.002 6.682 0.468 0.468 0.412 to.002 6.698 0.422 0.452 0.388 -0.002 6.737 0.363 0.413 0.353 i-0.004 6.657 0.526 0.493 0.438 -j-O.001 6.697 0.422 0.453 0.388
0.000 6.664 0.518 0.486 0.437 j-0.005 6.657 0.518 0.493 0.437 i-0.001 6.672 0.495 0.478 0.426
Average.........................................................
6.768 0.403 0.382 6.857 0.286 0.293 6.930 0.202 0.220 6.789 0.365 0.361 6.906 0.214 0.244 6.834 0.305 0.316 6.835 0.305 0.315 6.759 0.429 0.391 6.825 0.298 0.325
-
0.373 0.300 0.232 0.354 0.243 0.314 0.314 0.391 0.309
-
-
0.067 N ICCl.
0.009 6.702 0.479 0.448 0.418 -0.007 6.753'0.385 0.397 0.366 -0.012 6.786 0.328 0.364 0.330
0.007 6.710 0.447 0.440 0.401 0.001 6.773 0.336 0.377 0.335 0.002 6.739 0.400 0.411 0.375 0.001 6.739 0.400 0.411 0.375 0.000 6.696 0.501 0.454 0.429
-0.016 6.731 0.395 0.419 0.372
Average.........................................................
-
-
0.053 O.O( 0.057 O.O( 0.068 -O.O! 0.056 O.O( 0.064-O.O( 0.060-O.O( 0.055 O.O( 0.065 -O.O( 0.049 o.ot 0.056 O.O( 0.052 O.O( -~ 0.058
0.030 O.O( 0.031 o.oc 0.034 o.cf 0.039 -o.oc 0.042 -O.OC 0.036 O.OC 0.036 0.00 0.025 0.01 0.047 -0.01 ~- 0.035
*A Y (see p. 795)isthe discrepancy between the observed and calculated value
by guest on May 10, 2018
http://ww
w.jbc.org/
Dow
nloaded from

H. W. Robinson
te Buffer Systems. Eflect of Presence of NaCl and KCI.
02) (13) (14) (15)
0.171 N N&l.
6.592 0.586 0.558 6.618 0.507 0.532 6.633 0.463 0.517 6.607 0.551 0.543 6.614 0.514 0.536 6.647 0.466 0.503 6.589 0.597 0.561 6.613 0.514 0.537 6.595 0.596 0.555 6.585 0.594 0.565 6.596 0.575 0.554
- 0.468 0.432 0.410 0.453 0.435 0.411 0.472 0.435 0.472 0.471 0.463
- 0.342 N N&I.
0.090 0.004 6.488 0.717 0.662 0.100 -0.006 6.498 0.654 0.652 0.107 -0.013 6.498 0.620 0.652 0.090 0.004 6.495 0.689 0.655 0.101-0.007 6.492 0.659 0.658 0.092 0.002 6.514 0.622 0.636 0.089 0.005 6.480 0.726 0.670 0.102 -0.008 6.495 0.659 0.655 0.083 0.011 6.485 0.725 0.665 0.094 0.000 6.480 0.724 0.670 0.091 0.003 6.486 0.708 0.664
I- ~~
0.094 I I
0.518 0.495 0.482 0.508 0.497 0.483 0.521 0.497 0.521 0.521 0.515
0.134 N KCl. I 0.268 N KCI.
0.449 0.410 0.385 0.437 0.389 0.417 0.417 0.458 0.415
0.496 0.470 0.455 0.487 0.457 0.474 0.474 0.502 0.472
6.653 0.544 0.497 6.690 0.464 0.460 6.713 0.418 0.437 6.661 0.517 0.489 6.699 0.425 0.451 6.678 0.477 0.472 6.681 0.476 0.469 6.651 0.564 0.499 6.671 0.472 0.479
0.048 0.004 6.584 0.656 0.566 0.050 0.002 6.607 0.591 0.543 0.052 0.000 6.620 0.556 0.530 0.052 0.000 6.591 0.634 0.559 0.062 0.010 6.609 0.561 0.541 0.055 0.003 6.598 0.601 0.552 0.052 0.000 6.601 0.600 0.549 0.041 0.011 6.581 0.673 0.569 0.064 0.012 6.589 0.597 0.561 ~- 0.052
-
793
0.144 0.009 0.157 -0.004 0.170 -0.017 0.147 0.006 0.161-0.008 0.153 0.000 0.149 0.004 0.158 -0.005 0.144 0.009 0.149 0.004 0.149 0.004 ___~ 0.153
0.070 0.006 0.073 0.003 0.075 0.001 0.072 0.004 0.084 0.008 0.078 0.002 0.075 0.001 0.067 0.009 0.089 0.013
0.0761
for the Debye-Hiickelcorrection term.
by guest on May 10, 2018
http://ww
w.jbc.org/
Dow
nloaded from

794 Neutral Salts on Phosphate Buffers
- log Yz 2 4 = 1 + 3.29 X 10’ X a &i
- log Yz - (-- log Yl) 1.5 4
= 1 + 3.29 X 10’ X a 4
log z 1.5 4 = 1 + 3.29 X lo7 X a &
With an a value of 4.56 X lo-*, whence
1 71 1.5 VT
w r, = 1 + 1.5 1/1;
(5)
and a pK of 7.16, Cohn found that Equation 4 described Sgrensen’s phosphates with an accuracy of ~0.01 pH.
Kolthoff (24) in studying the influence of dilution on the pH of
buffer solutions used practically the same equation for log : ex-
cept that he gave to a a slightly lower value (4 X 1OF). Cohn’s equation was applied to the present data with a slight
correction of the pK value to take care of the temperature differ- ence. He used the Sorensen standardization at 18” which would give a value for pK 0.01 unit lower than that which would be obtained by the Cullen method of standardization at 20”. The pK at 38” according to the latter standardization would be ap- proximately 0.03 units less than the value at 20”. This would give a value of 7.145 which is in agreement with the value of 7.15 estimated by Hastings, Murray, and Sendroy. With this value
of 7.15, and with the pH determined, the values for log 3 given in 72
Column 3, Table IV are obtained thus:
log x = 7.15 - LNa2HPOd
pH - log iKH2POtl >
By using the value for the average effective diameter of the ions as given by Cohn, it is found that for the range of phosphate
studied (~/60 to ~/15) the values calculated for log 3 by Equation 72
by guest on May 10, 2018
http://ww
w.jbc.org/
Dow
nloaded from

H. W. Robinson 795
5, given in Column 4, Table IV, agree with the determined value to within 0.01 pH at 38”. The present data for pure phosphate at 38” are in agreement with Cohn’s finding for 18”.
However, when the same comparison between observed values
for log 3 (Columns 8, 14, 20) and calculated values (Columns 9, y2
15, 21) is made for phosphate mixture containing NaCl or KCl, it is found that the calculated and observed values no longer agree. The discrepancies, designated by A Y are given in Columns 10, 16, and 22. This lack of agreement does not prove entirely that the assumptions made in using this term are wrong, or that the presence of sodium or potassium chloride has more than an inter- ionic effect on the activity of the phosphate ions. Without doubt an error was made in assuming that the average effective diameter of all the ions present in the solution remained the same in the presence of sodium or potassium ions. Htickcl (7) calculated a value for the average effective diameter for potassium chloride equal to 3.76 X lo-* and for sodium chloride equal to 2.35 X lo-*. These values are smaller than 4.56 X 10v8 which was used in the correction term. A smaller value for a would decrea.se the differ-
ence existing between log 3 and the term 1.5 d,G
1 + 1.5 di* In the
y-2 present paper, because of the uncertainty of these magnitudes, no attempt to adjust this value of a is made.
From the data it was striking that the differences A Y between
71 1.5 ?!z
l”qand 1+1.5& for a given concentration of salt approached
a constant over varying ranges of PO1 concentration, but that it varied as a definite function of the neutral saIt concentration. In most cases the variation of this value for a given salt concentra- tion was within 0.01 units of the average mean value for that concentration. This quantit.y therefore may be used as a cor- rection factor when one has a known phosphate buffer cont,aining a known amount of sodium or potassium chloride respectively. The equation then will be
[NatHP%l I.5 4 PH = 7.15 + log LKH2P041 - 1 + 1.5 d; - AY (7)
by guest on May 10, 2018
http://ww
w.jbc.org/
Dow
nloaded from

796 Neutral Salts on Phosphate Buffers
The values for A Y for potassium and sodium chlorides in con- centrations up to 0.3 N may be obtained from Fig. 5.
When A Y is plotted against the square root of the concentra- tion of the neutral salt (in uni-univalent salt this is equivalent to the square root of ionic strength of the salt) it is found that the values fall on a straight line (lower curves of Fig. 5). The slopes of the lines are 0.333 and 0.150 for sodium chloride and potassium
I I . . I . I . I . I . 1
0.10
AY
I
a&ssa :- - concentration of saff or psajt
----SQuqre roof 0f concentration of salt orvj& I
FIG. 5. Deviations from the Debye-Hiickel equation A Y due to the presence of NaCl and KCl.
chloride respectively, and the lines cross the ordinate at points -0.04 and at 0. The equations of this correction are
A ‘N&l = 0.333 &L - 0.04
A yKcl = 0.150 ~/.Q.QJ
where &J&l and pCLKCI equal the ionic strengths of the sodium and potassium chloride in the solution.
When these values for A Y are introduced the equations are:
For sodium chloride
[NadWOd 1.5 VG pH = 7*15 + log [KHzPo,] - 1 + 1.5 4; - (0.333 ,&,&$J - 0.04) (‘1
by guest on May 10, 2018
http://ww
w.jbc.org/
Dow
nloaded from

H. W. Robinson 797
For potassium chloride
pH = 7.15 + log NazHPOd 1.5 VG
- KH 2 po A- (0.150 d&J (9) 4 1 + 1.5
These equations are valid for calculating the pH to 3~0.02 unit of a known phosphate mixture containing a known concentration (up to 0.50 N) of sodium or potassium chloride.
Practical Application of Factors for Dilution ana’ Salt E$ect.
It is general practice in biological work to use phosphate buffer at other than ~/15 concentration with the assumption that the pH
salt is that which the -
acid ratio used gives in ~/l5 concentration;
i.e., the Sorensen value for ~/15 Pod. This is incorrect since the pH changes with the concentration and is, as shown above, a function of the ionic strength. The same mistake is commonly made when for injection and for bacteriological work the POr is prepared in isotonic saline (physiologically normal) (0.9 to 0.85 per cent). The actual pH here (see Fig. 4) is decreased. Another practice is to use a low buffer concentration (e.g.,M/50) in isotonic saline. In this case the actual pH is dependent upon the alge- braic sum of the two errors, increase due to dilution and decrease due to presence of salt.
To correct for concentration, whenever it is desirable to know or to establish the pH with an error not greater than 0.02 pH, it is necessary to correct for both the buffer concentration and the salt concentration. This is shown clearly in the analysis of Fig. 4 above.
The actual pH may be obtained by use of Equations 8 or 9, or it may be obtained to within 0.02 pH graphically with the aid of Figs. 2 and 6. Fig. 2 gives the effect, in terms of A pH, of NaCl concentration between 0 and 0.4 N on various PO, concentrations (given here as a series of curves with varying ionic strength, p). Fig. 6 is constructed for two purposes; first, to give LL for the
salt usual concentrations and acid ratios of POa buffers, and second, to
give the value for the term log ; of Equation 4 for any p.
The difference between the vaIues of log z for any two different
by guest on May 10, 2018
http://ww
w.jbc.org/
Dow
nloaded from

798 Neutral Salts on Phosphate Buffers
PO4 concentrations with the same ratio represents the change in pH due to change in concentration. This is evident from the fol- lowing consideration.
1 :: 0.07 ,
~0.04 0 &a.43
0.02 i I I/II I I I I I I
FIG. 6. The upper half represents the relation between molar concentra-
tion of phosphate, of $d ratio, and ionic strength of phosphate solution.
The lower half gives the curve for the term log 2 (
1.5 & =
> 1 + 1.5 4; in the
Y
equation pH = 7.15 + log T - log r,. The difference in ordinates, there- -Y%
fore, of the lower half for any two POC concentrations with the same ratio represents the A pH due to the change in concentration. The dotted lines show the usual ~/15 concentration and the two- and fourfold dilutions ~/30 and ~/60 used often in this work.
Thus, if the initial pH1 and ,ul are known and it is desired to know the final pH2 after dilution to a concentration .uz
by guest on May 10, 2018
http://ww
w.jbc.org/
Dow
nloaded from

H. W. Robinson 799
pH1 = pK + log T - log 0
; and pH1 = pK f log T - log 1
then
With dilution A pH is positive.
The usefulness of Figs. 2 and 6 is best shown by numerical examples.
Case 1. Effect of Dilution.-If M/S Pod, with a ratio i and pH 7.372 is
to be diluted to ~/30, the pH may be calculated thus: From Fig 6. the
ionic strength changes from 0.1733 to 0.0860 and log r, changes from 0.384
to 0.305. A pH = 0.384 - 0.205 = 0.079. pH M/3:= 7.372 + 0.079 = 7.451. Determined electrometrically, pH = 7.452.
Case B. E$ect of sodium Chloride.-If ~130 Pot, ratio 4, is prepared
in 0.9 per cent NaCl (normal saline for injection) the resultant pH may be calculated as follows:
(a) ~a/15 diluted to ~/30 gives A pH = +0.079 as above. (b) 0.9 per cent NaCl = 0.154 N. From Fig. 2, read that 0.154 N NaCl
in PO* solution with p of 0.086 gives a A pH of -0.22.
The pH of &r/30 POr, ratio i in 0.9 NaCl is, therefore, 7.372 + 0.079 -
0.22 = 7.229. Case 3. Dilution at Constant PH.--In some cases, it is desirable to dilute
a buffer mixture without change of pH. In Case 1 dilution of M/l5 to ~/30 results in an increase of pH of 0.08. By reading from Fig. 2 the point where the A pH of 0.08 intersects the curve for p of 0.086, one finds a NaCl concentration of 0.035 N. The addition of salt to this concentra- tion, or in this case the use of 0.070 N NaCl as diluting agent, would have stabilized the pH at the initial pH.
So far we have been able to solve this type of problem only by the graphic method. The examples of Cases 1 and 2 above can be easily solved by Equation 8.
Applicability to Bu$er Index Values.
Another condition in which these corrections may be important has been suggested by Morton’s discussion of buffer solution.
by guest on May 10, 2018
http://ww
w.jbc.org/
Dow
nloaded from

800 Neutral Salts on Phosphate Buffers
Morton suggests that Van Slyke’s (25) buffer index p = dB dpH
dpH should be supplemented by a unit rr = ~ d fi
to define the stability
of the buffer system against dilution. When p is determined experimentally or calculated from an ac-
tual titration curve, it must include this dilution factor; but when salt
it is calculated from the dissociation constants and __ ratio of acid the buffer, the change in pH due either to dilution or to the effect of neutral salt formed should be considered. The need for this correction when necessary being granted, it seems much more desirableJe to define a buffer in terms of Van Slyke’s buffer index
B = dpH - than to use two independent criteria.
CONCLUSIONS.
From the experimental data given above, and from the equa- tions deduced from them, it is felt that the conditions existing in phosphate buffers, either without or with the addition of neutral salts, can be understood more clearly than hitherto. The results reported here for 38” agree well with others for room temperature and indicate that the temperature effect on the Debye-Hiickel constant is negligible. The fact that in mixtures of phosphate and alkali halides it is necessary to consider the ionic concentra- tion of the neutral salt separately rather than the total ionic con- centration is interesting. It is probable that some adjustment of the constants may make this unnecessary, but since adjustment of constants is empirical, it seemed best for the present to separate the effects. The accuracy with which this treatment represents the experimental data should justify itself for the major purpose of this work, which was to obtain information concerning this sys- tem which could be used in biological work.
With this object, Fig. 6 has been worked out to make the in- formation readily available to biologists in general. It is hoped eventually to express the data in nomogram form.
SUMMARY.
1. The influence of neutral salts on pH has been studied through- out the entire range of the phosphate buffer solution. The effect
by guest on May 10, 2018
http://ww
w.jbc.org/
Dow
nloaded from

H. W. Robinson
is predominantly that of the cations, and increases in the order K, Na, Li.
2. The effect of neutral salt is independent of the total POC concentration, but is a function of the ionic strength. This varies over the buffer range because of the change in proportions of the salts, B2HP04 and BH,POd, which ionize into three and two ions respectively.
3. The dilution of buffer solutions with solutions of neutral salts rather than water, in order to minimize the change in ionic strength, has been discussed as a method of stabilizing the PH.
4. By adjusting Cohn’s pK for the second dissociation constant of phosphoric acid to 38“ and to the Cullen standardization, the equation of Cohn
NazHPOs 1.5 6 pH=pK+logKH2PO,- -
1 + 1.5 T.4
is found to be valid at 38” for concentrations of PO1 up to M/15
within the error of ~~~0.01 pH. 5. This equat,ion, when applied to phosphate mixtures contain-
ing neutral salts, is not valid, but may be corrected by an added term which is a function of the ionic strength of neutral salt only.
6. The application of these data to biological practice is dis- cussed and a graphic method of calculation is given.
BIBLIOGRAPHY.
1. Serensen, S. P. L., and Palitzsch, S., Compt. rend. trav. Lab. Carl&erg, 9, 8 (1910).
2. Clark, W. M., The determination of hydrogen ions, Baltimore, 3rd edition (1928).
3. Cullen, G. E., J. Biol. Chem., 62, 501 (1922). 4. Hastings, A. B., and Sendroy, J., Jr., J. Biol. Chem., 61, 695 (1924). 5. Myers, V. C., and Muntwyler, E., J. Biol. Chem., 78, 225 (1928). 6. Debye, P., and Hiickel, E., Physik. Z., 24, 185 (1923). Debye, P.,
and McAulay, J., Physik. Z., 26, 22 (1925). Hiickel, E., Naturwis- senschaften, 3, 199 (1924).
7. Htickel, E., Physik. Z., 26, 93 (1925). 8. Hulett, G. A., and Bonner, W. D., J. Am. Chem. Xoc., 31, 309 (1909). 9. Cullen, G. E., Keeler, H. R., and Robinson, H. W., J. Biol. Chem.,
66, 301 (1925). 10. Noyes, A. A., and Ellis, J. H., J. Am. Chem. Sot., 39, 2532 (1917).
by guest on May 10, 2018
http://ww
w.jbc.org/
Dow
nloaded from

802 Neutral Salts on Phosphate Buffers
11. &reneen, S. P. L., and Linderstrem-Lang, K., Compt. rend. trav. Lab. Curlsberg, 16, 40 (1924).
12. Hastings, A. B., and Sendroy, J., Jr., J. Biol. Chem., 66, 445 (1925). 13. Hastings, A. B., Murray, C. D., and Sendroy, J., Jr., J. Biol. Chem.,
71, 723 (1925-26). 14. Stadie, W. C., and Hawes, E. R., J. Biol. Chem., 77, 265 (1928). 15. Michaelis, L., and Krtiger, R., Biochem. Z., 119, 307 (1921). 16. Michaelis, L., and Kakinuma, K., Biochem. Z., 141, 394 (1923). 17. Leeper, E. H., and Martin, C. J., Biochem. J., 20, 45 (1926). 18. Kolthoff, I. M., and Bosch, W., Rec. trav. chim. Pays-Bus, 46, 430
(1927); 47, 558, 819, 826, 861, 873 (1928); 48, 37 (1929). 19. Morton, C., J. Chem. Sot., 1401 (1928). 20. Lewis, G. N., and Randall, M., Thermodynamics and the free energy
of chemical substances, New York and London (1923). 21. Henderson, L. J., J. Am. Chem. Sot., 30, 954 (1908). 22. Washburn, E. W., J. Am. Chem. Xoc., 30, 31 (1908). 23. Cohn, E. J., J. Am. Chem. Sot., 49, 173 (1927). 24. Kolthoff, I. M., Biochem. Z., 196, 239 (1928). 25. Van Slyke, D. D., J. Biol. Chem., 62, 525 (1922).
by guest on May 10, 2018
http://ww
w.jbc.org/
Dow
nloaded from

Howard W. RobinsonMIXTURES
ON THE pH OF PHOSPHATE BUFFER THE INFLUENCE OF NEUTRAL SALTS
1929, 82:775-802.J. Biol. Chem.
http://www.jbc.org/content/82/3/775.citation
Access the most updated version of this article at
Alerts:
When a correction for this article is posted•
When this article is cited•
alerts to choose from all of JBC's e-mailClick here
ml#ref-list-1
http://www.jbc.org/content/82/3/775.citation.full.htaccessed free atThis article cites 0 references, 0 of which can be
by guest on May 10, 2018
http://ww
w.jbc.org/
Dow
nloaded from
CORRECTIONS
On page 585, Vol. lxxxii, No. 3, Jun e, 1929, lines 15 and 18, read maximum for minimum; lines 17 and 29 read maxima for minima.
On page 778, Vol. lxxxii, No. 3, June, 1929, line 5, read
“‘~~~~I, e for pH,,. = ___ E.M.P. e
PH,,, = 0.06169 ’
On page 110, Vol. lxxxiii, No. 1, July, 1929, line 6 from the foot of the page, read, Sodium tungstate does, sodi,um molybdate does not, for Sodium molybdate doss, sodium tungstate does not.