the influence of interstitial gas on powder handling · the influence of interstitial gas on powder...
TRANSCRIPT

The influence of interstitial gas on powder handling
Citation for published version (APA):Cottaar, E. J. E. (1985). The influence of interstitial gas on powder handling. Eindhoven: TechnischeHogeschool Eindhoven. https://doi.org/10.6100/IR179830
DOI:10.6100/IR179830
Document status and date:Published: 01/01/1985
Document Version:Publisher’s PDF, also known as Version of Record (includes final page, issue and volume numbers)
Please check the document version of this publication:
• A submitted manuscript is the version of the article upon submission and before peer-review. There can beimportant differences between the submitted version and the official published version of record. Peopleinterested in the research are advised to contact the author for the final version of the publication, or visit theDOI to the publisher's website.• The final author version and the galley proof are versions of the publication after peer review.• The final published version features the final layout of the paper including the volume, issue and pagenumbers.Link to publication
General rightsCopyright and moral rights for the publications made accessible in the public portal are retained by the authors and/or other copyright ownersand it is a condition of accessing publications that users recognise and abide by the legal requirements associated with these rights.
• Users may download and print one copy of any publication from the public portal for the purpose of private study or research. • You may not further distribute the material or use it for any profit-making activity or commercial gain • You may freely distribute the URL identifying the publication in the public portal.
If the publication is distributed under the terms of Article 25fa of the Dutch Copyright Act, indicated by the “Taverne” license above, pleasefollow below link for the End User Agreement:www.tue.nl/taverne
Take down policyIf you believe that this document breaches copyright please contact us at:[email protected] details and we will investigate your claim.
Download date: 18. Mar. 2020
THE INFLUENCE OF INTERSTITIAL GAS
ON POWDER HANDLING
WARD COTTAAR
THE INFLUENCE OF INTERSTITIAL GAS ON POWDER HANDLING
THE INFLUENCE OF INTERSTITIAL GAS ON POWDER HANDLING
PROEFSCHRIFT
TER VERKRIJGING VAN DE GRAAD VAN DOCTOR IN DE TECHNISCHE WETENSCHAPPEN AAN DE TECHNISCHE HOGESCHOOL EINDHOVEN. OP GEZAG VAN DE RECTOR MAGNIFICUS. PROF. DR. S. T. M. ACKERMANS. VOOR EEN COMMISSIE AANGEWEZEN DOOR HET COLLEGE VAN DEKANEN IN HET OPENBAAR TE VERDEDIGEN
OP DINSDAG 16 APRIL 1985 TE 16.00 UUR
DOOR
EDUARDUS JOHANNES EMIEL COTT AAR
GEBOREN TE HEERLEN
Druk: Dissertatiedrukkerij Wibro, Helmond.
Dit proefschrift is goedgekeurd door
de promotor:
prof.dr. K. Rietema
co-promotor:
ir. S. Stemerding

CONTENTS
1
1.1
1.2
1.3
1.4
2
2.0
2.1
2.2
2.3
2.4
2.4.1
2.4.2
2.4.3
2.5
2.6
2.7
2.8
2.9
2.A
2.B
INTRODUCTION scope of this thesis
other research
contents of this thesis
literature
THE EFFECT OF INTERSTITIAL GAS ON MILLING abstract
introduction
description of the milling process
computer analysis
measurements
experimental set-up
particle size measurement
analysis
results
discussion
conclusions
Hst of symbols
literature
viscosity at low pressures
the least-squares search procedure
1
1
2
2
3
5
5
5
7
9
10
10
13
15
21
23
24
25
26
26
28
3 THE EFFECT OF INTERSTITIAL GAS ON MILLING, PART 2 33
33
33
3.0
3.1
3.2
3.3
3.4
3.4.1
3.4.2
3.4.3 3.5
3.6
3.7
abstract
introduction
characterization of powders used in the milling
experiments 36
experimental results 40
discussion 44
comparison with wet milling 44
simulation of continuous, pressurized milling 46
comparison of power consumption 48
conclusions
list of symbols
literature
50
50
51

4 THE EFFECT OF INTERSTITIAL GAS ON MILLING: A
CORRELATION BETWEEN BALL AND POWDER BEHAVIOR
AND THE MILLING CHARACTERISTICS 53
4.0
4.1
4.2
4.3
4.4
4.4.1
4.4.2
4.4.3
4.5
4.6
4.7
4.8
4.9
4.A
abstract 53
introduction 53
visual observation of the milling process 55
a correlation between milling characteristics
and ball and powder behavior 59
experiments with varying ball load 61
milling characteristics 61
the collision rate of balls falling 62
the collision rate of balls cascading 63
results 66
discussion 68
conclusions 69
list of symbols 69
literature 70
noise analysis of the mill 70
5 THE EFFECT OF INTERSTITIAL GAS ON MIXING OF
FINE POWDERS 73
5.0 abstract 73
5.1 introduction 73
5.2 description of the mixing process 74
5.2.1 description by transport equations 75
5.2.2 description of final result 75
5.3 experimental set-up 76
5.3.1 the sampling method 76
5.3.2 experimental procedures 77
5.3.2.1 experiments on the diffusion coefficient 77
5.3.2.2 experiments on variances 78
5.3.3 powders and combinations used 79
5.4 results 81
5.4.1 diffusion coefficient for FCC1-FCC1 81
5.4.2
5.5
5.6
5.7
variances for the combination FCC2-magnetite 83
conclusions
list of symbols
literature
84
84
85

6 A THEORETICAL STUDY ON THE INFLUENCE OF GAS
ADSORPTION ON INTERPARTICLE FORCES IN POWDERS 87
6.0 abstract 87
6.1 introduction 87
6.2 derivation of the interaction force from the
6.3
6.3.1
6.3.2
6.3.3
6.3.4
6.4
6.4.1
6.4.2
6.4.3
6.4.4
6.5
6.6
6.7
6.7.1
6.7.2
6.7.3
6.8
6.A 6.B 6.C
6.C.l
6.C.2
6.C.3 6,C.4
7
7.1
7.2
7.3
7.4
7.5
energy
the energy of the system
the molecular energy, U m the elastic energy, UH
the energy due to adsorped gas, U g
88
89
90
91
91
the total energy 93
ranges of dimensionless parameters 94
the parameter w 94
the parameter a 95
the parameter T 96
the parameter o 97
calculation and discussion 98
conclusions 102
list of symbols 103
dimensionless parameters 103
indices 104
physical constants 104
literature 104
interaction energy between a gas and a solid 105
density of adsorbed molecules 106
the sorption measurements 107
introduction 107
the adsorption measurements 107
the desorption measurements 110
the calibration technique 110
GENERAL OVERVIEW 113
introduction 113
the hydrodynamic gas-powder interaction 113
the influence of gas adsorption on particle
cohesion 116 usage of gas influence in powder handling
practice 117
literature 118

1 INTRODUCTION
1.1 SCOPE OF THIS THES~S
This thesis will treat the effect of the interstitial gas, i.e. the
gas in the pores between the powder particles, on the handling of fine
powders. The reason for such a research project is that up till now
almost all research on powders only considered properties of the parti
cles, like particle size, particle weight and so on. A powder is in
essence, however, a two-phase system: it consists of a dispersed solid
phase, the particles, and a continuous gaseous phase, the interstitial
gas. For a complete understanding of the phenomena occuring during the
handling of fine powders one should deal therefore with both phases.
In this thesis the effects of the properties of the gaseous phase will
be investigated.
That the gaseous phase may indeed highly influence the properties of
the whole powder system may be clear from the field of fluidization:
due to induced gas velocities a powder changes into a more or less
turbulent mass with very large variations in voidage, e.g. "bubbles".
Of course, in fluidization these gas flows are deliberately created.
However, also in many other powder handling apparatus velocity diffe
rences between the particles and the gas are created through a con
tinuous reshuffling of the powder. This may cause a significant aera
tion of the powder, although the velocities are generally not as high
as in fluidized beds. Since this hydrodynamic interaction is due to
the viscosity of the gas, this viscosity is the first property of the
gas to influence the powder behavior.
A second property of the gas which may influence the behavior of the
powder is the adsorption of the gas on the powder surface. This ad
sorption may increase the interparticle forces. The effect of this
adsorption for the field of fluidization was reported on by Piepers
e.a. (1)· From these results ~t can be concluded that also in other
powder processes this influence may be of importance.
1
1.2 OTHER RESEARCH
Most attention so far has been paid to the effect of interstitial gas
in the field of solids flow from bunkers. Both the effects of gas
flows induced by the flowing particles (3,4,5) and the effects of a
deliberate aeration of the powder mass in the bunker (4,5,6,7,8,9)
have been investigated. Also the effects during the filling of bunkers
are sometimes mentioned (4).
Further attention has been paid to the effect of aeration on more fun
damental flow properties. Ishida e.a. (10) investigated the flow of
powders in an aerated inclined channel. Judd and Dixon (11) studied
the dynamic angle of repose of a powder flowing in a rotating drum,
which is aerated through a porous wall. Bridgewater (12) reports on
the effects of fluid flow through a powder bed on the stability of
the slope of the powder. Van den Langenberg-Schenk and Rietema (13) es
tablished parameters of a homogeneously fluidized powder flowing in a
vertical standpipe. In all this research gas flow has been delibe
rately induced like in fluidization. Although such research is of
course very important to the development of an understanding of the
two phase powder-gas system, it does not give any direct information
on the powder flow in apparatus in which no gas flow is created on
purpose.
Papers which are intended to develop models for the flow of powders
(15,16) do not take the gas influence into account,
1.3 CONTENTS OF THIS THESIS
The part of the research project, which is presented in this thesis,
mainly deals with two practical situations in powder handling: the dry
milling and mixing of fine powders.
Chapters 2 through 4 all deal with dry milling. Chapter 2 contains the
experimental set-up, the way of analysis of the milling experimentsand
some preliminary results. Chapter 3 gives results on some different
types of powders and explores any practical possibilities of using the
gas influence in milling processes. Chapter 4 contains a model and ex-
2

periments to obtain more insight in the important parameters of the
milling process.
Chapter 5 presents the most important results of gas influence on dry
mixing. From these results some rules of thumb can be derived for real
mixing problems.
Chapter 6, finally, contains a theoretical study on the influence of
gas adsorption on interparticle forces. It is shown that such is in
deed quite possible.
All chapters are either published in Powder Technology or submitted
for publication. References in a chapter to other chapters are there
fore expressed by referring to the publications in Powder Technology.
Generally, it will however be directly clear which chapters are meant.
1.4 LITERATURE
1 H. Piepers, W. Cottaar, A. Verkooijen and K. Rietema
Powder Technology 37(1984)55
2 K. Rietema, J. Boonstra, G. Schenk and A. Verkooijen
3
4
5
6
J. Johanson and A. Jenike
W. Bruff and A. Jenike
I. McDougall
H. Kurz adn H. Rumpf
Proc.Eur.Symp. Particle Technology
Amsterdam (1980)981
Proc. Powtech (1971)207
Powder Technology 1{1967)252
Brit.Chem.Eng, 14(1969)1079
Powder Technology 11(1976)147
7 R. Neddermann, U. Tuzun and S. Savage
Chem.Eng.Sci. 37(1982)1597
8 R. Neddermann, U. Tuzun and R. Thorpe
9
10
11
12
13
Powder Technology 35(1983)69
L. Bates Fachb. Rohstoff-Eng. 105(1981)484
M. Ishida, H. Hatano and T. Shirai
Powder Technology 27(1980)7
M. Judd and P. Dixon Trans.I.Chem.Eng. 57(1979)67
J. Bridgewater Powder Technology 11(1975)199
G. v.d. Langenberg-Schenk and K. Rietema
Powder Technology 38(1984)23
3

14 U. Tuzun and R. Neddermann Powder Technology 24(1979)257
15 J. Johanson Powder Technology 5(1971)93
4

2 THE EFFECT OF INTERSTITIAL GAS ON MILLING
Published in Powder Technology 38(1984)183-194
Coauthor: K. Rietema.
2.0 ABSTRACT
In a research program on the influence of interstitial gas on the
handling of fine powders, particle diameter less than 100 vm. the
effect on milling is also investigated.
The influence of the interstitial gas is exhibited through the drag
force, due to velocity differences, which the gas exerts on the solid
particles of the powder. These forces strongly influence the behavior
of the powder.
Our investigations of milling showed that the milling parameters, i.e.
the specific ra.tes of breakage and the breakage parameter, were depen
dent on the powder flow behavior. Two extremes were the regime of free
flowing powder, where the rate of breakage was high and the grinding
of the individual particles was rather ineffective, and the regime in
which the powder did not flow at all, where the rate of breakage was
low, but where the grinding of the single particles was rather fine.
2.1 INTRODUCTION
This paper reports on the influence of interstitial gas on the milling
parameters, when milling fine powders (d 10 to 100 vm) in a ball p
mill. The research is a part of our present research on the influence
of gas on powder handling.
The influence of interstitial gas is exhibited by the forces which
arise from a velocity difference between the dispersed solid and the
continuous gas phase of the powder. When there is a velocity diffe
rence Us, the so called slip velocity, between solid particles with a
typical particle size d and a gas with viscosity u, the interaction p
force Fi is given by Carman (1). To a first approximation it follows
5

F. = lSd~ ~ h(£) U 1 s (2.1)
p
Where h(£) is afunctionof the porosity£, which is of the order of
unity, when£ is of the order of 0.5. This relation is well known in
the field of fluidization.
In many powder-handling operations like milling and mixing, the powder
is continuously reshuffled, while at the same time gas is entrapped in
the pores between the solid particles. In this way, pressure differen
ces are created, which create a gas flow, which in turn will exhibit a
force on the solid particles as given by equation (2.1). In the stati
onary case, the velocity of the gas flow will be of the order of a
typical speed of the apparatus, U • The force of the outflowing gas, a
generally in the upward direction, can, however, never exceed the
weight of the solid particles. Hence, we can write
(1-£) pd g ~ 1~~ P h(£) ua p
(2.2)
As long as the bulk weight of the particles is higher than the drag
force of the gas the value of the porosity £ will equal the lowest
possible value £0 • As Ua increases, a point will be reached, where
both sides in equation (2.2) are equal, while £ is still £0 .
When Ua increases still further, £ must change for the formula still
to hold. Hence, a stage is reached where the porosity of the powder is
changed (increased). This change will have a marked influence on the
powder flow behavior.
From equation (2.2) we can derive a criterion for gas influence. Using
h(£) = ((1-£)/£) 2 and £0 = 0.4, it follows there will be a gas in
fluence if
(2.3)
From equation (2.3) we can see that for smaller or less heavy parti
cles there will be more influence, as the left side of equation (2.3)
is smaller. The same goes for more viscous gases or a higher apparatus
speed.

Using some typical values of our experiments: pd = 1000, g = 10,
d = 10-4, ~ = 10-5, U 0.1, all in SI-units, we get a value of 100 p a
for the left side.
So far, we have assumed the value of gas viscosity to be a property of
the gas itself, independent of other parameters. This concept is, how
ever, only true, when the free path of the gas molecules is much smal
ler than any other specific length of the system considered. In gene
ral, this path is in the order of 0.1 ~mat 1 bar and inversely pro
portional to the pressure. So at 0.01 bar, the free path is 10 ~m and
isthereforein the order of the particle diameter. The force exhibited
by the flowing gas will then decrease as the interaction between gas
molecules and so their momentum exchange becomes less important. The
apparent viscosity will therefore also decrease. In the rest of this
paper, the conceptions of smaller and larger viscosity or pressure
will therefore be highly equivalent (see also the appendix 2.A).
To examine the influence on the milling process, we performed milling
experiments with one specific powder using several gases and pres
sures. From these we derived specific milling parameters, i.e. the
specific rate of breakage and the breakage parameter. The range of
gases and pressures was wide enough to change the powder from a very
airy free flowing powder to a completely stiff mass, which showed no
flow at all. All other parameters have been kept constant as their ef
fect has been reported extensively elsewhere, e.g. ball size (2,3),
fines content (4}, moisture (5,6}, additives (7), ball and powder loa
ding (8,9).
2.2 DESCRIPTION OF THE MILLING PROCESS
To describe the milling process, we used a method which is quite com
mon in the literature (3,4,5,10,11,12). The model is based on mass
balance equations and, although it is not a priori evident that all
the assumptions made are valid, the model has proved to be quite use
ful and, as will be shown, does also agree satisfactorily with our
experiments. Some other, but closely related methods have also been
used (13).
7
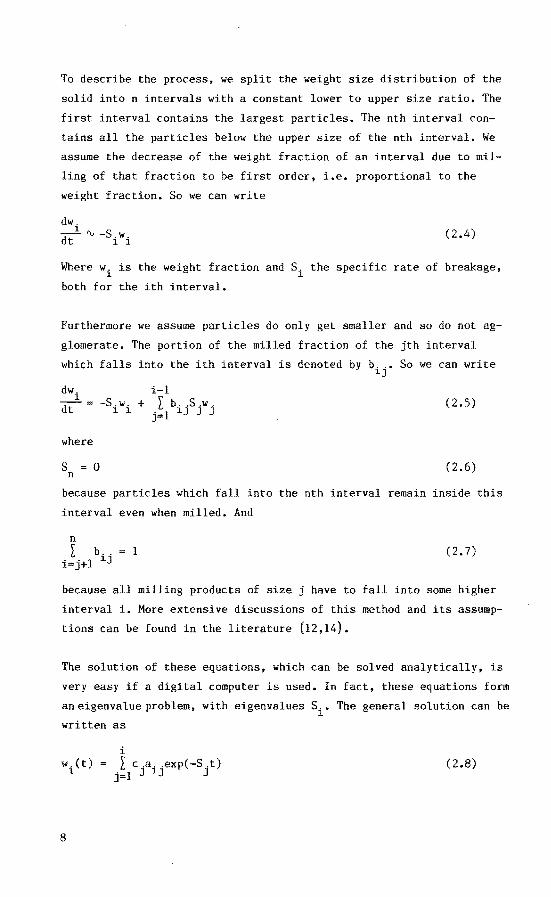
To describe the process, we split the weight size distribution of the
solid into n intervals with a constant lower to upper size ratio. The
first interval contains the largest particles. The nth interval con
tains all the particles below the upper size of the nth interval. We
assume the decrease of the weight fraction of an interval due to mil
ling of that fraction to be first order, i.e. proportional to the
weight fraction. So we can write
(2.4)
Where wi is the weight fraction and Si the specific rate of breakage,
both for the ith interval.
Furthermore we assume particles do only get smaller and so do not ag
glomerate. The portion of the milled fraction of the jth interval
which falls into the ith interval is denoted by b ..• So we can write l.J
dw. 1.
dt
where
s = 0 n
-S.w. + 1. 1
i-1 L b .. S .w.
j=l l.J J J (2.5)
(2.6)
because particles which fall into the nth interval remain inside this
interval even when milled. And
n r b .. i=j+l l.J
1 (2.7)
because all milling products of size j have to fall into some higher
interval i. More extensive discussions of this method and its assump
tions can be found in the literature (12,14).
The solution of these equations, which can be solved analytically, is
very easy if a digital computer is used. In fact, these equations form
an eigenvalue problem, with eigenvalues Si. The general solution can be
written as
w. (t) l
8
i L c.a .. exp(-S.t)
j=l J 1J J (2.8)
where a .. (i=1,n) is the eigenvector belonging to 1J
is completely determined by all the parameters si
stants c. are determined by-the initial values of J
For the first interval the equation is
eigenvalue S .• a .. J 1J
and b. . • The con-1J
w.(t), i.e. w.(O). 1 1
(2.9)
To reduce the number of parameters we assume the values of b .. to be 1J normalized, which means that
b. 0 = b. 1 0 1 1J 1- ,J- (2.10)
while the value of b nj will be determined by n-1
b nj 1 - L b. 0
i=j+1 1J (2.11)
This means that the relative size of the daughter particles with res
pect to the parent particle size is independent of the parent particle
size. Of course, this is still a further restriction in our model,
which has no physical ground.
For later use, we also define the cumulative breakage parameter as
B. 1
2.3 COMPUTER ANALYSIS
(2.12)
A second step is to derive from our measurements the parameters Si and
b ..• Therefore we measure at certain moments the particle size distri-1J bution inside the mill (see also the next section). From this, we de-
rive the weight fractions of the several intervals, which we will de
note as v.(t). These values have, of course, an experimental error, 1
s.(t), which consists of two parts. 1
The first error is introduced through sampling, i.e. the sample mea
sured with the Coulter Counter is not exactly representative of the
contents of the mill. This error was determined experimentally by ta
king many samples at one moment during the milling. It was of the or
der of 0.5% per interval.
9
The second error is the statistical error of the measurement of the
particle size distribution itself. It can easily be calculated because
if m is the number of particles counted by the Coulter Counter in an
interval, then the statistical error in this number is equal to the
square root of m (see also section 2.4.2 on particle size measure
ment).
Our aim is now to find those values of S. and ].
give the same sets w.(t) as the measured sets ].
tween these two values may be of the order of
bij which, given wi(O),
v.(t). The deviation bel
s.(t). To reach this aim ].
we use aleast-squaresmethod, which minimizes Q, where Q is given by
Q = (2.13)
Such a least-squares method will give the most likely values of the
parameters for the given experiment, assuming the experimental errors
have a Gaussian distribution, Also, the statistical errors of the
parameters are a result of the analysis, a fact which is often ignored
in the literature (more on the method used can be found in the appen
dix 2.B).
Using this method enables us to determine directly all values of Si
and b ..• Using narrow starting size fractions and studying the para-lJ
meters only for that interval is therefore unnecessary (15). Care
should be taken to ensure that the number of measurements is much lar
ger than the number of parameters (order of ten). This fact is some
times neglected in the literature, which results in numerous, but in
significant numbers (10).
2.4 MEASUREMENTS
2.4.1 experimental set-up
A schematic drawing of the set-up is given in figure 2.1. The mill was
made of steel with an internal diameter of 150 mm and an internal
length of 195 mm. In all reported experiments, it was run at a speed
of 80 rpm, which is 73% of the critical speed.
10

g s
>c'+-
r as upply
air inlet/outlet
;K
,..._
gas tight bearing
,_;;;.
1--....-...
pressure !meter
vacuuJ 1
L....- controller pump
r-- mill r--
- sampli device
L..... '--
mo or
Figure 2.1. Sahematias of the experimental set-up.
Figure 2.2. The initial distri
bution;-, aoarae distribution;
---, fine distribution.
I I
I I
I I
I
7
I I
I I
I I I I I I
I I
I I
I I
I I
I I
5 i 3
I.
11

The ball filling consisted of 240 steel balls with a diameter of
16 mm. The total ball volume was therefore equal to 15% of the mill
volume. The bulk volume of the balls was about 30% of the mill volume.
The bulk volume of the powder was equal to 15% of the total mill
volume. The powder used was a quartz sand consisting of 99% Si02•
Two initial particle size distributions were used, a coarse one and a
fine one. The fine one was obtained by milling the coarse one in air
for one hour in the same mill as described above (see figure 2.2).
During each experiment, around 30 samples were taken from the mill at
certain moments, depending on the milling speed. The samples with a
weight of the order 0.5 g were taken with a special sampling device
(figure 2.3), consisting of a cork screw closely fitting inside a hol
low tube. This was inserted in the mill through a ball valve and, by
turning the cork screw via an axis connected to it some powder was
pulled into the tube, The whole assembly was air-tight so no leakage
of gas was possible. However, each time some contamination entered the
mill due to the airvolumeof the hollow tube. Although this volume
equals only 0.05% of the mill volume at low pressures it could still
heavily contaminate the contents, because the tube was filled with air
at 1 bar. Therefore, the contents of the mill were renewed after each
sample.
inside mill
fl
Figure 2.3. The sampZing device.
12
turning handle

gas
dry air
hydrogen
neon
density viscosity
(kg/m3) (kg/ms)
1.290 1.88•10-5
0.089 0.88•10-5
0.890 3.10•10-5
Data on used gases.
free path
(Urn) (1 bar)
0.05
0.09
0.11
By means of an air-tight bearing, the mill - which was of course also
air-tight was connected to the gas-supply system. This system could
handle pressures in the range of 0.001 to 10 bar. The system was con
trolled by a device, which has the following functions:
(I) After a sample has been taken the mill is evacuated.
(2) Gas is supplied to the mill until a preset pressure is reached.
At low pressures an excess of gas is supplied, whereafter part of
it is pumped away.
(3) The mill is run for a preset time.
Steps (1) and (2) can be repeated several times, up to ten, if the gas
contents of the mill are severely contaminated.
Three gases, dry air, hydrogen and neon, were used during the experi
ments. These were chosen because of the large range of viscosity,
which is covered by these gases. Data can be found in table 2.1.
2.4.2 particle size measurement
To measure the size distribution, a Coulter Counter connected to a
channel-analyzer was used. The schematics of the set-up is given in
figure 2.4. The main advantage of this method over more conventional
ones like sieving or sedimentation is the measuring speed. The mea
surement of one sample took in the order of five minutes, while a dia
meter ratio of twenty-five was reached. Another advantage is the small
amount of powder needed for analysis, which can be neglected compared
to the total powder contents of the mill.
13

20 jlS
- +----
J\Jv samplEt I pulse
Coulter I shaper Counter
5 jlS
-- +--
JLilog(V)
I I channel
analyzer
Figure 2.4. Sahematias of the paPtiale size measurement.
comput
A disadvantage is that the Coulter Counter is in essence a particle
counting technique, while for the further analysis, volume fractions,
i.e. weight fractions, are needed. Therefore, a conversion has to be
made. Of course, this conversion can be done very accurately through
calibration. However, especially with a wide size distribution, which
is often the case in milling, a few large particles can count for a
volume as large as thousands of small particles. Because, as mentioned
above, the statistical error is equal to the square root of the number
of counted particles, the relative error in the number of counted par
ticles as well as in the calculated volume is inversely proportional
to the square root of the number of counted particles. For the inter
vals with the larger particles, this relative error can become very
large, even of the order of one.
The small volume of the samples, given as an advantage, can also be a
disadvantage when the mill is not fully mixed. In that case, the sam
ple would not be representative for the contents of the mill. As men
tioned above this error was measured experimentally.
er
The electrolyte used consisted of SO% water and SO% glycerol in which
10 g NaCl per liter was soluted. The powder was dispersed using a
stirrer. To test the effectiveness of this procedure some samples were_
also dispersed using an ultrasonic bath. Even after 30 minutes, no ef
fect could be detected on the measured particle size distribution.
14
The pulses of the Coulter Counter, the height of which is proportional
to the volume of the measured particles, pass through a pulse-shaper,
which adapts the pulses for the channel-analyzer. Its output pulses
have a height proportional to the logarithm of the input pulses and
are therefore proportional to the logarithm of the volume, i.e. to the
diameter of the particles.
Finally the height of these pulses is analyzed by the channel-analyzer
and one particle added to the specific channel, in which bounds the
height of the pulse falls. Thus, a particle size distribution of the
number of particles versus the logarithm of particle diameter is ob
tained.
The measured size distributions were punched on tape and fed into a
MINC-11 mini-computer, which first calculated the correction for coin
cidence in the measuring volume of the Coulter Counter and the dead
time of the channel-analyzer. Using calibration data, the number of
particle distribution was then converted to a volume distribution.
Also the statistical error could be calculated. Thus a distribution
was obtained of about so intervals per sample with an upper to lower
size ratio of 1.08.
2.4.3 analysis
As explained in the previous section, a size distribution is obtained
with about SO intervals. As this would lead to enormous numbers of
variables and equations in the least-squares procedure, for our analy
sis each time several volume fractions (usually six) as well as their
errors were taken together to form a new interval. The volume frac
tions were just added, while the errors were added quadratically.
These intervals, however, contain only particles above a certain mini
mum size. The nth interval should contain all particles below its up
per size level. To correct for the volume of the not counted parti
cles, we assume that if we would measure any particles in intervals
above t~ nth, the volume ratio of these intervals would be constant,
i.e.
15

v. 1 c
vi-1 i > n (2.14)
where C is a constant smaller than one. So now the contents of all
intervals above n, including the nth interval, is given by
(2.15)
The constant C is calculated using the intervals n-3 to n, assuming
equation (2.14) also holds for these intervals. The correction was
generally in the order of a few percent on the total distribution.
From all measured volumes vi at different moments t, using the least
squares method, the values of Si and bi1 can be obtained.
Figures 2.5 and 2.6 give the results of two of these fits. Shown is
the cumulative weight fraction Wi defined by
W. 1
i I w.
j=n J (2.16)
as a function of time. The drawn curves are the results of a computer
simulation using the values of and bil given by the least-squares
fit. As can be seen in figure 2.6, not all the measurements are neat
ly described by the used model. This was more evident in the experi
ments with more viscous gases. A computer fit using non-normalized
values of b .. yielded better results (broken line in figure 2.6). 1]
However, the significance of the results for Si and bij decreased due
to the larger number of parameters to be fitted. Hence, normalized
values were always used. This is also quite common in the literature,
although some work has been done on non-normalized values (16).
To investigate the influence of the number and size of the intervals,
several measurements were analyzed using other numbers and sizes. Some
results are shown in figures 2.7 and 2.8. HereS and Bare not shown
as functions of interval number, but as functions of particle size x,
as the intervals of the different analyses do not coincide. With S,
the value of x corresponds to the mean particle size of a g~\en inter
val; with B, it corresponds to the uppermost size of an interval, which
is in accordance with the definition of B.
16

w. l
0.5
0.2 Figure 2.5. The cumuZative weight
fraction ae a function of the in
terval number at several momenta, 0 .l
when milling in air at 0.01 bar,
using the coarse starting distri
bution. The drawn linea are the 0 • 0 5
result of a computer fit using
normalized b ..• ?,J
min
w. l
0.5
0.2
0 .l
0.05
0.02
7 5 i
3
0 min 0.02
7 5 3 i
Figure 2.6. The cumulative weight
fraction as a function of the in
terval number at several moments,
when milling in air at 7 bar, using
the fine starting distribution. The
d~awn linea are the result of a com
puter fit using normalizti!d b . . ; the 1,,1
broken line ie the result of a fit
using non-normalized b . .. ?,J
17
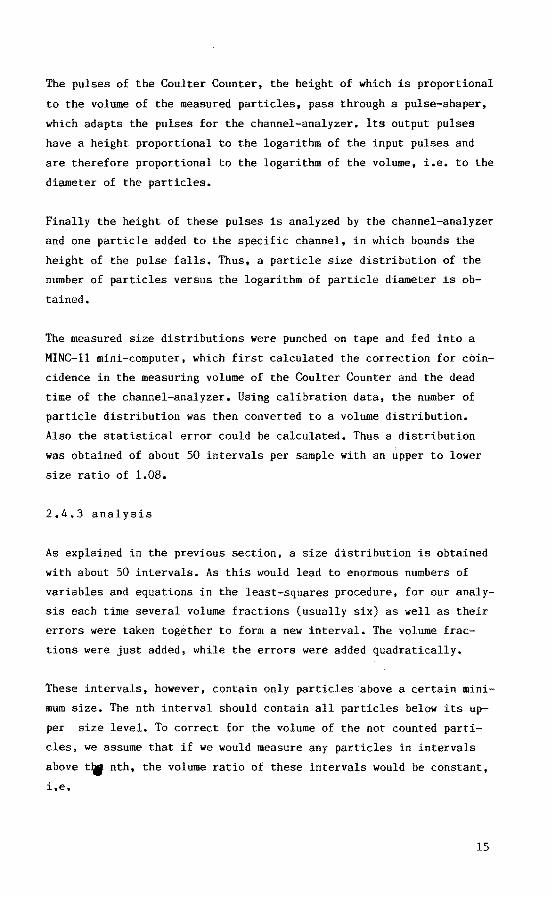
From figures 2.7 and 2.8 we can see there is good agreement between
the different analyses. Deviations are in the order of the experimen
tal error for all sizes. In order to keep the number of parameters
low, we will use the analysis with eight intervals and an upper to
lower size ratio of 1.56 for our further results.
0.02_
0.01-
0.005 r-
• •
...
0.001 ,_ I ,l 10 20
...
so
...
•
t ...
I
100 x (].Jm)
• t
I
200
Fig~ 2.7. The specific rates of breakage as a function of
the particle diameter using different numbers of intervals
and interval sizes:
• ~ 8 intervals~ size ratio 1. 56;
•~ 10 intervals~ size ratio 1.46;
&, 10 intervals~ size ratio 1.36.
18

0.5
0.2
0.1
0.05 FigUPe 2.8. The cumulative breakage
parameter as a function of particle
diameter using different numbers of
intervals and interval sizes: 0.02
a~ 8 intervals~ size ratio 1.56;
b~ 10 intervals, size ratio 1. 46; 0.01
a., 10 intervals., size ratio 1. 36. 50 100 X ()Jm)
As can also be seen from figure 2.7 for the higher intervals, smaller
particles, the experimental error is of the same order of magnitude as
the value of the parameter. These errors can be understood, as the to
tal milling time of one single experiment was of the order of 10/S1•
Hence, the lowest possible value of Si to be determined will be of the
order of s1/10. No conclusions can therefore be drawn for the higher
intervals and we will present only results for the four lowest inter
vals, largest particles.
No attempt has been made to fit the values of Si and bi1 to any func
tional forms, as there is no common understanding of these functions
and their physical meaning (12,16,17).
19
0.1 r- 0.01-
• • •
0.05 !- 0.005 -t 4 •
• • 51 • • 53 • • (min-I + t • (min-I)
• 0.02 !- t 0.002 -•
J • • + •
0.01 f-1 I ' I 0.001 I I 0.01 0.1 I 10 0.01 0.1 I 10
p (bar) p (bar)
0.02 ~ 0.01_
• • • •
I • • 0.01 • • f • 0.005 -!-
i t
52 54 • • t • • • {min~ 1 ) (min-t) • 0.005 -
. t t 0.002
-~ • • •
0.002 t-1 I I I 0.001 -I I I I
0.01 0. I I 10 0.01 0.1 I 10 p (bar) p (bar)
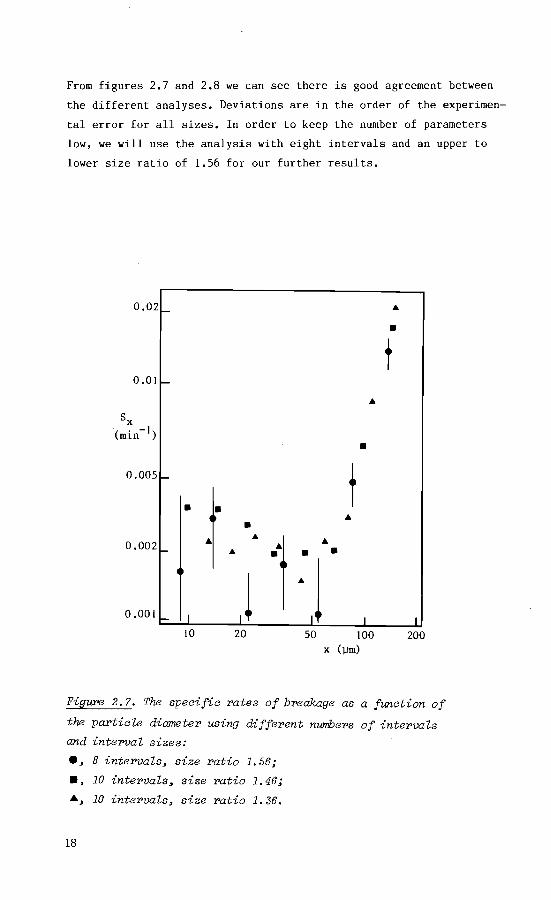
Fi~u:re 2. 9. The va~ues of the speaifia 2'ates of b2>eakage as a funation of
p2>essu:re fo2' thl'ee gases: e , ail'; •, hydr>ogen; • , neon.
20

2.5 RESULTS
Figures 2.9 and 2.10 give the results of the experiments for the spe
cific rates of breakage and the breakage parameters. All were obtained
using the fine starting distribution.
For the specific rate of breakage, we see a general increase in the
rate when the pressure or the viscosity of the gas is increased. For
air, we see a rather flat region in the range between 0.3 and 3 bar.
For hydrogen the rate is constant below 0.1 bar, while for neon, a
flat region seems to exist above 1 bar, although no measurements were
performed above 3 bar. For neon, at 3 bar only the values of s1 and s2 were determined due to the short milling time in this particular ex
periment.
Of the breakage parameter, only the values of b21 and b31 are given.
The other values were always small, less than 0.1, and showed very
high scatter between the individual experiments. As can be seen at
high pressures or viscosities, the value of b21 is high, about 0.8,
i.e. when a particle is milled, most of the product falls into the
interval directly below the original one. When pressure or viscosity
is decreased, the process gets finer: the value of b21 decreases and
the value of b31,and also of b41 , increases.
1- 0.5
1 I
t • • • • t • • •
t • •
0.5 r-0.2 -
b21 b31
\ •
0.1 ~ 0.2 r-•
b = 0 31,neon
0.1 ~ I I L 0.05 ~ I 0.01 0.1 I 10 0.01 0.1 I
p (bar) p (bar)
• •
Figure 2.10. The value of the breakage parameter as a function of pres
sure for three gases: e, air; •· hydrogen;&, neon.
21
I 10

The error bars in figures 2.9 and 2.10 are an illustration of the
accuracy. The errors of the points, where no bars are shown, are of
the same order of magnitude.
Some experiments were also performed using the coarser powder at the
start. A result is shown in figure 2 .11, where the weight fraction of
the first interval is shown as a function of time. At a certain moment
there is a change in the specific rate of breakage. After this time,
the milling could be described by the parameters as given in the fi
gures 2.9 and 2.10. Before this time, the rate of breakage was in the
order 0.01 min-1 and was independent of viscosity or pressure. The
change only occured for air and neon at pressures above 0.1 bar. For
the other cases, the results using the coarse and the fine starting
distribution were the same.
0.5
WI (t)
w1
(0)
0.2
0. l
0.05
0.02
Figure 2.11. The weight fraction of the
firet intePVa"L when miUing in air at
? bar, mi"L"Ling the coarse powder.
22
~. ~.
80 ( • ) 160 t m1.n

2.6 DISCUSSION
It is believed that the results should be correlated to the flow beha
vior of the powder in the mill. Using a highly viscous gas or a high
pressure, the powder flows very easily, like a liquid, while the bulk
volume is high. When decreasing the viscosity, the flow properties of
the powder decrease. At very low pressure, the powder does not flow at
all. It sticks to the wall of the mill, is carried up and falls down to
gether with the balls from the point, where equilibrium is reached be
tween the gravitational and centrifugal forces. These effects are shown
in figure 2.12, where the dynamic angle of repose is given for several
gases and pressures. This angle is defined as shown in figure 2.13. The
measurements were performed in the same apparatus and at the same speed
as the milling experiments.
(degr)
40
20 Figure 2.12. The angl-e of repose for <.;;;... ___ ....._ ____ .L... ___ __._-1
0.01 0.1 p (bar)l three gases as a function of pressure:
a, neon; b, air; c, hydrogen. d = 50 ~· p
Figure 2.13. The fiow of baUs and powder
inside the milZ at high gas viscosities. powder
23

A second indication is the sound of the mill: at high viscosity, a
soft scraping noise can be heard together with the sound of light
collisions. At low viscosity, the balls are really banging. So far it
has not been distinguished if this sound comes from collisions with
the wall, between balls, or both.
From these observations, it seems plausible that frequency and vio
lence of ball collisions with each other and with the wall of the mill
are strongly influenced by the flow behavior of the powder and fur
ther, that the effectiveness of the milling process should be correla
ted with this ball behavior.
The results at pressures above 1 bar cannot be explained using the
concept of the dependence of on pressure. Since at 1 bar the
free path of the molecules is already much smaller than the particle
size, the gas viscosity is constant at pressures above 1 bar. The
further change in the milling behavior is ascribed by us to the ad
sorption of gas on the particles, which influences the interparticle
forces, which in their turn influence the flow behavior. In fluidiza
tion, this adsorption does have a marked influence on the range of
homogeneous fluidization of fine powders.
We are continuing our investigations on both aspects, the ball be
havior in relation to the powder flow as well as the effects of gas
adsorption on powder flow.
2.7 CONCLUSIONS
The interstitial gas does have a marked influence on the milling para
meters. This influence can be easily understood qualitatively when
considering the powder flow. The changes in powder flow are a result
of the interaction between the two constituents of a powder, the gas
and the solid particles, and will be the subject of our future re
search. From the results, it also follows that during the milling the
rate of breakage can change due to the creation of finer particles and
a resulting change in powder flow. We measured an increase. Therefore
when milling fine powders (d < 100 urn), the powder flow should be ta-P
ken into account.
24

2.8 LIST OF SYMBOLS
a .. 1]
B
b .. 1]
c c.
J d
p F.
g
i
j
m
n
p
Q
s
1
s. 1
t
u a
u s
V. 1
W. 1
w. 1
X L
eigenvector- belonging to the eigenvalueS. in the J
solution of the mass-balance equations
cumulative breakage parameter
breakage parameter, part of interval j falling into
interval i
ratio of weight fractions for the highest intervals
constant in solution of mass-balance equations
particle size
interaction force between gas and particles per unit
volume
gravitational acceleration
interval number
interval number
number of particles counted in an interval
number of intervals
gas pressure
residue of the least-squares method
specific rate of breakage
error in measured weight fraction of the ith interval
time
typical speed of apparatus
slip velocity between gas and particles
measured weight fraction in the ith interval
cumulative weight fraction
weight fraction in the ith interval
particle size
porosity
lowest possible porosity
gas viscosity
particle density
25

2.9 LITERATURE
1 P.C. Carman Trans.Inst.Chem.Eng. 15(1937)15
2 L.G. Austin, K. Shoji and P.T. Luckie
3
4
V.K. Gupta and P.C. Kapar
L.G. Austin and P. Bagga
Powder Technology 14(1976)71
Powder Technology 10(1974)217
Powder Technology 28(1981)83
5 M.A. Berube, Y. Berube and R. Le Houillier
6
7
8
9
10
11
12
13
14
15
16
17
Powder Technology 23(1979)169
C. Bernhardt, H.J. Schulze and M. Ortelt
Powder Technology 25(1980)15
H. v. Seebach Zement, Kalk und Gips 5(1969)2
K. Shoji, S. Lohrast and L.G. Austin
Powder Technology 25(1980)109
K. Shoji, L.G. Austin and F. Smaila
Powder Technology 31(1982)121
A. Auer Powder Technology 28(1981)65
L.G. Austin and P.T. Luckie Powder Technology 5(1971)215
L.G. Austin Powder Technology 5(1971)1
G.W. Cutting
K.J. Reid
Powder Technology 15(1976)21
Chem.Eng.Sci. 20(1965)953
L.G. Austin and V.K. Bhatia Powder Technology 5(1971)261
L.G. Austin and P.T. Luckie Powder Technology 5(1971)267
V.K. Gupta, D. Hodouin, M.A. Berube and M.D. Everell
Powder Technology 28(1981)97
APPENDICES
2.A VISCOSITY AT LOW PRESSURES
We will compare the force F exhibited by a flowing gas, speed U, on a
tube with radius R and length L, where L » R. We will consider two
extreme cases : first, the case of viscous flow, where the free path A
of the molecules is much smaller than R, and secondly, the case of
free molecular flow, where A > R.
The first case is quite commonly known and the result is
F/L = 8 1r u1 U (2.A.1)
26

Where u1 is the viscosity of the gas at high pressures. This viscosity
can generally be written as
(2.A.2)
Where p is the density of the gas and vt the thermal velocity. The
numerical constant is just an order of magnitude~ The derivation of
this formula can be found in any text book on gas kinetics. Since PA is independent of pressure, it follows the viscosity ul is indepen
dent of pressure.
Let us now consider the case of free molecular flow. Again the gas
density is p, the flow velocity U and the mass of one molecule is M. The number of molecules entering the tube per unit time now equals
(2.A.3)
When we follow the path of a single molecule entering the tube it will
hit the wall after a distance in the order of R. At such a collision,
it looses its momentum in the direction of flow and will be scattered
in a random direction. Assuming there is a thermal equilibrium between
the wall and the gas the momentum exchange due to the thermal velocity
over many molecules will be zero. The effective momentum ex
change will therefore be MU. Now it will keep on colliding with the
wall and move in all kinds of directions, until it collides with an
other molecule and takes up the transport velocity U again. Between
this collision and the first one with the wall, the net transport and
momentum change will again be zero.
Now it moves again over a distance R, collides with the wall and
looses its momentum in the transport direction. This goes on until it
leaves the tube. The total number of effective collisions will then be
L/R, while the net momentum exchange per effective collision is MU.
The total force per unit length will now be
F/L = TI p U2 R (2.A.4)
We can now introduce an apparent viscosity (u2) in analogy with equa
tion (2.A.l)
u2 = P R U/8 (2.A.S)
27
The ratio of the two viscosities is
~1
~2
A vt 4-R U (2.A.6)
Hence, it follows that the apparent viscosity decreases at low pres
sures because A is larger than R and vt, order of 500 m/s, is much
larger than U, order of 0.01 m/s.
2.B THE LEAST-SQUARES SEARCH PROCEDURE
In this appendix we shall briefly discuss the least-squares procedure
we used and its theoretical background. We will not give a complete
analysis since this would be too lengthy.
Our assumption is that we have performed N independent measurements
which gave values yi. We also assume that these values have a Gaussian
distribution with a standard deviation o .• Of course we do not know 1
the real value of each variable we measured, but we can put the like-
lihood of it to be equal to x as
1 X- y. 2 fl(x ly. ,o.) -v exp (- -
2 (--1
) ) I 1 1 0.
1
(2.B.1)
We now also have a model fi(R) for each variable dependent on M inde
pendent parameters p., denoted as R• We can write J
(2.B.2)
or
(2.B.3)
where f(R) is the vector of theN models f.(R)• We now want to find the 1
most likely parameters. From equation (2.B.3) it can be seen this is
the case if
1 f. (R) - y. 2 Q =- ~( 1 1)
2 . 0. (2.B.4)
1 1
is minimal. Suppose this is true for R = ~· We now linearize f(R) with
respect to R at ~· So
28

f.(g) 1
of. I f.(g_) +I r- (p.- q.) 1 j pj Q=.9.. J J
(2.B.5)
Putting this into equation (2.B.4) it follows Q is in its extremum if
I 1 1 _1 0 (j = l,M) f. (.9.,) - y . Of . I
i oi opj Q=.9.. (2.B.6)
So the solution of the least-squares problem is the solution of equa
tion (2.B.6). Generally, equation {2.B.6) cannot be solved directly,
but an iteration is necessary. Suppose our momentarily best set of
parameters is L• We can then write
(2.B.7)
and also
(2.B.8)
Putting this into equation (2.B.6) we get
Of. I 0 ~ = 0 {j=l,M)
PJ Q=L (2.B.9)
which is a set of linear equations in qk- rk and therefore in qk. The
parameters found are used as the best fit for a new iteration until
the change in the parameters is below a certain value, e.g. their er
ror, or until Q does not decrease any more.
When .9.. is found we can write equation (2.B.4) using equations (2.B.S)
and (2.B.6) as
1 £.(.9..)-y.l TT Q = i ?( 1 o. 1) + {Q- .9..) A A{_g_- .9..) (2.B.10)
1 1
where A is a MxN matrix given by
1 Ofi I oi opj Q=.9..
(2.B.ll)
29

Of course, the parameter set ~ is not exactly true, but given our ex
periments, it is the most likely one. Therefore we also need the errors
in the parameters, i.e. their variance, defined by
(2.B.12)
E(x) is the expected value of x geven yi and ai. The likelihood of~
given~· y. and a. using equations (2.B.3) and (2.B.10) is 1 1
A(~l~,y. ,a.) "- exp(-(~-~)TATA(~-~)) (2.B.l3) 1 1
Using
where V is a MxM matrix, it can be derived that
V(pj'pk) = vjk
It can also be derived that
E(Q) = N
E((~-_q)TATA(~-~)) = M
and therefore using equation (2.B.l0)
1 f.(~) - y. 2 E (z H 1 a. 1) )
1 1
N-M
(2.B.14)
(2.B.l5)
(2.B.16)
(2.B.17)
(2.B.18)
This summation can also be calculated after the parameters have been
found. Equation (2.B.l8) gives us then a check on our model, since it
is derived using the overall assumption that if we could measure the
real values of the variables, so ai=O, then also our model would fit
to this measurement exactly, so fi(~) - yi = 0.
Some final remarks are:
The variables need not all be of the same dimension, since the
division by the error makes each term in the summation always di
mensionless.
- Of course, all the parameters have to be independent. If this is
not so, parameters have to be skipped until an independent set is
obtained. Otherwise, an infinite number of parameter combinations
would give the same solution. In practice, also parameters which
are almost dependent have to be skipped, where almost depends on
30

the accuracy of the computer used. The easiest way to do this
skipping in a program is to put the value of a dependent parameter
to zero. So in fact another equation is added to the equations in
in equation (2.B.9), making the parameters independent again.
A non-linear least-squares can have more minima. But there is al
ways only one global minimum. If it is thought that the minimum
found by the procedure is not the global one, e.g. the summation in
equation (2.B.18) is much larger than N-M, other starting values of
~ for the iteration can be tried,
31
3 THE EFFECT OF INTERSTITIAL GAS ON MILLING, PART 2
Published in Powder Technology
Coauthors: K. Rietema and S. Stemerding.
3.0 ABSTRACT
In a previous paper (1) results were presented on the effect of inter
stitial gas on the milling characteristics of one specific fine powder
in a ball mill. This second paper gives more data on two other pow
ders, cracking catalyst and hematite, together with those on the pow
der used in the earlier experiments, quartz sand. The effects found
are similar for each of the three powders: increasing gas pressure or
viscosity of the gas or both inside the mill increases the rate of
breakage and decreases the fineness of the daughter particles of a
milling event. The overall milling speed or production rate as well as
the ultimate fineness of the product improved when increasing pres
sure or viscosity of the gas.
On the basis of these results a comparison is made with wet milling.
It appears that milling at a pressure of around 10 bar is a good al
ternative for the milling of fine powders.
3.1 INTRODUCTION
In a previous paper (1) we reported on the effect of interstitial gas
on the milling characteristics of quartz sand in a laboratory size
ball mill. The results of this first paper encouraged us to continue
the investigation into the effect of interstitial gas on milling. In
this second paper we present results of this investigation on two
other powders, i.e. hematite and cracking catalyst. These two powders
are quite different in characteristics, except for the size range.
They also differ widely from the quartz sand.
In the previous paper an analysis is given which indicates when inter
action between powder particles and the surrounding gas can be expec
ted to have noticeable influence. A more accurate analysis is given by
Rietema (2), who considers the situation which arises in powder hand-
33

ling as a result of the continuous reshuffling of the powder, causing
gas to be entrapped into the powder. This gas tries to escape from the
powder which in this way becomes fluidized. The thus generated inter
action between gas and powder becomes important when the typical sett
ling time of the powder is long as compared to the characteristic
turnover time of the powder. This leads to the following condition
which has to be satisfied
N g
(3.1)
In other words, if this condition is satisfied gas-powder interaction
can be expected to have a bearing on powder behavior. The dimension
less number, N , will henceforth be called the gas-powder-interaction g
number. Putting in some typical values leads to
d « 100 ].1m p
(3.2)
So interaction will only be important for rather fine powders, where
the upper value of 100 ].1m is of course only a rough estimate, espe
cially since not only the particle size but also the particle size dis
tribution should be taken into account.
The gas-powder interaction leads to a higher porosity: the gas, that
is entrapped during the agitation, fluidizes the powder while flowing
out and, in this way, the settling of the powder after the agitation
is slowed down. The smaller the gas-powder-interaction number, the
higher the average porosity will be. The increase in porosity in turn
will enhance the flowability. Of course, there is a maximum to this,
since at very high porosities part of the gas will escape as bubbles.
(Note that the higher the gas influence the lower the gas-powder
interaction number).
Here it should be put forward that in particle mechanics the effective
gas viscosity is generally not an independent gas parameter, but de
pends also on the particle size involved: when the free path of the
gas molecules becomes comparable to the pore size the effective gas
viscosity drastically decreases and thus the gas-powder interaction
diminishes.
34

Another property of such fine powders is their cohesiveness. Cohesion
is of great influence on the nature of fluidization and since this
phenomenon is so closely related to the interaction between gas and
powder in a mill, cohesion will most likely also influence the gas
powder interaction. Interparticle forces may stabilize the powder
structure so that the powder will be fluidized homogeneously and the
formation of gas bubbles is prevented. Hence, the time required for
escape of the gas is extended to that in the case of a less cohesive
powder. Thus the general flowability of a powder after agitation may
be improved by increasing its cohesiveness.
Of course, this improvement will not continue forever when the inter
particle forces keep increasing, since at very large cohesiveness it
will become impossible to expand the powder homogeneously. In that case
vertical channels arise in the powder mass through which the gas can
easily escape (channeling). However, at not too large cohesiveness,
when the powder is continuously reshuffled by stirring or other means,
the particle-contacts are frequently broken as well as the gas chan
nels. So the gas cannot escape as easily with the result that yet the
powder will expand.
As reported by Piepers (3), at elevated pressures, above 1 bar abso
lute, the surrounding gas may increase thecohesivenessdue to adsorp
tion of gas at the surface of the particles. Thus it must be expected
that when gas pressure is increased from absolute zero to pressures
above 1 bar the flowability of fine powders is increased: firstly un
der 1 bar due to the increase of the effective gas viscosity, then,
above 1 bar, due to the adsorption of gas at the particle surfaces.
This difference in flowability was visually confirmed indeed during
milling experiments at various pressure levels. When looking through
a glass flange at one end of the mill, it appeared that at low pres
sures the powder forms a rather compact layer on the wall of the mill
which moves up together with the balls and finally falls down in dis~
crete packages of powder to become part again of the layer on the
wall. A very thin layer is even carried around completely, although it
is incidentally broken up by falling balls. At elevated pressures the
lower part of the mill is filled with a very airy powder mass, which
35

more or less looks like a liquid. A thin layer moves up with the balls
and falls down again on the mass thus aerating the mass.
3.2 CHARACTERIZATION OF POWDERS USED IN THE MILLING
EXPERIMENTS
In order to further investigate the effects found in the earlier ex
periments, new experiments were carried out with two powders of which
the milling characteristics differ from those of the quartz sand used
previously. Data on these two powders as well as the quartz can be
found in table 3.1. Photos 3.1 to 3.3 show the different powders.
The cracking catalyst is a powder, the particles of which consist of
aggregates formed by spray drying of a suspension of very small par
ticles, size less than 1 vm. These aggregates, which have a high in
ternal porosity, are rather easy to break. Of course, it is much more
difficult to mill the elementary, very small particles. However, the
resulting particles of any such process are far below the detection
limit of the Coulter Counter, which was used for the particle-size
measurement. The initial catalyst powder is slightly cohesive, while
during the milling process this cohesiveness of course increases. The
original powder shows a typical A-powder-behavior in Geldart's classi
fication on the fluidization behavior of powders (4). Also after a
long milling time the resulting powder remains in this category al
though less prominent.
The hematite on the other hand is a very cohesive powder with group
C-behavior in Geldart's classification. The powder consists of rather
large particles to which an abundance of fines is adhered. The deta
ching of these fines is very difficult to achieve and could only be
accomplished by means of ultrasonic equipment. This treatment, there
fore, was applied to each sample which was taken to perform a measure
ment of the particle size distribution. Of course, the effective par
ticle size inside the mill is somewhat larger due to the adherence of
the fines. However, the ultrasonic treatment yielded better reprodu
cible results.
36

The quartz sand of the earlier experiments was initially a free flo
wing powder showing B-powder-behavior in Geldart's classification. During milling the number of fines increases drastically and after some
time the powder shows group-C-behavior.
Photo 3.1. The initial quartz sand.
37
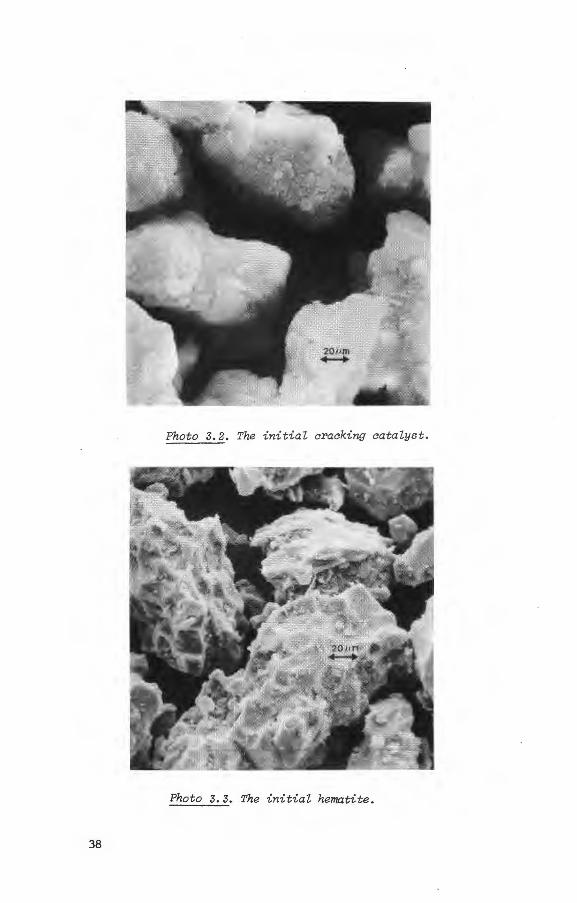
Photo 3.2. The initial cracking catalyst.
Photo 3.3. The initial hematite.
38

quartz sand:
pd= 2600 kg/m 3, N = 8, main constituent Si02 g
interval range (urn) weight % 1 89-140 13
2 56-89 59
3 35-56 19
4 22-35 5
5 14-22 2
6 9-14 1
7 < 9 1
cracking catalyst:
p d= 750 kg/rn3, N = 8, main constituent Si02-Al203 g
interval range (urn) weight % 1 66-104 34
2 42-66 48 3 26-42 17
4 17-26 1
5 11-17 0
6 7-11 0
7 < 7 0
hematite:
Pd= 4900 kg/m3, N = 11, main constituent Fe2o3 g
interval range (urn) weight %
1 56-89 15
2 35-56 so 3 22-35 25
4 14-22 6
5 9-14 2
6 < 9 2
Table 3.1. Data on the powders (the dimensionless number N is ealg
eulated for air at 1 bar and U = 0.1 m/s) a
39

3.3 EXPERIMENTAL RESULTS
As has been discussed extensively in the earlier paper (1) the milling
process can be described by two different sets of parameters. First of
all the rates of breakage, denoted by Si. These parameters are defined
as the total decrease per unit time of the weight fraction of a speci
fic size interval i per unit weight present in the particular size
interval due to the milling of the particles present in that interval
only, or
dw. S.
l (dtl) milling interval i (3.3)
in which wi is the weight fraction, while interval 1 contains the lar
gest particles.
The second set of parameters concerns the milling fineness. These
parameters, generally called the breakage parameters, bij' are defined
as the increment of the weight fraction of interval i that results
from the milling of interval j
ow. dw. b .. =
l (d/)milling interval
(3.4) l] -ow.= j
J
Assuming no agglomeration the milling process can be described com
pletely with these parameters, see e.g. (5). The assumption of no
agglomeration is, as will be shown later, not always justified. It
leads, however, only to small errors in the parameter values, because,
if agglomeration occurs, it becomes important only, when sufficient
fines are present, i.e. after a long milling time. Hence, it manifests
itself merely at the end of the milling process.
The experimental procedure consisted of taking small samples at regu
lar time intervals from the mill. These samples were analyzed by a
Coulter Counter. In each individual experiment about 20 to 30 samples
were taken. Using the measured size distributions the two sets of
parameters were established by a least-squares fit. Any more details
can be found in the first paper (1), where all steps of this procedure
are extensively discussed. In this first paper it is also shown that
the observed milling process can indeed be described using the two
40

sets of parameters defined above.
Figure 3.1 shows the values of the rate of breakage for the intervals
1, 2 and 3 of the powders concerned (actual sizes are given in ta
ble 3.1) for different pressures of air. The catalyst was milled using
ceramic balls; hematite and quartz using steel balls. All other ex
perimental conditions were equal and are shown in table 3.2.
As shown in figure 3.1 all powders follow generally the same trend:
the rates of breakage increase with increasing pressure. It can also
be seen that for the higher rank intervals, smaller particle sizes,
the effect becomes stronger. This is probably due to the fact that the
milling of a higher ranking interval is of importance not before rela
tively long milling times, i.e. when the change of the weight fraction
of the particular interval is mostly caused by milling of that inter
val and hardly any more by any influx of products of lower intervals.
This means that the rate of breakage of the higher rank intervals is
determined at a moment that the contents of the mill are finer and
thus the gas influence is larger.
Figure 3.2 shows the results for the breakage parameters of the two
most important size intervals. Again we see a similar behavior for
each of the three powders: a general decrease in fineness with in
creasing pressure, because b21 increases, while b31 decreases. So more
products of the milling of particles originally in interval 1 belong
to interval 2, instead of to interval 3, when the pressure is in
creased.
mill length 195 mm
diameter 150 mm
speed of rotation 80 rpm
balls diameter 16 mm
load 240 pieces
15 % of mill volume
powder bulk volume 15 % of mill volume
TabeZ J.2. Data on the experimental conditions.
41

0.2 r-
0.1 r-sl •
(min-1 ) • • • 0.05 • • r-
... • ... ... ...
0.02 - ... ... • • • ... • • -0.001 -I I I I •
0.01 0.1 I 10 • ... p (bar)
0.01 f-. • ... ... • ...
0.005 r-• ...
• s2 ...
(min- 1 ) • ...
0.002 -0.02 • -
1-l I I I
0.01 • 0.01 0.1 I 10 - p (bar) • ...
Figure 3.1. Values of the speai.fia
0.005 - ... • ... rates of breakage as a funation of s3
... • pressure of the interstitial gas
(min- 1 ) • • ... for three different powders:
• .... quartz sand, 0.002 r- • •• araaking aatalyst, ...
•• hematite .
0.001 f--.1 • I I I 0.01 0.1 I 10
p (bar)
42
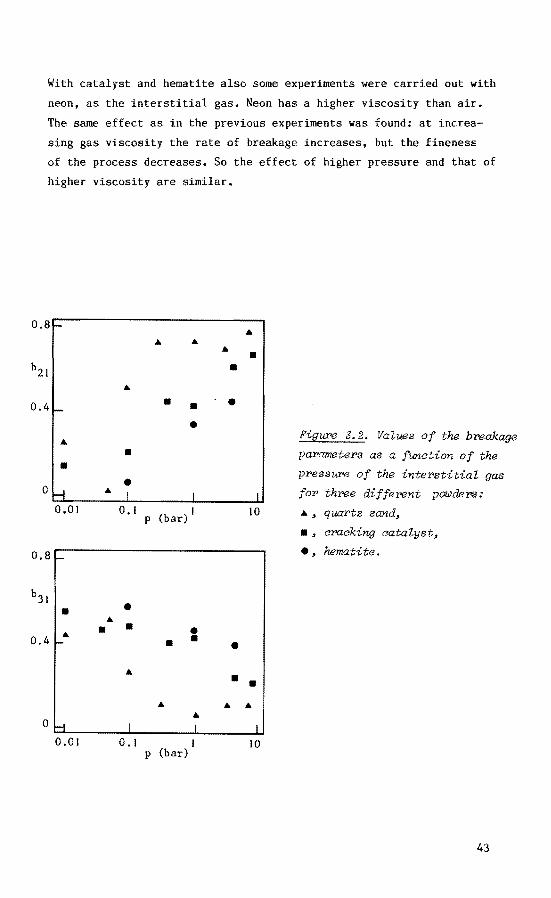
With catalyst and hematite also some experiments were carried out with
neon, as the interstitial gas. Neon has a higher viscosity than air.
The same effect as in the previous experiments was found: at increa
sing gas viscosity the rate of breakage increases, but the fineness
of the process decreases. So the effect of higher pressure and that of
higher viscosity are similar.
0.8 r- .. .. .. .. • b21 • 0.4 • • • 1-
• .. Figu:ru 3. 2. Values of the breakage
• parameters as a funa~ion of the •
• pressure of the interstitial gas OH_ ..
I I I for three differ>ent powdero: 0.01 0.1 I 10 ·~ quartz sand~ p (bar) . ~ oraoking oataZyst~
0.8 - ·~ hematite.
b31
• • .. • • • ..
0.4 - • • • .. • • .. .. .. .. 0 1-1 I I I
0.01 0.1 I 10 p (bar)
43
3.4 DISCUSSION
3.4.1 comparison with wet milling
First of all it is interesting to make a comparison with the results
of experiments found in the literature on wet milling, Unfortunately,
no results could be found on the wet milling of such fine powders as
we used. However, it appeared to be quite informative, as shown in fi
gure 3.3, to compare with the results of wet milling of much coarser
particles. The results of the rate of breakage versus the particle
size, as represented by the lines in the left side of figure 3.3, were
taken from Austin (6). He also used quartz sand, but with an initial
size range from about 100 to 1000 urn. In order to be able to compare
the results we brought the particle size on a dimensionless basis by
relating it to the mean particle size of the interval containing the
largest particles. That mean size was the same in corresponding ex
periments, viz. dry/wet (Austin) or non-pressurized/pressurized
(ours). In a similar way the rates of breakage were made dimension
less. For dry/wet milling the rates were related to the value be
longing to the first interval of wet milling. For the other combina
tion the value of the first interval belonging to pressurized milling
was used.
At the right side the cumulative breakage parameter, B, for the pro
ducts of the first interval is shown. This parameter is for a given
particle size defined as the fraction of the milling product of inter
val 1 being smaller in diameter than this given size. The data on this
parameter were taken from Berube (7), who also used quartz of about
the same size range as Austin. The particle size is made dimensionless
in the same way as in the left figure.
Figure 3.3 now shows a great deal of similarity between the cases dry/
wet and non-pressurized/pressurized respectively: the rate of breakage
increases, but the fineness decreases when milling wet instead of dry,
or pressurized instead of non-pressurized. The first conclusion is ap~
parent from the figure on the left side, The second one follows from
the figure on the right side: for wet milling the B-curve falls under
that of dry milling. So, less of the product is smaller than a given
44

0.5
cr
0.2
0.1
0.05
Figur-e J.J. A comparison of the change in milling characteristics
when converting from dry milling to wet milling versus the change
when converting from non-pressurized milling to pressurized milling.
Dry milling: solid lines, wet milling: broken lines.
Non-pressurized miZling: •, pressurized milling: •·
size limit, when milling wet. The same holds for non-pressurized/pres
surized milling.
Another observation in this respect made by Berube is that
the rate of breakage of the lowest rank interval, i.e. with the lar
gest particles, increases with time during wet milling. Initially it
is about equal to the value during dry milling. As already mentioned
in our previous paper we made the same observation when milling at
elevated pressure using rather coarse initial powder: initially the
milling speed is equal to the value at very low pressures (0.01 bar).
When the fines content increases, the rate of breakage increases to
the value obtained at elevated pressure as depicted in figure 3.1. It
must be put forward here that this similarity does not necessarily
mean that the two phenomena can be ascribed to the same cause. In
fact, our results can be explained by a decreasing powder viscosity,
due to the increase in gas-powder interaction, when the particle size
45

decreases and thus the gas-powder-interaction number also decreases
(see formula 3.1). In the case of Berube, however, the viscosity of
the slurry increases instead of decreases with the increase of the
fines content. Moreover, Berube states that this increase will be only
minor, since the increase of fines is rather small and he is unable to
explain his results when considering the influence of the viscosity of
the slurry.
An argument for wet milling against dry milling, next to the increase
in the rate of breakage, is the smaller rate of agglomeration. Here
again we see a similarity with pressurized milling. Figure 3.4 gives
data on the effect of gas pressure on the final value of the weight
fraction of the first interval, containing the largest particles. This
final value was established, when after a sufficiently long milling
it remained constant, Thus a steady state is reached, which results
from an equilibrium between agglomeration and breakage of agglome
rates. As a side remark it should be pointed out that the rate of
breakage of agglomerates is probably not equal to the rate of breakage
of the original particles of this interval, since the structure of ag
glomerates is quite different, as was detected by observation through
a microscope.
Figure 3,4 now shows that the final value of the weight fraction of
the first interval decreases with increasing pressure. At pressures
above 3 bar or when milling in neon, higher viscosity, it even becomes
zero. Whether this effect is due to a higher rate of breakage or to a
lower rate of agglomeration or to both has not been , How-
ever, it appears that milling at elevated pressures results in a finer
product than milling at 1 bar.
3.4.2 simulation of continuous, pressurized milling
The mathematical description we used for our batch grinding experi
ments can easily be extended to a description for continuous milling
with or without classification. Treatises on this can be found in the
literature (5,8). In essence the extension consists of introducing
terms for feed and product flows in the rate equations, while assuming
a stationary size distribution inside the mill, 3.5 gives the
46
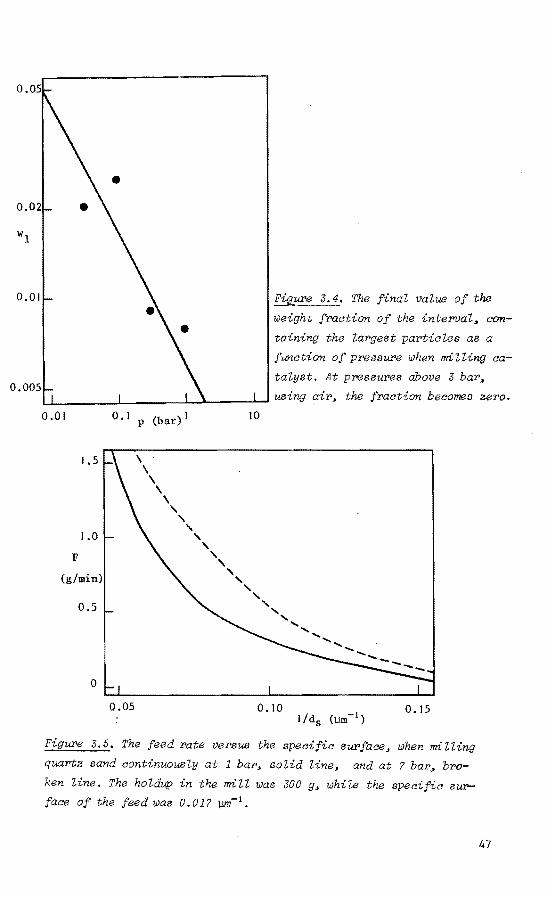
Fi~W'e 3. 4. The final valua of the
weight fraction of the interval, con
taining the largest particles as a
function of pressure when milling ca
talyst. At pressures ohove 3 bar,
u ____ _L ____ ..._..~-___ ........ using air, the fraction becomes zero.
0.01
1.5
1.0
F
(g/min)
0.5
0
0.1 P (bar) I
\ \ \
\ \
' ' ' '
0.05
' ' ' ' '
10
' ' ' '' ..........
0.10
.............. ....... _
------0.15
Figure 3.5. The feed rate versus the specific surface, when milling
quartz sand continuously at 1 bar, solid Zine, and at ? bar, bro
ken line. The holdup in the mill was 300 g, while the specific sur
face of the feed was 0.01? llm- 1 •
47

result of a computer simulation of continuous milling using rates of
breakage and breakage parameters of quartz sand as found in our expe
riments for the cases of low and high pressure inside the mill. Here
the feed rate versus the specific area of the product, i.e. the in
verse Sauter mean diameter, d , is shown. In this simulation no clas-s sification was used, i.e. no recirculation of particles above a cer-
tain size limit. The mill was assumed to be fully mixed. The results
show that, when a certain specific area is wanted, the feed rate can
be increased by almost a factor of two by operating at a pressure of
7 bar.
Simulations on a milling circuit with classification show similar in
creases in production rate, i.e. the amount of powder below a given
size limit produced per unit time.
3.4.3 comparison of power consumption
We compared also the power consumption for the three types of ball
milling, i.e. simple non-pressurized dry milling, wet milling and
pressurized dry milling. We assumed batchwise operation. Figure 3.6
shows the total power consumption as a function of product of the mil
ling time and the relative production rate for these three cases. Data
used to prepare this figure can be found in table 3.3. Since for a
specific result the product of the production rate and the milling
time is, of course, the determining factor, the parameter on the hori
zontal axis in figure 3.6 is directly a measure of the obtained
results.
It shows that simple dry milling from the viewpoint of production
costs is always less attractive than pressurized dry milling. When a
very fine powder is wanted and thus a long milling time is necessary,
wet milling finally becomes more advantageous. Of course, capital
costs need also to be taken into account. These will be the lowest for
dry milling and, probably, the highest for pressurized milling.
As mentioned it was assumed that finally all three processes can give
the desired results. This will not always be true, since e.g. wet and
pressurized milling decrease the rate of agglomeration and thus in-
48

crease the ultimate product fineness, During the drying process, ne
cessary if the product needs to be dry, however, agglomeration can oc
cur again, This disadvantage is not present when milling pressurized,
This consideration in itself can be a reason for pressurized milling.
1.5
l.O
w
(MWh/ton)
0.5
0 -----0
~------- ... ---- _ ............ --_ ... .,. .,. -pressurized --
2 t•P (hours)
4
Figure 3.6. The total power used for three different types of milling
versus product of the milling time and the relative production rate.
dry wet pressure
power required to drive 300 300 300 the mill (kW/ton)
relative production rate, 1 3 2 p
drying (30 weight % water) 300.
(kWh/ton)
pressurization (20 bar) 12 (kWh/ton)
Table J. 3. Power· data for three types of milling. A mill volume of
7 m3 per ton powckr was assumed.
49
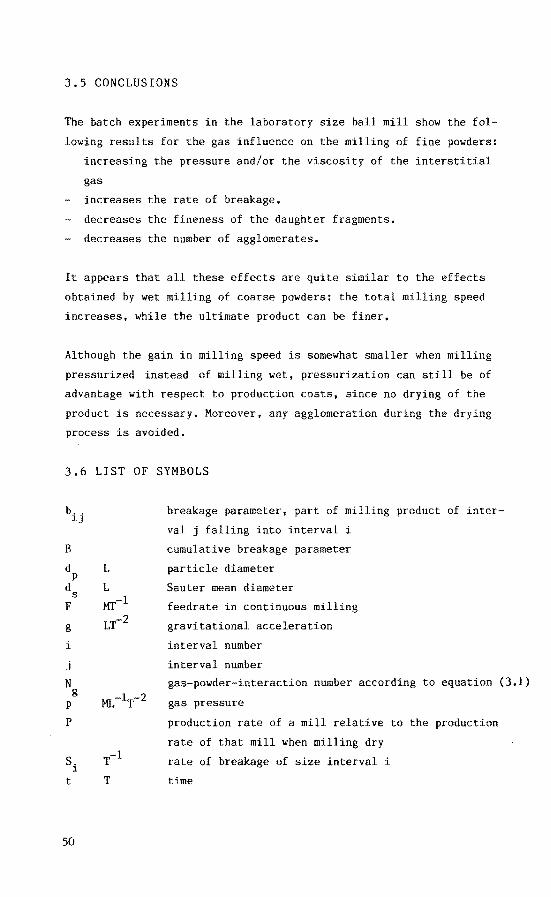
3.5 CONCLUSIONS
The batch experiments in the laboratory size ball mill show the fol
lowing results for the gas influence on the milling of fine powders:
increasing the pressure and/or the viscosity of the interstitial
gas
increases the rate of breakage.
decreases the fineness of the daughter fragments,
decreases the number of agglomerates.
It appears that all these effects are quite similar to the effects
obtained by wet milling of coarse powders: the total milling speed
increases, while the ultimate product can be finer,
Although the gain in milling speed is somewhat smaller when milling
pressurized instead of milling wet, pressurization can still be of
advantage with respect to production costs, since no drying of the
product is necessary. Moreover, any agglomeration during the drying
process is avoided.
3.6 LIST OF SYMBOLS
b .. lJ
B
d p d s F
g
i
j
N g p
p
S. l
t
50
L
L MT-1
LT-2
ML-lT-2
T
breakage parameter, part of milling product of inter
val j falling into interval i
cumulative breakage parameter
particle diameter
Sauter mean diameter
feedrate in continuous milling
gravitational acceleration
interval number
interval number
gas-powder-interaction number according to equation (3.1)
gas pressure
production rate of a mill relative to the production
rate of that mill when milling dry
rate of breakage of size interval i
time
u a
w. 1
w
typical speed of apparatus in which a powder is
handled
weight fraction of size interval i
power required to produce an amount of milled and
dried powder dimensionless particle diameter parameter
ML-lT-l gas viscosity
ML-3 particle density
dimensionless rate of breakage parameter
3.7 LITERATURE
1 w. Cottaar and K. Rietema Powder Technology 38(1984) 183
2 K. Rietema Powder Technology 37(1984)5
3 H. Piepers, E.J.E. Cottaar, A.H.M. Verkooijen and K. Rietema
Powder Technology 37(1984)55
4 D. Geldart Powder Technology 7(1973)285
5 L.G. Austin Powder Technology 5(1971)1
6 L.G. Austin, P.Bagga and M. Celik
Powder Technology 28 (1981) 235
7 M.A. Berube, Y. Berube and R. le Houillier
Powder Technology 23(1979)169
8 L.G. Austin, V.K. Jindal and C. Gotsis
Powder Technology 22(1979)199
51

4 THE EFFECT OF INTERSTITIAL GAS ON MILLING: A CORRELATION
BETWEEN BALL AND POWDER BEHAVIOR AND THE MILLING CHARAC
TERISTICS.
Submitted for publication to Powder Technology
Coauthor: K. Rietema.
4.0 ABSTRACT
In two earlier papers (1,2) the effect of interstitial gas on milling
was reported. It showed that these effects were well correlated with
changes in powder porosity and by consequence the changes in powder mo
bility due to variation of gas viscosity and pressure.
In this paper the cause of this correlation is further investigated.
from a close visual inspection of the processes in a ball
mill a model is developed in which the milling characteristics are
correlated to the ball flow and the powder behavior during ball colli
sions. From experiments it follows that both are influenced by powder
mobility.
4.1 INTRODUCTION
In two earlier papers (1,2) we reported on our experimental results
about the effect of the interstitial gas, the gas filling of the mill,
on the characteristics of dry milling of fine powders, particle dia
meter less than 100 ~m, in a ball mill. It was found that for three
quite different powders (quartz sand, fresh cracking catalyst and he
matite) the effect was very similar: the gas viscosity, by
applying different gases, and (or) the gas pressure resulted in an in
crease of the rate of breakage, i.e. the amount of material milled per
unit of time, and in a decrease of the fineness, i.e. the in-
crease in total surface when a particle is crushed.
As an example figures 4.1a and 4.1b give the rates of breakage for two
powders as a function of gas pressure and gas viscosity respectively.
Figures 4.2a and 4.2b show the corresponding milling fineness, which
is defined as
53

S I, 52 e S I, 52 e (min- 1) A (min-1§ e e e B e 0.0 1- e e
0.02 I-e
0 0 0.01 - e 0 0.02 1- 0
0
0
0.005 f- 0.01 I- 0
0
I 01 I I I 0.005 ~o-P I I I
0 2 3 4 0.01 0.' J 10 ~ (kg/ms) p (bar)
FigUX'e 4.1 The rates of breakage as a fwwtion of v1:seosity and gap,
pressure:
A: quartz sand: interval 1 (e) ?7 - 121 ~m
2 (0) 48 - 77 ~
B:cracking catalyst: interval (e) 66 - 104 ~m
2 (0) 42 - 66 um
4_ A • 3 -
F • F
3!-- 2. 75_
• 2.5 1-
2r- • I I I I I l 0 I 2 3 4 0.01
~ (kg/ms)
B
• • •
• • •
I I I 0.1 I 10
p (bar)
Figure 4.2. The milling fineness as a function of gas viscosity
and gas pressure for a quartz sand and a cracking catalyst respec
tively
54
6 d1 F = L b.1 d
i=2 ~ i (4.1)
where bi1 are the breakage parameters of the first interval and di de
notes the average size of the ith interval. Note that the minimum va
lue of F (b21~1) is given by d1/d2 which was 1.58 for our experiments.
It was also observed that the milling characteristics correlate well
with the average porosity of the powder. The higher the gas viscosity
or the higher the gas pressure the more porous the powder. The porosi
ty in its turn influences the mobility of the powder. (The similarity
between the effects of gas viscosity and pressure are explained in the
first paper (1)).
The authors believe that the results of the milling experiments should
be explained by the changes in powder mobility and consequently in
ball behavior and ball-powder interaction. In this paper we will
therefore further investigate these phenomena.
4.2 VISUAL OBSERVATION OF THE MILLING PROCESS
Before presenting our model we will describe the qualitative, visual
observations made by us, since we developed our model from these ob
servations.
As already pointed out in the first paper (1) the powder porosity,
and, therefore, the powder mobility, can change quite drastically with
varying gas pressure and (or) viscosity. Two extreme cases can be ob
served:
At low pressure, below 0.03 bar with air, porosity and mobility of
the powder are very low.
At relative high pressure, above 0.3 bar with air, porosity and mo
bility are high.
In this paper we shall only consider these two extreme cases and not
deal with intermediate states. Nor shall we deal with the effect of
gas viscosity which is quite similar to that of pressure. Next to
these two extremes of gas pressure we shall consider a variation in
55

Powder flow:
gas pressure 0.01 bar gas pressure l bar
average porosity low average porosity high
Ball movement:
gas pressure 0.01 bar
fa 11 i ng -z__ balls
balls
Figure 4. 3. •The powder fiow and baH movement at t!Jo gas pressur>es.
ball load. The visual observations were made in the same apparatus as
used for the earlier milling experiments, one metal flange being re
placed by a glass one. The powder and ball flow patterns are sketched
in figure 4.3. All relevant equipment parameters are given in table
4.1.
Regarding the powder flow the following observations were made:
56
Low gas pressure results in a low powder porosity. Most of the pow-·
der fills the space between the balls in the lower right section of
the mill and is carried upward with the balls (mill turning anti
clockwise). From a certain point the major part of the powder flows
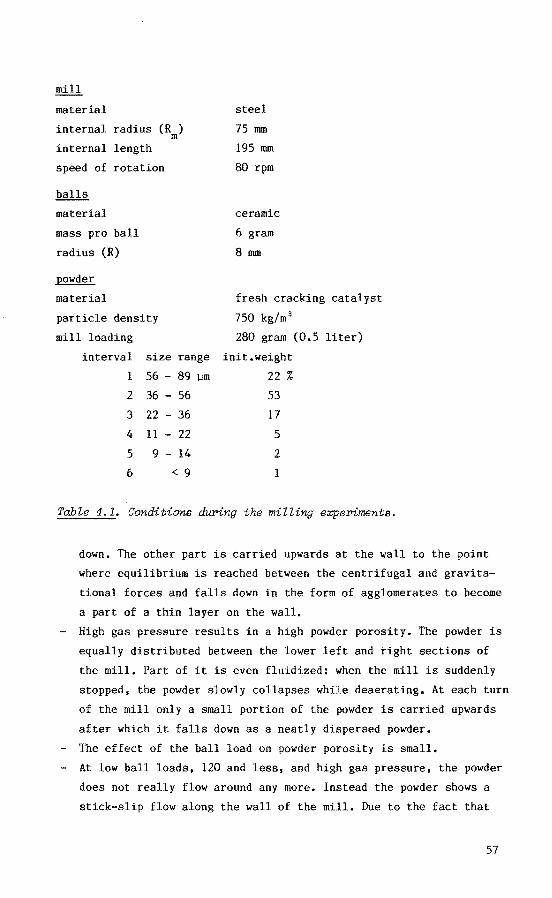
mill
material steel
internal radius (R ) 75 mm m internal length 195 mm
speed of rotation 80 rpm
balls
material ceramic
mass pro ball 6 gram
radius (R) 8 mm
powder
material fresh cracking catalyst
particle density 750 kg/m 3
mill loading 280 gram (0.5 liter)
interval size range init.weight
1 56 - 89 ).Jm 22 % 2 36 - 56 53
3 22 - 36 17
4 11- 22 5
5 9 14 2
6 < 9 1
Table 4.1. Conditions during the milling experiments.
down. The other part is carried upwards at the wall to the point
where equilibrium is reached between the centrifugal and gravita
tional forces and falls down in the form of agglomerates to become
a part of a thin layer on the wall.
High gas pressure results in a high powder porosity. The powder is
equally distributed between the lower left and right sections of
the mill, Part of it is even fluidized: when the mill is suddenly
stopped, the powder slowly collapses while deaerating. At each turn
of the mill only a small portion of the powder is carried upwards
after which it falls down as a neatly dispersed powder.
The effect of the ball load on powder porosity is small.
At low ball loads, 120 and less, and high gas pressure, the powder
does not really flow around any more. Instead the powder shows a
stick-slip flow along the wall of the mill. Due to the fact that
57

the aeration of the powder is drastically decreased the average
powder porosity also decreases. It remains, however, well above the
porosities observed at low pressure levels.
When considering the ball movement three different types can be dis
tinguished. At the bottom of the mill rolling balls are observed.
These balls are closely packed and move upwards. Generally there is a
slip of these balls at the wall.
Over these rolling balls cascading balls can be seen. They are more
loosely packed and move downwards while rolling and jumping over one
another and over the rolling balls. Their falling height between two
collisions is of the order of the ball radius.
Finally balls can be distinguished which fall down over a distance of
typically the radius of the mill. Of course, these falling balls as
well as the cascading balls have been part of the rolling balls
whilst being carried upwards.
When varying gas pressure and ball load the following effects were no
ticed:
At low gas pressure the number of falling balls per unit of time is
is higher than at high gas pressure.
At very low ball loads for none of the gas pressures used any fal
ling balls were observed.
At low gas pressure the plane in which the cascading balls come
down, is steeper than at high pressure, Its slope also increases
with increasing ball load.
- At high gas pressure and ball loads of 120 and less, the balls do
not flow around. Instead they show a stick-slip behavior along the
wall of the mill quite analogously to the behavior of the powder at
these conditions.
58

4.3 A CORRELATION BETWEEN MILLING CHARACTERISTICS AND BALL
AND POWDER BEHAVIOR
From the above observations we concluded that the effect of intersti
tial gas on milling may be caused by the following phenomena:
(1) The change in powder porosity and the resulting difference in pow
der mobility, which probably will highly influence the way of com
paction of the powder during ball collisions.
(2) The change in ball movement, probably induced by the change in
powder mobility, which results in different collision rates of
balls falling and cascading.
(3) The,change in powder distribution in the mill and the resulting
difference in the thickness of the powder layers in the areas
where balls collide.
In order to arrive at a more quantitative relation we introduce a set
of parameters as given in table 4.2. The first and second parameter,
nf and nc' represent the numbers of collisions per unit of time due to
falling or cascading balls respectively. These parameters depend on
gas pressure as well as on ball load. The contribution, if any, of
rolling balls to the milling process is put equal to zero.
The third and fourth parameter, crf. and cr., are defined as the de-l Cl
crease in the weight fraction of the ith interval due to one milling
event of one falling or cascading ball collision, respectively relative
to the weight fraction of that interval. Since the state of the powder ,
is not highly influenced by ball load, these parameters depend only on
gas pressure. Of course, these parameters also vary with particle size
and therefore with interval number.
The final two parameters, $f and $ , are defined as the milling fine-c . ness due to one milling event of a falling or cascading ball collision
respectively. Since the overall milling fineness as defined in equa
tion (4.1) is related to the first interval, $f and we will also be
related to the first interval. These parameters only depend on gas
pressure.
Using these definitions and the definition of the rate of breakage
59

parameter description
0 . c~
<llf
collision rate of balls falling
collision rate of balls cascading
weight fraction of powder from the
ith interval milled in one colli
sion of a falling ball, relative to
the weight fraction
weight fraction of powder from the
ith interval milled in one colli
sion of a cascading ball, relative
to the weight fraction
fineness due to a collision of a
falling ball
fineness due to a collision of a
cascading ball
influenced by
ball load gas pressure
+ +
+ + +
+
+
+
Table 4.2. Parameters of the proposed aorreZation.
(see e.g. (1 ,3)) we can write
(4.2)
When nf, nc and Si are obtained by experiments at a certain gas pres
sure but at different ball loads, then for that gas pressure ofi and
o. can be determined from equation (4.2). c~
Since nfofl the amount of powder milled by falling balls, while
it obtains a fineness <llf' and ncocl the amount of powder milled by
cascading balls, while it obtains a fineness <llc' the overall milling
fineness will be given by
(4.3)
When F is now also measured at the same gas pressure and at the same
ball loads as nf, nc and s1, then <llf and <llc can be determined from
equation (4.3) for that pressure.
60
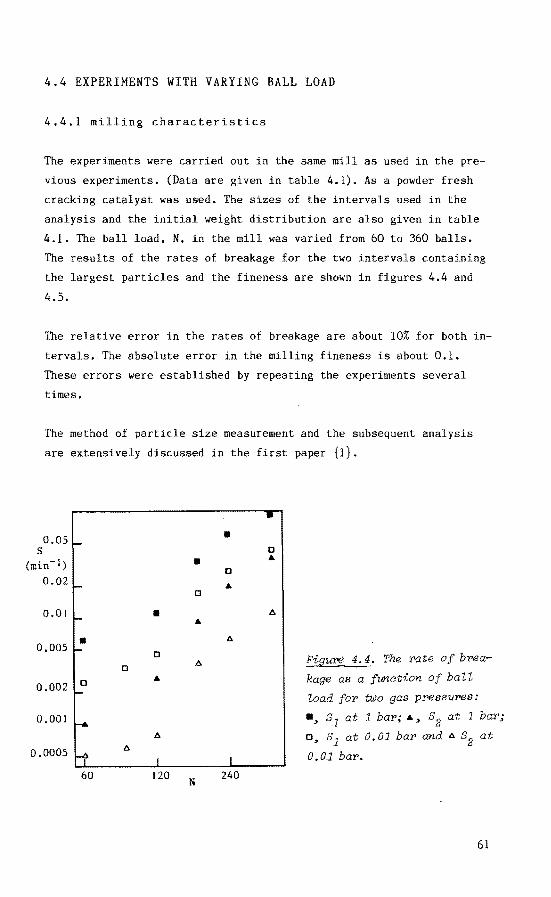
s
4.4 EXPERIMENTS WITH VARYING BALL LOAD
4.4.1 milling characteristics
The experiments were carried out in the same mill as used in the pre
vious experiments. (Data are given in table 4.1). As a powder fresh
cracking catalyst was used. The sizes of the intervals used in the
analysis and the initial weight distribution are also given in table
4.1. The ball load, N, in the mill was varied from 60 to 360 balls.
The results of the rates of breakage for the two intervals containing
the largest particles and the fineness are shown in figures 4.4 and
4.5.
The relative error in the rates of breakage are about 10% for both in
tervals. The absolute error in the milling fineness is about 0.1.
These errors were established by repeating the experiments several
times.
The method of particle size measurement and the subsequent analysis
are extensively discussed in the first paper (1) •
• 0.05 • - 0
(min-l) • A
0 0.02
!- A 0
0.01 • - A
• 1:>. 0.005 - 0
1:>. Figu:I'e 4. 4. The mte of bPea-0
a A kage as a fun~tion of ball
0.002 !- toad for two gas p'!'eBSUT'eB:
0.001 f-.o' •> s 1 at 1 baT'; A> at 1 bar>;
1:>. a> s1 at 0.01 bar> and t.. s2 at 1:>. 0.0005 rt I I 0.01 bar.
60 120 N
240
61

0 0
3_ 0
0 F • Figur-e 4. 5. The finene 88 as 2.5
a funation of baZZ Zoad at -. • 1 bar r•J and at 0. 01 bar (a) • • 0
ga8 proe88ure. 2 r
I I I
60 J 20 240 N
4.4.2 the collision rates of balls falling
As already pointed out in the first paper (1) there is also a marked
difference in the noise of the mill for the two pressure levels. At
low pressure it was much louder. It appeared that there is a correla
tion between the noise of the mill and the collision rate of balls
falling. Therefore, a method was developed to establish the collision
rate of balls falling from an analysis of the noise of the mill.
When the sound of the mill was recorded by a microphone and displayed
on an oscilloscope, the noise of the mill appeared to consist general
ly of two components. One was a low intensity signal. The other one
consisted of short bursts of a much higher intensity. It showed that
when no balls were falling, these bursts were absent, We therefore as
signed these bursts to collisions of falling balls and assumed that
each individual burst corresponded to a collision of a falling ball
and by measuring the frequency of these bursts the collision rate of
balls falling was established, The method is further elaborated in ap
pendix 4.A.
The result is shown in figure 4.6. The relative, systematic error in
the values obtained is estimated at 10%.
62
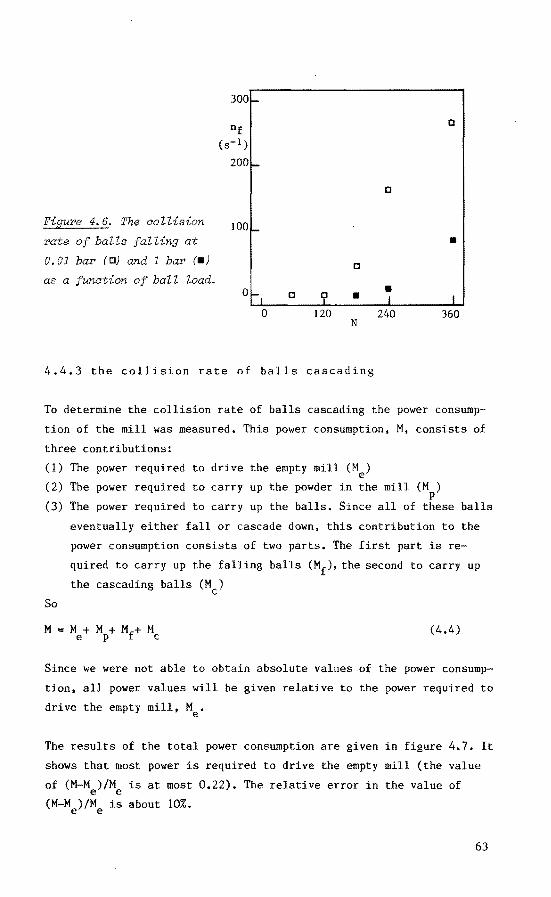
300-
nf 0
(s-1)
200 -0
Figure 4.6. The collision 100 -rate of balls falling at • 0.01 bar (c) and 1 bar (•J c a8 a function of ball load. • 0-l c '[_ • I I
0 120 240 360 N
4.4.3 the collision rate of balls cascading
To determine the collision rate of balls cascading the power consump
tion of the mill was measured. This power consumption, M, consists of
three contributions:
(1)
(2)
(3)
So
The power required to drive the empty mill (M ) e The power required to carry up the powder in the mill (M )
p The power required to carry up the balls. Since all of these balls
eventually either fall or cascade down, this contribution to the
power consumption consists of two parts. The first part is re
quired to carry up the falling balls (Mf)' the second to carry up
the cascading balls (M ) c
M = M + M + Mf+ M e p c (4.4)
Since we were not able to obtain absolute values of the power consump
tion, all power values will be given relative to the power required to
drive the empty mill, Me.
The results of the total power consumption are given in figure 4.7. It
shows that most power is required to drive the empty mill (the value
of (M-M )/M is at most 0.22). The relative error in the value of e e (M-M )/M is about 10%. e e
63

The value of M was established in the following way. Firstly the pop
wer consumption of the mill was measured with only powder present.
This yielded values of M /M of 0.019 at a high pressure level (0.035 P e
at a low pressure level). Secondly we measured the power consumption
when the mill was filled with balls only (240) and compared it to the
power consumption at a high pressure level and at the same ball load
but now in the presence of powder. Assuming that at a high pressure
level (high powder mobility) the ball movement is not influenced by
the powder, this yielded for a high pressure level a value of 0.045
for M /M • P e
At a high pressure level the power required to drive the powder was
now obtained through inter- and extrapolation. So at a high pressure level
(4.5)
For a low pressure level the power needed to carry up the powder can
not be obtained as directly as at a high level, since the powder, as
observed visually, highly influences the ball flow. Nonetheless it is
assumed that the influence of ball load on the power consumption due
to the powder is independent of pressure. So at a low pressure level
c c 0.2 r
M-Me • c • Me
• c 0.1 -
Figure 4.7. The po~er d~ c • drive the fiZZing of the miZZ, • p~der and baZZs, reZative to
the po~der to drive the empty 0 r1 I I I miZZ at 0.01 bar (c) and 0 JW 240 360 1 bar (•J. N
64
(4.6)
To calculate the contribution to the power consumption due to ball
movement it is assumed that the power input for one ball when being
carried upwards is proportional to the height over which it is carried
upwards, i.e. to the height over which it will eventually fall down.
For a falling ball this height is assumed to be equal to the mill ra
dius, R • For a cascading ball it is assumed that between two colli-m
sions it falls over a distance of typically the ball radius R. So
M /M = C'R n f e m f
M /M = C'R n c e c
Using equations (4.4),(4.7) and (4.8) we get
M M- M e p
M e
with C C' •R.
(4.7)
(4.8)
(4.9)
To get an estimate of C it was reasoned that at a ball load of 360
balls and at a low pressure level the collision rate of balls casca
ding must be very low, at most a few hundred per second. The main rea
son is that at this ball load the total power consumption is equal to
that at 240 balls, while the collision rate of balls falling is much
higher. Since R /R is about equal to ten, the collision rate of balls m
cascading must have been drastically decreased, Using a value of n of 1 -5 c
300 s- at these conditions results in a value for C of 4.87•10 s.
The final results for the collision rates of balls falling and casca
ding are given in table 4.3.
The relative systematic error in the values of the collision rate of
balls cascading is estimated at 20% for most conditions. The only real
exception is at a ball load of 360 balls at a low pressure level,
where the error may be as large as 100%. The sources of these errors
are the error in the power consumption measurements, the error in the
collision rate of balls falling and finally the error in the estima
tion of the constant C.
65
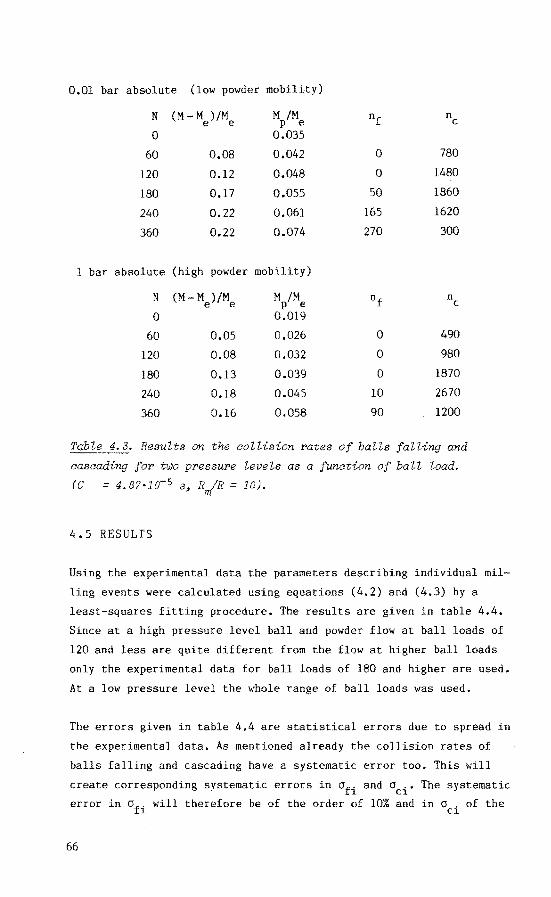
0.01 bar absolute (low powder mobility)
N (M-M )/M M /M e e P e nf n c 0 0.035
60 0.08 0.042 0 780
120 0.12 0.048 0 1480
180 0.17 0.055 50 1860
240 0.22 0.061 165 1620
360 0.22 0.074 270 300
1 bar absolute (high powder mobility)
N (M M )/M M /M e e P e nf n c 0 0.019
60 0.05 0.026 0 490
120 0.08 0.032 0 980
180 0.13 0.039 0 1870
240 0.18 0.045 10 2670
360 0.16 0.058 90 1200
Table 4.3. Results on the collision rates of balls falling and
cascading for two pressure levels as a function of ball load.
(C = 4.87•10- 5 s, Rm(R = 10).
4.5 RESULTS
Using the experimental data the parameters describing individual mil-
events were calculated using equations (4.2) and (4.3) by a
least-squares fitting procedure. The results are given in table 4.4.
Since at a high pressure level ball and powder flow at ball loads of
120 and less are quite different from the flow at higher ball loads
only the experimental data for ball loads of 180 and higher are used.
At a low pressure level the whole range of ball loads was used.
The errors given in table 4.4 are statistical errors due to spread in
the experimental data. As mentioned already the collision rates of
balls falling and cascading have a systematic error too. This will
create corresponding systematic errors in ofi and oci' The systematic
error in ofi will therefore be of the order of 10% and in oci of the
66

1 bar absolute 0.01 bar absolute
(high powder mobility) (low powder mobility)
interval 1 2 3 1 2 3
ofi•lOs 13 ± 2 5.4 ± 0.8 1.9±0.4 2.5±0.2 0. 7 ± 0.1 0.22±0~05
0 . •108 33 ± 3 8.9 ± 0.9 3,0±0.4 5.4 ± 0.1 1.0 ± 0.1 o. 34±0.08 Cl
ofi/oci 39 61 63 46 65
0n 10fi 1 2.4 6.8 1 3.8
ocl/oci 1 3,7 11 1 5.4
q,f 2.7±0.1 3.4±0.2
illc 2.4±0.1 2.5±0.1
Table 4.4. Results on the milling parameters of individual milling
events for two pressure levels. At 1 bar the experiments at ball
loads of 180, 240 and 360 were used. At 0.01 bar the ball loads used
were 60, 120, 180, 240 and 360.
order of 20%. The systematic errors in the fineness parameters are
much lower and well below the statistical error.
From these results it can be observed that:
(1) At either pressure level the amount of material milled by a fal
ling ball is much larger than the amount of material milled by a
cascading ball.
65
11
16
(2) The amount of milled material at the higher pressure level is al
ways larger than at the lower level. This holds for both falling
and cascading balls. Moreover, the difference is larger for smaller
particles (higher intervals).
(3) At decreasing particle size the amount of milled material decrea
ses sharper for cascading balls than for falling balls.
(4) At either pressure level the milling fineness due to a falling
ball is higher than the milling fineness due to a cascading ball.
(5) The milling fineness due to a falling ball is higher at the lower
pressure level than at the higher level.
(6) The milling fineness due to a cascading ball is about equal for
either pressure level.
67

4.6 DISCUSSION
Firstly it should be remarked that the amount of experimental data is
not sufficient to prove that the equations (4.2) and (4.3) give a com
plete description of the milling process. Our experiments only give
the values of the parameters of the model, assuming the equations give
indeed a complete description. Of course, our model was not just made
up, but was developed from visual observations.
At the higher pressure level the results of the experiments at the
loads of 60 and 120 could not be brought in line with those obtained
at higher ball loads. The rates of breakage were much too small. This
is in accordance with the visual observation that at these ball loads
and pressure neither the balls nor the powder do really flow.
In the literature it is quite common to describe the rate of breakage
by a unique relation to the particle diameter (e.g. 4,5):
(4.10)
in which a is independent of other conditions. Our results show that
this relation in general does not apply. E.g. at a higher pressure le
vel for falling balls the exponent a would be about 2, for cascading
balls it would be about 2.8. Although at constant conditions (e.g.
mill radius and speed) relation (4.10) may still be useful, care
should be taken when the conditions are changed, as in scaling up,
since the ratio of falling and cascading balls, and therefore a, may
change.
Since as derived by Rietema (6) the influence of interstitial gas de
pends on the circumferential speed of the apparatus under considera
tion, also the state of the powder depends on this speed and therefore
the scale of the apparatus. This in its turn influences the ratio of
falling and cascading balls as well as the result of an individual
event. This may again change the exponent a.
Similar considerationshold, of course, for the milling fineness.
68

Finally it is worth mentioning that our experiments show that crush
ing experiments on individual particles (7,8,9), cannot reveal all the
information on the milling characteristics. E.g. at either pressure
level falling balls enter the powder with the same kinetic energy, the
resulting milling fineness is however different. These effects, which
are due to differences in powder mobility, were occasionally noted be
fore in the literature (10,11).
4.7 CONCLUSIONS
From the experiments on the ball movement it can be concluded that
this movement depends on ball load as well as on the powder mobility.
The amount of material milled in one milling event and the resulting
fineness of such an event depends on kinetic ball energy as well as on
the powder mobility.
In order to arrive at a complete understanding of the milling process
in addition to actual milling experiments separate experiments should
be carried out on ball movement, on powder flow and on ball-powder in~
teraction during collisions.
4.8 LIST OF SYMBOLS
bil breakage parameter of first interval
C' c 1T constant in mill power relation
c T constant in mill power relation
d L particle diameter
F overall milling fineness
i interval number
M ML2T-3 total power consumption of the mill
M ML2T-3 power consumption due to cascading balls c
ML2T-3 M power consumption of the empty mill e
ML2T-3 Mf power consumption due to falling balls
M ML2T-3 power consumption due to the powder p
N ball load in the mill
n T-1 collision rate of balls cascading c
T-1 nf collision rate of balls falling
69

p
R
R
s m
gas pressure
radius of a ball
internal radius of the mill
rate of breakage
constant in equation (4.10)
gas viscosity
relative amount of powder milled by one cascading ball
relative amount of powder milled by one falling ball
milling fineness due to a cascading ball
milling fineness due to a falling ball
4.9 LITERATURE
1
2
W. Cottaar and K. Rietema
3
4
w. Cottaar,
L.G. Austin
L.G. Austin,
K. Rietema and
K. Shoji and
Powder Technology 38(1984)183
S. Sternerding
to be published in Powder Techn.
Powder Technology 5(1971)1
P.T. Luckie
Powder Technology 14(1976)71
5 L.G. Austin, P. Bagga and M. Celik
Powder Technology 28(1981 )235
6 K. Rietema Powder Technology 37(1984)5
7 B. Buss and H. Schubert Powder Technology 4( 1970) 117
8 S. Baumgardt, B. Buss, P. May and H. Schubert
Powder Technology 8(1973)107
9 S.R. Krogh Powder Technology 27(1980) 171
10 J.M. Crowley Powder Technology 15(1976)133
11 L.G. Austin and P. Bagga Powder Technology 28(1981)83
APPENDIX
4.A NOISE ANALYSIS OF THE MILL
In this appendix a noise analysis will be discussed, which is used to
obtain the number of balls per unit of time. The first aim of
this analysis was to obtain an amplituda distribution of this noise
Q(A), where Q(A)6A denotes the chance that the noise consists of a si
nusoidal wave with its amplitudo in the range A-t6A to A+tAA.
70
To reach this aim the noise of the mill, or more precisely the pres
sure fluctuation, was recorded by a microphone, amplified and then
sampled by a microcomputer. The sampling frequency was 10KHz. Thus a
distribution R(y) was obtained, where R(y)~y denotes the chance that
at any given time the absolute value of the deviation of the noise le
vel from zero is in the range y-!~y to y+!~y.
Of course, Q and R are not the same functions. For example when the
noise would consist of only one sinusoidal wave with a fixed amplituda
A, then
Q(A) o(A)
where 6 denotes the deltafunction, And
R(y) J 2/rr
.fAT:?
lo
Generally R(y) can be written as
R(y) j ~ Q(A) dA y
y ~ A
y > A
(4.A.l)
(4,A.2)
(4.A.3)
So R(y), the measured distribution, is the result of the convolution
of R0(y) and Q(A), the wanted amplituda distribution. Similarly Q(A)
can now be obtained by a deconvolution, when R(y) is measured.
The next goal was to derive from the obtained amplituda distribution
Q(A), the number of falling balls per unit of time. Here the following
assumptions are made, which are supported by observation of the noise signal on an oscilloscope:
One falling ball gives an amplituda larger than a level Ab during a
time ~tb. - There is no other noise with an amplituda larger than Ab present.
If the number of balls falling per unit time is equal to nf, then the
fraction of time, f, during which the amplituda of the nOise signal
is larger than Ab is given by
(4.A.4)
71

The exponential term on the rightside of the equation accounts for the
chance of two or more balls colliding almost simultaneously.
In accordance to the definition of the amplituda distribution f can
also be written as
f 00
f Q(A) dA Ab
(4.A.S)
Using values of Ab and ~tb obtained from visual inspection of the
noise signal using (4.A.S) and (4.A.4) the number of falling balls,
nf, can be obtained.
72

5 THE EFFECT OF INTERSTITIAL GAS ON MIXING OF FINE POWDERS
Submitted for publication to Powder Technology
Coauthors: A. Heijnen and K. Rietema
5.0 ABSTRACT
In our research program on the effect of interstitial gas on the hand
ling of fine powders the influence on mixing was investigated.
Two types of mixing were investigated: the mixing of two powders of
which all relevant properties were equal and two powders with widely
different properties. The experiments were performed in a rotating
drum. Powder composition was established with a probe, which measured
the optical reflectivity of the powder. This method proved to be fast
and easy while being accurate enough.
From the experiments it can be concluded that for powders with
(nearly) equal properties the speed of mixing can be increased by in
creasing the gas viscosity and/or gas pressure. For powders, which
show a segregative behavior, the final quality of the mix can, how
ever, be improved by lowering the gas viscosity and/or gas pressure.
5.1 INTRODUCTION
In a research program on the influence of interstitial gas on the
handling of fine powders we already extensively on the ef-
fects of interstitial gas on milling (1,2,3). These effects appeared
to be caused by changes in powder porosity and hence in the powder mo
bility due to differences in gas viscosity and gas pressure. Summarizing these changes were:
At increasing gas viscosity the powder porosity and mobility in-
crease.
- When decreasing the gas pressure from ambient pressure to values of
typically 0.01 bar, the powder porosity and mobility decrease. This
change is actually analogue to the first one, since at such low
pressures the effective gas viscosity for powders decreases.
73
When increasing the gas pressure from ambient pressure to values of
typically 10 bar the powder porosity and mobility increase. This
change can most probably be ascribed to the increase in particle in
teraction due to gas adsorption, but is not yet fully understood.
It is quite analogue to similar phenomena observed by us in fluidi
zation (4).
Rietema (5) derived a criterion, when gas influence might be expected,
N = g
p d2 g d p
J,1 u a
« 100 (5.1)
The smaller the value of the gas-powder-interaction number, N , the g
larger the gas-powder interaction. Since this gas influence already
has a remarkable effect on milling, it might be expected there is also
a dependency of the mixing behavior of fine powders on the intersti
tial gas. Therefore, we also undertook an effort in this field of
powder handling.
5.2 DESCRIPTION OF THE MIXING PROCESS
In this section we will discuss methods to describe the mixing process.
Since all experiments were performed in a horizontal drum, we will
confine ourselves to methods to be used in this geometry. Moreover, a
bout equal amounts of powder with roughly the same particle size were
mixed. Mixing is therefore purely stochastic and the concept of or-
dered mixtures due to adherence of small particles on
will not be applicable.
particles
There are generally two ways to describe a mixing pocess. In one the
actual process is described by transport equations. In the other des
cription the (final) result of the process is given, This is mostly
do~e by the variance in composition between samples of a given size,
drawn from the mixture. We will discuss both methods below. Extensive
discussions can be found in the literature (6,7).
74
5.2.1 description by transport equations
Considering only binary mixtures, where no convective processes are
present in the direction under consideration, the dependence of the
composition c with time t and position x is given by
de 5!._ D de dt dx dx
(5.2)
Where D is called the diffusion coefficient.
By definition the composition is zero if only one powder is present
and one if only the other is present. If in a given sample the bulk
volumina of both powders are equal it will be 0.5.
We will use this equation to describe the axial mixing in a horizon
tally rotating drum. Initially one half of the drum is filled with one
powder, the other half with another. Setting x=O at the middle of the
drum and the length to L, this leads to the initial condition
1 c(t=O)={g.5
0 < X :> !L X = 0
;> X < 0
The boundary conditions are
de dx 0 X = ±!L
(5.3)
(5.4)
since no transport is possible through the flanges at the end of the
drum.
5.2.2 description of final result
When the powder properties become more and more different the descrip
tion of a mixing process using equation (5.2) becomes less and less
meaningful!. This is due to the fact that segregation processes can
generally not be adequately described by this equation. Since for such
processes up till now no adequate alternative descriptions are availa
ble, we will take resource to describing the mixing process by way of
describing the final result.
This final result will be quantified by means of introducing a va-
75
riance a of the compos~t~on in the direction under consideration.
This variance is defined as
(5.5)
Where c denotes the average value of the composition.
Generally, the composition is only known at certain positions. The in
tegral then reduces to a summation
And
c = 1 m
m L (c.- C) 2
i=1 ~
m l: c.
i=m ~
(5.6)
(5.7)
It is both allowed to measure the compositions at regular intervals
along the direction under consideration and to measure it at random
positions.
5.3 EXPERIMENTAL SET-UP
5.3.1 the sampling method
To measure the local composition of a powder mixture we used a method
based on a difference in the optical reflectivity of the powders to be
mixed. A schematical drawing is given in 5.1. The main advan-
tage of this method is the measuring speed: the probe is inserted into
the powder, and instantaneously the composition can be read from a
calibration graph.
Of course, the method has its disadvantages:
The powders to be mixed must be optically different, In a research
project this can be obtained by coating one of the powders.
The sample size is unknown. At best only a fair estimate can be
calculated. Therefore, the method cannot be used to investigate mi
xing on microscale. Only an overall mixing process can be studied.
The reflectivity appeared to depend on the porosity. If,
however, care was taken during calibration this effect could be

n fibreb
photo transistor
read Ol!t
lamp
inserted randomly into , mixed
powdec '--. \ fibceb.
mmJ ~re 4.81 ~ "\
~ steel support
1.6 mm
0 light tra~smitting fibre
e light receiving fibre
Figure 5,1. A schematical drawing of the optical probe.
largely eliminated when measuring in a stationary powder. The ef
fect, however, makes the probe useless when a flowing powder is mo
nitored, since in such a case the porosity may show large devia
rions at the tip of the probe. Not the least, of course, due to dis
turbances caused by the probe itself-
In the experiments the probe behaved quite well and since it has also
been used to study the segregation of powders in a fluidized bed with
equal satisfactory results. The absolute error, when the composition of
a powder mixture ranging from 0 to 1 was established, was about 0.02
over the whole range.
5.3.2 experimental procedures
5.3.2.1 experiments on the diffusion coefficient
Figure 5.2 shows the schematics of the experimetal set-up. Initially
each half of the drum is filled with one powder. The bulk volumina of
both powders are equal. During an individual experiment the drum is
77
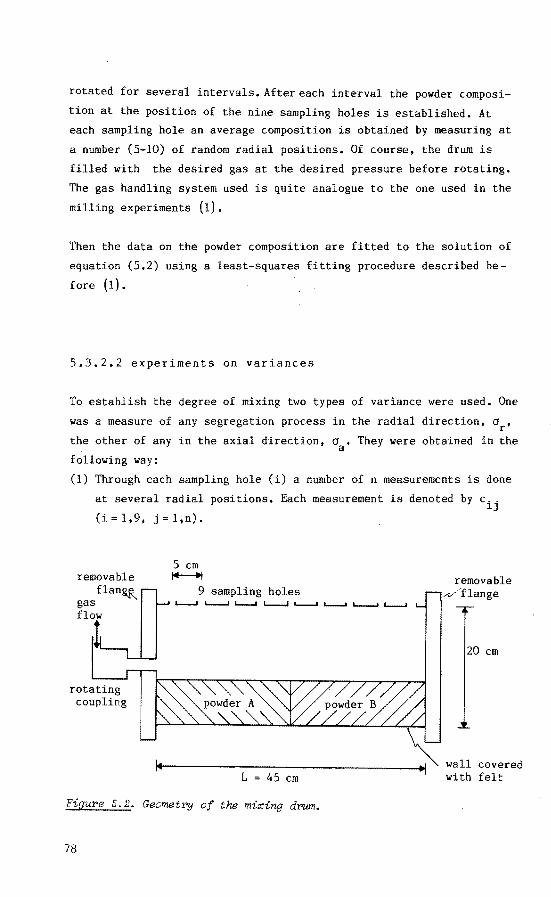
rotated for several intervals.Aftereach interval the powder composi
tion at the position of the nine sampling holes is established. At each sampling hole an average composition is obtained by measuring at
a number (5-10) of random radial positions. Of course, the drum is
filled with the desired gas at the desired pressure before rotating.
The gas handling system used is quite analogue to the one used in the
milling experiments (1).
Then the data on the powder composition are fitted to the solution of
equation (5,2) using a least-squares fitting procedure described be
fore (1).
5.3.2.2 experiments on variances
To establish the degree of mixing two types of variance were used. One
was a measure of any segregation process in the radial direction, or,
the other of any in the axial direction, a • They were obtained in the a
following way:
(1) Through each sampling hole (i) a number of n measurements is done
at several radial positions. Each measurement is denoted by c .. lJ
(i 1,9, j = 1,n).
5 em removable ~
OJlan&,K. 9 sampling holes
gas .....___. .._____. ...__. L-.....t .____. .___. L-..-.1 .___.
flo .
L = 45 em
FiguPe 5.2. Geometry of the mixing dPUm.
78
removable ,.,_,/flange
20 em
wall covered with felt

(2) Of each sampling hole the mean value, ci' and the variance, oi'
of the powder composition are now given by
0.= ~
1 n - L c .. nj=1 ~J
(5.8)
(5.9)
(3) Since o. is a measure of the variance in the radial direction at 1
one axial position, the average of oi over the whole drum will be a
measure of the demixing in the radial direction. Thus we define
1 9 o := -9 L o
1.
r i=1 (5.10)
(4) Similarly any differences in c. between different sampling holes 1
are a measure of demixing in the axial direction. We therefore de-
fine
Using
9 c = -
91 L c.
i=1 1
(5.11)
(5.12)
In the experiments both or and oa were measured as a function of time.
The actual measuring procedure was quite the same as in the experi
ments on the diffusion coefficient. Only the obtained results were
analyzed in a different way.
5.3.3 powders and combinations used
Table 5.1 shows the data on the powders used in theexperiments. Table
5.2 shows the combinations of powders used.
In the first series actually the self diffusion of fresh cracking cata
lyst was studied. To enable us to follow the mixing process part of
the powder was colored by Indian Ink. Care was taken that the diffe
rences in other properties, such as particle size distribution and
79

FCC1 FCC2 Magnetite
d (um) 0- 100 0 - 200 0 - 250 p d (JJm) 53 60 84
s pd (kg/m3) 680 800 5090
pb (kg/m3) 400 520 3400
£0 0.41 0.35 0.33
N 1) 10 16 196 g
type of
fluidization 2) A A B
color white white black
'J'ab Ze 5 .1. Data on pOliJds:¥'8 used in mi:r:ing
FCC = F:l'esh CPacking Catalyst
expePiments.
1) The gas-pOliJde:r-inte;r>aation numbe:¥' is calculated fo:¥' ai:¥' at 1 ba:¥'
and an a:ppaPatus speed of 0.1 m/s. 2) Aaao:l'ding to GeldaPt's aZassification (8).
type of experiment
diffusion coefficient
variances
powder combination
FCC1 - FCC1
FCC2 - Magnetite
Types of expe:l'imer,ts and pOliJde:¥' combinations used.
fluidization behavior, between the uncolored and colored particles
were small. To reach this aim the powder which should remain white was
treated in the same way as the powder to be colored, except that no
Ink was added (e.g. it was also wetted in alcohol, dried and sieved
again). The fresh cracking catalyst is a well flowing powder and can
be homogeneously fluidized,
In the second series the mixing result, represented by the variances,
of a combination of fresh cracking catalyst and magnetite is studied.
This powder combination shows a high degree of demixing due to the
large difference in powder properties (particle size and weight). E.g.
it was very difficult to obtain full mixes of different compositions
needed for the calibration of the sampling apparatus. The fresh cra
cking catalyst again was a well flowing powder, which could be homoge-
80

neously fluidized. The magnetite was a free flowing powder, which only
showed heterogeneousfluidization.
5.4 RESULTS
5.4.1 diffusion coefficient for FCCl-FCCl
Figure 5.3 shows the result of a single mixing experiment. It shows
that a description using equations (5.2) through (5.4) is indeed valid
for the self-mixing of this powder.
Figure 5.4 shows the result of the diffusion coefficient, when diffe
rent gased are used. This result is in accordance with our expecta-
1
c
0,5
c
0
1
0.5
0
-20
180 s
-10 0 10 20 x (em)
Figure 5.3. The measured (dots) and computed (drawn lines) composition
as a function of the axial position in the drum at two moments for the
p~der combination FCCl-FCCl when mi~ing in argon at 8.4 bar and a speed
of rotation of 60 rpm. (D = 0.?4 am 2/s)
81

1 ....
0.8 1-D
(cm 2/s) 0.6 -
Figure 5.4. The diffusion
coefficient as a function
of gas viscosity for the
combination FCC1-FCC1 at
a gas pressure of 1.8 bar
and a of 60 rpm.
The diffusion
as a function
gas pressure for the
combination FCC1-FCC1 at
a of 60 rpm. The gas
used was air.
D
0.4 -
0.2-
0 1-1
0
0.6 !-
(cm2/s)
0.4 !-
0.2 -
• 0- I
0.01
•
• neon
• argon
• air
• H2
I , I I
1 2 3 11 (10- 5 kg/ms)
•
•
• • •
I I I
0.1 1 10 p (bar)
tion: at higher gas viscosities the porosity of the powder and there
fore the mobility of the powder increase. An increase in mobility will
in its turn create an increase in the diffusion coefficient.
Figure 5.5 shows the diffusion coefficient as a function of pressure.
Again the behavior of the diffusion coefficient can be explained by
the changes in powder mobility.
82

0.10 ~
A
0.08 -oa A
0 • 0.06 ~
• The variance in I •
0.04 • the axial direction for the r-•
0 A A
combination FCC2-Magnetite • 0
function of time for 0.02
~ as a
four cases: 0
• argon at 1 bar~ A air at o_ I I I I I
1 bar~ o air at 0.01 bar and I 2 3 4 5
• hydrogen at 1 bar. The t (min)
was 60 rpm.
5.4.2 variances for the combination FCC2-magnetite
Figure 5.6 shows the result for the variance in the axial direction.
At short mixing times no systematic gas influence can be detected. Af
ter approximately 5 minutes the values remained constant. Here it
clearly shows that a very low gas viscosity (air, 0.01 bar) gives a
much better mix, lower variance, than higher gas viscosities. At
higher gas viscosities there appears to be no influence of gas visco
sity on the variance.
Figure 5.7 shows the result for the variance in the radial direction.
Here never any gas influence can be detected.
Similar observations were made by us for a somewhat different but also
segregative system. Here the speed of the apparatus was varied. Again
it showed that a higher gas-powder-interaction number, i.e. lower
speed, lowered the axial variance. Also the radial variance was lower
at a lower speed.
These observations can be understood in the following way: an increase
in the gas-powder-interaction number decreases the mobility of the
83

FiguPe 5.7. The vaPianee in
the Padial diPeetion foP the
combination FCC2-Magnetite
as a function time foP
four eases:
• aPgon at 1 bar, • air at
1 bar,oaiP at 0.01 bar and
o. 20 1- •
0.16-
• 0r e
o. 12 1-
0.08 -
0.04 ,...
0 1- I
• hydrogen at 1 bar. The speed
was 60 rpm.
• • 0
•
I
2
• 0
• • • Q
I I I
3 4 5 t (min)
powder particles. Thus particles will have less chance to segregate.
These results show a great similarity with those of Nienow and Rowe
(9) for the segregation of powders in fluidized beds.
5.5 CONCLUSIONS
For fine powders with about equal properties the average speed of mi
xing may be increased by decreasing the gas-powder-interaction number.
This implies that it is generally favourable to mix such powders in an
apparatus which induces high powder velocities.
For powders, which show a tendency to segregate, i.e. unmixing, it is
favourable to keep the gas-powder-interaction number high. Such pow
ders should be mixed in an apparatus which only creates low powder
velocities. The segregation can also be diminished by mixing under
vacuum conditions.
5.6 LIST OF SYMBOLS
c
d p
84
L
powder composition
particle size

d
D
g
L
N
i
j
n
p
t
s
g
u a X
Sauter mean diameter
diffusion coefficient
gravitational acceleration
length of the drum
gas-powder-interaction number defined by equation(5.1)
index indicating sampling hole
index indicating measurements at one sampling hole
number of measurements at one sampling hole
gas pressure
time
typical speed of powder handling apparatus
position in apparatus
packed porosity
gas viscosity
bulk density at packed porosity
particle density
variance in composition
variance in axial direction
variance in radial direction
5.7 LITERATURE
1
2
3
4
5
6
7
8
9
W. Cottaar and K. Rietema Powder Technology 38(1984)183
W. Cottaar, K. Rietema and S. Stemerding
to be published in Powder Techn.
W. Cottaar and K. Rieterna submitted to Powder Technology
H. Piepers, W. Cottaar, A. Verkooijen and K. Rieterna
Powder Technology 37(1984)55
K. Rieterna
K. Sommer
K. Sommer
D. Geldart
P. Rowe and A. Nienow
Powder Technology 37(1984)5
J. Powder & Bulk Solids Technology
3(1974)4
Fortschritte der Verfahrenstechnik
19(1981)189
Powder Technology 7(1973)285
Powder Technology 15(1976)141
85
6 A THEORETICAL STUDY ON THE INFLUENCE OF GAS ADSORPTION
ON INTERPARTICLE FORCES IN POWDERS
6.0 ABSTRACT
Using data from the literature and some additional experiments it is
investigated if the interparticle forces in and more
cally the cohesion between particles is influenced by the physi-sorp
tion of gases.
In this otherwise theoretical study the force to be applied to a par
ticle to obtainaspecific distance from a plane is derived from the
total energy of the system of particle and plane. This energy con
sists of three terms: molecular interaction energy between the par
ticle and the plane, elastic energy due to deformation of the par
ticle and adsorption energy of the gas.
It is concluded that gas adsorption may indeed quite heavily in
fluence the interparticle forces and cohesion (increase up to a fac
tor three). The degree of influence is determined by the type of gas
and the gas pressure.
6.1 INTRODUCTION
In the past two decades considerable attention has been paid to the
interaction forces between particles (1,2,3). A quite detailed over
view was already reported by Krupp (4). This continuing interest is not
remarkable, since with the ever increasingindustrialuse of very fine
powders, this particle interaction plays an ever more important role
in industrial processes.
Also attention has been paid to the relation between interparticle
forces and powder properties like the tensile strength (5,6) and the
fluidization behavior (7).
Lately it has been shown that there is evidence that interparticle
forces are not only dependent on particle properties, but are also in
fluenced by the surrounding gas due to adsorption (8,9). In this paper
87

we will investigate if such is indeed possible. We will only deal with
the influence of physi-sorption, i.e. reversible adsorption.
In the investigation we will deal with the case of a spherical parti
cle with radius R in contact with an infinitely large and flat plane.
Both particle and plane consist of the same substance. The results of
such a geometry, e.g. the cohesion, are equal to the results of two
particles with radii R1 and R2
with R=R1R
2/(R
1+R2). The actual values
of the radii to be used for any numerical calculations should not be
the actual radii of the particles but the radii of the surface asperi
ties.
6.2 DERIVATION OF THE INTERACTION FORCE FROM THE ENERGY
A system of a spherical particle and a flat plane is considered. The
distance between the centre of the particle and the surface of the
plane is denoted by L. This distance L can be controlled by applying
an external force, F, to the particle. The maximum value of this force
will be called the cohesion, C.
Suppose the energy, U, of the system is known as a function of L, then
the force F is given by
F _ dU - dL (6.1)
It will now be shown how to calculate this energy as a function of L
for two different cases: that of a unflattened particle and that of a
flattened particle. A flattened particle is a particle that is so
close to the plane that due to repulsive forces its initial shape has
changed.
The assumed geometry of the flattened particle is shown in figure 6.1.
Here it follows
L = R + z - h (6.2)
with z the distance between the surfaces and h the flattening of the
particle. It may be clear that the system still has one degree of
freedom, since equation (6.2) contains two variables (z and h). Since
a system always tends to the lowest possible energy it follows that at
88
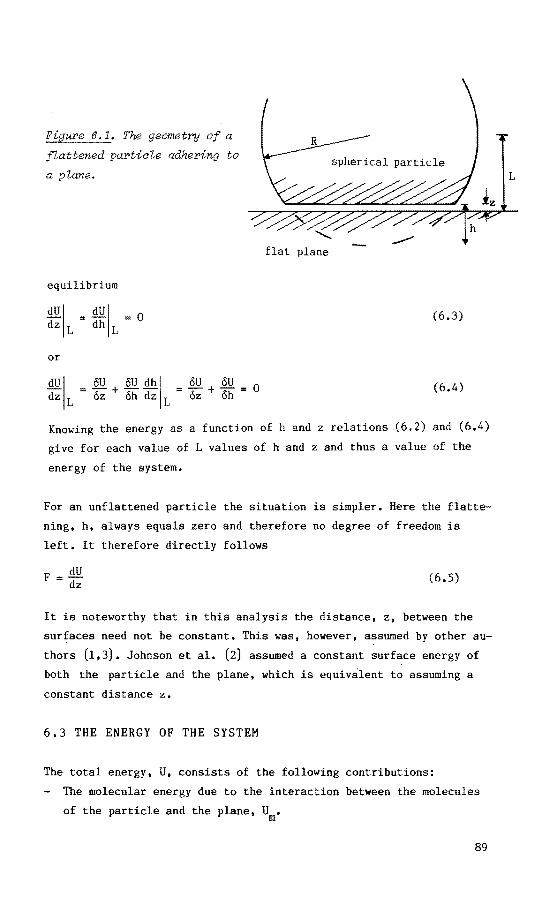
The geometry of a
~n,~r..,n~'n partiaZe adhering to
a pZane.
equilibrium
or
duJ dz 1 au + au dh\ az ah dz L
flat plane
(6.3)
(6.4)
Knowing the energy as a function of h and z relations (6.2) and (6.4)
give for each value of L values of h and z and thus a value of the
energy of the system.
For an unflattened the situation is simpler. Here the flatte-
ning, h, always equals zero and therefore no degree of freedom is
left. It therefore directly follows
F = dU dz (6.5)
It is noteworthy that in this analysis the distance, z, between the
surfaces need not be constant. This was, however, assumed by other au
thors (1,3). Johnson et al. (2) assumed a constant surface energy of
both the particle and the plane, which is equivalent to assuming a
constant distance z.
6.3 THE ENERGY OF THE SYSTEM
The total energy, U, consists of the following contributions:
- The molecular energy due to the interaction between the molecules
of the particle and the plane, um.
89
L

- The elastic energy due to the defo.rmation of the particle, UH.
- The molecular adsorption energy due to the interaction between the
adsorbed gas molecules and the molecules of the particle and the
plane, U • g
The first two contributions have also been used by other authors. It
is assumed that all contributions are independent. E.g. the molecular
energy due to interaction between particle and plane is not influenced
by adsorbed gas molecules.
6.3.1 the molecular energy, Urn
The molecular energy due to the interaction between molecules of the
particle and molecules of the plane is calculated using a Lennard
Janes potential for the interaction between two molecules. This poten
tial is given by
V (r) ss j--J (6.6)
Where r is distance between the molecules and Css and rss are parame
ters dependent on the molecules involved.
The total molecular energy of the system can be calculated by summing
all interactions. So
(6.7)
Where ns is the density of molecules in the solid and the plane.
For a flattened particle (see figure 6.1) this results in
AssR h r6 Um(h,z) 6Z {-(1 + ~) + lo zsss(t + ~)}
where Assis the Hamaker constant for solid-solid
A = 1r2n 2C ss s ss
(6.8)
interaction, given by
(6.9)
It is generally possible to obtain values of A in more direct ways ss
without using an intermolecular potential (10).
90
For an unflattened particle (h=O) the result is
A R r 6
Um(h=O,z) = ~= {-1 + 420s:6} (6.10)
6.3.2 the elastic energy, u8
The energy due to the elastic deformation of a sphere follows from
Hertz's theory (11). For a
/2R hS/2 K
flattened particle it follows approximately
where K is defined as
1 - v 2
K=-y
( 6.11)
(6.12)
with v the Poisson ratio and Y the Young's modulus of the material
under consideration.
Actually the elastic energy results also from molecular energy, but
this time between molecules of the particle, In principle it can be
calculated from the energy change due to the small displacements of
the molecules in the particle when the particle is deformed.
For an unflattened particle the elastic energy is of course zero.
It should be pointed out that the shape of the particle as sketched
in figure 6.1 is, of course, not the real shape. Deviations are, how
ever, small and since our goal is to study the influence of gas ad
sorption we will not discuss this here. More on this subject can be
found in the literature (e.g, 1,2).
6.3.3 the energy due to adsorbed gas, ug
To calculate this energy two things must be known. First of all the
binding energy, U (y), of a single molecule, which is bound between c
two planes with a distance y, has to be determined. Secondly the
density of molecules adsorbed per unit surface, N (y), must also be c
known. The total energy due to adsorbed gas then equals
91

~ Sketch of the geometry I
for the calculation of the energy
due to gas adsorption.
U (h,z) JNc(y) Uc(y) 2n s ds g 0
Where the distance y is given by (see also figure 6.2)
·y=r z + h
(s < hRh)
(s ~ hRh)
Thus equation (6.14) can be rewritten as
U (h,z) g
N (z) U (z) 2nRh+ 2nR f N (y) U (y) dy c c c c z
(6.13)
(6.14)
(6.15)
The calculation of the energy Uc is carried out in appendix 6.A. There
for the interaction between the molecules of the solid and the gas
also a Lennard-Jones potential is assumed (see equation (6.6)). The
result is
4U 3r 1 8r 9
u (y) =-__i! { --::¥ +---¥} c II y Y
(6.16)
Where U a is the binding energy of a gas molecule to a single plane of
the solid. This energy will be determined from data in the literature.
The calculation of the density of adsorbed gas molecules is shown in
appendix 6.B. The result is
N (y) c
92
1 =rr gg
6 exp((-U (y) + U )/kT) c a (6.17) 1 + 6 exp((-U (y) + U )/kT)
c a
The parameter 6 is defined in appendix 6.B as
N a
6 = N N Oa a
(6.18)
where N is the number of adsorbed molecules at a free surface and N0 a a
the number of adsorption sites. Both are determined experimentally.
6.3.4 the total energy
The total energy of the system can now be written as
U(h,z) = U (h,z) + UH(h,z) + U (h,z) m g
Introducing the following dimensionless parameters
6Ur ss £=AT ss
7/2 ljJ _ 48/2 rss
- 15 A K IR ss
a.
T
u 481f a
12 Ass
u a
- kT
11 = h/r ss
l; = z/r ss
A = L/r ss
p = R/r ss
~ = y/r gs
l;'= z/r gs
this relation can be written in a dimensionless form
£(11,!;) =- (t + zl + lor++ ?-) + ljJ 115/2
r oo r2 +a. {e Cs') £ (s') 11 + __&§. f e (~) £ (~) d~} f
c c r ss l;, c c r gg
where
and
e (~) c
8 +~
1 + 6 exp((-4/1:2 Ec(~)- l)T)
(6.19)
(6.20)
(6.21)
(6.22)
(6.23)
93

In the remainder of this paper it is assumed that the values of rss'
r and r are equal. Generally this will not be exactly true, but gs gg
the influence of any differences will be small. This assumption im-
plies that the dimensionless parameters s and s' are also equal.
Using equation (6.21) equation (6.4) can now be written as
o(e <s)·£ <s)) c c
a 1l ---=------;;:0-s--=--- 0 (6.24)
and equation (6.2) as
A-P=s-11 (6.25)
6.4 RANGES OF DIMENSIONLESS PARAMETERS
6.4.1 the parameter w
From data given by Visser (10) it follows that for almost all mate-20 rials the Hamaker constant, A , is in the range of 5•10 J through
-20 ss 50•10 J. It is also clear from these data that the actual values of
Ass obtained through different methods for one specific substance show
large discrepancies. Differences may be up to a factor five.
The value of the parameter, K, which expresses the mechanical behavior
of the particle, is for most materials (e.g. ionic crystals and me
tals) in the range of 5•10- 11m2/N through 2•10-11m2/N (3). For synthe
tic materials it is generally about a factor ten higher. For rss' the
distance at which two molecules are at rest, the value will generally
be of the order of 3.5•1o-10m.
For the radius, R, of the particle or more precisely the asperity, we
will use a value of 0.1 urn (4). Since the parameter w only depends on
the square root of this radius any changes in the value of R will not
change the range of w very drastically.
Finally it therefore follows
1 < w < 40 ionic crystals, metals (6.26)
1 < w < 4 synthetic materials, flour, potato starch
94
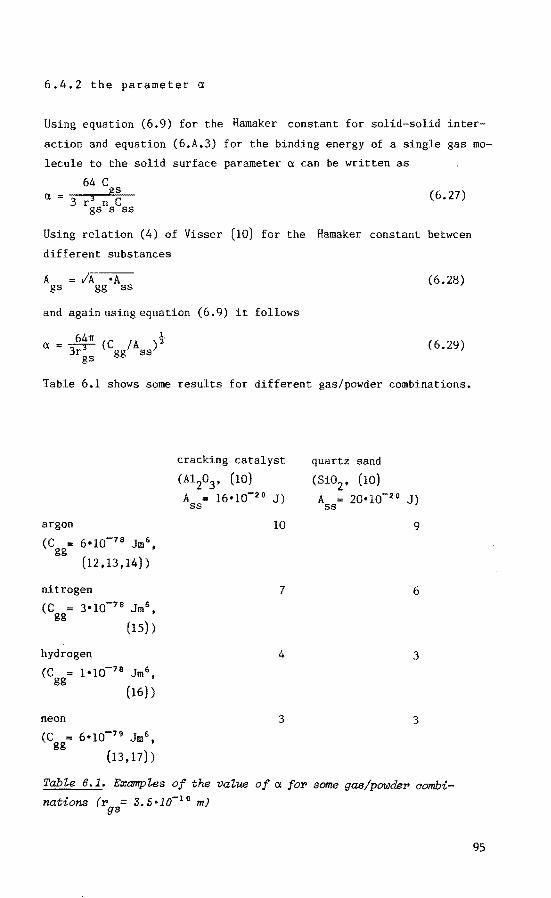
6.4.2 the parameter a
Using equation (6.9) for the Hamaker constant for solid-solid inter
action and equation (6.A.3) for the binding energy of a single gas mo
lecule to the solid surface parameter a can be written as
64 c gs a = 3 r 3 n C
gs s ss (6.27)
Using relation (4) of Visser (10) for the Hamaker constant between
different substances
A /A •A gs gg ss
and again using equation (6.9) it follows
« = 64TI (C /A )~ ")r""3 gg ss gs
(6.28)
(6.29)
Table 6.1 shows some results for different gas/powder combinations.
argon
(C = 6•10-78 Jm 6 , gg (12,13,14))
nitrogen
(C = 3•10-78 Jm6 gg •
(15))
hydrogen
neon
(13,17))
cracking catalyst
(Al2
03
, (10)
A = 16•10-20 J) ss
10
7
4
3
quartz sand
(Si02
, (10) A = 20•10-20 J) ss
9
6
3
3
Tab"le 8.1. E:x:ampl-es of the val.ue of a for some gas/powder combi
nations (r = 3.5•10-10 m) gs
95

6.4.3 the parameter T
Similarly the parameter T can be written, using equations (6.A.3),
(6.9) and (6.28), as
,;;lAC 4v2 ss gg '= 9 r 3 kT gs
Table 6.2 gives some examples.
(6.30)
The values of T thus obtained are in good agreement with those calcu
lated by Steele (18}, who uses a much more refined method. E.g. for
the adsorption on graphitized carbon (A ==30•1o-20J (10)) he states ss
values of 4 and 1.8 for argon and neon respectively. Equation (6.27)
would yield values of 4.9 and 1.5 respectively.
argon
(C = 6•10-78 Jm 6 , gg (12,13,14))
nitrogen
(C = 3•10-78 Jm6 gg •
(15))
hydrogen
(C = 1•10-78 Jm6 , gg
(16))
neon
(13,17))
cracking catalyst
(Al2o
3, (10}
A = 16•10-20 J) ss
4
3
1.5
1.1
quartz sand
(Si02 , (10)
A 20·10-20 J) ss
4
3
1.6
1.3
TabZe 6. 2. E:.ccurrpZes of the vaZue of T for some gas/powder aombi
nations at room temperature (T = 293 K, r = 3.5•10- 10 m) gs .
96
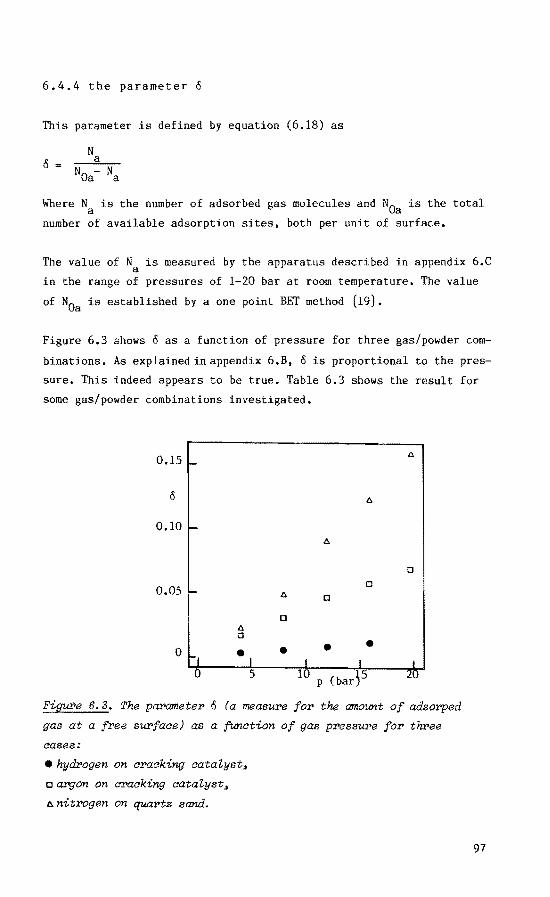
6.4.4 the parameter o
This parameter is defined by equation (6.18) as
N a
N - N Oa a
Where Na is the number of adsorbed gas molecules and NOa is the total
number of available adsorption sites, both per unit of surface.
The value of N is measured by the apparatus described in appendix 6.C a
in the range of pressures of l-20 bar at room temperature. The value
of NOa is established by a one point BET method (19).
Figure 6.3 shows o as a function of pressure for three gas/powder com
binations. As explained in appendix 6.B, o is proportional to the pres
sure. This indeed appears to be true. Table 6.3 shows the result for
some gas/powder combinations investigated.
0.15 -
0.10 ,....
0.05 !-
0 r-J 0
1:>
0 A 0
•I • 5
0
0
0
• • I I I
10 p (barP 20
Figure 6.3. The parameter o (a measure for the amount of adsorped
gas at a free surface) as a function of gas pressure for three
aases:
ehydrogen on craaking aataZyst,
o argon on cracking cataZyst,
~:>nitrogen on quartz sand.
97

argon
nitrogen
hydrogen
neon
cracking quartz sand
catalyst
0.0036
0.0040
0.0007
0.0001
0.0060
0.0063
0.0021
0.0015
TabZe 6.3. ExampZes of the experimentaZZy estabZished vaZues of
o/p (1/bar) for some gas/powder combinations at room temperature.
6.5 CALCULATION AND DISCUSSION
Figure 6.4 shows the result for the dimensionless force as a function
of distance between the particle and the plane. This dimensionless
force is given by
6 F r 2 dE
$ = ss
A R = dA (6.31) ss
or
$ F (6.32)
The curve for a pressure of 0 bar is, of course, equal to the curve
without any gas influence. A negative value of $ represents a repul
sive force between the particle and the plane: to reach the correspon
ding values of A-p the particle must be pressed onto the plane with a
force F. Positive values represent an attractive force between the
particle and the plane.
At higher values of the gas pressure there is at a certain value of
A-P a sudden decrease in the force. This step-wise transition is due
to the fact that at higher values of A-p it is energetically more fa
vorable to form a single mono-layer of gas molecules between the parti
cle and the plane (see figure 6.5).
98

Figure 6.4. The dimension
less interaction force as a
function of the particle
plane distance for the ease
of nitrogen adsorbed on
cracking catalyst for three
pressures (a ?, T 3,
o/p 0.004/bar, l/!=20). 0.5
=-=>
~ >77/7//7 T
1
(\ I \0 bar
.. ~ .. \\ l .. . . . . . .
,f 4\<~
A P
Figure 6.5. The transition from the state of an unfZattened particle
to the state of a flattened. part1:ale with an adsorbed monolayer between
the particle and the plane. The total energy of the system is equal in
both states.
It clearly shows in figure 6.4. that at high gas pressures the cohe
sion increases due to the gas adsorption.
Figure 6.6 shows the result of a similar calculation as the one of fi
gure 6.4 but now with a smaller hardness parameter w (e.g. a smaller
hardness or a larger radius). Comparison with figure 6.4 shows that at
low values of A-p the force dependence on A-p is heavily influenced by
the hardness parameter w. The maximum value of the force. the cohe
sion. is however not influenced by the hardness parameter. This is due
to the fact that the maximum is always reached at a value of n (or h)
99

Figure 6.6. The dimensionless
interaction force as a func
tion of particle-plane dis
tance for the same system as
figure 6. 4, but with a de
creased hardness (a = ?,
t = 3, 0/p = 0.004/bar,
lJ; = 2).
1
0
-1
0.5 1 1.5 2 A- P
close to zero. As may be clear from equation (6.21) the contribution
of the hardness to the force is equal to wn 3/ 2• So indeed for n close
to zero the contribution of the hardness is also close to zero.
The fact that the maximum is reached at values of n close to zero can
be understood in the following way. If flattening of a particle occurs
repulsive molecular forces become important. Since the repulsive mole
cular energy changes very much with small changes of the distance ~.
any changes in the distance A will mostly induce changes of the flat
tening n (compare equation (6.25)). Thus it follows as a first appro
ximation
(6.33)
The maximum is reached if
(6.34)
So indeed the maximum is reached at n~o. Of course, an exact, but very
complex, calculation can be carried out to calculate the exact value
of n at which the maximum is reached.
It can also be seen in figure 6.6 that the transition to a monolayer
of adsorbed gas occurs at lower values of A- p. This can be understood
100

in the following way: the adsorption energy of this monolayer is about
proportional to the flattening (first term in equation (6.15)), the
elastic energy is proportional to the flattening to the power 2.5
(equation (6.11)). Since the transition occurs when both energy con
tributions are about equal, for a lower hardness a higher flattening
occurs. Since ~is about constant for the monolayer, equation (6.25)
shows that a higher flattening, n, indeed implies a lower A-p. Of
course, there is also some change in the molecular energy which we
neglected in this reasoning.
Figure 6.7 shows the result of a similar calculation as that of fi
gure 6.4, but now with argon as the adsorbing gas. Note the different
scale of the y-axis. Comparison with figure 6.4 shows that the cohe
sion is more influenced by gas adsorption for argon than for nitrogen.
This is due to the fact that the total adsorption energy of adsorbed
gas is higher for argon than for nitrogen. Also the transition to a
monolayer occurs at lower values of A p due to this higher adsorp
tion energy.
Figure 6.8 finally shows the result of the cohesion force as a func
tion of gas pressure for cracking catalyst for four different gases.
This dimensionless cohesion is defined by
Figu:roe 6. 7. The dimensionl-ess
interaction force as a fUnction
of the particte-ptane distance
for the case of a~on adsorbed
on cracking catatyst for three
pressures (a = 10, T = 4,
o/p 0.036/bar, ~ = 20) o.s
/~,10 bar . : \ \ // ~\ . . \ . : \\ . . . \ . .
f " ....... :"
0 bar
1 A _ P 1.5
101
2

l''igure 6. 8. The dimensionless
cohesion as a function of gas
pressure for cracking catalyst.
For data on gas adsorption
parameters see tables 6.1-6.3.
6 r 2 C ss y = ~ = ~max
ss
y
6r-
4_
I 2r- I
----· ............. argon
/ /
------------- nitrogen ........ -----_,-neon + hydrogen
I 5
I I 10 15
p (bar)
(6.35)
I
20
As already stated the cohesion is practically independent of the hardness
of the material of the particle and the plane. This was also observed
by other authors (2). Moreover, it shows that the relative increase in
the cohesion due to gas adsorption is also independent of the radius
of the particle, c.q. the asperity radius. This is clarified by the
fact that none of the dimensionless parameters dealing with the gas
adsorption (a, T and 6) contain the radius, R.
For the quartz sand quite similar results were obtained.
6.6 CONCLUSIONS
The relation between interparticle distance and force may be influen
ced by gas adsorption. The presence and degree of the influence de
pend on the type of gas and the gas pressure.
The cohesion of the particles may also be influenced by gas adsorp
tion. The relative increase may be up to a factor three. The presence
and degree of the influence depend on the type of gas and on the gas
pressure. The relative degree of this influence does neither depend on
the radius of the particles involved nor on the hardness of the parti
cles.
102

6.7 LIST OF SYMBOLS
A .. lJ
c C .. lJ
F
h
K
L
n. l
N
No p
r
r .. lJ
R
s
T
u V .. lJ
y
L-3 L-2
c2 ML-1T-2
L
L
L
L
L
Hamaker coustant for the interaction between sub
stances i and j
cohesion (maximum of force)
constant in Lennard-Jones potential for substances
i and j
external force applied to the particle
flattening
constant defined by equation (6.12) distance between the centre of the particle and the
surface of the plane
density of molecules in substance i
density of adsorbed gas molecules
maximum density of adsorbed gas molecules
gas pressure
intermolecular distance
constant in Lennard-Jones for substances
i and j
radius of the particle
distance to centre line of the particle/plane sys-
tem
absolute temperature
energy
intermolecular potential for substances i and j
distance between the surface of the particle and the
plane
y ML-1T-2 Young's modulus
z L smallest distance between the surfaces of the particle
and the plane
6.7.1 dimensionless parameters
y
0
ratio of constants for molecular solid/ solid interac
tion and gas adsorption
cohesion
measure of adsorbed gas density defined by equation
(6.18)
103

£
p
T
energy
flattening of the particle
density of adsorbed gas molecules
smallest distance between the surfaces of the parti
cle and the plane
distance between the centre of the particle and the
surface of the plane
Poisson ratio
distance between the surfaces of the particle and the
plane
radius of the particle
ratio of adsorption energy and thermal energy
external force applied to the particle
ratio of constants for molecular solid/solid interac
tion and elastic energy
6.7.2 indices
a
c
g
H
m
s
gas adsorption at a free surface
gas adsorption between two surfaces
gas
elastic (Hertz)
molecular
solid
6.7.3 physical constants
6,8 LITERATURE
1 B.V. Derjaguin, V.M. Muller and Y.D. Toporov
J,Coll.Interf.Sci. 53(1975)314
2 K.L. Johnson, K. Kendall and A.D. Roberts
3
4
5
104
B, Dahneke
H. Krupp
D.C.-H. Cheng
Proc.R.Soc.Lond.A 324(1971)301
J.Coll.Interf.Sci. 40(1972)1
Adv.Coll.Interf.Sci. 1(1967)111
Chem.Eng.Sci, 23(1968)1405
6 J. Tsubaki and G. Jimbo Powder Technology 38(1984)219
7 0. Mo1erus Powder Technology 33(1982)81
8 K. Rietema Powder Technology 37(1984)5
9 H. Piepers, E. Cottaar, A. Verkooijen and K. Rietema
Powder Technology 37(1984)55
10 J. Visser Adv.Coll.Interf.Sci. 3(1972)331
11 H. Hertz Miscellaneous papers, 1896, Lon
don: Macmillan
12 H. Beijerinck, P. van der Kam, E. Cottaar and N. Verster
J.Chem.Phys. 75(1981)1570
13 K. Tang, J. Norbeck and P. Certain
J.Chem.Phys. 64(1976)3063
14 R. Aziz and H. Chen J.Chem.Phys. 67(1977)5719
15 T. MacRury, W. Steele and B. Berne
J.Chem.Phys. 64(1976)1288
16 J. Farrar and Y. Lee J.Chem.Phys. 57(1972)5492
17 J. Farrar, Y. Lee, V. Golmann and M. Klein
Chern. Phys. Lett. 19(1973)359
18 W.A. Steele
19 R. Johne and D. Severin
APPENDICES
The interaction of gases with solid
surfaces, Pergamon Press 1974
Chem.-Ing. Techn. 37(1965)57
6.A INTERACTION ENERGY BETWEEN A GAS AND A SOLID
For the interaction energy between an individual gas molecule and an
individual molecule of the solid we assume a Lennard-Jones potential
V (r) = C ( -gs gs (6.A.1)
The energy of a single gas molecule which is at a distance d of a so
lid plane is then given by
n/2 oo
U (d) = 2 n n f{ f V (r) r 2dr } sine de a s Od/cose gs s
1 r s = 2 1f ns cgs< - 6d 3 + 14Zd 9 ) (6.A.2)
105

This energy is at its minimum for d=rgs/12. The binding energy of a
single gas molecule is therefore given by
u = a
4/2nnC s gs (6.A.3)
If the case of a single gas molecule between two solid planes at a
distance y is considered, the energy is
u (y,d) = u (d) + u (y-d) c a a (6.A.4)
Where d is the distance to one of the planes.
For low values of y (y < 2r ) this function has a minimum at d=ty. gs
For higher values two minima will occur. As long as y is not too
large, the value of the energy in these minima does not differ very
much from the value at • Therefore, we will write the binding
energy between two planes as
(6.A.S)
6.B DENSITY OF ADSORBED MOLECULES
The system of the free gas and the adsorbed gas at a free surface is
considered. It is assumed there is equilibrium. Then the chemical po
tential, Ug' for the free gas must be equal to the chemical potential,
ua' of the adsorbed gas
Na Ua + kT log N _ N
Oa a (6.B.l)
Where Na is the number of adsorbed gas molecules and NOa the number of
adsorption sites at the free surface.
The same holds, of course, for the adsorption between two planes at
distance y. Thus
(6.B.2)
If all conditions, e.g. temperature and pressure, are the same it
therefore follows
106

N (y) c
N N aN exp((-U (y) + U )/kT) - c a Oa a
(6.B.3) NO - N (y) c c
Since the surface covered by one gas molecule is of the order of r 2
gg
it follows
\(y) "'7 l + 6 exp((-U (y) + U )/kT) gg c a
l 6 exp( U (y) + U )/kT) c a (6.B.4)
Using the definition
(6.B.5)
Since the chemical potential of a free, ideal gas is proportional to
the logarithm of the gas pressure it follows from equation (6.B.l)
that 6 is also proportional to the pressure.
6.C THE SORPTION MEASUREMENTS
6.C.l introduction
To measure the physi-sorptionof gases and powders at elevated pres
sures an experimental set-up was constructed as shown in figure 6.C.l.
In its essence the used technique is a volumetric one: the lack of gas
due to adsorption (or the surplus due to desorption) is measured by a
differential pressure transducer. All volumina are chosen in such a
way that if no sorption would take place the differential pressure
would be zero.
In this section we willtreatthe gas as an ideal gas. Using more accu
rate descriptions of a real gas, e.g. using virial coefficients, hard
ly increases the accuracy of the results,
6.C.2 the adsorption measurements
The procedure followed in this measurement is given in table 6.C.l,
From a simple mol balance it can be derived that the total amount of
adsorbed gas in moles at a pressure p1, na (p1), is equal to
107
3 --~~---------------------------------\t----~s supply
vacuttt-- I - 20 bar pump
vessel filled with brass volumina equa to powder vol
reference side
vessel filled with
powder
sorption side
Figure 6.C.l. Sohematias of the set-up for the sorption
measurements.
absolute pressure
(6.C.l)
Where ~p is the pressure difference between the sorption and the refe
rence side, V is the total volume below valve 5 (valve 7 opened), V s p is the skeleton volume of the powder, p1 is the absolute pressure at
the sorption side, Vc is the required skeleton volume of the powder
(i.e. the volume necessary to get no pressure difference, if no sorp
tion is present), R is the gas constant and T is the absolute tempera
ture.
Since the absolute pressure, p1, is orders of magnitude larger than
the differential pressure, ~p, it may be clear from equation (6.C.l)
that the accuracy to be reached is determined by the accuracy in
V - V • The required skeleton volume, Vc, is obtained through a cali-c p
bration procedure. The error is generally of the order of 0.01%. The
error in Vp, established by measurements with a pyknometer, was gene
rally about 0.1%. The lowest sorption, n , which can therefore be am
measured is equal to
108

adsorption measurement
step valves (x closed) pressure action
1 2 3 4 5 6 7 (upper right)
1 X X 0 bar evacuation
2 X X X X Po filling of upper vessels
3 X X X X X pl measurement
4 X X 1 bar deflating
desorption measurement
step valves (x closed) pressure action
1 2 3 4 5 6 7 (upper right)
1 X X Po filling of all vessels
2 X X X X 1 bar deflating
3 X X X X 0 bar evacuation of upper
vessels
4 X X X X X p1 measurement
5 X X 1 bar deflating
Table 6.C.1. The followed procedures for the sorption measurements.
When proceeding to a next step first all valves to be closed are
alo.'led, then valves to be opened are opened. Valves
6 and 7 are always opened or aloeed simultaneously.
p v ( ) 10-3 .:..L..:e.
nam P1 = RT
Or at 10 bar
n (10)/V 0.04 mol/m3 am p
3 Or using a skeleton weight of 3000 kg/m
N (10)/m = 1.4•10-5 mol/kg am p
4 and 5 and
(6.C.2)
(6.C.3)
(6.C.4)
Where m denotes the powder mass. Taking e.g. a molar weight of the p -7
gas of 30 gr this leads to a weighing accuracy of 4•10 , when a gra-
vimetric method would be used. Such is however unreachable, without
taking resource to very exotic weighing techniques. This shows the
advantage of a volumetric method for gasadsorption.
109

The duration of a single measurement is about three hours. One hour is
needed for a proper evacuation of all vessels. The second hour is nee
ded to fill the two upper vessels with gas. This takes such a long
time since all small pressure fluctuations must be damped out. The fi
nal hour is needed for the pressure difference to settle, after the
valves between the lower and upper vessels are opened.
6.C.3 the desorption measurement
The procedure followed in this measurement is also given in table
6.C.l. Now it can be derived that
6p (V - V ) + p1(V - V ) ( )
s p c p na Po = RT (6.C.S)
Where p0 is the pressure at which the lower vessels were originally
filled (step 1). The sorption at the final pressure p1 has to be
known. Generally it is measured by the adsorption technique.
The lowest measurable value of the sorption which can be measured is
now determined by the absolute errors in p1Vp/RT and in na(p1). Since
both errors are equal (see the previous section), it follows
Since Po is about twice as large as p1, it follows again
n (10)/V = 0.04 mol/m3 a p
(6.C.6)
(6.C.7)
So the accuracy of both the adsorption and the desorption technique
are equal~
6.C.4 the calibration technique
In the equations (6.C.1) and (6.C.S) in which the sorption is calcula
ted, two parameters, V and V , are still unknown. These where esta-s c
blished by the following calibration procedure:
- Instead of the powder a known volume of steel balls, Vb, is placed
in the lower sorption vessel.
A measurement is done similar to the adsorption or desorption mea-
110

surement.
Since the sorption is practically zero from equation (6.C.l) (or
(6.C.S)) it can be derived:
0 (6.C.8)
-Using different ball volumina, Vb, and initial pressures, p0 , resul
ting in many values of 6p and p1, V and V can be determined by a s c least-squares fitting procedure.
111

112

7 GENERAL OVERVIEW
7.1 INTRODUCTION
It is evident from the previous chapters that the interstitial gas
does influence the behavior of the powder through interaction with the
powder particles. All influences noted in the milling and mixing ex
periments created by applying gases with different viscosities and/or
pressures can be explained by the differences in porosity of the pow
der and the accompanying differences in mobility and cohesion of the
powder, That this influence on the porosity does have such a remark
able effect on the powder behavior is due to the fact that the mobi
lity and the cohesion show a very strong dependency on the porosity.
Two distinct types of gas influence could be distinguished. They are
shortly discussed below.
7.2 THE HYDRODYNAMIC GAS-POWDER INTERACTION
This interaction is due to the fact that a powder, which is aerated
during reshuffling in the apparatus under consideration, takes a cer
tain time to fully deaerate. If this time of deaeration is long com
pared to the cycle time of the reshuffling (at least) part of the pow
der is continuously in an aerated state. Rietema (1) derived a crite
rion when gas influence can be expected:
p g d2 N = d p << 100
g u ua (7 .1)
The dimensionless number N is called the gas-powder-interaction num-g . her. It should be noted that the smaller this number, the higher the
gas influence.
Figure 7.1 shows the result of a series of experiments in a rotating
drum in which both the apparatus speed Ua and the gas viscosity u are
varied. All particle properties were kept constant. In this particular
case the limiting value of the number N , at which gas influence resul-g
ting in a partly expanded powder became noticeable, was around 7. It
also clearly shows that the lower the number, i.e. the higher the gas
113
hydrogen ~ = 0.88•10- 5 kg/ms
114
air ~ = 1.8•10-5 kg/ms
w 4.5 s 1
N = 6.8 g
N = 4.4 g

neon ~ 3.1•10- 5 kg/ms
w = 4.5 s- 1
N = 3.9 g
(
w = 7 s-~
N = 2.5 g
Figure 7.1. The visually observed
powder surface and powder flow of a
fresh cracking catalyst (dp= 63-80 ~~
pp= 800 kg/m 3) for three different
gases at three speeds of rotation.
Radius of the drum is 0.075 m.
Depth of the drum is 0.02 m.
ll5
influence, the more powder is in the expanded state.
Two remarks must be made on this influence. The first is that for fine
powders the gas viscosity is generally not an independent gas parame
ter. At low absolute pressures the free path of the gas molecules be
comes of the order of the particle diameter, which results in a dras
tical decrease of the effective gas viscosity. For particles with a
diameter of 10 urn this effect sets in around 0.1 bar.
The second remark is that the number N , generally, depends on the g
scale of the apparatus, since the speed of the apparatus depends on
this scale in most cases. E.g. for ball mills, which are run at a con
stant fraction of the critical speed, the number N is inversely pro-&
portional to the square root of the radius of the mill. So when the
scale is increased, the number N decreases and thus the gas influence g
increases. As may be clear from the previous chapters this may have
important consequences for the processes involved.
7.3 THE INFLUENCE OF GAS ADSORPTION ON PARTICLE COHESION
This influence is studied theoretically in chapter 6. The result of
this influence is that the maximum porosity of the aerated powder is
increased. This can be explained by the theory developed by Mutsers
(2,3,4), which states that the larger the interparticle forces the lar
ger the stabilizing forces in an aerated powder will be. Hence, the
formation of gas bubbles, which cause a very fast deaeration of the
powder, is still prevented at higher porosities.
That gas adsorption does indeed influence the inter.particle cohesion
and thus the powder cohesion is shown in figure 7.2. Here the calcula
ted cohesion is compared to the measured cohesion. A strong correlation
is evident.
When in the future more pressurized installations will be used in pow
der handling these effects may also become important. Since gas ad
sorption is also very dependent on the absolute temperature, also the
temperature will effect this influence.
116
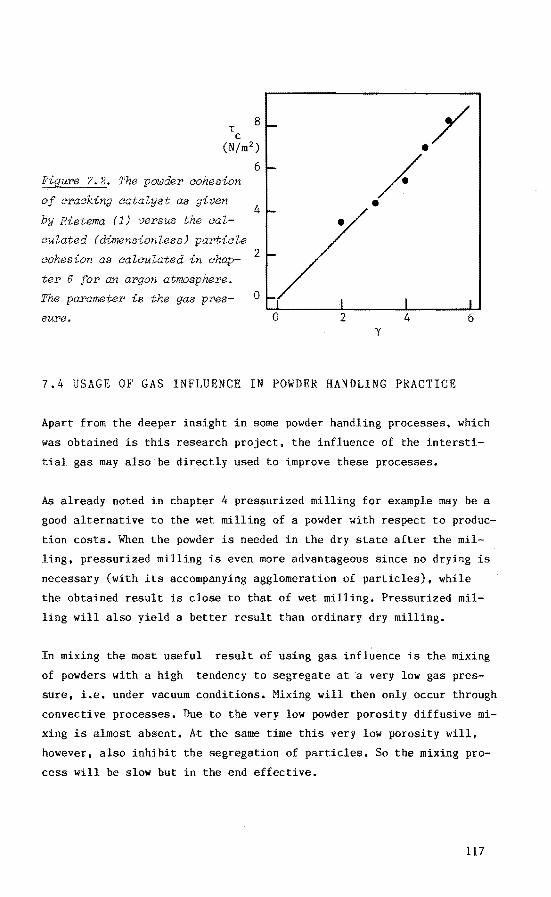
8 T c
(N/m 2 )
Figure 7.2. The powder cohesion
of cracking catalyst as given
by Rietema ( 1) versus the cal
culated (dimensionless) particle
cohesion as calculated in chap
ter 6 for an argon atmosphere.
The parameter is the gas pres-
sure.
6
4
2
0
./ /-•
y
7.4 USAGE OF GAS INFLUENCE IN POWDER HANDLING PRACTICE
Apart from the deeper insight in some powder handling processes, which
was obtained is this research project, the influence of the intersti
tial gas may also be directly used to improve these processes.
As already noted in chapter 4 pressurized milling for example may be a
good alternative to the wet milling of a powder with respect to produc
tion costs. When the powder is needed in the dry state after the mil
ling, pressurized milling is even more advantageous since no drying is
necessary (with its accompanying agglomeration of particles), while
the obtained result is close to that of wet milling. Pressurized mil
ling will also yield a better result than ordinary dry milling.
In mixing the most useful result of using gas influence is the mixing
of powders with a high tendency to segregate at a very low gas pres
sure, i.e. under vacuum conditions. Mixing will then only occur through
convective processes. Due to the very low powder porosity diffusive mi
xing is almost absent. At the same time this very low porosity will,
however, also inhibit the segregation of particles. So the mixing pro
cess will be slow but in the end effective.
117
Another possible usage may be the transport in vessels of segregating
powder mixes under vacuum conditions. Thus preventing, or at least
slowing down, any segregation.
Since gas viscosity and pressure so markedly influence the powder beha
vior gas influence may occasionally also be useful in creating some
special circumstances which are otherwise unobtainable.
7.5 LITERATURE
1 K. Rietema
2 s. Mutsers
3 s. Mutsers
4 s. Mutsers
1[8
and K. and K.
Rietema
Rietema
Powder Technology 37(1984)5
thesis, T.H. Eindhoven 1977
Powder Technology 24(1979)57
Powder Technology 24(1979)65

SAMENVATTING
In dit proefschrift worden de resultaten beschreven van een onderzoek
naar de invloed van het interstitiele gas, het gas tussen de poeder
deeltjes, op het gedrag van fijne, stromende poeders. Twee invloeden
moeten worden onderscheiden:
een hydrodynamische interaktie ten gevolge van een verschil in snel
heid tussen het gas en de poederdeeltjes,
- een eventuele verhoging van de onderlinge deeltjeskrachten ten ge
volge van mogelijke adsorptie van het gas aan het oppervlak van de
deeltjes.
De eerste invloed heeft in het algemeen tot gevolg dat het poeder in
apparaten waarin het wordt bewerkt, een hogere porositeit verkrijgt,
dan die het in een dergelijk apparaat zou hebben bij afwezigheid van
deze invloed. De hogere porositeit heeft een hogere poedermobiliteit
tot gevolg. De belangrijkste grootheden, diedeze invloed bepalen, zijn
de gasviskositeit en de deeltjesdiameter.
De tweede invloed, welke vooral merkbaar is bij verhoogde drukken
(10 tot 20 bar) heeft tot gevolg dat de maximale porositeit, die
het poeder bereiken kan, wordt verhoogd en daarmee samenhangend de
mobiliteit wordt vergroot. Ten gevolge van de grotere interaktie
krachten tussen de deeltjes (grotere kohesie) kan het beluchte poe
der namelijk een lossere struktuur bereiken zonder instabiel te wor~
den (belvorming).
Voor twee praktische vormen van poederbewerkingen, malen en mengen,
is de uiteindelijke betekenis van deze twee gasinvloeden voor het
proces onderzocht.
Bij malen bleken de eigenschappen van het gas zowel de maalsnelheid
(de gewichtsfraktie gemalen poeder per tijdseenheid) als de maalfijn
heid (de fijnheid van de gemalen poederdeeltjes) te beinvloeden. Ook
de uiteindelijke fijnheid van het maalprodukt wordt beinvloed door
bet gas. Het onderzoek toont aan dat onder bepaalde omstandigheden
het droog malen van een poeder in een molen onder verhoogde druk een
goed alternatief kan zijn voor het nat malen, dan wel een verbetering

kan geven ten opzichte van normaal droog malen.
De beinvloeding van het poedergedrag door het gas en de daaruit vol
gende beinvloeding van het maalproces is ook gebruikt om een beter
inzicht te verkrijgen in de verschijnselen welke van belang zijn voor
het malen in een kogelmolen. Het bleek mogelijk twee typen van kogel
gedrag te onderscheiden, die elk bijdroegen tot het maalproces, en
de bijdragen van elk te kwantificeren. Ook de porositeit van het poe
der bleek invloed te hebben op deze bijdragen. Kennis als deze kan
van groot nut zijn bij de schaalvergroting van kogelmolens.
Ook op het menggedrag van poeders bleek de gasfase invloed te hebben.
In het algemeen geldt dat voor poeders, welke geen neigingtotsegre
gatie vertonen, de mengsnelheid verhoogd kan worden door de mobili
teit, respektievelijk de porositeit, van de poeders te vergroten.
Dit kan bereikt worden door uit te gaan van een gas met een hoge vis
kositeit en/of te werken bij verhoogde druk. Voor poeders,welkewel
neiging tot segregatie vertonen, dient de mobiliteit juist zo laag
mogelijk gehouden te worden om uitzakken van deeltjes te bemoeilijken.
Dit kan men bewerkstelligen door te werken met een lage gasviskositeit
en/of bij verlaagde druk (vakuum).
De invloed van de adsorptie van gas op de deeltjeskrachten is ook
theoretisch onderzocht. Op grond van literatuurgegevens en enige
aanvullende experimenten kon worden aangetoond dat een dergelijke
invloed inderdaad aanwezig is. De invloed is sterk afhankelijk van
het type gas.
De eindkonklusie van het onderzoek kan luiden dat het interstitiele
gas inderdaad een duidelijke invloed op het gedrag van fijne poeders
heeft en dat deze invloed van belang is bij de verschillende poeder
bewerkingen.

SUMMARY
This thesis reports on a research project on the influence of inter
stitial gas, i.e, the gas in the pores between the powder particles,
on the behavior of fine, flowing powders. Two influences must be dis
tinguished:
- a hydrodynamic interaction due to a slip velocity between the gas
and the particles,
a possible increase of the interparticle forces due to adsorption
of the gas at the surface of the particles.
The first influence generally causes that the porosity of the powder
in the apparatus under consideration is higher than it would be
without this influence. This increased porosity in its turn increases
the mobility of the powder. The main parameters controlling this in
fluence are the gas viscosity and the particle size.
The second influence, which is mostly noticeable at elevated gas
pressures (10 through 20 bar), causes an increased maximum porosi
ty of the powder. This is due to the fact that due to the increased
interparticle forces the powder can reach a more open structure
without becoming instable (creation of gas bubbles). The increased
maximum porosity again increases the mobility.
For two applications in the field of powder handling the effects of
these two influences of interstitial gas have been further investi
gated. These applications were the dry milling and dry mixing of fine
powders.
For milling the properties of the gas influenced both the rate of
breakage, i.e. the fraction of the powder milled per unit of time,
and the milling fineness, i.e. the fineness of the milled particles.
Also the ultimate fineness of the product was influenced by the in
terstitial gas. It is shown thatthedry milling of a powder in a mill
at an elevated gas pressure can be a good alternative to the wet
milling of such a powder, Milling at an elevated pressure will also
cause an improvement in comparison with ordinary dry milling.

The influence of the gas on the powder behavior and the resulting
influence on the milling process has also been used to obtain a bet
ter insight in the most important processes occuring in a ball mill.
Two types of ball movement, falling and cascading balls, each contri
buting to the milling process, could be distinguished. The contribu
tion of each could be quantified. Also the powder porosity appeared
to influence these contributions. The knowledge thus obtained can be
of great \·alue whan up.
Also the mixing behavior of fine powders appeared to be influenced by
the interstitial gas. Generally it can be stated that powders, which
show no tendency to segregation, can be more quickly mixed by increa
sing the powder porosity, c.q. the mobility. This can be done by
using a more viscous gas and/or an increased gas pressure in the mi
xer. Powders, however, which will easily segregate, can better be
mixed in a state of low powder mobility. This one can reach by mixing
in a low \'iscositY gas and/or at low gas pressure (vacuum).
The influence of the adsorption of gas on the interparticle forces
has also been investigated theoretically. Using data from the litera
ture and some additional experiments it is shown that such an in
fluence is indeed present. The degree of the influence is very depen
dent on the type of gas used.
The final conclusion of this research is that the interstitial gas
indeed does influence the behavior of fine powders and that this in
fluence has its consequences for practical applications of powder
handling.

LEVENSBERICHT
20 aug 1956 geboren te Heerlen
1974 eindexamen gymnasium-B aan het Bernardinus-
college te Heerlen
1974 - 1980 studie aan de afdeling Technische Natuurkunde
van de TH Eindhoven
1980 - 1984 als wetenschappelijk ambtenaar van de stichting
FOM werkzaam aan de afdeling Scheikundige Tech
nologie van de TH Eindhoven
1985 - werkzaam als ontwikkelaar bij de hoofdindustrie
groep Licht van de Nederlandse Philips Bedrij
ven B.V.
ACKNOWLEDGEMENT
The project of which this thesis is a result was a part of the program
of Technical Physics and Innovation (Technische Natuurkunde en Innova
tie) of the Foundation for Fundamental Research on Matter (Stichting
Fundamenteel Onderzoek der Materie. FOM). It was also financially
supported by the Foundation for Technical Sciences (Stichting voor
de Technische Wetenschappen. STW). the future technical science
branch of the Foundation for Pure Research (Stichting Zuiver Weten
schappelijk Onderzoek. ZWO).
STELLINGEN
behorend bij het proefschrift van E.J.E. Cottaar
1 Het is onjuist aan het oppervlak van vaste stoffen een oppervlakte
energie toe te kennen.
dit proefschrift, hoofdstuk 6
K.L. Johnson e.a., Proc.R.Soc.Lond.A 423(1971)301
B.V. Derjaguin e.a.,J.Coll.Interf.Sci. 53(1975)314
2 De als "flow properties" in de literatuur omschreven eigenschappen
van poeders beschrijven niet, zoals de term suggereert, de stro
mingseigenschappen, maar slechts de overgang van een stilstaand
naar een stromend poeder.
3 De door Sommer gegeven beschrijving van het mengen van poeders is
niet invariant voor een verandering in de definitie van de konsen
tratie.
K. Sommer, Fortschr.d.Verfahrenst. 19(1981)189
4 Gezien de bij de huidige stand van de kennis van het gedrag van
poeders zeer beperkte geldigheid van numerieke korrelaties en de
daar tegenover staande grote variatie in de eigenschappen van poe
ders, is het geven van en zoeken naar dergelijke numerieke korrela
ties in het algemeen een zinloze zaak. De voortgang van de kennis
over poeders is voorlopig meer gebaat bij goede kwalitatieve be
schrijvingen van het waargenomen gedrag.
5 Het door Vaessen ontwikkelde model voor de impulsoverdracht tussen
een plasma en daarin gespoten metaaldeeltjes is onnodig ingewikkeld.
Een eenvoudig laminair model geeft, gezien de onzekerheid in de
verschillende parameters, een even nauwkeurig beeld.
P.H. Vaessen, proefschrift TH Eindhoven 1984

6 Bij de sporenelementenanalyse met behulp van FIXE (proton induced
X-ray emission) is de keuze van de dragermaterialen en het ontwik
kelen van standaardmethoden voor de monsterbereiding minstens
even belangrijk als het ontwikkelen van de uiteindelijke analyse
apparatuur en -programmatuur.
H.P.M. Kivits, proefschrift TH Eindhoven 1980
7 Bij het gebruik van tracerdeeltjes ten behoeve van het bestuderen
van het gedrag van een stromend medium dient men zorgvuldig te
onderzoeken of en in hoeverre te verwachten is dat het gedrag van
de tracerdeeltjes overeenkomt met dat van het te onderzoeken me
dium.
8 Na de invoering van de twee-fasen struktuur in het wetenschappelijk
onderwijs lijkt het zinvoller de aanduiding "universiteit" in de
aanduiding "hogeschool" te veranderen in plaats van de omgekeerde
wijziging zoals voorgesteld door de Nederlandse regering.
16 april 1985