the influence of individual-specific plant parameters and
TRANSCRIPT

Article
The Influence of Individual-Specific Plant Parametersand Species Composition on the Allergenic Potentialof Urban Green Spaces
Susanne Jochner-Oette 1,*, Theresa Stitz 1, Johanna Jetschni 1 and Paloma Cariñanos 2 ID
1 Physical Geography/Landscape Ecology and Sustainable Ecosystem Development, Catholic University ofEichstätt-Ingolstadt, Eichstätt 85072, Germany; [email protected] (T.S.); [email protected] (J.J.)
2 Department of Botany, Faculty of Pharmacy, Campus de Cartuja, University of Granada, Granada 18071,Spain; [email protected]
* Correspondence: [email protected]; Tel.: +49-8421-93-21742
Received: 3 May 2018; Accepted: 19 May 2018; Published: 23 May 2018�����������������
Abstract: Green planning focusses on specific site requirements such as temperature tolerance oraesthetics as crucial criteria in the choice of plants. The allergenicity of plants, however, is oftenneglected. Cariñanos et al. (2014; Landscape and Urban Planning, 123: 134–144) developed the UrbanGreen Zone Allergenicity Index (IUGZA) that considers a variety of plant characteristics to calculatethe allergenic potential of urban green spaces. Based on this index, we calculated an index for theindividual-specific allergenic potential (IISA) that accounts for a varying foliage volume by accuratemeasurements of crown heights and surface areas occupied by each tree and only included matureindividuals. The studied park, located in Eichstätt, Germany, has an area of 2.2 ha and consists of231 trees. We investigated the influence of species composition using six planting scenarios andanalysed the relationship between allergenic potential and species diversity using Shannon index.Only a small number of trees was female and therefore characterised as non-allergenic, 9% of thetrees were classified as sources of main local allergens. The allergenic potential of the park based onliterature values for crown height and surface was IUGZA = 0.173. Applying our own measurementsresulted in IISA = 0.018. The scenarios indicated that replacing trees considered as sources of mainlocal allergens has the strongest impact on the park’s allergenic potential. The IUGZA offers an easyway to assess the allergenic potential of a park by the use of a few calculations. The IISA reducesthe high influence of the foliage volume but there are constraints in practicability and in speed ofthe analysis. Although our study revealed that a greater biodiversity was not necessarily linked tolower index values, urban green planning should focus on biodiversity for ameliorating the allergenicpotential of parks.
Keywords: urban parks; landscape planning; allergenic potential; ecosystem disservices
1. Introduction
Allergic diseases are considered as important human health issues as they substantially restrictmany allergic people [1,2]. In Germany, almost 20% of the adult population suffers from at leastone type of allergy [1] and 30% of the adult population and 50% of the adolescent generation showsensitisations [2]. Since 15% of the population are affected by hay fever [3], pollen allergy poses amajor risk for humans.
In light of these rising numbers of allergic diseases, the consideration of allergy-friendliness inurban green planning seems to be essential [1,4]. Actually, pollination is regarded as an ecosystemservice provided by green infrastructure [5]. When related to pollen allergies, however, it can also
Forests 2018, 9, 284; doi:10.3390/f9060284 www.mdpi.com/journal/forests

Forests 2018, 9, 284 2 of 14
be considered as an ecosystem disservice [6] representing a conflict to other ecosystem services such asrecreation and health benefits as green spaces regulate climate and improve air quality [5].
Urban green planning mainly focusses on specific site requirements (e.g., temperature tolerance,pest resistance, tolerance to pruning) and aesthetics as crucial criteria in the choice of plants [7]. Theallergenic potential of plants, however, is often neglected [1,4,8]. Still, more research is requiredregarding the use of allergenic plants in green spaces and the development of allergy-friendly greenareas in urban environments. Some attempts have been made to formulate planning recommendationsto reduce negative health impacts caused by plants producing allergenic pollen [9–11]. For example,it was recommended to develop gardens with only female plants or with a great diversity ofnon-allergenic plants [10]. Microbial diversity was found to positively affect the human immune systemby reducing certain allergenic and respiratory diseases (e.g., reviewed by [12]). A study conducted ineastern Finland showed that atopic individuals were associated with lower environmental biodiversityin the surroundings of their homes and significantly lower generic diversity of gammaproteobacteriaon their skin [13]. Since there is a link between richness of macroorganisms and the associated microbialbiodiversity [12], a greater biodiversity of plants in general may reduce the risk of allergy sensitisations.In addition, an increased biodiversity linked to a reduction of traditional species with a high allergeniccapacity leads to lower concentrations of monospecific pollen [14].
The allergenic potential of plants was assessed by [10] who developed the Ogren Plant AllergyScale (OPALS). This scale considers different plant-specific criteria based on studies about similaritiesbetween allergenic and non-allergenic plants. Characteristics include pollen weight and size, pollenmoisture, flower fragrance as well as the position of male flowers of monoecious species. The scalecategorises species at ten levels with 1 being non-allergenic and 10 being highly allergenic. Anotherattempt to categorise plants according to their allergological characteristics was made by [15] whodeveloped the allergen index (A.I.). This index is based on information on the plant’s life cycle,the length of its phenanthesic period, the presence of phenomena of cross reactivity and speciesabundance [15,16]. In addition, [17] developed the so-called Urban Green Zone Allergenicity Index(IUGZA) to calculate the allergenic potential of urban green spaces. This index compares an existentgreen space with a hypothetical space with maximum allergenicity. The index is based on the followingassumptions: Plants with a higher crown volume emit higher pollen quantities [18], anemophiloustrees produce more pollen than other trees [19] and pollen release is directly proportional to the numberof individuals belonging to one species.
In this study, the current allergenic potential of the trees and shrubs in an urban park (Hofgarten,located in Eichstätt, Germany) was examined using IUGZA.
Based on this index, we developed IISA, an index for the individual-specific allergenic potential ofurban green spaces. Therefore, we measured the height and the surface covered by each individual treeor shrub and only included mature individuals already emitting pollen. In addition, we investigatedthe influence of species composition on the allergenic potential of the park using six different plantingscenarios and analysed the relationship between allergenic potential and species diversity usingShannon index. Thus, our main aims were to develop and evaluate management tools (indices andplanting scenarios) in order to formulate recommendations for urban planning. Although this studyonly includes a single park, our methods are also applicable for any park of any size and thereforeillustrative for the practicability of the management tools presented in our study.
2. Materials and Methods
2.1. Study Area
The studied park Hofgarten (48◦53’20.54” N, 11◦11’17.78” E, 385 m a.s.l.) is located in thecity of Eichstätt, Bavaria, Germany (Figure 1a,b). The climate is temperate with an average annualtemperature of 8.0 ◦C and an annual precipitation of 776.5 mm (1961–1990, German MeteorologicalService, station “Landershofen”). Eichstätt is located at the Altmühl river and has a few open green

Forests 2018, 9, 284 3 of 14
areas. The rectangular-shaped urban park lies south-east of the city center, next to the main campus ofthe Catholic University of Eichstätt-Ingolstadt (Figure 1c). Hofgarten has an area of 22,480 m2 (~2.2 ha).In 1735, the park was designed as a baroque garden and partially transformed to an English gardenafter 1817. In recent times, these concepts were combined leading to a composition of geometricallydesigned and accurately pruned baroque elements with long and structured avenues and a variety ofsome very old trees originating from Europe, North America and Asia [20]. Recently, the park counts231 trees and shrubs of 69 different species (excluding hedges, flowerbeds and grass and herb species)(Table 1).
Forests 2018, 9, x FOR PEER REVIEW 3 of 14
of the Catholic University of Eichstätt-Ingolstadt (Figure 1c). Hofgarten has an area of 22,480 m² (~2.2 ha). In 1735, the park was designed as a baroque garden and partially transformed to an English garden after 1817. In recent times, these concepts were combined leading to a composition of geometrically designed and accurately pruned baroque elements with long and structured avenues and a variety of some very old trees originating from Europe, North America and Asia [20]. Recently, the park counts 231 trees and shrubs of 69 different species (excluding hedges, flowerbeds and grass and herb species) (Table 1).
Figure 1. Location of the study site in Germany (Eurostat, NUTS 2013/EU-28) (a) and in the city of Eichstätt, red border; (b) OpenStreetMap; (c) GoogleEarth.
Figure 1. Location of the study site in Germany (Eurostat, NUTS 2013/EU-28) (a) and in the city ofEichstätt, red border; (b) OpenStreetMap; (c) GoogleEarth.
Forests 2018, 9, 284 4 of 14
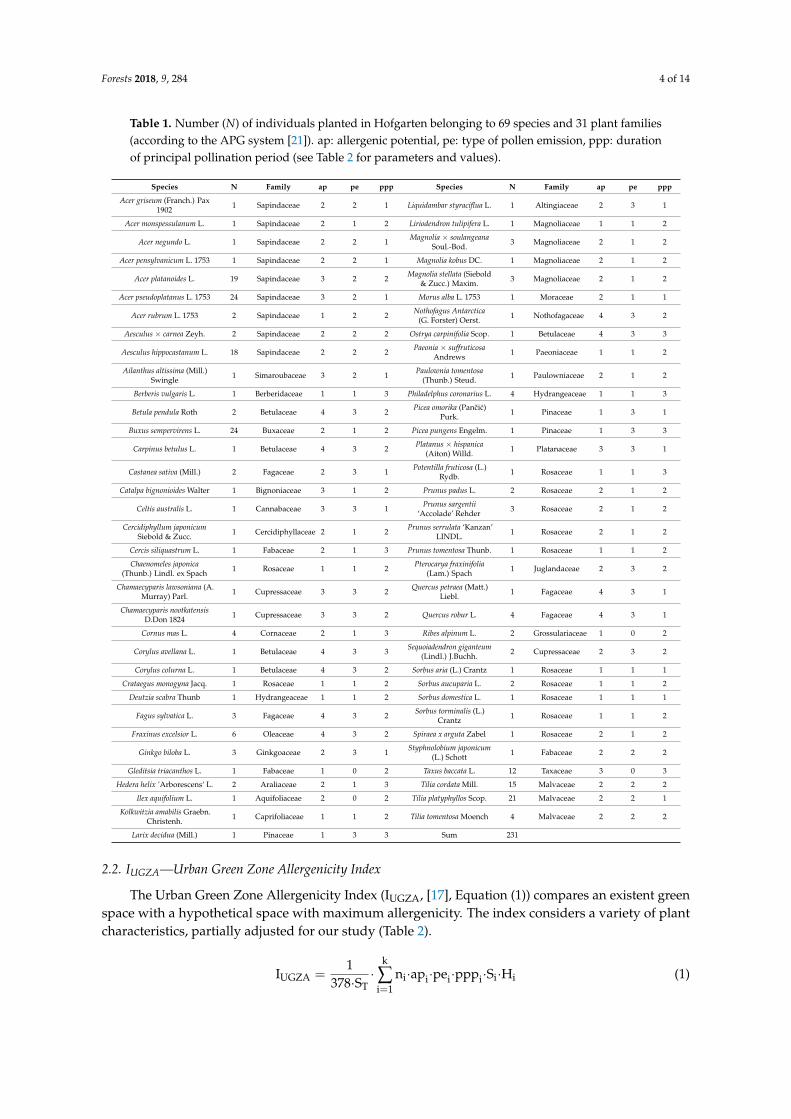
Table 1. Number (N) of individuals planted in Hofgarten belonging to 69 species and 31 plant families(according to the APG system [21]). ap: allergenic potential, pe: type of pollen emission, ppp: durationof principal pollination period (see Table 2 for parameters and values).
Species N Family ap pe ppp Species N Family ap pe ppp
Acer griseum (Franch.) Pax1902 1 Sapindaceae 2 2 1 Liquidambar styraciflua L. 1 Altingiaceae 2 3 1
Acer monspessulanum L. 1 Sapindaceae 2 1 2 Liriodendron tulipifera L. 1 Magnoliaceae 1 1 2
Acer negundo L. 1 Sapindaceae 2 2 1 Magnolia × soulangeanaSoul.-Bod. 3 Magnoliaceae 2 1 2
Acer pensylvanicum L. 1753 1 Sapindaceae 2 2 1 Magnolia kobus DC. 1 Magnoliaceae 2 1 2
Acer platanoides L. 19 Sapindaceae 3 2 2 Magnolia stellata (Siebold& Zucc.) Maxim. 3 Magnoliaceae 2 1 2
Acer pseudoplatanus L. 1753 24 Sapindaceae 3 2 1 Morus alba L. 1753 1 Moraceae 2 1 1
Acer rubrum L. 1753 2 Sapindaceae 1 2 2 Nothofagus Antarctica(G. Forster) Oerst. 1 Nothofagaceae 4 3 2
Aesculus × carnea Zeyh. 2 Sapindaceae 2 2 2 Ostrya carpinifolia Scop. 1 Betulaceae 4 3 3
Aesculus hippocastanum L. 18 Sapindaceae 2 2 2 Paeonia × suffruticosaAndrews 1 Paeoniaceae 1 1 2
Ailanthus altissima (Mill.)Swingle 1 Simaroubaceae 3 2 1 Paulownia tomentosa
(Thunb.) Steud. 1 Paulowniaceae 2 1 2
Berberis vulgaris L. 1 Berberidaceae 1 1 3 Philadelphus coronarius L. 4 Hydrangeaceae 1 1 3
Betula pendula Roth 2 Betulaceae 4 3 2 Picea omorika (Pancic)Purk. 1 Pinaceae 1 3 1
Buxus sempervirens L. 24 Buxaceae 2 1 2 Picea pungens Engelm. 1 Pinaceae 1 3 3
Carpinus betulus L. 1 Betulaceae 4 3 2 Platanus × hispanica(Aiton) Willd. 1 Platanaceae 3 3 1
Castanea sativa (Mill.) 2 Fagaceae 2 3 1 Potentilla fruticosa (L.)Rydb. 1 Rosaceae 1 1 3
Catalpa bignonioides Walter 1 Bignoniaceae 3 1 2 Prunus padus L. 2 Rosaceae 2 1 2
Celtis australis L. 1 Cannabaceae 3 3 1 Prunus sargentii‘Accolade’ Rehder 3 Rosaceae 2 1 2
Cercidiphyllum japonicumSiebold & Zucc. 1 Cercidiphyllaceae 2 1 2 Prunus serrulata ‘Kanzan’
LINDL. 1 Rosaceae 2 1 2
Cercis siliquastrum L. 1 Fabaceae 2 1 3 Prunus tomentosa Thunb. 1 Rosaceae 1 1 2
Chaenomeles japonica(Thunb.) Lindl. ex Spach 1 Rosaceae 1 1 2 Pterocarya fraxinifolia
(Lam.) Spach 1 Juglandaceae 2 3 2
Chamaecyparis lawsoniana (A.Murray) Parl. 1 Cupressaceae 3 3 2 Quercus petraea (Matt.)
Liebl. 1 Fagaceae 4 3 1
Chamaecyparis nootkatensisD.Don 1824 1 Cupressaceae 3 3 2 Quercus robur L. 4 Fagaceae 4 3 1
Cornus mas L. 4 Cornaceae 2 1 3 Ribes alpinum L. 2 Grossulariaceae 1 0 2
Corylus avellana L. 1 Betulaceae 4 3 3 Sequoiadendron giganteum(Lindl.) J.Buchh. 2 Cupressaceae 2 3 2
Corylus colurna L. 1 Betulaceae 4 3 2 Sorbus aria (L.) Crantz 1 Rosaceae 1 1 1
Crataegus monogyna Jacq. 1 Rosaceae 1 1 2 Sorbus aucuparia L. 2 Rosaceae 1 1 2
Deutzia scabra Thunb 1 Hydrangeaceae 1 1 2 Sorbus domestica L. 1 Rosaceae 1 1 1
Fagus sylvatica L. 3 Fagaceae 4 3 2 Sorbus torminalis (L.)Crantz 1 Rosaceae 1 1 2
Fraxinus excelsior L. 6 Oleaceae 4 3 2 Spiraea x arguta Zabel 1 Rosaceae 2 1 2
Ginkgo biloba L. 3 Ginkgoaceae 2 3 1 Styphnolobium japonicum(L.) Schott 1 Fabaceae 2 2 2
Gleditsia triacanthos L. 1 Fabaceae 1 0 2 Taxus baccata L. 12 Taxaceae 3 0 3
Hedera helix ‘Arborescens‘ L. 2 Araliaceae 2 1 3 Tilia cordata Mill. 15 Malvaceae 2 2 2
Ilex aquifolium L. 1 Aquifoliaceae 2 0 2 Tilia platyphyllos Scop. 21 Malvaceae 2 2 1
Kolkwitzia amabilis Graebn.Christenh. 1 Caprifoliaceae 1 1 2 Tilia tomentosa Moench 4 Malvaceae 2 2 2
Larix decidua (Mill.) 1 Pinaceae 1 3 3 Sum 231
2.2. IUGZA—Urban Green Zone Allergenicity Index
The Urban Green Zone Allergenicity Index (IUGZA, [17], Equation (1)) compares an existent greenspace with a hypothetical space with maximum allergenicity. The index considers a variety of plantcharacteristics, partially adjusted for our study (Table 2).
IUGZA =1
378·ST·
k
∑i=1
ni·api·pei·pppi·Si·Hi (1)

Forests 2018, 9, 284 5 of 14
Table 2. Scale of values for the parameters used for IUGZA (Urban Green Zone Allergenicity Index) andIISA (Index of individual-specific allergenic potential of green spaces).
Parameters Values for IUGZA and IISA
Allergenic potential (ap)
0 = non-allergenic (OPALS 1)
1 = low allergenicity (OPALS 2–4)
2 = moderate allergenicity (OPALS 5–7)
3 = high allergenicity (OPALS 8–10)
4 = main local allergens
Type of pollen emissions (pe)
0 = only female-sex individuals
1 = entomophilous
2 = ampiphilous
3 = anemophilous
Principal pollination period(ppp)
1 = 1–4 weeks
2 = 5–8 weeks
3 ≥ 9 weeks
IUGZA IISA
Crown height (H)Mean height attained atreproductive maturity: 2, 6, 10, 14m or exceptionally 18 m
Individual-specific measurements[m]
Plant surface (S)Small-diameter: <4 m,medium-diameter: 4–6 m,large-diameter: >6 m
Individual-specific measurementsusing 4 radii [m]
OPALS: Ogren Plant Allergy Scale [10].
Relevant variables for IUGZA are the total area of the examined green space in square meters (ST),the number of species (k), the number of individuals belonging to one species i (ni), species-specificand classified values for allergenicity (api), type of pollen emission (pei), duration of the mainpollination period (pppi), crown height in meters (Hi) and surface area of the plant in square meters (Si)(classification see Table 2). The values for the parameters of the index were—apart from the base areaof the green space (ST) and of the present number of species and individuals (k, ni)—obtained fromdatabases or reports and in this study adapted to conditions prevailing in the biogeographic regionof our investigated park (see Section 2.4). The capacity of species-specific pollen emission (Si × Hi)was calculated using a volume calculation of geometric plant shapes. A cylindrical shape was usedfor trees and a hemispherical shape for shrubs. The height of the crown (Hi) and surface area of treesand shrubs (Si) refer to the maximum values of a mature individual of the respective species. Forsimplification, these literature-based values of Hi and Si were also classified or scaled.
The figure 378 is an expression of the maximum values (api × pei × pppi × Hi) a species i canobtain and serves, together with the base area of the green space (ST), as reference unit of the formula.Although, maximum values for height can reach 18 m and main local allergens are considered asap = 4, [17] used ap = 3, pe = 3, ppp = 3 and H = 14 for the calculation of this factor.
An index value of 0 can only be obtained if the tree is female (pe = 0) or the emitted pollen isnon-allergenic (ap = 0).
Values higher than 0.5 already relate to a high allergenic potential [17]. When a densely plantedgreen space is considered, the sum of all surface areas occupied by the plants can be greater thanthe base area of the green space (ST). In this case and when all factors and parameters measured aremaximal, the index can also exceed the value of 1.

Forests 2018, 9, 284 6 of 14
2.3. IISA—Index of Individual-Specific Allergenic Potential of Green Spaces
The index of the individual-specific allergenic potential of green spaces (IISA) was calculatedusing the same formula as for IUGZA (Equation (1)). In contrast to IUGZA, we measured the crownheight (Hi) and surface areas (Si) of each plant. In addition, IISA uses a different constant (1/1188)since we considered main local allergens (ap = 4) and the maximum tree height differs in our studydue to plant-specific measurements. The highest crown represented by the species Tilia tomentosa wasH = 33 m. In contrast to the study presented by [17] we only included mature individuals that arealready producing flowers and hence emitting pollen. For both variants (IUGZA and IISA), we excludedflowerbeds and herb and grass species and revised all parameters according to the descriptions below.
2.4. Parameters Used for IUGZA and IISA
For the classification of the allergenic potential (api) of plants, we used the Ogren Plant AllergyScale (OPALS, [10], reclassification see Table 2). Different species composition and airborne pollenconcentrations imply varying sensitisation rates for specific species between countries/regions [8].Thus, locally occurring highly allergenic plants were additionally taken into account (ap = 4). In ourstudied park, this relates to species of Betulaceae, Fagaceae and Oleaceae [11]. For missing speciesnot listed in [10], we calculated the median. e.g., the median of all Acer species was used to obtain thevalue for missing information on the allergenic potential of Acer monspessulanum.
The factor type of pollen emission (pei) consists of information about the type of pollination.E.g., female dioecious plants do not emit any pollen whereas anemophilous plants emit far morepollen than entomophilous plants [22]. The classification of female plants resulted in ap = 0. Thisclassification was mainly made by means of optical characteristics (presence of fruits, e.g., berries onIlex aquifolium = female). If optical inspections were not possible due to plant height, we used the meanof the allergenicity values for female and male plants of the respective species. For the classificationof missing species not evaluated by [17], we used information of the databases BiolFlor [23] andBaumkunde.de [24]. In case of diverging specifications, a plant was attributed to pe = 2.
To adopt the length of the pollination period (pppi) to the biogeographical region of our study,information on this parameter was obtained from literature and databases [23–26]. Therefore, it wasalso necessary to adjust the width of classes for this parameter (see Table 2).
The individual-specific volume (Si × Hi) of each tree is considered to represent the capacity ofpollen emission [18]. In contrast to IUGZA, the newly developed IISA does not incorporate mean valuesfor adult trees but takes the actual information of Si and Hi for each individual into account. Asdescribed by [17], a cylindrical shape was used for trees and a hemispherical shape for shrubs. Theunequal symmetry of many trees and shrubs implies that the calculation of the volume of the cylinderremains imprecise when an average radius of the crown is applied. Therefore, the plant’s radius wasmeasured at four positions. Tree and crown height was assessed using a height meter (SUUNTOPM-5/1520).
Since IISA only includes mature individuals, the age of the trees as an indicator for maturity wasassessed using a commonly used method proposed by [27] which is based on the measurement oftrunk circumferences at a height of 1.5 m. According to [27], the age of the tree is its circumference incentimetres divided by 2.5. In the case of fast-growing trees (e.g., Sequoiadendron giganteum, Pterocaryafraxinifolia, Nothofagus antarctica, Liriodendron tulipifera), the circumference is divided by 5. Informationregarding species-specific age of maturity was obtained from different publications [28–31]. In caseof missing information the mean age of maturity of all available species (=20.1 years) was used as athreshold value of maturity. Note that the growth of solitary trees may differ but could not be assessedin the course of our study.

Forests 2018, 9, 284 7 of 14
2.5. Planting Scenarios
Since IUGZA uses the maximum plant height and surface of the crown (values known fromliterature), but IISA requires individual-specific values, it was more sensible to use IUGZA in plantingscenarios. In all six scenarios, the number of hypothetical planted individuals equals the number ofindividuals currently growing in the studied park (N = 231).
For scenario 1, we selected 14 typical park trees according to [32,33]. We calculated their count (seenumbers in brackets) according to their current proportional occurrence in the park: Acer plantanoides(34.3), Acer pseudoplatanus (43.3), Aesculus hippocastanum (32.5), Betula pendula (3.6), Carpinus betulus(1.8), Fagus sylvatica (5.4), Fraxinus excelsior (10.8), Larix decidua (1.8), Picea omorica (1.8), Picea pungens(1.8), Taxus baccata (21.7), Tilia cordata (27.1), Tilia platyphyllos (37.9), T. tomentosa (7.2). Scenario 2 is basedon the exclusion of locally high-allergenic species. In total 21 trees/shrubs with ap = 4 belonging tothe plant families Betulaceae, Fagaceae and Oleaceae were replaced by randomly selected individuals.The median of this new selection was ap = 2. For scenario 3, all present species were selected butuniformly distributed. With 231 individuals and 69 different species, a frequency of 3.35 was assignedto these species. In scenario 4, only the ten most prevalent species were considered (A. pseudoplatanus,T. platyphyllos, A. platanoides, A. hippocastanum, T. cordata, T. baccata, F. excelsior, T. tomentosa, Quercusrobur). The number of individuals were uniformly distributed among species. Thus, a frequencyof 23.1 was assigned to each species. For scenario 5, also only the ten most prevalent species wereincorporated in our calculations, however, with an unequal distribution. The frequencies were 1, 2, 3,5, 10, 20, 30, 40, 50 and 70 with the lowest frequency related to the species that is represented fewestof all. We considered 24 species in scenario 6 recommended by [34] for city trees and shrubs thatwere classified at least as suitable in the categories of drought tolerance and winter hardiness. Thoseclimate-tolerant species were uniformly distributed and yielded a count of 9.6. Species belonging tothis category were Acer negundo, Sorbus aria, Buxus sempervirens, Cornus mas, Acer rubrum, Ailanthusaltissima, Ginkgo biloba, Gleditsia triacanthos, Styphnolobium japonicum, Sorbus domestica, Sorbus torminalis,T. tomentosa, A. monspessulanum, A. platanoides, Aesculus x carnea, B. pendula, C. betulus, P. omorika,T. cordata, Crataegus monogyna, Castanea sativa, Corylus colurna, F. excelsior and Quercus petraea.
2.6. Shannon Index (HS)
The Shannon index HS is a commonly used index to describe biodiversity [35] and was used forthe comparison of different planting scenarios. If HS = 0, only one species is prevailing, accountingfor 100% of the individuals. The highest diversity represents many different species with an evendistribution of individuals. The Shannon index was calculated using Equation (2):
HS =S
∑i=1
pi· ln(pi) with pi =ni
N(2)
where S = number of species, pi = relative frequency of the ith species, ni = number of individualsbelonging to one species, and N = number of individuals.
3. Results
3.1. Plant Characteristics and Current Allergenic Potential of the Park
The allergenic potential of the investigated 231 trees is predominantly moderate (53%; Figure 2a).Only a small number of trees (11%) was characterised as low allergenic and a comparable amount (9%)is even considered as a source of main local allergens (e.g., B. pendula or Corylus avellana). The mostcommon pollination strategy (48%) is the mixture of entomophily and anemophily (Figure 2b). Only 7%of the individuals were female plants producing no pollen (e.g., T. baccata or I. aquifolium). The majorityof trees (59%) have a principal pollination period of 4–6 weeks; merely 12% of the plant species flowerfor 9 weeks or even longer (Figure 2c).

Forests 2018, 9, 284 8 of 14
Forests 2018, 9, x FOR PEER REVIEW 8 of 14
where S = number of species, pi = relative frequency of the ith species, ni = number of individuals belonging to one species, and N = number of individuals.
3. Results
3.1. Plant Characteristics and Current Allergenic Potential of the Park
The allergenic potential of the investigated 231 trees is predominantly moderate (53%; Figure 2a). Only a small number of trees (11%) was characterised as low allergenic and a comparable amount (9%) is even considered as a source of main local allergens (e.g., B. pendula or Corylus avellana). The most common pollination strategy (48%) is the mixture of entomophily and anemophily (Figure 2b). Only 7% of the individuals were female plants producing no pollen (e.g., T. baccata or I. aquifolium). The majority of trees (59%) have a principal pollination period of 4–6 weeks; merely 12% of the plant species flower for 9 weeks or even longer (Figure 2c).
Figure 2. Percentage of plant individuals (N = 231) in the urban park Hofgarten classified according to their (a) allergenic potential (ap); (b) type of pollen emission (pe) and (c) duration of principal pollination period (ppp, see Table 2 for parameters and values).
The allergenic potential of the park calculated using literature values for crown height and surface was IUGZA = 0.173. Assuming no alterations of planted species, the park’s potential is limited to a low allergenic potential. Applying our own measurements to the data reduced the index to IISA = 0.018. Thus, the current allergenic potential is substantially overestimated using IUGZA.
3.2. Planting Scenarios and Associated Biodiversity
Although some species producing pollen known as main local allergens (e.g., pollen of B. pendula and F. excelsior) were considered in scenario 1, the planting of typical park trees [32,33] according to their current proportional occurrence was associated with the highest allergenic potential (IUGZA = 0.226, see Table 3). Replacing trees considered as sources of main local allergens (scenario 2) had the strongest positive impact on the park’s allergenic potential (IUGZA = 0.147), almost comparable to scenario 5 (IUGZA = 0.150) where the ten most predominant species with an unequal distribution were selected. An equal distribution, however, induced a comparable high value (IUGZA = 0.197, scenario 4). Applying scenario 3 (uniform distribution of all present species) or scenario 6 (climate-tolerant species [34]), yielded quite similar values for IUGZA compared to the current state (see Table 3).
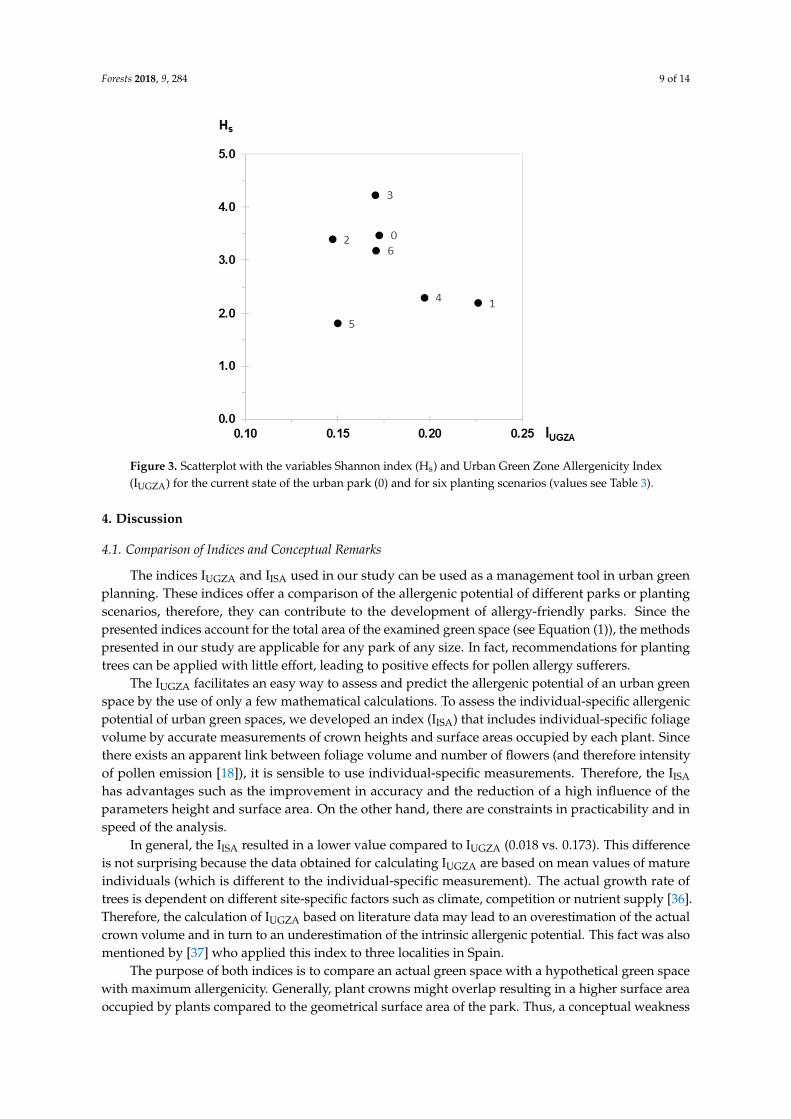
A greater biodiversity (according to Shannon index Hs) was not necessarily linked to a lower allergenic potential of the park (Table 3 and Figure 3). In fact, the highest biodiversity (Hs = 4.23) in scenario 3 (uniform distribution of all present species) only yielded an average allergenic potential (IUGZA = 0.170). The lowest biodiversity (Hs = 1.81) in scenario 5 (unequal distribution of ten most occurring species) was even associated with a relatively low allergenic potential (IUGZA = 0.150).
Figure 2. Percentage of plant individuals (N = 231) in the urban park Hofgarten classified accordingto their (a) allergenic potential (ap); (b) type of pollen emission (pe) and (c) duration of principalpollination period (ppp, see Table 2 for parameters and values).
The allergenic potential of the park calculated using literature values for crown height and surfacewas IUGZA = 0.173. Assuming no alterations of planted species, the park’s potential is limited to a lowallergenic potential. Applying our own measurements to the data reduced the index to IISA = 0.018.Thus, the current allergenic potential is substantially overestimated using IUGZA.
3.2. Planting Scenarios and Associated Biodiversity
Although some species producing pollen known as main local allergens (e.g., pollen of B. pendulaand F. excelsior) were considered in scenario 1, the planting of typical park trees [32,33] according to theircurrent proportional occurrence was associated with the highest allergenic potential (IUGZA = 0.226,see Table 3). Replacing trees considered as sources of main local allergens (scenario 2) had the strongestpositive impact on the park’s allergenic potential (IUGZA = 0.147), almost comparable to scenario 5(IUGZA = 0.150) where the ten most predominant species with an unequal distribution were selected.An equal distribution, however, induced a comparable high value (IUGZA = 0.197, scenario 4). Applyingscenario 3 (uniform distribution of all present species) or scenario 6 (climate-tolerant species [34]),yielded quite similar values for IUGZA compared to the current state (see Table 3).
A greater biodiversity (according to Shannon index Hs) was not necessarily linked to a lowerallergenic potential of the park (Table 3 and Figure 3). In fact, the highest biodiversity (Hs = 4.23) inscenario 3 (uniform distribution of all present species) only yielded an average allergenic potential(IUGZA = 0.170). The lowest biodiversity (Hs = 1.81) in scenario 5 (unequal distribution of ten mostoccurring species) was even associated with a relatively low allergenic potential (IUGZA = 0.150).
Table 3. Urban Green Zone Allergenicity Index (IUGZA) for the current state of the urban park (0) andfor current state and different planting scenarios and their corresponding Shannon index (Hs).
IUGZA Hs
Current state (0) 0.173 3.47Scenario 1 0.226 2.20Scenario 2 0.147 3.39Scenario 3 0.170 4.23Scenario 4 0.197 2.30Scenario 5 0.150 1.81Scenario 6 0.171 3.18
Forests 2018, 9, 284 9 of 14
Forests 2018, 9, x FOR PEER REVIEW 9 of 14
Table 3. Urban Green Zone Allergenicity Index (IUGZA) for the current state of the urban park (0) and for current state and different planting scenarios and their corresponding Shannon index (Hs).
IUGZA Hs Current state (0) 0.173 3.47
Scenario 1 0.226 2.20 Scenario 2 0.147 3.39 Scenario 3 0.170 4.23 Scenario 4 0.197 2.30 Scenario 5 0.150 1.81 Scenario 6 0.171 3.18
Figure 3. Scatterplot with the variables Shannon index (Hs) and Urban Green Zone Allergenicity Index (IUGZA) for the current state of the urban park (0) and for six planting scenarios (values see Table 3).
4. Discussion
4.1. Comparison of Indices and Conceptual Remarks
The indices IUGZA and IISA used in our study can be used as a management tool in urban green planning. These indices offer a comparison of the allergenic potential of different parks or planting scenarios, therefore, they can contribute to the development of allergy-friendly parks. Since the presented indices account for the total area of the examined green space (see Equation (1)), the methods presented in our study are applicable for any park of any size. In fact, recommendations for planting trees can be applied with little effort, leading to positive effects for pollen allergy sufferers.
The IUGZA facilitates an easy way to assess and predict the allergenic potential of an urban green space by the use of only a few mathematical calculations. To assess the individual-specific allergenic potential of urban green spaces, we developed an index (IISA) that includes individual-specific foliage volume by accurate measurements of crown heights and surface areas occupied by each plant. Since there exists an apparent link between foliage volume and number of flowers (and therefore intensity of pollen emission [18]), it is sensible to use individual-specific measurements. Therefore, the IISA has advantages such as the improvement in accuracy and the reduction of a high influence of the parameters height and surface area. On the other hand, there are constraints in practicability and in speed of the analysis.
Figure 3. Scatterplot with the variables Shannon index (Hs) and Urban Green Zone Allergenicity Index(IUGZA) for the current state of the urban park (0) and for six planting scenarios (values see Table 3).
4. Discussion
4.1. Comparison of Indices and Conceptual Remarks
The indices IUGZA and IISA used in our study can be used as a management tool in urban greenplanning. These indices offer a comparison of the allergenic potential of different parks or plantingscenarios, therefore, they can contribute to the development of allergy-friendly parks. Since thepresented indices account for the total area of the examined green space (see Equation (1)), the methodspresented in our study are applicable for any park of any size. In fact, recommendations for plantingtrees can be applied with little effort, leading to positive effects for pollen allergy sufferers.
The IUGZA facilitates an easy way to assess and predict the allergenic potential of an urban greenspace by the use of only a few mathematical calculations. To assess the individual-specific allergenicpotential of urban green spaces, we developed an index (IISA) that includes individual-specific foliagevolume by accurate measurements of crown heights and surface areas occupied by each plant. Sincethere exists an apparent link between foliage volume and number of flowers (and therefore intensityof pollen emission [18]), it is sensible to use individual-specific measurements. Therefore, the IISA
has advantages such as the improvement in accuracy and the reduction of a high influence of theparameters height and surface area. On the other hand, there are constraints in practicability and inspeed of the analysis.
In general, the IISA resulted in a lower value compared to IUGZA (0.018 vs. 0.173). This differenceis not surprising because the data obtained for calculating IUGZA are based on mean values of matureindividuals (which is different to the individual-specific measurement). The actual growth rate oftrees is dependent on different site-specific factors such as climate, competition or nutrient supply [36].Therefore, the calculation of IUGZA based on literature data may lead to an overestimation of the actualcrown volume and in turn to an underestimation of the intrinsic allergenic potential. This fact was alsomentioned by [37] who applied this index to three localities in Spain.
The purpose of both indices is to compare an actual green space with a hypothetical green spacewith maximum allergenicity. Generally, plant crowns might overlap resulting in a higher surface areaoccupied by plants compared to the geometrical surface area of the park. Thus, a conceptual weakness

Forests 2018, 9, 284 10 of 14
of both indices is the fact that values can also be higher than 1 (see Methods section). In reality,however, the indices are rather small for parks (see Results [17,37]), but not for dense forests [38].Even smaller values would be obtained when the constant of the formula for IUGZA is adjusted to 648(by applying the prevailing maximum values for the parameters used: ap = 4, pe = 3, ppp = 3 andH = 18). The value for IISA (0.018) was considerably smaller since the constant used in the equation(1188) included sources of main local allergens (ap = 4) and was adapted to the maximum measuredcrown height (H = 33 m, T. tomentosa). Some species, e.g., C. avellana, will never reach a comparableheight. Therefore, this index might yield in more meaningful values when the height of trees does notdiffer very much among planted trees or shrubs.
Another modification was the reduction of the number of considered individuals due to the factthat only mature species were included for the calculation of IISA. Considering all species (both matureand immature), the index was quite similar (0.019, data not shown). This is probably attributable tothe fact that immature individuals are smaller in size and therefore do not contribute much to themagnitude of the index.
Allergenic pollen is not only restricted to trees and shrubs. The high sensitisation rate in Germanadults of 37.9% linked to grass pollen [39] shows the importance of lawns. In our studied park, grass iscut on a regular basis and only some small areas covering less than 5% of the park’s area are not cut topromote spontaneous vegetation for insects. Thus, this study does not include the allergenic potentialof non-woody plants but only the allergenic potential based on trees and shrubs. The inclusion of lawnarea which accounts for 55.9% of the park area (1.3 ha) would result in an increase of IUGZA by 0.00254when a medium height of 0.2 m is assumed. Including grass for IISA is not sensible since this index isbased on accurate measurements of plant heights (which varies in the course of the vegetation seasonin the case of grass) and only includes mature individuals. Most grasses, however, do not flower inour park due to frequent cutting. Nevertheless, in other urban green areas, the inclusion of non-woodyplants may has to be considered as well.
The employment of pruning can be an effective management tool. In our park, accurately prunedindividuals of B. sempervirens expose a lower risk since flowers are kept to a minimum. Ideally,information on pruning practices should be included in assessing the allergenic potential of parks. Thestudies of [17,37] accounted for the effects of grass and flower species. Here, we excluded hedges andlawns since they are very frequently cut.
An important factor not considered in our study is the pollen emission of areas outside thestudy area [8]. In case of Hofgarten, an inflow especially from south-eastern (plantings and lawns),south-western (large green areas and riverside vegetation) and north-western directions (plant nursery)is possible, despite walls and buildings enclosing this park. Depending on species and wind conditions,pollen can be spread over large areas and great distances [40,41] substantially influencing the allergenicpotential of a given place. Pollen abundance is further affected by numerous surfaces for impactionand filtration [42] such as walls and buildings that surround Hofgarten. In addition, needles of conifersor leaves of deciduous trees may influence the impaction of pollen. Early flowering anemophilousplants such as hazel and birch may be able to disperse their pollen more efficiently since their ownleaves and most leaves of other plants are not unfolded yet. Except for some fountains, lakes or pondsare not present in Hofgarten, but they allow the deposition of pollen [38]. Since the length of thepollination period (ppp) may vary due to different weather conditions from one year to another [43],phenological observations and/or airborne pollen measurement might contribute to a more accurateindex in further studies. In the study of [37], pollen concentrations were monitored at the roof of highbuildings, but not in the investigated parks. An exact assessment of the influence of pollen transporthowever, is only possible with on-site airborne pollen measurements.
4.2. Planting Scenarios and Recommendations for Plantings in Urban Green Areas
The selection of 14 typical park trees in German cities [32,33] according to their currentproportional occurrence resulted in the highest allergenic potential (IUGZA = 0.226) among all six

Forests 2018, 9, 284 11 of 14
planting scenarios. This finding suggests that the planting of common park trees in general is not verysuitable for designing allergy-friendly green spaces. This may be attributed to some species whosepollen are known as main local allergens such as B. pendula or F. excelsior. Regarding the current stateof the park, a comparison between these typical park trees (93 individuals) and the remaining treesand shrubs which are not very common or even exotic (138 individuals) shows that their proportionalIUGZA is almost equal (0.087 vs. 0.086; data not shown). This finding also suggests that typical parktrees include species with negative effects for allergy sufferers. It was pointed out that a moderateplanting of exotic species leads to an increasing floral diversification, but the overuse of these exoticsshould be avoided [14]. Olea europaea is an example of a species producing highly allergenic pollen thatis mainly planted because of its exotic appearance [10]. Frequently planted individuals of O. europaealead to an increase of airborne Oleaceae pollen and therefore to an increase of the sensitisation rate ofGerman adults which is currently at 9.7% [39]. This species might pose a risk since a high degree offamily relationship with another more common species with allergenic pollen (Fraxinus spp.) exists [44].The role of exotic species is controversially debated: Whereas [45] attribute exotic species a preventivemeasure to reduce sensitisations, other authors noted that some species attracted negative attention.For southern Spain, [46] mentioned allergy symptoms in autumn related to the genus Casuarina that isnative to Australia and Asia but extensively used as an ornamental tree, especially in coastal cities [47].
The role of main local allergens for the allergenic potential of green spaces is evident: Regardingthe current state of the park, 21 major local allergenic trees and shrubs are contributing with a value of0.036 to the allergenic potential (data not shown). This means that only 9% of the trees and shrubsare responsible for 21.1% of the allergenic potential calculated with IUGZA. For example, major localallergenic pollen of birch, hazel and grasses are triggering clinically relevant symptoms in over 90%of the German adults and on over 75% of Europeans [39]. Thus, replacing main local allergenicplants (scenario 2) had a considerable impact on the park’s allergenic potential (IUGZA = 0.147). Thesubstitution was made by randomly selected individuals with a medium allergenic potential of ap = 2.Using solely non-allergenic plants would yield in even lower values of IUGZA.
To assess the suitability of the current selection of trees, we incorporated three different scenarios.Although a uniform distribution of all planted species (scenario 3) was linked to a similar IUGZA as theactual selection, an equal distribution of the ten most frequently occurring plants (scenario 4) resultedin a comparably high allergenic potential (IUGZA = 0.197). This indicates that the actual preferentialselection of trees is not very suitable with respect to their allergenic potential. An unequal distribution(scenario 5, IUGZA = 0.156) reduced the high influence on IUGZA of some species such as the main localallergenic trees Q. robur and F. excelsior as well as the high allergenic potential of T. tomentosa becauseof its great foliage volume. As a result, the mass use of certain plants results in large quantities ofmonospecific pollen, probably affecting the frequency of new sensitisations and the aggravation ofsymptoms in people allergic to this pollen [14].
The categorisation of climate-tolerant species by [34] does not include any parameters relatedto the risk for allergy sufferers. The species that are able to perform well under changed climaticconditions (scenario 6) yielded similar values for IUGZA compared to the current state. However, forthese and for all other species, it has to be considered that plant-related factors such as the length ofthe pollination period or the pollen’s allergenicity might change with ongoing climate change [48].In the future, these changes might result in different assessments and have to be timely regarded inurban planning.
The results of our planting scenarios suggest that a greater diversity of trees, assessed usingShannon index, is not linked to a lower allergenic potential of the park. However, several studies claimthat urban green planning should focus on biodiversity for ameliorating the allergenic potential ofparks [14,17]. Additional species are increasing species diversity but we suppose that the mass useof common pollen emitters leads to high pollen levels increasing the risk of new sensitisations andaggravating allergic reactions.

Forests 2018, 9, 284 12 of 14
Allergy sufferers should have access to green spaces where they are not put at additional healthrisk. In Germany, pollen allergens can be found nearly year-round in the air [26], which can stronglyaffect those concerned. The occurrence of highly allergenic and anemophilous plants should be limitedor avoided, because of their high pollen emission [8]. Furthermore, plants with a long pollinationperiod and the increased planting of only male individuals of dioecious species pose a risk for allergysufferers. It was suggested that the concept of a female park is suitable for allergy sufferers, becausefemale individuals of dioecious species do not release any pollen [10]. However, the sterility of suchgreen spaces results in a minimised capability of pollination [8]. In addition, female trees are often notfavoured for planting due to higher amounts of litter or undesirable odour as observed in G. biloba [14].
5. Conclusions
In order to keep and design cities as liveable as possible, it is important to regard urban greenspaces as providers for not only positive ecosystem services but possibly also for ecosystem disservicesrelated to allergies. Until now, not many specific recommendations for the implementation ofallergy-friendly city greening exist and are therefore needed. Indices are a useful management tool foranalysing and assessing allergenic potential in public green spaces. With purposive consideration ofsingle individuals, they allow to make an actual site-specific assessment. Based on literature valuesand a few mathematical equations the IUGZA is easy to calculate. The individual-specific allergenicpotential of urban green spaces assessed by IISA requires more information obtained by accuratemeasurements of crown heights and surface areas occupied by each plant. Thus, the calculation ofthis index is more time consuming but the result is more precise. Planting scenarios and assessingbiodiversityare useful for the formulation of recommendations for urban planning. In further studies,influences such as pollen flow from neighbouring or distant green areas should be taken into account.
Author Contributions: S.J.-O. and T.S. conceived and designed the study; T.S. was involved in field measurements;J.J. prepared maps of the study area; S.J.-O. analysed the data; P.C. contributed with methods and plant information;S.J.-O. wrote the paper with the help of all co-authors.
Acknowledgments: We gratefully acknowledge the support of the Spanish Ministry of Economy andCompetitiveness (FENOMED CGL2014-54731-R).
Conflicts of Interest: The authors declare no conflict of interest.
References
1. Bergmann, K.-C.; Heinrich, J.; Niemann, H. Current status of allergy prevalence in Germany: Position paperof the Environmental Medicine Commission of the Robert Koch Institute. Allergo J. Int. 2016, 25, 6–10.[CrossRef] [PubMed]
2. Ring, J.; Bachert, C.; Bauer, C.-P.; Czech, W. Weißbuch Allergie in Deutschland, 3rd ed.; Springer Medizin:München, Germany, 2010, ISBN 978-3-89935-245-0. (In German)
3. Langen, U.; Schmitz, R.; Steppuhn, H. Häufigkeit allergischer Erkrankungen in Deutschland: Ergebnisseder Studie zur Gesundheit Erwachsener in Deutschland (DEGS1). Bundesgesundh. Gesundheitsforsch.Gesundheitssch. 2013, 56, 698–706. (In German) [CrossRef] [PubMed]
4. Bundesministerium für Umwelt, Naturschutz, Bau und Reaktorsicherheit. Grün in der Stadt—Für eineLebenswerte Zukunft. Grünbuch Stadtgrün; BMUB: Berlin, Germany, 2015. (In German)
5. Millennium Ecosystem Assessment. Ecosystems and Human Well-Being: Synthesis; Island Press: Washington,DC, USA, 2005, ISBN 1-59726-040-1.
6. Lyytimäki, J.; Sipilä, M. Hopping on one leg—The challenge of ecosystem disservices for urban greenmanagement. Urban For. Urban Green. 2009, 8, 309–315. [CrossRef]
7. Baumschulen Gebr. van den Berk. Van den Berk über Bäume, 2nd ed.; Baumschule Van den Berk:Sint-Oedenrode, Germany, 2004, ISBN 90-807408-6-1. (In German)
8. Seyfang, V. Studie zum Wissenschaftlichen Erkenntnisstand über das Allergiepotential von Pollenflug der Gehölze imÖffentlichen Grün der Städte und Gemeinden und Mögliche Minderungsstrategien; Hochschule Ostwestfalen-Lippe:Lemgo, Germany, 2008. (In German)

Forests 2018, 9, 284 13 of 14
9. Huntington, L. Das Gartenbuch für Allergiker. Die Schönsten Pflanzen, die Besten Arbeitsweisen; VGS: Köln,Germany, 1999, ISBN 3802513851. (In German)
10. Ogren, T.L. Allergy-Free Gardening. The Revolutionary Guide to Healthy Landscaping; Ten Speed Press: Berkeley,CA, USA, 2000, ISBN 1580081665.
11. Bergmann, K.-C.; Zuberbier, T.; Ausgustin, J.; Mücke, H.-G.; Straff, W. Klimawandel und Pollenallergie.Städte und Kommunen sollten bei der Bepflanzung des öffentlichen Raums Rücksicht auf Pollenallergikernehmen. Allergo J. 2012, 21, 103–108. (In German) [CrossRef]
12. Sandifer, P.A.; Sutton-Grier, A.E.; Ward, B.P. Exploring connections among nature, biodiversity, ecosystemservices, and human health and well-being: Opportunities to enhance health and biodiversity conservation.Ecosyst. Serv. 2015, 12, 1–15. [CrossRef]
13. Hanski, I.; von Hertzen, L.; Fyhrquist, N.; Koskinen, K.; Torppa, K.; Laatikainen, T.; Karisola, P.; Auvinen, P.;Paulin, L.; Mäkelä, M.J.; et al. Environmental biodiversity, human microbiota, and allergy are interrelated.Proc. Natl. Acad. Sci. USA 2012, 109, 8334–8339. [CrossRef] [PubMed]
14. Cariñanos, P.; Casares-Porcel, M. Urban green zones and related pollen allergy: A review. Some guidelinesfor designing spaces with low allergy impact. Landsc. Urban Plan. 2011, 101, 205–214. [CrossRef]
15. Hruska, K. Assessment of urban allergophytes using an allergen index. Aerobiologia 2003, 19, 107–111.[CrossRef]
16. Ciferri, E.; Torrisi, M.; Staffolani, L.; Hruska, K. Ecological study of the urban allergenic flora of central Italy.J. Mediter. Ecol. 2006, 7, 15–21.
17. Cariñanos, P.; Casares-Porcel, M.; Quesada-Rubio, J.-M. Estimating the allergenic potential of urban greenspaces: A case-study in Granada, Spain. Landsc. Urban Plan. 2014, 123, 134–144. [CrossRef]
18. Friedman, J. The Ecology and Evolution of Wind Pollination. Ph.D. Thesis, University of Toronto, Toronto,ON, Canada, 2009.
19. Givnish, T.J. Ecological constraints on the evolution of breeding systems in seed plants: Dioecy and dispersalin Gymnosperms. Evolution 1980, 34, 959. [CrossRef] [PubMed]
20. Besl, M. Der Hofgarten vor der Sommerresidenz Eichstätt. Genese und Vergleiche. Master’s Thesis, CatholicUniversity of Eichstätt-Ingolstadt, Eichstätt, Germany, 2011. (In German)
21. Byng, J.W.; Chase, M.W.; Christenhusz, M.J.; Fay, M.F.; Judd, W.S.; Mabberley, D.J.; Sennikov, A.N.; Soltis, D.E.;Soltis, P.S.; Stevens, P.F.; et al. An update of the Angiosperm Phylogeny Group classification for the ordersand families of flowering plants: APG IV. Bot. J. Linn. Soc. 2016, 181, 1–20. [CrossRef]
22. Pütz, N. Studienhilfe Botanik; Vechtaer fachdidaktische Forschungen und Berichte No. 17; Institut für Didaktikder Naturwissenschaften, der Mathematik und des Sachunterrichts: Vechta, Germany, 2008. (In German)
23. Umweltforschungszentrum Leipzig Halle. BiolFlor: Datenbank Biologisch-Ökologischer Merkmale derFlora von Deutschland. Available online: http://www2.ufz.de/biolflor/index.jsp (accessed on 20 February2017). (In German)
24. Gurk, C.; Hepp, C. Baumkunde.de: Online-Datenbank für Bäume und Sträucher. Available online: http://www.baumkunde.de/ (accessed on 20 February 2017). (In German)
25. Jäger, E.J.; Müller, G.K.; Ritz, C.; Welk, E.; Wesche, K. Rothmaler—Exkursionsflora von Deutschland.Gefäßpflanzen: Atlasband, 11th ed.; Springer Spektrum: München, Germany, 2007. (In German)
26. Stiftung Deutscher Polleninformationsdienst. Pollenflugkalender für Deutschland: PollenflugGesamtdeutscher Raum 2007–2011. Available online: http://www.pollenstiftung.de/pollenvorhersage/pollenflug-kalender/ (accessed on 7 March 2017). (In German)
27. Mitchell, A. Die Wald- und Parkbäume Europas. Ein Bestimmungsbuch für Dendrologen und Naturfreunde, 2nd ed.;Parey: Hamburg, Germany, 1979, ISBN 3490059182. (In German)
28. Bartels, H. Gehölzkunde; Ulmer: Stuttgart, Germany, 1993. (In German)29. Schütt, P.; Weisgerber, H.; Schuck, H.J.; Lang, U.M.; Stimm, B.; Roloff, A. Enzyklopädie der Laubbäume. Die
Große Enzyklopädie mit über 800 Farbfotos unter Mitwirkung von 30 Experten; Nikol: Hamburg, Germany, 2006,ISBN 3937872396. (In German)
30. Schütt, P.; Schuck, H.J.; Stimm, B. Lexikon der Bauch- und Strauchbaumarten. Das Standardwerk der Forstbotanik,3rd ed.; Nikol: Hamburg, Germany, 2014. (In German)
31. Stinglwagner, G.K.F.; Haseder, I.E.; Erlbeck, R. Das Kosmos Wald- und Forstlexikon, 2nd ed.; Kosmos: Stuttgart,Germany, 2005, ISBN 3440103757. (In German)
Forests 2018, 9, 284 14 of 14
32. Kunick, W. Biotopkartierung—Landschaftsökologische Grundlagen; Teil 3; Stadt Köln: Köln, Germany, 1983.(In German)
33. Wittig, R. Siedlungsvegetation. 40 Tabellen; Ulmer: Stuttgart (Hohenheim), Germany, 2002, ISBN 9783800136933.(In German)
34. Roloff, A.; Bonn, S.; Gillner, S. Konsequenzen des Klimawandels—Vorstellung der Klima-Arten-Matrix(KLAM) zur Auswahl geeigneter Baumarten. Stadt+Grün 2009, 57, 53–60.
35. Munk, K. Ökologie—Evolution; Thieme: Stuttgart, Germany, 2009, ISBN 3131448814. (In German)36. Speer, J.H. Fundamentals of Tree-Ring Research; University of Arizona Press: Tuscon, AZ, USA, 2010.37. Maya Manzano, J.M.; Tormo Molina, R.; Fernández Rodríguez, S.; Silva Palacios, I.; Gonzalo Garijo, Á.
Distribution of ornamental urban trees and their influence on airborne pollen in the SW of Iberian Peninsula.Landsc. Urban Plan. 2017, 157, 434–446. [CrossRef]
38. Cariñanos, P.; Adinolfi, C.; de Guardia, C.L.D.; de Linares, C.; Casares-Porcel, M. Characterization of allergenemission sources in urban areas. J. Environ. Qual. 2016, 45, 244–252. [CrossRef] [PubMed]
39. Burbach, G.J.; Heinzerling, L.M.; Edenharter, G.; Bachert, C.; Bindslev-Jensen, C.; Bonini, S.; Bousquet, J.;Bousquet-Rouanet, L.; Bousquet, P.J.; Bresciani, M.; et al. GA(2)LEN skin test study II: Clinical relevance ofinhalant allergen sensitizations in Europe. Allergy 2009, 64, 1507–1515. [CrossRef] [PubMed]
40. Stanley, R.G.; Linskens, H.F. Pollen. Biologie, Biochemie, Gewinnung und Verwendung, Lizenzausg; Freund:Greifenberg, Germany, 1985, ISBN 9783924733001.
41. Makra, L.; Matyasovszky, I.; Tusnády, G.; Wang, Y.; Csépe, Z.; Bozóki, Z.; Nyúl, L.G.; Erostyák, J.; Bodnár, K.;Sümeghy, Z.; et al. Biogeographical estimates of allergenic pollen transport over regional scales: Commonragweed and Szeged, Hungary as a test case. Agric. For. Meteorol. 2016, 221, 94–110. [CrossRef]
42. Emberlin, J.; Norris-Hill, J. Spatial variation of pollen deposition in North London. Grana 1991, 30, 190–195.[CrossRef]
43. Jochner, S.C.; Beck, I.; Behrendt, H.; Traidl-Hoffmann, C.; Menzel, A. Effects of extreme spring temperatureson urban phenology and pollen production: A case study in Munich and Ingolstadt. Clim. Res. 2011, 49,101–112. [CrossRef]
44. Vara, A.; Fernández-González, M.; Aira, M.J.; Rodríguez-Rajo, F.J. Fraxinus pollen and allergenconcentrations in Ourense (South-western Europe). Environ. Res. 2016, 147, 241–248. [CrossRef] [PubMed]
45. Chiesura, A. The role of urban parks for the sustainable city. Landsc. Urban Plan. 2004, 68, 129–138. [CrossRef]46. García, M.; Moneo, I.; Audicana, M.T.; del Pozo, M.D.; Muñoz, D.; Fernández, E.; Díez, J.; Etxenagusia, M.A.;
Ansotegui, I.J.; Fernández de Corres, L. The use of IgE immunoblotting as a diagnostic tool in Anisakissimplex allergy. J. Allergy Clin. Immunol. 1997, 99, 497–501. [CrossRef]
47. Trigo, I.F.; Davies, T.D.; Bigg, G.R. Objective climatology of cyclones in the Mediterranean region. J. Clim.1999, 12, 1685–1696. [CrossRef]
48. Beggs, P.J. Impacts of climate change on aeroallergens: Past and future. Clin. Exp. Allergy 2004, 34, 1507–1513.[CrossRef] [PubMed]
© 2018 by the authors. Licensee MDPI, Basel, Switzerland. This article is an open accessarticle distributed under the terms and conditions of the Creative Commons Attribution(CC BY) license (http://creativecommons.org/licenses/by/4.0/).