the influence of gear up on academic achievement and
TRANSCRIPT

University of ConnecticutOpenCommons@UConn
NERA Conference Proceedings 2013 Northeastern Educational Research Association(NERA) Annual Conference
10-25-2013
The Influence of GEAR UP on AcademicAchievement and College Enrollment for Low SESLearnersDr. Demetrick [email protected]
Follow this and additional works at: https://opencommons.uconn.edu/nera_2013
Part of the Education Commons
Recommended CitationWilliams, Dr. Demetrick, "The Influence of GEAR UP on Academic Achievement and College Enrollment for Low SES Learners"(2013). NERA Conference Proceedings 2013. 5.https://opencommons.uconn.edu/nera_2013/5

THE INFLUENCE OF GEAR UP ON ACADEMIC ACHIEVEIMENT 1
The Influence of GEAR UP on Academic Achievement and College Enrollment for low SES
Leaners
Demetrick A. Williams
Argosy University
Author Note
One author, no affiliation Demetrick A. Williams Pompton Plains, New Jersey
This article is a summary of the dissertation GEAR UP PROGRAM PARTICIPATION
AND THE INFLUENCE ON ACADEMIC ACHIEVEMENT AND COLLEGE
ENROLLMENT FOR LOW SES LEARNERS: A CORRELATION STUDY which was
completed by the author at Argosy University.
Correspondence concerning this article should be addressed to Demetrick A. Williams,
16 Adams St Pompton Plains, NJ 07444. E-mail: [email protected]

THE INFLUENCE OF GEAR UP ON ACADEMIC ACHIEVEIMENT 2
Introduction
Students who come from a lower socioeconomic status (SES) have many outside forces
that cause them to not be prepared for higher education (Burleson, 2008; Ward, 2006). Studies
have shown that outside factors include poor time management skills, personal relationships,
financial issues, involvement in campus life, cultural identification, peer influences, parental
involvement, lack of rigor in the curriculum, and limited school resources (Burleson, 2008;
Ward, 2006). With all of these outside factors, low SES students still attempt to participate in
their school activities (Buller, 2010). Although many low SES students remain active with extra
tutoring and other programs within the school system, most are often not ready for higher
education (Buller, 2010). Buller (2010) stated, “even students who are active participants in
school activities and identify as ’school kids’ cannot be successful without the knowledge and
tools deemed important by the school” (p. 4). Further research has indicated that low SES
students may lack the cultural knowledge required to function and succeed on a college campus
(Ehlers & Wibrowski, 2007; Quaterman, 2008). When these students are at home, the culture
may be completely different than their external life is, which may influence student progress
within their school studies. This difference in culture can also cause a student to completely shut
down at school (Buller, 2010). The constant struggle between home and school culture,
combined with a low SES status, compounds student academic failure (Buller, 2010).
Problem Statement
For years, educational researchers in the United States (U.S.) have attempted to
understand the causes of low academic achievement which leads to the decline in higher
education for students from low SES (Ward, 2006). The lack of academic achievement and
college preparedness of students from low SES has had a negative effect on their access to higher

THE INFLUENCE OF GEAR UP ON ACADEMIC ACHIEVEIMENT 3
education (Moran, 2008). The research has indicated that early intervention programs can have a
positive effect on academic achievement and college preparedness for low SES students (Beer,
2009; Dalpe, 2008; Wilkins, 2007). Early interventions programs must close the gap for low SES
students by preparing them for college enrollment and improving their academic achievement
(Burleson, 2008; Fram, 2007; Ramburuth, 2010).
Academic preparedness refers to the lack of the necessary skills of low SES students to
have the ability to function in the 21st century as a productive member of society (Moran, 2008).
Research indicates that programs, such as GEAR UP, offer support for low SES students to be
better prepared to attend college (Beer, 2009; Dalpe, 2008; Fram, 2007; Johnson, 2010; USDOE,
2010; Wilkins, 2007). Awareness for low SES students also included the “level of social and
procedural preparedness youths possess when they arrive on college campuses” (Burleson, 2008,
p. 16). The research has also shown that early intervention programs can have a strong impact on
low SES student’s academic achievement with the introduction of rigor in certain subjects
(Ramburuth, 2010; NCCEP, 2009). GEAR UP program provides early intervention for low SES
students in courses that would prepare them for college level work (Ramburuth, 2010; NCCEP,
2009; USDOE, 2010).
The quantitative study focused on the influence of GEAR UP participation in a CIP that
was developed to teach and prepare low SES students how to plan and prepare for college (Beer,
2009; Cabrere, 2006; Johnson, 2010; Wilkins, 2007). The GEAR UP program uses many of the
suggested precollege interventions from the research with a key focus in “accelerating the
academic achievement of cohorts of students through their high school graduation” (Cabrere,
2006, p.78). The quantitative correlation study examined the influence of attendance in GEAR

THE INFLUENCE OF GEAR UP ON ACADEMIC ACHIEVEIMENT 4
UP on students from low SES to improve their academic achievement and enrollment in higher
education.
Purpose of Study
The purpose of the quantitative correlation study is to examine the association between
participation in the GEAR UP program with academic achievement and college enrollment for
low SES students. A low SES student is defined as “a student whose family’s taxable income
does not exceeds 150% of the poverty level in the calendar year preceding the year in which the
individual initially participates in the project (USDOE, 2010). The poverty level amount is
determined by using criteria established by the bureau of the census of the U. S. Department of
Commerce (USDOE, 2010). Participation for students will be measured based on their
attendance of the GEAR UP program throughout the year. Students should attend campus visits
and after school programs that are offered throughout the school year. For schools to take
advantage of the GEAR UP program they must have 50% of the population be low SES
(USDOE, 2010; GEAR UP California, 2011).
Academic achievement will be measured by student test scores on the state of New
Jersey’s annual yearly progress exams as they go through the GEAR UP program. At the middle
school level and below, students take the developmental reading assessment (DRA2), Terra
Nova, and the New Jersey assessment of skills and knowledge (NJASK). At the high school
level, students take the high school proficiency assessment (HSPA). The quantitative correlation
study will use archived data on the high school level, to explore the impact that GEAR UP has
on low SES students that participate in the program.
Research Question

THE INFLUENCE OF GEAR UP ON ACADEMIC ACHIEVEIMENT 5
� RQ1: What is the relationship between participation in the GEAR UP program and low
SES students in college enrollment?
� RQ2: What is the relationship between participation in the GEAR UP program on
academic achievement for low SES students?
Hypotheses
� HO1: There is no significant relationship between participation in GEAR UP and
college entrance for low SES students.
� HA1: There is a significant relationship between participation in GEAR UP and
college entrance for low SES students.
� HO2: There is no significant relationship between participation in GEAR UP and
academic achievement for low SES students.
� HA2: There is a significant relationship between participation in GEAR UP and
academic achievement for low SES students
Limitations of the Study
The scope of the study will be limited to the state of New Jersey. The scope of the study
will limit the target population for the study. The study will also be limited to evaluations of the
whole program and not the individual participants. Because the chosen method of study is
quantitative, the study will lack detailed accounts from the participants within the study. The
study will include only archived data, which will eliminate the possibility of interacting with the
actual participants in the programs. There is no way of determining if other variables, other than
participation in GEAR UP had an impact on student achievement.
Delimitations

THE INFLUENCE OF GEAR UP ON ACADEMIC ACHIEVEIMENT 6
The study will include a limited number of institutions across New Jersey; this will limit
the pool of participants for the study. The study will only be looking at students that meet all of
the federal requirements for a low SES student. Data from evaluations of programs from across
the state will be used limiting the control. Because only institutions that take part in the GEAR
UP program will be included in this study, this could cause bias. The level of participation of
each participant will be unknown and the level of participation in the program will also be
unknown.
Need for the Study
Lower income students normally attend K-12 school systems that do not give them the
ability to succeed in higher education. These students are too often academically unprepared to
get accepted let alone succeed once they get into an institution. Guiffrida (2005) stated, “Data
suggest(s) that black students face challenges beyond academic preparation and ability that
impact their chances to succeed at college” (Guiffrida, 2005, p. 710). Students from low SES
circumstances continue to be less prepared for higher education in spite of the efforts of the
federal government and institutions. Low SES students are enrolling at a very low rate compared
to students from better SES backgrounds depending on family finances, academic achievement,
and what they know about higher education. The GEAR UP program provides services to this
population of students with the hopes of improving academic achievement and college
enrollment. This quantitative correlation study will try to determine if the GEAR UP program is
effective in the state of New Jersey.
Education Significance
The results of the correlation study may lead to a better understanding of how attendance
in the GEAR UP program is related to academic achievement and college enrollment for low

THE INFLUENCE OF GEAR UP ON ACADEMIC ACHIEVEIMENT 7
SES students. The study may offer information for early intervention programs for low SES
students to improve their chances of preparedness for higher education. The findings of this
research will contribute to low SES school districts developing new programs to help low SES
students excel in higher education, by examine the effectiveness of the GEAR up program in the
state of New Jersey. The correlation study will focus only on the state of New Jersey’s GEAR
UP program. By gaining a better understanding of how attendance in the program can affect the
perception of higher education for low SES students would show if the program is effective.
Literature Review
For decades the Federal government has made interventions for low SES students to
increase college access through Title IV of the Higher Education Act of 1965, which gives these
students aid to attend institutions of higher education through loans and grants (Perna, 2002).
Private organizations, state governments, and universities have provided financial aid to low SES
students to increase college enrollment for these students (The College Board, 2000; Perna,
2002). Even though college attendance has increased overall from the financial support of these
institutions and the federal government, enrollment rates for low SES students are still down
compared to upper and middle class students ( Mortenson, 2001; Perna, 2002). Perna (2002)
explained that one of the causes for the continuing differences in college enrollment by low SES
families could be that “traditional interventions have focused too narrowly on the financial
barriers to college enrollment without sufficient attention to the steps required to be
academically, socially, and psychologically prepared to enter and succeed in college” (Gladieux
& Swail, 1999; Perna, 2002, p, 64). These traditional methods have caused policy makers to
recognize the limits of the traditional methods; they have also caused greater focus to be placed
on precollege programs as a solution (Perna, 2002).

THE INFLUENCE OF GEAR UP ON ACADEMIC ACHIEVEIMENT 8
The following literature review will review the aspects that affect academic achievement
and college enrollment for low SES students. The literature review will examine the key role that
parents, guidance counselors, culture, information, and SES play in college enrollment and
academic achievement for low SES students. The literature review will also begin to examine the
GEAR UP program to see how it affects the college choice process for students that participate
in the program. The topics that are reviewed in the literature review are important factors for the
study because they help to explain the importance of increasing college enrollment and academic
achievement for low SES students. These factors also help to show why early intervention
programs are needed to address the issues related to low SES students. The literature review will
start with social class and the roll of the parent and the affect that a parent’s involvement can
have on a student. Following with the importance of information, guidance, and concluding with
a review of the GEAR UP program and how it addresses the needs of the low SES student.
Plans for Higher Education
The federal government has been involved with precollege programs since the 1960’s
through the TRIO programs. In 1998 the federal government substantially extended its
involvement by starting the GEAR UP program (Perna, 2002; NCES, 2009). Both of these
precollege programs are sponsored by private institution, universities, and the federal
government to improve academics and general college readiness (Fenske, Geranios, Keller &
Moore,1997; NCES, 2009). These programs were developed to address the needs of four groups
of students that are underrepresented in higher education: “low-income students, historically
underrepresented minorities, potential first generation college students, and students with low
academic achievement” (Perna, 2002, p, 65; NCES, 2009). Studies have shown that low SES
students are less likely to enroll in institutions of higher education because of their family
THE INFLUENCE OF GEAR UP ON ACADEMIC ACHIEVEIMENT 9
backgrounds (Cabrera & La Nasa, 2001; Hossler, Braxton, & Coopersmith, 1989; Kane, 1994;
Kane & Spizman, 1994; Manski & Wise, 1983; Rouse, 1994). These low SES students are also
less likely to have plans for higher education compared to upper and middle class students
(Hossler, Schmit, & Vesper, 1999; Perna, 2000c). Studies have also shown that the process for
enrollment is different across racial and ethnic groups (Jackson, 1990; Perna, 2000a; St. John,
1991). Perna (2002) explains that there are three conceptual approaches that have been used to
explore the differences in college enrollment behavior. One, the Econometric model shows that
individuals make their college decisions on personal tastes and preferences (Hossler et al., 1989;
Manski & Wise, 1983; Perna, 2000a). Two, the Sociological status attainment model focuses on
the influence by family, peers, and the school environment for college choice (Hossler et al.,
1999). Perna (2002) explained that the third is a combination of the econometric and the
sociological models to make college choices.
Studies have shown that social capital plays a large role in understanding the differences
in personal preferences, taste, and information processing with school choice (Hossler et al.,
1999; Perna, 2000a). Perna (2002) stated that “the concept of social capital refers to social
networks and the ways in which social networks and connections are sustained” (Morrow, 1999).
Social capital can come in two forms; either information sharing channels and networks, or as
social norms, values, and behaviors (Colman, 1988). Social capital can be developed either by
interactions with family members or other members within the social class (Coleman, 1988;
Hossler et al., 1999).
Social Class
A large cut in federal funding for higher education has shifted even more burden on the
public to pay for college (Breneman & Finney, 1997; Mumper, 1996; Paulsen, 1991, 2000;
THE INFLUENCE OF GEAR UP ON ACADEMIC ACHIEVEIMENT 10
Paulsen & St. John, 2002). Members of the general public are forced to find new loans to pay for
the rising cost of higher education rather than receive more grants to cover the cost (Paulsen &
St. John, 2002). Paulsen & St. John (2002) explained the importance of social class and the large
role that finances play with the student’s choice sequence to attend or not to attend an institution.
The choice sequence has a few important parts that aid a student in making choices such as the
formation of aspirations, opportunity, college choice, majors offered, persistence to graduate, and
graduate education (Paulsen & St. John, 2002). But all of the student’s choices are influenced by
the knowledge of the family when dealing with higher education (Paulsen & St. John, 2002).
Paulsen & St. John (2002) explained that if the family does not have the “background,
environmental and educational experiences, and policy-related factors, including postsecondary
information, student aid, tuition cost, and debt forgiveness” it could have a negative effect on
college attendance for some students (Paulsen & St. John, 2002, p. 192).
Parental Contribution
Auerbach (2004) explained that due to the lack of national support and the inadequate
numbers of quality guidance counselors, the burden of planning for college has fallen on the
shoulders of low SES students and their families. Studies have shown that the role of the parent
in encouraging the student to attend institutions of higher education is pivotal (Gandara, 1995,
2002; Gandara & Bial, 1999; Hossler, Schmit, & Vesper, 1999; Jun & Colyar, 2001;
Mcdonough, 1997; McDonough, 2000; Perez, 1999, Plank & Jordan, 2001). Parents that are
college educated and from higher SES play a proactive role for their children during the selection
process (Baker & Stevenson, 1986; McDonough, 1997; Useem, 1991; Yonezawa, 1997). Parents
of lower SES that lack a college education support their children in attending college, but offer
little knowledge of the process (Clark, 1983; Gandara, 1995; Mahan, Villanueva, Hubbard, &
THE INFLUENCE OF GEAR UP ON ACADEMIC ACHIEVEIMENT 11
Lintz, 1996). Auerbach (2004) stated that “few families without a tradition of college going have
sufficient knowledge to help their children navigate pathways to college” (Auerbach, 2004, p,
126). Gandara (1998) explained that the lack of knowledge of the process to attend college forms
a barrier for college access for students. Studies have shown that parents are in the top three
sources to provide information and help to students during the selection process, even though
they lack correct information on vital information about colleges (Antonio, 2002; Post, 1990).
For these parents precollege access programs are the main source for information yet most low
SES families do not have access to these programs (McDonough, 2000). Delgado-Gaitan (1994)
stated “knowledge is power and parents who are knowledgeable about the school’s expectations
and the way in which the school operates are better advocates for their children than parents who
lack such skills” (Delgado-Gaitan, 1994, p, 96).
Information and Guidance
Some families have access to information, resources, and opportunities that aid them in
overcoming voids and obstacles that other families do not when it comes to the college process
(Plank & Jordan, 2001). Consequences of a particular set of choices and actions help to guide
families that have access during the college process (Plank & Jordan, 2001). Social stratification
has developed a strong link with higher education in the United States (Hurn, 1993). The choice
to attend postsecondary institutions or not has a key impact on life chances, occupational status,
and wealth (Plank & Jordan, 2001). Plank & Jordan (2001) explained that amount of access that
a student has to information and guidance during the high school years has a direct impact on if
they will attend college or go in a different direction. Studies have shown that the United States
progressively globalized and highly technical economy frankly requires the skill sets that
postsecondary education offers its students (Bell, 1973; Berryman & Bailey, 1992).

THE INFLUENCE OF GEAR UP ON ACADEMIC ACHIEVEIMENT 12
Postsecondary education can have a direct positive effect on an individual’s chances to reach
high social status, wealth, job stability, and many other desired outcomes (Bidwell, 1989; Sewell,
Hauser, & Featherman, 1976; Tinto, 1987). Although a postsecondary education can have such
an impact on a student’s life, many academically qualified students do not attend postsecondary
educational institutions (PEIs) (Hanson, 1994; Karen, 1991). Plank & Jordan (2001) contribute
the lack of attendance for these low SES students that are academically qualified to the lack of
access to information, guidance, and actions during the high school period.
Financial Constraints
Nellum (2008) explained that financial constraints are one of the main obstacles linked to
degree achievement and persistence for low SES students. Terenzini (2001) explained that
persistence is frequently interconnected to an array of variables; clarifying the role of financial
aid can be a difficult task. Swail (2003) found that students’ choices to enroll in certain
institutions were driven by labor market returns for acquiring a bachelor’s degree. These students
made the choice to attend college because evidence showed that college graduates have higher
annual and life time earning capabilities (Nellum, 2008). Nellum (2008) explained that low SES
students need to see the benefits in completing a college degree and acquiring the costs
associated with enrollment. Studies have shown that low SES students are influenced by the
availability of financial aid to counterbalance the cost of higher education (St. John, 1991; Swail
et al., 2003).
The Participant
Studies have shown that low SES students deal with three main inequalities in higher
education: these students attend college less than others, college completion is very low, and they
attend 4 year selective colleges rarely compared to students from higher SES backgrounds

THE INFLUENCE OF GEAR UP ON ACADEMIC ACHIEVEIMENT 13
(Engle, Bermeo, & O’Brien, 2006; Gladiuex & Swail, 1998; Kahlenburg, 2004; Terenzini et al.,
2001; Titus, 2006; USDOE, 2000; Walpole, 2003). Berzin (2010) explained that low SES
students have other factors that affect college attainment such as gender, race, family
background, institutional context, parent academic involvement, and school experiences. Studies
have shown that inferior rates of college attendance and completion are frequently related to
other factors such as the student being a 1st generation, and having inadequate academic
preparation (Engle et al, 2006; Heller, 2004).
Environment of the Participants
Educators are becoming progressively conscious of the potential associations that occur
between educational achievement, social-emotional competence, and social support (Elliott,
Malecki, & Demaray., 2001; Welsh, Parke, Widaman, & O’Neal, 2001; Zins, Weissberg, Wang,
& Walberg, 2004). Elias and Hayes (2008) stated that “research has shown that early social
interactions and the quality of these interactions provide the basis for future developmental
milestones” (Elias & Hayes, 2008, p, 474; Vygotsky, Reiber, & Carton, 1987). Studies have
shown the role that emotion recognition, regulation, and related social-emotional skills can have
on effective social interaction (Saarni, 2007). Intervention programs can target these skills to
promote positive interactions and program designed models for academic achievement (Elias &
Arnold, 2006).
The Impact of Culture
Stakeholders within the school community find achievement and motivation to play a key
role in academic success (Pintrich & Schunk, 1996). Studies have shown that cultural
differences have a strong effect on achievement and motivation (Henderlong & Lepper, 2002;
Kaplan, Karabenick, & DeGroot, 2009; Maehr & Yamaguchi, 2001; Otsuka & Smith, 2005;

THE INFLUENCE OF GEAR UP ON ACADEMIC ACHIEVEIMENT 14
Urdan & Maeher, 1995). These cultural differences between school and home have caused
parents and teachers to deal with these issues from completely different points of view
(Rothstein-Fisch & Trumbull, 2008). If school districts want their students to be successful the
district must develop a full understanding of how achievement and motivation differs culturally
within the district’s population (Rothstein-Fisch & Trumbull, 2011).
Members of the school staff must develop an understanding of how parents socialize with
their students about academic achievement (Rothstein-Fisch & Trumbull, 2011). During the
contact with the parent these members of the staff can help those parents to develop an
understanding of the school culture and what the school expects from their children (Rothstein-
Fisch & Trumbull, 2011). Studies have shown that this type of communication is key in
development of a relationship between the school and parents (Shor & Bernard, 2003; Trumbull,
Rothstein- Fisch, Greenfield & Quiroz, 2001).
The Importance of Guidance and Mentors
Guiffrida (2005) explains that counselors can do great things to help students prepare and
retain these students through counseling. Counselors can encourage students to take part in
student organizations which will be vital in some cases for social integration. Guiffrida (2005)
warns counselors that they must “caution students about the potential limitations of over
involvement in student organizations” (Guiffrida, 2005, p 711). Guiffrida (2005) explains that
counselors must work with students and parents ahead of time to understand what they should be
considering success in college. The combination of working with the parent and student and
teaching them systemic leadership strategies will help the student to get the full advantage of the
organization without losing out on academics (Guiffrida, 2005).
GEAR UP
THE INFLUENCE OF GEAR UP ON ACADEMIC ACHIEVEIMENT 15
In 1998 during President Clinton’s state of the union address he asked Congress to help
disadvantaged children in America by helping colleges and other institutions give these children
and their parents the guidance and support they need to go to college (Gardner, 2009). An
answer to the President’s request two federal programs were used to develop the GEAR UP
program. The two precursors to the GEAR UP program were State Student Incentive Grant
(SSIG) originally funded by Congress in 1973 and the National Early Intervention Scholarship
and Partnership program (NEISP) which was introduced with the 1992 reauthorization of the
Higher Education Act (Gardner, 2009). In 1998 GEAR UP was introduced during the
reauthorization of the Higher Education Act by the federal government (NCES, 2010). All of the
NEISP requirements for state grants were grandfathered over to GEAR UP with the addition of
giving grants for regional partnership programs (Gardner, 2009). The regional partnerships
should have a minimum of one local Educational Agency (LEA), minimum of one elementary
and secondary school, postsecondary education institution, two or more community
organizations including businesses, philanthropic organizations, or other community-based
agencies (Gardner, 2009).
The GEAR UP program began full operation in 2001 with the three objectives for low
SES students:
1. Increase the academic performance and preparation for postsecondary education of
participating students
2. Increase the rate of high school graduation and participation in postsecondary
education of participating students

THE INFLUENCE OF GEAR UP ON ACADEMIC ACHIEVEIMENT 16
3. Increase educational expectations for participating students and student and family
knowledge of postsecondary education options, preparation, and financing (DOE,
2006, p. 23).
With these objectives in mind two types of grants are awarded by the GEAR UP program for a
six year span of time. The first grant is given to the state so that it can meet GEAR UP
objectives state wide. The state can distribute these funds to local and regional institution across
that state to help low SES students prepare for college. The second grant is for partnership
programs that are made up of local education agencies, postsecondary education institutions,
school districts, and other community agencies that have come together to help students
(Gardner, 2009). Gardner (2009) stated that there are “two characteristics of the GEAR UP
initiative (a) a required one-to-one match leading to sustainability in operational and funding
status and (b) a cohort approach” (Gardner, 2009, p.31). GEAR UP members must have at least
50% of their funding from their partners, these partners can include state governments,
institutions of higher education, and/or community organizations and businesses (DOE, 2006;
NCES, 2009).
Methodology
The purpose of the quantitative correlation study is to explore the association between
participation in the GEAR UP program with academic achievement and college enrollment for
low SES students. GEAR UP was developed in 1998 to improve public education and to
increase low SES students’ access to higher education (NCCEP, 2009; NCES, 2010). GEAR UP
is designed to help students develop the skills that they need to improve academic achievement
and prepare for higher education (NCCEP, 2009; NCES, 2010). The program provides low SES
students with research based early intervention strategies that incorporate: academic support;

THE INFLUENCE OF GEAR UP ON ACADEMIC ACHIEVEIMENT 17
information about postsecondary education and financial aid; scholarships; counseling services;
and other relevant strategies (NCCEP, 2009; NCES, 2010). The program enables states and low
SES communities to develop plans to strengthen their schools so that their students will have
more opportunities (NCCEP, 2009; NCES, 2010). GEAR UP gives support to states, school
districts, local business, colleges, and community based organizations as they work collectively
to inform, train, and support low SES students and their parents to obtain a degree in higher
education (NCCEP, 2009; NCES, 2010). The program supports states, school districts, local
business, colleges, and community based organizations through grants. These grants allow them
to develop and expand programs that will help low SES students gain access to higher education.
The non-experimental design for the quantitative correlation study will assess associations
between participation in the GEAR UP program, academic achievement, and college enrollment
for low socioeconomic (SES) students in New Jersey. The study will use archival data to collect
the study variables and the study will focus on the state of New Jersey participants in the GEAR
UP program. The three study variables include (a) participation in the GEAR UP program (b)
academic achievement as measured by the HSPA, NJASK, TERRA NOVA test, and (c) SES.
The National Council for Community and Education Partnerships (NCCEP) will be contacted for
data and evaluations on the GEAR UP program. Archival data will be collected from the
National Center for Educational Statistics (NCES) and from the NCCEP for the study. The
following research questions will be asked to guide the study:
1. What is the relationship between the GEAR UP program and low SES students in
college acceptance?
2. What is the relationship between participation in the GEAR UP program on academic
achievement for low SES students?
THE INFLUENCE OF GEAR UP ON ACADEMIC ACHIEVEIMENT 18
Research Design
The framework of the study will function on the theoretical and methodological
assumptions of the quantitative correlational research method. A quantitative correlational
design offers an opportunity for the researcher to predict scores and describe the relationship
among variables (Creswell, 2012). Creswell (2012) stated that “in correlational research design,
investigators use the correlation statistical test to describe and measure the degree of association
(or relationship) between two or more variables” (Creswell, 2012, p. 338). In this design
researchers do not try to control or manipulate the variables like an experiment; in its place
researchers relate, using the correlation statistic of two or more scores for each of the participants
(Creswell, 2012). The quantitative correlational method is used to relate two or more variables
to determine if they have any influence on each other (Creswell, 2012). This method allows the
researcher to predict an outcome (Creswell, 2012).
Participants
One of President Clinton’s most exciting programs to emerge from the Higher Education
Amendments of 1998 was the GEAR UP program (NCCEP, 2010). GEAR UP is intended to
encourage student achievement and facilitate more college access(NCCEP, 2010). NCCEP
stated that GEAR UP “is aimed at enabling low-income communities and states to create new or
expanded K–16 education partnerships and action plans that strengthen schools and provide
more and improved education opportunities for low-income students” (NCCEP, 2010, p. 15).
GEAR UP uses proven models to support local schools, community-based organizations,
businesses, institutions of higher education, and states to improve academic achievement and
college access for low SES students. The U.S. Department of Education uses GEAR UP as a tool
THE INFLUENCE OF GEAR UP ON ACADEMIC ACHIEVEIMENT 19
to attack the challenge head on of improving academic achievement and college success for low
SES students (NCCEP, 2010).
The State of New Jersey’s GEAR UP program is currently working on the second federal
grant in its efforts to prepare low SES students for higher education (NJ GEAR UP, 2011). The
program works with students, families, and teachers in 30 middle and high schools in seven
different urban centers (NJ GEAR UP, 2011). These school districts work with five higher
education partner institutions that motivate students to obtain college degrees by providing the
following services (NJ GEAR UP, 2011, p. 20):
• Academic and personal counseling
• GEPA, HSPA, PSAT, and SAT prep classes
• A 6-week summer program on a college campus
• Help with college applications
• Professional development for teachers
• Mentoring
• After-school tutoring
• College visits and tours
• Financial aid information workshops
• Cultural and educational field trips
• College scholarships
The seven urban centers and the higher education partners work together to emphasize the
importance of low SES students taking rigorous high school courses to further prepare them for
higher education. Students that take part in the NJ GEAR UP program are also eligible for the
THE INFLUENCE OF GEAR UP ON ACADEMIC ACHIEVEIMENT 20
state’s Educational Opportunity Fund (EOF) program (NJ GEAR UP, 2011). The EOF program
also offers financial assistance and summer programs for low SES students in the state of New
Jersey (NJ GEAR UP, 2011). New Jersey teams up with Higher Education Student Assistance
Authority and GEAR UP to provide information to low SES students and their parents on how to
pay for higher education in New Jersey. The NJ GEAR UP program only requires that students
meet three requirements for eligibility:
• Attend one of the NJ target GEAR UP schools
• Be eligible for free or reduced price lunch
• Show motivation to prepare for college
For this study there will be no direct contact with the participants in the GEAR UP program. All
of the data that will be collected will come from archival data sets. The archival data sets will
come from NCCEP and NCES that supplies the public with information on educational programs
across the country. Because the purpose of the quantitative correlation study is to explore the
association between participation in the GEAR UP program with academic achievement and
college enrollment for low SES students it is important that a description of the program and the
institutions that will offer these services to these students is defined in the participant section.
The researcher has described these three institutions because they are the three largest and most
diverse institutions in the state of New Jersey that participate in the GEAR UP program.
Description of Institutions
The first state institution is located in a wealthy suburban environment in northern New
Jersey. The institution services more than 2,600 students on campus in 10 dorm buildings and
another 8,000 commuter students. The campus sits on 370 acres of wooded land which holds 38
buildings and a complete sports complex for 13 intercollegiate sports programs. Because the

THE INFLUENCE OF GEAR UP ON ACADEMIC ACHIEVEIMENT 21
institution is located in the mountains, students also have access to hiking, small mountain
climbing, and water fall explorations. The institution offers over 250 undergraduate and
graduate academic programs within five colleges: arts and communications, business, education,
humanities and social sciences, and science and health. The institution also offers certification
programs in education. Pre-professional programs in dentistry, law, medicine, and veterinary
medicine are arranged at the request of students. The second state institution is located in an
urban environment in northern New Jersey. The institution services more than 3,750 students on
campus in 8 dorm buildings and another 13,850 commuter students. The campus sits on 252
acres which holds 52 buildings and it has 17 intercollegiate sports programs. The institution
offers close to 300 majors, minors, concentrations, and certificate programs for graduate and
undergraduate students.
The National Council for Community and Education Partnerships (NCCEP) was
developed to improve public k-16 education. The NCCEP hopes to reach its goal through:
creating education/community partnerships, linking schools and communities, developing new
research-based college access programs, and supporting the implementation of proven
educational strategies” (National Council for Community and Education Partnerships, 2004).
The NCCEP plans to use the findings from research to develop successful frameworks for action
(National Council for Community and Education Partnerships, 2004). NCCEP is determined to
strengthen the standard of equal educational opportunity for all students (National Council for
Community and Education Partnerships, 2004). The work that NCCEP does is intended to:
“help improve public education, increase students' academic achievement levels, and increase
low-income students' access to higher education” (National Council for Community and
Education Partnerships, 2004). In order to complete this work, NCCEP connects colleges and

THE INFLUENCE OF GEAR UP ON ACADEMIC ACHIEVEIMENT 22
universities with local k-12 districts, parent groups, businesses, government agencies,
foundations, corporations, and “community- based organizations to create systemic change in
education” (National Council for Community and Education Partnerships, 2004).
The National Center for Education Statistics (NCES) was developed to provide a wide-
range of information about NCES mission and activities, to serve the research, for education and
to provide additional information to interested groups (NCES, 2009). NCES is one of the federal
government’s units for gathering and investigating data that relates to education in the United
States (NCES, 2009). NCES is a part of the U. S. Department of Education and the Institute of
Education Sciences (NCES, 2009). The National Center for Education Statistics “fulfills a
Congressional mandate to collect, collate, analyze, and report complete statistics on the condition
of American education; conduct and publish reports; and review and report on education
activities internationally” (NCES, 2009, p. 32). NCES has a wide-ranging Statistical Standards
Program that provides advice and consultation on methodological and statistical aspects that aid
in the design, collection, and analysis of data collection (NCES, 2009). NCES offers all of its
programs and archived data sets to the general public so that they can use this information to
make well informed decisions concerning educational issues (NCES, 2009).
Access Permission
Archival data will be gathered from NCCEP and NCES. NCES and NCCEP are both
public institutions that work hand and hand with the government to provide educational statistics
to the public. These institutions provide the public with concise data to make intelligent
decisions about educational issues (NCCEP, 2010; NCES, 2010). Members of the public are
free to pull data directly from the NCCEP and NCES web sites, or contact members of the
NCCEP, or NCES staff for help collecting data sets (NCCEP, 2010; NCES, 2010). The study

THE INFLUENCE OF GEAR UP ON ACADEMIC ACHIEVEIMENT 23
will focus on the state of New Jersey’s GEAR UP program’s academic achievement,
participation, and low SES students archived data sets.
Description of Data Collection
The study will use the archival data to explore associations between participation in the
GEAR UP program and achievement and college enrollment for low SES students. NCCEP and
NCES give the public access to education statistics so that members of the public can make
intelligent decisions when it comes to educational issues. Members of the public can choose the
state, grade levels, type of tests, and years that they wish to collect the data. The data is provided
in SPSS or Excel formats upon request. For the study, NCCEP and NCES will be contacted to
collect archival data on the state of New Jersey. The study will review evaluation and test scores
of students that participated in the GEAR UP program in the state of New Jersey to explore if an
association exists between the variables and the program. The archival data that is received will
be placed in the Statistical Package for Social Sciences (SPSS). SPSS will be used to analyze the
data using descriptive statistics. Statistical tests will be run to explore if any relationships exist
between the variables and the hypotheses for the study. The following hypotheses will be used
to guide collection of the data and analysis:
� H01: There is no relationship between participation in GEAR UP and college entrance
for low SES students.
� HA1: There is a significant relationship between participation in GEAR UP and college
entrance for low SES students.
� H02: There is no relationship between participation in GEAR UP and academic
achievement for low SES students.

THE INFLUENCE OF GEAR UP ON ACADEMIC ACHIEVEIMENT 24
� HA2: There is a significant relationship between participation in GEAR UP and academic
achievement for low SES students.
Instrumentation
The quantitative correlation study will focus on archived data sets, primarily archived
data on academic achievement and participation in the GEAR UP program for low SES students.
The quantitative correlation study will focus on HSPA archived data sets for high school
students. This quantitative correlation study will use a non-parametric measure of strength and
direction to show if an association exists between the variables. The Spearman Rank Correlation
coefficient test is used for variables that are ordinal, ratio, and interval that do not meet the
necessary assumptions to use the Pearson’s correlation (Choudhury, 2009; Lund Research,
2012). In many cases a researcher would use the Pearson correlation when dealing with ratio or
interval data sets, but when the assumptions of the Pearson correlation are not met the Spearman
correlation can be used (Choudhury, 2009; Lund Research, 2012). Another assumption for the
Spearman Rank Correlation Coefficient is a monotonic relationship between the variables.
A monotonic relationship is a relationship that does one of the following: (1) as the value of one
variable increases so does the value of the other variable or (2) as the value of one variable
increases the other variable value decreases. Examples of monotonic and non-monotonic
relationships are presented in the diagram below: (Lund Research, 2012, p. 4)

THE INFLUENCE OF GEAR UP ON ACADEMIC ACHIEVEIMENT 25
The monotonic relationship is important to the Spearman Rank Correlation because the
relationship is less restrictive compared to the linear relationship in the Pearson correlation
(Lund Research, 2012). Lund Research (2012) explained that the middle image above explains
this point well: “A non-linear relationship exists but the relationship is monotonic and is suitable
for analysis by Spearman's correlation but not by Pearson's correlation” (Lund Research, 2012, p.
4).
Planned Data Analysis
The quantitative correlation study will use the Statistical Package for the Social Sciences
(SPSS) to conduct the correlation analysis. The variables for the quantitative correlation study
will have three different levels of measurement. The variables for the study are participation
(Ordinal, did the student attend), academic achievement (Ratio, Test scores), and low SES
(Interval). Since the levels of measurement are different among the variables the Spearman
Rank correlation coefficient test will be used to measure the variables (Choudhury, 2009). The
Spearman Rank Correlation Coefficient test is used to find correlation in the variables, when the
levels of measurement are different among those variable (Choudhury, 2009). The Spearmen
Rank Correlation Coefficient test will assess the variables without making any assumption about
THE INFLUENCE OF GEAR UP ON ACADEMIC ACHIEVEIMENT 26
their relationship (Choudhury, 2009). Since the quantitative study is using archived data,
information about the parameters of the variables can be undetermined. The lack of information
makes the correlation of the variables non-parametric (Choudhury, 2009). Therefore the study
will use the Spearman Rank Correlation Coefficient to measure the variables. Choudhury (2009)
stated the “Spearman rank correlation coefficient tries to assess the relationship between ranks
without making any assumptions about their relationship” (Choudhurry, 2009, p. 3). In the place
of the r coefficient, researchers utilize the Spearman rho (rs) correlation coefficient for nonlinear
data and for other types of data measured on a categorical scale (Creswell, 2012).
FINDINGS
The purpose of the quantitative correlation study is to examine the association between
participation in the GEAR UP program with academic achievement and college enrollment for
low SES students. The quantitative correlational study used archival data to find associations
within the variables for the study. The study was guided by two research questions.
1. What is the relationship between participation in the GEAR UP program and low SES
student’s college enrollment?
2. What is the relationship between participation in the GEAR UP program on academic
achievement for low SES students?
Data
The following table compares the demographics of the GEAR UP and non-GEAR UP
middle school students. The archival data was taken from the 2008 final report on the GEAR UP
program. The table shows the characteristics of GEAR UP and non-GEAR UP students on the
national level.

THE INFLUENCE OF GEAR UP ON ACADEMIC ACHIEVEIMENT 27
COMPARISON OF CHARACTERISTICS OF GEAR UP AND NON-GEAR UP
STUDENTS IN THE NATIONAL EVALUATION
National Evaluation of GEAR UP
a
Characteristics
All public
middle schools
(%)
GEAR UP
program
nationally
(%)
GEAR UP
middle schools
(%)
Non-GEAR
UP middle
schools
(%)
Gender
Male 51 50 50 50
Female 49 50 50 50
Race/ethnicity
African-American 17 30 25 19
Asian 4 3 3 6
Hispanic 16 36 31 25
Native American 1 5 7 2
White 62 26 35 48
Special programs
IEPb 13 11 12 10
LEPc 8 12 12 8
NSLPd 37 N/A
e 65 62
a Comparison between GEAR UP and non-GEAR UP students who remained in the evaluation through the end of eighth grade.
b Individualized Education Program
c Limited English Proficient
d National School Lunch Program e Not available, however, to be eligible, at least 50 percent of the students in the school must be eligible for free or reduced-price meals.
For the final report non-GEAR UP schools were chosen based on their similarity to GEAR UP
schools. The GEAR UP partnerships aided a greater percentage of minority students than the
national average for middle school students.
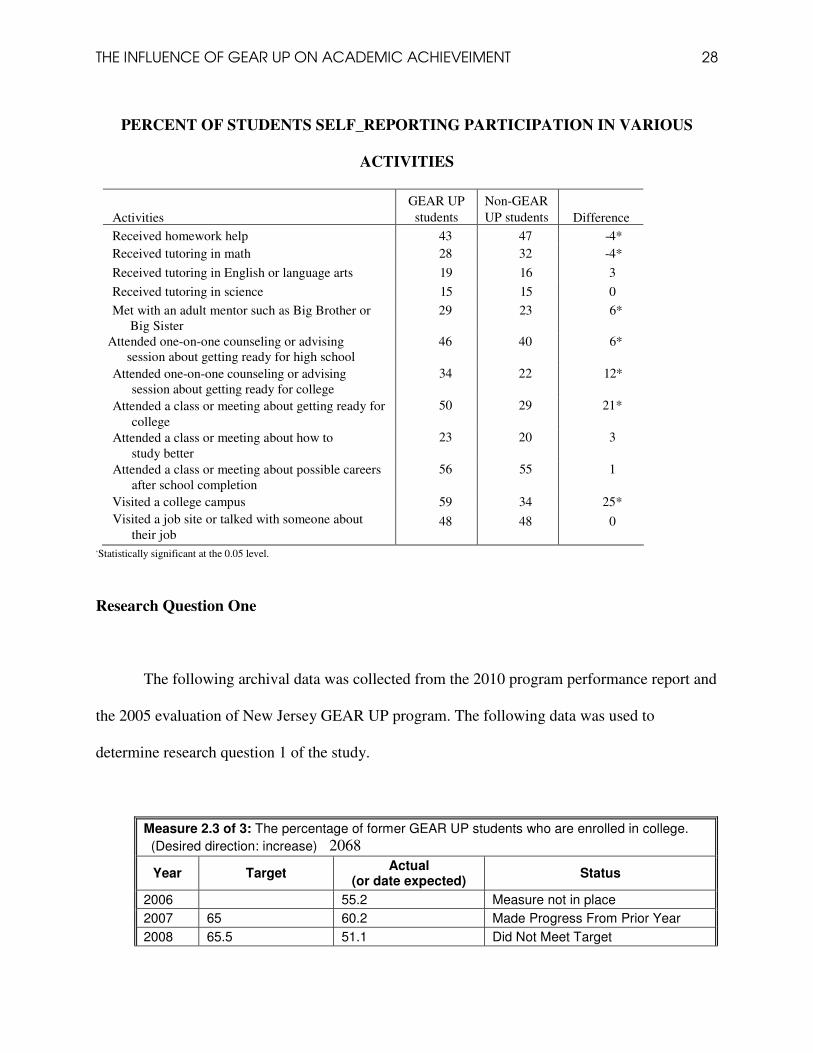
During the national report approximately 1,800 participants in the GEAR UP program
reported to have participated in over 2,700 GEAR UP events. The following archival data shows
the percent of students that reported participation in various activities.
THE INFLUENCE OF GEAR UP ON ACADEMIC ACHIEVEIMENT 28
PERCENT OF STUDENTS SELF_REPORTING PARTICIPATION IN VARIOUS
ACTIVITIES
Activities
GEAR UP
students
Non-GEAR
UP students Difference
Received homework help 43 47 -4*
Received tutoring in math 28 32 -4*
Received tutoring in English or language arts 19 16 3
Received tutoring in science 15 15 0
Met with an adult mentor such as Big Brother or 29 23 6*
Big Sister Attended one-on-one counseling or advising
session about getting ready for high school
46 40 6*
Attended one-on-one counseling or advising
session about getting ready for college
34 22 12*
Attended a class or meeting about getting ready for
college
50 29 21*
Attended a class or meeting about how to
study better
23 20 3
Attended a class or meeting about possible careers
after school completion
56 55 1
Visited a college campus 59 34 25*
Visited a job site or talked with someone about
their job 48 48 0
*Statistically significant at the 0.05 level.
Research Question One
The following archival data was collected from the 2010 program performance report and
the 2005 evaluation of New Jersey GEAR UP program. The following data was used to
determine research question 1 of the study.
Measure 2.3 of 3: The percentage of former GEAR UP students who are enrolled in college.
(Desired direction: increase) 2068
Year Target Actual
(or date expected) Status
2006 55.2 Measure not in place
2007 65 60.2 Made Progress From Prior Year
2008 65.5 51.1 Did Not Meet Target

THE INFLUENCE OF GEAR UP ON ACADEMIC ACHIEVEIMENT 29
2009 66 Not Collected Not Collected
2010 66.5 Not Collected Not Collected
2011 59 (February 2012) Pending
2012 60 (February 2013) Pending
2013 60 (February 2014) Pending
2014 61 (February 2015) Pending
Chart 1 (MEASURE 2.3 of 3) was pulled from the 2010 program performance report. In
2007 progress was made in the percent of college going students in the program. In 2008 there
was a slight drop in college enrollment for students in the GEAR UP program. The next set of
archival data was pulled from the 2005 evaluation of the New Jersey GEAR UP program. The
next two tables show college enrollment rates for New Jersey GEAR UP students. For display 9
and 10 labeled as initial college-going rates of NJ GEAR UP state project cohorts, display 10
overall college-going rate of NJ GEAR UP state project the figures show the number of students
that participated in the program that enrolled in college as well as subsets of students that stayed
in state and out of state colleges. Cohort 5 contains incomplete data and could not be fully
evaluated. Cohorts 1-4 show a pattern of success. The data used is for students that participated
in the program during the time period of the evaluation. The participants that are used did not go
through the program from 7th
grade 12th
grade. These participants took part in the program from
their initial grade. In some cases students could have started in the 9th
or 10th
grade in the
program. The evaluation focused only on the first four years of the program between 2001- 2004
which was the only full years of complete data at that point. In display 9, between 61% -100%
of students that complete the program enroll in institutions of higher education. The table shows
each cohort separately. The data shows the percent of students that went to college as well as the
percent of students that stayed in state and went to out of state institutions. The data shows
patterns of success for the GEAR UP program with college enrollment. The display 10 tracked
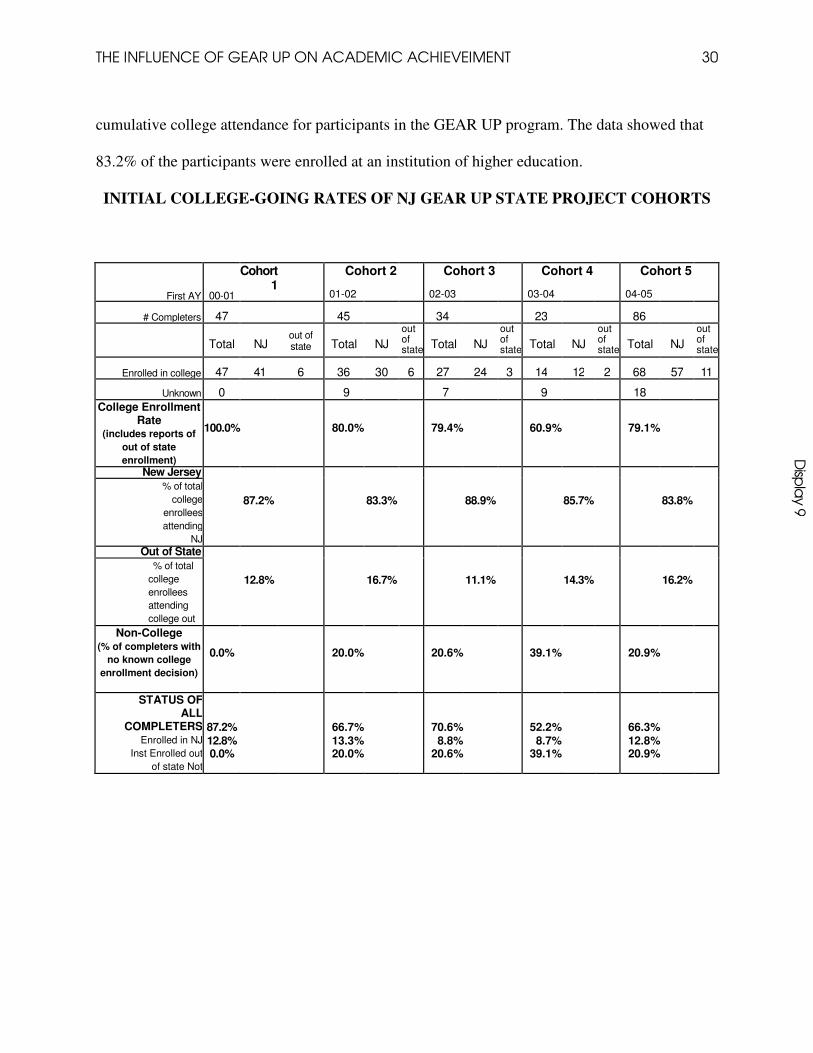
THE INFLUENCE OF GEAR UP ON ACADEMIC ACHIEVEIMENT 30
cumulative college attendance for participants in the GEAR UP program. The data showed that
83.2% of the participants were enrolled at an institution of higher education.
INITIAL COLLEGE-GOING RATES OF NJ GEAR UP STATE PROJECT COHORTS
First AY 00-01
Cohort 1
Cohort 2
01-02
Cohort 3
02-03
Cohort 4
03-04
Cohort 5
04-05
# Completers 47 45 34 23 86
Total NJ
out of state Total NJ
out of state
Total NJ
out of state
Total NJ
out of state
Total NJ
out of state
Enrolled in college 47 41 6 36 30 6 27 24 3 14 12 2 68 57 11
Unknown 0 9 7 9 18 College Enrollment
Rate (includes reports of
out of state
enrollment)
100.0%
80.0%
79.4%
60.9%
79.1%
New Jersey
% of total
college
enrollees
attending
NJ
87.2%
83.3%
88.9%
85.7%
83.8%
Out of State
% of total
college
enrollees
attending
college out
12.8%
16.7%
11.1%
14.3%
16.2%
Non-College (% of completers with
no known college
enrollment decision)
0.0%
20.0%
20.6%
39.1%
20.9%
STATUS OF ALL
COMPLETERS Enrolled in NJ
Inst Enrolled out
of state Not
87.2% 12.8% 0.0%
66.7% 13.3% 20.0%
70.6% 8.8%
20.6%
52.2% 8.7%
39.1%
66.3% 12.8% 20.9%
Disp
lay 9

THE INFLUENCE OF GEAR UP ON ACADEMIC ACHIEVEIMENT 31
OVERALL COLLEGE-GOING RATE OF NJ GEAR UP STATE PROJECT
First AY 00-01
Cohort 1
Cohorts 1 & 2
01-02
Cohorts 1, 2,
& 3 Cohorts 1, 2,
3, & 4
Cohorts 1, 2,
3, 4, & 5
# Completers 47 92 126 149 235
Total NJ out of
state Total NJ Out of
State Total NJ
Out of
State
Total NJ
Out of
State Total NJ Out of
state
Enrolled in college 47 41 6 83 71 12 110 95 15 124 107 17 192 164 28
Unknown 0 9 16 25 43 College Enrollment
Rate (includes reports of
out of state
enrollment)
100.0%
90.2%
87.3%
83.2%
81.7%
New Jersey
% of total
college
enrollees
attending NJ
institutions
87.2%
85.5%
86.4%
86.3%
85.5%
Out of State
% of total
college
enrollees
attending
college out
12.8%
14.5%
13.6%
13.7%
14.6%
Non-College (% of completers with
no known college
enrollment decision)
0.0%
9.8%
12.7%
16.8%
18.3%
STATUS OF ALL
COMPLETERS Enrolled in NJ Inst
Enrolled out of
state Not enrolled
87.2% 12.8% 0.0%
77.2% 13.0% 9.8%
75.4% 11.9% 12.7%
71.8% 11.4% 16.8%
69.8%11.9%18.3%
Research Question Two
The next set of data is from the 2005 evaluation of New Jersey GEAR UP, the 2008 final
report, and the 2010 program performance report on the GEAR UP program. This set of data is
Disp
lay 10

THE INFLUENCE OF GEAR UP ON ACADEMIC ACHIEVEIMENT 32
used to answer research question two. The following data will help to explain the relationship
between participation and academic achievement for low SES students. Chart one (table 3-1a) of
the archival data showed correlation between the GEAR UP program and rigorous core course
taking. The chart also shows scoring on the college orientation index for GEAR UP and non-
GEAR UP students. Chart two (Table 3-1b) shows the different types of mathematics courses
taken by GEAR UP and non-GEAR UP students. The third chart (Table 3-1c) shows the
associations between GEAR UP and the level of science courses taken by students. Chart four
(Table 3-1d) shows association between GEAR UP and the level of English courses taken by
students. Chart five (Table 3-1f) shows association between GEAR UP and the level of academic
rigor in students’ courses. Chart six (Table 3-1g) shows the association between the program and
the level of academic performance for students. Chart seven (Table 3-1h) shows the percentage
of students with high levels of academic performance. Tables 3-1a – 3-1h are used to explain the
level of academic achievement for participants in the program. These students took courses with
higher levels of rigor and exceled academically.
Table 3-1 a. Association for GEAR UP with percentage of students taking more challenging
core academic courses
GEAR
UP
Non-
GEAR
UP Difference
95%
Confidence
interval
Measure and subgroup (%) (%) (%) (%)
Percentage of students enrolled in algebra
All 33.6 22.9 10.6 (-2.3,23.6) Middle 1/3 on College Orientation
Index 30.9 21.0 9.8 (-5.7,25.3)
African-American 18.5 9.6 9.0 (-5.9,23.8) Hispanic 49.0 39.8 9.2 (-16.2,34.5)
First-generation student 32.3 21.9 10.4† (-2.0,22.8)

THE INFLUENCE OF GEAR UP ON ACADEMIC ACHIEVEIMENT 33
Percentage of students enrolled at above-grade level in science
All 14.7 4.8 9.8* (2.2,17.5) Middle 1/3 on College Orientation
Index 14.3 4.8 9.5* (1.7,17.3)
African-American 9.4 2.0 7.4 (-1.7,16.4) Hispanic 24.6 7.9 16.7* (0.3,33.1)
First-generation student 13.0 4.6 8.3* (1.2,15.4)
Percentage of students enrolled at above-grade level in English
All 24.8 12.2 12.6 (-6.5,31.7) Middle 1/3 on College Orientation
Index 18.9 10.5 8.4 (-3.8,20.6)
African-American 15.6 4.2 11.4† (-0.8,23.6) Hispanic 32.2 25.3 6.9 (-11.2,25.1)
First-generation student 25.3 11.9 13.4 (-8.6,35.4)
Percentage of students enrolled at above-grade level in foreign language
All 2.7 3.0 -0.2 (-5.1,4.7) Middle 1/3 on College Orientation
Index 1.9 2.7 -0.9 (-5.6,3.9)
African-American 0.5 1.4 -1.0 (-3.7,1.8) Hispanic 9.1 3.4 5.7 (-4.0,15.3)
F i r s t - g e n e r a t i o n s t u d e n t 1.3 3.1 -1.9 (-6.4,2.7)
* Statistically significant differences at the 5-percent level. † Statistically
significant differences at the 10-percent level.
NOTES: Estimates in this table were prepared with replicated counterfactual projection (CFP) weights. Detail may not
sum to totals because of rounding.
Table 3-1 b. Association for GEAR UP with level of mathematics courses taken
Measure and subgroup
GEAR UP (%)
Non- GEAR
UP (%) Difference
95% Confidence
interval
Percentage of all students Remedial or no mathematics 2.7 3.4 -0.7 (-3.9,2.5)
Nonacademic mathematicsa 44.5 35.1 9.3 (-17.5,36.2)
Pre-algebra 19.3 38.5 -19.3* (-42.3,3.8)

THE INFLUENCE OF GEAR UP ON ACADEMIC ACHIEVEIMENT 34
Algebra 33.6 22.9 10.6 (-2.3,23.6)
Percentage of students in middle 1/3 on
College Orientation Index Remedial or no mathematics 1.8 1.6 0.2 (-1.8,2.1)
Nonacademic mathematics 46.8 38.6 8.1 (-17.7,33.9) Pre-algebra 20.6 38.7 -18.1 (-41.1,4.9)
Algebra 30.9 21.0 9.8 (-5.7,25.3)
Percentage of African-American students
Remedial or no mathematics 1.8 6.2 -4.4 (-12.4,3.7)
Nonacademic mathematics 59.3 57.0 2.3 (-22.9,27.6) Pre-algebra 20.3 27.2 -6.9 (-26.6,12.7)
Algebra 18.5 9.6 9.0 (-5.9,23.8)
Percentage of Hispanic students
Remedial or no mathematics 5.3 3.1 2.2 (-1.6,6.0)
Nonacademic mathematics 36.7 32.9 3.8 (-22.3,29.8) Pre-algebra 9.0 24.2 -15.1 (-38.5,8.2)
Algebra 49.0 39.8 9.2 (-16.2,34.5)
Percentage of first-generation students
Remedial or no mathematics 2.3 2.9 -0.6 (-4.3,3.2)
Nonacademic mathematics 44.1 36.3 7.8 (-21.0,36.6) Pre-algebra 21.3 39.0 -17.7 (-42.5,7.2)
A l g e b r a 32.3 21.9 10.4† (-2.0,22.8)
* Statistically significant differences at the 5-percent level.
a This term is used by NCES to describe general and basic skills mathematics classes.
NOTES: Estimates in this table were prepared with replicated counterfactual projection (CFP) weights. Detail may not
sum to totals because of rounding.

THE INFLUENCE OF GEAR UP ON ACADEMIC ACHIEVEIMENT 35
Table 3-1c. Association for GEAR UP with level of science courses taken
Measure and subgroup GEAR UP
(%)
Non-
GEAR UP
(%) Difference
95% Confidence
interval
Percentage of all students Remedial or no science 1.1 6.8 -5.6 (-15.6,4.3)
On-grade or below-grade life or physical sciences 74.4 76.0 -1.7 (-30.3,27.0)
Above-grade life or physical
sciences 12.4 3.9 8.5* (1.4,15.7)
Chemistry or physics 12.1 13.3 -1.2 (-25.6,23.2)
Percentage of students in middle
1/3 on College Orientation Index Remedial or no science 0.4 6.7 -6.3 (-17.1,4.6)
On-grade or below-grade life or physical sciences 72.0 78.7 -6.7 (-35.1,21.8)
Above-grade life or physical sciences 12.8 4.2 8.6* (0.7,16.4)
Chemistry or physics 14.8 10.4 4.4 (-20.4,29.2)
Percentage of African-American students
Remedial or no science 1.0 12.8 -11.7 (-28.5,5.1)
On-grade or below-grade life
or physical sciences 56.0 80.2 -24.1 (-81.7,33.4)
Above-grade life or physical sciences 6.4 1.0 5.4 (-1.8,12.6)
Chemistry or physics 36.5 6.1 30.4 (-23.0,83.9)
Percentage of Hispanic students Remedial or no science 1.7 6.9 -5.2 (-14.3,3.8)
On-grade or below-grade life
or physical sciences 65.1 84.4 -19.3 (-47.3,8.6)
Above-grade life or physical sciences 21.9 6.6 15.3† (-1.3,31.9)
Chemistry or physics 11.4 2.1 9.2 (-14.0,32.5)
Percentage of first-generation students
Remedial or no science 1.0 7.2 -6.2 (-17.8,5.5)
On-grade or below-grade life or physical sciences 75.4 74.4 1.0 (-30.4,32.5)
Above-grade life or physical
sciences 10.5 3.7 6.8* (0.8,12.7)
C h e m i s t r y o r p h y s i c s 13.0 14.6 -1.6 (-28.9,25.7)
* Statistically significant differences at the 5-percent level. † Statistically
significant differences at the 10-percent level.
NOTES: Estimates in this table were prepared with replicated counterfactual projection (CFP) weights. Detail may not

THE INFLUENCE OF GEAR UP ON ACADEMIC ACHIEVEIMENT 36
sum to totals because of rounding.
Table 3-1d. Association for GEAR UP with level of English courses taken
Measure and subgroup GEAR UP
(%)
Non- GEAR UP
(%) Difference
95% Confidence
interval
Percentage of all students No English 3.0 4.5 -1.5 (-4.4,1.4) Remedial English 1.1 3.9 -2.8 (-10.5,5.0)
Below-grade English 1.4 3.2 -1.9 (-6.1,2.4)
On-grade English 69.7 76.2 -6.5 (-28.3,15.3)
Above-grade English 24.8 12.2 12.6 (-6.5,31.7)
Percentage of students in middle
1/3 on College Orientation Index No English 3.8 4.4 -0.6 (-4.0,2.8)
Remedial English 0.6 4.8 -4.2 (-14.1,5.7) Below-grade English 1.9 2.3 -0.3 (-3.3,2.6)
On-grade English 74.8 78.0 -3.2 (-20.6,14.1)
Above-grade English 18.9 10.5 8.4 (-3.8,20.6)
Percentage of African-American students
No English 2.1 3.8 -1.6 (-7.5,4.2)
Remedial English 0.7 14.3 -13.6 (-41.8,14.6)
Below-grade English 1.6 1.7 -0.1 (-4.7,4.6)
On-grade English 79.9 76.0 3.9 (-36.0,43.8)
Above-grade English 15.6 4.2 11.4* (-0.8,23.6)
Percentage of Hispanic students
No English 7.5 7.4 0.2 (-4.0,4.3)
Remedial English 2.3 1.5 0.8 (-4.4,6.1) Below-grade English 2.8 4.2 -1.4 (-5.1,2.3)
On-grade English 55.1 61.7 -6.5 (-24.6,11.5)
Above-grade English 32.2 25.3 6.9 (-11.2,25.1)
Percentage of first-generation students
No English 1.9 3.2 -1.4 (-4.4,1.6)
Remedial English 0.9 4.2 -3.3 (-11.7,5.1)
Below-grade English 0.9 2.8 -1.9 (-6.6,2.7)
On-grade English 71.1 77.9 -6.8 (-31.8,18.2)
A b o v e - g r a d e E n g l i s h 25.3 11.9 13.4 (-8.6,35.4)
* Statistically significant differences at the 5-percent level.
NOTES: Estimates in this table were prepared with replicated counterfactual projection (CFP) weights. Detail may not
sum to totals because of rounding.

THE INFLUENCE OF GEAR UP ON ACADEMIC ACHIEVEIMENT 37
Table 3-1 f. Association for GEAR UP with academic rigor of courses taken
Measure and subgroup GEAR UP
Non-
GEAR UP Difference
Mean number of academically rigorous
core courses taken
All 1.1 1.0 0.1
Middle 1/3 on College Orientation Index 1.0 0.9 0.1
African-American 1.0 0.5 0.5*
Hispanic 1.3 1.0 0.3
First-generation 1.1 1.0 0.1
* Statistically significant differences at the 5-percent level.
NOTES: Estimates in this table were prepared with replicated counterfactual projection (CFP) weights.
Academic rigor is determined by the number of core academic classes taken that are considered to be above- grade level for an average eighth-grade student.
Detail may not sum to totals because of rounding.
Table 3-1g. Association for GEAR UP with level of academic performance
Measure and subgroup GEAR UP Non-GEAR
UP Difference
95%
Confidence interval
Mean GPA for mathematics All 2.5 2.4 0.1 (-0.2,0.4)
Middle 1/3 on College Orientation Index 2.5 2.3 0.1 (-0.2,0.4)
African-American 2.3 2.2 0.1 (-0.2,0.5) Hispanic 2.5 2.2 0.4 (-0.3,1.0)
First-generation 2.5 2.5 0.0 (-0.2,0.3)
Mean GPA for science
All 2.6 2.6 -0.1 (-0.4,0.2) Middle 1/3 on College
Orientation Index 2.5 2.6 -0.1 (-0.4,0.2) African-American 2.2 2.3 -0.1 (-0.4,0.2)
Hispanic 2.7 2.5 0.2 (-0.1,0.6)
First-generation 2.6 2.7 -0.1 (-0.4,0.2)

THE INFLUENCE OF GEAR UP ON ACADEMIC ACHIEVEIMENT 38
Mean GPA for English
All 2.7 2.7 -0.1 (-0.3,0.2)
Middle 1/3 on College
Orientation Index 2.6 2.7 -0.0 (-0.3,0.3) African-American 2.3 2.4 -0.1 (-0.4,0.2)
Hispanic 2.7 2.7 0.0 (-0.3,0.4)
First-generation 2.7 2.7 -0.1 (-0.4,0.2)
Mean GPA for foreign language
All 2.5 2.7 -0.2 (-0.6,0.2) Middle 1/3 on College
Orientation Index 2.4 2.8 -0.4 (-0.9,0.1)
African-American 2.1 2.5 -0.4 (-1.2,0.4) Hispanic 2.7 2.9 -0.2 (-0.7,0.4)
F i r s t - g e n e r a t i o n 2.4 2.7 -0.3 (-0.8,0.2)
* Statistically significant differences at the 5-percent level. † Statistically
significant differences at the 10-percent level.
NOTES: Estimates in this table were prepared with replicated counterfactual projection (CFP) weights.
The number -0.0 indicates that the true value of this number is less than zero but more than -0.1.
Detail may not sum to totals because of rounding.
Table 3-1h. Association for GEAR UP with percentage of students with high levels of
academic performance
Measure and subgroup GEAR UP
(%)
Non-GEAR UP (%) Difference
95% Confidence
interval
Percentage of all students with grade of B or better in above-grade level
Mathematics 21.4 11.6 9.8 (-0.3,19.8) Science 10.5 3.7 6.8 (-0.8,14.4)
English 17.9 10.5 7.4 (-6.6,21.4)
Foreign language 0.9 2.4 -1.4 (-4.3, 1.4)
Percentage of students in middle
1/3 on College Orientation Index with grade of B or better in above-grade level
Mathematics 15.7 8.2 7.6 (-1.4,16.6) Science 9.8 3.7 6.1 (-2.6,14.8)
English 13.5 8.7 4.8 (-4.3,14.0)
Foreign language 0.6 2.4 -1.8 (-5.0,1.4)
Percentage of African-American students with grade of B or better in above-grade level

THE INFLUENCE OF GEAR UP ON ACADEMIC ACHIEVEIMENT 39
Mathematics 8.0 5.5 2.5 (-5.5,10.5) Science 4.6 2.0 2.5 (-2.4,7.5)
English 9.3 4.2 5.1 (-3.4,13.6)
Foreign languagea – – –
Percentage of Hispanic students with grade of B or better in above-grade level
Mathematics 30.3 16.0 14.3 (-6.4,35.1) Science 20.3 5.3 15.1 (-1.4,31.5)
English 24.3 20.7 3.5 (-14.5,21.6)
Foreign language 2.8 3.0 -0.2 (-2.6,2.3)
Percentage of first-generation students with grade of B or better in above-grade level
Mathematics 20.9 11.9 9.0 (-0.7,18.6) Science 9.0 3.7 5.3 (-1.7,12.3)
English 17.7 10.4 7.4 (-8.7,23.4)
F o r e i g n l a n g u a g e 0.3 2.5 -2.2 (-5.2,0.8)
* Statistically significant differences at the 5-percent level. † Statistically
significant differences at the 10-percent level. a Inadequate sample size to
produce estimates.
NOTES: Estimates in this table were prepared with replicated counterfactual projection (CFP) weights. The number -0.0
indicates that the true value of this number is less than zero but more than -0.1. Detail may not sum to totals because
of rounding.
The following archival data was collected from the 2010 program performance report and
the 2005 evaluation of New Jersey GEAR UP program. The following data was used to
determine conclusions to research question 2 of the study.
Measure 1.1 of 2: The percentage of GEAR UP students who passed prealgebra by the end of
the 7th grade. (Desired direction: increase) 1216
Year Target Actual
(or date expected) Status
2001 18 Measure not in place
2002 18 Measure not in place
2003 19 22 Target Exceeded
2004 20 29 Target Exceeded
2005 25 37.9 Target Exceeded
2006 30 30 Target Met
2007 35 32.4 Made Progress From Prior Year
2008 35 25.2 Did Not Meet Target
2009 35 27 Made Progress From Prior Year
2011 32 (August 2011) Pending
2012 33 (August 2012) Pending
THE INFLUENCE OF GEAR UP ON ACADEMIC ACHIEVEIMENT 40
2013 33 (August 2013) Pending
2014 34 (August 2014) Pending
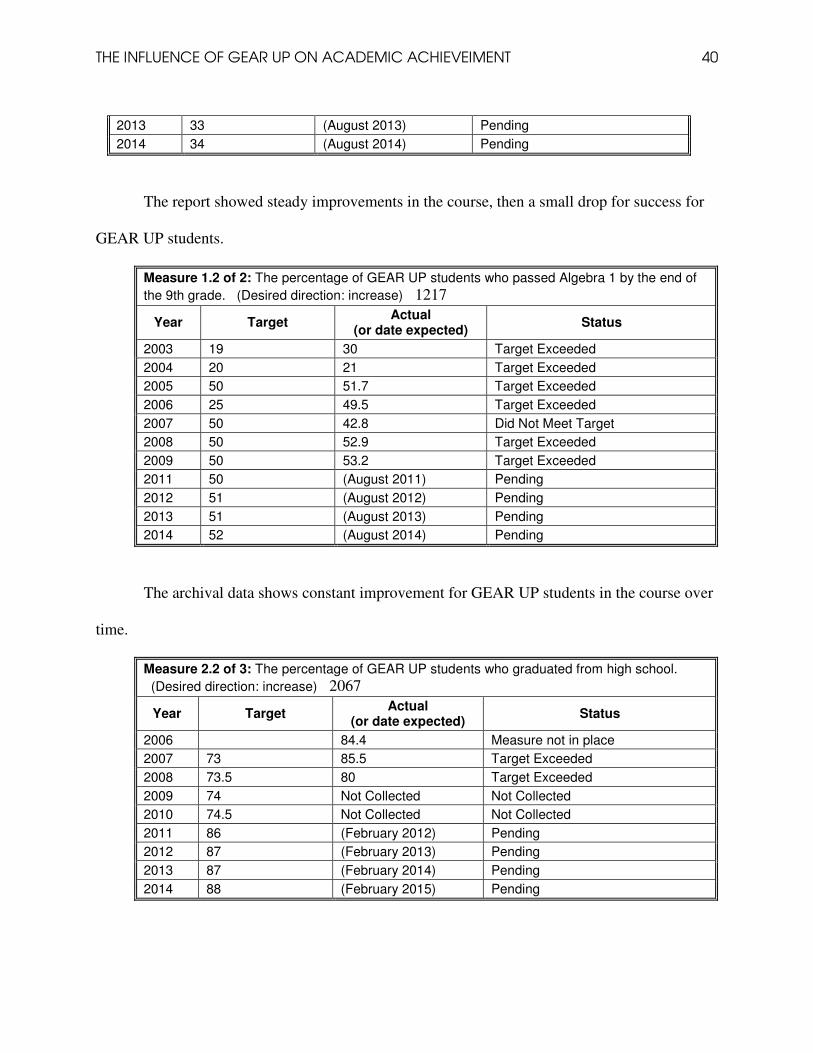
The report showed steady improvements in the course, then a small drop for success for
GEAR UP students.
Measure 1.2 of 2: The percentage of GEAR UP students who passed Algebra 1 by the end of
the 9th grade. (Desired direction: increase) 1217
Year Target Actual
(or date expected) Status
2003 19 30 Target Exceeded
2004 20 21 Target Exceeded
2005 50 51.7 Target Exceeded
2006 25 49.5 Target Exceeded
2007 50 42.8 Did Not Meet Target
2008 50 52.9 Target Exceeded
2009 50 53.2 Target Exceeded
2011 50 (August 2011) Pending
2012 51 (August 2012) Pending
2013 51 (August 2013) Pending
2014 52 (August 2014) Pending
The archival data shows constant improvement for GEAR UP students in the course over
time.
Measure 2.2 of 3: The percentage of GEAR UP students who graduated from high school.
(Desired direction: increase) 2067
Year Target Actual
(or date expected) Status
2006 84.4 Measure not in place
2007 73 85.5 Target Exceeded
2008 73.5 80 Target Exceeded
2009 74 Not Collected Not Collected
2010 74.5 Not Collected Not Collected
2011 86 (February 2012) Pending
2012 87 (February 2013) Pending
2013 87 (February 2014) Pending
2014 88 (February 2015) Pending

THE INFLUENCE OF GEAR UP ON ACADEMIC ACHIEVEIMENT 41
The archival data shows improvement for high school completion for participants in the
GEAR UP program.
The next two charts are from the 2005 evaluation of the New Jersey GEAR UP program.
These charts show performance of participants in the GEAR UP program on two state tests, the
GEPA and HSPA, compared to students within the target schools that are not participants.
Displays 6 and 7
Source: New Jersey GEAR UP State Project; target school data from New Jersey Report Card 2002-3
Language Arts Literacy
Mathematics Science
Percent of NJ GEAR UP Students Scoring Proficient on the
2003 GEPA Compared to the Target Schools
50.0%
40.0%
30.0%
20.0%
10.0%
0.0%
GEAR UP Participants
Target School Participants
Language Arts Literacy
Mathematics
Percent of NJ GEAR UP Students Scoring Proficient on the 2003
HSPA Compared to Students in the Target Schools
50.0%
40.0%
30.0%
20.0%
10.0%
0.0%
GEAR UP Participants
Target School Participants

THE INFLUENCE OF GEAR UP ON ACADEMIC ACHIEVEIMENT 42
CHAPTER FIVE: SUMMARY, CONCLUSIONS AND RECOMMENDATIONS
Studies demonstrate that low SES students are not prepared for higher education after
participating in extra programs before and after school (Burleson, 2008; Buller, 2010; Ward,
2006). This lack of preparedness is due to the many outside forces that low SES students must
deal with (Burleson, 2008; Ward, 2006). In order for low SES students to be prepared for higher
education, the tools and knowledge that institutions of higher education consider essential must
be provided. Educators should pay attention to the cultural aspect of preparing low SES students
to function and succeed on a college campus (Ehlers & Wibrowski, 2007; Quaterman, 2008).
The GEAR UP program helps to develop the necessary skill sets that low SES students
will need to succeed in higher education. Students that are successful in the transition from the
k-12 system into higher education are academically, socially and culturally prepared (Burleson,
2008). By developing these skill sets GEAR UP hopes to improve academic achievement and
success in postsecondary education. GEAR UP “provides research-based early outreach
strategies that include: academic support; information about postsecondary education and
financial aid; scholarships; counseling services; and other relevant strategies” to reach its goal
(National Council for Community and Education Partnerships [NCCEP], 2009, p. 8).
Early intervention programs can have a positive effect on college preparedness and academic
achievement for low SES students (Beer, 2009; Dalpe, 2008; Wilkins, 2007). The federal
government has developed many interventions to increase college access for low SES students
through Title IV of the Higher Education Act of 1965 (Perna, 2002). Universities along with
private organizations and state governments have provided low SES students with financial aid
to improve their access to higher education (The College Board, 2000; Perna, 2002). College

THE INFLUENCE OF GEAR UP ON ACADEMIC ACHIEVEIMENT 43
attendance for low SES students has increased because of these interventions, but the enrollment
rates compared to upper and middle class students is still low (Mortenson, 2001; Perna, 2002).
One possible cause for the enrollment numbers continuing to be low for low SES families
could be the methods used with traditional interventions (Gladieux &Swail, 1999; Perna, 2002).
Most of the traditional interventions tend to focus on the financial barriers of college enrollment
and pay little to no attention to social, psychological, cultural, and academic rigor needed for
these students to succeed in higher education. Policy makers have begun to recognize the limits
of the traditional interventions and methods; they have turned to early intervention programs as a
solution (Perna, 2002). These early intervention programs utilize parents, guidance counselors,
culture, and information on college as key components to increase academic achievement and
college enrollment for low SES students.
GEAR UP was developed to improve access to higher education for lower SES students.
The program was designed to develop the skills in low SES students needed to improve
academic achievement and college enrollment. The program develops these skills through
research based early intervention strategies. GEAR UP enables low SES communities and states
to develop plans that will open up opportunities and strengthen their schools. The program
supports the partnerships through grants that allow them t to expand programs that will improve
access and open new opportunities for low SES students.
Limitations
As the state of New Jersey has just begun the implementation of its second GEAR UP
grant, the amount of available data on the state GEAR UP program is very limited. Archival data
on the first grant for the state has been sent to the federal government. The state of New Jersey
has only had one full cohort of students to move on. At this point the only way to access the data
THE INFLUENCE OF GEAR UP ON ACADEMIC ACHIEVEIMENT 44
is through the federal government. The federal government has made one report on the program
limiting the amount of data to be collected for the study.
Discussions and Conclusions
The first table labeled “Comparison of characteristics of GEAR UP and non-GEAR UP
students in the national evaluation” in chapter four provides a solid foundation for discussing
GEAR UP conclusions by comparing the demographics of non-GEAR UP students and students
that participated in GEAR UP on the national level. This chart also paints a good picture on a
national level of the characteristics of students in GEAR UP compared to non-GEAR UP
students. It also shows how similar the students were for the national evaluation in GEAR UP
and students that did not participate in the GEAR UP program. The non-GEAR UP schools was
selected based on how similar there were to the GEAR UP schools. There was no difference in
the amount of boys and girls, but the GEAR UP program aided a higher percentage of minority
students than the national average for middle school students. During the national evaluation
65% of the GEAR UP students were from minority families while minority students only made
up 38% of the total middle school population on the national level.
During the national evaluation GEAR UP and non-GEAR UP students were asked to
report if they had participated in certain activities. The table on “Percent of students self-
reporting participation in various activities” shows significant differences in a few key areas of
the questions for college preparation. GEAR UP and non-GEAR UP students were asked if they
attended one-on-one counseling or advising sessions about getting ready for high school,
attended one-on-one counseling, or advising sessions about getting ready for college, attended a
class or meeting about getting ready for college, and visited a college campus. The GEAR UP

THE INFLUENCE OF GEAR UP ON ACADEMIC ACHIEVEIMENT 45
students took part in more of these preparation aids for higher education than non-GEAR UP
students.
For research question “one” of the study, data were pulled from the 2010 program
performance report and the 2005 evaluation of the New Jersey GEAR UP program. The data
demonstrate a consistent level of success for the GEAR UP program for college enrollment.
During some of the years of the report the GEAR UP program did not reach its target goals set
for that year but the program still stayed above 51% college enrollment for students that
participated in the program. Display chart 9 in chapter four shows that between 61% - 100% of
students that complete the GEAR UP program enroll at an institution of higher education.
National numbers show that college attendance for low income students is 47.8%, black students
is 56.3%, and 48.6% for Hispanic students over all. After comparing the national numbers with
GEAR UP, the comparison leans in favor of the GEAR UP program. The data agrees with HA1:
there is a significant relationship between participation in GEAR UP and college entrance for low
SES students. The data shows that GEAR UP has a significant positive effect on college
enrollment for low SES students that participate in the program.
For research question “two” of the study, data was pulled from the 2008 final report, the 2010
program performance report, and the 2005 evaluation of the New Jersey GEAR UP program.
The first set of data measures academic achievement through the amount of rigorous courses
taken by students. These courses also help to prepare the students for postsecondary education.
The report then looked at how the non-GEAR UP and GEAR UP students performed in the
courses with higher rigor. The report measured the success of the program through the GPA’s of
the students within these courses. In this case academic achievement was measured by GPA and
performance in above grade level courses. When looking at charts 3-1a through 3-1h even

THE INFLUENCE OF GEAR UP ON ACADEMIC ACHIEVEIMENT 46
though more GEAR UP students took courses with higher rigor there was no statistical
significant difference in the performance of GEAR UP and non-GEAR UP students in the above
average courses. The 2010 program performance report for the GEAR UP program focused in
the areas of pre-algebra, algebra, and high school graduation for GEAR UP students. Over a nine
year period of reported data the GEAR UP program has shown progressive increase in the
percent of students that have passed pre-algebra and algebra among participants. The data shows
that the GEAR UP program has continued to graduate 80% or greater of their participating
students from high school. The 2005 evaluation also looked at the two major performance tests
for the state of New Jersey in middle school and high school: the GEPA (Middle school) and the
HSPA (High school). The evaluation focused on school systems where GEAR UP students were
enrolled so that GEAR UP students could be evaluated against non-GEAR UP students in the
exact same environment. The GEAR UP students outperformed the non-GEAR UP students in
every subject of the state test. The GEAR UP students also showed noteworthy improvements in
science and mathematics on the tests. The evaluation showed a clear difference in academic
achievement for students that participated in the GEAR UP program. The archival data agrees
with HA2: there is a significant relationship between participation in GEAR UP and academic
achievement for low SES students. The data shows a positive relationship between participation
in the GEAR UP program and academic achievement for low SES students.
Discussion of the Implications
The positive findings from this study can be added to the literature on the GEAR UP
program’s success with lower SES students. As stated, there is not much research available on
the GEAR UP program; however, the results of this study determined that the GEAR UP program
is heading in the right direction for increasing academic achievement and college enrollment for

THE INFLUENCE OF GEAR UP ON ACADEMIC ACHIEVEIMENT 47
low SES students. The positive relation that GEAR UP has on college enrollment and academic
achievement for low SES students that participate in the program should be well noted. The
archival data shows that in time if the GEAR UP program is maintained, college enrollment and
academic achievement for low SES students will continue to improve. The improvement in
academic achievement and college enrollment that the GEAR UP program has made in the state
of New Jersey can be significantly impacted if the program is expanded to all of the low SES
districts within the state. The findings from this study have shown the strong positive impact
that the GEAR UP program has on low SES student’s academic achievement and college
enrollment. This study should promote increased interest in the GEAR UP program and its
effects on the participants in the program. The findings in this study show the greater need for
more research on the GEAR UP program and its participants. The data shows that the GEAR UP
program is opening doors and creating new opportunity for low SES students that has been
greatly needed. This program needs to be further studied to improve upon it, so that its already
successful numbers can greatly improve and the gap between lower, upper, and middle SES
students can be closed.
Recommendations for Future Research
More research needs to be conducted on new ways of collecting and analyzing the data
on the GEAR UP program. A study on the actual aids that are given to participants in the GEAR
UP program would provide a more detailed account for what services the program actually
offers. More research is needed on the partnerships within the GEAR UP program. It would have
been helpful to see how these partnerships are formed and maintained between the school
districts, local businesses, and institutions of higher education. More research is also needed on
THE INFLUENCE OF GEAR UP ON ACADEMIC ACHIEVEIMENT 48
how the funding works for these partnerships on each level and how they help to maintain the
program.

THE INFLUENCE OF GEAR UP ON ACADEMIC ACHIEVEIMENT 49
References
Adams, C., & singh, K. (1998). Direct and indirect effects of school learning variables on the
academic achievement of African American 10th graders. The Journal of Negro
Education, 67, 48-66.
Albee, G. W. (1982). Preventing psychopathology and promoting human potential. American
Psychologist, 37, 1043-1050.
Alberto F. Cabrere, R. D.-A. (2006). Increasing the college preparedness of at-risk students.
Journal of Latinos and Education, 5(2), 79-97.
Alexis, M. (1998). Assessing 50 years of African American economic status, 1940-1999. The
American Economic Review, 88, 368-375.
Amit Choudhury. (2009). Spearman rank correlation coefficient. Retrieved from
http://www.experiment –resources.com/spearman-rank-correlation-coefficient.html
Antonio, A. (2002). College nowledge for successful K-16 transitions. Paper presented at the
annual meeting of the American Educational Research Association, New Orleans , LA.
Astin, A. W. (1997). How good is your institution’s retention rate? Research in Higher
Education, 38, 647-658.
Ascher, C., & Fruchter, N. (2001). Teacher quality and student performance in New York City’s
low performing schools. Journal of Education for Students Placed at Risk, 6(3), 199-214.
Auerbach, s. (2004). Engaging latino parents in supporting college pathways: lessons from a
college access program. Journal of Hispanic higher education, 3(2), 125-145.
Azmitia, M., Cooper, C. R., Garcia, E. E., & Dunbar, N. D. (1996). The ecology of family
guidance in low-income Mexican American and European- American families. Social
Development, 5(1), 1-23.
Ballou, d. (2002). Sizing up test up test scores. Education Next, 2(2), 10-15.
Baker, A. (2005). Ask the expert: Perspectives on family involvement. The evaluation
exchange,10(4), 20-21
Baker, J. A. (1999). Teacher-student interaction in urban at-risk classrooms: differential
behavior, relationship quality, and student satisfaction with school. The Elementary
School Journal, 100, 57-70.
Baker, D. P., & Stevenson, D. L. (1986). Mothers’ strategies for children’s school
achievement: managing the transition to high school. Sociology of Education, 59, 156-
166.
Bar-on, R. (2005). The impact of emotional-social intelligence on subjective well-being.
Perspectives in Education, 23(2), 41-61.
Banks, J. A., Cookson, P., Gay, G., & Hawley, W. D. (2001). Diversity within unity: Essential
principles for teaching and learning in a multicultural society. Phi Delta Kappan, 83(3),
196-203. Retrieved from http://search.proquest.com/docview/218472190?accountid=34899
Banerjee, R., & yuill, N. (1999). Children’s understanding of self-presentational display rules:
Associations wit mental-state understanding. British Journal of Developmental Psychology,
17, 111-124.

THE INFLUENCE OF GEAR UP ON ACADEMIC ACHIEVEIMENT 50
Bauman, K. J., & Graf, N. L. (2003). Educational attainment 2000: census 2000 brief
(Publication N0. C2KBR-24). Washington DC: U.S. Census Bureau.
Bean, R. A., Bush, K. R., McKenry, P. C., & Wilson, S. M. (2003). The impact of parental
support, behavioral control, and psychological on the academic achievement and self-esteem
of African American and European American adolescents. Journal of Adolescent Research,
18(5), 523-541.
Beer, G. S. (2009). The impact of summer/academic year learning projects on the academic
achievement of student participants. Louisiana Tech University). ProQuest Dissertations
and Theses, Retrieved from
http://search.proquest.com/docview/304912392?accountid=34899
Beland, K. (2003). Eleven principles sourcebook: how to achieve quality education in P-
12 Schools. Washington, DC: Character Education Partnership.
Bell, D. (1973). The coming of post-industrial society. New York: Basic Books.
Berkowitz, M. W. & Bier, M. C. (2005). What works in character education: a report for
Policy Makers and opinion leaders. Retrieved from http://www.character.org
Berzin, S. C. (2010). Educational aspirations among low-income youths: Examining multiple
conceptual models. Children & Schools, 32(2), 112-123.
http://search.proquest.com/docview/210947020?accountid=34899
Berryman, S. E., & Baily, T. R. (1992). The double helix of education and the economy.
New York: Institute on Education and the Economy. Teachers College, Columbia
University.
Bernstein, L. (1992). Where is reform taking place? An analysis of policy changes and
School Climate. Educational Evaluation and policy Analysis, 14 297-302.
Bidwell, C. E. (1989). The meaning of educational attainment. Research in the sociology
of Education and Socialization, 8, 117-138.
Birritteri, A. (1998). Higher education: funding the future. New Jersey
Business,44(2), 28-28. Retrieved from ProQuest database.
Bluestone, C., & Tamis-LeMonda, C. S. (1999). Correlates of parenting styles in
predominantly working and middle-class African American mothers. Journal of
Marriage and Family,61(4), 881-894.
Bosacki, S. L. (2003). Psychological pragmatics in preadolescents: Sociomoral
Understanding, self-worth, and school behavior. Journal of Youth and Adolescence,
32(2), 141-155.
Bourdieu, P., & Passeron, J. C. (1977). Reproduction in education, society and culture.
Beverly Hills, CA: Sage.
Brackett, M. A., & Mayer, J. D. (2003). Convergent, discriminant, and incremental validity of
Competing measures of emotional intelligence. Personality and Social Psychology Bulletin,
29, 1147-1158.
Breneman, D., & Finney, J. (1997). The changing landscape: Higher education finance in the
1990s. in P. M. Callan & J. E. Finney (Eds.). Public and Private financing of higher
education. Phoenix, AZ: Oryx Press.
THE INFLUENCE OF GEAR UP ON ACADEMIC ACHIEVEIMENT 51
Brook, J. S., & Newcomb, M. D. (1995). Childhood aggression and unconventionality: Impact
on later academic achievement, drug use, and workforce involvement. Journal of Genetic
Psychology, 156(4), 393-410.
Bryan, T., Burstein, K., & Bryan, J. (2001). Students with learning disabilities: Homework
problems and promising practices. Educational Psychologist, 36(3), 176180.
Bronfenbrenner, U., (1979). The ecology of human development: experiments by nature and
design. Cambridge, MA: Harvard University Press.
Bruner, J. (1996). The culture of education. Cambridge, MA: Harvard University Press.
Buehler, C., & Gerard, J. (2002). Martial conflict, ineffective parenting, and children’s and
adolescent’s maladjustment. Journal of Marriage and the Family, 64, 78-92.
Burleson, D. A., Hallett, R. E., & Park, D. K. (2008). COLLEGE KNOWLEDGE: An
assessment of urban students awareness of college processes. College and University, 84(2),
10-17. Retrieved from ProQuest database.
Burd, s. (2003). Programs for disadvantaged students feud over their futures: Battle is
expected over plan to merge GEAR UP and TRIO. Chronicle of higher education, 49(27),
A21-A22.
Burd, s. (2006). Not much help for needy students in proposed budget for 2007. The chronicle of
higher education, 52(24). http://chronicle.com/weekly/v52/i24/24a02301.htm
Buller, G. E (2010). Perceptions of the impact of upward bound on academic success:
Case Studies of northeast latino students and graduates. (Doctoral Dissertation).
Retrieved from ProQuest database.
Cabrera, A. F., & La Nasa, S. M. (2001). On the path to college: Three critical tasks
facing America’s disadvantaged students. Research in Higher Education, 42(2), 119-149.
Cabrera, A. F., Deil-Amen. R., Prabhu. R., Terenzini. P. T., Chul. L., & Franklin Jr., R.
E. (2006). Increasing the College Preparedness of At-Risk Students.
Journal of Latinos & Education, 5(2), 79-97.
Cairns, L. G. (1987). Behavior problems. In M. J. Dunkin (Ed), International
Encyclopedia of Teaching and teacher education 446-452 New York: Pergamon.
Callahan, K., Rademacher, J. A., & Hildreth, B. L. (1998). The effect of parent
participation in strategies to improve the homework performance of students who are at
risk. Remedial and Special Education, 19(3), 131-141.
Catalano, R. R, Berglund, M. L., Ryan, J. A. M., Lonczak, H. S., & Hawkins, J. D.
(2002). Positive youth development in the United States: research findings on evaluations
of positive youth development programs. Prevention and treatment Retrieved from
http://journals.apa.org
Carroll, C. (1989). College persistence and degree attainment for 1980 high school
graduate:Hazards for transfeers, stopouts, and part-timers.Whaston, DC: U.S.
Department of Education, National Center for Education Statistics (NCES).
Choy, S. (2001). Students who parents did not go to college: Postsecondary access, persistence
And attainment. Washington, DC: National Center for Education Statistics (NCES).
Choy, S. P. (2000). Debt burden four years after college. Washington, DC: U. S. Department of
Education National Center for Educational Statistics.
Clauss-Ehlers, C., & Wibrowski, C. (2007). Building educational resilience and social support:
The effects of the educational opportunity fund program among first- and second-
THE INFLUENCE OF GEAR UP ON ACADEMIC ACHIEVEIMENT 52
generation college students. Journal of College Student Development, 48(5), 574-584.
Retrieved from http://search.proquest.com/docview/195181627?accountid=34899
Clark, M. L. (1991). Social identity, peer relations, and academic competence of African
American adolescents. Education and Urban Society, 24, 41-52.
Clark, R. M. (1983). Family life and school achievement: Why poor Black children succeed or
fail. Chicago: University of Chicago Press.
Cohen, J. (2001). Social emotional education:core principles and practices. New York:
Teachers College Press, p. 3-29.
Cohen, J. (2006). Social, emotional, ethical, and academic education: Creating a climate for
learning, participation in democracy, and well-being. Harvard Education Review, 76(2),
201–237.
Coleman, J. S. (1988). Social capital in the creation of human capital. American Journal of
Sociology, 94(Supplement), 95-120.
Coleman, j. S., Cambell, E. Q., Hobson, c. F., McPartland, J. M., Mood, A. M., Weinfeld, f. D.,
& York, R. L. (1966). Equaliy of educational opportunity study. U. S. Department of
Education Washington, DC: U. S. Government Printing Office.
Conley, D. (1999). Being black, living in the red: Race, wealth, and social policy in America.
Beerkeley, CA: University of California Press.
Cooper, H., & Valentine, J. C. (2001). Using research to answer practical questions about
homework. Educational Psychologist, 36(3), 143-154.
Covington, M. V. (2000). Goal theory, motivation, and school achievement: An integrative
review. Annual Review of Psychology, 51, 171-200.
The College Board. (2000). Trends in student aid 1999. New York: Author.
Daire, A. P., LaMothe, S., & Fuller, D. P. (2007). Differences between Black/African american
and white college students regarding influences on high school completion, college
attendance, and career choice. The Career Development Quarterly, 55(3), 275-279.
Retrieved from http://search.proquest.com/docview/219448410?accountid=34899
Dahl, G., & Lochner, L. (2005). The impact of family income on child achievement (Discussion
Paper No. 1305-05). Madison, WI: Institute for Research on Poverty.
Dalaker, J., & Proctor, b. (2000). Poverty in the United States: 1999: Current population reports
(Series P-60 No.21). Washington, DC: U. S. Government Printing Office.
Darling-Hammond, L. (2000). Teacher quality and student achievement: a review of state policy
evidence. Education Policy Analysis Archives, 8(1), 1-44.
Darling-Hammond, L. (2004). From “separate by equal” to “nochild left behind”: The collision
of new standards and old inequalities. In D. Meier & G. Wood (Eds.), Many chlidren left
behind (pp. 3-32). Boston: Beacon Press.
Day, C. (2002). The challenge tobe the best: Reckless curiosity and mischievous motivation.
Teachers and Teaching: Theory and Practice, 8(3), 421-434.
Department of Education (DOE). (2006). Fiscal year 2006 application for partnership grants
under the GEAR UP. http://www.ed.gov
Department of Education (DOE). (2008). Gaining early awareness and readiness for
undergraduate programs: 2008 application for state grant. http://www.ed.gov
Deslandes, R., Royer, E., Potvin, P., & Leclerc, D. (1999). Patterns of home and school
parternership for general and special education students at the secondary level.
Exceptional Children, 65(4), 496-506.

THE INFLUENCE OF GEAR UP ON ACADEMIC ACHIEVEIMENT 53
Dalpe, J. K. (2008). The relationship between academic and non-academic preparation and
postsecondary education outcome by students in the state gaining early awareness and
readiness for undergraduate programs (GEAR UP) project. University of Nevada, Reno).
ProQuest Dissertations and Theses, Retrieved from
http://search.proquest.com/docview/275862015?accountid=34899
Dalton, J. H., Elias, M. J., & Wandersman, A. (2007). Community psychology: Linking
individuals and communities (2nd
ed.). Belmont, CA: Wadsworth.
Delgado-Gaitan, C. (1994). Consejos: the power of cultural narratives. Anthropology &
Education Quarterly 25(3), 298-316.
Dobbs, M. (2004). Universities record drop in black admissions. Retrieved Oct 2010, from
Washington Post: www.washingtonpost.com
Du Bios, W. E. B. (1953). The souls of Blak Folk. New York: Blue Heron.
Dunne, J., & Hogan, P. (2004). Education and practice: upholding the integrity of teaching and
Learning. Oxford, England: Blackwell.
DuBois, D. L., Felner, R. D., Brands, S., Adan, A. M., & Evans, E. G. (1992). A prospective
study of life stress, social support, and adaptation in early adolescence. Child
Development, 64, 542-557.
Easton-Brooks, D., & Davis, A. (2007). Wealth, traditional socioeconomic indicators, and the
achievement debt. The Journal of Negro Education, 76(4), 530-541.
http://search.proquest.com/docview/222081411?accountid=34899
Eccles, J., Early, D., Frasier, K., Belansky, E., & McCarthy, K. (1997). The relation of
connection, regulation, and support for autonomy to adolescents’ functioning. Journal of
Adolescent Research, 12, 263-286.
Eccles, J. S., Roeser, R., Wigfield, A., & Freedman-Doan, C. (1999). Academic and motivational
pathways through middle school, In L. Balter & C. S. Tamler-LeMonda (Eds.), Child
psychology: A handbook of contemporary issues (pp. 287-317). Philadelphia: Psychology
Press.
Elias, M., Zins, J. E., Weissberg, R. P., Fey, K. S., Greemberg, M. T., Haynes, N. M., Kessler,
R., (1997). Promting social and emotional learning: a guide for educators. Alexandria,
VA: Association for Supervision and Curriculum Development.
Elias, M. J. (2001). Prepare children for the tests for life, not a life of tests. Education Week,
21(4), 40-40. Retrieved from
http://search.proquest.com/docview/202698430?accountid=34899
Elias, M. J., & Arnold, H. A. (2006). The educator’s guide to emotional intelligence and
academic achievement: social-emotional learning in the classroom. Thousand Oaks, CA:
Crowin Press.
Elias, M. J., & Haynes, N. M. (2008). Social competence, social support, and academic
achievement in minority, low-income, urban elementary school children. School
Psychology Quarterly, 23(4), 474. Retrieved from
http://search.proquest.com/docview/195361304?accountid=34899
Elliott, S. N., Malecki, C. K., & demaray, M. K. (2001). New directions in social skills
assessment and intervention for elementary and middle school students. Exceptionality, 9,
19-32.

THE INFLUENCE OF GEAR UP ON ACADEMIC ACHIEVEIMENT 54
Ellefsen, G., & Beran, T. N. (2007). Individuals, families, and achievement: A comprehensive
model in a canadian context. Canadian Journal of School Psychology, 22(2), 167-181.
http://search.proquest.com/docview/224364451?accountid=34899
Engle, J., Bermeo, A., & O’Brien, C. (2006). Straight from the source: what works for first-
Generation college students. Washington, DC: the Pell Institute.
Epstein, J. L., & Jansorm, N. R. (2004). School, family, and community partnerships link the
plan. Education digest, 69(6), 19-23.
Esposito, C. (1999). Learning in urban blight: School climate and its effect on the school
performance of urban, minority, low-income children. School psychology Review, 28,
365-377.
Estell, D. B., cairns, R. B., Farmer, T. W., & Cairns, B. D. (2002). Aggression in inner-city early
elementary classroom: individual and peer-group configurations. Merrill-Palmer
Quarterly, 48, 52-76.
Fabes, R. A., eisenberg, N., Karbon, M., Bernzweig, J., speer, A. L., & Carlo, G. (1994).
Socialization of children’s vicarious emotional responding and prosocial behavior:
Relations with mother’s perceptions of children’s emotional reactivity. Developmental
Psychology, 30, 44-55.
Faircloth, B.S., & Hamm, J. V. (2005). Asense of belonging among high school students
representing four ethnic groups. Journal of Youth and Adolescence, 34(4), 293-309.
Farmer, H. S., & Chung, Y. B. (1995). Variables related to career commitment, mastery
motivation, and level of career aspiration among college students. Journal of Career
Development, 21(4), 265-278.
Fehrmann, P. G., Keith, T. Z., & Reimers, T. M. (1987). Home influence on school learning:
Direct and indirect effects of parental involvement on high school grades. Journal of
Educational Research, 80(6), 330-337.
Ferguson, R. F. (1998). Can schools narrow the black-white test score gap? In. C. Jencks & M.
Phillips (Eds.), The black-white test score gap (pp. 318-374). Washington: Brookings.
Fenske, R. H., Porter, J. D., & DuBrock, C. P. (2000). Tracking financial aid and persistence of
women, minority, and needy students in science, engineering, and mathematics. Research in
Higher Education, 41(1), 67-94.
Fram, M. S., Miller-Cribbs, J., & Horn, L. V. (2007). Poverty, race, and the contexts of
achievement: Examining educational experiences of children in the U.S. south. Social Work,
52(4), 309-19. Retrieved from
http://search.proquest.com/docview/215269588?accountid=34899
Fenske, R.H., Geranios, C. A., Keller, J. E., & Moore, D. E. (1997). Early intervention
programs: opening the door to higher education. Washington, DC: ERIC Clearinghouse
Fuligni, A. J. (2001). Family obligation and the academic motivation of adolescents from
Asian Latino American, and European backgrounds. New directions for Child and
Adolescent Development, 94, 61-76.
Garcia-Reed, P., Reid, R. J., & Peterson, N. A. (2005). School engagement of Latino
Youth in an urban middle school context: Valuing the role of social support. Education and
Urban Society, 37(3), 257-275.
Gardner, D. S. (2009). Sustainability of parent involvement in gaining early awareness and
readiness for undergraduate programs. University of Illinois at Urbana-Champaign).
THE INFLUENCE OF GEAR UP ON ACADEMIC ACHIEVEIMENT 55
ProQuest Dissertations and Theses,
http://search.proquest.com/docview/304898461?accountid=34899
Gandara, P. (1995). Over the ivy wall: The educational mobility of low-income chicanos.
Albany: state University of New York Press.
Gandara, P. (1998). Capturing Latino students in the academic pipeline. California
Policy Seminar Brief Series, 10(3). Berkeley: University of California Latino/ Latino
Policy Research Program.
Gandara, P. (2002). A study of high school Puente: What we have learned about
Preparing Latino youth for postsecondary education. Educational Policy, 16(4), 474-495.
Gandara, P., & Bial, D. (1999). Paving the way to higher education: K-12 intervention
Programs for underrepresented youth (Draft). Washington, DC: National Postsecondary
Education Cooperatives, National Center for Education Statistics.
GEAR UP California. (2011). Gear up. Retrieved from http://www.castategearup.org/
Gibson, D. M., & Jefferson, R. N. (2006). The effect of perceived parental involvement
And the Use of growth-fostering relationships on self- concept in adolescents
participating in GEAR UP. Adolescence, 41(161), 111-125.
Gladieux, L. E., & swail, W. S. (1999). Financial aid is not enough: Improving the odds of
college success. In J. E. King (Ed.), Financing a college education: How it works, how
it’s changed, pp. 177-197. Whasington, DC:ACE/Oryx Press.
Gladieuz, L. E., & Swail, W. (1998). Postsecondary education: Student success, not just access.
In S. Halperin, S. (Ed.), the forgotten half revisited (pp. 101-144). Washington, DC:
American Youth Policy Forum.
Guiffrida, D. (2005). Othermothering as a framework for understanding african american
students' definitions of student-centered faculty. Journal Of Higher Education, 76(6),
701-723.
Gonzales, N. A., Cauce, A. M., Friedman, R. J., & Mason, C. A. (1996). Family, peer, and
neighborhood influences on acaddemic achievement among African – American
adolescents: one-year prospective effects. American Journal of Community Psychology,
24, 365-387.
Greenberg, M. T., Weissberg, R. P., O’Brien, M. U., Zins, J. E., Fredericks, L., Resnik, H., &
Elias, M. J. (2003). Enhancing school-based prevention and youth development through
coordinated social, emotional, and academic learning. American Psychologist, 58, 466-
474.
Greenfield, P. M. (2009). Limking social change and developmental change: Shifting pathways
of human development. Developmental Psychology, 45(2), 401-418.
Greenfield, P. M., Quiroz, B., & Raeff, C. (2000). Cross-cultural conflict and harmony in the
social construction of the child. In S. Harkness, C. Raeff, & C. M. Super (Eds.)
Haggerty, R. J., Sherrod, L. R., Garmezy, N., & Rutter, M. (1994). Stress, risk, and resilience in
children and adolesecents: processes, mechanisms, and interventions. New York:
Cambridge University Press.
Halpern, R. (1990). Poverty and early childhood parenting: toward a framework for intervention.
American Journal of Orthopsychiatry, 60, 6-17.
Hanson, S. L. (1994). Lost talent: Unrealized educational aspirations and expectations among U.
S. youths. Sociology of Education, 67(3). 159-183.

THE INFLUENCE OF GEAR UP ON ACADEMIC ACHIEVEIMENT 56
Harter, S. (1990). Developmental differences in the nature of self-representations: Implications
for the understanding, assessment and treatment of maladaptive behavior. Cognitive
Therapy Research, 14, 113-142.
Harter, S., 7 Whitesell, N. R. (1996). Multiple pathways to self-reported depression and
psychological adjustment among adolescents. Development and Psychopathology, 8,
761-777.
Haynes, N. M., Emmons, C., & Ben-Avie, M. (1997). School climate as a factor in student
adjustment and achievement. Journal of Educational and Psychological Consultation, 8
321-329.
Hearn, J. C. (1992). Emerging variations in postsecondary attendance patterens: An investment
of part-time, delayed, and non-degree enrollment. Research in Higher Education, 33(6),
657-687.
Heaven, P. C., Mak, A., barry, J., & Ciarrochi, J. (2002). Personality anf family influences on
adolescent attitudes to school and self-rated academic performance. Personality &
Individual Differences, 32, 453-462.
Heal, K. H., (1978). Misbehavior among school children: The role of the school in strategies for
prevention. Policy and Politics, 6, 321-333.
Heller, D. E. (1997). Student price response in higher education: An update to Leslie and
Brinkman. Journal of Higher Education, 68, 624-659.
Heller, D. (2002). Condition of access: Higher education for lower income students.
Westport, CT. Praeger.
Heine, S., Kitayama, S., & Lehman, D. (2001). Cultural differences in self- evauation: Japanese
readily accept negative self-relevant information. Journal of Cross-Cultural Psychology,
32(4), 434-443.
Henderlong, J., & Lepper, M. R. (2002). The effects of praise on children’s intrinsic motivation:
A review and synthesis. Psychological Bulletin, 128(5), 774-795.
Herman-Stahl, M., & Petersen, A. C. (1996). The protective role of coping and social resources
for depressive symptoms among young adolescents. Journal of youth and Adolescence,
25, 733-753.
Hill, J. P., & Holmbeck, G. N. (1986). Attachment and autonomy during adolescence, Vol. 3.
Greenwich, CT: Jai Press.
Hill, N. E., & Torres, K. (2010). Negotiating the American dream: The paradox of aspirations
and achivement among Latino students and engagement between their families and
schools. Journal of Social Skills, 66(1), 95-112.
Hudley, C., & Daoud, A. M. (2008). Cultures in contrast: Understanding the influence of school
culture on student engagement. In C. Hudley & A. E. Gottfried (Eds.), Academic
motivation and the culture of school in childhood and adolescence (pp. 187-215). New
York, NY: Oxford University Press.
Hughes, M., & Demo, D. H. (1989). Self-perceptions of Black Americans: Selfesteem and
personal efficacy. American Journal of Sociology, 95, 132-159.
Hurn, C. J. (1993). The limits and possibilities of schooling: An introduction to the sociology of
education (3rd
ed.). Boston: Allyn and Bacon.
Hoff, D. L., & Mitchell, S. N. (2006). Pay-to-play: Fair or foul? Phi Delta Kappan, 88(3), 230-
234. Retrieved from http://search.proquest.com/docview/218539050?accountid=34899

THE INFLUENCE OF GEAR UP ON ACADEMIC ACHIEVEIMENT 57
Hoge, D. R., Smit, E. K., & Hanson, S. L. (1990). School experiences predicting changes in self-
esteem of sixth- and seveth-grade students. Journal of Educational Psychology, 82, 117-
127.
Hossler, D., Braxton, J., & Coopersmith, G. (1989). Understnading student college choice. In
John C. Smart (Ed.), Higher education: Handbook of theory and research (Vol. 5, pp.
231-288). New York: Agathon Press.
Hossler, D., Schmit, J., & Vesper, N. (1999). Going to college: How social, economic, and
educational factors influence the decisions studnets make. Baltimore: Johns Hopkins
University Press.
Hwang, Y. S., Echols, C., & Vrongistinos, K. (2002). Multidimensional academic motivation of
high achieving African American students. Clloge student Journal, 36, 544-554.
Hwang, Y. S., Echols, C., Wood, R., & Vrongistinos, K. (2001). African American college
students motivation in education. Paper presented at the annual meeting of the American
EducationalResearch Association, Seattle, WA.
Irvin, M., Farmer, T., Leung, M.-C., Thompson, J., & Hutchins, B. (2010). School, community,
and church activities: Relationship to academic achievement of low-income African
American early adolescents in the rural deep south. Journal of Research in Rural
Education (Online), 25. 1-21.
Jackson, G. A. (1990). Financial aid, college entry, and affirmative action. American Journal of
Education, 98(4), 523-551.
Johnson, P. (2000). Officials look to close minority graduation gap. The Record. A. 01-
A01. Retrieved from http://search. Proquest.com
Johnson, J. R. (2010). An analysis of the impact of intervention programs on the completion I
rate of Hispanic students in high school. (Tarleton State University). ProQuest
Dissertations and Theses, Retrieved from
http://search.proquest.com/docview/520111829?accountid=34899
Jimenez-castellanos, O. (2010). Relationship between educational resources and school
achievement: A mixed method intra-district analysis. The Urban Review, 42(4), 351-371.
doi:10.1007/s11256-010-0166-6
Jun, A., & Colyar, J. (2001). Parental guidance suggested: Family involvement in college
preparation programs. In W. g. Tierney & L. S. Hagedorn (Eds.), Increasing access to
college: Extending possibilities for all students (pp. 195-216). Albany: State University of
New York Press.
Kahlenberg, R. (2004). America’s untapped resource: Low-income students in higher education
New York: Century Foundation Press.
Kaplan, A., Karabenick, S., & De Groot, E. (2009). Introduction: Culture, self, and motivation:
The contribution of Martin L. Maeher to the fields of achievement motivation and
educational psychology. In A. Kaplan, E. Karabenick, & E. De Groot (Eds.), Culture, self,
and motivation: Essays in honor of Martin L. Maehr (pp. vii-xxi). Charlotte, NC:
Information Age Publishing.
Kia-Keating, M. (2007). Belonging in connection to school in resettlement: Young refugees,
school belonging , and psychosocial adjustment. Clinical Child Psychology and Psychiatry,
12 (1), 29-43.
Kane, J., & Spizman, L. M. (1994). Race, financial aid awards and college attendance: Parents
and geography matter. American Journal of Economics and Sociology, 53(1), 73-97.

THE INFLUENCE OF GEAR UP ON ACADEMIC ACHIEVEIMENT 58
Kane, T. J. (1994). College entry by blacks since 1970: The role of college costs, family
background, and the returns to education. Journal of Political Economy, 105(5), 878-911.
Karen, D. (1991). The politics of class, race, and gender: Access to higher education in the
United States, 1960-1986. American Journal of Education, 99(2), 208-237.
Keating, L. M., Tomishima, M. A., Foster, S., & Alessandri, M. (2002). The effects of a
mentoring program on at-risk youth. Adolescence, 37(148), 717-734.
Kyle, D. W. (2011). Families goals, school involvement, and childrens academic achievement: A
follow-up study thirteen years later. School Community Journal, 21(2), 9-24.
http://search.proquest.com/docview/912504982?accountid=34899
Knox, M., Funk, J., Elliott, R., Bush, E. G. (1998). Adolescents’ possible selves and their
relationships to global self-esteem. Sex Roles, 39(1/2), 61-80.
Kobus, K., & Reyes, O. (2000). A descriptive, study of urban Mexican American adolescents’
perceived stress and coping. Hispamic Journal of Behavioral Sciences, 22(2), 163-178.
Kozol, J. (2005). Apartheid in America? Phi Delta Kappan, 87, 264-275.
Krei, M. S. (1998). Intensifying the barriers: the problem of inequitable teacher allocation in
low-income urban schools. Urban Education, 33(1), 71-94.
Kuperminc, G. P., Leadbeater, B. J., Emmons, C., & Blatt, S. J. (1997). Perceived school climate
and difficulties in the social adjustment of middle school students. Applied Development
Science, 1(2), 76-88.
Lankford, H., Loeb, S., & Wyckoff, J. (2002). Teacher sorting and the plight of urban schools: a
descriptive analysis. Educational Evaluation and Policy Analysis, 24(1), 37-62.
Lareau, A. (1989). Home advantage: Social class and parental intervention in elementary
education. New York: Falmer.
Lee, C. D. (1993). Culturally responsive pedagogy and performance-based assessment. The
Journal of Negro Education, 67, 268-279.
Lee, V. E., & Burkam, D. T. (2002). Inequality at the starting gate. Washington, DC: Economic
Policy Institute.
Leppel, K. (2002). Similarities and differences in the college persistence of men and women. The
Review of Higher Education, 4, 433-450.
Leslie, L. L., & Brinkman, P. T. (1987). Student price response in higher education: the student
demand studies. Journal of Higher Education, 58(2), 181-203.
Leslie, L. L., & Brinkman, P. (1988). The economic value of higher education. New York:
Macmillan.
Levitt, M. J., & Levitt, J. L. (1994). Social support and achievement in childhood and early
adolescence: A multicultural study. Journal of Applied Developmental Psychology, 15, 207-
222
Li, J. (2002). A cultural model of learning: Chinese “heart and mind for wanting to learn.”
Journal of Cross-Cultural Psychology, 33(3), 248-269.
Lopez, G. (2001). The value of hard work: Lessons on parent involvement from an (im)migrant
household. Harvard Educational Review, 71(3), 416-437.
Lopez, S. J., & Snyder, C. R. (2003). Positive psychological assessment: a handbook of models
and measures. Washington, DC: American Psychological Association.
Luthar, S. S. (1995). Social competence in the school setting: prospective cross-domain
associations among inner-city teens. Child Development, 66, 416-429.

THE INFLUENCE OF GEAR UP ON ACADEMIC ACHIEVEIMENT 59
Luster, T., & McAdoo, H. P. (1995). Factors related to self-esteem among African American
youths: A secondary analysis of the High/Scope Perry preschool data. Journal of Adolescent
Research, 5, 451-467.
Ma, X. (2001). Stability of socio-economic gaps in mathematics and sience achievement among
Canadian schools. Canadian Journal of Education, 26(1), 97-118.
Maehr, M. L., & Yamaguchi, R. (2001). Cultural diversity, student motivation and achievement.
In F. Salili, C. Chiu, & Y. Hong (Eds.), Student motivation: The culture and context of
learning (pp. 121-148). New York, NY: Kluwer Academic/ Plenum.
Mangiante, E. M., & Silva. (2011). Teachers matter: Measures of teacher effectiveness in low-
income minority schools. Educational Assessment, Evaluation and Accountability, 23(1),
41-63. doi:10.1007/s11092-010-9107-x
Mannuzza, S., Klein, R. G., Bessleer, A., Malloy, P., & Hynnes, M. E. (1997). Educational and
occupational outcomes of hyperactive boys grown up.Journal of the American Academy of
Child & Adolescent Psychiatry, 36, 1222.
Manski, C. F., &Wise, D. A. (1983). College Choice in America. Cambridge, MA: Harvard
University Press.
Marples, R. (1999). Aims of education. New York: Routledge.
Markus, H. R., & Kitayama, S. (1991). Culture and the self: Implications for cognition, emotion,
and motivation. Psychological Review, 98, 224-253.
Masten, A. S. (1994). Resilience in individual development: successful adaptation despite risk
and adversity. In M. C. Wang & E. W. Gordon (Eds.), Educational Resilience in Inner-City
America: Challenges and Prospects (pp. 3-26). Hillsdale, NJ: Erlbaum.
Matos, L., Lens, W., & Vansteenkiste, M. (2009). School culture matters for teachers and
students achievement goals. In A. Kaplan, S. Karabenick, & E. De Groot (Eds.), Culture,
self, and motivation: Essays in honor of Martin L. Maehr (pp. 161- 181). Charlotte, NC:
Information Age Publishing.
Maton, K. I., Teti, D. M., Corns, K. M., Vieira-Baker, C. C., Lavine, J. R., Gouze, K. R., et al.
(1996). Cultural specificity of support sources, correlates and context: three studies of
African American and Caucasian youth. American Journal of Community Psychology, 24,
551-587.
McCaffrey, D. F., Lockwood, j. R., Koretz, D., Louis, T. A., & Hamilton, J. (2004). Models for
value added modeling of teacher effects. Journal of Educational and Behavioral Statistics,
29(1), 67-101.
McClafferty, K. A., McDonough, P. M., & Fann, A. (2001). Parent involvement in the college
planning process. Paper presented at the annual conference of the Association for the study
of Higher Education, Richmond, VA.
McDonough, P. (1997). Choosing colleges: How social class and schools structure opportunity.
Albany: State University of New York Press.
McDonough, P., Perez, L., Fann, A., Tobolowsky, B., Smith, M., Teranish, R., et al. (2000).
Parent involvement programs in education: Best research and practices. Los Angeles:
University of California, Los Angeles, GEAR UP State Support Systems for Families
Implementation Committee.
McFarlane, A. H., Bellissimo, A., & Norman, G. R. (1995). The role of family and peers in
social self-efficacy: links to depression in adolescence. American Journal of
Orthopsychiatry, 65, 402-410.

THE INFLUENCE OF GEAR UP ON ACADEMIC ACHIEVEIMENT 60
McPherson, M. S., & Schapiro, M. O. (1991). Does student and affect college enrollment? New
evidence on a persistent controversy. American Economic Review, 81(1), 309-318.
Mehan, H., Villanueva, I., Hubbard, L., & Lintz, A. (1996). Constructing school success: the
consequences of untracking low-achieving students. New York: Cambridge university Press.
Meyer, R. (1997). Value-added indicators of school performance: a primer. Economics of
Education Review, 16(3), 283-301.
Michelli, N. M., & Reiser, D. L. (2005). Teacher education for democracy and social justice.
New York: Routledge.
Miller, J. B. (1988). Connections, disconnections and violations. Work in Progress, No. 33.
Wellesley, MA: Stone Center Working Paper Series.
Miller, J. B., & Stiver, I. P. (1997). The healing connection: How women form relationships in
therapy and in life. Boston, MA: Beacon Press.
Moll, L., Amanti, C., Neff, D., & Gonzalez, n. (1992). Funds of knowledge for teaching: Using a
qualittive approach to connect homes and classrooms. Theory Into Practice, 31(2), 132-141.
Moline, A. (1987). Financial aid and student persistence: An Application of causal
Modeling. Research in Higher Education, 27(1), 15-38.
Moran, K. (2008). Examining the mathematical preparedness of first year college students
entering college directly from traditional high schools in connecticut. Research & Teaching
in Developmental Education, 25(1), 30-44. Retrieved from
http://search.proquest.com/docview/886531403?accountid=34899
Mortenson, T. (2001). Trends in college participation by family income: 1970 to 1999.
Postsecondary Education OPPORTUNITY, 1-8.
Mumper, M. (1996). Removing college price barriers. Albany: SUNY Press.
Murdock, T. (1990). Financial aid and persistence: an integrative review of the
Literature. Paper presented to the National Association of Student Personnel
Administrators, St. Louis.
Murtaugh, P., Burns, L., & Schuster, J. (1999). Predicting the retention of university
Students. Research in Higher Education, 40, 355-371.
Myers, S. L., Jr., Kim, H., & Mandala, C. (2004). The effect of school poverty on racial gaps in
test scores: The case of the Minnesota Basic Standards tests. The journal of Negro
Education, 73, 81-98.
Najaka, S. S., Gottfredson, D. C., & Wilson, D. B. (2002). A meta-analytic inquiry into the
relationship between selected risk factors and problem behavior. Prevention Science, 2,
257-271.
National Council for Community and Education Partnerships. (2004). Ensuring student success
through k-16 partnerships. Retrieved from http://www.edpartnerships.org
National Council for Community and Education Partnerships. (2009). GEAR UP.
Retrieved from http://www.edpartnerships.org
NCES. (2002). The nation’s report card. Washington, DC: U> S. Government Printing
Office. National Center for Education Statistics. (2010). Data Reports.
Retrieved from http://nces.ed.gov
Noddings, N. (2003). Happiness and education. Cambridge, England: Cambridge
University Press.
THE INFLUENCE OF GEAR UP ON ACADEMIC ACHIEVEIMENT 61
Nellum, C. J. (2008). In search of success: Examining motivators for persistence among upper-
division low socioeconomic status (SES) students. California State University, Long Beach).
ProQuest Dissertations and Theses, , n/a.
http://search.proquest.com/docview/304831801?accountid=34899
Ogbu, J. U. (1991). Low school performance as an adaptation: the case of blacks in
Stockton CA. In M. A. Gibson & J. U. Ogbu (Eds), Minority status and schooling: A
comparative study of immigrant and involuntary minorities (pp. 249-285). New York:
Garland.
Orfield, G. (1992). Money, equity, and college access. Harvard Educational Review,
62(3), 337-372.
Orr, J. A. (2003). Black-white differences in achievement: The importance of wealth.
Sociology of Education 76, 281-304.
Osterman, K. F. (2000). Students need for belonging in the school community. Review of
Educational Research, 70(23), 323-367.
Otsuka, S., & Smith, I. D. (2005). Educational applications of the expectancy-value
Model of achievement motivation in the diverse culture contexts of the west and the east.
Change: Transformations in Education, 8(1), 91-109.
Pantages, T. J., & Creedon, C. F. (1978). Studies of college attrition: 1950-1975.
Review of Educational Research, 48(1), 49-101.
Pascarella, E., & Terenzini, P. (1998). Studying college students in the 21st century:
Meeting challenges. The Review of Higher Education, 21, 151-165.
Paulsen, M. B., & St John, E.,P. (2002). Social class and college costs: Examining the financial
nexus between college choice and persistence. The Journal of Higher Education, 73(2),
189-236. Retrieved from http://search.proquest.com/docview/205338910?accountid=34899
Paulsen, M. B. (1991). College tuition: Demand and supply determinants from 1960 to
1986. Review of Higher Education, 14, 339-358.
Paulsen, M. B. (2000). Economic perspectives on rising college tuition: A theoretical
and empirical exploration. In J. C. Smart (Ed.), Higher education: Handbook of theary
and research (Vol. 15, pp. 39-104). New York: Agathon.
Peebles-Wilkins, W. (2007). Why early intervention? Children & Schools, 29(1), 45-46.
Retrieved from ProQuest database.
Perreira, K. M., Fuligni, A., & Potochnick, S. (2010). Fitting in: The roles of social acceptance
and discrimination inshaping the academic motivations of Latino youth in the U. S.
Southwest. Journal of Social Issues, 66(1), 131-153.
Peltier, G., Laden, R., & Matranga, M. (1999). Student persistence in college: A review of
research. Journal of College Student Retention, 1 357-376.
Peng, S., & Fetters, W. (1978). Variables involed in withdrawal during the first two years of
college: Preliminary findings from the national longitudinal study of school class of 1972.
American Education Research Journal, 15(3), 361-372.
Peterson, A. C., Leffert, N., Graham, B., Alwin, J., & Ding, S. (1997). Promoting mental health
during the transition into adolescence. In J. Schulenberg, J. L. Maggs & K. Hurrelman
(Eds.), Health risks and developmental transitions during adolscence (pp. 471-597). New
York: Cambridge University Press.

THE INFLUENCE OF GEAR UP ON ACADEMIC ACHIEVEIMENT 62
Perna, L. W. (2000). Differences in the decision to attend college among African Americans,
Hispanics, and Whites. Journal of Higher Education, 71(2), 117-141.
Perna, L. W. (2002). Precollege outreach programs: Characteristics of programs serving
historically underrepresented groups of students. Journal of College Student Development,
43(1), 64-64. Retrieved from
http://search.proquest.com/docview/195176874?accountid=34899
Perna, L.W., Fenske, R.H., & Swail, W.S. (2000). Sponsors of early intervention programs. Eric
review: early intervention: Expanding access to higher education, 8(1), 15-18.
Peterson, C., & Seligman, M. (2004). Character strengths and virtues: a handbook and
Classification. New York: Teachers College Press.
Peterson, C., Park, N., & Seligman, M. E., (2005). Orientation to happiness and life
Satisfaction: The full life versus the empty life. Journal of Happiness Studies, 6(1), 25-41.
Perez, L. X. (1999). The interface of individual, structural, and cultural constructs in
Latino parents’ effort to support their children in planning for college. UCLA Graduate
School of Education & Information Sciences.
Pintrich, P. R., & Schunk, D. H. (1996). Motivation in education: Theory, research, and
applications. Upper Saddle River, NJ: Prentice Hall.
Plank, S. B., & Jordan, W. J. (2001). Effects of information, guidance, and actions on
postsecondary destinations: A study of talent loss. American Educational Research Journal,
38(4), 947-947. Retrieved from
http://search.proquest.com/docview/200364843?accountid=34899
Pogrow, S. (2006). Restructuring high-poverty elementary schools for success: a description of
the Hi-Perform school design. Phi Delta Kappan, 88, 223-229.
Post, D. (1990). College-going decision by Chicanos: The politics of misinformation.
Educational Evaluation and Policy Analysis, 12(2), 174-187.
Powell, K. C. (2004). Developmental psychology of adolescent girls: Conflicts and identity
issues. Education, 125(1), 77-87.
Provitera McGlynn, A. (2001). The minority graduation gap: New Jersey tackles the problem.
The Hispanic Outlook in Higher Education, II(14), 24-24. Retrieved from Quarterman, J.
(2008, DEC). College student journal. Retrieved from EBSCO Host database.
Quarterman, J. (2008). An assessment of barriers and strategies for recruitment and retention of
diverse graduate student population. College Student Journal, 42(4), 947-967.
Ramburuth, P., & Härtel, C.E. J. (2010). Understanding and meeting the needs of students from
low socioeconomic status backgrounds. Multicultural Education & Technology Journal,
4(3), 153-162. doi:10.1108/17504971011075156
Rand Corporation. (2004). Focus on the wonder years: challenges facing the American middle
school. Retrieved from http://www.rand.org
Raudenbush, S. W. (2004). What are value-added models estimating and what does this imply
for statistical practice? Journal of Educational and Behavioral Statistics, 29(1), 121-129.

THE INFLUENCE OF GEAR UP ON ACADEMIC ACHIEVEIMENT 63
Reason, R. (2001). Student variables that predict retention: Recent research and new
developments. NASPA Journal, 40(4), 172-191.
Reese, L., Balzano, S., Gallimore, r., & Goldenberg, C. (1995). The concept of education: Latino
family values and America schooling. International Journal of Educational Research,
23(1), 57-81.
Reyes, O., Gillock, K. L., Kobus, K., 7 Sanchez, B. (2000). A longitudinal examination of the
transition into senior high school for adolescents from urban, low-income status, and
predominantly minority backgrounds. American Journal of Community Psychology, 28,
519-544.
Reynolds, A. J. (1998). Resilience among black urban youth: prevalence, intervention effects,
and mechanisms of influence. American Journal Of Orthopsychiatry, 68, 84-100.
Reynolds, A. J. (1999). Educational success in highrisk settings:contributions of the chicago
Longitudinal study. Journal of school Psychology, 37, 345-354.
Reynolds, D., Jones, D., St. Leger, S., & Murgatroyd, S. (1980). School factors and truancy. In
L. Hersove & I. Berg (Eds), Out of school: Modern perspectives in truancy and school
refusal (pp. 27-39). Chicheter, England: Wiley.
Roderick, M., Coca, V., & Nagaoka, J. (2011). Potholes on the road to college: High school
effects in shaping urban students' participation in college application, four-year college
enrollment, and college match: A magazine of theory and practice. Sociology of
Education, 84, 178-211.
Rose, L. C., & Gallup, A. M. (2000). The 32nd
annual Phi Delta Kappa/Gallup poll of the public
attitudes toward the public schools. Phi Delta Kappan, 82, 41-57.
Rosenbaum, J. (1976). Making inequality. NewYork: Wiley.
Rosenbaum, J. E., Miller, S. R., & Krei, M. S. (1996). Gatekeeping in an era of more open gates:
High school counselors’ view of their influence on students’ college plans. American
Journal of Education, 104(4), 257-279.
Rosenblatt, Z., & Peled,D. (2002). School ethical climate and parental involvement. Journal of
Educational Administration, 40(4/5), 349-377.
Rothstein, r. (2004). Class and schools: using social, economi, and educational reform to close
the Black-Euripean American achievement gap. Washington DC: Economic Policy
Institute.
Rothstein-Fisch, C., & Trumbull, E. (2008). Managing diverse classrooms: How to build on
students culture strengths. Alexandria, VA: ASCD.
Rouse, C. E. (1994). What to do after high school: The two year versus four year college
enrollment decisio. In R. G. Ehrenberg (Ed. ) Choices and consequences: Contemporary
policy issues in education (pp. 59-88). New York: IRL Press.
Roza, M., Guin, K., Gross, B., & Deburgomaster, S. (2007). Do districts fund schools fairly?
EducationNext, 7(4), 69–73. Retrieved from Hoover Institution:
http://www.hoover.org/publications/ednext/9223676.html.
Rothstein, R., & Jacobsen, R. (2006). What is basic? Principal Leadership, 7, 14-19.
Ryan, R. M., & Deci, E. L. (2000). Self-determination theory and the facilitation of intrinsic
motivation, social development, and well-being. American Psychologist, 35(1), 68-78.
Rutter, M., Maughan, B., Mortimore, P., & Ouston, J. (1979). Fifteen thousand hours: secondary
schools and their effects on children. Cambridge, MA: Harvard University Press.

THE INFLUENCE OF GEAR UP ON ACADEMIC ACHIEVEIMENT 64
Saarni, C. (2007). The development of emotional competence: Pathways for helping children
become emotionally intelligent. In R. BarOn, J. Maree, and M. J. Elias (Eds.), Educating
people to be emotionally intelligent (pp. 15-36). Westport, CT: Praeger.
Salili, F. (2009). A model of culture and achievement behavior. In A. Kaplan, S. Karabenick, &
E. De Groot (Eds.), Culture, self, and motivation: Essays in honor of Martin L. Maehr
(pp. 183-212). Charlotte, NC: Information Age Publishing.
Sanders, W. L. (2000). Value-added assessments from student achievement data: opportunities
and hurdles. Journal of Personnel Evaluation in Education, 14(4), 329-339.
Sanders, W. L. (2003). Beyond No Child Left Behind. Paper presented at the 2003 annual
meeting of the American Educational Research Association.
http://www.sas.com/resources/asset/beyond-no-child-left-behind.pdf.
Sanders, W. L. (2004). A Summary of conclusions drawn from longitudinalanalysis of students
achievement data over the past 22 years. Paper presented at the Goveners Education
symposium. http://www.sas.com/resources/asset/hunt_summary.pdf.
Sanders, W. L., 7 Rivers, J. C. (1996). Cumulative and residual effects of teachers on future
student academic achievement. Research Progress Report. Knoxville: University of
Tennessee Value-Added Research and Assessment Center.
Santrock, J. W. (2001). Educational psychology. New York: Mcgraw-Hill
Schaps, E., & solomon, D. (2003). The role of the school’s social environment in preventing
student drug use. Journal of Primary Prevention, 23(3), 299-328.
Schonert-Reichl, K. A. (2000). Children and youth at risk: Some conceptual considerations.
Paper presented at the Pan-Canadian Education Research Agenda Symposium, “Children
and Youth at Risk”, Ottawa, Cancda.
Seligman, M. E. P. (2002). Authentic happiness. New York: Free Press.
Seligman, M. E. P., Steen, T. A., Park, N., & Peterson, C. (2005). Positive psychology progress:
empirical validation of interventions. American Psychologist, 60, 410-421.
Sewell, W. H., Hauser, R. M., & Featherman, D. L. (Eds.). (1976). Schooling and achievement in
American society.New York: Academic Press.
Schexnider, A. J. (1998). The evolving HBCU niche. Black Issues In Higher Education, 14(23),
35.
Shapiro, T. M. (2004). The hidden cost of being AfricanAmerican: How wealth perpetuates
inequality. New York: Oxford University Press.
Shor, R., & Bernhard, J. K. (2003). A Comparative study of conflicts experienced between
immigrant parents in canada and Isreal and professionals in educational institutions about
appropriate responses to children’s misbehavior. Intercultural Education, 14(4), 385-396.
Shucksmith, J., Hendry, L. B., & Glendinning, A. (1995). Models of parenting implications for
adolescent well-being within different types of family context. Journal of Adolescence,
18, 253-270.
Slaby, R., Wilson-Brewer, R., & Dash, K. (1994). Aggressors, victims, and bystanders: thinking
and acting to prevent violence. Newton, MA: Education Development Center.
Sirin, r. S. 92005). Socioeconomic status and academic achievement : A meta-analytic review of
researcher. Review of Educational Research, 75, 417-453.
Smith-Maddox, R. (1998). Defining culture as a dimension of academic achievement:
Implications for culturally responsive curriculum,instruction, and assessment. The
Journal of Negro Education, 67, 302-317.

THE INFLUENCE OF GEAR UP ON ACADEMIC ACHIEVEIMENT 65
Spencer, M. B. (2005). Crafting identiies and assessing opportunities post-Brown. American
Psychologist, 60, 821-830
Statistics Canada. (2002). Civics and society: Emerging issues, Ottawa: Human Resources
Development Canada.
Statistics Canada. (2004). Measuring up: Canadian Results of the OECD PISA study:The
performance of Canada’s youth in mathematics, Reading, science and problem solving.
Human Resources Development Canada.
St. John, E. P. (1990). Price response in enrollment decisions: An analysis of the high school and
beyond sophomore cohort. Research in Higher Education. 31(2), 161-176.
St. John, E. P. (1991). What really influencesminority attendence? Sequential analyses of the
high school and beyond sophomore cohort. Research in Higher Education, 32(2), 141-
158.
St. John, E. (1991). The impact of student financial aid: A review of recent research.
Journal of Student Financial Aid, 21,18-32.
St. John, E. P., Noell, J. (1989). The effects of student financial aid on access to higher
education: An analysisof progress with special consideration of minority enrollment.
Research in Higher Education, 30(6), 563-581.
St. John, E., Hu, S., Simmons, A., 7 Musoba, G. (2001). Aptitude vs. Merit: What matters is
persistence. The Review of Higher Education, 24, 131-152.
Steele, C. M. (1999, AUG). Thin ice. Retrieved from The Atlantic: www.theatlantic.com
State of New Jersey. (2008). Promoting excellence for all. Retrieved from Commission on
Higher Education: http://www.state.nj.us/highereducation/EOF/
Stoops, N. (2004). Educational attainment in the United States: 2003. Population characteristic
(Publication No. P20-550). Washinton, DC: U.S. Census Bureau.
Strauss, C., & Quinn, N. (1997). A cognitive theory of cultural meaning. Cambridge, UK:
Cambridge University Press.
Suarez-Orozco, C., Pimentel, A., & Martin, M. (2009). The significance of relationships:
Academic engagement and achievement among newcomer immigrant youth. Teachers
College Record, 111(3), 712-749.
Swail, W. S., & Perna, L. W. (2002). Pre-college outreach programs: a national
Perspective. The Role of early intervention in education reform. Eric review: Early
intervention: expanding access to higher education, 8(1) 13-14.
Swail, W., Redd, K., & Perna, L. (2003). Retaining minority students in higher
Education: A framework for success. San Francisco, CA: Jossey-Bass.
Terenzini, P., Cabrera, A., & Bernal, E. (2001). Swimming against the tide: The poor in
American higher education. New York: College Board Publications (Report No. 20001-
1).
Thrurston Domina, A. C. (2011). The link between educational expectations and effort
in the college-for-all Era. Sociology of Education, 84(2), 93-112.
Tinto, V. (1987). Learning college: Rethinking the causes and cares of student attrition.
Chicago: University of Chicago Press.
Tinto, V. (1993). Leaving college: Rethinking the causes and cures of student attrition
(2nd
ed.). Chicago: University of Chicago Press.
Titus, M. (2006). Understanding college degree completion of students with low

THE INFLUENCE OF GEAR UP ON ACADEMIC ACHIEVEIMENT 66
Socioeconomic Status: The influence of the institutional financial context. Research in
Higher Education, 47(4), 371-398.
Tolan, P. H., Guerra, N. G., & Motaini-Klovdahl, L. R. (1997). Staying out of harm’s
Way: Coping and the development of inner-city children. In S. A. Wolchik & I. N.
Sandler (Eds.), Handbook of children’s coping: Linking theory and intervention (pp. 453-
479). New York: Plenum Press.
Tornatzky, L. G., Cutler, R., & Lee. J. (2002). College knowledge: What Latino parents
Need to know and why they don’t know it. Claremont, CA: Tomas Rivera Policy Institute.
Trumbull, E., Rothstein-Fisch, C. (2011). The intersection of culture and achievement
Motivation School Community Journal 21(2), 25-53
Trumbull, E., Nelson-Barber, S., & Mitchell, J. (2002). Enhancing mathematics
Instruction for indigenous American students. In. J. Hankes (Eds.), Changing the faces of
mathematics: Perspectives on Indigenous people of North America (pp. 1-18). Reston,
VA: National Council of Teachers of Mathematics.
Trumbull, E., Rothstein-Fisch, C., Greenfield, P. M., & Quiroz, B. (2001). Bridging
Cultures between home and school: A guide for teachers. Mahwah, NJ: Erlbaum.
Turner, S., & Scherman, A. (1996). Big brothers: impact on little brothers’ self-concepts
and Behaviors. Adolescence, 31(134), 882.
Twemlow, S.W., Fonagy, P., Sacco, F. C., Gies, M. L., & Hess, D. (2001). Improving the
Social and intellectual climate in elementary schools by addressing bully-victim-
bystanders power struggles. In J. Choen (Ed), Caring classroom/ intelligent schools: the
social emotional education of young children (pp. 162-182). New York: Teachers
College Press.
Urdan, T.C. (2009). The contributions of Martin L. Maehr to the study of cultural influences on
achievement motivation. In A. Kaplan, S. Karabenick, & E. De Groot (Eds.), Culture,
self, and motivation: Essays in honor of Martin L. Maehr (pp. 267-284). Charlotte, NC:
Information Age Publishing.
Urdan, T. C., & Maehr, M. L. (1995). Beyond a two-goal theory of motivation and achievement:
A case for social goals. Review of Educational Research, 65(3), 213-244.
Useem, E. L. (1991). Student selection into course sequences in mathematics: The impact of
parental involvement and school polices. Journal of Research on Adolescence, 1(3), 231-
250.
U.S. Census Bureau. (2002). 2000 census of the population. Washington DC: U. S. Government
Printing Office.
U.S. Census Bureau. (2010). 2010 census of the population. Washington DC: U. S. Government
Printing Office.
U.S. Department of Education. (2002). Public law 107-110, the No Child Left Behind Act of
2001. http://www.ed.gov
U.S. Department of Education. (2004). New No Child Left Behind Flexibility: Highly qualified
teachers fact sheet. http://www2.ed.gov
U.S. Department of Education. (2009). The American Recovery and Reinvestment Act of 2009:
Saving and creating jobs and reforming education. http://www2.ed.gov
U.S. Department of Education. (2010). Race to the top application for phase 2 funding (CFDA
Number: 84.395A). http://www2.ed.gov

THE INFLUENCE OF GEAR UP ON ACADEMIC ACHIEVEIMENT 67
U.S. Department of Education, National Canter for Education Statistics. (2000). Low income
Students: Who they are and how they pay for their education. Washington, DC: Author.
U.S. Department of Education. (2010). GEAR UP. Retrieved from
http://www2.ed.gov/programs/gearup/index.html
U. S. department of Justice. (2004). Towrd safe and orderlyschools-the national study of
delinquency prevention in schools. Retrieved from http://www.ncjrs.gov
Veneziano, R. A., & Rohner, R. P. (2002). Perceived paternal acceptance, paternal involvement,
and yout’s psychological adjustment in a rural, biracial Southern community. Journal of
Marriage and the Family, 60(2), 335-343.
Villalpando, O., & Solorzano, D. G. (in press). The role of culture in college programs: A review
of the research literature. InW. Tierney, Z. Corwin, & J. colyar (Eds.), From high school
to college: Evaluating access. Albany: State University of New York Press.
Villanueva, I., & hubbard, L. (1994). Toward redefining parent involvement: Making parents’
invisible strategies and culture practices visible. Paper presented at the annual meeting of
the American Educational Research Association, New Orleans, LA.
Vygotsky, L. S., Rieber, R., & Carton, a. S. (Eds.) (1987). The collected works of L. S. Vygotsky,
Vol. 1: Problems of general psychology. New York: Plenum Press.
Walpole, M. (2003). Socioeconomic status and college: How SES affects college experiences
And outcomes. The Review of Higher Education, 27(1), 45-73.
Wang, M. C., Haertel, G. D., & Walberg, H. J. (1993). Toward a knowledge base for school
learning. Review of Educational Research, 63, 249-294.
Ward, N. L. (2006). Improving equity and access for low-income and minority youth into
institutions of higher education. Urban Education,41(1), 50-70.
Walpole, M., Bauer, C., Kanyi, K., & Toliver, R. (2002). African American students; early
outcomes of college: links between campus experiences and outcomes. Paper presented at
the annual meeting of the American Educainal Research Association, New Orleans, LA.
Way, N., 7 Robinson, M. G. (2003). A longitudinal study of the effects of family, friends, and
school experiences on the psychological adjustment of ethnic minority, low SES
adolescents. Journal of Adolescent Research, 18(4), 324-346.
Weiner, B. (1994). Integrating social and personal theories of achievement strivings. Review of
Educational Research, 6, 557-573.
Weinstein, R. (2002). Overcoming inequality in schooling: A call to action for community
psychology. American Journal of Community Psychology, 30, 21-42.
Welsh, M., Parke, R. D., Widaman, K., & O’Neil, R. (2001). Linkages between children’s social
and academic competence: a longitudinal analysis. Journal of School Psychology, 39,
463-482.
Wilkinson, R. B. (2004). The role of parental and peer attachment in the psychological health
and self-esteem of adolescents. Journal of Youth and Adolescence, 33(6), 479-493.
Wilson, W. J.(1996). When work disappears: the world of the new urban poor. New York:
Knopf.
Wright, S. P., horn, S. P., & Sanders, W. L. (1997). Teacher and classroom context effects on
student achievement: implications for teacher evaluation. Journal of Personnel
Evaluation in Education, 11(1),57-67.

THE INFLUENCE OF GEAR UP ON ACADEMIC ACHIEVEIMENT 68
Wright, S. P., White, J. T., Sanders, W. L., & Rivers, J. C. (2010) SAS EVAAS statistical models.
http://www.sas.com
Yonezawa, S. (1997). Making decisions about students’ lives: An interactive study of secondary
school students’ academic program selection. Unpublished doctoral dissertation, UCLA
Graduate School of Education and Information Studies.
Zins, J. E., Weissberg, R. P., Wang, M. C.,& Walberg, H. J. (2004). Building academic success
on social and emotional learning: what does the research say? New York: Teachers
College Press.

THE INFLUENCE OF GEAR UP ON ACADEMIC ACHIEVEIMENT 69