the influence of fuel sulfur on the operation of large two...
TRANSCRIPT

General rights Copyright and moral rights for the publications made accessible in the public portal are retained by the authors and/or other copyright owners and it is a condition of accessing publications that users recognise and abide by the legal requirements associated with these rights.
Users may download and print one copy of any publication from the public portal for the purpose of private study or research.
You may not further distribute the material or use it for any profit-making activity or commercial gain
You may freely distribute the URL identifying the publication in the public portal If you believe that this document breaches copyright please contact us providing details, and we will remove access to the work immediately and investigate your claim.
Downloaded from orbit.dtu.dk on: May 09, 2019
The Influence of Fuel Sulfur on the Operation of Large Two-Stroke Marine DieselEngines
Cordtz, Rasmus Faurskov
Publication date:2015
Document VersionPublisher's PDF, also known as Version of record
Link back to DTU Orbit
Citation (APA):Cordtz, R. F. (2015). The Influence of Fuel Sulfur on the Operation of Large Two-Stroke Marine Diesel Engines.DTU Mechanical Engineering. DCAMM Special Report, No. S185

Ph
D T
he
sis
The Infl uence of Fuel Sulfur on the Operation of Large Two-Stroke Marine Diesel Engines
Rasmus Faurskov CordtzDCAMM Special Report No. S185January 2014


The Influence of Fuel Sulfur on the Operation of Large Two-Stroke Marine Diesel Engines
By
Rasmus Faurskov Cordtz
A thesis submitted in partial fulfillment of the requirements for the degree of
DOCTOR OF PHILOSOPHY
at the
TECHNICAL UNIVERSITY OF DENMARK
2015

The Influence of Fuel Sulfur on the Operation of Large Two-Stroke Marine Diesel Engines Rasmus Faurskov Cordtz Section of Thermal Energy Department of Mechanical Engineering Technical University of Denmark Nils Koppels Allé, Bld. 403 DK-2800 Kgs. Lyngby Denmark Ph.D. Thesis ISBN: 978-87-7475-421-3 DCAMM Special Report no.: S185 © Copyright by Rasmus Faurskov Cordtz, 2015 All rights reserved
1
Preface
The present thesis is submitted for the partial fulfillment of the PhD degree at the Technical
University of Denmark (DTU). The PhD program is carried out at the Department of Mechanical
Engineering under the Section of Thermal Energy from September 2010 to January 2014 and
included a four months leave. The study is funded by The Technical University of Denmark and the
research School DCCAM (Danish Center for Applied Mathematics and Mechanics) and MAN
Diesel & Turbo.
The author would like to thank my supervisor Associate Professor Jesper Schramm and colleague
Professor Peter Glarborg (DTU) as well as employees at MAN Diesel and Turbo, especially Stefan
Mayer, Svend S. Eskildsen and Anders Andreasen for their guidance and support throughout the
study. The author is also very grateful for the support offered by PENTOL GmbH that with their
SO3 monitor supported the SO3 measurement campaign with a heavy duty diesel engine at Rostock
University (Lehrstuhl für Kolbenmaschinen und Verbrennungsmotoren). Special thanks are
addressed to CEO Olivier Blauenstein, employee Dirk Bogenschneider (PENTOL) and Dr.-Ing.
Jean Rom Rabe (Rostock University). The author appreciate the numerous and inspiring discussions
with my colleagues at DTU and the patient and caring support from my Joan.
Rasmus Cordtz Kgs. Lyngby January 2014
2
Abstract
Cold corrosion of cylinder liners in large low speed two-stroke marine diesel engines is an issue that
has gained increasingly interest over the last years. It is believed that the corrosion is primarily
caused by sulfur trioxide (SO3) that is formed from the oxidation of fuel sulfur. Following the SO3
condenses on the liner surface as aggressive sulfuric acid (H2SO4) when the liner temperature is
less than the sulfuric acid dew point. To counteract corrosion cylinder liner lubricants are blended
with base additives. Controlling corrosion rates are challenging and expensive. Furthermore
completely avoiding corrosion is unwanted as mild levels of corrosion is sought to improve
conditions of the lubricant film between the moving piston and the liner. The present work focusses
on in cylinder SO3 formation and subsequent H2SO4 condensation on the cylinder liner of a large
marine engine. Formation of SO3 is investigated theoretically with a phenomenological multizone
engine model that applies a detailed sulfur reaction mechanism. Results show that generally a few
percent of the fuel sulfur is converted to SO3 and the remaining sulfur leaves the engine as sulfur
dioxide (SO2). Model trends agree with experiment work. From a fully homogenized cylinder gas
the sulfuric acid dew point trace is calculated by implementing H2O-H2SO4 vapor liquid
equilibrium. Theory that couples heat and diffusive mass transfer in the gas species boundary layer
adjacent to the liner surface is applied to analyze the characteristics of sulfuric acid condensation.
Higher operating pressures and fuel sulfur contents act to increase the deposition that is very
sensitive to the applied liner temperature.

3
Resume
Koldkorrosion af cylinderforinger i store langsomtgående to-takts marine-dieselmotorer har i de
seneste år fået meget opmærksomhed som følge af ændrede driftsbetingelser og deraf øgede
korrosionsrater. Det menes, at korrosionen skyldes svovltrioxid (SO3), der dannes ved oxideringen
af brændstoffets svovl. Efterfølgende kondenserer SO3 på foringsoverfladen som aggressiv
svovlsyre (H2SO4), når overfladetemperaturen er lavere end syredugpunktet. For at hæmme
korrosion er smøreolien tilsat basiske komponenter, men det er vanskeligt og dyrt at styre korrosion
i praksis. Samtidig ønskes en mild grad af korrosion, der menes at forbedre smøreegenskaberne
mellem cylinderforingen og det bevægelige motorstempel. Nærværende afhandling omhandler SO3-
dannelse og følgende H2SO4 kondensering på cylinderforingen i en stor langsomtgående to-takts
marine-dieselmotor. SO3-dannelsen er teoretisk behandlet vha. en fænomenologisk multizone
simuleringsmodel, der involverer en detaljeret svovl-reaktionsmekanisme. Ifølge modellen
omdannes generelt kun få procent af brændstoffets svovl til SO3, og resten udledes som svovldioxid
(SO2). Modeltrends stemmer overens med resultater fra en række motoreksperimenter. Med
udgangspunkt i en homogen cylindergas er svovlsyredugpunkter beregnet vha. H2O-H2SO4
faseligevægt. Koblet varme og diffusionsteori er anvendt til at analyseres egenskaber for
svovlsyrekondensering på cylinderforingen. Øget cylindertryk og brændstof-svovlindhold forøger
kondensering, der ligeledes er meget følsom over for den anvendte foringstemperatur.

4
Contents
Preface .................................................................................................................................................. 1
Abstract ................................................................................................................................................ 2
Resume ................................................................................................................................................. 3
1. Introduction ...................................................................................................................................... 6
2. Objective ........................................................................................................................................ 10
3. Sulfur chemistry ............................................................................................................................. 11
3.1 Thermodynamics of sulfur oxides in diesel engine operation ................................................. 12
4. Phenomenological engine model (SO3 modeling) ......................................................................... 15
4.1 General model assumptions ..................................................................................................... 15
4.2 Rate of fuel heat release ........................................................................................................... 16
4.3 Burned zones and gas mixing .................................................................................................. 18 Temperature and excess air traces of burned zones ................................................................................. 19
Model calibration ..................................................................................................................................... 21
4.4 Model Results .......................................................................................................................... 21
4.5 Reducing the sulfur reaction mechanism ................................................................................. 25
5. Exhaust gas measurements of SO3 ................................................................................................ 29
5.1 Experimental setup ................................................................................................................... 29
5.2 Review of available SO3 measurement techniques ................................................................. 31 Acid dew point meter .............................................................................................................................. 32
EPA Method 8 ......................................................................................................................................... 33
Controlled Condensation Method (CCD) ................................................................................................ 33
PENTOL SO3 Monitor ............................................................................................................................ 34
5.3 Experimental results ................................................................................................................. 35
5.4 Multi zone model vs. experimental results .............................................................................. 41
6. Modeling the characteristics of sulfuric acid condensation on the cylinder liner .......................... 44
6.2 Modeling cases ......................................................................................................................... 46
6.3 Cylinder gas dew points ........................................................................................................... 47
6.4 Sulfuric acid condensation ....................................................................................................... 51 Condensing acid strengths on the cylinder liner ...................................................................................... 51
Deposition of sulfuric acid on the cylinder liner ..................................................................................... 53
6.5 Acid mist formation ................................................................................................................. 57
Discussion .......................................................................................................................................... 59
Conclusions ........................................................................................................................................ 60
Nomenclature ..................................................................................................................................... 62
5
Abbreviations ..................................................................................................................................... 64
References .......................................................................................................................................... 65
Appendices ......................................................................................................................................... 70
A.1…………Paper 1: Modeling The Distribution of Sulfur Compounds in a Large Two-Stroke Diesel Engine
A.2…………Paper 2: Investigating SO3 Formation from the Combustion of Heavy Fuel Oil in a Four-stroke Medium Speed Test Engine
A.3…………Paper 3: Characteristics of Sulfuric Acid Condensation on Cylinder Liners of Large Two-Stroke Marine Engines
A.4…………Principles of chemical reaction rates

6
1. Introduction
Over 90% of the world trade is carried by the international shipping industry. Without shipping the
import and export of goods on the scale necessary for the modern world would not be possible.
Every year several billion tons of trades are moved primarily by large container ships that often
operate on large low speed two-stroke engines. These engines offer high power densities in the
megawatt range with thermal efficiencies up to 55% and burn Heavy Fuel Oil (HFO) for many
hours a year. HFO is basically the residue from fuel oil refineries and the maritime industry heavily
stresses the global environment in terms of air pollution and greenhouse effects. In operation the
ships emit significant levels of carbon dioxide (CO2), particulate matter (PM) also known as soot,
nitrogen oxides (NOx) and sulfur oxides (SOx). Emissions of NOx and PM are poisonous and
carcinogenic and are subject to international legislations. In large marine engines NOx formation is
a consequence of the efficient low speed process and in near future additional technologies such as
Exhaust Gas Recirculation1 (EGR) and Selective Catalytic Reduction2 (SCR) are likely combined to
meet ever more demanding NOx legislations. SOx emissions are the principle cause of acid rain and
reduce in line with the fuel sulfur content. Current and future SOx-legislations that are set by the
International Maritime Organization (IMO) are presented in Figure 1.1. The figure presents two
SOx-limits. A global limit and yet a limit that applies to the so called Emission Controlled Areas
(ECA’s) representing e.g. the North Sea area, the Baltic Sea area, sea ports and near coast areas.
Ships that operate outside the ECA’s are currently allowed to operate with fuels containing up to
3.5 wt. %. In ECA areas the current limit is 1 wt. % but from 2015 the limit will be as low as 0.1
wt. %. The limits apply unless exhaust gas cleaning is carried out onboard. This can be realized by
the use of scrubbers that with seawater can wash out SOx and other impurities from the exhaust gas.
Figure 1.1. Sulfur limits according to the International Maritime Organization3.
7
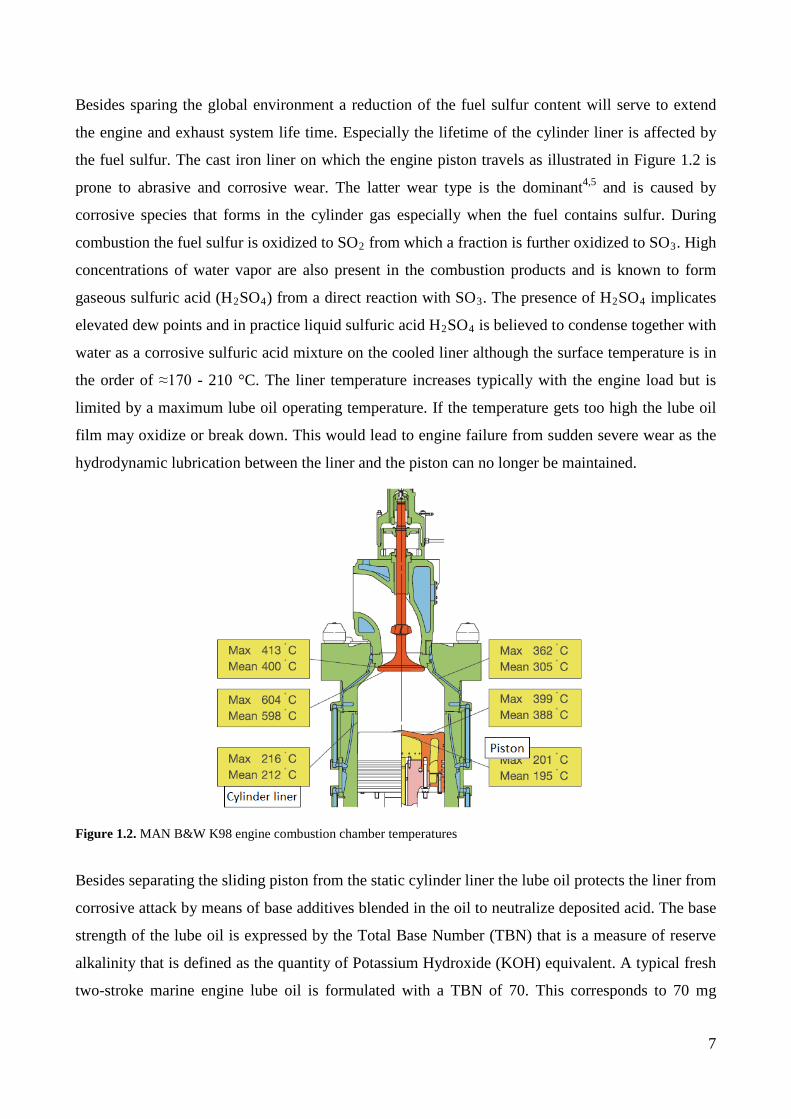
Besides sparing the global environment a reduction of the fuel sulfur content will serve to extend
the engine and exhaust system life time. Especially the lifetime of the cylinder liner is affected by
the fuel sulfur. The cast iron liner on which the engine piston travels as illustrated in Figure 1.2 is
prone to abrasive and corrosive wear. The latter wear type is the dominant4,5 and is caused by
corrosive species that forms in the cylinder gas especially when the fuel contains sulfur. During
combustion the fuel sulfur is oxidized to SO2 from which a fraction is further oxidized to SO3. High
concentrations of water vapor are also present in the combustion products and is known to form
gaseous sulfuric acid (H2SO4) from a direct reaction with SO3. The presence of H2SO4 implicates
elevated dew points and in practice liquid sulfuric acid H2SO4 is believed to condense together with
water as a corrosive sulfuric acid mixture on the cooled liner although the surface temperature is in
the order of ≈170 - 210 °C. The liner temperature increases typically with the engine load but is
limited by a maximum lube oil operating temperature. If the temperature gets too high the lube oil
film may oxidize or break down. This would lead to engine failure from sudden severe wear as the
hydrodynamic lubrication between the liner and the piston can no longer be maintained.
Figure 1.2. MAN B&W K98 engine combustion chamber temperatures
Besides separating the sliding piston from the static cylinder liner the lube oil protects the liner from
corrosive attack by means of base additives blended in the oil to neutralize deposited acid. The base
strength of the lube oil is expressed by the Total Base Number (TBN) that is a measure of reserve
alkalinity that is defined as the quantity of Potassium Hydroxide (KOH) equivalent. A typical fresh
two-stroke marine engine lube oil is formulated with a TBN of 70. This corresponds to 70 mg
8
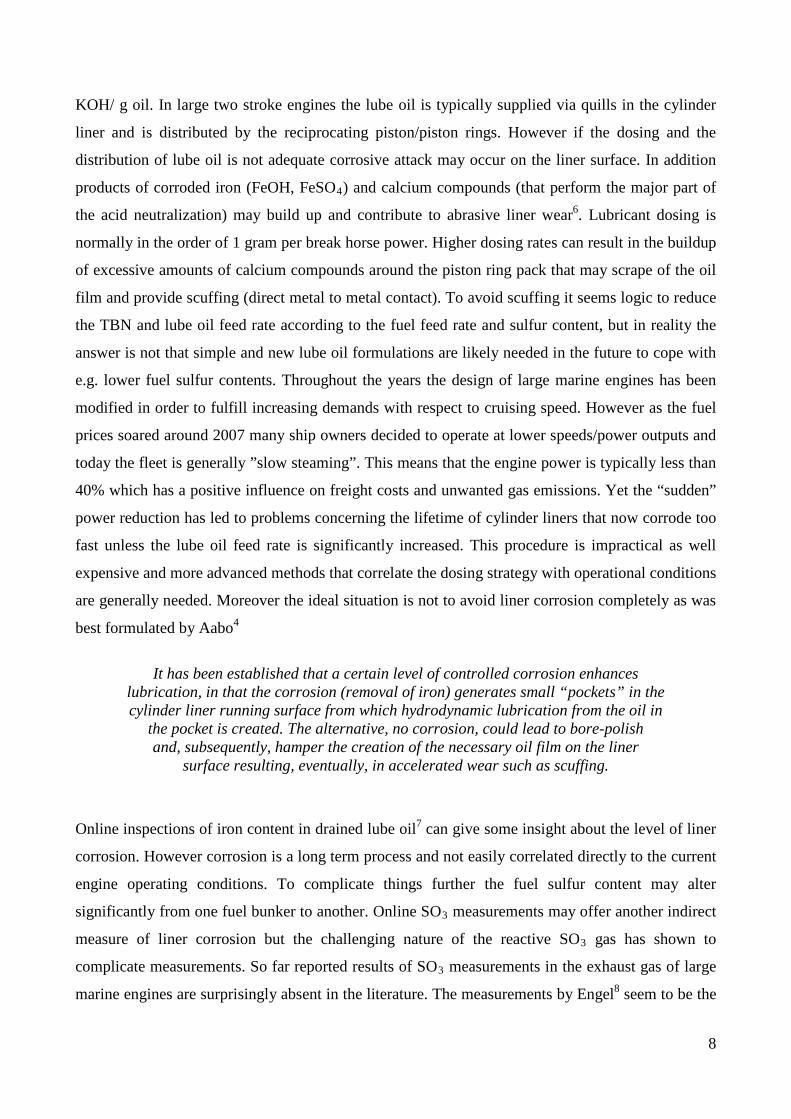
KOH/ g oil. In large two stroke engines the lube oil is typically supplied via quills in the cylinder
liner and is distributed by the reciprocating piston/piston rings. However if the dosing and the
distribution of lube oil is not adequate corrosive attack may occur on the liner surface. In addition
products of corroded iron (FeOH, FeSO4) and calcium compounds (that perform the major part of
the acid neutralization) may build up and contribute to abrasive liner wear6. Lubricant dosing is
normally in the order of 1 gram per break horse power. Higher dosing rates can result in the buildup
of excessive amounts of calcium compounds around the piston ring pack that may scrape of the oil
film and provide scuffing (direct metal to metal contact). To avoid scuffing it seems logic to reduce
the TBN and lube oil feed rate according to the fuel feed rate and sulfur content, but in reality the
answer is not that simple and new lube oil formulations are likely needed in the future to cope with
e.g. lower fuel sulfur contents. Throughout the years the design of large marine engines has been
modified in order to fulfill increasing demands with respect to cruising speed. However as the fuel
prices soared around 2007 many ship owners decided to operate at lower speeds/power outputs and
today the fleet is generally ”slow steaming”. This means that the engine power is typically less than
40% which has a positive influence on freight costs and unwanted gas emissions. Yet the “sudden”
power reduction has led to problems concerning the lifetime of cylinder liners that now corrode too
fast unless the lube oil feed rate is significantly increased. This procedure is impractical as well
expensive and more advanced methods that correlate the dosing strategy with operational conditions
are generally needed. Moreover the ideal situation is not to avoid liner corrosion completely as was
best formulated by Aabo4
It has been established that a certain level of controlled corrosion enhances
lubrication, in that the corrosion (removal of iron) generates small “pockets” in the cylinder liner running surface from which hydrodynamic lubrication from the oil in
the pocket is created. The alternative, no corrosion, could lead to bore-polish and, subsequently, hamper the creation of the necessary oil film on the liner
surface resulting, eventually, in accelerated wear such as scuffing.
Online inspections of iron content in drained lube oil7 can give some insight about the level of liner
corrosion. However corrosion is a long term process and not easily correlated directly to the current
engine operating conditions. To complicate things further the fuel sulfur content may alter
significantly from one fuel bunker to another. Online SO3 measurements may offer another indirect
measure of liner corrosion but the challenging nature of the reactive SO3 gas has shown to
complicate measurements. So far reported results of SO3 measurements in the exhaust gas of large
marine engines are surprisingly absent in the literature. The measurements by Engel8 seem to be the
9
only peer reviewed experiments. However Engel only measured SO3 in the exhaust gas from heavy
duty diesel engines (not marine engines) and reported that ∼1-8 % of the fuel sulfur is converted to
SO3 depending on the fuel type and operating conditions. This may explain the “rule of thumb” that
states that a few percent of the fuel sulfur is converted to SO3 in a large marine engine as well.
However it remains to be reported how SO3 formation is altered by key parameters such as engine
speed, pressure and air-fuel ratio. This is addressed in the present work through a phenomenological
model of a large marine engine and a series of SO3 measurements with a heavy duty test engine.
The diesel combustion process combined with chemical reactions can be modeled with different
levels of complexity. Computational Fluid Dynamic tools (CFD) are highly advanced and offer
detailed information about the complex, multiphase and heterogeneous combustion process. A
significant drawback associated with CFD tools however is the computational time required for
solving conservation laws of species, momentum and energy through partial differential equations
in a 3D domain including chemical sub models. The computational time is typically more than 10^5
seconds and is not practical for investigating SO3 formation in multiple operational conditions. In
order to provide a much faster and a fairly detailed model a phenomenological multizone engine
model is formulated in this study. Different formulations of this model approach exist in the
literature9. This work is inspired by the formulation suggested by Andersson10. The model is simple
compared to CFD tools as it solely solves ordinary differential equations with respect to time and
disregards conservation laws with respect to space. But since it is a 0D model the computational
time is in the order of 10^2 seconds which makes it flexible and suitable for multiple simulations.
However the multizone model also fails in predicting “true” gas mixing and turbulence etc. On the
other hand with the phenomenological approach the effect of mixing can be induced and thereby
evaluated as shown in this work.
The sulfur chemistry has been intensively investigated theoretically11-17 and experimentally11,18-22
over the years. Focus on atmospheric sulfur chemistry has provided valuable information about H-
S-O complexes and today the sulfur chemistry is considered a well-established science. In the field
of power plants and gas turbines SO3 formation has been studied both theoretically and
experimentally23-28. It is known that SO2 is the primary sulfur compound in a combustion process
and a fraction of the SO2 is further oxidized to SO3 through several reaction pathways involving
species of the radical pool and H-S-O complexes. In this work a detailed sulfur reaction mechanism
is applied in order to simulate SO3 formation that is shown to form primarily as the hot gas products
cool during expansion stroke.

10
2. Objective
The aim of this work is to quantify the formation of gaseous SO3/H2SO4 in the cylinder of a large
low speed two-stroke marine diesel engine operating on HFO including sulfur and model sulfuric
acid condensation on the cylinder liner. For the purpose a phenomenological multizone engine
model that applies a detailed sulfur reaction mechanism will be formulated. To simplify
computations the multizone model solely considers homogenous gas reactions and disregards
multiple phases i.e. liquid fuel and solid matter. Moreover the HFO is modeled as n-dodecane
including non-bonded elemental sulfur. The large low speed two-stroke engine specified in Table
4.1 serves as the reference engine for the engine model. In order to simulate realistic fuel burn rates
the model will apply experimental operating data such as cylinder pressure histories of the full
operational range. The lack of experimental SO3 exhaust gas data necessitates that the model is
calibrated against available NOx data. For the purpose a simple correlation of mixing between
burned fuel products and fresh gas (mostly air) will be proposed. The multizone model will be
formulated in MATLAB where chemical reaction rates (species formation) are integrated via the
open source software CANTERA29,30 that is directly compatible with MATLAB. With CANTERA
the thermodynamic properties of gas species are expressed through 7 coefficient NASA
polynomials and CANTERA efficiently calculates thermodynamic compositions, properties and
temperatures etc. of gas mixtures through available subroutines.
By implementing theory that couples heat and diffusive mass transfer the multizone model will be
used to predict the rate of sulfuric acid condensation on the cylinder of a marine engine in multiple
operating conditions. Condensation takes place if the liner temperature is less than the sulfuric acid
dew point that is determined by implementing H2O-H2SO4 VLE.
In order to compare model results with experimental data a comprehensive study of SO3 formation
in a diesel engine that operates on HFO including sulfur will be carried out. To keep the
experimental costs at a reasonable level the measurements will be carried out with a fully mapped
heavy duty (kilowatt) test engine instead of a large (megawatt) marine engine. Proven techniques
for measuring SO3 in the exhaust gas will be reviewed and the best option will be used.

11
3. Sulfur chemistry
In order to model the distribution of sulfur compounds in the cylinder gas a detailed sulfur reaction
mechanism11 is applied. The mechanism is the result of a comprehensive literature review,
laboratory reactor experiments and theoretical predictions18,31-34. It comprises over 130 elementary
reactions and more than 30 species divided into three subsets; a sulfur subset, a H2/O2 subset and a
CO/CO2 subset. The latter two subsets govern the oxidation of the hydrocarbons in the fuel. Table
3.1 lists important high temperature SOx-reactions where the O and OH radicals act as key species
in terms of SO2 to SO3 oxidation11. HOSO2 acts as an intermediate component and “opens” an
important pathway to SO3.
Reaction No. Reaction A n E/R
77 SO + O2 ↔ SO2 + O 7.6E3 2.37 2970
86 SO2 + O(+M) ↔ SO3(+M)a 3.7E11 0.00 1689
Low-pressure limit 2.4E27 -3.60 5186
Troe parameters 0.442, 316, 7442 88 SO2 + OH(+M) ↔ HOSO2(+M)b 5.7E12 -0.27 0
Low-pressure limit 1.7E27 -4.09 0
Troe parameters 0.10, 1E-30, 1E30 89 SO2 + SO2 ↔ SO3 + SO 5.0E07 2.00 37750
90 SO3 + H ↔ SO2 + OH 8.4E09 1.22 2980
92 SO3 + O ↔ SO2 + O2 2.8E04 2.57 29200
93 SO3 + OH ↔ SO2 + HO2 4.8E04 2.46 13700
130 HOSO2 ↔ SO3 + H 1.4E18 -2.91 54900
131 HOSO2 + H ↔ SO2 + H2O 1.0E12 0.00 0
132 HOSO2 + O ↔ SO3 + OH 5.0E12 0.00 0
133 HOSO2 + OH ↔ SO3 + H2O 1.0E12 0.00 0
134 HOSO2 + O2 ↔ HO2 + SO3 7.8E11 0.00 656 aEnhanced third-body coefficients: N2 = 0, SO2 = 10, H2O = 10 bEnhanced third-body coefficients: N2 = 1, SO2 = 5, H2O = 5
Table 3.1. High temperature SOx reactions. Arrhenius parameters in cal, cm, mol, s, K for k = ATβexp(-E/RT). Reaction numbers refer to the full reaction mechanism.
The SOx chemistry in the sulfur subset is decoupled from any NOx interactions although the
oxidation of SO2 may proceed from a reaction involving NO2. Nevertheless, reactions between
NOx and SOx are ignored as NO2 formation is negligible in large low speed diesel engines35 and

12
since direct S/N interactions remain controversial31. Neither does the applied sulfur subset contain
H2SO4 reactions. In this work four additional reactions are applied and shown in Table 3.2. The
gaseous H2SO4 formation is modeled from a single (very fast) reaction36 involving SO3 and H2O
and high temperature NOx formation is modeled with the extended Zeldovich mechanism37. N2O is
ignored in the present study as it merely relates to lean premixed combustion processes like gas
turbines2 and since premixed combustion is practically absent in large low speed diesel engines.
Reaction No Reaction A β E/R R.3.1 N + NO ↔ N2 + O 2.7E13 0 179 R.3.2 N + O2 ↔ NO + O 9.0E09 1 3270 R.3.3 N + OH ↔ NO + H 3.36E13 0 194
R.3.4 SO3 + H2O ↔ H2SO4 7.23E08 0 0
Table 3.2. Applied NO and H2SO4 reactions. Arrhenius parameters in cal, cm, mol, s, K for k = ATβexp(-E/RT)
3.1 Thermodynamics of sulfur oxides in diesel engine operation
In Figure 3.1 the adiabatic flame temperature and the thermodynamic distribution of sulfur
compounds for dry air and n-dodecane (C12H26) including 3.5 % m/m elemental sulfur is illustrated.
The temperatures and mole fractions are presented for excess air ratios (𝜆) between 0.75 and 1.25.
Figure 3.1. The adiabatic flame temperature and mole fractions of sulfur compounds versus the excess air ratio at chemical equilibrium. Reactants are n-dodecane including 3.5 % m/m sulfur in dry air.

13
At combustion conditions the fuel sulfur is primarily transformed into sulfur oxides with SO2 being
the major sulfur compound even at fuel rich conditions. The overall stoichiometry of a diffusion
controlled diesel process is always lean. However diffusion flames burning in air are characterized
by a stoichiometric flame front38 and it is normally assumed that fuel and air reacts (at the flame) at
λ=1. As seen in Figure 3.1 the H-S compounds vanish as λ approaches 1 and above. Moreover SO2
is equilibrated rapidly near the flame front on a time scale comparable to that of the fuel oxidation
reactions22,26,39. Consequently if rich compositions are neglected and if chemical equilibrium is
assumed to exist at flame conditions the H-S compounds can be ignored and the applied sulfur
subset can be greatly reduced for a diesel process as examined in a later section.
Gaseous H2SO4 is not formed at flame conditions due to thermodynamic restrictions. In fact H2SO4
forms at considerably lower temperatures via SO3 that is neither really preferred at flame conditions
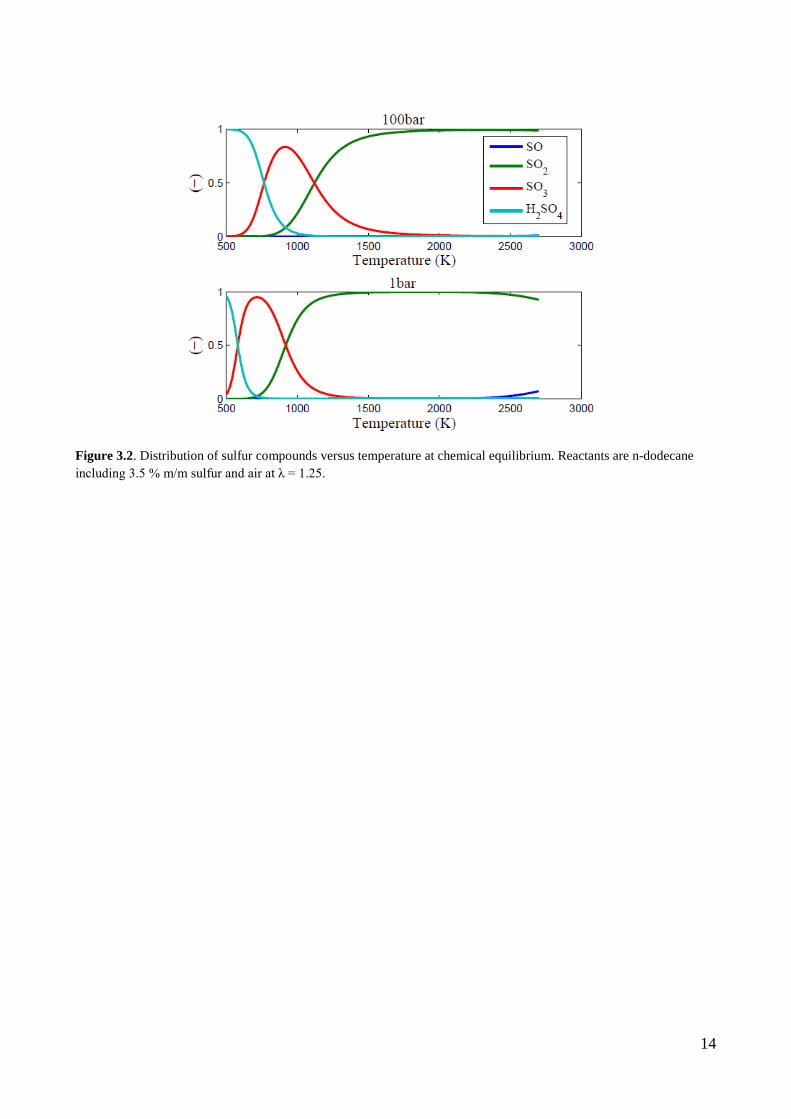
(Fig. 3.1). In Figure 3.2 the thermodynamic distribution of important sulfur compounds at 1 bar and
100 bar pressure are shown for the temperature range prevailing during the expansion stroke in a
diesel process. The distribution is based on n-dodecane including 3.5 % m/m elemental sulfur and
air at λ = 1.25. As shown in the figure the fuel sulfur is distributed in the three species SO2, SO3
and H2SO4. SO is to some extent present but only at very high temperatures where SO2 is the
primary compound. SO3 is principally absent at temperatures above 2000 K and H2SO4 is confined
to temperatures of less than ≈1000 K. At some point during the expansion stroke SO3 may form at
the expense of SO2 as the gas products cool. According to the thermodynamics the SO2 will vanish
at temperatures of less than 800 K. However, it will be shown later that the governing reactions
“freeze” as the cylinder gas cools and only a fraction of the SO2 is converted. In practice the
distribution of SOx species in the exhaust gas according to Figure 3.2 is not representative.
Nevertheless, the fraction of fuel sulfur that is converted to condensable and highly corrosive
species is now defined from the ε-expression in eq. 3.1. It is believed that H2SO4 forms from a very
fast reaction between SO3 and H2O. For this reason it makes sense to lump SO3 and H2SO4 and
consider both species as highly corrosive.
𝜀 = [𝑆𝑆3]+[𝐻2𝑆𝑆4][𝑆𝑆3]+[𝐻2𝑆𝑆4]+[𝑆𝑆2]
(3.1)
14
Figure 3.2. Distribution of sulfur compounds versus temperature at chemical equilibrium. Reactants are n-dodecane including 3.5 % m/m sulfur and air at λ = 1.25.

15
4. Phenomenological engine model (SO3 modeling)
An overall description of the engine model is provided in the current section. For a more detailed
description the reader is referred to the published material40 that is enclosed in app A.1. In short the
model seeks to reproduce the combustion process of four operating conditions (25%, 50 %, 75 %
and 100 % engine load) of the two-stroke engine specified in Table 4.1. Burned fuel products are
divided in multiple zones for a more realistic prediction of NOx and SOx formation. For each
operating case the model applies experimental data such as cylinder pressure history, charge air
conditions and valve timings etc.
Number of cylinders 4 Bore/stroke/connecting rod 500mm / 2200 mm / 2885 mm
MCR speed 123 RPM MCR power 7.050 MW
MEP at MCR 20 bar
Turbocharger MAN TCA55-VTA Table 4.1. Reference engine used for the phenomenological engine model.
4.1 General model assumptions
To reduce model complexity a set of general assumptions are introduced:
• The fuel is modeled as n-dodecane (C12H26) including non-bonded elemental sulfur.
• The air is modeled as dry air comprising 79 % N2 and 21 % O2 only.
• The fraction of injected fuel reflects the fuel burn fraction.
• Injected fuel burns stoichiometrically at the flame temperature.
• Fuel phase changes and particulate matter is not considered.
• Only homogenous gas phase reactions are considered.
• Gas mixtures obey the ideal gas law.
• The model resolution is one crank angle degree.
• The pressure in the cylinder is uniform.
• Blow by affects are neglected.
• Engine cylinder bore, piston position and compression ratio describes the instant cylinder
geometry.

16
• The mixing between fuel products and fresh gas during the expansion stroke is modeled
with a simple correlation described in a later section.
4.2 Rate of fuel heat release
A homogenous cylinder gas i.e. a single zone approach is considered in order to evaluate the burned
fuel fraction at each crank angle during combustion. For the purpose the first law of
thermodynamics of an ideal gas mixture in a closed system is applied (eq. 4.1) where the derivatives
are expressed in terms of the crank angle position (𝜃). A measured cylinder pressure trace 𝑝(𝜃) and
a calculated gas volume 𝑉(𝜃) is applied to the equation from which the effective net heat release
rate 𝑄𝑛𝑛𝑛(𝜃) is approximated.
θγθγγ
θ ddpV
ddVp
ddQnet
11
1 −+
−= (4.1)
θθθ ddQ
ddQ
ddQ
Q HTnetff +== (4.2)
The liberated heat of the fuel 𝑄𝑓 (eq. 4.2) is the sum of the effective net heat release plus heat
transfer/loss 𝑄𝐻𝐻 that is approximated from Woschni’s heat transfer correlation41. In eq. 4.3 ��𝑓 is
integrated from the point of fuel ignition and throughout the expansion stroke in order to determine
the trace of the fuel burn fraction )(θbx .
( )∫
∫∫⋅
⋅−⋅=
∆+
TOIf
TOIf
TOIf
b dQ
dQdQx
θ
θθθ
θθθ
(4.3)
The trapped gas at the time/crank angle where the cylinder gas compression starts is a mixture of
fresh gas and hot residual gas products from the previous engine cycle. The share of the residual gas
is calculated using Blair’s empirical correlation42 for uniform cylinder scavenging. The unknown
temperature of the gas mixture at the start of compression is calculated through an iterative

17
procedure over a few computational engine cycles. The iteration is stopped once the calculated
mixture temperature has converged. In the single-zone approach the gas properties are updated
every crank angle and the composition of the cylinder gas is assumed to be in the state of chemical
equilibrium if the mean gas temperature is above 1200 K. Otherwise the gas composition remain
frozen. The crank angle resolved gas compositions are used to determine the ratio of the specific
heats 𝛾 needed in eq. 4.1.
Figure 4.1 holds the measured cylinder pressure traces and calculated fuel burn traces of the four
model cases. The fuel ignites close to TDC (Crank angles ATDC = 0) but the shape of the burn
fraction and the combustion duration varies with the load. The combustion duration (with respect to
crank angles) increases with the engine load due to higher engine speeds (as seen in Table 4.2) and
since more fuel is added per cycle. According to the fuel burn traces premixed combustion is
absent. Premixed combustion is normally depicted as a very high burned fuel gradient close to TDC
and is merely linked to the combustion process of smaller engines with higher engine speeds. As a
result the multizone model in this work reasonably aims at simulating a fully mixing controlled
combustion process.
Figure 4.1. Experimental cylinder pressures and modeled fuel burn fractions with respect to crank angle position. The legends refer to the engine load.

18
4.3 Burned zones and gas mixing
In a compression ignited and mixing controlled diesel combustion process a stoichiometric flame
zone encloses the decomposing fuel spray43. The complex nature of the spray and flame is not
directly modeled in this work. Instead the model seeks to reproduce flame conditions by distributing
the injected fuel in multiple burned gas zones with no spatial location (0D model). At each crank
angle from the point of fuel ignition and till combustion ends a new burned zone is formed. The
burning fuel is initially mixed with fresh gas (air + residual gas) at λ = 1. The burned zone (flame)
temperature is calculated from the assumption that the mixture enthalpy is conserved at chemical
equilibrium. This is a common approach41 due to the high flame temperature of about 2700 K which
implies that the chemical reactions between the fuel and the fresh gas proceed very fast. Hereafter a
burned zone is diluted with fresh gas every crank angle at a defined rate as described later. No more
fuel is added to a burned zone and no gas exchange is considered between burned zones either.
Consequently a burned zone grows leaner (λ>1) throughout the expansion stroke. The process of
the burned zones is illustrated in Figure 4.2 from the point of fuel ignition.
Figure 4.2. The process of the burned zones from the crank angle where fuel ignition takes place θ ign. Δθ represents the model resolution of 1 CAD. The numbers in the figure refer to a burned zone number.
The rate at which fresh gas is mixed into a burned zone is assumed to be constant for every crank
angle. Should the local excess air ratio of a burned zone exceed the overall excess air ratio then no
more fresh gas is added to the zone. By weighting the overall mass of cylinder charge air according
to the fuel burn fraction trace (Figure 4.1) the threshold of fresh air (mmax) that can potentially mix

19
into each burned zone during combustion and expansion until the exhaust valve opens (EVO) is
calculated. mmax is then used to express the mixing rate as seen in eq. 4.4 where N denotes the
number of crank angles between the time of ignition (TOI) and (EVO). In order to investigate the
effect of gas mixing the mixing factor β is introduced in the equation. Just before TOI the relative
fresh gas volume (V ) is one. During combustion and gas mixing the share of fresh gas reduces and
the mixing rate of subsequent burned zones is assumed to decrease in line with V . For a given
burned zone V represents the relative fresh gas volume exactly at the crank angle where the zone is
created. The mixing rate for the burned zones in equation 4.4 now involves mmax and V that are
unique for each burned zone whereas β and N are global parameters. Moreover mmax, V and N are
outputs of the engine model. Hence β acts as the only mixing calibration factor and must be tuned
for each simulation case in order reproduce experimental gas data. The mixing rate is a very rough
simplification of the complex nature of air entrainment into the flame and combustion products. On
the other hand the effect of mixing in terms of gas species formation can be fairly inspected with the
suggested correlation.
bzmix V
Nmm maxb= (4.4)
Temperature and excess air traces of burned zones
During the expansion stroke the burned zones cool due to gas mixing and expansion. The cooling is
assumed to take place in two steps. First the burned zones mix with colder fresh gas at constant
pressure. The mixing provides an intermediate temperature 𝑇∗ that is calculated by conserving the
total enthalpy. The gas mixture of a burned zone is assumed to be in the state of general chemical
equilibrium if the resulting temperature is more than 1200 K. Otherwise the mixture chemistry is
assumed to be frozen. Secondly the ideal gas law on a differential form (eq. 4.5) with respect to 𝜃 is
applied to calculate the temperature gradient resulting from the expansion. The updated temperature
of the burned zone is then determined using Euler integration as shown in eq. 4.6. Temperature and
excess air ratio variations throughout the expansion stroke of three selected burned zones (1, 11 and
24) are illustrated in Figure 4.3. The traces correspond to 50 % engine load and will change slightly
with the load. Yet for two mixing rates; β = 0.5 and β = 1.0 the figure illustrates the principles of

20
gas mixing and cooling of the burned zones. By definition; if β = 1 then the first formed burned
zone will be mixed with fresh gas to the overall excess air ratio exactly at EVO (110 crank angles
ATDC) as seen in the figure. The left most point on each of the traces represents the approximated
flame condition where the temperature is around 2700K and the mixture is stoichiometric i.e. λ = 1.
If β is increased then more fresh gas is mixed into the burned zones. This results in higher local
excess air ratios throughout the expansion stroke but it lowers the local temperatures in turn. The
hindered mixing rates of subsequent burned zones (e.g. 11 and 24) by introducing 𝑉� in eq. 4.4 are
demonstrated by the ever reducing gradients of the local excess air ratio traces.
θθθ ddTmR
ddVp
ddpV =+ (4.5)
( ) ( ) θθ
θθθ ∆⋅+≈∆+ddTTT * (4.6)
Figure 4.3. Local temperatures and excess air ratios versus gas mixing (β) for three selected burned zones (1, 11 and 24).

21
Model calibration
In the phenomenological multizone model the chemical reactions take place in the burned zones
only. The fresh gas chemistry is essentially frozen throughout the cycle as the temperature is never
more than ≈900 °C around max pressure close to TDC. The initial composition of the burned zones
is described by chemical equilibrium at the corresponding flame temperature. At every crank angle
during the expansion stroke the composition of the burned zones is updated by integrating the
chemical reaction rates of the sulfur reaction mechanism through a subroutine in CANTERA. The
kinetics is integrated using post process procedure based on the known temperature traces and
species balances.
In contrast to the major gas products of fuel combustion such as H2O and Carbon dioxide (CO2)
NO formation is very sensitive to the temperature and gas mixing history of the burned zones. For
the four operating cases listed in Table 4.2 experimental data of NO concentrations in the exhaust
gas is provided and the multizone model is calibrated by adjusting the gas mixing rate to all burned
zones through β in order to reproduce the measured NO values. This makes NO the key species in
terms of model calibration and not SO3 since no such experimental data were available. The model
calibration provides the unknown fresh gas mixing history to the burned zones for the different
loads. The procedure is more carefully described in the published material (app. A.1). The resulting
β-values are listed in Table 4.2 and show that β is consistently less than one which means that none
of the burned zones are mixed fully to the overall excess air ratio. Moreover the magnitude of β is
found to reflect the engine speed inversely. This suggests that β is a function of the engine speed
which seems rational as lower speeds leaves more time for gas mixing. For the same reason the
model predicts higher NO production at reduced speeds in agreement with practical experiences of
large low speed marine engines.
4.4 Model Results
According to Figure 3.2 the gaseous H2SO4 formation is thermodynamically confined to
temperatures of less than ≈1000 K. This is generally less than the minimum temperature of the
burned zone traces depicted in Figure 4.3 and H2SO4 formation is negligible in the hot gas products
throughout the engine cycle. Formation of SO3 (expressed as ε-traces, eq. 3.1) in selected burned
zones at 50 % engine load and 2.0 % m/m fuel sulfur are presented in Figure 4.4. The leftmost point

22
on each trace represents the approximated stoichiometric flame condition where the very low ε-
value indicates that the sulfur compounds are nearly represented by SO2 only. In the first ≈10 zones
SO3 forms considerably as the gas products cools during the expansion stroke and the fraction of
SO3 can exceed some 4-6 % at EVO. Yet the rapid SO3 formation is also followed by a quite
sudden stagnation. In subsequent zones the oxidation of SO2 to SO3 is hampered due to the
reducing cylinder pressure (during the gas expansion) resulting in lower partial pressures of reacting
species and consequently slower reaction kinetics. In addition the assumption of reduced gas mixing
rates for subsequent burned zones as illustrated in Figure 4.3 adds to the suppressing of SO3
formation through locally lower oxygen concentrations.
Figure 4.4. Formation of SO3 in burned zones at 50 % engine load and 2.0 % m/m fuel sulfur. The numbers in the figure refer to selected burned zones.
In Figure 4.5 the ε-traces of the same burned zones as in Figure 4.4 are plotted against the local
burned zone temperature instead of crank angle position. The figure also shows the thermodynamic
traces of ε that corresponds to chemical equilibrium. According to the figure the SO3 is rapidly
equilibrated at the highest temperatures where the thermodynamic and the kinetic traces are joined.
Nevertheless SO2 is the principal sulfur oxide at conditions close to the flame and SO3 formation is
very limited above 2000 K. The thermodynamic traces indicate that SO3 is increasingly favored as
the temperature decreases. However from about 1650 K the governing SO3 kinetics is generally too
slow to keep up with the thermodynamic growth. It is now concluded that the primary SO3
formation takes place in the temperature range from 2000 K to 1300 K as seen in the figure and the

23
governing SO3 reactions freeze along with the extinction of the free radicals (O and OH) as the
burned zones are cooled below 1300 K.
Figure 4.5. Formation of SO3 in burned zones versus temperature modeled for 50 % engine load and 2.0 % m/m fuel sulfur. The dashed traces represent general chemical equilibrium. The numbers in the figure refer to selected burned zones.
Thru simulations it is realized that elevated cylinder pressures acts to increase the oxidation of SO2
to SO3. Yet this trend is not clearly mirrored in Table 4.2 where the maximum cylinder pressure
𝑝𝑚𝑚𝑚 of each load case of the reference engine is listed together with the modeled ε-value of the
cylinder gas at EVO. The max pressure increases with engine load but the SO3 formation is also
hampered at higher loads due to higher engine speeds. This provides less gas mixing as illustrated
by the β-values in the table. The adverse effects of max pressure and engine speed provide that ε is
fairly uniform over the full operational range of the large two-stroke marine engine.
Engine load Speed NOexh pmax β λ t ε
% rpm ppmv bar - - - 25 78 1320 90 0.80 2.7 3.7 50 98 1236 118 0.79 2.4 3.9 75 112 1266 157 0.51 2.8 4.1 100 123 1119 172 0.34 2.3 2.7
Table 4.2. Model/reference engine operating data, calibrated β-values and ε-values of the cylinder gas at EVO modeled for 2 % m/m fuel sulfur.

24
The multizone model is used to investigate how the formation of SO3 differs with the fuel sulfur
content. For the purpose the operating data at 25 % engine load is used and it is assumed that the
cylinder pressure trace remains unchanged and does not change with the fuel composition/sulfur
content. With the calibrated mixing rate for the particular load case the overall ε-values of the
cylinder gas at EVO are calculated and plotted against the sulfur content in Figure 4.6. In the typical
sulfur range from 1-4 % m/m the ε-value is quite unaffected. Lower sulfur contents results in higher
SO2 to SO3 conversion and ε tends to increase asymptotically as the sulfur content approaches zero.
This can be explained by the thermodynamics that increasingly favors SO3 at the expense of SO2
when the aspect ratio of oxygen to sulfur is increased. This is realized for lower sulfur contents in
the current simulations since the gas mixing rate and thus the oxygen content in the burned zones
remains unchanged.
Figure 4.6. The fraction of fuel sulfur that is converted to SO3 versus the fuel sulfur content modeled at 25 % engine load.

25
4.5 Reducing the sulfur reaction mechanism
The applied sulfur subset of the sulfur reaction mechanism covers a large number of elementary
reactions that may be ignored in the lean post flame conditions prevailing in burned zones in the
present model formulation. The sulfur subset can be reduced as long as the distribution of sulfur
oxides are not compromised. In order to identify key reactions the multizone model and CANTERA
are efficiently combined. Hereby the rate of progress of all elementary reactions can be inspected
throughout the engine cycle where the gas composition, pressure and temperatures changes.
Elementary reactions can be eliminated for different reasons. As an example, consider reaction
R.4.1 where the molecules A and B react to form two new molecules C and D. R.4.1 can act in both
directions and the rate of progress is the net rate between the forward and backward production
rates 𝑞𝑓 and 𝑞𝑏 respectively. Production rates are determined by the rate constants 𝑘 and the molar
concentrations of the acting species as shown in eq. 4.7. The temperature dependent rate constants
are calculated by the use of Arrhenius expressions that are partly governed by chemical equilibrium
as shown in app. A.4.
𝐴 + 𝐵 ↔ 𝐶 + 𝐷 (R.4.1)
𝑞𝑛𝑛𝑛 = 𝑞𝑓 − 𝑞𝑏 = 𝑘𝑓[𝐴][𝐵] − 𝑘𝑏[𝐶][𝐷] (4.7)
In a reacting chemical system the rate at which A and B are consumed could be balanced by the rate
of their production through C and D. In this state the rate of progress of R.4.1 is zero and the
reaction does not act in an overall chemistry with multiple reactions. Similarly if the concentration
of either C or D is zero and the equilibrium of R.4.1 by far favor A and B then the rate of progress
is also zero. In reaction systems like a diesel process the pressure and the temperature is
significantly altered during gas expansion and the preferred equilibrium orientation may shift at
some point and prefer C and D. This will affect the rate of progress and the particular reaction can
no longer be ignored. In this case a negligible effect of R.4.1 would require that the product [A][B]
is essentially zero or that the associated activation energy is high enough to act as a reaction barrier.
By using a subroutine in CANTERA the rate of progress of all elementary reactions in the sulfur
subset is determined for each of the burned zones during the expansion stroke until EVO. With
reference to the above considerations any reaction in which the rate of progress throughout the
expansion stroke justifies its elimination is considered inactive and is removed from the sulfur
subset. For the purpose the H2/O2 subset and the CO/CO2 subset are kept unchanged. For the diesel

26
process it turns out that the distribution of sulfur oxides in lean post flame conditions can be
described by a heavily reduced sulfur subset without compromising the accuracy compared to the
full subset. A large part of the explanation lies in the fact that the H-S compounds and H-S-O
complexes are thermodynamically not preferred under the lean conditions and are present in such
small quantities that they do not contribute to the overall reaction chemistry. The revised sulfur
subset comprises the 7 elementary sulfur reactions presented in Table 4.3 wherein the number of
sulfur species is now only 4; i.e. SO, SO2, SO3 and HOSO2.
Reaction No. Reaction A β E/R
77 SO + O2 ↔ SO2 + O 7.6E3 2.37 2970
86 SO2 + O(+M) ↔ SO3(+M)a 3.7E11 0.00 1689
Low-pressure limit 2.4E27 -3.60 5186
Troe parameters 0.442, 316, 7442 88 SO2 + OH(+M) ↔ HOSO2(+M)b 5.7E12 -0.27 0
Low-pressure limit 1.7E27 -4.09 0
Troe parameters 0.10, 1E-30, 1E30 89 SO2 + SO2 ↔ SO3 + SO 5.0E07 2.00 37750
90 SO3 + H ↔ SO2 + OH 8.4E09 1.22 2980
93 SO3 + OH ↔ SO2 + HO2 4.8E04 2.46 13700
134 HOSO2 + O2 ↔ HO2 + SO3 7.8E11 0.00 656 aEnhanced third-body coefficients: N2 = 0, SO2 = 10, H2O = 10 bEnhanced third-body coefficients: N2 = 1, SO2 = 5, H2O = 5
Table 4.3. Revised sulfur subset for the modeling of SO3 formation in a large marine diesel engine. Arrhenius parameters in cal, cm, mol, s, K for k = ATβexp(-E/RT)
A comparison between the full and the revised sulfur subset is presented in Figure 4.7. The
comparison is viewed as modeled traces of overall ε-values i.e. the distribution of SO2 and SO3 in
the cylinder gas products. To challenge the revised subset the effect of modest and excessive gas
mixing (β=0.1 and β=1.5 respectively) is investigated. As shown in the figure no difference is
observed in the ε-traces for any mixing rate so no accuracy is lost with the revised subset. The
current findings are essential as the pathways for SO3 formation in a large marine engine are
clarified. In Figure 4.8 and 4.9 the rate of progress (relative rates) over the expansion stroke of the 7
reactions in the revised sulfur subset are presented for 5 selected burned zones. From the size of the
rates it is understood that Reaction 86 and 134 are the primary pathways to SO3 with the latter
being the most dominant. Reaction 134 forms SO3 via the HOSO2 intermediate produced in

27
reaction 88. Reaction 89 shifts direction during the process and despite its quite high activation
energy shown in Table 4.3 it accounts for about 5 percent of the overall SO3 formed. Reaction 90
and 93 generally serve to produce SO3 but their combined contribution is less than 5 percent.
Reaction 77 does not act in the production of SO3 but serves to consume SO that is
thermodynamically favored in minor concentrations at very high temperatures.
Figure 4.7. Overall SO3 formation versus crank angle position modeled with the full and the revised sulfur subset at different mixing rates (β), 50% engine load and 4.5 % m/m fuel sulfur.
Figure 4.8. Relative rates of progress of reaction number 88, 134, 86 and 89 in Table 4.3. Modeled at 50 % engine load and 4.5 % m/m fuel sulfur.

28
Figure 4.9. Relative rates of progress of reaction number 90, 93 and 77 Table 4.3. Modeled at 50 % engine load and 4.5 % m/m fuel sulfur.

29
5. Exhaust gas measurements of SO3
As shown later in this section simulations performed with the multizone model indicate that the
fraction of fuel sulfur that is converted to SO3 (ε) increases in line with the cylinder pressure and
reduces with the engine speed. It remains now to be reported if these trends are also reflected in
reality. Therefore a series of SO3 measurements are conducted with a heavy duty single cylinder
test engine that operates on HFO including sulfur. In the experiments SO3 is measured in the
exhaust gas under steady operating conditions. In order to alter the SO3 content the combustion
history is varied between experiments by altering the injected fuel mass, fuel injection timing,
engine speed and air-fuel ratio.
The response of NOx is investigated in parallel with SO3. From a thermodynamic point of view the
presence of the two species are not comparable as NOx is formed primarily at flame conditions (>
2000 K) whereas high temperature SO3 formation is confined primarily to temperatures less than
2000 K. However both species are sensitive to local gas mixing and rely heavily on species from the
radical pool such as OH and O. NOx formation has been shown to scale with the maximum cylinder
pressure in diesel engines44 and SO3 is believed to follow a comparable trend. In any case, parallel
investigations of NOx and SO3 will serve as valuable information and “fingerprints” with respect to
model validations. In the published material45 enclosed in app. A.2 a closer comparison between
NOx and SO3 measurements are provided but in the present report the results are primarily focusing
on SO3.
5.1 Experimental setup
Test engine specifications are listed in Table 5.1. During the measurements the cylinder pressure
trace is recorded with a resolution of 0.25 crank angles over 80 consecutive engine cycles by a
piezoelectric pressure transducer located in the combustion chamber. To remove noise the raw
pressure data are “smoothened” using the procedure of Harndorf46. From the measured cylinder
pressures the ROHR-traces are calculated by applying the first law of thermodynamics on a
differential form similarly to the procedure previously described in the multizone model. However
in the present approach the cylinder gas is considered to be a “real” gas where the internal energy is
determined using the technique of Zacharias47 and wall heat losses follows the procedure of
Hohenberg48,49. For further details see the published material45 enclosed in app. A.2.

30
Number of cylinders 1 Displacement volume 3.18 L Bore/stroke 150 mm / 180 mm Compression ratio 15 Rated speed 1500 rpm Rated Power 80 kW Fuel injection pressure Max. 1600 bar Pressure charging Fuel injection
External (adjustable) Single jet
Table 5.1. Specifications of the heavy duty engine used to investigate SO3 formation.
For practical reasons two HFO’s with similar sulfur contents of 1.6 and 2.24 % m/m are used in the
experiments. Specific fuel data are listed in Table 5.2. The Calculated Carbon Aromaticity Index
(CCAI) is a unit-less number that is frequently used to rank (roughly) the ignition quality of
residual fuel oils50,51. The number is based on the kinematic viscosity and the fuel density. The
lower the number the better are the ignition characteristics. The normal CCAI range is between 800
and 880 and satisfies fuel number 1 only. However ignition performance is also linked to engine
design and operating conditions and fuels with higher CCAI’s may operate successfully51 as
experienced with the present engine. According to the theoretical conversions of fuel sulfur
presented in Figure 4.6 slightly higher SO3 fractions can in principle be measured with fuel number
1 compared to fuel number 2 due to the lower sulfur content. However the difference of the slight
sulfur variations was not measureable.
C H S H2O N+O Ash (A/F)s*
Kin. viscosity at 50 °C
CCAI LHW
% m/m kgair/kgfuel mm2/s - kJ/kg Fuel 1 83.47 11.08 1.6 1.68 2.1 0.06 13.4 188 838 38759 Fuel 2 88.5 8.9 2.24 0.01 0.34 0.105 13.3 115 926 40288 *Stoichiometric air fuel ratio
Table 5.2. Specification of test fuels used to investigate SO3 formation.
Exhaust gas emissions are sampled in a circular (100 mm) exhaust pipe downstream a gas receiver
that works as a gas mixer and damps pressure pulsations produced by the cyclic engine process. A
schematic illustration of the experimental facility is shown in Figure 5.1. The engine is operated to
produce an exhaust gas temperature that is above the acid dew point temperature all the way to the
SO3 sample location. The dew point can be calculated from an empirical correlation and is a
function of the SO3 and H2O pressure52,53. To avoid acid condensation in the exhaust system a
gas/surface temperature of minimum 140-150 °C is required for the present experiments.

31
Figure 5.1. Experimental setup used to investigate SO3 formation.
By compensating for the sulfur bonded to SO3 and by neglecting any sulfur bonded to particulate
mass the SO2 concentration in the exhaust gas is calculated from the fuel composition and the
excess air that is determined from measured exhaust gas compositions. In this respect CO2/CO and
the O2 concentrations are measured in the exhaust gas with an Infrared Gas Analyzer (IRD) and a
Paramagnetic Detector (PMD) respectively. NOx is measured with a Chemiluminescence Analyzer
(CLD). The exhaust gas was analyzed by sampling the exhaust for 4-5 minutes after the thermal
response of the exhaust system had stabilized. In contrast SO3 was sampled for 20-30 minutes in
order to assess variations of online SO3 readings.
5.2 Review of available SO3 measurement techniques
Complications arise from the highly reactive nature of SO3 from which SO3 measurements are
challenged and might biased24,25,54: 1) SO3 is a highly reactive gas that reacts with minerals of alkali
ash such as magnesium oxide (MgO) and calcium oxide (CaO). 2) SO3 measurements can be biased
due to much higher concentrations of SO2. 3) SO3 may react with surfaces e.g. in the sampling line.
4) SO3 and H2O form gaseous H2SO4 that may condense on “cold” surfaces and on particulate
matter. 5) HFO often contain small fractions of vanadium that can be oxidized and catalyze the
oxidation of SO2 to SO355,56.
Current experiences of SO3 measurements are generally based on gas sampling in the exhaust ducts
of coal fired power plants and the gas in those ducts does not fully represent a HFO exhaust gas. As
an example the fraction of ash forming matter in typical power plant coals can be as high as 10-30
% by mass2. During combustion a fraction of the ash forming matter is thermal decomposed and
oxidized into an alkaline ash. Depending on the gas temperature, the alkalinity of the ash as well as
the SO3/H2SO4 content significant amounts of SO3 may be “lost” to the ash24 which will bias the
measurements. However, heavy fuel oils produce much less ash than coal and noncombustible
materials such as mineral inclusions are virtually absent57.

32
Common methods for measuring SO3 involves: 1) absorption of SO3/H2SO4 in an isopropanol
(IPA) solution, 2) separation of SO3/H2SO4 by controlled condensation and 3) an indirect
measurement through the SO3/H2SO4 dew point temperature. A brief description of the methods is
provided hereafter. Other methods involving Fourier Transform Infrared Spectroscopy25 (FTIR),
SO3 capture in salts54,58, and yet an indirect measurements where the SO3 content is linked to
formation of CO2 through a plug of calcium oxalate59 (CaC2O4) have shown promising results but
are not reviewed in this work. Among the reviewed methods the controlled condensation method
(CCD)60 that is also known as the controlled condensation system (CCS) is the most preferred
technique and is recommended by many researchers58 as well as the U.S Environmental Protection
Agency (EPA). However the British and the American standards for CCD have been withdrawn54.
In this work the PENTOL SO3 monitor is used. The monitor is a modified version of the instrument
formerly known as the Severn Science Analyzer. The principle is described by Jackson61 and has
been used for many years at the Central Electricity Generating Board with apparent succes62 and in
a number of power plants in the USA25. The principle is based on SO3 absorption in an IPA
solution where the gas sampling and subsequent SO3 analysis is automated. Published data on the
accuracy does not seem to exist but the manufacturer states that the accuracy of the monitor is ± 5%
of reading in the calibrated range. Moreover parallel measurements performed with the SO3
monitor and the CCD method in a HFO power station resulted in SO3 concentrations with no
significant difference61.
Acid dew point meter
A stick shaped probe is inserted into the exhaust duct and a sulfuric acid film forms on the probe tip
whenever its temperature is below the acid dew point. The highly conductive film enables an
electric current between two electrodes that are fabricated into the probe tip together with a
thermocouple. The electric current and the probe tip temperature are logged. The tip temperature is
regulated by cooling air supplied to the probe tip within the probe. The strength of the electric
current is a relative measure of the condensed film thickness. After some adjustment of the cooling
air flow rate it is possible to achieve a stable current. A stable current indicates that the rate of acid
condensation and evaporation on the probe tip is balanced and the corresponding tip temperature is
the measured acid dew point63 temperature. The dew point measurement relies on the reasonable
assumption that the gas phase reaction H2O + SO3 → H2SO4 is infinitely fast. Through an
33
empirical dew point correlation such as the one suggested by Verhoff and Banchero52 in eq. 5.1 the
SO3 concentration in the sample gas is determined from the measured dew point temperature 𝑇𝑚,𝑑
and a known H2O content. The accuracy of the principle is generally good except in gas streams
where H2SO4 mist is formed as well as in dirty streams where tip deposits may interfere with the
readings62.
1𝐻𝑎,𝑑
= 2276𝐸−6 − 2943𝐸−8 ln(𝑝𝐻2𝑆) − 858𝐸−7 ln(𝑝𝐻2𝑆𝑆4) + 620𝐸−8 ln(𝑝𝐻2𝑆𝑆4) ln(𝑝𝐻2𝑆) (5.1)
EPA Method 8
The EPA method 8 was designed to measure the H2SO4 mist from sulfuric acid plants. A steady
and known flow of sample gas is continuously sampled for 1-2 hours through a heated glass-lined
probe. The gas is then passed through an ice cooled impinger containing a solution of IPA and
water. As the gas passes the impinger the H2SO4 is absorbed and stored. After the sampling the
solution in the impinger is titrated in order to determine the acid strength and thereby the
SO3/H2SO4 concentration in the flue gas. Isopropanol is used because of a limited solubility of SO2
in organic alcohols. Nonetheless it is known that SO2 from the sample gas may absorb and oxidize
in the IPA solution and form acid components. The errors induced can be equal to or greater than
the actual concentration of SO3 in the flue gas62.
Controlled Condensation Method (CCD)
The better alternative to the EPA Method 8 is the CCD method where a steady and known sample
gas flow is continuously sampled for 1-2 hours through a heated glass-lined probe. In the CCD
method a heated quartz wool filter placed after the probe is used to capture particulate matter from
the sample gas prior to a liquid cooled condenser where the sulfuric acid is fully condensed. The
cooling liquid is maintained at ≈80°C which is lower than the sulfuric acid dew point but above the
dew point of pure water. Still fractions of water will condense together with the acid according to
the H2O-H2SO4 VLE. With the CCD method interference from SO2 is theoretically excluded and
the SO3/H2SO4 concentration in the sample gas is determined through a titration of the condensed
acid solution. The CCD method has provided repeatable and accurate measurements in controlled
conditions62.

34
PENTOL SO3 Monitor
A steady and known sample gas flow is continuously extracted through a heated (200 °C) glass-
lined (quartz) sample probe. Figure 5.2 shows the 1.5 meter probe mounted in the exhaust pipe of
the present SO3 campaign. The probe can be supplied from the manufacturer in different lengths
upon request. In the probe head at the probe exit the gas passes a heated quartz wool filter just
before it is mixed into an IPA solution. The liquid solution is supplied from an external vessel via
the umbilical shown in the figure. The IPA solution absorbs the SO3/H2SO4 compounds from the
sample as sulfate ions (SO42-). Via the umbilical the solution is then passed through a reaction bed
of barium chloranilate crystals where the SO42- ions reacts to form acid chloranilate ions as seen in
R.5.1
𝑆𝑆42− + 𝐵𝐵𝐶6𝑆4𝐶𝐶2 + 𝐻+ → 𝐵𝐵𝑆𝑆4 + 𝐻𝐶6𝑆4𝐶𝐶2− (R.5.1)
The acid ions absorb light preferably at 535 nm and are detected in the solution with a photometer.
By maintaining a constant flow of IPA solution and sample gas the SO3/H2SO4 concentration in the
sample gas is proportional to the absorbed light. Prior to use the monitor is calibrated with
calibration liquids equivalent to 5 ppmv and 45 ppmv of SO3 in sample gas. Chemical conversions
and analysis take place in the reaction module shown in Figure 5.2 and via the CPU the photometer
signals are transformed to online data readings of SO3 concentrations.
Figure 5.2. Left: Installation of PENTOL SO3 probe in exhaust system. Right: PENTOL SO3 monitor
35
5.3 Experimental results
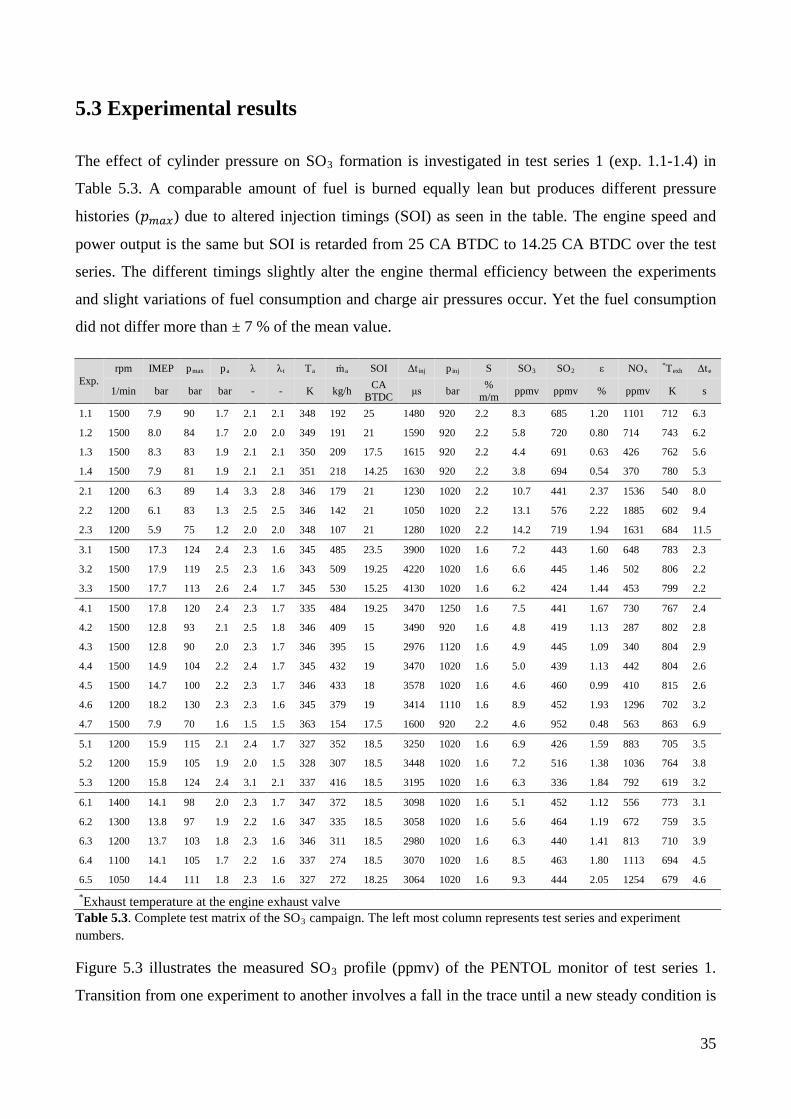
The effect of cylinder pressure on SO3 formation is investigated in test series 1 (exp. 1.1-1.4) in
Table 5.3. A comparable amount of fuel is burned equally lean but produces different pressure
histories (𝑝𝑚𝑚𝑚) due to altered injection timings (SOI) as seen in the table. The engine speed and
power output is the same but SOI is retarded from 25 CA BTDC to 14.25 CA BTDC over the test
series. The different timings slightly alter the engine thermal efficiency between the experiments
and slight variations of fuel consumption and charge air pressures occur. Yet the fuel consumption
did not differ more than ± 7 % of the mean value.
Exp. rpm IMEP pmax pa λ λ t Ta ṁa SOI Δt inj p inj S SO3 SO2 ε NOx *Texh Δte
1/min bar bar bar - - K kg/h CA BTDC μs bar %
m/m ppmv ppmv % ppmv K s
1.1 1500 7.9 90 1.7 2.1 2.1 348 192 25 1480 920 2.2 8.3 685 1.20 1101 712 6.3
1.2 1500 8.0 84 1.7 2.0 2.0 349 191 21 1590 920 2.2 5.8 720 0.80 714 743 6.2
1.3 1500 8.3 83 1.9 2.1 2.1 350 209 17.5 1615 920 2.2 4.4 691 0.63 426 762 5.6
1.4 1500 7.9 81 1.9 2.1 2.1 351 218 14.25 1630 920 2.2 3.8 694 0.54 370 780 5.3
2.1 1200 6.3 89 1.4 3.3 2.8 346 179 21 1230 1020 2.2 10.7 441 2.37 1536 540 8.0
2.2 1200 6.1 83 1.3 2.5 2.5 346 142 21 1050 1020 2.2 13.1 576 2.22 1885 602 9.4
2.3 1200 5.9 75 1.2 2.0 2.0 348 107 21 1280 1020 2.2 14.2 719 1.94 1631 684 11.5
3.1 1500 17.3 124 2.4 2.3 1.6 345 485 23.5 3900 1020 1.6 7.2 443 1.60 648 783 2.3
3.2 1500 17.9 119 2.5 2.3 1.6 343 509 19.25 4220 1020 1.6 6.6 445 1.46 502 806 2.2
3.3 1500 17.7 113 2.6 2.4 1.7 345 530 15.25 4130 1020 1.6 6.2 424 1.44 453 799 2.2
4.1 1500 17.8 120 2.4 2.3 1.7 335 484 19.25 3470 1250 1.6 7.5 441 1.67 730 767 2.4
4.2 1500 12.8 93 2.1 2.5 1.8 346 409 15 3490 920 1.6 4.8 419 1.13 287 802 2.8
4.3 1500 12.8 90 2.0 2.3 1.7 346 395 15 2976 1120 1.6 4.9 445 1.09 340 804 2.9
4.4 1500 14.9 104 2.2 2.4 1.7 345 432 19 3470 1020 1.6 5.0 439 1.13 442 804 2.6
4.5 1500 14.7 100 2.2 2.3 1.7 346 433 18 3578 1020 1.6 4.6 460 0.99 410 815 2.6
4.6 1200 18.2 130 2.3 2.3 1.6 345 379 19 3414 1110 1.6 8.9 452 1.93 1296 702 3.2
4.7 1500 7.9 70 1.6 1.5 1.5 363 154 17.5 1600 920 2.2 4.6 952 0.48 563 863 6.9
5.1 1200 15.9 115 2.1 2.4 1.7 327 352 18.5 3250 1020 1.6 6.9 426 1.59 883 705 3.5
5.2 1200 15.9 105 1.9 2.0 1.5 328 307 18.5 3448 1020 1.6 7.2 516 1.38 1036 764 3.8
5.3 1200 15.8 124 2.4 3.1 2.1 337 416 18.5 3195 1020 1.6 6.3 336 1.84 792 619 3.2
6.1 1400 14.1 98 2.0 2.3 1.7 347 372 18.5 3098 1020 1.6 5.1 452 1.12 556 773 3.1
6.2 1300 13.8 97 1.9 2.2 1.6 347 335 18.5 3058 1020 1.6 5.6 464 1.19 672 759 3.5
6.3 1200 13.7 103 1.8 2.3 1.6 346 311 18.5 2980 1020 1.6 6.3 440 1.41 813 710 3.9
6.4 1100 14.1 105 1.7 2.2 1.6 337 274 18.5 3070 1020 1.6 8.5 463 1.80 1113 694 4.5
6.5 1050 14.4 111 1.8 2.3 1.6 327 272 18.25 3064 1020 1.6 9.3 444 2.05 1254 679 4.6 *Exhaust temperature at the engine exhaust valve
Table 5.3. Complete test matrix of the SO3 campaign. The left most column represents test series and experiment numbers.
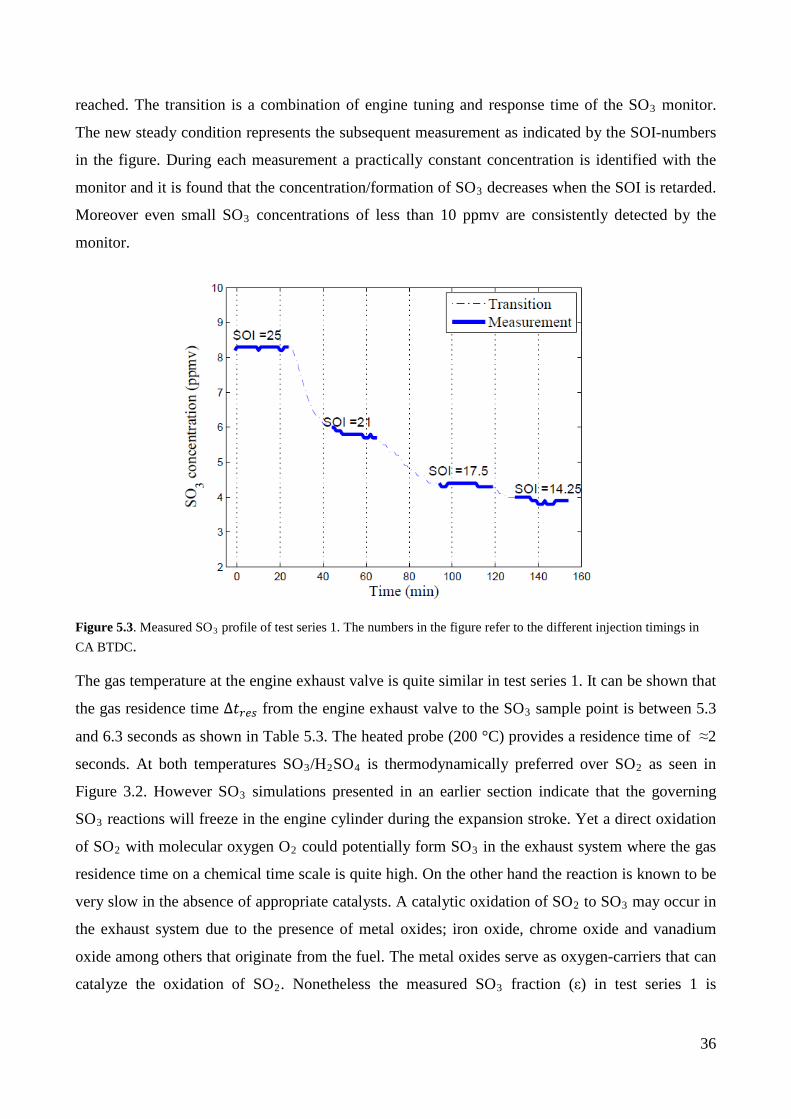
Figure 5.3 illustrates the measured SO3 profile (ppmv) of the PENTOL monitor of test series 1.
Transition from one experiment to another involves a fall in the trace until a new steady condition is
36
reached. The transition is a combination of engine tuning and response time of the SO3 monitor.
The new steady condition represents the subsequent measurement as indicated by the SOI-numbers
in the figure. During each measurement a practically constant concentration is identified with the
monitor and it is found that the concentration/formation of SO3 decreases when the SOI is retarded.
Moreover even small SO3 concentrations of less than 10 ppmv are consistently detected by the
monitor.
Figure 5.3. Measured SO3 profile of test series 1. The numbers in the figure refer to the different injection timings in CA BTDC.
The gas temperature at the engine exhaust valve is quite similar in test series 1. It can be shown that
the gas residence time ∆𝑡𝑟𝑛𝑟 from the engine exhaust valve to the SO3 sample point is between 5.3
and 6.3 seconds as shown in Table 5.3. The heated probe (200 °C) provides a residence time of ≈2
seconds. At both temperatures SO3/H2SO4 is thermodynamically preferred over SO2 as seen in
Figure 3.2. However SO3 simulations presented in an earlier section indicate that the governing
SO3 reactions will freeze in the engine cylinder during the expansion stroke. Yet a direct oxidation
of SO2 with molecular oxygen O2 could potentially form SO3 in the exhaust system where the gas
residence time on a chemical time scale is quite high. On the other hand the reaction is known to be
very slow in the absence of appropriate catalysts. A catalytic oxidation of SO2 to SO3 may occur in
the exhaust system due to the presence of metal oxides; iron oxide, chrome oxide and vanadium
oxide among others that originate from the fuel. The metal oxides serve as oxygen-carriers that can
catalyze the oxidation of SO2. Nonetheless the measured SO3 fraction (ε) in test series 1 is

37
generally low as seen in Table 5.3. Especially in experiment 1.4 where ε is 0.54. Moreover the
exhaust gas conditions are similar with respect to temperature, residence time, SO2 concentration
and excess air ratio in test series 1. With this in mind the measured ε-differences of the test series is
most likely caused by the altered operating conditions and the contribution of gaseous or catalytic
SO3 formation in the exhaust system seems very limited.
The ROHR (rate of heat release) traces in Figure 5.4 illustrate the combustion histories of test series
1. It is observed that earlier injections advance the point of ignition relative to TDC. In addition
early injections promote the share of premixed combustion that is represented by the area below the
ROHR peak close to TDC. With early injections more fuel burns around TDC where the cylinder
volume is small and the max pressure is altered from 81 bar to 90 bar in test series 1. As seen in the
figure the operating pressure appears to have a similar effect on the measured SO3 and NOx
concentrations in the exhaust gas. This makes sense as elevated pressures provide higher molar
densities/partial pressures of governing reactants resulting in faster chemical kinetics. The influence
of pressure on SO3 formation is best illustrated by ε and shown in the figure. The ε-values increase
in line with the maximum cylinder pressure meaning that a higher fraction of the fuel sulfur is
converted to SO3 when the operating pressure is increased. Still it is not clear whether the altered
pressure histories are solely responsible for that. An argument for this is that the share of premixed
combustion is not comparable in test series 1 as indicated in the figure. The share premixed
combustion accounts for 34 % of the fuel energy in experiment 1.1 but only 17 % in experiment
1.4.
In test series 2 in Table 5.3 the influence of premixed combustion on SO3 formation is investigated.
In the three experiments premixed combustion is promoted by reducing the engine speed (compared
to test series 1) combined with early fuel injections at 21 CA BTDC. Furthermore the cylinder
pressure history is altered between the experiments via different charge air pressures 𝑝𝑚 that alters
the trapped excess air ratio 𝜆𝑛. Later in this section it is shown that changing the excess air ratio
does not seem to effect SO3 formation. The ROHR traces of test series 2 are presented in Figure 5.5
together with the trace of experiment 1.3 for comparison. The share of premixed combustion is
comparably high and heterogeneous mixing controlled combustion is nearly absent in series 2. But
in agreement with test series 1 the fraction of SO3 (ε) in the exhaust gas increases in line with the
max pressure as seen in the figure. Yet despite the similar max pressure range of the two series the
ε-values are significantly higher in test series 2. The effect of engine speed on SO3 formation is
investigated later in the section and demonstrates that the reduced engine speed in series 2 cannot
explain the large ε-differences compared to test series 1. It is concluded that SO3 formation is

38
promoted with the share of premixed combustion and the results of ε in test series 1 are influenced
by the inconsistent premixed proportions. The measured concentrations of SO3 versus max pressure
of test series 2 in Figure 5.5 are not readily comparable due to the different excess air ratios shown
in Table 5.3. The same applies to the NOx measurements. But despite the more lean air fuel
mixtures in test series 2 both SO3 and NOx are present in remarkably higher concentrations
compared to test series 1. This is likely explained by the superior fractions of premixed combustion
that acts to increase their rate of formation. Premixed combustion refers to injected fuel that
evaporates and mixes partly with air prior to the point of fuel ignition. At ignition the premixed
portion burns rapidly but incompletely. As a result intermediate gas products like CO are formed in
the combustion chamber before the more complete oxidation. CO flames produce high
concentrations of oxygen atoms64 that combined with SO2 is a significant source of SO3
formation11. This may explain the superior SO3 fractions experienced in test series 2. Moreover 1D
staged combustion reactor experiments i.e. rich combustion prior to secondary air entrainment for
completing combustion have shown to increase SO3 formation19,20 compared to single stage
combustion at the same air-fuel ratios. CO flames doped with sulfur species have also shown to
produce increased amounts of SO3 compared to sulfur doped methane flames21 that involve smaller
concentrations of atomic O.
Figure 5.4. Test series 1. Left: ROHR traces. Upper right: Fraction of fuel sulfur converted to SO3 versus max cylinder pressure. Lower right: Specific emissions of SO3 and NOx versus max cylinder pressure. The max pressure increases with earlier fuel injections relative to TDC.
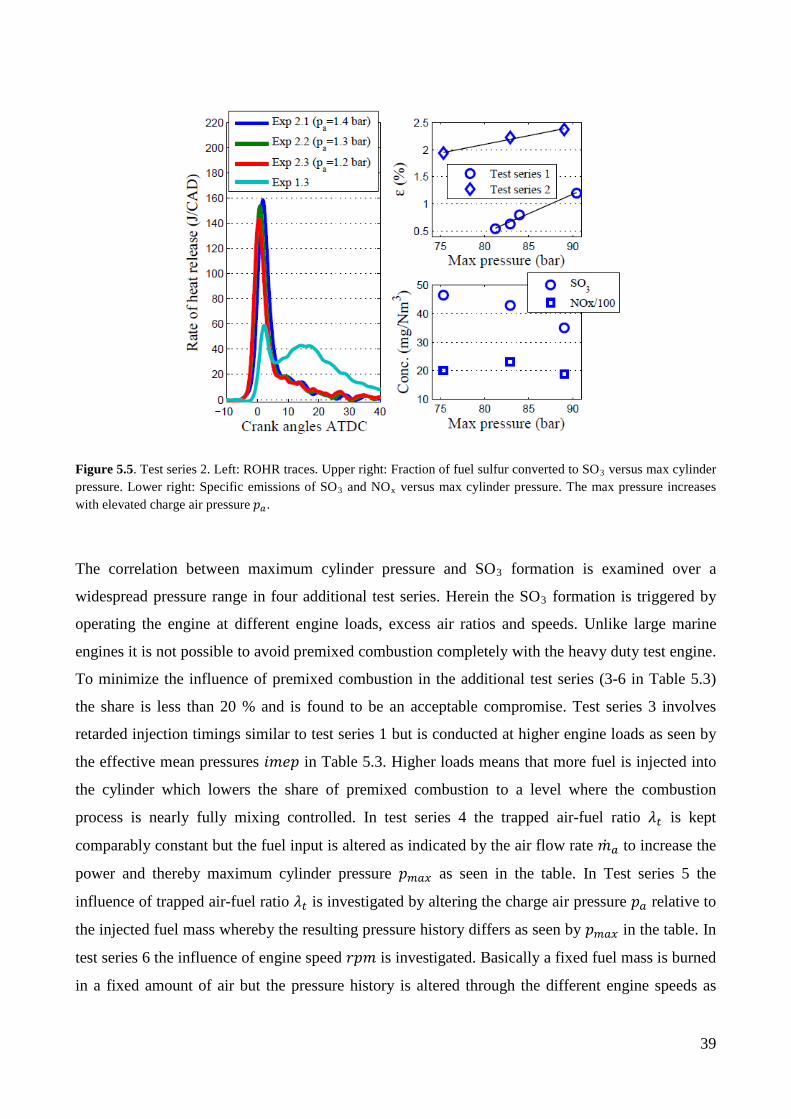
39
Figure 5.5. Test series 2. Left: ROHR traces. Upper right: Fraction of fuel sulfur converted to SO3 versus max cylinder pressure. Lower right: Specific emissions of SO3 and NOx versus max cylinder pressure. The max pressure increases with elevated charge air pressure 𝑝𝑚.
The correlation between maximum cylinder pressure and SO3 formation is examined over a
widespread pressure range in four additional test series. Herein the SO3 formation is triggered by
operating the engine at different engine loads, excess air ratios and speeds. Unlike large marine
engines it is not possible to avoid premixed combustion completely with the heavy duty test engine.
To minimize the influence of premixed combustion in the additional test series (3-6 in Table 5.3)
the share is less than 20 % and is found to be an acceptable compromise. Test series 3 involves
retarded injection timings similar to test series 1 but is conducted at higher engine loads as seen by
the effective mean pressures 𝑖𝑖𝑖𝑝 in Table 5.3. Higher loads means that more fuel is injected into
the cylinder which lowers the share of premixed combustion to a level where the combustion
process is nearly fully mixing controlled. In test series 4 the trapped air-fuel ratio 𝜆𝑛 R is kept
comparably constant but the fuel input is altered as indicated by the air flow rate ��𝑚 to increase the
power and thereby maximum cylinder pressure 𝑝𝑚𝑚𝑚 as seen in the table. In Test series 5 the
influence of trapped air-fuel ratio 𝜆𝑛 is investigated by altering the charge air pressure 𝑝𝑚 relative to
the injected fuel mass whereby the resulting pressure history differs as seen by 𝑝𝑚𝑚𝑚 in the table. In
test series 6 the influence of engine speed 𝑟𝑝𝑖 is investigated. Basically a fixed fuel mass is burned
in a fixed amount of air but the pressure history is altered through the different engine speeds as

40
indicated by 𝑝𝑚𝑚𝑚 in the table. A more detailed description of the experiments can be found in the
published material45 enclosed in app. A.2. Figure 5.6 presents the measured ε-values with respect to
maximum cylinder pressure of the 6 different test series. Test series 4 cover the entire max pressure
range from 70 bar to 130 bar wherein the ε-values are shown to increase proportionally from 0.5 %
to 1.9 %. In fact the resulting ε-values are well represented by a linear fit.
Figure 5.6. Correlation between maximum cylinder pressure and fuel sulfur converted to SO3. The numbers in the figure refer to the experiments in Table 5.3.
The max pressure range of test series 3 is moderate. Yet there is no clear indication that the altered
injection timings influences SO3 formation apart from the accompanied pressure changes and the ε-
values tend to follow the general trend of test series 4 as seen in Figure 5.6. Neither does the
trapped air fuel ratio seem to affect SO3 formation. This is illustrated by the results of test series 5
in the figure where the response of ε does not deviate from the general trend of test series 4. This
suggests that ε in series 5 is elevated by the increased pressure histories rather than the excess air
ratio. The statement is supported by the results of test series 2 where the charge air pressure is
altered likewise to alter the air fuel ratio. As seen in Figure 5.6 the resulting ε-values of series 2
follow a linear fit with the same gradient as the linear fit of test series 4. This leads to a general
conclusion that elevated operating pressures yield higher molar densities/partial pressures of gas
species that improve the governing reaction kinetics in terms of SO2 to SO3 conversion.

41
The linear fit through the dataset of test series 6 in Figure 5.6 deviates from the general trend as
demonstrated by a steeper slope compared to series 4. In test series 6 the ε-value decreases with the
engine speed. In other words a reduction of the engine speed promotes SO3 formation but the ε-
values in the series are possibly affected in more than one way. When the speed is reduced the
operating pressure increases. But more important more time is available for chemical reactions and
gas mixing i.e. air entrainment into the hot gas products in the cylinder.
5.4 Multi zone model vs. experimental results
In order to validate the phenomenological multizone approach (combined with the sulfur reaction
mechanism) it is desired to adapt the engine model to the heavy duty test engine and seek to
reproduce the experimental data presented in this section. Currently this task has not been
undertaken. Instead a rough validation is performed by reproducing experimental trends only. If it is
assumed that the net heat release trace 𝑄𝑛𝑛𝑛(𝜃) of a simulation case (Table 4.2) is independent of
the engine speed then the resulting cylinder pressure trace 𝑝(𝜃) is also independent of the engine
speed. This is not rational in practice as the rate of combustion cannot be directly controlled.
Anyway in the multizone model the rate of fresh gas mixing into the hot combustion
products/burned zones is determined by ṁmix in eq. 4.4. The mix gain factor β likely decreases with
the engine speed since less time is available for gas mixing. As a result β is considered as a relative
measure of engine speed. In Figure 5.7 the effect of β on SO3 formation is illustrated for the 50 %
load case. Elevated gas mixing promotes SO3 formation as seen from ε in the figure. Stating that β
scales linearly with the engine speed is a postulate. Nevertheless this assumption is now used to
correlate SO3 formation to the engine speed. The calibrated β-value at 50 % engine load is 0.79 and
the engine speed is 98 rpm. With the linear approximation β should be 0.079 at 980 rpm etc. The
engine speed results in Figure 5.7 now suggest that ε is proportional to � 1
√𝑟𝑟𝑚� which means that ε-
gradients are highest at lower engine speeds. At 1500 rpm the resulting ε-value is close to 1 %. This
number fits reasonably with the experimental results of Tests series 4 (at similar max pressures) in
Table 5.3. In addition the suggested curvature of the engine speed results explains the differences
between modeled and measured ε values of the large marine engine and the heavy duty engine
(Table 4.2 and Table 5.3 respectively).

42
Figure 5.7. Left: Fraction of fuel sulfur converted to SO3 versus gas mixing (β). Right: Fraction of fuel sulfur converted to SO3 versus engine speed. Model conditions correspond to 50 % engine load and 2.0 % m/m fuel sulfur.
It is shown in Figure 5.6 that ε increases linearly with the maximum cylinder pressure. A reasonable
way to alter the cylinder pressure in simulations is by slightly shifting the 𝑄𝑛𝑛𝑛(𝜃) trace relative to
the base trace determined from the thermodynamic analysis in Figure 4.1. It is also fair to assume
that the rate of fresh gas mixing into the burned zones remains unchanged when 𝑄𝑛𝑛𝑛(𝜃) is only
shifted a few crank angle degrees. To vary the cylinder pressure history 𝑄𝑛𝑛𝑛(𝜃) at 25 %, 50 % and
75 % engine load is shifted ±2 CAD relative to the base trace. For each load three different max
pressures and ε-values are then simulated as shown in Figure 5.8.
Figure 5.8. Modeled and measured ε-values with respect to max cylinder pressure (fuel sulfur content 1.6 wt. %). The numbers in the figure refer to the shift of the Qnet(θ) trace (in crank angles degrees) relative to a base case.

43
The resulting ε-values of the model now follow a linear trend similar to the experimental data.
However the experimental ε-slope (from Figure 5.6) is slightly higher than the model predictions. It
is unclear what causes the slight difference. The very simple mixing approach may be one reason.
Another reason could be the accuracy of the experimental data. In order to examine the observed ε-
differences the first task would be to adapt the multizone model to the experimental data of the
heavy duty engine. This could give an indication whether the applied mixing correlation should be
modified. However it is important to keep in mind that accurate SO3 measurements are challenging
as explained earlier.

44
6. Modeling the characteristics of sulfuric acid condensation on the cylinder liner
Gaseous sulfuric acid and water vapor from the bulk/cylinder gas may condense on the cylinder
liner (Figure 1.2) if the surface temperature is lower than the sulfuric acid dew point temperature. In
this situation the condensing rates of acid and water are comparable. However if the liner
temperature is also lower than the dew point of pure water vapor then the rate of water greatly
exceeds the acid that is highly diluted. Condensation can be considered as molecular gas diffusion
of condensable species through a very thin gaseous boundary layer. The species are forced to the
gas-liquid interphase due to partial pressure gradients63,65,66. Conversion from gas to liquid is not
rate limiting66. I.e. vapor liquid equilibrium (VLE) is assumed to exist at the interphase. The process
of condensation is sketched in Figure 6.1. Gaseous sulfuric acid does not really form in the hot bulk
cylinder gas due to thermodynamic restrictions. However from the kinetics of R.3.4 (Table 3.2) the
SO3 in the bulk gas is assumed to react instantly with water vapor very close to the cooled liner
surface to form gaseous H2SO4, and throughout this section SO3 in the bulk gas is lumped with
H2SO4.
Figure 6.1. The principles of H2SO4 and H2O diffusion through the gaseous boundary layer and subsequent condensation on the cylinder liner.
In reality a thin lube oil film is distributed on the liner surface that acts to prevent acid corrosion by
means of base additives that are blended in the lube oil. In combination with the lube oil dosing
strategy the base additives basically provide the means to hamper corrosion. Nevertheless high
lubricant feed rates are sometimes required to avoid corrosion which is impractical as well as
expensive. Moreover the dosing strategy and the state of the protective oil film is influenced by
several parameters such as the operating conditions, fuel quality, sulfur content, operating
environment, lube oil formulation, liner temperature and mechanical interactions from the moving
piston etc. In addition the distribution and refreshment of lube oil on the whole liner area is not

45
ideal. Measurements indicate that the oil film thickness is generally in the order of micro meters.
However thermal degradation of the oil provides that the film thickness is several times less on the
liner surface that corresponds to the piston position at TDC6. This is also the location where
corrosion is mostly pronounced in practice. It would require a very complex model in order to
consider all the operating effects that influence the state of the oil film. Since corrosion is believed
to be closely linked to the amount of deposed sulfuric acid on the cylinder liner the intention with
this work is to model the characteristics of sulfuric acid condensation on the liner. It is believed that
valuable information in terms of liner corrosion can be retrieved from the condensation analysis. To
simplify things further the condensation is assumed to take place on a surface with no oil film and
the surface temperature is assumed constant throughout the stroke. The bulk gas is treated as a
homogenous gas mixture i.e. the gas species in the burned zones and the fresh gas is fully mixed at
each instant cylinder gas volume.
The sulfuric acid dew point may be determined from empirical formulas52,53 that correlate the dew
point temperature to the bulk gas pressure of SO3/H2SO4 and H2O. However these correlations do
not provide information about the share of condensing sulfuric acid and water. A more convenient
approach for the present study is to apply VLE of the H2O-H2SO4 system. Theoretical correlations
of this type are based on thermodynamic properties of the components in the gas and the liquid
phase. Abel67 was among the first to derive the vapor-phase above a liquid solution of sulfuric acid
and water. He used the best available thermodynamic data at that time. The theoretical models have
been improved over the years as the data has been gradually upgraded. Today several correlations
are suggested67-71. In this study the work of Bosen and Engels72 is used to describe the complex
nature of the H2O-H2SO4 VLE. The model treats ideal gasses above a liquid solution where the
partial pressures pi (index i refers to H2O or H2SO4) are calculated from the general expression in
eq. 6.1. χi is the liquid mole fraction, γi is an activity coefficient and pi0 is the vapor pressure of the
pure substance73,74. The activity coefficient is derived from the NRTL (Non-Random Two Liquid
model) equation75 (eq. 6.2) wherein adjustable parameters are fitted to reproduce experimental data
of total pressure, vapor phase composition and liquid molar enthalpy. The references of the
experimental data are cited in the work of Bosen and Engels and the VLE is valid for liquid acid
concentration up to 96 % m/m in the temperature range between 0 - 240 °C.
𝑝𝑖(𝑇, 𝑐𝑚) = 𝑥𝑖𝛾𝑖𝑝𝑖0 (6.1)
ln (𝛾𝑖) =∑ 𝜏𝑗𝑗𝐺𝑗𝑗𝑚𝑗𝑁𝑗
∑ 𝐺𝑗𝑗𝑚𝑗𝑁𝑗
+ ∑ 𝐺𝑗𝑖𝑚𝑖∑ 𝐺𝑗𝑖𝑚𝑗𝑁𝑗
𝑁𝑘 �𝜏𝑖𝑘 −
∑ 𝜏𝑛𝑖𝐺𝑛𝑖𝑚𝑛𝑁𝑛∑ 𝐺𝑗𝑖𝑚𝑗𝑁𝑗
� (6.2)

46
𝐺𝑖𝑖 = exp (−𝛼𝑖𝑖𝜏𝑖𝑖) 𝜏𝑖𝑖 = 𝐵𝑖𝑖 +𝑏𝑖𝑖𝑇
The number of phases P and chemically independent constituents 𝐶 in the H2O-H2SO4 VLE is 2.
According to Gibbs phase rule in eq. 6.3 the system therefore yields 2 degrees of freedom 𝐹. This
means that a given liquid acid strength ca combined with a system temperature T can be applied to
eq. 6.1 in order to determine the saturation pressures of H2SO4 and H2O. In this work it is
convenient to reverse the process and apply known bulk gas pressures of H2SO4 and H2O (to eq.
6.1) in order to determine the acid dew point temperature and the condensing acid strength. I.e. the
share of condensing acid and water.
𝐹 = 𝐶 − 𝑃 + 2 (6.3)
6.2 Modeling cases
Over the life time a large 2-stroke marine engine will operate at different loads, with various fuel
compositions and in different environments. Consequently the cylinder liners will be subject to gas
species of varying densities that alter the properties of sulfuric acid condensation. In order to limit
the number of simulations a constant fuel sulfur content of 2 % m/m is used in this work for the
operating conditions representing 25 % and 100 % engine load. In addition at each load the residual
gas fraction is set to 3 % and 6 % m/m as seen in Table 6.1.
load rpm S xres pa Ta pmax λ t ε* Case % rev/min % m/m % m/m bar °C bar - %
1 100 123 2.0 6 3.8 37 167 2.13 2.70 2 100 123 2.0 3 3.8 37 172 2.32 2.74 3 25 78 2.0 6 1.5 33 89 2.47 3.65 4 25 78 2.0 3 1.5 33 90 2.67 3.69
*at exhaust valve opening Table 6.1. Cases studied to investigate the characteristics of sulfuric acid condensation on the cylinder liner of a large marine engine.
In section 4.2 the fuel heat release rate is determined for the two engine loads through a measured
cylinder pressure trace. In this section the process is reversed and the “known” heat release rate is
used to calculate the cylinder pressure history for the two engine loads at the different residual gas
fractions. This is a fair approach since the effect of the residual gas fraction is small. The cylinder
pressure plays a key role as it affects SO3 formation and alters the properties of condensation
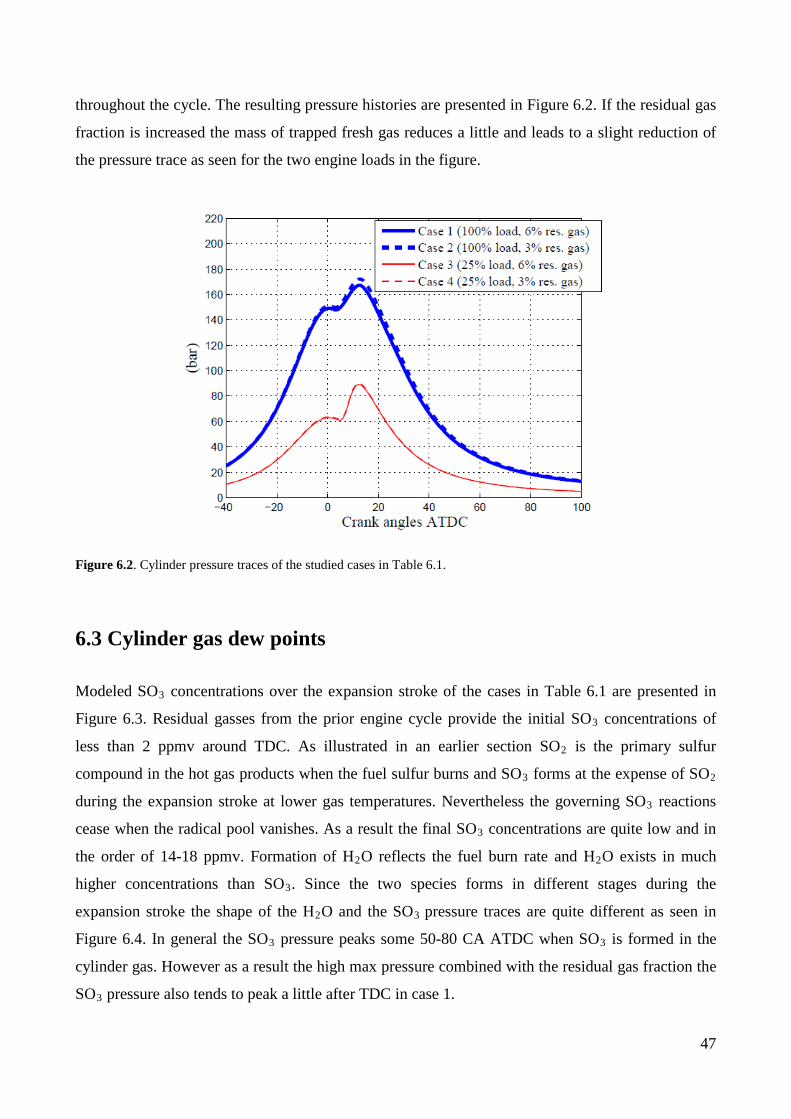
47
throughout the cycle. The resulting pressure histories are presented in Figure 6.2. If the residual gas
fraction is increased the mass of trapped fresh gas reduces a little and leads to a slight reduction of
the pressure trace as seen for the two engine loads in the figure.
Figure 6.2. Cylinder pressure traces of the studied cases in Table 6.1.
6.3 Cylinder gas dew points
Modeled SO3 concentrations over the expansion stroke of the cases in Table 6.1 are presented in
Figure 6.3. Residual gasses from the prior engine cycle provide the initial SO3 concentrations of
less than 2 ppmv around TDC. As illustrated in an earlier section SO2 is the primary sulfur
compound in the hot gas products when the fuel sulfur burns and SO3 forms at the expense of SO2
during the expansion stroke at lower gas temperatures. Nevertheless the governing SO3 reactions
cease when the radical pool vanishes. As a result the final SO3 concentrations are quite low and in
the order of 14-18 ppmv. Formation of H2O reflects the fuel burn rate and H2O exists in much
higher concentrations than SO3. Since the two species forms in different stages during the
expansion stroke the shape of the H2O and the SO3 pressure traces are quite different as seen in
Figure 6.4. In general the SO3 pressure peaks some 50-80 CA ATDC when SO3 is formed in the
cylinder gas. However as a result the high max pressure combined with the residual gas fraction the
SO3 pressure also tends to peak a little after TDC in case 1.

48
Figure 6.3. Modeled SO3 concentrations of the cylinder gas of the studied cases in Table 6.1.
Figure 6.4. Modeled SO3 and H2O pressures of the studied cases in Table 6.1.
The sulfuric acid dew points presented in Figure 6.5 are calculated with eq. 6.1 and are based on the
SO3 and H2O pressure traces in Figure 6.4. Max dew points of typically more than 200 °C are
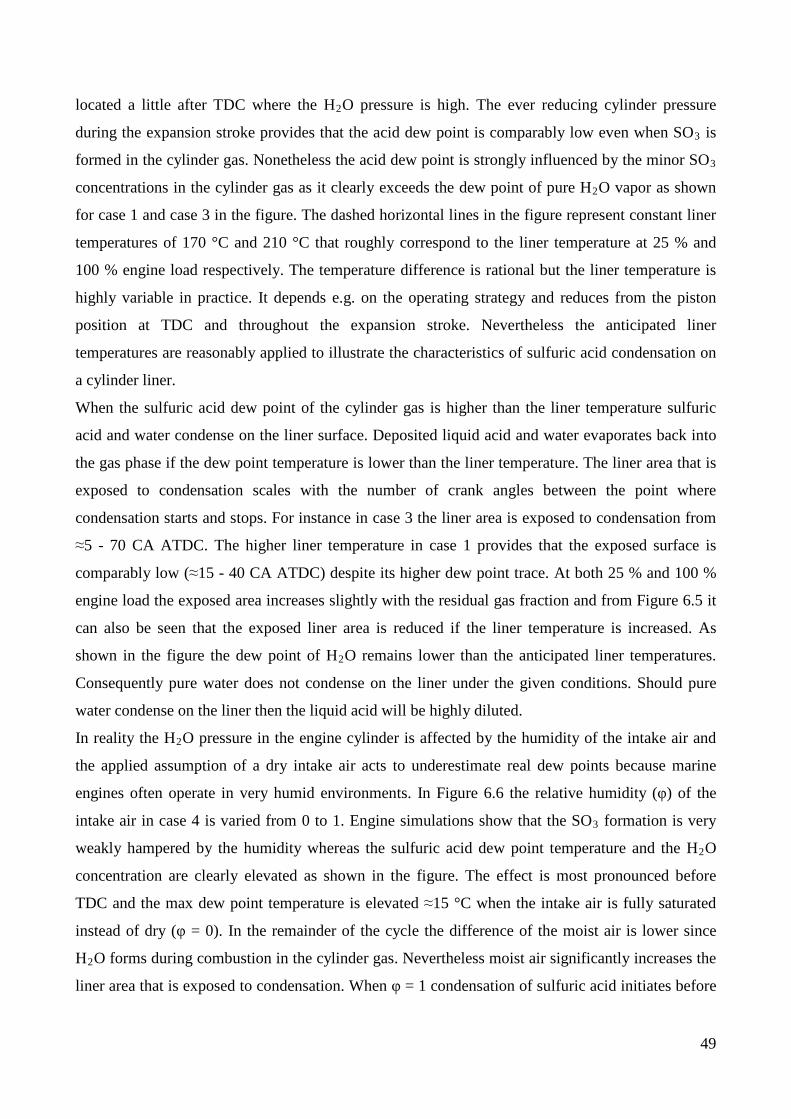
49
located a little after TDC where the H2O pressure is high. The ever reducing cylinder pressure
during the expansion stroke provides that the acid dew point is comparably low even when SO3 is
formed in the cylinder gas. Nonetheless the acid dew point is strongly influenced by the minor SO3
concentrations in the cylinder gas as it clearly exceeds the dew point of pure H2O vapor as shown
for case 1 and case 3 in the figure. The dashed horizontal lines in the figure represent constant liner
temperatures of 170 °C and 210 °C that roughly correspond to the liner temperature at 25 % and
100 % engine load respectively. The temperature difference is rational but the liner temperature is
highly variable in practice. It depends e.g. on the operating strategy and reduces from the piston
position at TDC and throughout the expansion stroke. Nevertheless the anticipated liner
temperatures are reasonably applied to illustrate the characteristics of sulfuric acid condensation on
a cylinder liner.
When the sulfuric acid dew point of the cylinder gas is higher than the liner temperature sulfuric
acid and water condense on the liner surface. Deposited liquid acid and water evaporates back into
the gas phase if the dew point temperature is lower than the liner temperature. The liner area that is
exposed to condensation scales with the number of crank angles between the point where
condensation starts and stops. For instance in case 3 the liner area is exposed to condensation from
≈5 - 70 CA ATDC. The higher liner temperature in case 1 provides that the exposed surface is
comparably low (≈15 - 40 CA ATDC) despite its higher dew point trace. At both 25 % and 100 %
engine load the exposed area increases slightly with the residual gas fraction and from Figure 6.5 it
can also be seen that the exposed liner area is reduced if the liner temperature is increased. As
shown in the figure the dew point of H2O remains lower than the anticipated liner temperatures.
Consequently pure water does not condense on the liner under the given conditions. Should pure
water condense on the liner then the liquid acid will be highly diluted.
In reality the H2O pressure in the engine cylinder is affected by the humidity of the intake air and
the applied assumption of a dry intake air acts to underestimate real dew points because marine
engines often operate in very humid environments. In Figure 6.6 the relative humidity (φ) of the
intake air in case 4 is varied from 0 to 1. Engine simulations show that the SO3 formation is very
weakly hampered by the humidity whereas the sulfuric acid dew point temperature and the H2O
concentration are clearly elevated as shown in the figure. The effect is most pronounced before
TDC and the max dew point temperature is elevated ≈15 °C when the intake air is fully saturated
instead of dry (φ = 0). In the remainder of the cycle the difference of the moist air is lower since
H2O forms during combustion in the cylinder gas. Nevertheless moist air significantly increases the
liner area that is exposed to condensation. When φ = 1 condensation of sulfuric acid initiates before

50
TDC and condensation stops some 10-15 crank angles later than the case of dry intake air as seen in
Figure 6.6.
Figure 6.5. Sulfuric acid dew points of the cylinder gas of the studied cases in Table 6.1. The dashed horizontal lines represent constant cylinder liner temperatures of 170 °C and 210 °C.
Figure 6.6. Sulfuric acid dew points and H2O concentrations of the cylinder gas at different charge air humidities (φ) for case 4 in Table 6.1. The dashed horizontal line represents a fixed cylinder liner temperature.

51
6.4 Sulfuric acid condensation
Condensing acid strengths on the cylinder liner
The share of condensing sulfuric acid and water on the cylinder liner can be found from eq. 6.1. For
the purpose either the H2O or the H2SO4 pressure at the gas liquid interface must be applied
together with a specified liner temperature. As was shown in Figure 6.5 the anticipated liner
temperatures are always higher than the dew point of pure water. Furthermore the H2O content in
the bulk gas is orders of magnitude higher than the SO3 content. This means that the amount of
water that condenses together with sulfuric acid is very small compared to the H2O contained in the
bulk gas. Therefore the share of condensing acid and water (acid strength) is reasonably determined
at each crank angle during the expansion stroke by assuming that the H2O pressure at the gas-liquid
interface equals the H2O pressure in the bulk gas. In Figure 6.7 calculated values of the condensing
acid strength 𝑚𝑎𝑎𝑗𝑑𝑚𝑎𝑎𝑗𝑑+𝑚𝑤𝑎𝑤𝑤𝑤
% are plotted against a specified liner temperature and the molar
concentration of H2O at 60 bar pressure. At high temperatures (> 200 °C) the acid strength is
generally more than 50 % m/m and the influence of H2O is low. However for lower temperatures
the acid strength may approach zero and the H2O concentrations acts to reduce the acid strength.
When the acid strength is zero it means that the temperature is equal to or lower than the dew point
of pure water.
Figure 6.7. Liquid sulfuric acid strength relative to temperature and H2O molar concentration at 60 bar pressure.

52
For each of the studied cases in Table 6.1 the resulting H2O pressure trace in Fig. 6.4 is used
together with the applied liner temperatures in order to determine the condensing acid strength over
the expansion stroke. In agreement with Figure 6.7 the most diluted acid is formed on the liner
when the H2O pressure peaks close to pmax as seen in Figure 6.8. Furthermore the lower liner
temperature (170 °C) at 25 % load results in lower acid strengths compared to 100 % load (210 °C).
In addition the acid is slightly more diluted when the residual gas fraction is increased. If the intake
air of case 4 is fully saturated (shown as case 4*in the figure) instead of dry the H2O pressure is
elevated by up to ~60 % during the expansion stroke and the condensing acid is somewhat more
diluted as seen in the figure.
Figure 6.8. Condensing sulfuric acid strengths on the cylinder liner of the studied cases in Table 6.1.
The H2O pressure peaks when the piston is still located in the upper part of the cylinder liner. At the
same time the stability of the protective lube oil film is challenged by thermal degradation from the
very hot cylinder gas, and the means to prevent acid corrosion via base additives may be hampered.
Later in the expansion stroke the lube oil is likely more resistant to the colder cylinder gas and
probably in a better condition to neutralize condensed acid. Different researchers states that dilute
acid is most aggressive65,76,77 and the results in Figure 6.8 therefore suggests that the most
aggressive acid is condensing in the upper third of the liner. Clearly sulfuric acid corrosion needs
also to be linked to the amount of deposited acid as well which is not yet considered. However
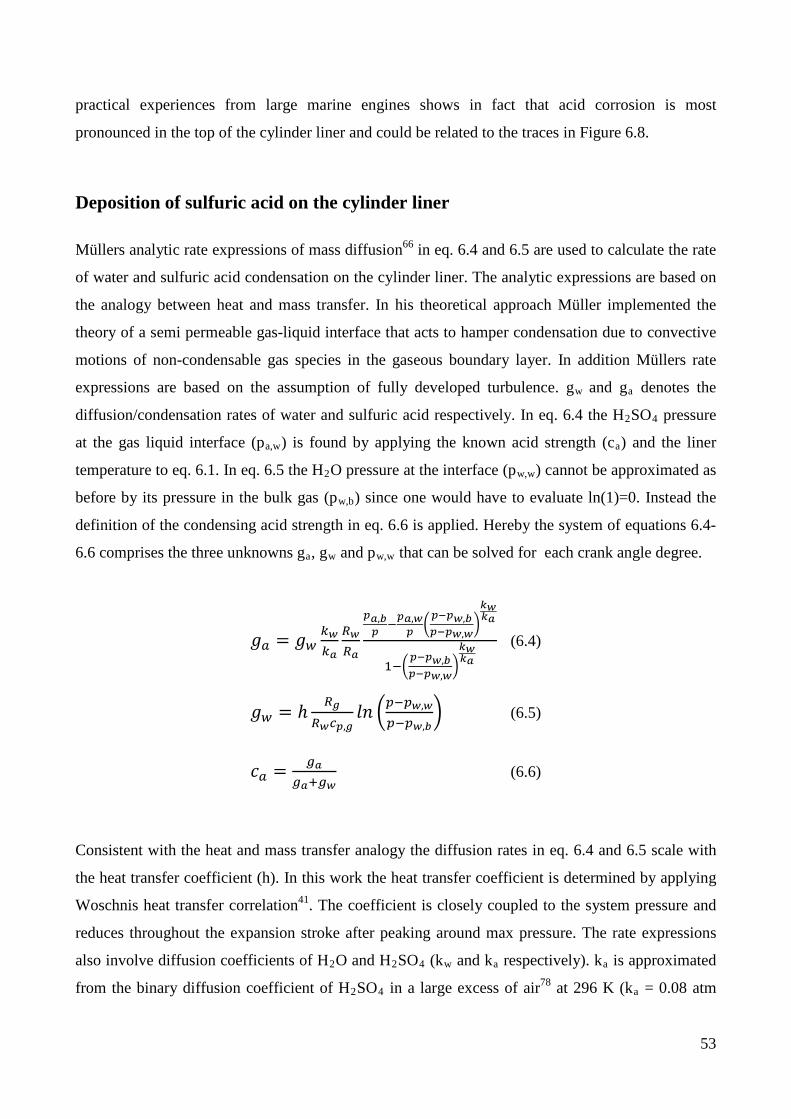
53
practical experiences from large marine engines shows in fact that acid corrosion is most
pronounced in the top of the cylinder liner and could be related to the traces in Figure 6.8.
Deposition of sulfuric acid on the cylinder liner
Müllers analytic rate expressions of mass diffusion66 in eq. 6.4 and 6.5 are used to calculate the rate
of water and sulfuric acid condensation on the cylinder liner. The analytic expressions are based on
the analogy between heat and mass transfer. In his theoretical approach Müller implemented the
theory of a semi permeable gas-liquid interface that acts to hamper condensation due to convective
motions of non-condensable gas species in the gaseous boundary layer. In addition Müllers rate
expressions are based on the assumption of fully developed turbulence. gw and ga denotes the
diffusion/condensation rates of water and sulfuric acid respectively. In eq. 6.4 the H2SO4 pressure
at the gas liquid interface (pa,w) is found by applying the known acid strength (ca) and the liner
temperature to eq. 6.1. In eq. 6.5 the H2O pressure at the interface (pw,w) cannot be approximated as
before by its pressure in the bulk gas (pw,b) since one would have to evaluate ln(1)=0. Instead the
definition of the condensing acid strength in eq. 6.6 is applied. Hereby the system of equations 6.4-
6.6 comprises the three unknowns ga, gw and pw,w that can be solved for each crank angle degree.
𝑔𝑚 = 𝑔𝑤𝑘𝑤𝑘𝑎
𝑅𝑤𝑅𝑎
𝑝𝑎,𝑏𝑝 −𝑝𝑎,𝑤
𝑝 �𝑝−𝑝𝑤,𝑏𝑝−𝑝𝑤,𝑤
�𝑖𝑤𝑖𝑎
1−�𝑝−𝑝𝑤,𝑏𝑝−𝑝𝑤,𝑤
�𝑖𝑤𝑖𝑎
(6.4)
𝑔𝑤 = ℎ 𝑅𝑔𝑅𝑤𝑐𝑝,𝑔
𝐶𝑙 �𝑟−𝑟𝑤,𝑤
𝑟−𝑟𝑤,𝑏� (6.5)
𝑐𝑚 = 𝑔𝑎𝑔𝑎+𝑔𝑤
(6.6)
Consistent with the heat and mass transfer analogy the diffusion rates in eq. 6.4 and 6.5 scale with
the heat transfer coefficient (h). In this work the heat transfer coefficient is determined by applying
Woschnis heat transfer correlation41. The coefficient is closely coupled to the system pressure and
reduces throughout the expansion stroke after peaking around max pressure. The rate expressions
also involve diffusion coefficients of H2O and H2SO4 (kw and ka respectively). ka is approximated
from the binary diffusion coefficient of H2SO4 in a large excess of air78 at 296 K (ka = 0.08 atm
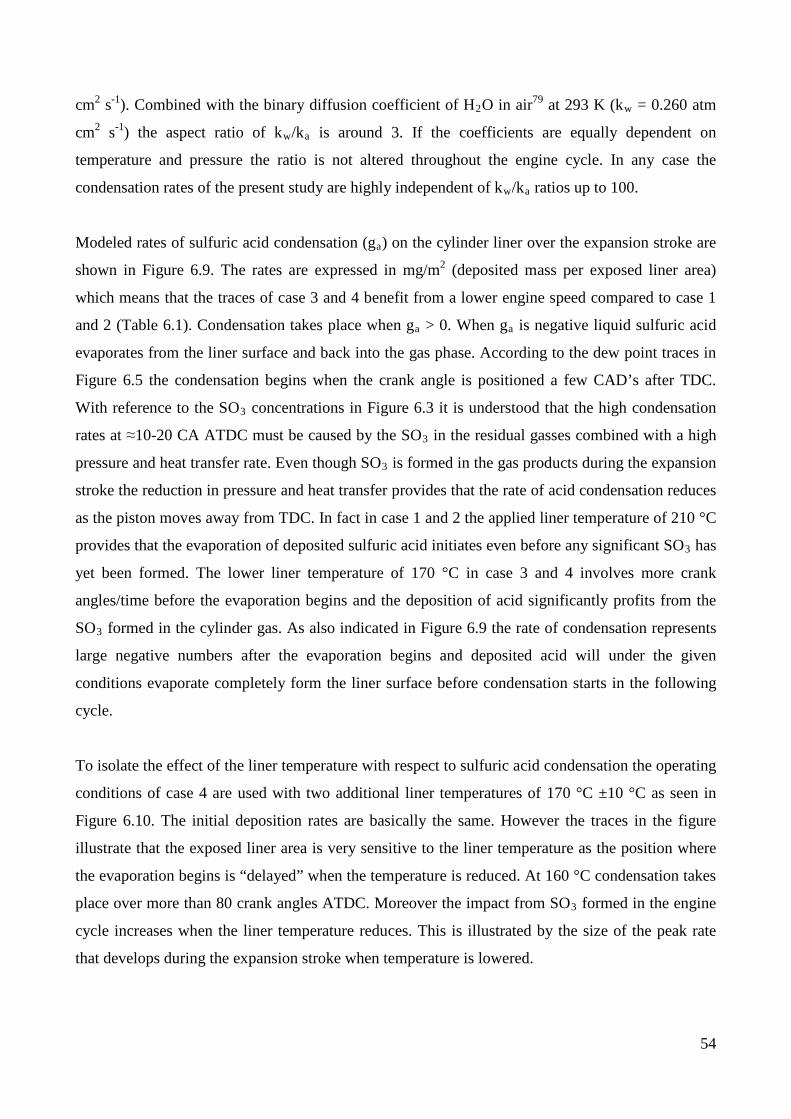
54
cm2 s-1). Combined with the binary diffusion coefficient of H2O in air79 at 293 K (kw = 0.260 atm
cm2 s-1) the aspect ratio of kw/ka is around 3. If the coefficients are equally dependent on
temperature and pressure the ratio is not altered throughout the engine cycle. In any case the
condensation rates of the present study are highly independent of kw/ka ratios up to 100.
Modeled rates of sulfuric acid condensation (ga) on the cylinder liner over the expansion stroke are
shown in Figure 6.9. The rates are expressed in mg/m2 (deposited mass per exposed liner area)
which means that the traces of case 3 and 4 benefit from a lower engine speed compared to case 1
and 2 (Table 6.1). Condensation takes place when ga > 0. When ga is negative liquid sulfuric acid
evaporates from the liner surface and back into the gas phase. According to the dew point traces in
Figure 6.5 the condensation begins when the crank angle is positioned a few CAD’s after TDC.
With reference to the SO3 concentrations in Figure 6.3 it is understood that the high condensation
rates at ≈10-20 CA ATDC must be caused by the SO3 in the residual gasses combined with a high
pressure and heat transfer rate. Even though SO3 is formed in the gas products during the expansion
stroke the reduction in pressure and heat transfer provides that the rate of acid condensation reduces
as the piston moves away from TDC. In fact in case 1 and 2 the applied liner temperature of 210 °C
provides that the evaporation of deposited sulfuric acid initiates even before any significant SO3 has
yet been formed. The lower liner temperature of 170 °C in case 3 and 4 involves more crank
angles/time before the evaporation begins and the deposition of acid significantly profits from the
SO3 formed in the cylinder gas. As also indicated in Figure 6.9 the rate of condensation represents
large negative numbers after the evaporation begins and deposited acid will under the given
conditions evaporate completely form the liner surface before condensation starts in the following
cycle.
To isolate the effect of the liner temperature with respect to sulfuric acid condensation the operating
conditions of case 4 are used with two additional liner temperatures of 170 °C ±10 °C as seen in
Figure 6.10. The initial deposition rates are basically the same. However the traces in the figure
illustrate that the exposed liner area is very sensitive to the liner temperature as the position where
the evaporation begins is “delayed” when the temperature is reduced. At 160 °C condensation takes
place over more than 80 crank angles ATDC. Moreover the impact from SO3 formed in the engine
cycle increases when the liner temperature reduces. This is illustrated by the size of the peak rate
that develops during the expansion stroke when temperature is lowered.
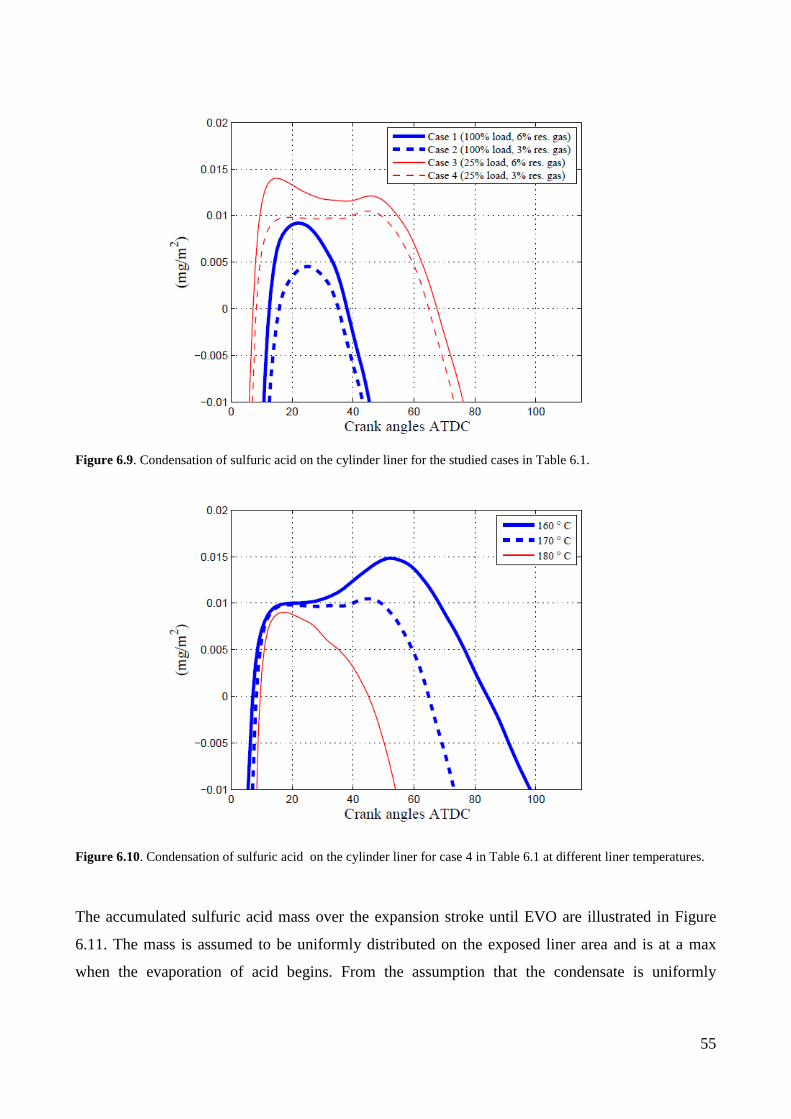
55
Figure 6.9. Condensation of sulfuric acid on the cylinder liner for the studied cases in Table 6.1.
Figure 6.10. Condensation of sulfuric acid on the cylinder liner for case 4 in Table 6.1 at different liner temperatures.
The accumulated sulfuric acid mass over the expansion stroke until EVO are illustrated in Figure
6.11. The mass is assumed to be uniformly distributed on the exposed liner area and is at a max
when the evaporation of acid begins. From the assumption that the condensate is uniformly

56
distributed on the liner area the following removal/evaporation of deposited acid is completed
before EVO. The influence of the operating conditions becomes clearer when the peak points in the
figure are compared. At 100 % engine load (case 1 and 2) the high liner temperature provides that
the exposed liner area is comparably small and the deposited acid mass is relatively low. For the
same load the mass is reduced by ≈ 60 % when the residual gas fraction is reduced from 6 % to 3
%. At 25 % engine load (case 3 and 4) the SO3 that forms in the cylinder gas significantly adds to
the deposition of acid. Yet the effect of the higher residual gas fraction is reduced to ≈22 %. The
lower engine speed at 25 % engine load implies that the number of operating cycles is reduced by
1/3 relative to 100 % load. As a result the weight of case 3 and 4 ought to be reduced accordingly.
Anyway the deposited acid mass per time unit will under the given conditions be several times
higher at 25 % load.
Case 4* in Figure 6.11 are based on the same operating conditions as case 4 but the liner
temperature is reduced by 10 °C to 160 °C. The difference between case 4 and 4* illustrates the
influence of the lower temperature/larger exposed liner area. At the reduced temperature the
deposited acid mass increases by a factor of more than 2 under the given conditions. It was shown
in Figure 6.6 that moisturized intake air elevates the exposed surface area through a higher dew
point trace. Case 4** in Figure 6.11 represents the same operating conditions as case 4 but the intake
air is fully saturated. As illustrated the moist air basically doubles the deposited acid mass under the
given conditions.
Figure 6.11. Accumulated sulfuric on the cylinder liner of the studied cases in Table 6.1. *The liner temperature is reduced 10 °C relative to case 4. **The intake air is saturated
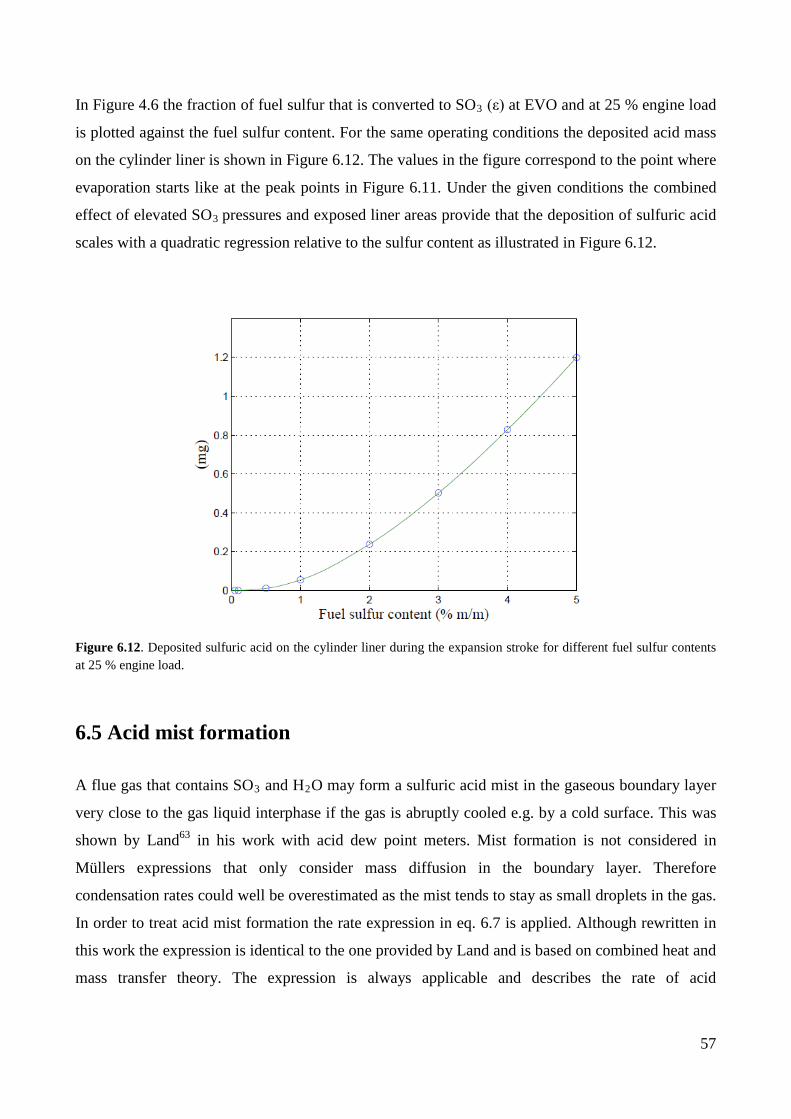
57
In Figure 4.6 the fraction of fuel sulfur that is converted to SO3 (ε) at EVO and at 25 % engine load
is plotted against the fuel sulfur content. For the same operating conditions the deposited acid mass
on the cylinder liner is shown in Figure 6.12. The values in the figure correspond to the point where
evaporation starts like at the peak points in Figure 6.11. Under the given conditions the combined
effect of elevated SO3 pressures and exposed liner areas provide that the deposition of sulfuric acid
scales with a quadratic regression relative to the sulfur content as illustrated in Figure 6.12.
Figure 6.12. Deposited sulfuric acid on the cylinder liner during the expansion stroke for different fuel sulfur contents at 25 % engine load.
6.5 Acid mist formation
A flue gas that contains SO3 and H2O may form a sulfuric acid mist in the gaseous boundary layer
very close to the gas liquid interphase if the gas is abruptly cooled e.g. by a cold surface. This was
shown by Land63 in his work with acid dew point meters. Mist formation is not considered in
Müllers expressions that only consider mass diffusion in the boundary layer. Therefore
condensation rates could well be overestimated as the mist tends to stay as small droplets in the gas.
In order to treat acid mist formation the rate expression in eq. 6.7 is applied. Although rewritten in
this work the expression is identical to the one provided by Land and is based on combined heat and
mass transfer theory. The expression is always applicable and describes the rate of acid

58
condensation directly at the gas liquid interphase. However the sulfuric acid pressure gradient
�𝑑𝑟𝑎𝑑𝐻�𝑟 at the interface is not known. The gradient expresses the resulting gradient that exists at the
gas liquid interphase whether or not mist is formed. A way to approach the gradient is by neglecting
super saturation of the sulfuric acid. If super saturation is ignored a least gradient can be determined
from the acid dew point curve63. To do this small temperature variations around a specified
temperature (liner temperature) are considered at each crank angle degree. From eq. 6.1 the change
in acid pressure (with respect to temperature variations) are then determined and the resulting
�𝑑𝑟𝑎𝑑𝐻�𝑟 gradient is evaluated. Moreover Land concluded that the Lewis number 𝐿𝑖 in eq. 6.7 is
approximately 2.3 for SO3/H2SO4 in a typical exhaust gas. This is in reasonably agreement with
Müller66 who stated that 𝐿𝑖 = 2.6 ± 5% throughout a motoring cycle.
𝑔𝑚 = � ℎ𝑟𝑐𝑝,𝑔𝐿𝑛
𝑀𝑀𝑎𝑀𝑀𝑔
� �𝑑𝑟𝑎𝑑𝐻�𝑟�𝑇𝑔 − 𝑇𝑀� (6.7)
In a situation where a sulfuric acid mist forms eq. 6.7 now represents the least rate of condensation.
Eq. 6.4 represents the upper extreme. In practice the rate can be anywhere in-between the two
extremes. Modeled traces of the two scenarios are compared in Figure 6.13 for case 3 in Table 6.1.
At a liner temperature of 155 °C the traces intersects at 9 and 37 CA ATDC. In this interval acid
mist may form in the boundary layer and potentially limit the rate of deposition by as much as the
trace of eq. 6.7. Outside the interval eq. 6.7 combined with the least pressure gradient approach is
no longer appropriate and the rate of deposition follows eq. 6.4. At a liner temperature of 165 °C the
interval of mist formation is reduced and the lower extreme is increased. At a liner temperature of
175°C mist formation is no longer an issue. According to this simplified analysis the possibility of
mist formation is very sensitive to the liner temperature. The possibility increases inversely with the
liner temperature as illustrated in Table 6.2 for the model cases in Table 6.1. The plus symbols in
the table symbolizes that mist may form. The cases are ranked from left to right in terms of
increasing SO3 and H2O bulk gas pressures and the table shows that the probability of mist
formation increases accordingly, especially due to a higher H2O pressure. For the same reason
humid intake air will add to the probability of acid mist formation. Moreover for a given case there
is a tendency that mist is more likely to form when the liner temperature reduces.

59
Figure 6.13. Sulfuric acid condensation rates on the cylinder liner for case 3 in Table 6.1 with and without mist formation in the gas species boundary.
25% load xres 3%
25% load xres 6%
100% load xres 3%
100% load xres 6%
160 °C + + + + 170 °C - + + + 180 °C - - + + 190 °C - - - -
Table 6.2. The possibility of sulfuric acid mist formation in the gaseous boundary layer (for the cases in Table 6.1) at different liner temperatures. Plus symbols illustrate that mist may form.
Discussion
The results of sulfuric acid condensation presented in this work only clarify the characteristics of
condensation on the cylinder liner of a large low speed marine engine. There are several reasons for
this. First of all the assumption of a homogenous gas mixture eliminates the possible effect of
higher condensation rates locally caused by stratified/heterogeneous SO3 concentrations and
turbulence intensities in the cylinder gas. The homogenous gas assumption also challenges the
findings in terms of acid mist formation. Furthermore the dew point of sulfuric acid is based on the
H2O-H2SO4 VLE. The VLE is theoretically derived and show that even for fairly concentrated acid

60
strengths the saturation pressure of H2O can be orders of magnitude higher that the H2SO4
pressure. This probably explains why the VLE to the authors’ knowledge is not validated against
experimental data. It is also shown in the present work that the cylinder liner temperature is a
crucial parameter in terms of deposited sulfuric acid. In reality the applied assumption of a constant
liner temperature trace over the expansion stroke is not correct as the temperature typically
decreases throughout the stroke which increases the surface area that is exposed to acid
condensation. For a better prediction of acid deposition a true temperature trace should be applied
that will also indicate whether pure water is condensing on the liner in practice. It cannot be ruled
out that much higher levels of water than acid is condensing on the liner surface. Pure water may
play a significant role in terms of corrosion as diluted acid tends to be more aggressive than
concentrated acid. Water itself is corrosive in the presence of oxygen and SO2 may dissolve in
water and form corrosive sulfurous acid.
Sulfuric acid mist formation in the gaseous boundary layer can serve to reduce sulfuric acid
corrosion by hampering the deposition of acid onto the liner surface. According to results of this
work the mist formation is most prominent at higher engine loads. On the other hand the probability
of mist formation tends to reduce with the liner temperature that normally increases with the engine
load. Thus, at higher engine loads the higher liner temperature might counteract the mist formation.
Conclusions
A phenomenological 0D multizone engine model that applies a detailed sulfur reaction mechanism
is formulated in order to examine SO3 formation (from oxidation of fuel containing sulfur) in a
large low speed two-stroke marine diesel engine. By splitting the injected fuel into multiple burned
gas zones and by applying experimental data as model input and calibration data the model
simulates realistic gas conditions at 25 - 100 % engine load. Due to thermodynamic restrictions
SO3 is unlike SO2 hardly present at the highest gas temperatures in a diesel process. SO3 is
increasingly favored at the expense of SO2 as the hot gas products cool during the expansion stroke
and is primarily formed in the temperature range between 1300 K and 2000 K. Above 1650 K SO3
is in equilibrium but since the governing reactions freeze at around 1300 K the presence of SO3 in
the exhaust gas is much less than thermodynamically predicted. The fraction of fuel sulfur that is
converted to SO3 (ε) in the exhaust increases with the cylinder pressure (engine load) but decreases

61
with the engine speed. The trends agree with engine tests performed with a heavy duty single
cylinder HFO-fueled medium speed engine. In addition high shares of premixed combustion are
found to increases SO3 formation remarkably. The adverse effects of operating pressure and engine
speed of a large marine engine means that the resulting ε-values are quite similar for the full
operational range. A few percent of the fuel is generally converted to SO3. For a diffusion
controlled (diesel) combustion process SO3 is primarily formed from a reaction involving HOSO2
and O2 where the HOSO2 intermediate is formed by the mayor sulfur compound SO2 and OH.
Another significant pathway to SO3 is the direct reaction between SO2 and O(+M). The two
reactions contribute to about 90% of the SO3 formed in the engine cylinder. Formation of H2SO4 is
confined to temperatures of less than 1000 K and no significant H2SO4 is modeled in the cylinder
gasses. It is likely that gaseous H2SO4 forms prior to condensation very close to the liner surface
(due to the abrupt cooling) from a nearly instant reaction between SO3 and H2O. For that reason
SO3 and H2SO4 are reasonably lumped together. With a homogenous cylinder gas composition the
characteristics of sulfuric acid condensation on a directly exposed cylinder liner (no lube oil film) of
constant temperature is examined by combining engine model results with diffusive mass transfer
and H2O-H2SO4 VLE. Results demonstrate that SO3 from the residual gasses is responsible for the
peak acid dew points of typically more than 200 °C close to max cylinder pressure. The operating
pressure, fuel sulfur content and residual gas fraction elevates the SO3 pressure and increases the
rate of condensation. Similarly the deposition may increase with the charge air humidity through a
higher dew point trace and exposed liner area. However higher liner temperatures associated with
higher engine loads hampers the deposition compared to lower loads. Even small increments of the
liner temperature will under the given conditions reduce the deposition significantly.

62
Nomenclature
Symbol Unit A Arrhenius pre-exponential factor Depends on the reaction ca Condensing acid strength kg/kg cp,g Specific heat capacity of gas J/kg-K E Activation Energy J/mol, cal/mol ga Rate of condensing sulfuric acid mg/m2-s gw Rate of condensing water mg/m2-s h Heat transfer coefficient W/m2-K Hk
o Standard state molar enthalpy of the kth species joule/mole ka Binary diffusion coefficient of H2SO4 in air atm cm2 /s kw Binary diffusion coefficient of H2O in air atm cm2 /s kf Forward reaction rate Depends on the reaction kb Backward reaction rate Depends on the reaction Kc Equilibrium constant in concentration units Depends on the reaction Kp Equilibrium constant in pressure units Depends on the reaction Le Lewis number - m mass kg ṁa Charge air flow kg/h mmax Potential mass of air in a burned zone kg ṁmix Gas mixing in burned zone per CAD kg/CA° MWa Molecular weight of H2SO4 g/mole MWg Molecular weight of gas mixture g/mole n Number of species in the reaction - N Number of CAD’s from TOI to EVO - Po Pressure of one standard atmosphere dynes/cm2 pi
0 Vapor pressure of a pure substance Pa pH2O Vapor pressure of H2O mm Hg pH2SO4 Vapor pressure of H2SO4 mm Hg pmax Maximum cylinder pressure Pa pa Charge air pressure Pa pinj Fuel injection pressure Pa pa,b Partial pressure of H2SO4 Pa pa,b Partial pressure of H2SO4 in bulk gas Pa pa,w Partial pressure of H2SO4 at gas-liquid interface Pa pw,b Partial pressure of H2O in bulk gas Pa pw,w Partial pressure of H2O at gas-liquid interface Pa

63
Symbol Unit qnet Rate of progress mole/cm3 Qf Fuel heat kJ QHT Heat transfer kJ Qnet Net heat release kJ R Gas constant J/mole-K Ra Specific gas constant of H2SO4 J/kg-K Rw Specific gas constant of H2O J/Kg-K Rg Specific gas constant of cylinder gas J/Kg-K Sk
o Standard state molar entropy of the kth species joule/mole-K T Gas temperature K Ta Charge air temperature K T* Intermediate gas temperature K Ta,d Acid dew point temperature K Texh Exhaust gas temperature K Tg Mean cylinder/bulk gas temperature K Tw Gas-liquid interface/liner wall temperature K Tw,d Dew point temperature of pure water K Δte Gas residence time in exhaust system s Δtinj Duration of fuel injection μs v Stoichiometric coefficient - V Cylinder volume m3
Relative fresh gas volume -
xb Fuel burn fraction - xi Mole fraction in the liquid solvation - β Arrhenius temperature exponent - β Gas mixing constant - θ Crank angle position CA° θign Point of ignition CA° Δθ Computational step CA° ε Fraction of fuel sulfur converted to SO3 - λ Excess air ratio - λt Trapped excess air ratio - γ Ratio of specific heats - γi Activity coefficient -

64
Abbreviations
BDC Bottom dead center CA Crank angle CAD Crank angle degrees CA ATDC Crank angles after top dead center CA BTDC Crank angles before top dead center CCD Controlled condensation CCAI Calculated carbon aromaticity index CCS Controlled condensation system EVO Exhaust valve opening ECA Emission controlled areas FTIR Fourier transform infrared spectroscopy IMEP Indicated mean effective pressure IMO International maritime organization IPA Iso-propanol LHW Lower heating value MCR Maximum continuous rating MEP Mean effective pressure NRTL Non-random two-liquid model ROHR Rate of heat release rpm Revolutions per minute SOI Start of injection S Sulfur TBN Total Base Number TDC Top dead center TOI Time of ignition VLE Vapor liquid equilibrium

65
References 1. Heywood, J. B. Internal combustion engine fundamentals; McGraw-Hill: New York, 1988; .
2. Turns, S. R. An introduction to combustion / concepts and applications; McGraw-Hill: New York, 2012.
3. International Maritime Organization: http://www.imo.org/Pages/home.aspx.
4. Aabo, K. CIMAC Heavy Fuel Oil Working Group, and Experience from Operation on Today's Fuels and Low Sulphur Fuels. In 24th International Bunker Conference; Rotterdam, 2003; .
5. Hengeveld, J.; Schenk, C.; Aabo, K. The Role of Temperature and Pressure in the Wear Process in Low Speed Diesel Engines. Shell, 2000.
6. Weiss, E. K. J.; Busenthuer, B.; Hardenberg, H. O. Diesel Fuel Sulfur and Cylinder Liner Wear of a Heavy-Duty Diesel Engine. SAE paper 1987, 872148.
7. Chew, F.; McGeary, T. Study of the Relationship between Cylinder Lubricant Drain Condition and Performance Parameters of 2-Stroke Crosss-head Engines. In CIMAC Congress; Hamburgh, 2001; .
8. Engel, P. K.; Thompson, R. E.; Silvestrinin, R. Corrosion and Fouling Potential in Diesel Exhausts. Mech. Eng. 1979, 101, 598-606.
9. Stiesch, G., Ed.; Modeling Engine Spray and Combustion Processes; Springer: 2003; .
10. Schramm, J.; Henningsen, S.; Sorenson, S. C. Modeling of Corrosion of Cylinder Liner in Diesel Engines Caused by Sulphur in the Diesel Fuel. SAE paper 1994, 940818.
11. Hindiyarti, L.; Glarborg, P.; Marshall, P. Reactions of SO3 with the O/H radical pool under combustion conditions. J. Phys. Chem. A 2007, 111, 3984-3991.
12. Levy, A.; Merryman, E.; Reid, W. Mechanisms of Formation of Sulfur Oxides in Combustion. Environ. Sci. Technol. 1970, 4, 653-&.
13. Gleason, J. F.; Sinha, A.; Howard, C. J. Kinetics of the Gas-Phase Reaction HOSO2+O2=>HO2+SO3. J. Phys. Chem. 1987, 91, 719-724.
14. Gleason, J. F.; Howard, C. J. Temperature Dependence of the Gas-Phase Reaction HOSO2+O2=>HO2+SO3. J. Phys. Chem. 1988, 92, 3414-3417.
15. Laakso, D.; Smith, C. E.; Goumri, A.; Rocha, J.; Marshall, P. Theoretical Studies of the RSOO, ROSO, RSO(2) and HOOS (R=H, CH(3)) Radicals. Chem. Phys. Lett. 1994, 227, 377-383.
16. Goumri, A.; Laakso, D.; Rocha, J.; Smith, C. E.; Marshall, P. Computational studies of the potential energy surface for O(3P)+H2S: Characterization of transition states and the enthalpy of formation of HSO and HOS. J. Chem. Phys. (USA) 1995, 102, 161-169.
66
17. Goumri, A.; Rocha, J.; Laakso, D.; Smith, C. E.; Marshall, P. Computational studies of the potential energy surface for O(1 D)+H2S: Characterization of pathways involving H2 SO, HOSH, and H2OS. J. Chem. Phys. 1994, 101, 9405-9411.
18. Glarborg, P.; Kubel, D.; DamJohansen, K.; Chiang, H.; Bozzelli, J. Impact of SO2 and NO on CO oxidation under post-flame conditions. Int. J. Chem. Kinet. 1996, 28, 773-790.
19. Merryman, E. L.; Levy, A. Enhanced SO3 Emissions from staged Combustion. Symp. Int. Combust. 1979, 727-736.
20. Hedley, A. B. Sulphur trioxide in combustion gases. Fuel Soc. J. 1962, 13, 45-54.
21. Dooley, A.; Whittingham, G. The Oxidation of Sulphur Dioxide in Gas Flames. Trans. Faraday Soc. 1946, 42, 354-366.
22. Johnson, G. M.; Matthews, C. J.; Smith, M. Y.; Williams, D. J. Distribution of sulfur species in the burnt gas of fuel-rich propane-air flames. Combust. Flame 1970, 15, 211-214.
23. Schneider, D. R.; Bogdan, Z. Modelling of SO3 Formation in the Flame of a Heavy-oil Fired Furnace. Chem Biochem Eng Q 2003, 17, 175-181.
24. Srivastava, R. K.; Miller, C. A.; Erickson, C.; Jambhekar, R. Emissions of Sulfur Trioxide From Coal-Fired Power Plants, Riley Power Inc. Report No. RPI-TP-0178, 2002.
25. Denne, C.; Himes, R. Continuous Measurement Technologies for SO3 and H2SO4 in Coal-Fired Power Plants, Technical Report, EPRI (Electric Power Research Institute): Palo Alto, 2004.
26. Hunter, S. C. Formation of SO3 in gas turbines. J. Eng. Power 1982, 104, 44-50.
27. Lebedev, A. B.; Secundov, A. N.; Starik, A. M.; Titova, N. S.; Schepin, A. M. Modeling study of gas-turbine combustor emission. Proc. Comb. Inst. 2009, 32, 2941-2947.
28. Moniruzzaman, C. G.; Yu, F. A 0D aircraft engine emission model with detailed chemistry and soot microphysics. Combust. Flame 2012, 159, 1670-1686.
29. Goodwin, D. G. Defining phases and interphases - Cantera 1.5. Tech. rep. California Inst. of Technology, 2003.
30. Goodwin, D. G. Cantera C++ users guide. California Inst. of Technology, 2002.
31. Alzueta, M.; Bilbao, R.; Glarborg, P.; Alzueta, M.; Bilbao, R.; Glarborg, P. Inhibition and Sensitization of Fuel Oxidation by SO2. Combust. Flame 2001, 127, 2234-2251.
32. Yilmaz, A.; Hindiyarti, L.; Jensen, A. D.; Glarborg, P.; Marshall, P. Thermal dissociation of SO3 at 1000-1400 K. J Phys Chem A 2006, 110, 6654-6659.
33. Rasmussen, C. L.; Glarborg, P.; Marshall, P. Mechanisms of radical removal by SO2. Proceedings of the Combustion Institute 2007, 31.

67
34. Glarborg, P.; Glarborg, P. Hidden interactions - Trace species governing combustion and emissions. Proceedings of the Combustion Institute 2007, 31, 77-98.
35. Zabetta, E. C.; Kilpinen, P. Improved NOx submodel for in-cylinder CFD simulation of low- and medium-speed compression ignition engines. Energy & fuels 2001, 15, 1425-1433.
36. Reiner, T.; Arnold, F. Laboratory Investigations of Gaseous Sulfuric-Acid Formations via SO3+H2O+M=>H2SO4+M: Measurements of the Rate-Constant and Product Identification. J. Chem. Phys. 1994, 101, 7399-7407.
37. Lavoie, G. A.; Heywood, J. B.; Keck, J. C. Experimental and Theoretical study of Nitric Oxide Formation in Internal Combustion Engines. Combust. Sci. Technol. 1970, 1, 313-26.
38. Sorenson, S. C. Engine Principles and Vehicles; Sorenson , Spencer C.: Lyngby, Denmark, 2012; , pp 736.
39. Bartok, W.; Sarofim, A. Fossil fuel combustion / A source book; Wiley: New York, 1991.
40. Cordtz, R.; Schramm, J.; Andreasen, A.; Eskildsen, S. S.; Mayer, S. Modeling the distribution of sulfur compounds in a large two stroke diesel engine. Energy Fuels 2013, 27, 1652-1660.
41. Ferguson, C. R.; Kirkpatrick, A. T., Eds.; Internal combustion engines / applied thermosciences; Wiley: New York, 2001; .
42. Blair, G. P., Ed.; In Design and Simulation of Two-Stroke Engines; SAE: Warrendale, PA, 1996; .
43. Dec, J. E.; Espey, C. Soot and Fuel Distributions in a D.I. Diesel Engine Via 2-D Imaging. SAE paper 1992, 922307.
44. Scholl, K. W.; Sorenson, S. C. Combustion of soybean oil methyl ester in a direct injection diesel engine. SAE Spec Publ SP 1993, 211-223.
45. Cordtz, R.; Schramm, J.; Rabe, R. Investigating SO3 Formation from the Combustion of Heavy Fuel Oil in a Four-Stroke Medium-Speed Test Engine. Energy and Fuels 2013, 27.
46. Harndorf, H.; Kösel, R.; Volkart, A. Optimierung der Mess- und Auswerteparameter zur Analyse von Zülinderdruckverlaufen. MTZ 1992, 53, 136 ff.
47. Zacharias, F. Analytische Darstellung der Thermodynamischen Eigenschaften von Verbrennungsgassen, Dissertation TU Berlin, 1966.
48. Hohenberg, G. Experimentelle Erfassung der Wandwärme in Kolbenmotoren, Habilitationsschrift, Technische Universität Graz, 1983 , .
49. Hohenberg, G. F. Advanced Approaches for Heat Transfer Calculations. SP 1979, 61-79.
50. Zeelenberg, A. P.; Fijn, v. D.; Barker, H. L. Ignition Performance of Fuel Oils in Marine Diesel Engines. Int Congress Combus Engines 1983, 1455-1469.
68
51. Valencia, F. A.; Armas, I. P. Ignition Quality of Residual Fuel Oils. J. Mar. Res 2005, 2, 77-96.
52. Verhoff, F. H.; Banchero, J. T. Predicting Dew Points of Flue Gases. Chem. Eng. Prog. 1974, 70, 71-72.
53. Pierce, R. Estimating Acid Dewpoints in Stack Gases. Chem. Eng. 1977, 84, 125-128.
54. Fleig, D.; Vainio, E.; Andersson, K.; Brink, A.; Johnsson, F.; Hupa, M. Evaluation of SO3 Measurement Techniques in Air and Oxy-Fuel Combustion. Energy Fuels 2012, 26, 5537-5549.
55. Froment, G. F.; Bischoff, K. B. Chemical reactor analysis and design. 1990.
56. Livbjerg, H.; Villadsen, J. Kinetics and effectiveness factor for SO2 oxidation on an industrial vanadium catalyst. Chemical Engineering Science 1972.
57. Flagan, R. C.; Seinfeld, J. H. Fundamentals of air pollution engineering, Prentice Hall, Inc. , Englewood Cliffs, New Jersey, 1988.
58. Vainio, E.; Fleig, D.; Brink, A.; Andersson, K.; Johnsson, F.; Hupa, M. Experimental Evaluation and Field Application of a Salt Method for SO3 Measurement in Flue Gases. Energy Fuels 2013.
59. Ibanez, J. G.; Batten, C. F.; Wentworth, W. E. Simultaneous determination of SO3(g) and SO2(g) in a flowing gas. Ind. Eng. Chem. Res. Industrial & engineering chemistry research 2008, 47, 2449-2454.
60. United States Environmental Protection Agency (EPA): Available online: http://www.epa.gov/ttn/emc/ctm-013.pdf.
61. Jackson, P. J.; Hilton, D. A.; Buddery, J. H. Continuous Measurement of Sulphuric Acid Vapour in Combustion Gases using a Portable Automatic Monitor. J. Inst. Energy 1981, 54, 124-135.
62. Jaworowski, R. J.; Mack, S. S. Evaluation of Methods for Measurements of SO3/H2SO4 in Flue-Gas. J. Air Pollut. Control Assoc. 1979, 29, 43-46.
63. Land, T. Theory of Acid Deposition and its Application to the Dew-Point Meter. J. Inst. Fuel 1977, 50, 68-75.
64. Gaydon, A. G. Continuous Spectra in Flames: The Role of Atomic Oxygen in Combustion. Proceedings of the Royal Society of London.Series A, Mathematical and Physical Sciences 1944, 183, 111-124.
65. Teetz, C. Investigation into Reducing Low Temperature Corrosion in Diesel Engines. VDI Forschungsh. 1984.

69
66. Mueller, P. Dew point temperatures in cylinders of diesel engines working with fuel that contains sulfur (Taupunkttemperaturen im Zylinder von Dieselmaschinen bei schwefelhaltigen Kraftstoffen, Nr 486). VDI -- Forschungsheft 1961, 27, 1-56.
67. Abel, E. The Vapour-phase above the System Sulphuric Acid-Water. J. Phys. Chem. 1946, 50, 260.
68. Greenewalt, C. H. Partial pressure of water out of aqueous solutions of sulfuric acid. Ind. Eng. Chem. 1925, 17, 522-523.
69. Gmitro, J. I.; Vermeulen, T. Vapor-Liquid Equilibria for Aqueous Sulfuric Acid. A. I. Ch. E J. 1964, 10 No 5, 740-746.
70. Wilson, R. W.; Stein, F. P. Correlation of sulfuric acid-water partial pressures. Fluid Phase Equilib. 1989, 53, 279-288.
71. Pessoa, F. L. P.; Siqueira Campos, C. E. P.; Uller, A. M. C. Calculation of vapor-liquid equilibria in aqueous sulfuric acid solutions using the UNIQUAC equation in the whole concentration range. Chemical Engineering Science 2006, 61, 5170-5175.
72. Bosen, A.; Engels, H. Description of the phase equilibrium of sulfuric acid with the NRTL equation and a solvation model in a wide concentration and temperature range. Fluid Phase Equilib. 1988, 43, 213-230.
73. Nist Chemistry WebBook: http://webbook.nist.gov/chemistry/.
74. Luchinskii, G. P. Physical-chemical Study of the H2O-SO3 System, I. Equilibrium in the vapor and the liquid phase. Zh. Fiz. Khim. 1956, 30, 1207.
75. Renon; Prausnitz Local compositions in thermodynamic excess functions for liquid mixtures. AIChE J. 1968, 14, 135-144.
76. van Helden, A. K. A Physio-chemical Model of Corrosive Wear in Low-Speed Diesel Engines. CIMAC Conference Report D-9; 1987; .
77. Yahagi, Y. Corrosive wear of diesel engine cylinder bore. Tribol. Int. 1987, 20, 365-373.
78. Poschl, U.; Canagaratna, M.; Jayne, J. T.; Molina, L. T.; Worsnop, D. R.; Kolb, C. E.; Molina, M. J. Mass Accommodation Coefficient of H2SO4 Vapor on Aqueous Sulfuric Acid Surfaces and Gaseous Diffusion Coefficient of H2SO4 in N2/H2O. J. Phys. Chem. 1998, 102, 10082.
79. Reid, R. C.; Sherwood, T. K., Eds.; The properties of gases and liquids. Their estimation and correlation; McGraw-Hill Book Company: New York, 1958; .

70
Appendices

Modeling the Distribution of Sulfur Compounds in a Large TwoStroke Diesel EngineRasmus Cordtz,*,† Jesper Schramm,† Anders Andreasen,‡ Svend S. Eskildsen,‡ and Stefan Mayer‡
†Technical University of Denmark, Kgs. Lyngby, Denmark 2800‡MAN Diesel & Turbo, Denmark
ABSTRACT: In many years large low speed marine diesel engines have consumed heavy fuel oils with sulfur contents in theorder of 2.5−4.5 wt %. Present legislation requires that the fuel sulfur is reduced, and in the near future the limit will be 0.5 wt %globally. During combustion most of the sulfur is oxidized to SO2 from which a fraction is further oxidized to SO3. SO3 maycombine with H2O and condense as liquid sulfuric acid that promotes corrosive wear on e.g. cylinder liners. To extend enginelifetime and reduce costs for lubrication it is pivotal to identify formation of SO3 with respect to operational conditions and sulfurfeed. This work presents a computational model of a large low speed two-stroke diesel engine where a 0D multizone approachincluding a detailed reaction mechanism is employed in order to investigate in cylinder formation of gaseous SO3 where fuel burnrates are based on experimental pressure traces. In contrast to NO the SO3 does not really form at the highest combustiontemperatures, but like NO the formation of SO3 is very sensitive to the rate that fresh air mixes with hot combustion products.Consequently a simple mixing rate is proposed and calibrated in order to meet experimental results of NO. For a large low speeddiesel engine the model shows that 3−5% of the injected sulfur is oxidized to SO3 that is formed primarily in the temperaturerange from 2000 to 1300 K during cylinder expansion. In addition the model is used to reduce the full reaction mechanism from96 to 7 elementary sulfur reactions without compromising the SO3 to SO2 ratio.
■ INTRODUCTION
Many industries as well as the maritime industry are forced todeal with environmental concerns and reduce harmful gaseousemissions such as sulfur oxides which are the principal cause ofacid rain. In this context the International MaritimeOrganization (IMO) has defined future legislation that willglobally lead to a maximum of 0.5 wt % fuel sulfur in 2020 and0.1 wt % from 2015 in some environmentally controlled areas(ECA) unless after treatment equipment such as scrubbers areinstalled onboard.During combustion the sulfur is oxidized primarily to SO2
beside a small fraction of SO3. Experimental results on thefraction of SO3 to sulfur oxides in diesel exhaust gas range from1−8%1,2 depending on operational conditions and fuel quality.In practice SO3 is known to promote corrosive wear on surfacesas it forms liquid sulfuric acid (H2SO4) in combination withH2O.
3−5 H2SO4 may condense on a cylinder liner either asconcentrated acid or diluted acid in water3 if the surfacetemperature is less than the respective dew point temperatures.In order to neutralize the acid and hamper corrosioncommercial lube oils are formulated with a high alkalinityexpressed by the total base number (TBN). Nevertheless inoperation an acceptable level of surface corrosion is sought toassist the lube oil layer between the liner and the moving pistonrings. Reducing the TBN and lube oil feed rate according to thefuel sulfur seems logical, but in reality the answer is not thatsimple and new lube oil formulations are likely needed in thefuture to cope with lower sulfur feed rates.Commercial lube oils are typically formulated to operate with
a fuel sulfur content of around 3 wt % on average, and recentexamples of operational difficulties with low sulfur fuels in largetwo-stroke engines are reported. For instance severe wear rates
due to scuffing (local metal to metal contact)6 and heavydeposits of thermal degraded lube oil on piston and ring packthat may ultimately lead to severe wear.7 Thus in practice thesulfur is believed to contribute to antiwear.Despite a large concern especially in the 1990s with respect
to SO3 formation in diesel engines no results on experimentalmeasurements of SO3 from large two-stroke diesel engines havebeen published in peer reviewed journals in the past.8 This maybe explained by the challenging nature of the molecule. Thepresent work employs a theoretical approach wherein cylinderformation of SO3 is modeled in order to assess the risk ofcorrosive attack with respect to operational conditions. Themodel does not apply a predictive fuel spray combustion modelincluding fuel phase changes but treats multiple homogeneousgas zones similar to the procedure suggested by Anderson9 andused by Andreasen8 who modeled formation of sulfur oxides ina large low speed diesel engine at a low sulfur content of 0.05wt %. Treating multiple gas zones is not a crude simplificationsince SO3 basically forms only in post flame regions as hot gasproducts are diluted with air.The model is formulated in MATLAB and applies the open
source software CANTERA10,11 that is efficiently used tointegrate chemical reaction rates, computing general chemicalequilibrium and thermodynamic gas properties. With CAN-TERA thermodynamic properties of gas mixtures and speciesare expressed through 7 coefficient NASA polynomials.
Background on SO3 Formation and Applied ReactionMechanism. Theoretical investigations of SO3 formation in
Received: November 4, 2012Revised: January 31, 2013Published: February 1, 2013
Article
pubs.acs.org/EF
© 2013 American Chemical Society 1652 dx.doi.org/10.1021/ef301793a | Energy Fuels 2013, 27, 1652−1660
App A.1 (Paper 1)
App. A.1 page 1/9

diesel engines is absent in contrast to gas turbines whereconsiderable attention has been found throughout theyears.12−14 Also in standard textbooks15,16 on the subject ofcombustion and internal combustion engines formation ofsulfur oxides is weakly covered compared to e.g. nitrogenoxides.Thermodynamic considerations of hydrocarbon/hydrogen
flames containing sulfur shows that SO2 is the principal sulfurcontaining species in the product gas.17,18 Experimental resultsconfirm this trend and indicate that SO2 is equilibrated rapidlynear the flame front on a time scale comparable to that of thefuel oxidation reactions.12,16,18 In a flat flame furnace Headley19
measured SO3 concentrations in excess than thermodynami-cally “allowed” by the overall reaction between SO2 and O2.Headley concluded that SO3 is rather formed from the reactionbetween SO2 and atomic O and that a strict thermodynamiccriterion is not appropriate to describe SO3 formation at hightemperatures. The statement is supported by other research-ers,2,20 and rather simple SO3 mechanisms involving SO2, O,and H are provided in refs 16 and 17.Focus on atmospheric sulfur chemistry has provided
theoretical and experimental work on thermochemistry andreactions of H−S−O complexes.21−25 Based on experimentalresults from the literature as well as theoretical tools Glarborg26
evaluated thermodynamic properties and analyzed reactionsystems involving H−S−O complexes. A revised detailedreaction mechanism comprising a sulfur subset, a H2/O2subset, and a CO/CO2 subset is formulated27 and applied inthis work. The mechanism covers 35 species and the sulfursubset alone contains 96 elementary reactions. On oxidation ofSO2 to SO3 the mechanism is validated against a range of hightemperature experimental data based on various reactorexperiments. Additionally a single reaction describing gaseousH2SO4 formation is applied in the present work. Published dataon H2SO4 formation is limited, yet kinetic rate coefficients of areaction between SO3 and H2O are suggested.28 The rates areinvestigated in a low pressure environment far fromcombustion conditions. Nevertheless the rate is fast andconsidered rational in describing gaseous H2SO4 formation.In low speed diesel engines emissions of nitrogen oxides are
primarily represented by NO and reactions involving NO2 arenegligible.29 Correspondingly N2O formation is ignored in thepresent study as it is more appropriate in a lean premixedcombustion like e.g. gas turbines.15 Hence, the extendedZeldovich mechanism30 is applied in the present work tosimulate NO formation.
■ EXPERIMENTAL SECTIONA large test engine from MAN Diesel & Turbo is used to generateexperimental data needed to calibrate the multizone model. Foursteady state experiments are conducted at 100, 75, 50 and 25% engineload at engine speeds of 123, 112, 98, and 78 rpm respectively. Thespeed decreases with the load according to a simulated propellercurve.8 General engine specifications are presented in Table 1.
■ THEORETICAL MODELTo reduce model complexity and computational time a numberof important assumptions are introduced. However from theauthor’s point of view these simplifications will not alter thegeneral depiction of SO3 formation.• The fuel is treated as n-dodecane (C12H26) including
nonbonded elemental sulfur.• The air is treated as dry air with 79% N2 and 21% O2.
• The fraction of injected fuel is directly reflected by the fuelburn fraction.• Gas mixtures obey ideal gas conditions.• Gas properties are updated every crank angle.• The gas pressure in the cylinder is uniform.• Blow by affects are neglected.• Only cylinder bore, piston position, and compression ratio
is used to define cylinder geometry.Single-Zone Model. Initially a homogeneous cylinder gas
(single zone) is considered in order to evaluate the burned fuelfraction of each crank angle during combustion. For thispurpose the first law of thermodynamics of an ideal gas mixturein a closed system (1) is applied. In this form a measuredcylinder pressure trace can be applied to determine the heatrelease of combustion. A closed system approximation is notentirely true since the fuel is injected directly into thecombustion chamber. However the consequence of neglectinginjection effects in the overall energy balance is typically smallcompared to the inaccuracies associated with heat transfercorrelations31 as provided in the literature of combustionengines. The correlations typically involve empirical constantsthat need to be calibrated for the specific engine underconsideration. Otherwise the correlations only providequalitatively predictions in particular during combustion.Nevertheless the well-known Woschni correlation is appliedin this work using constants suggested by Ferguson.32
θγ
γ θ γ θ=
−+
−dQ
dp
dVd
Vdpd1
11
net
(1)
θ θ θ = = +Q
dQ
d
dQ
ddQ
dff net HT
(2)
The liberated heat from the fuel Qf in 2 is the sum of aneffective net heat release plus the heat transfer/loss. In 3 Qf isintegrated in order to determine the trace of the fuel burn rate/burn fraction xb(θ).
∫ ∫
∫θ
θ θ
θ=
· − ·
·θ
θ θ
θ
θ
θ
+Δ
xQ d Q d
Q d( )b
f f
f
start start
(3)
The trapped cylinder gas at the time where compressionstarts is a mixture of fresh air and residual gas products from theprevious engine cycle. Still the mixture temperature and theshare of the two gas types are unknown. The share of residualgas Xres depends on the quality of the prior gas exchange wheremost of the combustion products are replaced by fresh air. Xresis calculated using Blair’s empirical correlation33 which is theresult of numerous cylinder gas exchange/scavenging experi-ments with different porting configurations.
Table 1. Test Engine Specifications
parameter remarks
engine type 4T50ME-Xnumber of cylinders 4bore/stroke/connecting rod 500 mm/2200 mm/2885 mmMCRa speed 123 rpmMCR power 7050 kWMEPb at MCR 20 barturbocharger MAN TCA55-VTA
aMaximum continuous rating. bMean effective pressure.
Energy & Fuels Article
dx.doi.org/10.1021/ef301793a | Energy Fuels 2013, 27, 1652−16601653
App A.1 (Paper 1)
App. A.1 page 2/9

The mass of air and residual gas is calculated from eqs 4 and5 respectively where the inlet air temperature is providedexperimentally. In contrast the temperature of the residual gasis not known in advance but is calculated through an iterativeengine cycle procedure. Following the mixture temperature atthe start of compression is calculated assuming that theenthalpy of the two gas types is conserved. In the single-zoneapproach gas properties are updated every crank angleassuming that the cylinder gas is in a state of general chemicalequilibrium if the temperature is above 1200 K. The gastemperature (during compression and expansion) is linked tothe measured cylinder pressure. Below 1200 K the gascomposition is assumed to be frozen.
=·
· −mp
R TV X(1 )Air
EVC
Air AirEVC res
(4)
=·
·mp
R TV Xres
EVC
res resEVC res
(5)
Multizone Model. Traces of experimental cylinder pressurewith respect to engine load are presented in Figure 1 next to
the traces of the burned fuel fraction as predicted by the single-zone model. The fuel starts to burn just after TDC, but theshape of the combustion depends on the engine load. Forinstance the combustion duration is reduced at lower loadsbecause less fuel is added per cycle. For a given load themultizone model is coupled to the single-zone model in thesense that it applies the cylinder pressure trace and thecorresponding fuel burn trace. Another adopted feature is thegas composition and temperature at the time where the fuelstarts to burn. However in contrast to the single-zone approachmultiple gas zones are treated from this instant and until EVO.Burned Zones and Gas Mixing. A compression ignited
diesel combustion process with direct fuel injection is basicallydiffusion controlled with a stoichiometric flame zone enclosinga decomposing fuel spray.34 Nonetheless the complex nature ofthe spray and flame is not modeled. Instead the model seeks toreproduce high temperatures close to the flame by separatingthe overall fuel mass in multiple burned gas zones. At each
crank angle during fuel combustion a new burned zone iscreated where the burning fuel fraction is mixed stoichiometri-cally with air and residual gas from the fresh gas zone. The localflame temperature is calculated assuming that the productspecies attain general chemical equilibrium. This implies thatchemical reactions between the fuel and fresh gas proceed veryfast which is a common assumption32 due to the high flametemperature of more than 2500 K. After combustion a burnedzone is diluted with fresh gas (air + residual gas) every crankangle at a defined rate as described below. No more fuel isadded to a burned zone, and no gas exchange is consideredbetween burned zones either. Consequently a burned zonegrows leaner throughout the expansion stroke.The rate at which fresh gas is mixed into a burned zone per
crank angle is assumed to be constant, but if the local excess airratio should exceed the overall excess air ratio, then no moregas is added to the zone. By applying the overall excess air ratiothe integrated mass of air mmax that may potentially mix intoeach zone until EVO is calculated and used to express themixing rate for each zone eq 6 where N is the number of crankangles between EVO and the point where combustion starts.The mixing rate is a rough simplification of the complex natureof air entrainment into the flame and combustion products.Therefore an adjustable mix gain factor β is introduced with theaim of investigating mixing sensitivity, and moreover β can becalibrated in order to meet experimental results of NO. Inaddition, since the share of fresh gas reduces as more fuel isburned, the mixing rate of subsequent zones is assumed todecrease accordingly. This is done by introducing the relativefresh gas volume V at the angle where a given burned zone iscreated.
β = mm
NVmix
max(6)
Burned Zone Temperature Trace. During cylinderexpansion the burned zones cools every crank angle due togas mixing and expansion. The cooling is assumed to take placein two steps. First the burned zones mix with colder fresh gas atconstant pressure. The mixing provides an intermediatetemperature T* that is calculated by conserving the totalenthalpy. The gas mixture of a burned zone is assumed to be inthe state of general chemical equilibrium if the resultingtemperature is more than 1200 K. Otherwise the mixturechemistry is assumed frozen. Second the ideal gas law on adifferential form 7 is applied to calculate the temperature dropdue to expansion, and the updated temperature of the burnedzone is determined using Euler integration 8.
θ θ θ+ =V
dpd
pdVd
mRdTd (7)
θ θ θθ
θ+ Δ ≈ * + ·ΔT TdTd
( ) ( )(8)
Modeled temperature and excess air ratio traces of selectedburned zones are illustrated in Figure 2 for two different mixingrates represented by a β-value of 0.5 and 1. The leftmost pointon the traces represents a flame condition where thetemperature is around 2700 K and the mixture is stoichiometrici.e. λ = 1. Increasing β means that more fresh gas will mix intothe burned zones. This provides higher local excess air ratiosthroughout the expansion stroke but lowers the localtemperatures in turn as seen in the figure. By definition, if β= 1, then the first created burned zone will attain the global
Figure 1. Traces of experimental cylinder pressure and fuel burnfraction with respect to engine load.
Energy & Fuels Article
dx.doi.org/10.1021/ef301793a | Energy Fuels 2013, 27, 1652−16601654
App A.1 (Paper 1)
App. A.1 page 3/9
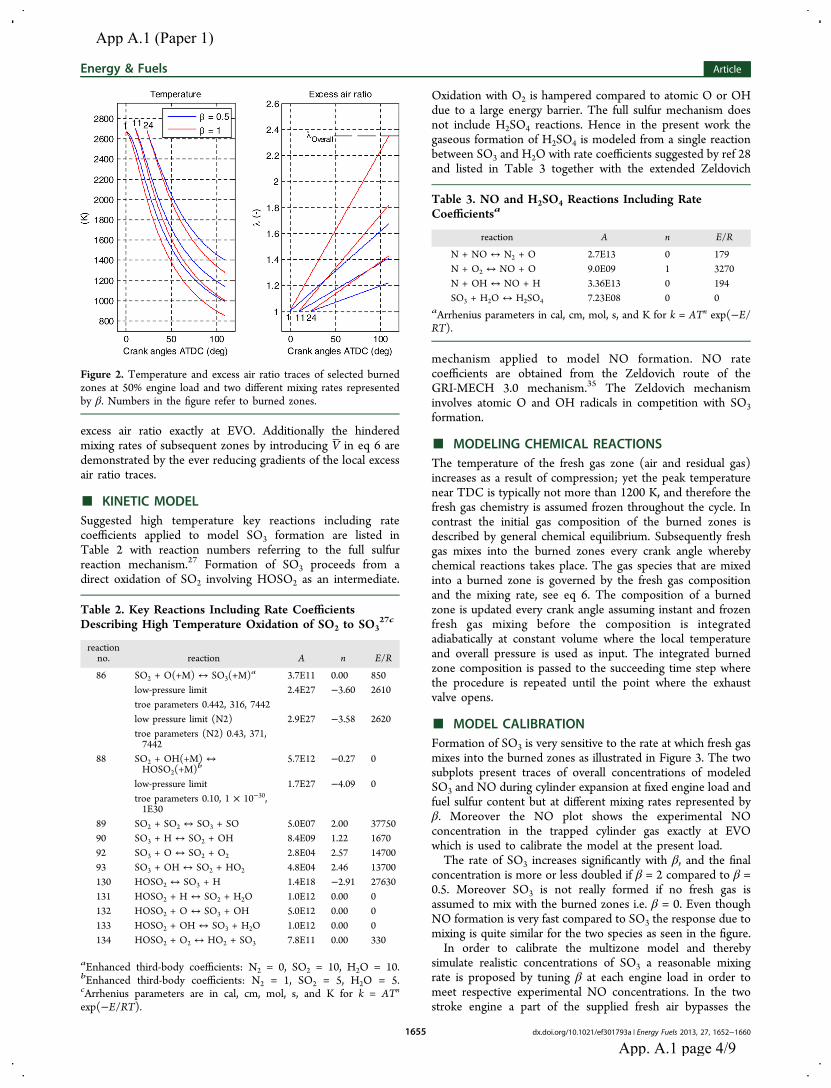
excess air ratio exactly at EVO. Additionally the hinderedmixing rates of subsequent zones by introducing V in eq 6 aredemonstrated by the ever reducing gradients of the local excessair ratio traces.
■ KINETIC MODELSuggested high temperature key reactions including ratecoefficients applied to model SO3 formation are listed inTable 2 with reaction numbers referring to the full sulfurreaction mechanism.27 Formation of SO3 proceeds from adirect oxidation of SO2 involving HOSO2 as an intermediate.
Oxidation with O2 is hampered compared to atomic O or OHdue to a large energy barrier. The full sulfur mechanism doesnot include H2SO4 reactions. Hence in the present work thegaseous formation of H2SO4 is modeled from a single reactionbetween SO3 and H2O with rate coefficients suggested by ref 28and listed in Table 3 together with the extended Zeldovich
mechanism applied to model NO formation. NO ratecoefficients are obtained from the Zeldovich route of theGRI-MECH 3.0 mechanism.35 The Zeldovich mechanisminvolves atomic O and OH radicals in competition with SO3formation.
■ MODELING CHEMICAL REACTIONSThe temperature of the fresh gas zone (air and residual gas)increases as a result of compression; yet the peak temperaturenear TDC is typically not more than 1200 K, and therefore thefresh gas chemistry is assumed frozen throughout the cycle. Incontrast the initial gas composition of the burned zones isdescribed by general chemical equilibrium. Subsequently freshgas mixes into the burned zones every crank angle wherebychemical reactions takes place. The gas species that are mixedinto a burned zone is governed by the fresh gas compositionand the mixing rate, see eq 6. The composition of a burnedzone is updated every crank angle assuming instant and frozenfresh gas mixing before the composition is integratedadiabatically at constant volume where the local temperatureand overall pressure is used as input. The integrated burnedzone composition is passed to the succeeding time step wherethe procedure is repeated until the point where the exhaustvalve opens.
■ MODEL CALIBRATIONFormation of SO3 is very sensitive to the rate at which fresh gasmixes into the burned zones as illustrated in Figure 3. The twosubplots present traces of overall concentrations of modeledSO3 and NO during cylinder expansion at fixed engine load andfuel sulfur content but at different mixing rates represented byβ. Moreover the NO plot shows the experimental NOconcentration in the trapped cylinder gas exactly at EVOwhich is used to calibrate the model at the present load.The rate of SO3 increases significantly with β, and the final
concentration is more or less doubled if β = 2 compared to β =0.5. Moreover SO3 is not really formed if no fresh gas isassumed to mix with the burned zones i.e. β = 0. Even thoughNO formation is very fast compared to SO3 the response due tomixing is quite similar for the two species as seen in the figure.In order to calibrate the multizone model and thereby
simulate realistic concentrations of SO3 a reasonable mixingrate is proposed by tuning β at each engine load in order tomeet respective experimental NO concentrations. In the twostroke engine a part of the supplied fresh air bypasses the
Figure 2. Temperature and excess air ratio traces of selected burnedzones at 50% engine load and two different mixing rates representedby β. Numbers in the figure refer to burned zones.
Table 2. Key Reactions Including Rate CoefficientsDescribing High Temperature Oxidation of SO2 to SO3
27c
reactionno. reaction A n E/R
86 SO2 + O(+M) ↔ SO3(+M)a 3.7E11 0.00 850low-pressure limit 2.4E27 −3.60 2610troe parameters 0.442, 316, 7442low pressure limit (N2) 2.9E27 −3.58 2620troe parameters (N2) 0.43, 371,7442
88 SO2 + OH(+M) ↔HOSO2(+M)b
5.7E12 −0.27 0
low-pressure limit 1.7E27 −4.09 0troe parameters 0.10, 1 × 10−30,1E30
89 SO2 + SO2 ↔ SO3 + SO 5.0E07 2.00 3775090 SO3 + H ↔ SO2 + OH 8.4E09 1.22 167092 SO3 + O ↔ SO2 + O2 2.8E04 2.57 1470093 SO3 + OH ↔ SO2 + HO2 4.8E04 2.46 13700130 HOSO2 ↔ SO3 + H 1.4E18 −2.91 27630131 HOSO2 + H ↔ SO2 + H2O 1.0E12 0.00 0132 HOSO2 + O ↔ SO3 + OH 5.0E12 0.00 0133 HOSO2 + OH ↔ SO3 + H2O 1.0E12 0.00 0134 HOSO2 + O2 ↔ HO2 + SO3 7.8E11 0.00 330
aEnhanced third-body coefficients: N2 = 0, SO2 = 10, H2O = 10.bEnhanced third-body coefficients: N2 = 1, SO2 = 5, H2O = 5.cArrhenius parameters are in cal, cm, mol, s, and K for k = ATn
exp(−E/RT).
Table 3. NO and H2SO4 Reactions Including RateCoefficientsa
reaction A n E/R
N + NO ↔ N2 + O 2.7E13 0 179N + O2 ↔ NO + O 9.0E09 1 3270N + OH ↔ NO + H 3.36E13 0 194SO3 + H2O ↔ H2SO4 7.23E08 0 0
aArrhenius parameters in cal, cm, mol, s, and K for k = ATn exp(−E/RT).
Energy & Fuels Article
dx.doi.org/10.1021/ef301793a | Energy Fuels 2013, 27, 1652−16601655
App A.1 (Paper 1)
App. A.1 page 4/9

cylinder during the scavenging process and dilutes theoutgoing/replaced exhaust gases. This means that the overallNO concentration of the cylinder gas exactly at EVO (when theexhaust valve is still closed) is higher than the measured exhaustpipe concentration presented in Table 4. By compensating for
the gas dilution the trapped experimental NO concentrationexactly at EVO is determined and shown for the 50% load casein Figure 3 (1965 ppmv). Following the model is calibrated bytuning the β-value in order to reproduce this value as seen inFigure 3 where the calibrated β-value is found to be 0.83.Calibrated β-values for the different engine loads are listed in
Table 4. At all loads β is less than 1. Computationally thismeans that none of the burned zones will attain the overallexcess air ratio during cylinder expansion. β also reflects theengine speed inversely as seen in the table. At 100% load themixing is found to be rather low due to the increased enginespeed leaving less time for gas mixing.
■ COMPUTATIONAL RESULTSThe sulfur species of relevance in the burned gases are SO2 andSO3 beside a very small fraction of H2SO4. To illustrate SO3formation expression 9 is used where ε practically describes thecompetition between SO2 and SO3 formation.
ε =+ +
[SO ][SO ] [SO ] [H SO ]
3
3 2 2 4 (9)
Kinetically determined SO3 formation in burned zones withrespect to the crank angle from the point of creation and untilEVO at 50% engine load and 4.5 wt % fuel sulfur is illustrated
in Figure 4. The leftmost point on each trace represents acondition very close to the stoichiometric flame zone where the
sulfur oxides are more or less represented by SO2 only. A littleafter the rate of SO3 in the first 12−15 zones increases rapidlyas the gas expands and mixes with fresh gas. However the rapidformation is also followed by a rapid slow down, and at somepoint the SO3 formation stagnates. Yet locally the fraction ofSO3 may be more than 6%. In subsequent zones the fraction isconsiderably lower, and their contribution to the overall SO3output is small as they typically hold a small share of theinjected fuel sulfur.In Figure 5 the former ε-traces of the burned zones are
illustrated with respect to temperature together with thetheoretical traces of ε as prescribed by general chemicalequilibrium. Although SO3 is rapidly equilibrated at the highesttemperatures, SO2 is the principal sulfur oxide close to theflame, and SO3 formation is very limited above 2000 K.Thermodynamically SO3 is increasingly favored as the temper-
Figure 3. Gas mixing sensitivity (illustrated by β) of SO3 and NOmodeled at 50% engine load and 4.5 wt % fuel sulfur. The NO plotincludes an experimental concentration exactly at EVO.
Table 4. Measured Exhaust Pipe NO Concentrations andCalibrated β Values with Respect to Operational Conditions
engine load (%) rpm NOexh (ppmv) β (-)
25 78 1320 0.8950 98 1236 0.8375 112 1266 0.59100 123 1119 0.41
Figure 4. Formation of SO3 in burned zones at 50% engine load and4.5 wt % fuel sulfur. Numbers in figure refer to burned zones.
Figure 5. Formation of SO3 in burned zones versus temperature at50% engine load and 4.5 wt % fuel sulfur. Dashed traces representgeneral chemical equilibrium and trace numbers refer to burned zones.
Energy & Fuels Article
dx.doi.org/10.1021/ef301793a | Energy Fuels 2013, 27, 1652−16601656
App A.1 (Paper 1)
App. A.1 page 5/9

ature reduces during cylinder expansion. However at around1650 K the SO3 kinetics is too slow to keep up with thetheoretical growth. The primary SO3 formation takes placewithin the temperature range from 2000 K to 1300 K, and thegoverning reactions freeze close to the latter.According to the present model gaseous formation of H2SO4
in high temperature burned zones is very limited and results inan overall concentration of less than 1 ppmv at EVO. HoweverH2SO4 is thermodynamically favored over SO3 if the hot gasesare cooled sufficiently for instance upon contact with thecooled liner surface (this aspect is not covered by the modelthough). Moreover, SO3 and H2SO4 concentrations have beenused interchangeably for acid dew point calculations36,37 whichis rational due to the fast H2O + SO3 ↔ H2SO4 reaction asindicated in Table 3. Consequently a sensible depiction ofgaseous H2SO4 formation is illustrated by the theoretical curvesin Figure 6. The curves represent the fractional conversion of
initial SO3 to gaseous H2SO4 at general chemical equilibriumwith respect to temperature, overall pressure, and H2O vaporconcentration. As shown the H2SO4 onset is moved towardhigher temperatures if the pressure and or the concentration ofH2O increases. In any case most of the SO3 is converted toH2SO4 if the hot gases are cooled for instance to 550 K. Theliner temperature is typically around 475 K,38 and aconsiderable amount of H2SO4 may form at the gas-to-linerinterface in practice. Concentrated acid or more importantdiluted acid in water is known to condense on the liner surfaceproviding that the temperature is lower than the dew pointtemperature. The revised SHELL acid dew point curves38
indicates that the dew point of a gaseous mixture of H2SO4 andH2O can exceed 475 K at the current sulfur levels and cylindergas conditions. However, if the surface temperature is stillabove the dew point of pure water the condensed acid is highlyconcentrated but quite harmless compared to a conditionwhere pure water also condenses. Such a condition results in amuch more aggressive/corrosive solution.39
The traces of ε in Figure 7 illustrate the overall formation ofSO3 from TDC until EVO at different engine loads and sulfurcontents. In all cases except one any possible surface formationof H2SO4 and condensation is omitted. This implies that ε atEVO is the same as when combustion starts in the subsequent
cycle. Just after TDC a sudden drop of ε is observed in thefigure and demonstrates formation of SO2, while SO3 from thefresh gas is rapidly converted to SO2 as it is mixed into the hightemperature burned zones. During the second half of fuelcombustion ε reaches a minimum at around 0.5% but thenstarts to increase considerably demonstrating formation of SO3.Depending on the load the final share of SO3 at EVO is in theorder of 3.5−5.2% and 3.2−4.3% at 1 wt % and 4.5 wt % fuelsulfur respectively. This shows that the fraction of SO3increases inversely with the fuel sulfur content in agreementwith experimental results.1 Generally ε increases slightly withthe engine load (providing that the speed is unchanged) whichseems reasonable due to elevated pressures providing a higherdegree of SO2 oxidation in the latter part of the expansionstroke. Especially at 100% load the fresh gas mixing iscomparably low as indicated by the small β-value in Table 4and explained by the elevated engine speed leaving less time formixing and chemical reactions. As a consequence, SO3formation is hampered and ε deviates from the general trend.If it is assumed that no SO3 or H2SO4 is present in the
residual gas when combustion starts a slightly different trace ofε develops as also demonstrated in Figure 7 in the case of 50%engine load and 4.5 wt % sulfur. In contrast the trace of ε nowstarts close to zero, but soon after the trace is almost identicalto the former case at the equivalent conditions. In the presentcase ε is a bit lower at EVO though since the fresh gas holds noSO3.Model results of overall concentrations of SO2 and SO3 from
TDC and until EVO are presented in Figure 8 with respect toengine load and fuel sulfur content. Irrespective of the load SO2forms rapidly just after TDC and seeks toward a more or lessfixed concentration. At 4.5 wt % sulfur the final concentration isbetween 1000−1200 ppmv depending on the engine load.Changing from 4.5 wt % to 1 wt % fuel sulfur will reduce theSO2 concentration proportionally. SO3 formation is slowcompared to SO2 and the onset is about 20−30 crank anglespast TDC, yet the majority is formed within the first 75 crankangles. Final differences in SO3 concentrations are fairly smallwith respect to engine load. For instance at 4.5 wt % sulfur therange is between 38−47 ppmv, and at 1 wt % the concentrationis between 9−12 ppmv.
Figure 6. Fraction of initial SO3 converted to gaseous H2SO4 withrespect to temperature, overall pressure, and H2O vapor concentration.
Figure 7. Overall formation of SO3 with respect to engine load andfuel sulfur content. (**no SO3 or H2SO4 present in residual gas.)
Energy & Fuels Article
dx.doi.org/10.1021/ef301793a | Energy Fuels 2013, 27, 1652−16601657
App A.1 (Paper 1)
App. A.1 page 6/9

■ RELATIVE RISK OF LINER CORROSIONIn practice the fuel is injected into the combustion chamberthrough a multihole injector in the top of the cylinder andabove the liner. Unfortunately the present 0D multizoneapproach cannot locate the burned zones throughoutcombustion and expansion. Yet the local concentration ofSO3 (mol/m3) in the burned zones with respect to time (i.e.,the number of crank angles that has passed after a given zone iscreated) is depicted in Figure 9. The traces indicate that thelocal concentration typically peaks at about 50−60 crank anglespast creation and then reduces rapidly due to expansion andmixing with fresh gas.
The rate of acid condensation on an exposed surfaceincreases with the partial pressure of H2SO4 in the gasphase.5,40 Combined with the former proposal regardingsurface H2SO4 formation the figure can be used to depict therisk of corrosive attack along the cylinder liner. It appears thatthe risk is highest within the first 60 crank angles after TDC
(i.e.in the upper third of the liner) providing that the surfacetemperature is sufficiently low. The results are consistent withpractical experience of large two stroke engines where corrosiveattack is pronounced in the top of the liner around the ringpack position at TDC.
■ REDUCING THE SULFUR SUBSETBasically SO3 forms only in post flame regions where the excessair ratio is above 1. Still the full sulfur subset contains 96elementary reactions, and many of these are not relevant in thehigh pressure environment of a large low speed diesel engine.In combination with CANTERA the present model is wellsuited to reduce the number of chemical reactions as well as thenumber of sulfur species in order to reduce the computationaltime. To do this the net formation rate of each elementaryreaction of each burned zone is investigated throughout theexpansion stroke wherein the zones meet high pressure andtemperature gradients and mix with fresh gas. Moreover thesulfur chemistry is reduced by keeping the H2/O2 and the CO/CO2 subset unchanged. Based on the investigation a largelyreduced sulfur subset is suggested comprising only 6 of theelementary reactions in Table 2 but includes reaction number77 from the full sulfur subset. The revised subset comprisesreaction numbers 86, 88, 89, 90, 93, 134, and 77 with ratecoefficients as listed in Table 5. In addition the number ofsulfur species is reduced from 14 to 4.
The revised sulfur subset is compared with the full subset inFigure 10 at different mixing rates expressed by β that is variedbetween 0.1 and 1.5. The traces in the figure illustrate overallSO3 formation (expressed by ε) from TDC and until EVO. As
Figure 8. Overall concentrations of SO2 and SO3 with respect toengine load and fuel sulfur content.
Figure 9. SO3 concentration in burned zones during cylinderexpansion at 50% engine load and 4.5 wt % fuel sulfur. Numbers infigure refer to burned zones.
Table 5. Elementary Sulfur Reaction of the Revised SulfurSubseta
reaction no. reaction A n E/R
77 SO + O2 ↔ SO2 + O 7.6E3 2.37 2970aArrhenius parameters in cal, cm, mol, s, and K for k = ATn exp(−E/RT).
Figure 10. Overall SO3 formation modeled with a full and a revisedsulfur subset at different mixing rates (β) at 50% engine load and 4.5wt % fuel sulfur.
Energy & Fuels Article
dx.doi.org/10.1021/ef301793a | Energy Fuels 2013, 27, 1652−16601658
App A.1 (Paper 1)
App. A.1 page 7/9

shown no accuracy is lost in the SO3 to SO2 ratio with therevised subset.
■ CONCLUSIONSIn the present work gaseous formation of sulfur oxides in alarge low speed two-stroke diesel engine is modeled using a 0Dmultizone approach in combination with a detailed reactionmechanism where fuel is modeled as n-dodecane withnonbonded elemental sulfur. Computationally the fuel isseparated in multiple burned gas zones to address the effectof high flame temperatures and local variations of fresh gasmixing. Results demonstrate that the rate of mixing is a verysensitive parameter regarding SO3 formation. High mixing ratesresult in more SO3 in a similar fashion as NO. An adjustablemixing rate is suggested and calibrated in order to meetexperimental results of NO. The model simulates realisticresults of SO3 providing confidence with the applied reactionmechanism and model assumptions. In addition the presentmodel is used in combination with CANTERA to reduce thesulfur subset of the overall reaction mechanism from 96 to 7elementary reactions without compromising the accuracy of theSO3 to SO2 fraction in the burned gases. Moreover the numberof required sulfur species is reduced from 14 to 4.Due to thermodynamic restrictions SO3 is weakly present at
the highest temperatures close to the diesel flame. HoweverSO3 is increasingly favored as the gas temperature reducesduring cylinder expansion. Basically all of the SO3 is formedlocally in the temperature range from about 2000 K and downto 1300 K. Moreover down to about 1650 K SO3 is welldescribed by general chemical equilibrium. The governing SO3reactions are frozen below 1300 K and down to about 800−1000 K where gaseous/corrosive H2SO4 is preferred from a fastreaction between SO3 and H2O. At about 50−60 crank anglespast TDC the SO3/H2SO4 concentration peaks in accordancewith practical experience that shows the highest rates of surfacecorrosion in the upper part of the cylinder liner.Overall sulfur to SO3 conversion increases slightly with the
engine load providing that the engine speed is similar butincreases slightly inversely with the fuel sulfur content. Ingeneral the conversion is on the order of 3−5%, and theremainder is converted to SO2
■ AUTHOR INFORMATIONCorresponding Author*E-mail: [email protected] authors declare no competing financial interest.
■ NOMENCLATUREh = enthalpy kJ/kgm = mass kgmmix = fresh gas mixing kg/°CAp = pressure PaQf = fuel heat kJQHT = heat transfer kJQnet = net heat release kJR = gas constant J/mol KT = temperature KV = volume m3
Xres = residual gas fraction at EVC m3/m3
γ = specific heat ratio -λ = excess air ratio -
θ = crank angle position °Cθstart = start of combustion °CΔθ = computational step °C
ABBREVATIONSATDC = after top dead centerCA = crank anglesEVC = exhaust valve closingEVO = exhaust valve openingMCR = maximum continuous ratingMEP = mean effective pressureres = residual gasTDC = top dead center
■ REFERENCES(1) Engel, P. K.; Thompson, R. E.; Silvestrinin, R. Corrosion andFouling Potential in Diesel Exhausts. Mech. Eng. 1979, 101, 598−606.(2) Dooley, A.; Whittingham, G. The Oxidation of Sulphur Dioxidein Gas Flames. Trans. Faraday Soc. 1946, 42, 354−366.(3) Schramm, J.; Henningsen, S.; Sorenson, S. C. Modelling ofCorrosion of Cylinder Liner in Diesel Engines Caused by Sulphur inthe Diesel Fuel. SAE Paper 1994, 940818.(4) Jackson, P. J.; Hilton, D. A.; Buddery, J. H. ContinuousMeasurement of Sulphuric Acid Vapour in Combustion Gases using aPortable Automatic Monitor. J. Inst. Energy 1981, 54, 124−135.(5) Land, T. Theory of Acid Deposition and its Application to theDew-Point Meter. J. Inst. Fuel 1977, 50, 68−75.(6) Boons, M.; Brand, R. Lubrication Challenges for Distillate FuelOperated Two-Stroke Engines. In 26 CIMAC World Congress;CIMAC: Bergen, 2010.(7) Welsch, M. Considerations for using low-sulphur fuel; WartsilaCorporation: 2002.(8) Andreasen, A.; Mayer, S. Modeling of the oxidation of fuel sulfurin low speed two-stroke Diesel engines. In 26th CIMAC WorldCongress; Bergen, 2010.(9) Andersson, M.; Johansson, B.; Hultqvist, A. A Real-Time NOxModel for Conventional and Partially Premixed Diesel Combustion.SAE Paper 2006, 2006-01-0195.(10) Goodwin, D. G. Defining phases and interphases - Cantera 1.5;Tech. rep.; California Inst. of Technology: 2003.(11) Goodwin, D. G. Cantera C++ users guide; California Inst. ofTechnology: 2002.(12) Hunter, S. C. Formation of SO3 in Gas Turbines. J. Eng. Power1982, 104, 44−50.(13) Lebedev, A. B.; Secundov, A. N.; Starik, A. M.; Titova, N. S.;Schepin, A. M. Modeling Study of Gas-Turbine Combustor Emission.Proc. Combust. Inst. 2009, 32, 2941−2947.(14) Moniruzzaman, C. G.; Yu, F. A 0D Aircraft Engine EmissionModel with Detailed Chemistry and Soot Microphysics. Combust.Flame 2012, 159, 1670−1686.(15) Turns, S. R. An introduction to combustion/concepts andapplications; McGraw-Hill: New York, 2012.(16) In Fossil fuel combustion/A source book; Bartok, W., Sarofim, A.,Eds.;Wiley: New York, 1991.(17) Cullis, C. F.; Mulcahy, M. F. R. The Kinetics of Combustion ofGaseous Sulphur Compounds. Combust. Flame 1972, 18, 225−292.(18) Johnson, G. M.; Matthews, C. J.; Smith, M. Y.; Williams, D. J.Distribution of Sulfur Species in the Burnt Gas of Fuel-Rich Propane-Air Flames. Combust. Flame 1970, 15, 211−214.(19) Hedley, A. B. Sulphur Trioxide in Combustion Gases. Fuel Soc. J.1962, 13, 45−54.(20) Merryman, E. L.; Levy, A. Enhanced SO3 Emissions fromStaged Combustion. Symp. Int. Combust. 1979, 727−736.(21) Gleason, J. F.; Howard, C. J. Temperature Dependence of theGas-Phase Reaction HOSO2+O2=>HO2+SO3. J. Phys. Chem. 1988,92, 3414−3417.
Energy & Fuels Article
dx.doi.org/10.1021/ef301793a | Energy Fuels 2013, 27, 1652−16601659
App A.1 (Paper 1)
App. A.1 page 8/9

(22) Gleason, J. F.; Sinha, A.; Howard, C. J. Kinetics of the Gas-PhaseReaction HOSO2+O2=>HO2+SO3. J. Phys. Chem. 1987, 91, 719−724.(23) Laakso, D.; Smith, C. E.; Goumri, A.; Rocha, J.; Marshall, P.Theoretical Studies of the RSOO, ROSO, RSO(2) and HOOS (R=H,CH(3)) Radicals. Chem. Phys. Lett. 1994, 227, 377−383.(24) Goumri, A.; Rocha, J.; Laakso, D.; Smith, C. E.; Marshall, P.Computational Studies of the Potential Energy Surface for O(1D)+H2S: Characterization of Pathways Involving H2 SO, HOSH, andH2OS. J. Chem. Phys. 1994, 101, 9405−9411.(25) Goumri, A.; Laakso, D.; Rocha, J.; Smith, C. E.; Marshall, P.Computational Studies of the Potential Energy Surface for O-(3P)+H2S: Characterization of Transition States and the Enthalpyof Formation of HSO and HOS. J. Chem. Phys. 1995, 102, 161−169.(26) Glarborg, P.; Kubel, D.; DamJohansen, K.; Chiang, H.; Bozzelli,J. Impact of SO2 and NO on CO Oxidation under Post-FlameConditions. Int. J. Chem. Kinet. 1996, 28, 773−790.(27) Hindiyarti, L.; Glarborg, P.; Marshall, P. Reactions of SO3 withthe O/H Radical Pool under Combustion Conditions. J. Phys. Chem. A2007, 111, 3984−3991.(28) Reiner, T.; Arnold, F. Laboratory Investigations of GaseousSulfuric-Acid Formations via SO3+H2O+M=>H2SO4+M: Measure-ments of the Rate-Constant and Product Identification. J. Chem. Phys.1994, 101, 7399−7407.(29) Zabetta, E. C.; Kilpinen, P. Improved NOx Submodel for in-Cylinder CFD Simulation of Low- and Medium-Speed CompressionIgnition Engines. Energy Fuels 2001, 15, 1425−1433.(30) Lavoie, G. A.; Heywood, J. B.; Keck, J. C. Experimental andTheoretical study of Nitric Oxide Formation in Internal CombustionEngines. Combust. Sci. Technol. 1970, 1, 313−26.(31) Heywood, J. B. Internal combustion engine fundamentals;McGraw-Hill: New York, 1988 .(32) In Internal combustion engines/applied thermosciences; Ferguson,C. R., Kirkpatrick, A. T., Eds.; Wiley: New York, 2001.(33) In Design and Simulation of Two-Stroke Engines; Blair, G. P., Ed.;SAE: Warrendale, PA, 1996.(34) Dec, J. E.; Espey, C. Soot and Fuel Distributions in a D.I. DieselEngine Via 2-D Imaging. SAE Paper1992, 922307.(35) Smith, G. P.; Golden, D. M.; Frenklach, M., et al. GRI-Mech 3.0.(36) McKinley, T. L. Modeling Sulfuric Acid Condensation in DieselEngine EGR Coolers. SAE Spec. Publ. Sens. Actuators 1997, 1255, 207−218.(37) Mueller, P. Influence of Sulphuric Acid on DEW PointTemperature of Flue Gases. Chem.-Ing.-Tech. 1959, 31, 345−351.(38) Hengeveld, J.; Schenk, C.; Aabo, K. The Role of Temperatureand Pressure in the Wear Process in Low Speed Diesel Engines. Shell2000.(39) Teetz, C. Investigation into Reducing Low TemperatureCorrosion in Diesel Engines. VDI Forschungsh. 1984, 626, 13.(40) van Helden, A. K.; Valentijn, M. C.; van Doorn, H. M. J.Corrosive Wear in Crosshead Diesel Engines. Tribol. Int. 1989, 22,189−193.
Energy & Fuels Article
dx.doi.org/10.1021/ef301793a | Energy Fuels 2013, 27, 1652−16601660
App A.1 (Paper 1)
App. A.1 page 9/9
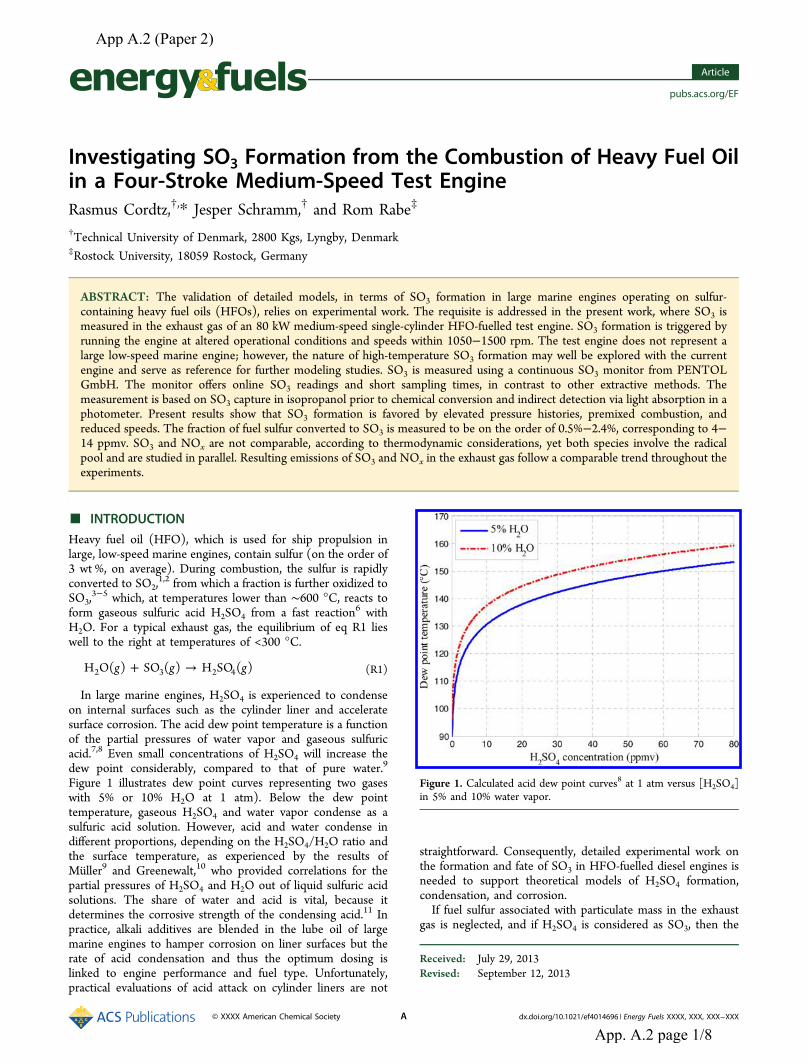
Investigating SO3 Formation from the Combustion of Heavy Fuel Oilin a Four-Stroke Medium-Speed Test EngineRasmus Cordtz,†,* Jesper Schramm,† and Rom Rabe‡
†Technical University of Denmark, 2800 Kgs, Lyngby, Denmark‡Rostock University, 18059 Rostock, Germany
ABSTRACT: The validation of detailed models, in terms of SO3 formation in large marine engines operating on sulfur-containing heavy fuel oils (HFOs), relies on experimental work. The requisite is addressed in the present work, where SO3 ismeasured in the exhaust gas of an 80 kW medium-speed single-cylinder HFO-fuelled test engine. SO3 formation is triggered byrunning the engine at altered operational conditions and speeds within 1050−1500 rpm. The test engine does not represent alarge low-speed marine engine; however, the nature of high-temperature SO3 formation may well be explored with the currentengine and serve as reference for further modeling studies. SO3 is measured using a continuous SO3 monitor from PENTOLGmbH. The monitor offers online SO3 readings and short sampling times, in contrast to other extractive methods. Themeasurement is based on SO3 capture in isopropanol prior to chemical conversion and indirect detection via light absorption in aphotometer. Present results show that SO3 formation is favored by elevated pressure histories, premixed combustion, andreduced speeds. The fraction of fuel sulfur converted to SO3 is measured to be on the order of 0.5%−2.4%, corresponding to 4−14 ppmv. SO3 and NOx are not comparable, according to thermodynamic considerations, yet both species involve the radicalpool and are studied in parallel. Resulting emissions of SO3 and NOx in the exhaust gas follow a comparable trend throughout theexperiments.
■ INTRODUCTION
Heavy fuel oil (HFO), which is used for ship propulsion inlarge, low-speed marine engines, contain sulfur (on the order of3 wt %, on average). During combustion, the sulfur is rapidlyconverted to SO2,
1,2 from which a fraction is further oxidized toSO3,
3−5 which, at temperatures lower than ∼600 °C, reacts toform gaseous sulfuric acid H2SO4 from a fast reaction6 withH2O. For a typical exhaust gas, the equilibrium of eq R1 lieswell to the right at temperatures of <300 °C.
+ →g g gH O( ) SO ( ) H SO ( )2 3 2 4 (R1)
In large marine engines, H2SO4 is experienced to condenseon internal surfaces such as the cylinder liner and acceleratesurface corrosion. The acid dew point temperature is a functionof the partial pressures of water vapor and gaseous sulfuricacid.7,8 Even small concentrations of H2SO4 will increase thedew point considerably, compared to that of pure water.9
Figure 1 illustrates dew point curves representing two gaseswith 5% or 10% H2O at 1 atm). Below the dew pointtemperature, gaseous H2SO4 and water vapor condense as asulfuric acid solution. However, acid and water condense indifferent proportions, depending on the H2SO4/H2O ratio andthe surface temperature, as experienced by the results ofMuller9 and Greenewalt,10 who provided correlations for thepartial pressures of H2SO4 and H2O out of liquid sulfuric acidsolutions. The share of water and acid is vital, because itdetermines the corrosive strength of the condensing acid.11 Inpractice, alkali additives are blended in the lube oil of largemarine engines to hamper corrosion on liner surfaces but therate of acid condensation and thus the optimum dosing islinked to engine performance and fuel type. Unfortunately,practical evaluations of acid attack on cylinder liners are not
straightforward. Consequently, detailed experimental work onthe formation and fate of SO3 in HFO-fuelled diesel engines isneeded to support theoretical models of H2SO4 formation,condensation, and corrosion.If fuel sulfur associated with particulate mass in the exhaust
gas is neglected, and if H2SO4 is considered as SO3, then the
Received: July 29, 2013Revised: September 12, 2013
Figure 1. Calculated acid dew point curves8 at 1 atm versus [H2SO4]in 5% and 10% water vapor.
Article
pubs.acs.org/EF
© XXXX American Chemical Society A dx.doi.org/10.1021/ef4014696 | Energy Fuels XXXX, XXX, XXX−XXX
App A.2 (Paper 2)
App. A.2 page 1/8

fraction of fuel sulfur converted to SO3 in the exhaust gas isexpressed by ε in eq 1:
ε =+
[SO ][SO ] [SO ]
3
2 3 (1)
Published experimental data on the fraction of sulfurconverted to SO3 in large marine engines is almost absentand relies on theoretical models6,12 as well as a not-so-accurate“rule of thumb” stating that a few percent is converted to SO3.The SO3 measurements by Engel13 seem to be the only peer-reviewed results of SO3 formation in diesel engines where SO3was measured in the exhaust gas from heavy duty dieselengines. Engel reported that ∼1%−8% of the fuel sulfur wasconverted to SO3, depending on the fuel type and operationalconditions. Still, it remains to be reported how the SO3 fractionchanges with operational conditions such as engine speed,pressure history, and fuel−air ratio that will serve as usefulinformation in the case of model validations. To meet this, aseries of SO3 measurements is conducted in the exhaust gasproduced by an 80-kW single-cylinder test engine with a ratedspeed of 1500 rpm. The engine operates on HFO andmeasurements are carried out with two test fuels withcomparable sulfur contents of 1.6 wt % and 2.24 wt %. Themeasurements cover a range from low to high load understeady-state conditions, wherein injection timing, engine speed,and air−fuel ratio is varied to alter the combustion history thatis examined via a pressure transducer in order to analyze therate of heat release. Adjusting the fuel injection timing alters thecylinder pressure history and affects NOx formation.14 Morespecifically, NOx formation has been shown to scale with themaximum cylinder pressure in diesel engines.15 Both thermalNOx and high-temperature SO3 formation involves the radicalpool3,16 and their response (in the exhaust gas) are examined inparallel, relative to the maximum cylinder pressure. The radicalpool is not subject to the exhaust gas chemistry where thetemperature is <600 °C. A direct oxidation of SO2 withmolecular oxygen O2 could potentially form SO3 in the exhaustsystem, but the reaction is very slow17 at temperatures below1100 °C in the absence of appropriate catalysts andhomogeneous reactions involving SO3 formation are practicallyquenching during the cylinder expansion.Complications arise from the reactive nature of SO3, which
makes its determination in flue gases a challenge, andmeasurements can be biased for several reasons:18−20
• SO3 is a highly reactive gas and may react with mineralsof alkali ash, such as magnesium oxide (MgO) andcalcium oxide (CaO)
• SO3 measurements can be biased due to the presence ofa much higher concentration of SO2
• SO3 may react with surfaces such as those in thesampling line
• SO3 and H2O form gaseous H2SO4 at temperaturesbelow ∼600 °C that may be lost at “cold” surfaces due tocondensation
Current experiences of SO3 measurements are primarilybased on gas sampling in exhaust ducts of coal-fired powerplants, where the conditions do not exactly represent a HFOexhaust gas. One reason for this is that the fraction of ash-forming matter in typical power plant coals is high and roughlylies within the range of 10%−30% (by mass),21 from which afraction is thermal decomposed and oxidized into an alkalineash during combustion. However, HFOs produce much less ash
than coals, since noncombustible materials (such as mineralinclusions) are virtually absent.22
The most common methods for measuring SO3/H2SO4involve (1) the absorption of H2SO4 in an isopropanol (IPA)solution,19,23,24 (2) the separation of H2SO4 by controlledcondensation,25 and (3) H2SO4 dew point measurement.26
Other methods involving Fourier transform infrared spectros-copy (FTIR),19 H2SO4 capture in salts,18,27 and indirectmeasurements of SO3 as carbon dioxide28 have yieldedpromising results but, for practical reasons, are not consideredin this work. The controlled condensation (CCD) method(also called controlled condensation system (CCS)) is the mostpreferred technique and recommended by the U.S. Environ-mental Protection Agency (EPA). Nevertheless, the British andAmerican standards for CCD have been withdrawn.18 In thiswork, the PENTOL SO3 monitor is used, which is a modifiedversion of the instrument formerly known as the SevernScience Analyzer. The principle is described by Jackson24 andhas been used for many years at the Central ElectricityGenerating Board with apparent success,23 as well as in severalpower plants in the United States.19 The principle is based onSO3 absorption in an IPA solution where gas sampling andsubsequent SO3 determination is automated. Published data onthe accuracy and repeatability does not seem to exist, but themanufacturer states that the accuracy of the monitor is ±5% ofthe reading in the calibrated range. Moreover, measurementsconducted with the SO3 monitor and the CCD method in aHFO power station yielded SO3 concentrations with nosignificant difference.24
PENTOL SO3 Monitor. The sample gas is continuouslyextracted through a heated (200 °C) quartz glass-lined sampleprobe. In the probe head at the probe exit, the gas passes aquartz wool filter before it mixes with an IPA solution, whereinthe H2SO4/SO3 components condense and are absorbed/stored as sulfate ions (SO4
2−). The solution is then transportedvia an umbilical (that implies an instrument delay of ∼5 min)to a reaction bed of barium chloranilate crystals where theSO4
2− ions react to form acid chloranilate ions, as seen inreaction R2.
+ + → +− + −SO BaC O Cl H BaSO HC O Cl42
6 4 2 4 6 4 2(R2)
The acid ions absorb light preferably at 535 nm and aredetected using a photometer. By maintaining a constant flow ofIPA and sample gas, the H2SO4 + SO3 concentration in theexhaust gas is proportional to the absorbed light. Prior to use,the monitor is calibrated with liquids equivalent to 5 ppmv and45 ppmv of SO3 in the sample gas.
■ EXPERIMENTAL SECTIONThe test engine used for the experiments is a modified four-strokesingle-cylinder engine equipped with a needle-controlled common railinjector prepared for multiple injections, but, in the presentinvestigation, the fuel is injected as a single jet (i.e., no pilot injection).The engine is HFO-capable and charge air is supplied from an externalpressurized vessel to allow controllable air−fuel ratios. General enginespecifications are listed in Table 1.
Two HFOs with similar sulfur contents (1.6 and 2.24 wt %) areused in the experiments. Specific fuel data are listed in Table 2. TheCalculated Carbon Aromaticity Index (CCAI) is a dimensionlessnumber that is frequently used to roughly rank the ignition quality ofresidual fuel oils.29,30 The number is based on the kinematic viscosityand the fuel density: The lower the number, the better the ignitioncharacteristics. The normal CCAI range is 800−880 and satisfies fuel
Energy & Fuels Article
dx.doi.org/10.1021/ef4014696 | Energy Fuels XXXX, XXX, XXX−XXXB
App A.2 (Paper 2)
App. A.2 page 2/8

number 1 only. However, ignition performance is also linked to enginedesign and operating conditions and fuels with higher CCAI valuesmay operate successfully,30 as experienced with the present engine.The cylinder pressure trace is recorded with a resolution of 0.25
crank angles over 80 consecutive engine cycles via a piezoelectricpressure transducer located in the combustion chamber. To providenoise-free pressure traces, the raw pressure data are smoothened usingthe procedure of Harndorf.31 Combustion processes are examinedfrom the resulting pressure traces p(θ) in combination with the firstlaw of thermodynamics on a differential form (eq 2), whereby the rateof heat release (ROHR) (i.e., the fuel burn rates) are calculated. Therate of the internal energy (U) of the assumed homogeneous cylindergas system is balanced by the fuel burn rate (Qf), a wall heat loss (Qw),the system work (pV), and a blow-by loss (Hbb), which is neglected.Consequently, the derivative of the mass of the cylinder gas (mc) in eq3 is equivalent to the rate of the injected fuel mass (mf).
θ θ θ θ θ
θ θ
= + + +
= +
U Q Qp
V H
mu
um
dd
d
d
d
ddd
dd
dd
dd
f w bb
cc
(2)
θ θ=
m mdd
dd
c f(3)
In eq 2, the specific internal energy u of the cylinder gas is calculatedusing the approach of Zacharias,32 where u = u(T,p,λ) is rewritten interms of temperature, pressure, and excess air. Differentiating u withrespect to the crank angle position (θ) yields eq 4, where r representsthe instantaneous fraction of excess combustion air.
θ θ θ θ= ∂
∂· ∂∂
+ ∂∂
· ∂∂
+ ∂∂
·∂∂
u uT
T ur
r up
pdd p r p T r T, , , (4)
The gas law (eq 5) is written in terms of a real gas constant Rz,32
which is a function of temperature, pressure, and gas composition.Differentiating T with respect to θ yields T in eq 6 and closes thesystem of eqs 2−6 when V in eq 4 is written in terms of the cylindergeometry, and the wall heat loss follows the procedure ofHohenberg.33,34
=TpV
m Rzc (5)
θ=
+ − −θ θ θ θT p V m T R T
m Rdd
V p Rz
m
z
dd
dd c
dd
dd
c
z c
(6)
Exhaust gas emissions are sampled in a 100-mm circular exhaustpipe downstream from a gas receiver (Figure 2) that works as a gas
mixer and dampens the pressure pulsations. In all experiments, theengine is operated to produce a gas temperature that is above the aciddew point temperature all the way to the SO3 sample probe. NOx ismeasured with a chemiluminescence NOx analyzer (CLD). CO andCO2 are measured with an infrared gas analyzer (IRD) and O2 ismeasured with a paramagnetic detector (PMD). By compensating forthe sulfur bonded to SO3 and by neglecting any sulfur associated withparticulate mass, the SO2 concentration in the exhaust gas is calculatedfrom the fuel composition and the excess air. All experiments areconducted with the engine operating at steady state within a limitedspeed range of 1050 and 1500 rpm. Exhaust gas data are sampled over4−5 min after the thermal response of the exhaust system hadstabilized. In contrast, SO3 samplings covered ∼20−30 min to detectany variations that are due to relatively long samplings. Recordedexhaust gas data are averaged and provided hereafter.
■ RESULTS AND DISCUSSIONTable 3 identifies the 25 individual experiments of the full testmatrix that are divided into 6 test series. The experiments arelisted in terms of operational data, including maximum cylinderpressure and gas emissions of SOx and NOx. For simplicity, themass of trapped cylinder air is based on the charge air pressure,charge air temperature, and displacement volume. In experi-ments 1.1−1.4 and 2.2−2.3, the exhaust pressure was too highto allow immediate air flow through the intake valve. As aresult, the trapped air−fuel ratio is set to the overall λ-value. Inthe remaining experiments, the trapped air−fuel ratio is lowerthan the overall λ-value as the intake pressure forced bypass airthrough the exhaust valve during the gas exchange.Test series 1 in Table 3 represents a fuel injection timing
analysis where a f ixed amount of fuel burns equally lean ataltered pressure histories. The engine speed and power outputis fixed but the injection is retarded from 25 CA BTDC to14.25 CA BTDC. [CA BTDC = crank angles before top deadcenter.] The different timings slightly altered the thermalefficiency between the experiments and slight variations in thefuel consumption and charge air pressures occurred. Yet, thefuel consumption did not differ by more than ±7% of the meanvalue.Figure 3 illustrates the measured SO3 profile in ppmv
covering test series 1. The transition from one experimentproduces a decay in the profile until a steady condition isreached that represents the subsequent experiment. The
Table 1. Test Engine Specifications
parameter value/comment
number of cylinders 1displacement volume 3.18 Lbore/stroke 150 mm/180 mmcompression ratio 13−16 (15 in the present investigation)rated speed 1500 rpmrated power 80 kWfuel injection pressure max. 1600 bar
Table 2. Specifications of Test Fuels
Composition (wt %)
C H S H2O N + O ash (A/F)sa (kgair/kgfuel) kinematic viscosity @ 50 °C (mm2/s) CCAI LHW (kJ/kg)
Fuel 1 83.47 11.08 1.6 1.68 2.1 0.06 13.4 188 838 38759Fuel 2 88.5 8.9 2.24 0.01 0.34 0.105 13.3 115 926 40288
aStoichiometric air−fuel ratio.
Figure 2. Experimental setup.
Energy & Fuels Article
dx.doi.org/10.1021/ef4014696 | Energy Fuels XXXX, XXX, XXX−XXXC
App A.2 (Paper 2)
App. A.2 page 3/8

transition is a combination of engine tuning and response timeof the SO3 monitor. During each experiment, a practicallyconstant concentration is identified throughout the ∼20 min ofsampling. As illustrated, the SO3 concentration/formationdecreases as the injection timing is retarded and fairly smallconcentrations are detected consistently by the monitor.
In test series 1, the exhaust gas temperature (∼475 °C at theengine exhaust valve) and the gas flow results in comparable gasresidence times of ∼5.5 s from the engine exhaust valve to theSO3 probe, as seen in Table 3). The probe is heated to 200 °Cand provides a sample gas residence time of ∼2 s through theprobe. At both temperature levels, SO3 is thermodynamicallypreferred over SO2. Yet, post-flame investigations indicate thatgaseous SO3 reactions are very slow at these temperatures andconsidered frozen in the exhaust system. Metal oxides such asiron oxide, chrome oxide, and vanadium oxide (all in variousoxidation numbers) may be present in the gas stream and oninternal surfaces. The metal oxides can serve as oxygen carriersand catalyze the oxidation of SO2 to SO3 in the exhaust gas.Although the SO2 concentration in the exhaust gas is high,relative to SO3, the fraction of SO2 that is converted to SO3 islow, especially in experiment 1.4 (ε = 0.54), as seen in Table 3.Consequently, the potential of a gaseous or catalytic SO3
formation in the exhaust system seems very limited.ROHR traces of test series 1 are shown in Figure 4. Earlier
injections advance the point of fuel ignition relative to top deadcenter (TDC) (CA ATDC = 0) and promote the share ofpremixed combustion that is defined as the area below the peakin a ROHR trace around TDC. [CA ATDC = crank angles aftertop dead center.] The combined effect results in maximumpressure variations in the range of 81−90 bar that increaseswith earlier injections, since more fuel then burns around TDC,where the gas volume is small. Specific exhaust gas emissions of
Table 3. Test Matrixa
Exprpm
(1/min)imepb
(bar)pmax(bar)
pa(bar) λ λt
Ta(K)
ma(kg/h)
SOIc
(CAD)Δtinj(μs)
pinj(bar)
fuel S(wt %)
SO3(ppmv)
SO2(ppmv) ε (%)
NOx(ppmv)
Ted
(K)Δte(s)
1.1 1500 7.9 90 1.7 2.1 2.1 348 192 25 1480 920 2.2 8.3 685 1.20 1101 712 6.3
1.2 1500 8.0 84 1.7 2.0 2.0 349 191 21 1590 920 2.2 5.8 720 0.80 714 743 6.2
1.3 1500 8.3 83 1.9 2.1 2.1 350 209 17.5 1615 920 2.2 4.4 691 0.63 426 762 5.6
1.4 1500 7.9 81 1.9 2.1 2.1 351 218 14.25 1630 920 2.2 3.8 694 0.54 370 780 5.3
2.1 1200 6.3 89 1.4 3.3 2.8 346 179 21 1230 1020 2.2 10.7 441 2.37 1536 540 8.0
2.2 1200 6.1 83 1.3 2.5 2.5 346 142 21 1050 1020 2.2 13.1 576 2.22 1885 602 9.4
2.3 1200 5.9 75 1.2 2.0 2.0 348 107 21 1280 1020 2.2 14.2 719 1.94 1631 684 11.5
3.1 1500 17.3 124 2.4 2.3 1.6 345 485 23.5 3900 1020 1.6 7.2 443 1.60 648 783 2.3
3.2 1500 17.9 119 2.5 2.3 1.6 343 509 19.25 4220 1020 1.6 6.6 445 1.46 502 806 2.2
3.3 1500 17.7 113 2.6 2.4 1.7 345 530 15.25 4130 1020 1.6 6.2 424 1.44 453 799 2.2
4.1 1500 17.8 120 2.4 2.3 1.7 335 484 19.25 3470 1250 1.6 7.5 441 1.67 730 767 2.4
4.2 1500 12.8 93 2.1 2.5 1.8 346 409 15 3490 920 1.6 4.8 419 1.13 287 802 2.8
4.3 1500 12.8 90 2.0 2.3 1.7 346 395 15 2976 1120 1.6 4.9 445 1.09 340 804 2.9
4.4 1500 14.9 104 2.2 2.4 1.7 345 432 19 3470 1020 1.6 5.0 439 1.13 442 804 2.6
4.5 1500 14.7 100 2.2 2.3 1.7 346 433 18 3578 1020 1.6 4.6 460 0.99 410 815 2.6
4.6 1200 18.2 130 2.3 2.3 1.6 345 379 19 3414 1110 1.6 8.9 452 1.93 1296 702 3.2
4.7 1500 7.9 70 1.6 1.5 1.5 363 154 17.5 1600 920 2.2 4.6 952 0.48 563 863 6.9
5.1 1200 15.9 115 2.1 2.4 1.7 327 352 18.5 3250 1020 1.6 6.9 426 1.59 883 705 3.5
5.2 1200 15.9 105 1.9 2.0 1.5 328 307 18.5 3448 1020 1.6 7.2 516 1.38 1036 764 3.8
5.3 1200 15.8 124 2.4 3.1 2.1 337 416 18.5 3195 1020 1.6 6.3 336 1.84 792 619 3.2
6.1 1400 14.1 98 2.0 2.3 1.7 347 372 18.5 3098 1020 1.6 5.1 452 1.12 556 773 3.1
6.2 1300 13.8 97 1.9 2.2 1.6 347 335 18.5 3058 1020 1.6 5.6 464 1.19 672 759 3.5
6.3 1200 13.7 103 1.8 2.3 1.6 346 311 18.5 2980 1020 1.6 6.3 440 1.41 813 710 3.9
6.4 1100 14.1 105 1.7 2.2 1.6 337 274 18.5 3070 1020 1.6 8.5 463 1.80 1113 694 4.5
6.5 1050 14.4 111 1.8 2.3 1.6 327 272 18.25 3064 1020 1.6 9.3 444 2.05 1254 679 4.6aThe first column on the left-hand side represents the test series numbers and the experiment numbers. bIndicated mean effective pressure. cStart offuel injection, in terms of crank angle degrees (CAD). Before top dead center (BTDC). dAt the exhaust valve outlet.
Figure 3. Measured SO3 profile of test series 1. The numbers in thefigure refer to the different injection timings.
Energy & Fuels Article
dx.doi.org/10.1021/ef4014696 | Energy Fuels XXXX, XXX, XXX−XXXD
App A.2 (Paper 2)
App. A.2 page 4/8

NOx and SO3, expressed in units of mg per normal m3 (mg/Nm3) are plotted against maximum cylinder pressure in Figure4. The response from the altered combustion history iscomparable as both species are favored by elevated pressures.Hence, operating conditions that promote NOx promote SO3in a similar fashion, under the present circumstances, and SO3emissions increase at the expense of SO2, as illustrated by ε inthe figure. Although SO3 is clearly manipulated by thecombustion history, it is not clear whether the altered pressurelevels alone are responsible for this. An argument for this is thatthe share of premixed combustion is not comparable but variesfrom 17% to 34% over the four experiments, as indicated by theROHR traces in Figure 4.To quantify the influence of premixed combustion on SO3
formation, test series 2 in Table 3 is performed, where the shareof premixing is promoted by reducing the engine speed,combined with early injections. Moreover, the pressure historyis altered via the charge air pressure. The resulting ROHRtraces are presented in Figure 5, together with the trace ofexperiment 1.3 for comparison. The share of premixedcombustion is comparably high and heterogeneous-mixing-controlled combustion is virtually absent in test series 2.Consistent with the results of test series 1, ε increases with themaximum pressure. However, despite an overlapping maximumpressure range, the ε-values are significantly higher in test series2, as illustrated in Figure 5. Speed investigations presented laterin the section demonstrate that the lower engine speed in testseries 2 cannot explain the present observations. As a result,SO3 is promoted with the share of premixed combustion andthe slope of ε in test series 1 seems to be a consequence ofaltered pressure histories combined with inconsistent premixedproportions. Specific emissions of SO3 and NOx from test series2 in Figure 5 are not readily comparable, because of differentexcess air ratios, as seen in Table 3. Yet, for both species, theemissions are remarkably higher than in test series 1 presentedin Figure 4 and likely caused by the superior fractions ofpremixed combustion.Premixed combustion refers to the fuel that evaporates and
mixes partially with air prior to ignition and incomplete
burning. As a result, intermediate gas products, such as CO, areformed before the more complete oxidation. CO flamesproduce high concentrations of oxygen atoms35 whichpromotes thermal NOx, and combined with SO2, is a mainsource of SO3 formation,
3 consistent with the superior speciesconcentrations experienced in test series 2. In this respect, one-dimensional (1D) reactor experiments with staged combustion(i.e., rich combustion prior to secondary air entrainment) havebeen shown to increase SO3 formation,
5,36 compared to single-stage combustion at identical overall lean air−fuel ratios. Inaddition, CO flames doped with sulfur species have been shownto produce increased amounts of SO3, compared to sulfur-doped methane flames37 that involve lesser concentrations ofatomic oxygen.Test series 3 in Table 3 involves retarded injection timings
similar to test series 1 but is conducted at higher loads toproduce low premixed proportions (∼6%) and thereby providepractically full mixing controlled combustion histories, asillustrated by the ROHR traces in Figure 6. As expected, thevariations of ε are decreased, compared to that observed in testseries 1, but the altered pressure history still manipulates SO3and NOx formation, as illustrated in the figure where thespecific emissions increase moderately over the maximumpressure range.The correlation between maximum cylinder pressure and
SO3 formation is examined over a widespread pressure rangewherein engine operational conditions are altered to vary thepressure history. SO3 formation is hereby studied in relation toengine power, engine speed, air−fuel ratio, and fuel injectiontiming. The operating points are recognized in Table 3 and theshare of premixed combustion is <20% in the remainingexperiments (test series 4−6) to provide comparable measure-ments for the data analysis. In the lower-pressure range, fuel 2proved to be most successful, providing acceptable levels ofpremixing, in contrast to fuel 1, which is associated with thesuperior ε-values of test series 2.In test series 4, the trapped air−fuel ratio is kept comparably
constant but the fuel input is altered to investigate the responseof SO3, relative to engine load. The correlation between ε and
Figure 4. Test series 1: (left) ROHR traces, (upper right) sulfur toSO3 conversion versus the maximum cylinder pressure, and (lowerright) specific emissions of SO3 and NOx versus the maximum cylinderpressure. The maximum pressure increases with earlier fuel injections,relative to top dead center (TDC).
Figure 5. Test series 2: (left) ROHR traces, (upper right) sulfur toSO3 conversion versus the maximum cylinder pressure, and (lowerright) specific emissions of SO3 and NOx versus the maximum cylinderpressure. The maximum pressure increases with elevated charge airpressures (pa).
Energy & Fuels Article
dx.doi.org/10.1021/ef4014696 | Energy Fuels XXXX, XXX, XXX−XXXE
App A.2 (Paper 2)
App. A.2 page 5/8
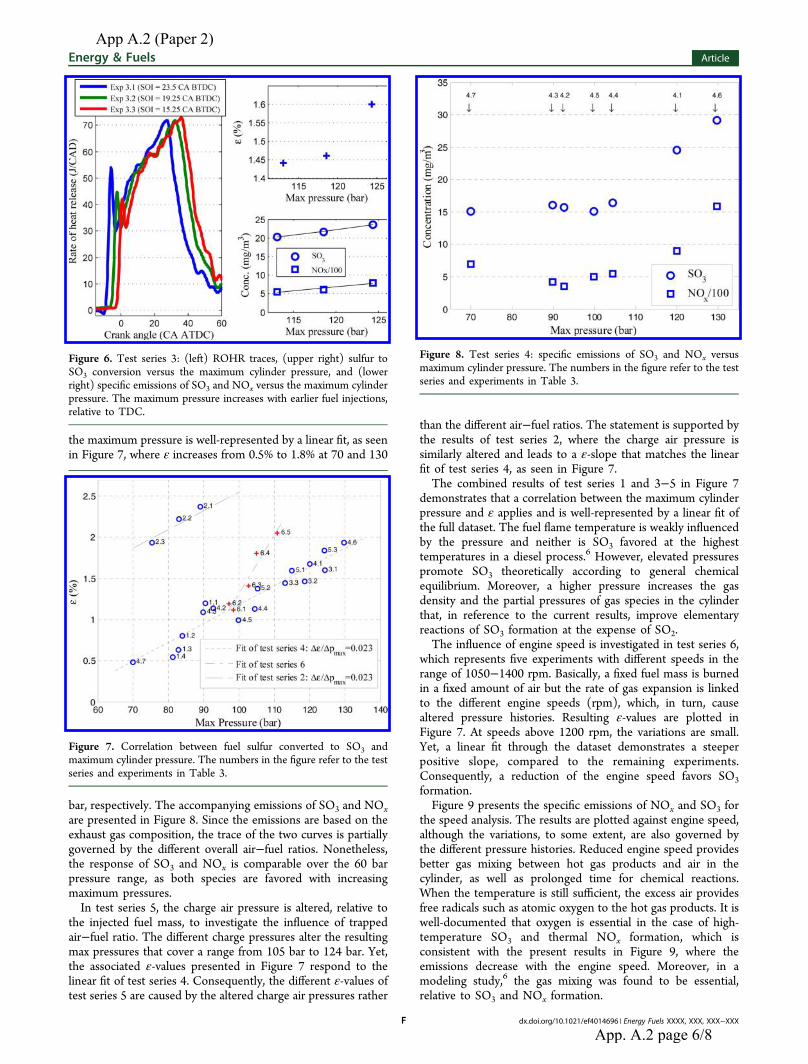
the maximum pressure is well-represented by a linear fit, as seenin Figure 7, where ε increases from 0.5% to 1.8% at 70 and 130
bar, respectively. The accompanying emissions of SO3 and NOxare presented in Figure 8. Since the emissions are based on theexhaust gas composition, the trace of the two curves is partiallygoverned by the different overall air−fuel ratios. Nonetheless,the response of SO3 and NOx is comparable over the 60 barpressure range, as both species are favored with increasingmaximum pressures.In test series 5, the charge air pressure is altered, relative to
the injected fuel mass, to investigate the influence of trappedair−fuel ratio. The different charge pressures alter the resultingmax pressures that cover a range from 105 bar to 124 bar. Yet,the associated ε-values presented in Figure 7 respond to thelinear fit of test series 4. Consequently, the different ε-values oftest series 5 are caused by the altered charge air pressures rather
than the different air−fuel ratios. The statement is supported bythe results of test series 2, where the charge air pressure issimilarly altered and leads to a ε-slope that matches the linearfit of test series 4, as seen in Figure 7.The combined results of test series 1 and 3−5 in Figure 7
demonstrates that a correlation between the maximum cylinderpressure and ε applies and is well-represented by a linear fit ofthe full dataset. The fuel flame temperature is weakly influencedby the pressure and neither is SO3 favored at the highesttemperatures in a diesel process.6 However, elevated pressurespromote SO3 theoretically according to general chemicalequilibrium. Moreover, a higher pressure increases the gasdensity and the partial pressures of gas species in the cylinderthat, in reference to the current results, improve elementaryreactions of SO3 formation at the expense of SO2.The influence of engine speed is investigated in test series 6,
which represents five experiments with different speeds in therange of 1050−1400 rpm. Basically, a fixed fuel mass is burnedin a fixed amount of air but the rate of gas expansion is linkedto the different engine speeds (rpm), which, in turn, causealtered pressure histories. Resulting ε-values are plotted inFigure 7. At speeds above 1200 rpm, the variations are small.Yet, a linear fit through the dataset demonstrates a steeperpositive slope, compared to the remaining experiments.Consequently, a reduction of the engine speed favors SO3formation.Figure 9 presents the specific emissions of NOx and SO3 for
the speed analysis. The results are plotted against engine speed,although the variations, to some extent, are also governed bythe different pressure histories. Reduced engine speed providesbetter gas mixing between hot gas products and air in thecylinder, as well as prolonged time for chemical reactions.When the temperature is still sufficient, the excess air providesfree radicals such as atomic oxygen to the hot gas products. It iswell-documented that oxygen is essential in the case of high-temperature SO3 and thermal NOx formation, which isconsistent with the present results in Figure 9, where theemissions decrease with the engine speed. Moreover, in amodeling study,6 the gas mixing was found to be essential,relative to SO3 and NOx formation.
Figure 6. Test series 3: (left) ROHR traces, (upper right) sulfur toSO3 conversion versus the maximum cylinder pressure, and (lowerright) specific emissions of SO3 and NOx versus the maximum cylinderpressure. The maximum pressure increases with earlier fuel injections,relative to TDC.
Figure 7. Correlation between fuel sulfur converted to SO3 andmaximum cylinder pressure. The numbers in the figure refer to the testseries and experiments in Table 3.
Figure 8. Test series 4: specific emissions of SO3 and NOx versusmaximum cylinder pressure. The numbers in the figure refer to the testseries and experiments in Table 3.
Energy & Fuels Article
dx.doi.org/10.1021/ef4014696 | Energy Fuels XXXX, XXX, XXX−XXXF
App A.2 (Paper 2)
App. A.2 page 6/8
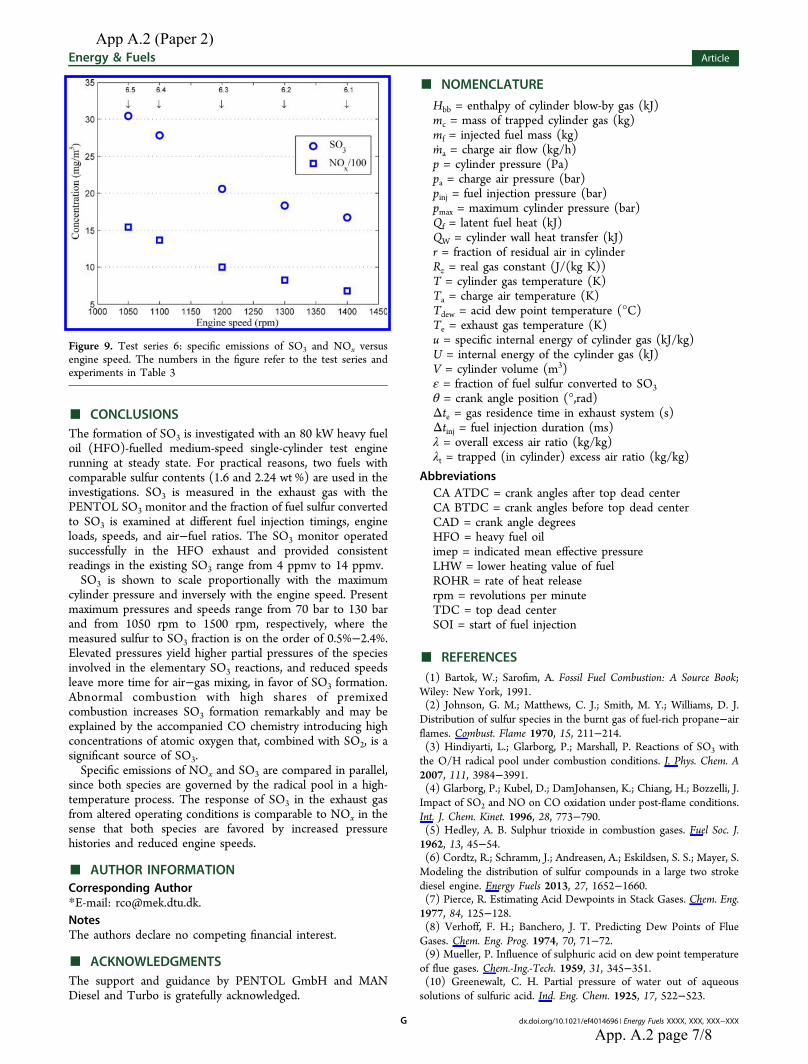
■ CONCLUSIONSThe formation of SO3 is investigated with an 80 kW heavy fueloil (HFO)-fuelled medium-speed single-cylinder test enginerunning at steady state. For practical reasons, two fuels withcomparable sulfur contents (1.6 and 2.24 wt %) are used in theinvestigations. SO3 is measured in the exhaust gas with thePENTOL SO3 monitor and the fraction of fuel sulfur convertedto SO3 is examined at different fuel injection timings, engineloads, speeds, and air−fuel ratios. The SO3 monitor operatedsuccessfully in the HFO exhaust and provided consistentreadings in the existing SO3 range from 4 ppmv to 14 ppmv.SO3 is shown to scale proportionally with the maximum
cylinder pressure and inversely with the engine speed. Presentmaximum pressures and speeds range from 70 bar to 130 barand from 1050 rpm to 1500 rpm, respectively, where themeasured sulfur to SO3 fraction is on the order of 0.5%−2.4%.Elevated pressures yield higher partial pressures of the speciesinvolved in the elementary SO3 reactions, and reduced speedsleave more time for air−gas mixing, in favor of SO3 formation.Abnormal combustion with high shares of premixedcombustion increases SO3 formation remarkably and may beexplained by the accompanied CO chemistry introducing highconcentrations of atomic oxygen that, combined with SO2, is asignificant source of SO3.Specific emissions of NOx and SO3 are compared in parallel,
since both species are governed by the radical pool in a high-temperature process. The response of SO3 in the exhaust gasfrom altered operating conditions is comparable to NOx in thesense that both species are favored by increased pressurehistories and reduced engine speeds.
■ AUTHOR INFORMATIONCorresponding Author*E-mail: [email protected] authors declare no competing financial interest.
■ ACKNOWLEDGMENTSThe support and guidance by PENTOL GmbH and MANDiesel and Turbo is gratefully acknowledged.
■ NOMENCLATURE
Hbb = enthalpy of cylinder blow-by gas (kJ)mc = mass of trapped cylinder gas (kg)mf = injected fuel mass (kg)ma = charge air flow (kg/h)p = cylinder pressure (Pa)pa = charge air pressure (bar)pinj = fuel injection pressure (bar)pmax = maximum cylinder pressure (bar)Qf = latent fuel heat (kJ)QW = cylinder wall heat transfer (kJ)r = fraction of residual air in cylinderRz = real gas constant (J/(kg K))T = cylinder gas temperature (K)Ta = charge air temperature (K)Tdew = acid dew point temperature (°C)Te = exhaust gas temperature (K)u = specific internal energy of cylinder gas (kJ/kg)U = internal energy of the cylinder gas (kJ)V = cylinder volume (m3)ε = fraction of fuel sulfur converted to SO3θ = crank angle position (°,rad)Δte = gas residence time in exhaust system (s)Δtinj = fuel injection duration (ms)λ = overall excess air ratio (kg/kg)λt = trapped (in cylinder) excess air ratio (kg/kg)
AbbreviationsCA ATDC = crank angles after top dead centerCA BTDC = crank angles before top dead centerCAD = crank angle degreesHFO = heavy fuel oilimep = indicated mean effective pressureLHW = lower heating value of fuelROHR = rate of heat releaserpm = revolutions per minuteTDC = top dead centerSOI = start of fuel injection
■ REFERENCES(1) Bartok, W.; Sarofim, A. Fossil Fuel Combustion: A Source Book;Wiley: New York, 1991.(2) Johnson, G. M.; Matthews, C. J.; Smith, M. Y.; Williams, D. J.Distribution of sulfur species in the burnt gas of fuel-rich propane−airflames. Combust. Flame 1970, 15, 211−214.(3) Hindiyarti, L.; Glarborg, P.; Marshall, P. Reactions of SO3 withthe O/H radical pool under combustion conditions. J. Phys. Chem. A2007, 111, 3984−3991.(4) Glarborg, P.; Kubel, D.; DamJohansen, K.; Chiang, H.; Bozzelli, J.Impact of SO2 and NO on CO oxidation under post-flame conditions.Int. J. Chem. Kinet. 1996, 28, 773−790.(5) Hedley, A. B. Sulphur trioxide in combustion gases. Fuel Soc. J.1962, 13, 45−54.(6) Cordtz, R.; Schramm, J.; Andreasen, A.; Eskildsen, S. S.; Mayer, S.Modeling the distribution of sulfur compounds in a large two strokediesel engine. Energy Fuels 2013, 27, 1652−1660.(7) Pierce, R. Estimating Acid Dewpoints in Stack Gases. Chem. Eng.1977, 84, 125−128.(8) Verhoff, F. H.; Banchero, J. T. Predicting Dew Points of FlueGases. Chem. Eng. Prog. 1974, 70, 71−72.(9) Mueller, P. Influence of sulphuric acid on dew point temperatureof flue gases. Chem.-Ing.-Tech. 1959, 31, 345−351.(10) Greenewalt, C. H. Partial pressure of water out of aqueoussolutions of sulfuric acid. Ind. Eng. Chem. 1925, 17, 522−523.
Figure 9. Test series 6: specific emissions of SO3 and NOx versusengine speed. The numbers in the figure refer to the test series andexperiments in Table 3
Energy & Fuels Article
dx.doi.org/10.1021/ef4014696 | Energy Fuels XXXX, XXX, XXX−XXXG
App A.2 (Paper 2)
App. A.2 page 7/8
(11) Teetz, C. Investigation into Reducing Low TemperatureCorrosion in Diesel Engines (Beitrag zur Verminderung derNasskorrosion im Dieselmotor, Nr 626). VDI Forschungsh. 1984.(12) Andreasen, A.; Mayer, S. Modeling of the oxidation of fuel sulfurin low speed two-stroke Diesel engines. Presented at the 26th CIMACWorld Congress, Bergen, Norway, 2010; Paper No. 39.(13) Engel, P. K.; Thompson, R. E.; Silvestrinin, R. Corrosion andFouling Potential in Diesel Exhausts. Mech. Eng. 1979, 101, 598−606.(14) Gill, D.; Ofner, H.; Schwarz, D.; Sturman, E.; Wolverton, M. A.The Performance of a Heavy Duty Diesel Engine with a ProductionFeasible DME Injection System. SAE Tech. Pap.2001, 2001-01-3629.(15) Scholl, K. W.; Sorenson, S. C. Combustion of soybean oilmethyl ester in a direct injection diesel engine. SAE Tech. Pap. 1993,930934.(16) Ferguson, C. R., Kirkpatrick, A. T., Eds. Internal CombustionEngines: Applied Thermosciences; Wiley: New York, 2001.(17) Cullis, C. F.; Mulcahy, M. F. R. The kinetics of combustion ofgaseous sulphur compounds. Combust. Flame 1972, 18, 225−292.(18) Fleig, D.; Vainio, E.; Andersson, K.; Brink, A.; Johnsson, F.;Hupa, M. Evaluation of SO3 Measurement Techniques in Air and Oxy-Fuel Combustion. Energy Fuels 2012, 26, 5537−5549.(19) Denne, C.; Himes, R. Continuous Measurement Technologies forSO3 and H2SO4 in Coal-Fired Power Plants, Technical Report, ElectricPower Research Institute (EPRI), Palo Alto, CA, 2004.(20) Srivastava, R. K.; Miller, C. A.; Erickson, C.; Jambhekar, R.Emissions of Sulfur Trioxide From Coal-Fired Power Plants, Riley Power,Inc., Report No. RPI-TP-0178, 2002.(21) Turns, S. R. An Introduction to Combustion: Concepts andApplications; McGraw−Hill: New York, 2012.(22) Flagan, R. C.; Seinfeld, J. H. Fundamentals of Air PollutionEngineering; Prentice Hall: Englewood Cliffs, NJ, 1988.(23) Jaworowski, R. J.; Mack, S. S. Evaluation of Methods forMeasurements of SO3/H2SO4 in Flue-Gas. J. Air Pollut. Control Assoc.1979, 29, 43−46.(24) Jackson, P. J.; Hilton, D. A.; Buddery, J. H. ContinuousMeasurement of Sulphuric Acid Vapour in Combustion Gases using aPortable Automatic Monitor. J. Inst. Energy 1981, 54, 124−135.(25) United States Environmental Protection Agency (EPA):Available online: http://www.epa.gov/ttnemc01/ctm/ctm-013.pdf.(26) Land, T. Theory of Acid Deposition and its Application to theDew-Point Meter. J. Inst. Fuel 1977, 50, 68−75.(27) Vainio, E.; Fleig, D.; Brink, A.; Andersson, K.; Johnsson, F.;Hupa, M. Experimental Evaluation and Field Application of a SaltMethod for SO3 Measurement in Flue Gases. Energy Fuels 2013, 27,2767−2775.(28) Ibanez, J. G.; Batten, C. F.; Wentworth, W. E. Simultaneousdetermination of SO3(g) and SO2(g) in a flowing gas. Ind. Eng. Chem.Res. 2008, 47, 2449−2454.(29) Zeelenberg, A. P.; Fijn, v. D.; Barker, H. L. Ignition Performanceof Fuel Oils in Marine Diesel Engines. Int. Congress Combust. Engines1983, 1455−1469.(30) Valencia, F. A.; Armas, I. P. Ignition Quality of Residual FuelOils. J. Mar. Res. 2005, 2, 77−96.(31) Harndorf, H.; Kosel, R.; Volkart, A. Optimierung der Mess- undAuswerteparameter zur Analyse von Zulinderdruckverlaufen. Motor-tech. Z. 1992, 53, 136 ff.(32) Zacharias, F. Analytische Darstellung der ThermodynamischenEigenschaften von Verbrennungsgassen, Dissertation Thesis, TU Berlin,Berlin, Germany, 1966.(33) Hohenberg, G. Experimentelle Erfassung der Wandwarme inKolbenmotoren, Habilitationsschrift, Technische Universitat Graz, Graz,Austria, 1983.(34) Hohenberg, G. F. Advanced Approaches for Heat TransferCalculations. SAE Tech. Pap. 1979, Paper No. 790825.(35) Gaydon, A. G. Continuous Spectra in Flames: The Role ofAtomic Oxygen in Combustion. Proc. R. Soc. London, Ser. A 1944, 183,111−124.(36) Merryman, E. L.; Levy, A. Enhanced SO3 Emissions from StagedCombustion. Symp. Int. Combust. 1979, 727−736.
(37) Dooley, A.; Whittingham, G. The Oxidation of Sulphur Dioxidein Gas Flames. Trans. Faraday Soc. 1946, 42, 354−366.
Energy & Fuels Article
dx.doi.org/10.1021/ef4014696 | Energy Fuels XXXX, XXX, XXX−XXXH
App A.2 (Paper 2)
App. A.2 page 8/8
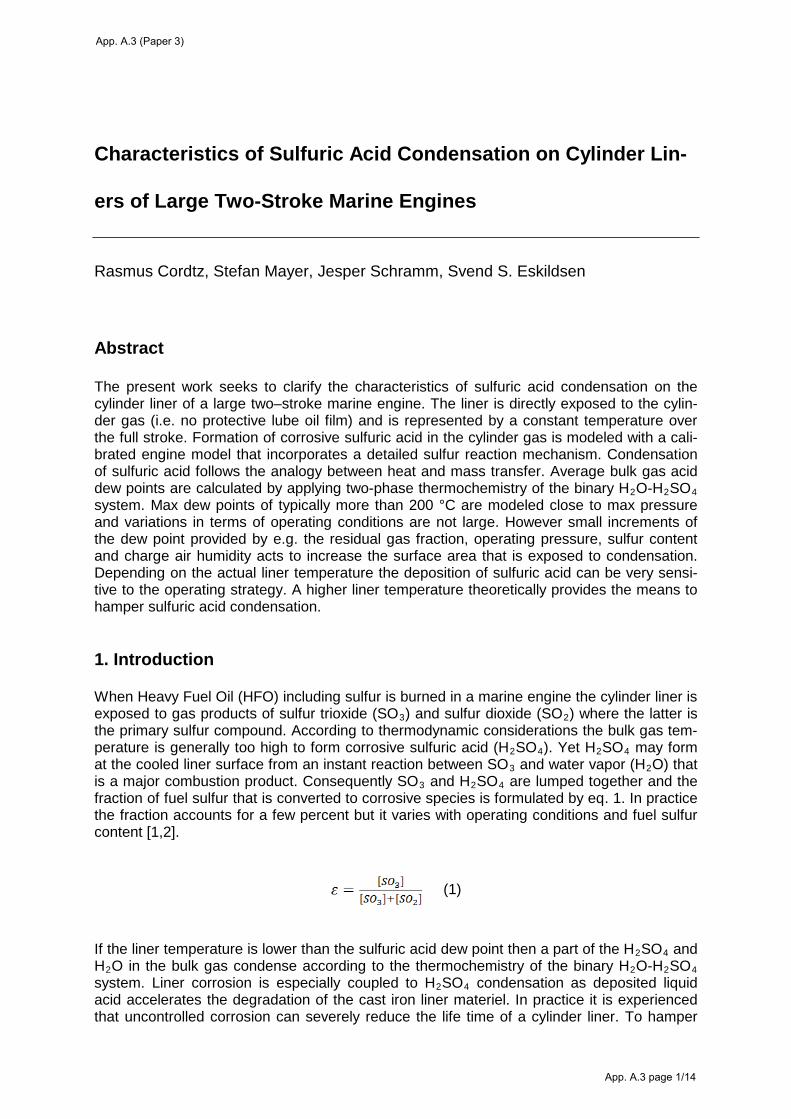
Characteristics of Sulfuric Acid Condensation on Cylinder Lin-
ers of Large Two-Stroke Marine Engines
Rasmus Cordtz, Stefan Mayer, Jesper Schramm, Svend S. Eskildsen Abstract The present work seeks to clarify the characteristics of sulfuric acid condensation on the cylinder liner of a large two–stroke marine engine. The liner is directly exposed to the cylin-der gas (i.e. no protective lube oil film) and is represented by a constant temperature over the full stroke. Formation of corrosive sulfuric acid in the cylinder gas is modeled with a cali-brated engine model that incorporates a detailed sulfur reaction mechanism. Condensation of sulfuric acid follows the analogy between heat and mass transfer. Average bulk gas acid dew points are calculated by applying two-phase thermochemistry of the binary H2O-H2SO4 system. Max dew points of typically more than 200 °C are modeled close to max pressure and variations in terms of operating conditions are not large. However small increments of the dew point provided by e.g. the residual gas fraction, operating pressure, sulfur content and charge air humidity acts to increase the surface area that is exposed to condensation. Depending on the actual liner temperature the deposition of sulfuric acid can be very sensi-tive to the operating strategy. A higher liner temperature theoretically provides the means to hamper sulfuric acid condensation. 1. Introduction When Heavy Fuel Oil (HFO) including sulfur is burned in a marine engine the cylinder liner is exposed to gas products of sulfur trioxide (SO3) and sulfur dioxide (SO2) where the latter is the primary sulfur compound. According to thermodynamic considerations the bulk gas tem-perature is generally too high to form corrosive sulfuric acid (H2SO4). Yet H2SO4 may form at the cooled liner surface from an instant reaction between SO3 and water vapor (H2O) that is a major combustion product. Consequently SO3 and H2SO4 are lumped together and the fraction of fuel sulfur that is converted to corrosive species is formulated by eq. 1. In practice the fraction accounts for a few percent but it varies with operating conditions and fuel sulfur content [1,2].
(1)
If the liner temperature is lower than the sulfuric acid dew point then a part of the H2SO4 and H2O in the bulk gas condense according to the thermochemistry of the binary H2O-H2SO4 system. Liner corrosion is especially coupled to H2SO4 condensation as deposited liquid acid accelerates the degradation of the cast iron liner materiel. In practice it is experienced that uncontrolled corrosion can severely reduce the life time of a cylinder liner. To hamper
App. A.3 (Paper 3)
App. A.3 page 1/14

corrosion commercial cylinder lube oils are blended with acid neutralizing base additives that combined with the lube oil dosing strategy provides the means to prevent corrosion. The sulfuric acid dew point may be determined from empirical formulas [3,4] that correlate the temperature with the pressure of SO3 and H2O. However such correlations do not pro-vide information about the share of condensing H2SO4 and H2O. A more convenient ap-proach for the present study is to apply the thermochemistry of the two-phase H2O-H2SO4 system. Theoretical correlations of this type are based on thermodynamic properties of the components in the gas and liquid phase. Abel [5] was among the first to derive the vapor-phase above a liquid solution of sulfuric acid and water. He used the best available thermo-dynamic data at that time. The theoretical models have been improved over the years as the thermodynamic data have been gradually upgraded. Today several correlations are sug-gested [5-9]. In this work the quite recent work of Bosen & Engels [10] is used to describe the complex nature of the H2O-H2SO4 system. The model treats ideal gasses above a liquid solution where the partial pressures pi (index i refers to H2O and H2SO4) are calculated from the general expression in eq. 2. χ i is the liquid mole fraction, γ i is an activity coefficient and pi
0 is the vapor pressure of the pure substance [11,12]. The activity coefficient is derived from the NRTL (Non-Random Two Liquid model) equation [13] wherein adjustable parame-ters are fitted to reproduce experimental data of total pressure, vapor phase composition and liquid molar enthalpy. The experimental data are cited in the work of Bosen & Engels that describe the phase equilibrium of the H2O-H2SO4 system up to 96 % m/m H2SO4 in the temperature range between 0 - 240 °C.
(2)
According to Gibbs phase rule the two phase H2O-H2SO4 system yields two degrees of freedom. For a liquid phase at a given acid strength (ca) eq. 2 provides the saturation pres-sures of H2SO4 and H2O at a defined temperature. If the procedure is reversed then known pressures of H2SO4 and H2O can be applied to the equation from which the dew point tem-perature and the condensing acid strength can be determined. The present work does not address liner corrosion directly but seeks to clarify the character-istics of H2SO4 condensation. The cylinder liner is directly exposed to the cylinder gas. I.e. the influence of the protecting lube oil is not considered. Gas species concentrations are simulated with a calibrated engine model [1] that includes a detailed sulfur reaction mecha-nism [14]. The process of condensation is modeled as molecular gas diffusion through the gaseous boundary layer very close to the liner surface. For the purpose the analytic expres-sions of Müller [15] are used which are based on the analogy between heat and mass trans-fer. In his theoretical approach Müller implemented the theory of a semi permeable gas-liquid interface that acts to hamper condensation due to convective motions from the non-condensable gases. Moreover the expressions are derived from the assumption of fully de-veloped turbulence that reasonably fits the conditions in a large two-stroke marine engine. 2. Engine Model In cylinder species formation is simulated with a multizone engine model that is previously developed by the authors [1]. The model incorporates a detailed sulfur reaction mechanism [14] besides the extended Zeldovich mechanism [16] in order to simulate products of sulfur compounds, mayor C-H-O species and nitrogen oxides (NO). The fuel is composed by n-dodecane (C12H26) and non-bonded elemental sulfur. In the multizone approach the complex nature of the diesel spray and flame is not directly modeled. Instead the model seeks to reproduce flame conditions by separating the overall
App. A.3 (Paper 3)
App. A.3 page 2/14

fuel mass in multiple burned gas zones with no spatial location (0D model). At each crank angle from the point of fuel ignition and until the combustion is completed a new burned zone is created where the fuel burns stoichiometrically with fresh gas. The fresh gas is com-posed by charge air (normally dry air) including residual gasses that remain in the cylinder after the scavenging process. The flame temperature of a burned zone is calculated from the assumption that the gas products are immediately equilibrated at the high temperature in the order of ≈2600-2700 K. Hereafter a burned zone is diluted with fresh gas every crank angle during the expansion stroke at a defined rate. No more fuel is added to a burned zone and no gas exchange is considered between burned zones either. Consequently the ratio of air to combustion products increases in the burned zones during expansion and meanwhile the mass of the fresh gas is reducing. In the published material [1] the fresh gas chemistry is assumed to be frozen. In the present work however the fresh gas is treated as a homoge-nous zone wherein chemical reactions are considered from the point where compression starts and until the exhaust valve opens. The subsequent scavenging process is not mod-eled. Instead the residual gas fraction is set as a model input. Due to the absence of experimental SO3 measurements the model is calibrated against ex-haust gas concentrations of NO produced by the large two-stroke reference engine specified in Table 1. The engine represents a modern marine engine that operates according to a simulated propeller curve [17] and experimental operating data are used as model input.
Number of cylinders 4 Bore/stroke 500mm / 2200 mm
Max speed 123 RPM
Max power 7050 kW Table 1. Specifications of the reference (two-stroke) marine engine used to investigate the characteris-
tics of sulfuric acid condensation on the cylinder liner. 3. Engine Simulations In service the large marine engines operate at different loads and with fuels of varying sulfur contents. Consequently a cylinder liner will be exposed to gas species of varying densities that alter the properties of sulfuric acid condensation. In order to limit the number of simula-tions a constant sulfur content of 2 % m/m is used in this work at the operating conditions representing 25 % and 100 % engine load. Moreover the residual gas fraction is set to 3 % and 6 % m/m as seen in Table 2 that holds the four studied base cases.
load rpm Fuel S xres pboost Tair pmax λ t ε* Case % rev/min % m/m % m/m bar °C bar - %
1 100 123 2.0 6 3.8 37 167 2.13 2.70 2 100 123 2.0 3 3.8 37 172 2.32 2.74 3 25 78 2.0 6 1.5 33 89 2.47 3.65 4 25 78 2.0 3 1.5 33 90 2.67 3.69
*at exhaust valve opening Table 2. Studied cases used to investigate the characteristics of sulfuric acid condensation in a large
marine engine. In a previous work [1] the rate of combustion was determined for the two engine loads in Table 2 by combining a measured cylinder pressure trace with the first law of thermodynam-ics. In this work the process is reversed and the “known” combustion rate is used to calcu-
App. A.3 (Paper 3)
App. A.3 page 3/14

late the cylinder pressure history. This is a fair approach due to the slight variations of the residual gas fraction. The cylinder pressure plays a key role as it significantly affects SO3 formation [2] and alters the properties of condensation throughout the cycle. The modeled pressure histories are presented in Figure 1. When the residual gas fraction is increased the mass of trapped fresh gas reduces a little. This leads to a slight reduction of the pressure trace as seen for the two engine loads in Figure 1.
Figure 1. Cylinder pressure traces of the studied cases in Table 2.
4. Results The ε-values defined in eq. 1 and listed in Table 2 describe the fraction of fuel sulfur that is converted to corrosive species at the point where the exhaust valve opens (EVO). Compared to the published material [1] the listed ε-values are slightly lower. This is explained by the implementation of improved experimental input data for the current engine simulations. De-spite a higher operating pressure the ε-values are lowest at 100 % load. This reason for this is the lower engine speed at 25 % load that leaves more time for cylinder gas mixing which elevates the SO3 formation [1, 2]. Modeled SO3 concentrations over the expansion stroke are presented in Figure 2. Residual gasses from the prior engine cycle provide the initial SO3 concentrations of less than 2 ppmv around TDC (Crank angles ATDC = 0). When the fuel sulfur burns SO2 is the primary sulfur compound in the gas products. SO3 forms at the expense of SO2 during the expansion stroke at lower gas temperatures. However the governing SO3 reactions are essentially quenched when the radical pool vanishes and final SO3 concentrations are less than 20 ppmv. Formation of H2O reflects the fuel burn rate and H2O exists in much higher concentrations than SO3. As H2O and SO3 are formed under different thermal conditions the shape of their pressure traces are quite different as seen in Figure 2. Due to the operating conditions and the residual gas fraction the SO3 pressure peaks in case 1 a little after TDC as seen in Fig-ure 3. Otherwise the SO3 pressure peaks some 50-80 CA ATDC when SO3 is formed in the gas products.
App. A.3 (Paper 3)
App. A.3 page 4/14

Figure 2. Simulated SO3 concentrations (average) of the studied cases in Table 2.
Figure 3. Modeled SO3 and H2O pressures (average) of the studied cases in Table 2. The sulfuric acid dew points presented in Figure 4 are calculated with eq. 2 and are based on the SO3 and H2O pressure traces in Figure 3. Max dew points of typically more than 200 °C are located a little after TDC where the H2O pressure is high. The ever reducing cylinder pressure during the expansion stroke provides that the acid dew point is comparably low even when SO3 is formed in the cylinder gas (Fig. 2). Yet the acid dew point is strongly influ-
App. A.3 (Paper 3)
App. A.3 page 5/14

enced by the minor SO3 concentrations as it clearly exceeds the dew point of H2O as shown for case 1 and case 3 in Figure 4. The dashed horizontal lines in Figure 4 represent constant liner temperatures of 170 °C and 210 °C that roughly correspond to 25 % and 100 % engine load respectively. The difference is rational but the liner temperature is highly variable in practice. It depends on the operating strategy and reduces from TDC and throughout the expansion stroke. Nevertheless the an-ticipated liner temperatures are reasonably applied to illustrate the characteristics of sulfuric acid condensation. When the dew point is higher than the liner temperature sulfuric acid and water condense on the liner surface. Deposited liquid evaporates back into the gas phase if the dew point tem-perature is lower than the liner temperature. The liner area that is exposed to condensation scales with the number of crank angles between the point where condensation starts and stops. In case 3 the liner area is exposed to condensation from ≈5 - 70 CA ATDC. The high-er liner temperature in case 1 provides that the exposed surface is comparably low (≈15 - 40 CA ATDC) despite a higher dew point trace. At both loads the exposed area increases slight-ly with the residual gas fraction and the exposed liner area can be reduced if the liner tem-perature is increased. As shown in Figure 4 the dew point of H2O remains lower than the anticipated liner tempera-tures. Consequently pure water does not condense on the liner under the given conditions. If pure water condenses the liquid acid will be highly diluted.
Figure 4. Sulfuric acid dew points (average) of the studied cases in Table 2. The dashed horizontal lines represent constant cylinder liner temperatures of 170 °C and 210 °C.
During a cycle the H2O pressure is affected by the humidity of the intake air and the as-sumption of dry intake air conditions acts to underestimate real dew points since marine en-gines often operate in very humid environments. In Figure 5 the relative humidity (φ) of the intake air in case 3 is varied from 0 to 1. Engine simulations show that the SO3 formation is weakly hampered by the humidity whereas the dew point temperature and the H2O concen-tration is elevated as shown in Figure 5. The effect is most pronounced before TDC and the max dew point temperature is elevated ≈15 °C when the intake air is fully saturated instead of dry. In the remainder of the cycle the relative effect of the moist air reduces as H2O forms
App. A.3 (Paper 3)
App. A.3 page 6/14
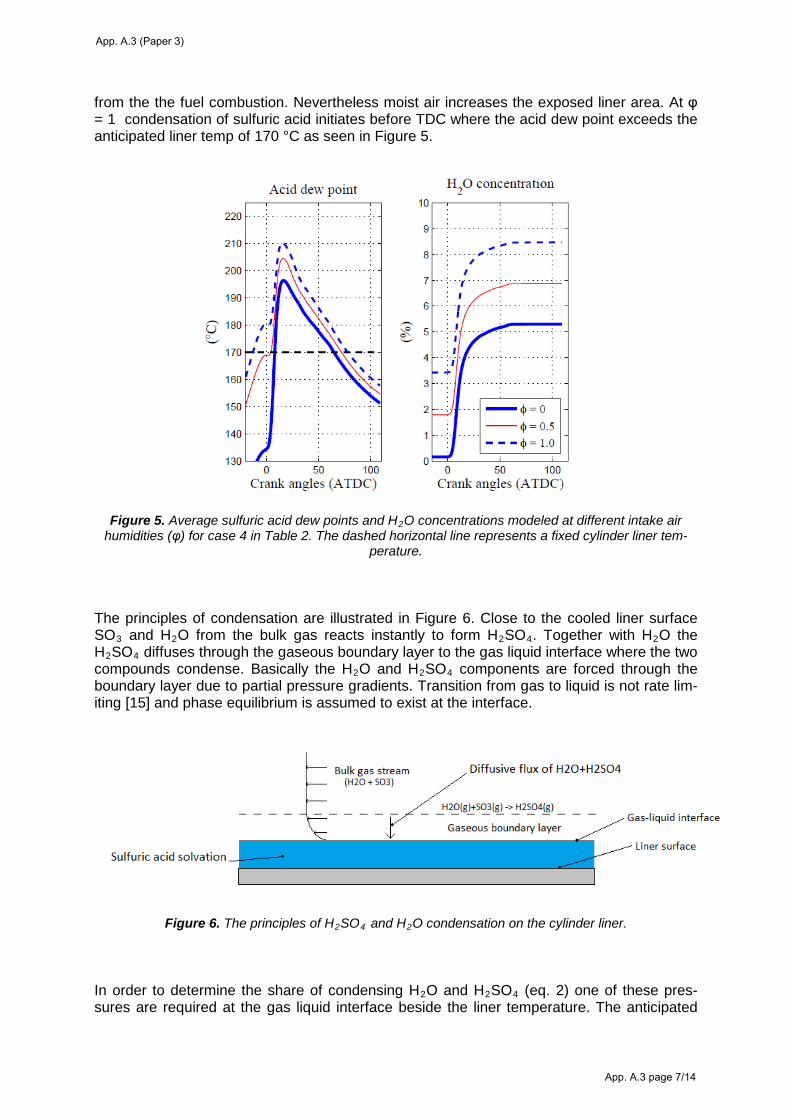
from the the fuel combustion. Nevertheless moist air increases the exposed liner area. At φ = 1 condensation of sulfuric acid initiates before TDC where the acid dew point exceeds the anticipated liner temp of 170 °C as seen in Figure 5.
Figure 5. Average sulfuric acid dew points and H2O concentrations modeled at different intake air humidities (φ) for case 4 in Table 2. The dashed horizontal line represents a fixed cylinder liner tem-
perature. The principles of condensation are illustrated in Figure 6. Close to the cooled liner surface SO3 and H2O from the bulk gas reacts instantly to form H2SO4. Together with H2O the H2SO4 diffuses through the gaseous boundary layer to the gas liquid interface where the two compounds condense. Basically the H2O and H2SO4 components are forced through the boundary layer due to partial pressure gradients. Transition from gas to liquid is not rate lim-iting [15] and phase equilibrium is assumed to exist at the interface.
Figure 6. The principles of H2SO4 and H2O condensation on the cylinder liner. In order to determine the share of condensing H2O and H2SO4 (eq. 2) one of these pres-sures are required at the gas liquid interface beside the liner temperature. The anticipated
App. A.3 (Paper 3)
App. A.3 page 7/14

liner temperatures are always higher than the dew point of H2O and the H2O contained in the bulk gas is orders of magnitude higher than the SO3 content. As a result, the amount of H2O that condenses together with H2SO4 is very small compared to the H2O content in the bulk gas. For that reason the share of condensing H2O and H2SO4 (acid strength) is rea-sonably determined (at each crank angle) from the assumption that the H2O pressure at the gas-liquid interface equals the H2O pressure in the bulk gas. Together with Müller’s mass diffusion expressions in eq. 3 and 4 the condensing acid strength is used to calculate the condensation rates of H2O and H2SO4. gw and ga denotes the transport/condensation rate of H2O and H2SO4 respectively. In eq. 3 the H2SO4 pressure at the gas liquid interface (pa,w) is found by applying the known acid strength (ca) and the liner temperature to eq. 2. In eq. 4 the H2O pressure at the interface (pw,w) cannot be approximated by its pressure in the bulk gas (pw,b) as before since one would have to evaluate ln(1)=0. Instead the definition of the condensing acid strength in eq. 5 is applied. Hereby the system of equations 3-5 that com-prises the three unknowns ga, gw and pw,w can be solved. Consistent with the heat and mass transfer analogy the rates in eq. 3 and 4 scale with the heat transfer coefficient (h) that is determined by Woschnis heat transfer correlation [16]. The coefficient is closely coupled to the system pressure and reduces throughout the expan-sion stroke after peaking around max pressure. The rate expressions also involve diffusion coefficients of H2O and H2SO4 (kw and ka respectively). ka is approximated by the binary diffusion coefficient of H2SO4 in a large excess of air [18] at 296 K (ka = 0.08 atm cm2 s-1). Combined with the binary diffusion coefficient of H2O in air [19] at 293 K (kw = 0.260 atm cm2 s-1) the aspect ratio of kw/ka is around 3. If the coefficients are equally dependent on temperature and pressure the ratio is not altered throughout the engine cycle. In any case the condensation rates of the present study are highly independent of kw/ka ratios up to 100.
(3)
(4)
(5)
Modeled rates of H2SO4 condensation over the expansion stroke are presented in Figure 7. A similar plot could be shown for H2O condensation but is omitted. The condensation rates are expressed in mg/m2 (deposited mass per exposed liner area) which means that the re-sults of case 3 and 4 benefit from a lower engine speed compared to case 1 and 2. Conden-sation takes place when ga > 0. When ga is negative liquid H2SO4 evaporates from the liner surface and into the gas phase. In line with the dew point traces in Figure 4 the onset of
App. A.3 (Paper 3)
App. A.3 page 8/14
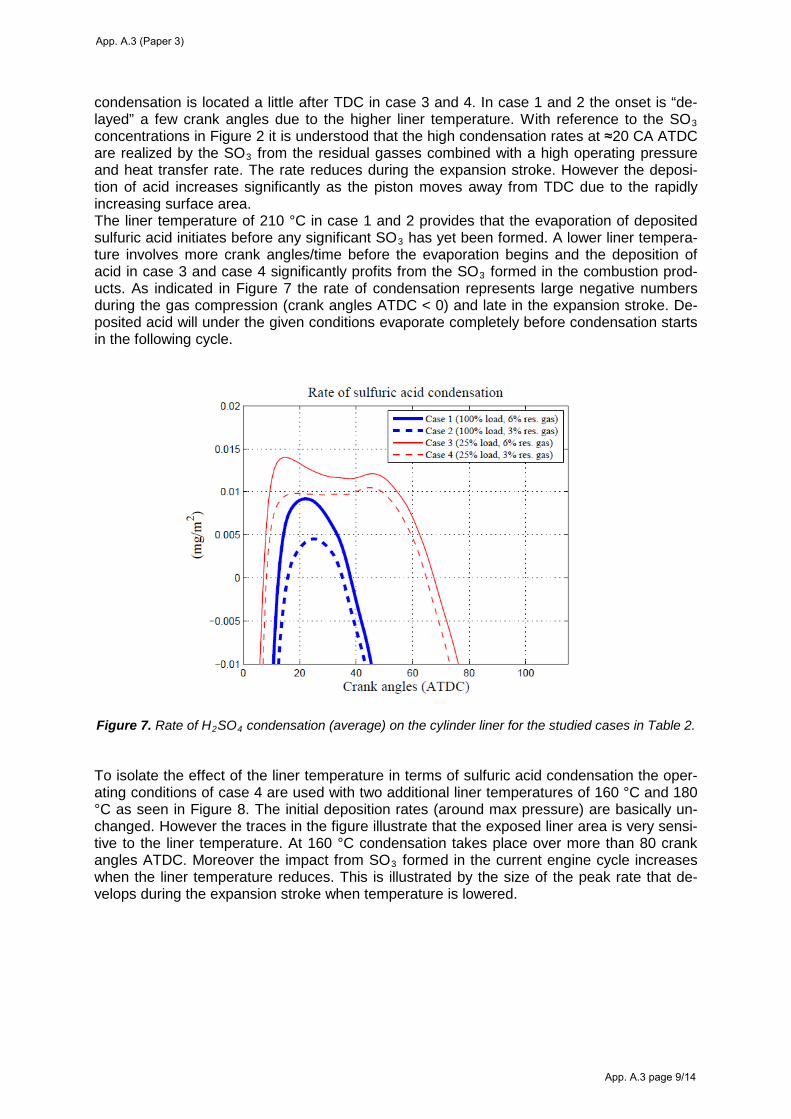
condensation is located a little after TDC in case 3 and 4. In case 1 and 2 the onset is “de-layed” a few crank angles due to the higher liner temperature. With reference to the SO3 concentrations in Figure 2 it is understood that the high condensation rates at ≈20 CA ATDC are realized by the SO3 from the residual gasses combined with a high operating pressure and heat transfer rate. The rate reduces during the expansion stroke. However the deposi-tion of acid increases significantly as the piston moves away from TDC due to the rapidly increasing surface area. The liner temperature of 210 °C in case 1 and 2 provides that the evaporation of deposited sulfuric acid initiates before any significant SO3 has yet been formed. A lower liner tempera-ture involves more crank angles/time before the evaporation begins and the deposition of acid in case 3 and case 4 significantly profits from the SO3 formed in the combustion prod-ucts. As indicated in Figure 7 the rate of condensation represents large negative numbers during the gas compression (crank angles ATDC < 0) and late in the expansion stroke. De-posited acid will under the given conditions evaporate completely before condensation starts in the following cycle.
Figure 7. Rate of H2SO4 condensation (average) on the cylinder liner for the studied cases in Table 2. To isolate the effect of the liner temperature in terms of sulfuric acid condensation the oper-ating conditions of case 4 are used with two additional liner temperatures of 160 °C and 180 °C as seen in Figure 8. The initial deposition rates (around max pressure) are basically un-changed. However the traces in the figure illustrate that the exposed liner area is very sensi-tive to the liner temperature. At 160 °C condensation takes place over more than 80 crank angles ATDC. Moreover the impact from SO3 formed in the current engine cycle increases when the liner temperature reduces. This is illustrated by the size of the peak rate that de-velops during the expansion stroke when temperature is lowered.
App. A.3 (Paper 3)
App. A.3 page 9/14
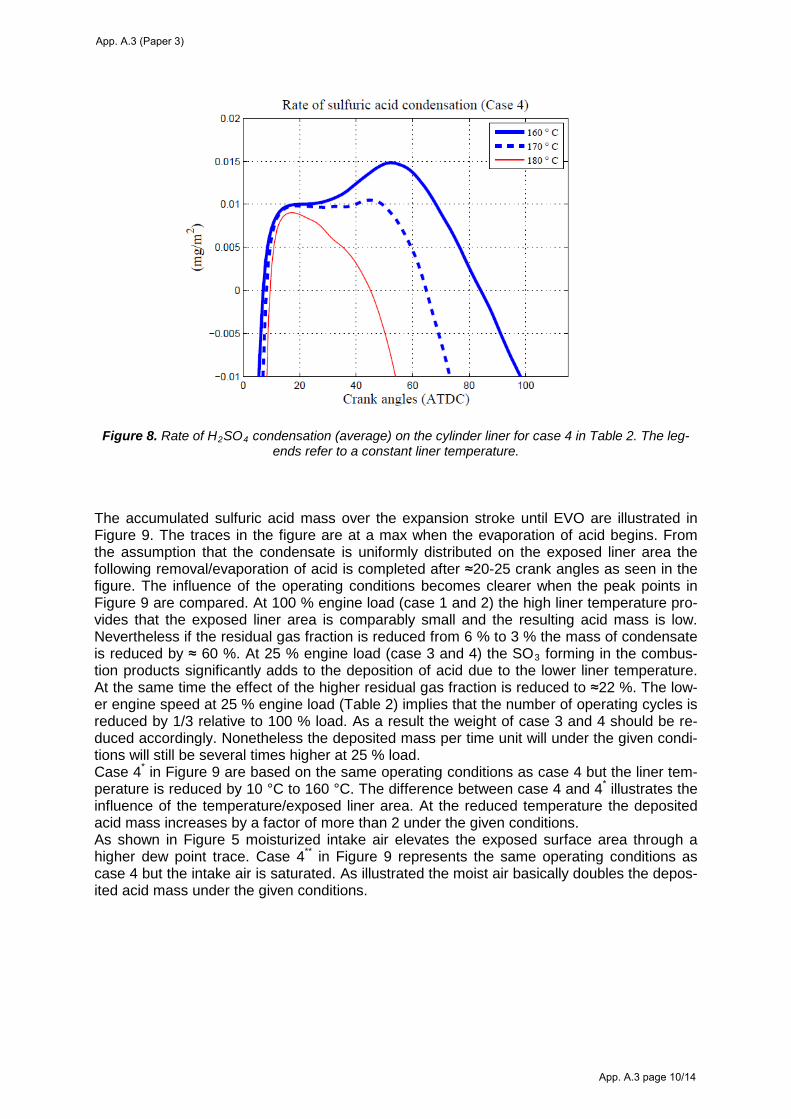
Figure 8. Rate of H2SO4 condensation (average) on the cylinder liner for case 4 in Table 2. The leg-ends refer to a constant liner temperature.
The accumulated sulfuric acid mass over the expansion stroke until EVO are illustrated in Figure 9. The traces in the figure are at a max when the evaporation of acid begins. From the assumption that the condensate is uniformly distributed on the exposed liner area the following removal/evaporation of acid is completed after ≈20-25 crank angles as seen in the figure. The influence of the operating conditions becomes clearer when the peak points in Figure 9 are compared. At 100 % engine load (case 1 and 2) the high liner temperature pro-vides that the exposed liner area is comparably small and the resulting acid mass is low. Nevertheless if the residual gas fraction is reduced from 6 % to 3 % the mass of condensate is reduced by ≈ 60 %. At 25 % engine load (case 3 and 4) the SO3 forming in the combus-tion products significantly adds to the deposition of acid due to the lower liner temperature. At the same time the effect of the higher residual gas fraction is reduced to ≈22 %. The low-er engine speed at 25 % engine load (Table 2) implies that the number of operating cycles is reduced by 1/3 relative to 100 % load. As a result the weight of case 3 and 4 should be re-duced accordingly. Nonetheless the deposited mass per time unit will under the given condi-tions will still be several times higher at 25 % load. Case 4* in Figure 9 are based on the same operating conditions as case 4 but the liner tem-perature is reduced by 10 °C to 160 °C. The difference between case 4 and 4* illustrates the influence of the temperature/exposed liner area. At the reduced temperature the deposited acid mass increases by a factor of more than 2 under the given conditions. As shown in Figure 5 moisturized intake air elevates the exposed surface area through a higher dew point trace. Case 4** in Figure 9 represents the same operating conditions as case 4 but the intake air is saturated. As illustrated the moist air basically doubles the depos-ited acid mass under the given conditions.
App. A.3 (Paper 3)
App. A.3 page 10/14

Figure 9. Deposited acid on the cylinder liner of the studied cases in Table 2. *The liner temperature is
160 °C instead of 170 °C. **The intake air is saturated. In Figure 10 the fraction of fuel sulfur that is converted to corrosive species (ε) at EVO is plotted against the fuel sulfur content. The results represent the operating conditions of case 4 in Table 2. In the typical fuel sulfur range from 1 - 4 % m/m the ε-value decreases slightly. As the sulfur content approaches very low numbers the ε-value tends to increase asymptoti-cally, yet the presence of SO3 in the cylinder gas will disappear in line with the vanishing sulfur content. Under the given conditions the combined effect of higher SO3 pressures and exposed liner areas provides that the deposition of sulfuric acid scales with a quadratic re-gression of the sulfur content as illustrated in the figure.
Figure 10. Fraction of fuel sulfur converted to corrosive species and deposited sulfuric acid on the cylinder during a cycle. The figures represent operating conditions at 25 % engine load.
App. A.3 (Paper 3)
App. A.3 page 11/14

5. Discussion With respect to sulfuric acid condensation on a marine engine cylinder liner the applied as-sumption of a homogenous cylinder gas mixture is not truly representative. The actual gas conditions of the mixing controlled combustion process are clearly heterogeneous in terms of composition and turbulence intensity etc. This challenges the modeled dew points and acid deposition rates. Moreover to the author’s knowledge the applied thermochemistry of the H2O-H2SO4 is system not directly validated against experimental measurements of sulfuric acid dew points. In the present work the liner temperature is constant throughout the expansion stroke where condensation takes place. The actual temperature profile is highly variable. It depends on the operating strategy and reduces from TDC towards the bottom dead center. In practice the condensation of acid will strongly depend on the resulting liner temperature profile. In this work the residual gas fraction and intake air humidity significantly alters the deposition of sulfuric acid. However if the actual liner temperature is generally lower than the acid dew point throughout the expansion stroke the influence of these conditions will decrease. In ad-dition the accumulated acid mass on the liner can be considerably higher than predicted in this work because a larger liner area is exposed to condensation at lower liner temperatures. A flue gas that contains SO3 can form an acid mist if it is abruptly cooled below the acid dew point [20]. This may occur in practice when hot gas products reach the cooled liner surface. Mist formation is not treated in this work and the applied analogy between heat and mass transfer may overestimate the rate of acid condensation as the mist tends to stay in the bulk gas. 6. Conclusions Formation of SO3 in a large two-stroke marine engine is modeled with a multizone engine model and combined with diffusive mass transfer theory in order to examine the characteris-tics of sulfuric acid condensation on the cylinder liner. The liner is assumed to have a con-stant temperature over the full stroke. I.e. 170 °C and 210 °C at 25 % and 100 % engine load respectively. Sulfuric acid dew points are calculated from the thermochemistry of the two-phase H2O-H2SO4 system. Acid dew points and condensation rates are based on a homogenous cylinder gas mixture. The reaction between H2O and SO3 instantly forms H2SO4 at the cooled liner surface. Thus SO3 and H2SO4 are lumped together. SO3 from the residual gasses provides that the sulfuric acid dew point peaks close to max cylinder pressure at temperatures of typically more than 200 °C. Under the given conditions the condensation of sulfuric acid is very sensitive to the operating strategy. The operating pressure, fuel sulfur content and residual gas fraction elevates the SO3 pressure that in-creases the rate of condensation as well as the acid dew point. When the dew point trace is elevated a larger liner area is exposed to condensation from which the deposition of acid can increase remarkably. Similarly the deposition increases with the charge air humidity. In order to counteract condensation of acid the liner temperature is essential as it determines the size of the exposed liner area. Even a small reduction of the liner temperature will under the given conditions significantly increase the deposition of acid.
App. A.3 (Paper 3)
App. A.3 page 12/14

Nomenclature Symbol Unit ca Condensing acid strength kg/kg cp,g Specific heat capacity of gas J/kg-K ga Rate of condensing sulfuric acid mg/m2-s
gw Rate of condensing water mg/m2-s
h Heat transfer coefficient W/m2-K
ka Binary diffusion coefficient of H2SO4 in air atm cm2 /s
kw Binary diffusion coefficient of H2O in air atm cm2 /s pa,b Partial pressure of H2SO4 in bulk gas Pa
pa,w Partial pressure of H2SO4 at gas-liquid inter-face Pa
Pboost Boost/charge air pressure bar pw,b Partial pressure of H2O in bulk gas Pa pw,w Partial pressure of H2O at gas-liquid interface Pa
pi0 Vapor pressure of a pure substance Pa
Ra Specific gas constant of H2SO4 J/kg-K Rw Specific gas constant of H2O J/Kg-K Rg Specific gas constant of cylinder gas J/Kg-K T Temperature K Tair Charge air temperature °C xi Mole fraction in the liquid solvation - xres Residual gas fraction % m/m γ i Activity coefficient - ε Fraction of fuel sulfur converted to SO3 - λ t Trapped excess air ratio -
Abbreviations ATDC After top dead center EVO Exhaust valve opening rpm Revolutions per minute S TDC
Sulfur Top dead center
App. A.3 (Paper 3)
App. A.3 page 13/14

Literature [1] Cordtz, R.; Schramm, J.; Andreasen, A.; Eskildsen, S. S.; Mayer, S. Modeling the dis-
tribution of sulfur compounds in a large two stroke diesel engine. Energy Fuels 2013, 27, 1652-1660.
[2] Cordtz, R.; Schramm, J.; Rabe, R. Investigating SO3 Formation from the Combustion of Heavy Fuel Oil in a Four-Stroke Medium-Speed Test Engine. Energy and Fuels 2013, 27.
[3] Verhoff, F. H.; Banchero, J. T. Predicting Dew Points of Flue Gases. Chem. Eng. Prog. 1974, 70, 71-72.
[4] Pierce, R. Estimating Acid Dewpoints in Stack Gases. Chem. Eng. 1977, 84, 125-128. [5] Abel, E. The Vapour-phase above the System Sulphuric Acid-Water. J. Phys. Chem.
1946, 50, 260. [6] Greenewalt, C. H. Partial pressure of water out of aqueous solutions of sulfuric acid.
Ind. Eng. Chem. 1925, 17, 522-523. [7] Gmitro, J. I.; Vermeulen, T. Vapor-Liquid Equilibria for Aqueous Sulfuric Acid.
A. I. Ch. E J. 1964, 10 No 5, 740-746. [8] Wilson, R. W.; Stein, F. P. Correlation of sulfuric acid-water partial pressures.
Fluid Phase Equilib. 1989, 53, 279-288. [9] Pessoa, F. L. P.; Siqueira Campos, C. E. P.; Uller, A. M. C. Calculation of vapor-liquid
equilibria in aqueous sulfuric acid solutions using the UNIQUAC equation in the whole concentration range. Chemical Engineering Science 2006, 61, 5170-5175.
[10] Bosen, A.; Engels, H. Description of the phase equilibrium of sulfuric acid with the NRTL equation and a solvation model in a wide concentration and temperature range. Fluid Phase Equilib. 1988, 43, 213-230.
[11] Nist Chemistry WebBook: http://webbook.nist.gov/chemistry/. [12] Luchinskii, G. P. Physical-chemical Study of the H2O-SO3 System, I. Equilibrium in the
vapor and the liquid phase. Zh. Fiz. Khim. 1956, 30, 1207. [13] Renon; Prausnitz Local compositions in thermodynamic excess functions for liquid
mixtures. AIChE J. 1968, 14, 135-144. [14] Hindiyarti, L.; Glarborg, P.; Marshall, P. Reactions of SO3 with the O/H radical pool
under combustion conditions. J. Phys. Chem. A 2007, 111, 3984-3991. [15] Mueller, P. Dew point temperatures in cylinders of diesel engines working with fuel that
contains sulfur (Taupunkttemperaturen im Zylinder von Dieselmaschinen bei schwefel-haltigen Kraftstoffen, Nr 486). VDI -- Forschungsheft 1961, 27, 1-56.
[16] Ferguson, C. R.; Kirkpatrick, A. T., Eds.; Internal combustion engines / applied ther-mosciences; Wiley: New York, 2001; .
[17] Andreasen, A.; Mayer, S. Modeling of the Oxidation of Fuel Sulfur in Low Speed two-Stroke Diesel Engines. In 26 CIMAC World Congress; CIMAC: Bergen, 2010; .
[18] Poschl, U.; Canagaratna, M.; Jayne, J. T.; Molina, L. T.; Worsnop, D. R.; Kolb, C. E.; Molina, M. J. Mass Accommodation Coefficient of H2SO4 Vapor on Aqueous Sulfuric Acid Surfaces and Gaseous Diffusion Coefficient of H2SO4 in N2/H2O. J. Phys. Chem. 1998, 102, 10082.
[19] Reid, R. C.; Sherwood, T. K., Eds.; The properties of gases and liquids. Their estimati-on and correlation; McGraw-Hill Book Company: New York, 1958; .
[20] Land, T. Theory of Acid Deposition and its Application to the Dew-Point Meter. J. Inst. Fuel 1977, 50, 68-75.
App. A.3 (Paper 3)
App. A.3 page 14/14

The rate of a chemical reaction is described via the Arrhenius expression in eq. A.1.
𝑘𝑓 = 𝐴 ∙ 𝑇𝛽𝑒𝑒𝑒 �− 𝐸𝑅𝑅� (A.1)
Forward and backward rates are related through the equilibrium constant Kc in units of
concentration as shown in eq. A.2.
𝑘𝑏 = �𝑘𝑓𝐾𝑐� (A.2)
The relationship between the equilibrium constant in concentration units and in pressure units is
expressed in eq. A.3
𝐾𝑐 = 𝐾𝑝 �𝑃𝑜
𝑅𝑅�∑ 𝑣𝑛𝑛1
(A.3)
The equilibrium constant in pressure units is given by eq. A.4 where The Δ refers to the change that
occurs in passing completely from reactants to products in the reaction.
𝐾𝑝 = exp �∆𝑆𝑜
𝑅− ∆𝐻𝑜
𝑅� (A.4)
∆𝑆𝑜
𝑅= �𝑣𝑛
𝑛
1
𝑠𝑘𝑜
𝑅
∆𝐻𝑜
𝑅𝑇= �𝑣𝑛
𝑛
1
𝐻𝑘𝑜
𝑅𝑇
App. A.4
App. A.4 page 1/1


DCAMM
Danish Center for Applied Mathematics and Mechanics
Nils Koppels Allé, Bld. 404
DK-2800 Kgs. Lyngby
Denmark
Phone (+45) 4525 4250
Fax (+45) 4593 1475
www.dcamm.dk
ISSN: 0903-1685
DTU Mechanical Engineering
Section of Thermal Energy
Technical University of Denmark
Nils Koppels Allé, Bld. 403
DK- 2800 Kgs. Lyngby
Denmark
Phone (+45) 4525 4131
Fax (+45) 4588 4325
www.mek.dtu.dk
ISBN: 978-87-7475-421-3