the influence of bedrock and mineral occurrences on ... · c. serpa, m. batterson and k. guzzwell...
TRANSCRIPT
Current Research (2009) Newfoundland and Labrador Department of Natural ResourcesGeological Survey, Report 09-1, pages 315-337
THE INFLUENCE OF BEDROCK AND MINERAL OCCURRENCESON ARSENIC CONCENTRATIONS IN GROUNDWATER WELLS
IN THE GANDER BAY AREA, NEWFOUNDLAND
C. Serpa1,2, M. Batterson1 and K. Guzzwell2
1Geochemistry, Geophysics and Terrain Sciences Section2Water Resources Division, Department of Environment and Conservation
ABSTRACT
Results from chemical water analyses, collected from private drinking wells in the Gander Bay area, have revealedarsenic concentrations above the maximum acceptable concentration (MAC), as established by Health Canada Guidelines forDrinking Water Quality. The purpose of this study is to offer an explanation for the source of the elevated arsenic concentra-tions in the groundwater.
One hundred and sixteen (116) water samples were collected from existing water wells, drilled into bedrock of the Dun-nage and Gander zones, to determine if the bedrock was a source of the arsenic. More than 50 percent of the water samplesanalyzed were found to have arsenic concentration above the MAC of 0.010 mg/L. Additionally, these samples also showedconcentrations of lead, iron and zinc above the MAC of 0.01, 0.3 and 5 mg/L, respectively. The concentrations of arsenic var-ied between 0 and 0.790 mg/L.
Geostatistics were applied to study the public health hazard posed by arsenic in the well water. The ordinary kriging esti-mates of arsenic were plotted on arsenic distribution maps using lake-sediment, till- and bedrock-geochemistry data. Indica-tor kriging for groundwater-well samples was applied to characterize the health hazard caused by arsenic concentration at athreshold value of 0.01 mg/L through a threshold map. These arsenic distribution and threshold maps will provide a decision-support tool to define the areas where it will be safe to drill new groundwater wells.
The elevated concentrations of arsenic within the bedrock in the Gander Bay area suggest that there are other sources,other than rock type, for the elevated arsenic levels found in the well water. Adjacency to mineralization and arsenic chem-istry both play important roles in this process. The analytical results show a strong correlation between the occurrence ofarsenic contamination in groundwater samples and the occurrence of copper and gold in the area. However, more samplesneed to be analyzed (till, bedrock, soil and vegetation) to evaluate the impact of arsenic contamination on the drinking water,as well as related issues of agricultural sustainability and food quality.
INTRODUCTION
The Gander Bay area was identified as having thepotential for moderate to high concentrations of arsenic inthe groundwater resources of the area (Newfoundland andLabrador Department of Environmental and Conservationwebsite: www.wrmd.env.gov.nl.ca; viewed 2008). Figure 1shows that this area has high concentrations of arsenic ingroundwater and consequently in private wells in the area.Although this data was collected initially for the purposes ofmineral exploration, it provided a useful means of mappingnatural chemical variation over the province. Data coverage
was extensive; 6569 lakes were sampled in insular New-foundland and analyzed for a variety of elements (Daven-port et al., 1994).
Arsenic concentrations in public drinking-water sup-plies are regulated by Health Canada (1996). In 2003, theFederal-Provincial-Territorial Committee on DrinkingWater, revised the maximum allowable concentration(MAC) from 0.025 mg/L to 0.010 mg/L for arsenic in drink-ing water because it was determined that the existing stan-dard did not satisfactorily protect the public from theadverse health effects of long-term exposure (Safiudin and
315

CURRENT RESEARCH, REPORT 09-1
316
Figure 1. Areas of potential arsenic concentration in well water (Department of Environment–Department of NaturalResources).

C. SERPA, M. BATTERSON AND K. GUZZWELL
Karim, 2001). Private water-supply wells are rarely sampledfor arsenic or other chemical constituents unless individualwell owners choose to do so.
To provide private well owners and provincial environ-mental and health officials with accurate information onarsenic concentrations from private wells in the Gander Bayregion, the departments of Environment and Conservation,(Water Resources Management Division) and of NaturalResources (Geological Survey) conducted an arsenic occur-rence and distribution study.
This report describes the investigation regarding thesources of arsenic contamination in the Gander Bay area,which includes discussion of analyses of water samples col-lected from private wells chosen at random, and analyses ofsamples of lake sediment, till and bedrock.
LOCATION
The study area comprises the Gander Bay and Bonav-ista Bay north areas, which are located in central New-foundland (Figure 2), and covers fifteen 1:50 000-NTS mapsheet areas: these are Glovertown (NTS 2D/9), Dead WolfPond (NTS 2D/10), Eastern Pond (NTS 2D/11), Mount Pey-ton (NTS 2D/14), Gander (NTS 2D/15), Gambo (NTS2D/16), Weir's Pond (NTS 2E/1), Gander River (NTS 2E/2),Botwood (NTS 2E/3), Port Leamington (NTS 2E/6), Com-fort Cove (NTS 2E/7), Carmanville (NTS 2E/8), Fogo (NTS2E/9), Twillingate (NTS 2E/10), Exploits (NTS 2E/11),Wesleyville (NTS 2F/4) and Musgrave Harbour (NTS 2F/5).
PREVIOUS INVESTIGATIONS
Arsenic is widely distributed throughout the Earth's
317
Figure 2. Index map showing sampling area.

CURRENT RESEARCH, REPORT 09-1
crust. The presence of elevated concentrations of arsenic inNewfoundland has been known since 1990 when 16 569lake-sediment samples were collected as part of Canada'sNational Geochemical Reconnaissance Program. Results ofthis project included a map of arsenic distribution in lakesediment for the Island of Newfoundland (Davenport et al.,1994) that showed considerable variation from region toregion, and its clear relation with bedrock geology. Elevat-ed arsenic concentrations are shown in central Newfound-land and on the Avalon Peninsula. Papezik (1967) describedthe origin of native arsenic in two copper mines in theSpringdale area.
In 2002, the first reported concentration of arsenicabove the federal drinking-water guidelines was reportedfrom the Harbour Main–Chapel's Cove–Lakeview area ofthe Avalon Peninsula, just after public wells first started tobe tested. Arsenic concentrations were found to be up to 12times greater than the MAC.
Rageh et al. (2007) studied arsenic concentrationsexceeding the MAC level in many wells and some from sur-face water bodies in eastern, central and western New-foundland. Their study showed that the analyses revealeddifferences among water sources in the eastern, central andwestern regions of Newfoundland, mainly due to the differ-ent type of bedrock geology of the areas.
HEALTH EFFECTS OF ARSENIC
Long-term ingestion of arsenic has been linked to cer-tain types of cancer, particularly skin, lung and bladder can-cer. The symptoms and signs that arsenic causes appear todiffer between individuals, population groups and geo-graphic areas. Thus, there is no universal definition of thedisease(s) caused by arsenic. Similarly, there is no method toidentify those cases of internal cancer that were caused byarsenic from cancers induced by other factors (World HealthOrganization, http://www.who.int/mediacentre/factsheets/fs210/en/; viewed 2008). The risks of developing healthproblems are the same for everyone, including children andpregnant women. There is minimal absorption of arsenicthrough the skin, and thus washing with water high inarsenic does not present a health risk (World Health Organi-zation, op. cit.)
Arsenic is a naturally occurring groundwater contami-nant in Canada, especially in Prince Edward Island, Québec,Ontario, British Columbia, Saskatchewan and Nova Scotia(Health Canada, 2006). Internationally, high concentrationshave been reported in the western United States, especiallyaround Los Angeles, the Sierra Nevada Mountains, the SaltRiver Basin, and areas of Michigan and Wisconsin (Petersand Blum, 2003). There is widespread contamination in
southeast India, and the worst occurrence of the healtheffects of groundwater arsenic contamination is inBangladesh.
GEOCHEMISTRY AND SOURCES OF ARSENIC
Arsenic occurs naturally in several oxidation states (-3,0, +3 and +5), but in natural waters is mostly found in inor-ganic forms, such as Arsenite As (III) and Arsenate As (V)(Holm et al., 2004). Organic arsenic forms may be producedby biological activity, mostly in surface waters, but arerarely quantitatively important. Inorganic arsenic species aremore mobile and toxic than organic forms of arsenic to liv-ing organisms, including animal, plants and humans (Bell etal., 2000).
The occurrence and variability of arsenic in groundwa-ter from wells drilled into bedrock in the study area are relat-ed to a number of factors, including: a) underlying bedrockcomposition and mineralization, b) soils and sedimentsderived from weathering of bedrock, c) anthropogenicsources related to past pesticide use and/or mining process-es, d) leaching of tailings, and e) resident time of ground-water in contact with the bedrock.
In the Gander Bay area, arsenic occurs in bedrock, aswell as in the shallow glacial sediment that covers the area.Arsenic is dissolved naturally from these materials andenters the groundwater through natural recharge. Naturallyoccurring arsenic concentrations in igneous, metamorphicand sedimentary rocks vary considerably; sedimentary rocksgenerally contain more arsenic than igneous and metamor-phic rocks (Banglapedia, 2006). Also, arsenic can be foundin association with several ore minerals, e.g., arsenopyrite(FeAsS), or associated with gold, antimony or iron. Finally,arsenic is also associated with geothermal areas and highevaporation rates, most likely because trace elements suchas arsenic are more readily mobilized and transported bywarm or hot water (Welch et al., 2000).
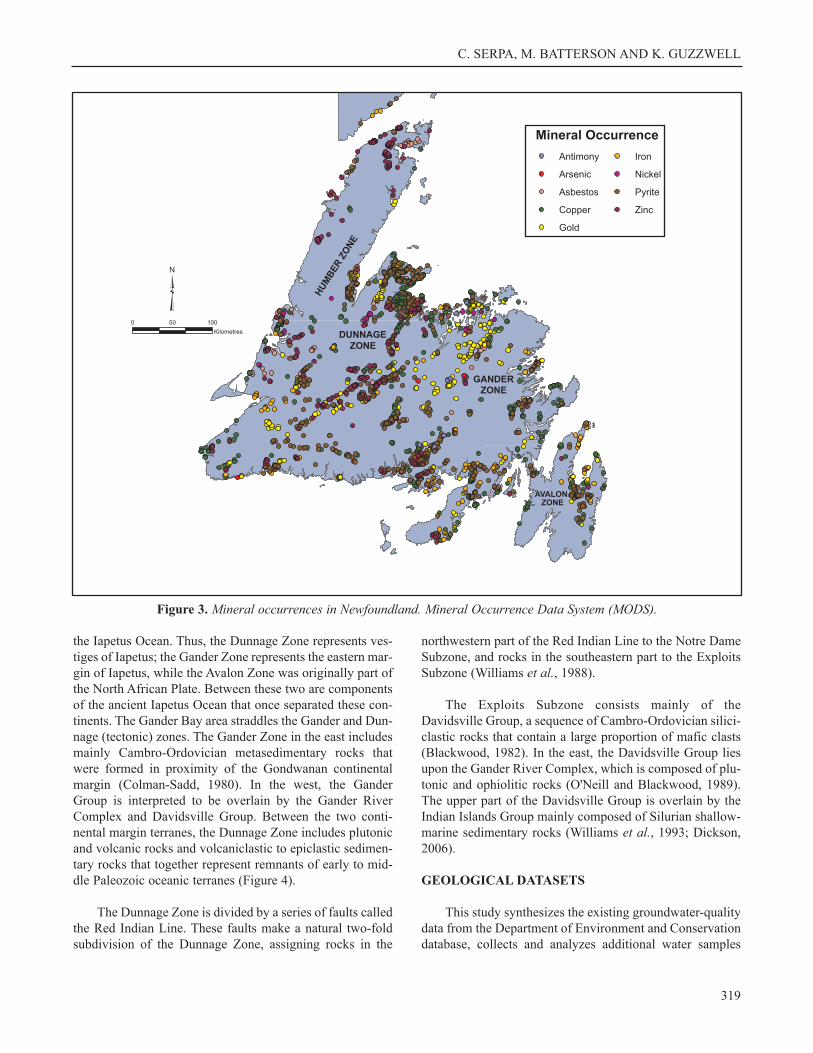
The Gander Bay area is characterized by massive sul-phide zinc–copper–lead–gold–silver; epithermal zones ofgold and silver; porphyry copper–molybdenum; low-sulphi-dation antimony; porphyry copper–gold; zinc and copperdeposits (Figure 3).
BEDROCK GEOLOGY
Newfoundland and Labrador is subdivided into fourtectonic zones, namely the Humber, Dunnage, Gander andAvalon zones. The Humber Zone could include componentsof the North American continental margin or the westernmargin of Iapetus. More easterly zones are geologic entities,added to the North American margin during the closing of
318
C. SERPA, M. BATTERSON AND K. GUZZWELL
the Iapetus Ocean. Thus, the Dunnage Zone represents ves-tiges of Iapetus; the Gander Zone represents the eastern mar-gin of Iapetus, while the Avalon Zone was originally part ofthe North African Plate. Between these two are componentsof the ancient Iapetus Ocean that once separated these con-tinents. The Gander Bay area straddles the Gander and Dun-nage (tectonic) zones. The Gander Zone in the east includesmainly Cambro-Ordovician metasedimentary rocks thatwere formed in proximity of the Gondwanan continentalmargin (Colman-Sadd, 1980). In the west, the GanderGroup is interpreted to be overlain by the Gander RiverComplex and Davidsville Group. Between the two conti-nental margin terranes, the Dunnage Zone includes plutonicand volcanic rocks and volcaniclastic to epiclastic sedimen-tary rocks that together represent remnants of early to mid-dle Paleozoic oceanic terranes (Figure 4).
The Dunnage Zone is divided by a series of faults calledthe Red Indian Line. These faults make a natural two-foldsubdivision of the Dunnage Zone, assigning rocks in the
northwestern part of the Red Indian Line to the Notre DameSubzone, and rocks in the southeastern part to the ExploitsSubzone (Williams et al., 1988).
The Exploits Subzone consists mainly of theDavidsville Group, a sequence of Cambro-Ordovician silici-clastic rocks that contain a large proportion of mafic clasts(Blackwood, 1982). In the east, the Davidsville Group liesupon the Gander River Complex, which is composed of plu-tonic and ophiolitic rocks (O'Neill and Blackwood, 1989).The upper part of the Davidsville Group is overlain by theIndian Islands Group mainly composed of Silurian shallow-marine sedimentary rocks (Williams et al., 1993; Dickson,2006).
GEOLOGICAL DATASETS
This study synthesizes the existing groundwater-qualitydata from the Department of Environment and Conservationdatabase, collects and analyzes additional water samples
319
Figure 3. Mineral occurrences in Newfoundland. Mineral Occurrence Data System (MODS).

CURRENT RESEARCH, REPORT 09-1
320
Figure 4. Lithology of bedrock geological units north of Gander Lake, Newfoundland.Geology compiled by Colman-Sadd andCrisby-Whittle (2002).

C. SERPA, M. BATTERSON AND K. GUZZWELL
from public and private drinking-water supplies within theGander Bay area, and compiles and reclassifies the lake-sed-iment, till and bedrock data from the provincial GeologicalSurvey databases to determine if there is any geostatisticalcorrelation between the regional geology and the occurrenceof arsenic in the groundwater. This correlation can then beextrapolated into areas where the geology is known, butwhere groundwater-quality data are scarce or do not exist, toguide future development.
GEOLOGICAL MAPS
Bedrock and surficial geological data were compiledfrom geological maps by Colman-Sadd et al. (1990), Currieet al. (1997) and Batterson et al. (1998). Digital versions ofthe provincial geological map were obtained though theResources Atlas from the Newfoundland and Labrador Geo-logical Survey (http://gis.geosurv.gov.nl.ca/, viewed 2008).Because the geological maps were produced at differentscales, the level of detail is variable. However, group and
formation designations were respected and the data werereclassified to follow the unit patterns.
SAMPLE DATASETS
Till-, lake-sediment and bedrock-geochemical data forthe Gander Bay area were retrieved from the ResourcesAtlas database archive of the Newfoundland and LabradorGeological Survey.
1. Arsenic in Lake-Sediment Dataset
The lake-sediment geochemistry dataset produced 1555As determinations from the Gander Bay area (Figure 5).These samples were collected at a sample spacing of 1 sam-ple per 6 km2 and analyzed by INAA.
2. Arsenic in Till Dataset
Between 1987 and 1999 till samples were collectedfrom the Gander Bay area. Sample spacing was 1 sample per
321
Figure 5. Location of lake-sediment samples analyzed for arsenic. Legend as in Figure 4.

CURRENT RESEARCH, REPORT 09-1
1 to 4 km2 depending on access, and samples were collectedmostly from shallow hand-dug pits penetrating to the BC- orC-horizon (Batterson and Taylor, 2001; Liverman et al.,2000). Till sampling across the area is not complete andsamples were collected between the Gander River Ultraba-sic Belt and Northern Arm Fault, in the Exploits Subzone(Figure 6).
3. Arsenic in Bedrock Dataset
Bedrock geochemical data for 350 bedrock sampleswere collected during 1993 for the Mount Peyton bedrock-mapping project (Dickson, 1993; Figure 7).
4. Arsenic in Groundwater Dataset
Arsenic data from public and private wells that are fin-ished in bedrock, in the Gander Bay area, were obtainedfrom the provincial records on public water-supply wellscollected by the Department of Environment and Conserva-tion for compliance with the Provincial Safe Drinking WaterAct (2002) and earlier legislation to ensure the safe delivery
of public drinking water. The samples were collected bydepartment staff between 1995 and 2008.
A total of 86 previously collected groundwater samplesfrom the Gander Bay area were obtained from the provincialrecords for water supplies of the Department of Environ-ment and Conservation, and an additional 30 samples fromprivate domestic wells. Most of the existing groundwaterdata were collected during well tests (also known as pump-ing tests, conducted to evaluate a well's potential yield by'stimulating' the aquifer through constant pumping, andobserving drawdown in the pumped well). Consequently,wells were pumped prior to sample collection; therefore,samples collected were likely from the aquifer, rather thanfrom the well casing. Samples from private wells collectedas part of this study were taken from the faucet of thekitchen sink after running the water for 3 minutes in order toensure that the pipes and well stem were purged, and thewater collected was representative of the aquifer. Well-depthinformation was generally available for all these samples(Figure 8).
322
Figure 6. Location of till samples analyzed for arsenic in the Gander Bay area. Legend as in Figure 4.

C. SERPA, M. BATTERSON AND K. GUZZWELL
The water-quality samples collected were analyzed byMaxxam Analytical Inc. following the Guidelines for Cana-dian Drinking Water Quality, while existing water-qualitysamples were analyzed by the Department of NaturalResources Geochemical Laboratory.
All distribution maps (Figures 5 – 8) depict arsenic con-centrations in quartiles. A quartile map is simply a colour-coded sampling map, where the symbols identify the sam-pling locations and their corresponding colours indicate themagnitude of the response variable. In this study, arsenicconcentration measurements were classified into four dis-tinct quartile ranges: Q1 (25%), Q2 (50%), Q3 (75%) andQ4 (100%). This method facilitates data interpretation, bycomparing maps with arsenic concentrations displayed,using equal intervals.
ARSENIC STATISTICS
Concentrations of arsenic in lake sediment, till, bedrockand groundwater in bedrock that vary by more than fourorders of magnitude are shown in Table 1 (see Robinson andAyotte, 2007). The ranges of arsenic concentrations in allsamples are from below the detection limit to 119 000 ppm.The highest concentration of arsenic was measured in
bedrock samples from the Mount Peyton area in a sample ofserpentine. The distribution of arsenic concentrations ingroundwater range from below detection limit to a maxi-mum arsenic concentration of 0.239 mg/L from samples col-lected from known locations and aquifer material. However,the maximum arsenic concentration (in the Department ofEnvironment and Conservation's database) was from sam-ples collected in the towns of Seldom and Little Seldom inSeptember 2002. Analyses from these samples indicatearsenic concentrations of 0.790 mg/L (data taken from therecords of the Department of Environment and Conserva-tion). Unfortunately, neither the accurate location nor thedepth of theses samples is known. While this value was usedfor modelling, its lack of coordinates made it impossible tobe used as a single value. Instead, this concentration wasaveraged in with other arsenic results from the same area asa composite (0.01 mg/L for arsenic concentrations fromsamples from 37 wells).
SPATIAL ANALYSIS AND RESULTS
General statistical analyses of the geochemical arsenicdata in drinking-water, lake-sediment, whole-rock, and tillsamples are described in this section. A spatial database wasgenerated and is presented in an interpolated map form,
323
Figure 7. Location of bedrock samples analyzed for arsenic in the Gander Bay area. Legend as in Figure 4.

CURRENT RESEARCH, REPORT 09-1
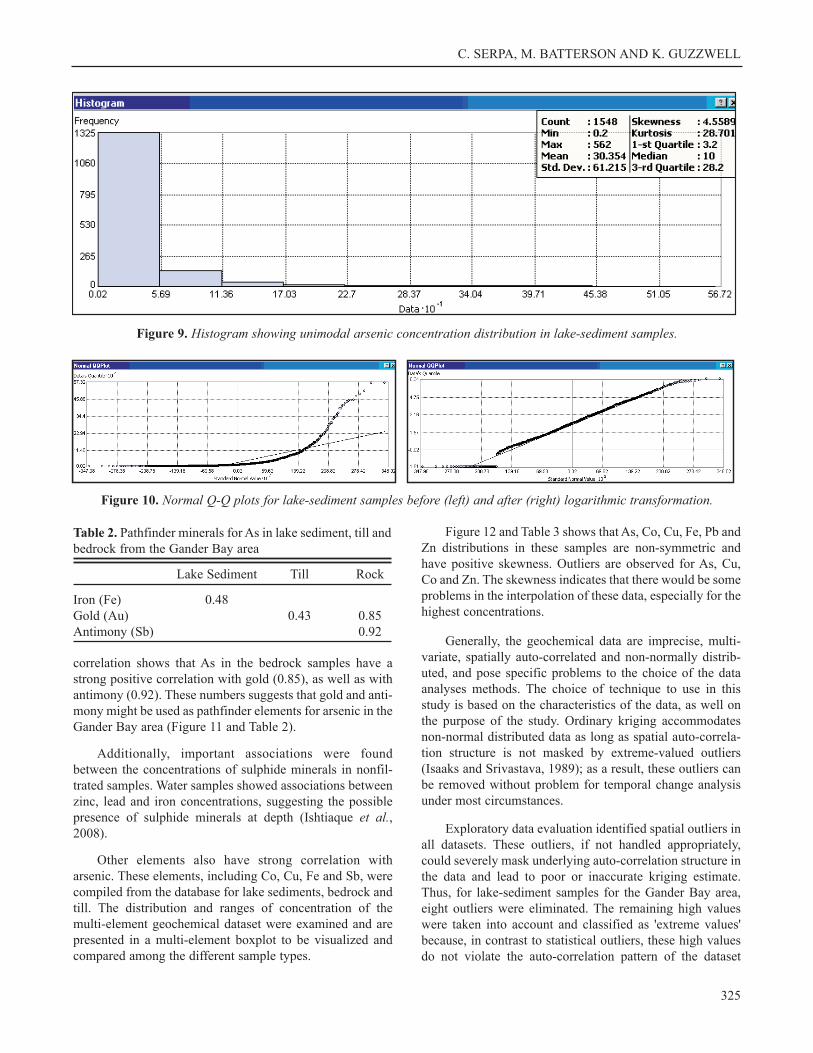
from which the relation (or lack of) between arsenic indrinking-water versus lake-sediment, bedrock and/or tillsamples is described. To examine the distribution of thearsenic data as a single element, histograms were created foreach one of the different type of samples. A histogram isused to graphically summarize and display the distributionof a process dataset. For example, the histogram for lake-sediments dataset from the Gander Bay area is shown below(Figure 9).
Figure 9 shows the graphical summary of the shape ofthe lake-sediment data distribution. Generally, arsenic con-centrations in lake-sediment, bedrock, till and groundwaterwell datasets were non-normally distributed and were posi-tively skewed with extreme values.
The Q-Q plots were produced for all datasets to explorewhat parts of the data can be poorly estimated; these plotsgraphically compare the distribution of a given variable tothe normal distribution (represented by the straight line).Figure 10 (left) shows that the highest arsenic values devi-ate from the normal model, tending to disappear; whereasFigure 10 (right) shows that transforming arsenic valueslogarithmically improves the fit at the high concentrationlevels, ensuring that the highest arsenic concentrationswould be equally considered.
A multi-element correlation matrix was calculated forall data. Table 2 shows a summary of selected elements. This
324
Figure 8. Location of groundwater-quality samples in the Gander Bay area. Results of the analyses indicate that most of thegroundwater samples exceed the Guidelines for Canadian Drinking Water Quality of 0.01 mg/L. Legend as in Figure 4.
Table 1. Summary statistics of available arsenic concentra-tion data (ppm = mg/L)
Type of #Samples Min Max MedianSample (ppm) (ppm) (ppm)Groundwater 116 0.00 0.239 0.01Lake sed. 1555 0.20 1550 10.00Till 1357 0.20 480 15.00Rock 350 0.00 119000 3.00
C. SERPA, M. BATTERSON AND K. GUZZWELL
correlation shows that As in the bedrock samples have astrong positive correlation with gold (0.85), as well as withantimony (0.92). These numbers suggests that gold and anti-mony might be used as pathfinder elements for arsenic in theGander Bay area (Figure 11 and Table 2).
Additionally, important associations were foundbetween the concentrations of sulphide minerals in nonfil-trated samples. Water samples showed associations betweenzinc, lead and iron concentrations, suggesting the possiblepresence of sulphide minerals at depth (Ishtiaque et al.,2008).
Other elements also have strong correlation witharsenic. These elements, including Co, Cu, Fe and Sb, werecompiled from the database for lake sediments, bedrock andtill. The distribution and ranges of concentration of themulti-element geochemical dataset were examined and arepresented in a multi-element boxplot to be visualized andcompared among the different sample types.
Figure 12 and Table 3 shows that As, Co, Cu, Fe, Pb andZn distributions in these samples are non-symmetric andhave positive skewness. Outliers are observed for As, Cu,Co and Zn. The skewness indicates that there would be someproblems in the interpolation of these data, especially for thehighest concentrations.
Generally, the geochemical data are imprecise, multi-variate, spatially auto-correlated and non-normally distrib-uted, and pose specific problems to the choice of the dataanalyses methods. The choice of technique to use in thisstudy is based on the characteristics of the data, as well onthe purpose of the study. Ordinary kriging accommodatesnon-normal distributed data as long as spatial auto-correla-tion structure is not masked by extreme-valued outliers(Isaaks and Srivastava, 1989); as a result, these outliers canbe removed without problem for temporal change analysisunder most circumstances.
Exploratory data evaluation identified spatial outliers inall datasets. These outliers, if not handled appropriately,could severely mask underlying auto-correlation structure inthe data and lead to poor or inaccurate kriging estimate.Thus, for lake-sediment samples for the Gander Bay area,eight outliers were eliminated. The remaining high valueswere taken into account and classified as 'extreme values'because, in contrast to statistical outliers, these high valuesdo not violate the auto-correlation pattern of the dataset
325
Figure 10. Normal Q-Q plots for lake-sediment samples before (left) and after (right) logarithmic transformation.
Figure 9. Histogram showing unimodal arsenic concentration distribution in lake-sediment samples.
Table 2. Pathfinder minerals for As in lake sediment, till andbedrock from the Gander Bay area
Lake Sediment Till Rock
Iron (Fe) 0.48Gold (Au) 0.43 0.85Antimony (Sb) 0.92

CURRENT RESEARCH, REPORT 09-1
326
Figure 11. Correlations between (a) Fe vs. Au (0.85) and (b) As vs. Sb (0.92) in bedrock samples from the Gander Bay area.
Figure 12. Multielement boxplot (As, Co, Cu, Fe, Pb and Zn) from rock, till and lake-sediment samples from the Gander Bayarea.
Table 3. Statistics of As, Co, Cu, Fe, Pb and Sb for 9346 lake-sediment samples in the Gander Bay area
1st 3rdn Min Quartile Median 95% CI Quartile Max IQR
As1_ppm 1556 0.20 3.20 10.00 8.90 to 11.00 28.658 1550.00 25.46Co1_ppm 1556 1.00 1.00 6.00 5.00 to 6.00 14.000 200.00 13.00Cu3_ppm 1561 1.00 8.00 13.00 12.00 to 13.00 20.000 351.00 12.00Fe3_pct 1556 0.05 0.75 1.60 1.50 to 1.70 3.600 36.00 2.85Pb3_ppm 1561 1.00 3.00 7.00 6.00 to 7.00 11.000 150.00 8.00Sb1_ppm 1556 25.00 25.00 25.00 25.00 to 25.00 54.000 580.00 29.00

C. SERPA, M. BATTERSON AND K. GUZZWELL
(Table 4). In fact, exploring the data using these extremevalues provided many clues to the development of bettermodels. For this case, a logarithmic transformation wascompleted to regulate these extreme values.
SPATIAL MAPPING
All mapping and geostatistical calculations were per-formed using ESRI Inc.'s ArcMap 9.2 GIS platform, ESRIInc.'s Geostatistical Analyst and Spatial Analyst extensions,and Excel Data Analysis.
Geostatistics have been applied in investigating andmapping soil contamination by heavy metals (Hooker andNathanail, 2006). The method facilitates quantification ofspatial features of minerals and enables its spatial interpola-tion within the environment, i.e., the variables are linked tolocations (Hinkle and Polette, 1999). Observations in spaceare linked to their co-ordinates and each observation has itsspecific place in space. Geostatistics are based on the theo-ry of a regionalized variable, which is distributed in spaceand shows spatial auto-correlation with the samples that areclosest in the space than those that are farther apart (Burn-ham and Anderson, 1998). This is carried out in three mainsteps (Kumi-Boateng, 2007):
- Exploring the dataset- Calculating the experimental variogram- Kriging interpolation and determination of a prob-
ability map taking into account values exceeding the MAC.
All statistical analysis in this study was performed oncategorical or rank-transformed data; these transformationsare not sensitive to differences in the concentrations depict-ed by the interpolation process versus actual values. Loga-rithmic transformation was performed to remove a second-order trend. Trend analysis was analyzed using the Geosta-tistical Analyst Tool of ArcMap software. Ordinary spheri-cal models were used and a neighbourhood search was usedwith preferably 5 neighbours, and a minimum of 2 for mostcases (Figure 13).
When using ordinary kriging (Welhan and Merrick,2004), there was no ability to account for anisotropy foralmost all interpolations. The search ranges were circular, sono weighting was given to any particular direction.Although not taking anisotropy into consideration providesthe best predictive surface (Cochran, 2004), anisotropy hadto be considered for till samples to improve the interpolationof the data from Gander Bay area.
Figure 14 shows the correlation between observed andpredicted values. The solid line shows a line of best fitthrought the scatter plot.
Results of these kriging interpolations can be seen inFigures 15, 16 and 17.
DISCUSSION
The data for arsenic concentrations in bedrock, lake-sediment and till were grouped according to bedrock lithol-ogy. The arsenic distribution map obtained from lake-sedi-ment samples shows that Fogo Island, Ladle Cove, AspenCove, and Gander Bay through to the area south of Glen-wood, and in the areas of Baytona up to the area north ofComfort Cove–Newstead all contain elevated concentra-tions of arsenic. These areas are mainly composed of sedi-mentary rocks from Davidsville, Gander and Botwoodgroups, and plutonic rocks from the Mount Peyton intrusivesuite and Fogo Batholith. Arsenic concentrations from tillsamples have better resolution. Elevated arsenic concentra-tions are localized in sedimentary and metasedimentaryrocks of the Davidsville and Gander groups, respectively.
Bedrock sample data covers only a small area (mostlythe area of the Mount Peyton Intrusive Suite), but the distri-bution map shows that elevated arsenic concentrations occurin, and south of, the Mount Peyton Intrusive Suite, and insedimentary rocks of the Davidsville and Botwood groups.
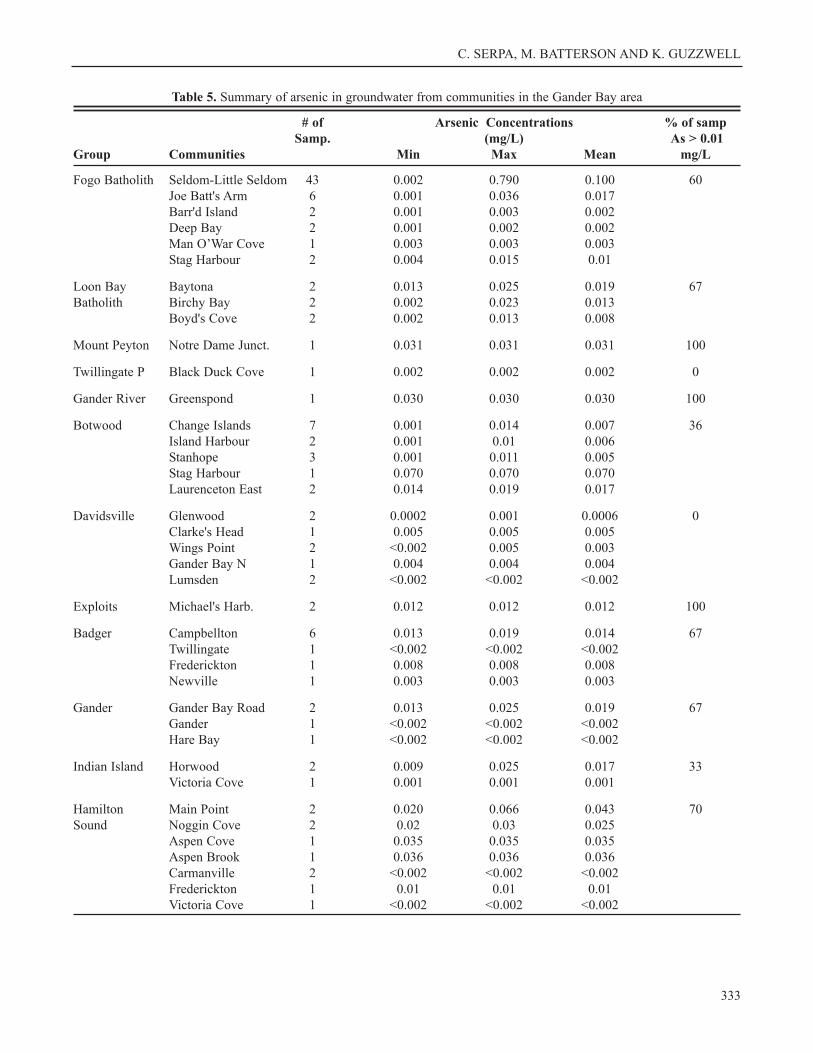
Arsenic data from groundwater samples were alsogrouped reflecting the bedrock lithology in which each wellwas located. The GIS and map analysis identified 12 lithos-tratigraphic units that were represented by groundwatersamples from the Botwood Group, Loon Bay Batholith,Davidsville Group, Fogo Batholith, Mount Peyton IntrusiveSuite, Twillingate Pluton, Gander River Complex, ExploitsGroup, Badger Group, Gander Group, Indian Island Groupand Hamilton Sound Group. The groundwater arsenic con-centrations had a distribution ranging from below the detec-tion limit to 0.790 mg/L over the Gander Bay area. The map-ping of groundwater arsenic concentrations indicates in gen-eral that arsenic concentrations tend to be more elevated inthe western part of the study area (Table 5).
Table 6 shows that the distribution of arsenic concen-trations in the Gander Bay area for till samples sorted by
327
Table 4. Statistics summary of arsenic concentrations insamples from the Gander Bay area after elimination of out-liers
Lake Sed Till Rock Gw(ppm) (ppm) (ppm) (ppm)
# of Samples 1447 1351 335 53Mean 17.32 24.70 6.67 0.022Median 8.60 15.00 3.00 0.013Min 0.20 0.20 0.00 0.00021st Q 2.90 9.50 2.00 0.0032nd Q 8.60 15.00 3.00 0.0133rd Q 22.80 27.80 6.00 0.030Max 98.60 217.00 83.00 0.239

CURRENT RESEARCH, REPORT 09-1
lithology; the samples show greater median and meanarsenic concentrations in sedimentary rocks relative to theother bedrock groups in that area.
The apparent relationship of arsenic occurrence tolithology shown by the arsenic distribution maps was con-firmed with the statistical contingency table (Robinson and
328
Figure 13. (a) A second-order polynomial trend given by the U-shaped curve projected on the x and y walls; (b) semi-vari-ogram showing the best model for till samples in the Gander Bay area.
Figure 14. Cross-validation table depicting scatter of points that shows the correlation between observed and predicted val-ues. The solid line shows a line of best fit through the scatter plot.

C. SERPA, M. BATTERSON AND K. GUZZWELL
329
Figure 15. (a) As distribution (kriging interpolation) in lake-sediment samples in the Gander Bay area, and (b) As distribu-tion overlying bedrock geology map.

CURRENT RESEARCH, REPORT 09-1
330
Figure 16. (a) As distribution (kriging interpolation) in till samples in the Gander Bay area, and (b) As distribution overlainon the bedrock geology.

C. SERPA, M. BATTERSON AND K. GUZZWELL
331
Figure 17. (a) As distribution (kriging interpolation) in rock samples in the Gander Bay area, and (b) As distribution over-lain on bedrock geology map.

CURRENT RESEARCH, REPORT 09-1
Ayotte, 2006) that records and analyzes the relationshipbetween the variables (igneous, sedimentary and metamor-phic rocks). The mapping of the different bedrock types ofGander Bay area showed that the probability of elevatedarsenic concentrations is higher in sedimentary bedrocktypes than in the igneous rocks. However, according to thegroundwater well data, groundwater well supplies havingelevated arsenic concentrations are found in plutonic rocks(Table 6; Bright, 2006; Sullivan, 2007). Therefore, it can beimplied that not only does the bedrock contribute to the ele-vated arsenic concentrations in the Gander Bay area, butmineralization also appears to play a very important role.
Table 2 indicates that pathfinders in bedrock for As inthe Gander Bay area are mainly gold and antimony. Arsenicis a by-product of mining for arsenopyrite, copper and/orgold. Gold and copper occurrences are widely found in cen-tral Newfoundland (Figure 3), and are also associated witharsenopyrite. These occurrences are mainly associated withvolcanic terranes of the Cambro-Ordovician ophiolitic rocksof the Dunnage Zone and Cambro-Ordovician metasedi-mentary rocks of the Gander Zone. The ores are groupedinto ophiolitic volcanic-hosted and arc volcanic-hostedenvironments of the Dunnage Zone and associated with rel-atively deeply formed late orogenic quartz veins and lowsulphidation epithermal deposits in the Gander Zone. Anti-mony occurrence in the Gander Bay area takes place inmonomineralic veins and carbonate or quartz-carbonate-bearing vugs, and also shows textures of a low sulphidationepithermal environment (Squires, 2005) throughout thisarea.
ARSENIC CONTAMINATION MAP
A statistical model has been developed to predict theprobability of elevated arsenic concentrations in drinking-water wells in bedrock by geographic area in the GanderBay area (Figure 18). For drinking-water purposes, a 'safe'threshold is defined by the Health Canada maximum accept-able concentration at 0.010 mg/L. This value was used forthe arsenic occurrence map and was based on the spatial dis-tribution map using Ordinary Kriging: Probability Map. Theraw dataset was classified into two parts (i.e., high and low).Higher values are indicated by the darker colour, with thenumber 1 representing 100% probability of finding arsenicconcentrations greater than 0.010 mg/L. Lower values areindicated by a lighter colour, with 0 corresponding to the 0%probability of finding elevated arsenic concentrations.
The probability map also shows a strong correlationbetween elevated arsenic concentrations in groundwaterwells, and copper and gold occurrences (Figure 18). Thiscan be explained because arsenic, in its most recoverableform, is found in various types of metalliferous minerals
(Mandal and Suzuki, 2002), such as pyrite and chalcopyrite(arsenical-pyritic-copper deposits), and arsenopyrite, realgarand orpiment (arsenic sulphide and arsenic-sulphide golddeposits). Pyrite, chalcopyrite and arsenopyrite are by farthe most common ore and gangue minerals in the area. Thus,due to the lowering of the water table below the deposits,'pyrites' oxidized in the vadose zone release arsenic asarsenic adsorbed on iron hydroxide (Madhaven and Subra-manium, 2000). During the subsequent recharge period, ironhydroxide releases arsenic into the groundwater (Fazal andKawachi, 2001).
CONCLUSIONS
Groundwater wells located in the Silurian and Devon-ian granite and gabbro intrusions have the highest arsenicconcentrations. However, arsenic levels that have elevatedconcentrations were also found in till- and lake-sedimentsamples overlying sedimentary bedrock. In lake sediments,when arsenic is exposed to water and soil, it moves down-hill into bodies of water. As the arsenic collects on the floorof the bodies of water, it would be trapped in the sedimentsand would eventually become part of the sedimentarysequence, while in till, glacial erosion and dispersal trans-port arsenic-rich sediment from its source in bedrock toareas that are underlain by bedrock with low arsenic con-centrations. Thus, a combination of bedrock geology (Peterset al., 2006) and surficial and chemical process are respon-sible for elevated arsenic concentrations within the GanderBay area. Since igneous rocks come from deep under-ground, they are mostly unaffected by variation in arseniclevels on the surface.
Table 7 indicates that elevated arsenic contaminationwas found in mafic plutonic rocks associated with alkalinewaters (ph greater than 7). Also, gold and copper deposits inthe Gander Bay area commonly occur in close associationwith sulphide mineralization especially pyrite, arsenopyriteand chalcopyrite (O'Driscoll and Wilton, 2005). Moreover,water samples show associations between zinc, lead andiron concentrations, confirming the presence of a sulphidemineralization at depth. Thus, groundwater in the gold-cop-per belt zone of the area is potentially vulnerable to the pres-ence of elevated concentrations of dissolved arsenic as aresult of the oxidation of the sulphide minerals. Further-more, deposits of arsenic were found in the study area, suchas Foot Pond, Brink's Pond and Rat Pond Southeast.Groundwater flowing through these deposits can dissolvearsenic from the minerals and thus increase arsenic concen-tration in the well water.
RECOMMENDATIONS
The results of this project have provided a clearer
332
C. SERPA, M. BATTERSON AND K. GUZZWELL
333
Table 5. Summary of arsenic in groundwater from communities in the Gander Bay area
# of Arsenic Concentrations % of sampSamp. (mg/L) As > 0.01
Group Communities Min Max Mean mg/L
Fogo Batholith Seldom-Little Seldom 43 0.002 0.790 0.100 60Joe Batt's Arm 6 0.001 0.036 0.017Barr'd Island 2 0.001 0.003 0.002Deep Bay 2 0.001 0.002 0.002Man O’War Cove 1 0.003 0.003 0.003Stag Harbour 2 0.004 0.015 0.01
Loon Bay Baytona 2 0.013 0.025 0.019 67Batholith Birchy Bay 2 0.002 0.023 0.013
Boyd's Cove 2 0.002 0.013 0.008
Mount Peyton Notre Dame Junct. 1 0.031 0.031 0.031 100
Twillingate P Black Duck Cove 1 0.002 0.002 0.002 0
Gander River Greenspond 1 0.030 0.030 0.030 100
Botwood Change Islands 7 0.001 0.014 0.007 36Island Harbour 2 0.001 0.01 0.006Stanhope 3 0.001 0.011 0.005Stag Harbour 1 0.070 0.070 0.070Laurenceton East 2 0.014 0.019 0.017
Davidsville Glenwood 2 0.0002 0.001 0.0006 0Clarke's Head 1 0.005 0.005 0.005Wings Point 2 <0.002 0.005 0.003Gander Bay N 1 0.004 0.004 0.004Lumsden 2 <0.002 <0.002 <0.002
Exploits Michael's Harb. 2 0.012 0.012 0.012 100
Badger Campbellton 6 0.013 0.019 0.014 67Twillingate 1 <0.002 <0.002 <0.002Frederickton 1 0.008 0.008 0.008Newville 1 0.003 0.003 0.003
Gander Gander Bay Road 2 0.013 0.025 0.019 67Gander 1 <0.002 <0.002 <0.002Hare Bay 1 <0.002 <0.002 <0.002
Indian Island Horwood 2 0.009 0.025 0.017 33Victoria Cove 1 0.001 0.001 0.001
Hamilton Main Point 2 0.020 0.066 0.043 70Sound Noggin Cove 2 0.02 0.03 0.025
Aspen Cove 1 0.035 0.035 0.035Aspen Brook 1 0.036 0.036 0.036Carmanville 2 <0.002 <0.002 <0.002Frederickton 1 0.01 0.01 0.01Victoria Cove 1 <0.002 <0.002 <0.002

CURRENT RESEARCH, REPORT 09-1
understanding of the causes for there being elevated arsenicconcentrations in groundwater in the Gander Bay, Fogo andBonavista north area. Hypotheses have been offered to sat-isfactorily explain the observed patterns of elevated arsenicconcentrations. In any future ongoing studies, it is recom-mended that both, soil and vegetation samples be collectedand analyzed for arsenic in order to examine any biologicalactivity that may be influencing arsenic mobilization fromsediment to water. Unfortunately, no biogeochemical exper-
iments were performed during this study to directly supportthis hypothesis.
To safeguard Newfoundland's public and privategroundwater supplies, future work should entail additionalcomprehensive studies of other elements, such as uranium,fluoride, lead, copper, zinc, and iron, which can pose ahealth risk. Elevated concentrations of uranium and fluoridealready have been detected in some Newfoundland commu-
334
Table 6. Summary statistics for bedrock arsenic data grouped by lithology; concentration units are in ppm
RocksIgneous Sedimentary Metamorphic
Sample Intrusive VolcanicType Mean Median Mean Median Mean Median Mean Median
Lake Sed. 17.06 7.00 10.08 4.50 19.28 11.00 17.23 9.00Till 12.89 9.00 22.29 17.00 38.80 28.80Rock 8.31 3.00 2.60 0.00Gw 0.018 0.012 0.007 0.007 0.011 0.005
Figure 18. Arsenic probability map–Mineral Occurrence.

C. SERPA, M. BATTERSON AND K. GUZZWELL
nities through well-water testing of public and randomlyselected private water supplies.
REFERENCES
Banglapedia: National Encyclopedia of Bangladesh2006: http://www.banglapedia.org/english/index.htm
Batterson, M.J. and Taylor, D.M. 2001: Till geochemistry of the Bonavista Peninsula areaNewfoundland and Labrador. Geological Survey, OpenFile NFLD/2734, 100 pages.
Batterson, M.J., Taylor, D.M. and Davenport, P.H.1998: Till geochemistry of the Grand Falls – MountPeyton area. Government of Newfoundland andLabrador, Department of Mines and Energy, GeologicalSurvey, Open File NFLD/2664, [Map 98-09 to 98-55]155 pages.
Bell, K., Cohen, J., Foster, S., Hack, E., Iwamiya, R., Kacz-ka, D., Koplos, J., Letkiewicz, F., Schulman, A., Smith, B.and Wu, J.
2000: Arsenic occurrence in public drinking water sup-plies. United States, Environmental Protection Agency,Office of Ground Water and Drinking Water(OGWDW) and by The Cadmus Group, 156 pages.
Blackwood, R.F.1982: Geology of Gander Lake (2D/15) and GanderRiver (2E/2) area. Newfoundland Department of Minesand Energy, Mineral Development Division, Report 82-4, 56 pages.
Bright, K.S.2006: Ultramafic bedrock source of arsenic in privatewells, Stowe, Vermont. Unpublished senior thesis, Mid-dlebury College, Middlebury, VT. The report is avail-able on-line at: middlebury.edu/NR/rdonlyres/.../0/Bright06Thesis.pdf
Burnham, K.P. and Anderson, D.R.1998: Model selection and inference: a practical infor-mation theoretic approach. Through Google Books:http://books.google.com/books?id=BQYR6js0CC8C&dq=Model+selection+and+inference:+a+practical+inf
ormation+theoretic&printsec=frontcover&source=bl&ots=i85Uneh8Zz&sig=1v6Sjy0V8V63yDpaXuw_Efunzhs&hl=en&sa=X&oi=book_result&resnum=3&ct=result
Cochran, I.2004: Determining a useful interpolation method forsurficial sediments in the Gulf of Maine. Students GISterm project, Colby College, Department of Geology,Maine, 11 pages.
Colman-Sadd, S.P.1980: Geology of south-central Newfoundland and evo-lution of the eastern margin of Iapetus. American Jour-nal of Science, Volume 280, 33 pages.
Colman-Sadd, S.P. and Crisby-Whittle, L.V.J.2002: Partial bedrock geology dataset of the Island ofNewdoundland (NTS area 02E and 02D). Newfound-land and Labrador Department of Mines and Energy,Open File NFLD/2616.
Colman-Sadd, S.P., Hayes, J.P. and Knight, I.K.1990: Geology of the Island of Newfoundland. New-foundland Department of Mines and Energy, Geologi-cal Survey Branch, Map 90-1.
Currie, L., Williams, H. and Piasecki, M.A.J.1997: Geology, Gander River-Gander Bay region,Newfoundland. Geological Survey of Canada, OpenFile 3467.
Davenport, P.H, Nolan, L.W. and Honarvar, P1994: Geochemical Atlas: The distribution of arsenic(As) in lake sediment, Island of Newfoundland. Depart-ment of Natural Resources, Geological Survey Map93–130 (a part of Open File NFLD/2355).
Dickson, W.L.1993: Geology of the Mount Peyton area (NTS/2D14),central Newfoundland. In Current Research. New-foundland and Labrador Department of NaturalResources, Geological Survey, Report 93-1, pages 209-220.
2006: The Silurian Indian Island Group and its relationto adjacent units. In Current Research. Newfoundlandand Labrador Department of Natural Resources, Geo-logical Survey, Report 06-1, pages 1-24.
Fazal, A. and Kawachi, T.2001: Validity of the latest research findings on causesof groundwater arsenic contamination in Bangladesh.International Water Resources Association, Water Inter-national, Volume 26, No. 2, pages 380-389.
335
Table 7. Summary statistics for As content in felsic andmafic intrusive rocks
N. of Samples Mean Median(ppm) (ppm)
Intrusive Felsic 19 0.009 0.007Intrusive Mafic 46 0.04 0.03

CURRENT RESEARCH, REPORT 09-1
Health Canada1996: Federal-Provincial-Territorial Committee onHealth and the Environment Guidelines for CanadianDrinking Water Quality, Sixth Edition.
2006: Guidelines for Canadian Drinking Water Quality.
Hinkle, S.R. and Polette, D.J.1999: Arsenic in ground water of the Willamette Basin,Oregon. U.S. Department of the Interior, U.S. Geologi-cal Survey, in cooperation with Oregon WaterResources Department, Water-Resources InvestigationsReport 98-4205, 34 pages.
Holm, T.R., Kelly, W.R, Wilson, S.D., Roadcap, G.S., Tal-bott, J.L. and Scott, J.W.
2004: Arsenic geochemistry and distribution in theMahomet Aquifer, Illinois. Waste Management andResearch Center, A Division of the Illinois Departmentof Natural Resources, 117 pages. The report is availableon-line at: http://www.wmrc.uiuc.edu/main_sections/info_services/library_docs/ RR/RR-107.pdf
Hooker, P.J. and Nathanail, C.P.2006: Risk-based characterisation of lead in urban soils.Chemical Geology, No. 226, pages 340-351.
Isaacs, E.H. and Srivastava, R.M.1989: Introduction to Applied Geostatistics. OxfordUniversity Press, New York.
Ishtiaque, A., Chowdhury, A. and Rahman, M.2008: Correlation of the co-occurrence of arsenic andiron in groundwater of Bangladesh. International Jour-nal of Applied Environmental Sciences, Volume 3, No.2, pages 119-124.
Kumi-Boateng, B.2007: Assessing the spatial distribution of arsenic con-centration from goldmine for environmental manage-ment at Obuasi, Ghana. International Institute for Geo-Information Science and Earth Observation Enschede,The Netherlands, 67 pages.
Liverman, D., Taylor, D., Sheppard, K. and Dickson, L.2000: Till geochemistry, Hodges Hill area, central New-foundland. Newfoundland and Labrador GeologicalSurvey, Open File NFLD/2704, 210 pages.
Madhavan, N. and Subramanian, V.2000: Sulphide mining as a source of arsenic in theenvironment. Current Science, Volume 78, No. 6, 42pages.
Mandal, B.K. and Suzuki, K.T.2002: Arsenic round the world: A review. Talanta, Vol-ume 58, Issue 1, pages 201-235.
O'Driscoll, J.M and Wilton, D.H.C.2005: Preliminary geochronology, geochemical andisotopic studies of auriferous systems in the BotwoodBasin and environs, central Newfoundland. In CurrentResearch. Newfoundland and Labrador Department ofNatural Resources, Geological Survey, Report 05-1,pages 207-222.
O'Neill, P. and Blackwood, F.1989: A proposal for revised stratigraphic nomenclatureof the Gander and Davidsville groups and the GanderRiver Ultrabasic Belt, of northeastern Newfoundland.In Current Research. Newfoundland Department ofMines, Geological Survey. Report 89-1, pages 127-130.
Papezik, V.S.1967: Native arsenic in Newfoundland. Canadian Min-eralogist, Volume 9, Part 1, pages 101-108.
Peters, S.C., Blum, J.D., Karagas, M.R., Chamberlain, C.P.and Sjostrom, D.J.
2006: Sources and exposure of the New Hampshirepopulation to arsenic in public and private drinkingwater supplies. Chemical Geology, Volume 228, pages72-84.
Peters, S.C. and Blum, J.D.2003: The source and transport of arsenic in a bedrockaquifer, New Hampshire, USA. Applied Geochemistry,Volume 18, No. 11, pages 1773-1787.
Rageh, O.M., Coles, C.A. and Lye, L.M.2007: Statistical analysis of Newfoundland drinkingwater sources containing arsenic. Memorial Universityof Newfoundland, Faculty of Engineering and AppliedScience, St. John's, Newfoundland, 5 pages.
Robinson, G.R. Jr. and Ayotte, J.D.2006: The influence of geology and land use on arsenicin stream sediments and ground waters in New Eng-land, USA. Applied Geochemistry, Volume 21, pages1482-1497.
2007: Rock-bound arsenic influences ground water andsediment chemistry throughout New England. Depart-ment of the Interior U.S. Geological Survey, Reston,Virginia. In Open-File Report, 18 pages.
336
C. SERPA, M. BATTERSON AND K. GUZZWELL
Safiudin, M and Karim, M.M2001: Groundwater arsenic contamination inBangladesh: Causes, effects and remediation. Proceed-ings of the 1st IEB International Conference and 7thAnnual. Institution of Engineers, Bangladesh, pages220-230.
Squires, G.C.2005: Gold and antimony occurrence of the ExploitsSubzone and Gander Zone: A review of recent discov-eries and their interpretation. In Current Research.Newfoundland and Labrador Department of NaturalResources, Geological Survey, Report 05-1, pages 223-237.
Spencer, J.2002: Natural occurrence of arsenic in southwestground water. Arizona Geological Survey, SouthwestHydrology, pages 14-15.
Sullivan, C.M.2007: Evaluation of a potential ultramafic source ofarsenic contamination in bedrock water wells in centralVermont. Unpublished senior thesis, Middlebury Col-
lege, Middlebury, V.T. The report is available on-line at:middlebury.edu/NR/rdonlyres/ . . . /0/Sull ivan07Thesis.pdf
Welch, A.H., Westjohn, D.B., Helsel, D.R. and Wanty, R.B.2000: Arsenic in groundwater of the United States:Occurrence and geochemistry. Ground Water, Volume38, No. 4, pages 589-604.
Welhan, J. and Merrick M.2004: Statewide network data analysis and kriging proj-ect, final report. Idaho Department of Water Resources,21 pages.
Williams, H., Colman-Sadd, S.P and Swinden, H.S.1988: Tectonic-stratigraphic subdivisions of centralNewfoundland. In Current Research, Part B. GeologicalSurvey of Canada, Paper 88-1B, pages 91-98.
Williams, H., Currie, K.L, and Piasecki, M.A.J.1993: The Dog Bay Line: a major Silurian tectonicboundary in northeast Newfoundland. Canadian Journalof Earth Sciences, Volume 30, pages 2481-2494.
337
