the industrial strategy green paper
TRANSCRIPT

Going Through the MotionsThe Industrial Strategy Green Paper
RUPERT DARWALL


Going Through the Motions


Going Through the Motions
The Industrial Strategy Green Paper
Rupert Darwall

iv
First Published June 2017
© Civitas 201755 Tufton Street
London SW1P 3QL
email: [email protected]
All rights reserved
ISBN 978-1-906837-88-4
Independence: Civitas: Institute for the Study of Civil Society is a registered educational charity (No. 1085494)
and a company limited by guarantee (No. 04023541). Civitas is financed from a variety of private sources to
avoid over-reliance on any single or small group of donors.
All publications are independently refereed. All the Institute’s publications seek to further its objective of promoting the advancement of learning. The views
expressed are those of the authors, not of the Institute.
Typeset byTypetechnique
Printed in Great Britain by4edge Limited, Essex

v
Contents
Author vi
Foreword by David G. Green vii
Summary xvii
1. What is strategy? 1
2. What is industrial strategy? 5
3. Industrial policy in the 1980s 7
4. The aspiration 11
5. Productivity and regional disparities 18
6. Infrastructure spending 22
7. M is for manufacturing 28
8. E is for energy 33
9. Decarbonisation or re-industrialisation? 40
10. Errors and omissions 45
11. The Brexit opportunity 48
12. Strategy and leadership 51
Notes 55

vi
Author
Rupert Darwall is a strategy consultant and policy analyst. After reading economics and history at Cambridge University, he worked in finance as an investment analyst and in corporate finance before becoming a special adviser to the then Chancellor of the Exchequer, Norman Lamont. He has written extensively for publications on both sides of the Atlantic, including the Wall Street Journal, National Review, the Daily Telegraph and The Spectator and is the author of the widely-praised The Age of Global Warming: A History (2013). He has written reports on UK energy policy for Reform (‘How to Run a Country: Energy Policy and the Return of the State’, Nov 2014) and the Centre for Policy Studies (‘Central Planning with Market Features: How renewable subsidies destroyed the UK electricity market’, March 2015) as well as an analysis for the Centre for Policy Studies on reforming tax credits (‘A better way to help the low paid: US lessons for the UK tax credit system’, 2006).

vii
Foreword
When Adam Smith explained his aim in writing the Wealth of Nations, he said it was to help the government discover how it could enable its people to provide a ‘plentiful subsistence’ for themselves. He understood that a government could not create prosperity on its own but that it could make a big difference to everyone’s chances of success.
To succeed in world markets companies need competitive advantages. Some are the result of their own skill and inventiveness, but many are created by the government and some can only be created by the government. For this reason, it makes sense to look at potential public policies under two headings: competitive advantages the government alone can create and additional useful government measures in support of enterprise.
Despite its obvious good intentions, the Government’s plans so far fail on both counts. It has not created all the competitive advantages that are its unique province, notably a favourable exchange rate, and its other support programmes fall a long way short of those provided by the most successful overseas governments. Most seriously of all, even on the least demanding of all tests – ‘do no harm’ – the green paper fails miserably to propose how energy policy could keep prices below those faced by our competitors.

viii
Competitive advantages that the Government alone can create
The most obvious such advantages are an honest civil service, independent courts, and accountable, democratic government, but also vital are low taxes, sound money, and a stable and competitive exchange rate.
An exchange rate that reflects the flow of imports and exports
The exchange rate has been ignored for decades, but an over-valued currency can eliminate all the efforts of companies to reduce prices by improving their productivity. The eurozone is our biggest export market and the European Central Bank is currently manipulating its exchange rate downwards. After Brexit the pound fell against the euro, a move reinforced by the Bank of England’s decision to cut bank rate, but the Government should pursue a strategy to ensure a continuing competitive rate. We have a large trade deficit with the EU and we are entitled to ensure that the exchange rate stays low to restore balance. The IMF has regularly reported for several years that the pound is over-valued, which not only puts exporters at a disadvantage but weakens home producers who face competition from importers. The IMF reported in June 2016, before the referendum, that the pound was over-valued by at least 12%. Even after recent falls against the dollar and the euro, the pound is still over-valued.
One approach would be to widen the goals of monetary policy. The American equivalent of our Monetary Policy Committee is charged with maximising employment as well as keeping inflation low. One approach would be to declare three overlapping policy goals: low inflation, maximum employment consistent with low inflation, and to prevent
GOING THROUGH THE MOTIONS

ix
FOREWORD
the exchange rate from being over-valued according to independent measures such as the World Bank’s Real Effective Exchange Rate (REER). Each goal is intimately related to the others, but the balanced pursuit of all three would be more consistent with the inclusive raising of prosperity than the current strategy, which relies chiefly on inflation targeting.
Making full use of the WTO
When we resume membership of the World Trade Organisation (WTO) in our own right, we should make full use of our powers to uphold competition. As it happens its rules have been shrewdly chosen. The basic principle is that import tariffs on goods should apply equally to all other countries unless there is a regional trade agreement or a customs union. Three exceptions are accepted: dumping, subsidies, and safeguarding a domestic industry. In the latter case a threatened industry can take measures for up to four years, extendable to eight. The underlying idea is to give a respite to a threatened industry to give it time to adjust to international competition. In the Thatcher years several sectors benefited from what could be called respite protection, including cars and steel.
Today there is a special problem of China dumping products on world markets. America makes constant use of its rights to retaliate against foreign subsidies and dumping. Within WTO rules, it recently added tariffs adding up to over 500% to Chinese cold-rolled steel, the kind used in car manufacture. We have given up our right to use WTO powers to the EU, but to make matters worse within the EU we have argued against making full use of our rights. To take no action is to uphold protection by China and other nations and to allow concealed subsidies to prevail over genuine competition.
x
GOING THROUGH THE MOTIONS
At present free market utopians argue that sectors such as steel are guilty of selfish protectionism because they seek to impose high prices on many other consumers for the benefit of the few. Sam Bowman of the Adam Smith Institute has argued: ‘If we bail out industries that are unprofitable in the long term, we’re locking capital and labour into unproductive work. If you bail out these firms, where do you stop? Basically you’d have given up on capitalism.’ But industries such as steel are not calling for protection from the results of their own inefficiency. They are calling for action against overseas protection. If the aim is to encourage labour and capital to find their most productive outlet, is that happening in China? The WTO has accepted that China sells overseas at below the cost of production, something it can do because its companies are largely state owned and its banks are state dominated. Moreover, there is no free bargaining for wages. This is not a fair fight to discover who is the most efficient producer of steel.
Ensuring that takeovers are in the international public interest
Mergers and acquisitions are not necessarily beneficial, even for shareholders. For example, a good case can be made for preventing foreign investment when a foreign company plans to take over a domestic rival, close it down, and thereby reduce competition. There have been beneficial foreign takeovers in recent years. The takeover of Jaguar Land Rover by Tata, for example, has been followed by significant new investment in the company. In other cases, the motive of investors was to weaken competition from a British rival or to strengthen monopoly. For example, the French company Alstom took over British train builder Metro-Cammell in 1989, completed its main contract, and shut the factory in 2005.
xi
FOREWORD
Some critics say that the national interest can’t be defined and fear that the government is about to adopt ‘nativist protectionism’. But the issue is not about nationality as such. Proposed foreign takeovers should all be referred to a competition regulator to ensure that the outcome will not reduce worldwide competition. Until the 2002 Enterprise Act the Secretary of State could intervene to prevent actions detrimental to the interests of consumers. This general ‘public interest’ test should never have been abolished and should be reinstated.
As guardian of our own national interest and the international community’s public interest, Parliament is entitled to ask whether or not specific investments are likely to increase or reduce competition. And it is entitled to ask whether sectors should be declared of strategic importance and protected from foreign takeover. We should be especially wary of allowing foreign governments to buy companies. Our ability to defend freedom and democracy throughout the world could be compromised, a danger that applies especially to takeovers by authoritarian regimes such as China.
Useful measures to create competitive advantages
Low-cost energy
The first challenge in creating favourable conditions for enterprise is to recognise that energy policy since 2008 has made matters worse. Carbon reduction often destroys jobs and a successful industrial strategy will have to choose jobs over carbon reduction. Mrs May has said that she wants an energy policy that ‘emphasises the reliability of supply and lower costs for users’.

GOING THROUGH THE MOTIONS
xii
The problem is that job creation, raising productivity and encouraging higher wages clash with carbon reduction. After the 2008 Climate Change Act, the Government’s climate-change policies have added to the cost of electricity and destroyed thousands of high-paid jobs. The UK Government has been repeatedly told by many business leaders that its energy policy adds to the cost of energy and puts some of our leading industries at a competitive disadvantage. The Government has been warned by the chemicals industry, ceramics, paper, steel, aluminium, and others. Together they employ over 200,000 people. The strategy has been to encourage lower energy use by forcing the price above the market rate, not least by means of the carbon price floor. This policy has contributed to the decline of the steel industry, the closure of the only two aluminium smelters in England and pushed investment in chemicals outside the UK. In the latter case the policy is especially perverse because the industry makes products, such as insulating materials, that the government wants to use to improve energy efficiency. Nevertheless the green paper intends to continue the decarbonisation strategy, deluding itself that it will generate future jobs.
Worse still, the unilateral imposition of higher energy costs is a hidden destroyer of enterprise. Fearing higher costs in the future, companies stop investing in Britain. Major closures are reported by the media but decisions to invest overseas instead of in Britain are taken in the privacy of boardrooms. We experience the results later in low growth and fewer jobs.
It is true that Germany, our main European rival, has also adopted a costly energy policy but it compensates its industries so that they pay about half as much for electricity as British companies. There is a compensation scheme in

xiii
FOREWORD
the UK but it is too small and leaves our manufacturers at a competitive disadvantage.
Three main policies could be adopted immediately: scrap the carbon price floor; encourage fracking; and develop nuclear power by building small modular reactors (SMRs).
Encourage banks to support enterprise
German local savings banks (Sparkassen) hold about 40% of all customer deposits and provide about 40% of all business loans. Sparkassen typically operate within the boundaries of a local council and can’t lend outside. During the 2008 recession they increased loans to business while the big international banks cut them. The significance of local relationship banks is that people throughout the land have the power to make a difference, instead of pleading with London-based banks.
Losses are relatively low because customers are known by reputation. The USA also has numerous local banks that operate on similar lines to the Sparkassen, often confined to a federal state.
In the UK, we used to have similar institutions until the TSB was privatised in the 1980s. One bank, the Airdrie Savings Bank, stayed outside the TSB group and still exists today. It has eight branches and 60,000 customers. 80% of its loans go to local businesses. 35% are for 5 years or more. Good local knowledge has kept losses down, and under 2% of total lending was written off in 2010. Like the Sparkassen, the Airdrie Savings Bank increased lending during the recent crisis. Loans were up from £28m in 2006 to £36m in 2010. Local banks have the potential to transform local economic prospects and would emerge with only a little encouragement from the Government.

GOING THROUGH THE MOTIONS
xiv
Reform corporation tax to promote investment in productive enterprise
We urgently need to rebuild our productive capacity, but the Government has no plan to encourage a surge in private investment. Corporation tax is already being lowered, but the time has come to abolish capital allowances. Now that we are about to be independent we need a major strategy for reinvestment. From 1984 capital expenditure was treated less favourably than other business costs. Until that year 100% of investment in plant and machinery was a business expense that could be deducted from taxable profits, but it was replaced by a 25% per year deduction on the declining-balance. Since then the system has been subject to frequent revisions and the deduction rate is now 18% with a £200,000 annual allowance. A company investing, say, £500,000 can treat £200,000 as a business expense in year one, but the remaining £300,000 goes into a pool from which 18% can be deducted as a business expense in each successive year. The effect is to discourage capital investment, which should be treated like any other business cost. Companies will inevitably depreciate capital spending over a number of years but the rate at which they do so should be their decision alone.
Conclusions
As Rupert Darwall shows in this publication, the green paper on industrial strategy is an example of going through the motions of developing a strategy. It was a rush job put together by desk-bound analysts who know how to reproduce government statistics in attractive charts, even when they don’t add to our understanding of industrial policy for the obvious reason that they were collected with
xv
FOREWORD
a different purpose in mind. The discussion of the variation in productivity between regions is a good example of the desk-bound approach. Gross valued added (GVA) per hour of work comes out a bit higher in London than elsewhere. The researchers knew that high productivity organisations can be found in all regions, suggesting that ‘regional factors’ are not the most important cause of any variations, but then solemnly proceed as if the statistics tell us something useful.
In fact, the higher ‘gross value added’ of London is partly an artefact of the misleading way in which the performance of the financial services sector is measured. In 2010 Andrew Haldane, now chief economist at the Bank of England, showed how the figure was more ‘mirage than miracle’. About 40% of the gross valued added of the banking sector is measured by FISIM (or financial intermediation services indirectly measured). GVA is calculated by working out the difference between a ‘reference’ interest rate, which is the supposedly risk-free rate, and the actual rate that banks charge borrowers. The nominal GVA of banks rose at the fastest rate on record in the final quarter of 2008, just when the financial system collapsed, demonstrating how misleading the FISIM measure can be.
We will soon be independent and able to devise our own strategy for enterprise without getting permission from Brussels under the ‘state aid’ rules. There is plenty to like in the Government’s consultation document, but overall it is a gigantic missed opportunity.
David G. Green


xvii
Summary
The Government intends that a re-tooled industrial strategy will underpin Britain’s success as a global trading nation. As the UK looks to benefit from the opportunity afforded by Brexit, this paper benchmarks the Government’s January 2017 Building Our Industrial Strategy green paper against corporate strategy-making. After reviewing the key characteristics of successful corporate strategy, the paper argues that an industrial strategy is needed because all governments have industrial policies. A strong industrial strategy should prepare Britain for Brexit by providing a coherent framework for industrial policy and reduce the incidence of ad hoc interventions to ensure UK competitiveness, boost exports and attract more foreign investment.
Productivity
The green paper puts raising productivity as its principal goal. When allowance is made for Britain’s high employment rate, labour productivity is within range of other G7 nations other than outliers Germany and Italy. The real problem is the sharp fall in productivity in the 2007/8 recession and its subsequent failure to recover. A successful industrial strategy must analyse the causes of this and propose policies to address it.

GOING THROUGH THE MOTIONS
xviii
Regional disparities
Emphasising the productivity gap between London and the regions sets up an unattainable goal. It fails to recognise the achievements of regions that are performing relatively well, such as Scotland, the South East and the East of England, and highlight those that are not, notably Wales and Northern Ireland. Its focus on investment in infrastructure fails to incorporate lessons from Japan, which demonstrate the high toll that infrastructure spending has on economic performance.
Manufacturing
There is an economic case for policies that support manufacturing in terms of manufacturing’s GDP multipliers, but the green paper doesn’t make that one – or any one. Instead, the green paper offers the Government’s institutional support to any sector willing to do sector deals, a throw-back to the sectoral working parties of the Wilson-Callaghan industrial strategy in the 1970s.
Energy
Access to cheap energy would make British industry more competitive, yet at the moment, industry pays more for energy than any other European country. A free trade agreement with the United States would leave industry even more exposed as American energy costs are less than half those in the UK. One reason is UK utility regulation gives electricity utilities far higher returns on their infrastructure than in the US.
A bigger factor in Britain’s high energy costs is aggressive decarbonisation policy. These conflict with slowing down and reversing de-industrialisation, an aim that does not
xix
SUMMARY
feature in the green paper. There is a large question mark over the sustainability of Britain’s large trade deficit, but high energy costs are a major obstacle to a manufacturing-led re-balancing to reduce Britain’s historically large trade imbalances. Furthermore, the green paper does not examine the implications for meeting Britain’s carbon budgets from a re-balancing of the economy with a rise in manufacturing output and a reduction in trade imbalances.
Developing Britain’s energy resources
After London, Aberdeen has the UK’s highest output per head of any city-region thanks to North Sea oil. Developing Britain’s natural energy resources has the potential to drive regional wealth generation. Britain has vast coal reserves under the North Sea, potentially turning Tynemouth into the North East equivalent of Aberdeen. The Bowland-Howland shale formation, straddling the North West and South Yorkshire, contains more natural gas than the combined reserves of the largest two shale formations in the US.
The green paper writes out Britain’s chemicals industry from Britain’s industrial future. Yet shale provides a great fit with the chemicals sector as natural gas is both a source of cheap energy and a feedstock, a double benefit that is attracting hundreds of billions of dollars of new investment into the US chemicals sector.
Key recommendations
1. Set a goal for Britain to have the lowest cost energy in Europe.
2. Switch focus from value-destroying infrastructure spending to removing the barriers to re-industrialisation.

GOING THROUGH THE MOTIONS
xx
3. Develop Britain’s natural energy resources to spread wealth to the regions and lead the revival of the chemicals sector.
4. Abolish the £1.8bn carbon price floor which unilaterally raises Britain’s energy costs.
Brexit is not only an opportunity to re-orientate policy away from policies that drive up the cost of energy. It is a requirement for Britain to prosper as a global trading nation.
1
1What is strategy?
Strategy is hard. Businesses have corporate strategies but the businessman who was first head of Mrs Thatcher’s Policy Unit complained her government didn’t have a political strategy. Politics is fluid and opportunistic which militates against the disciplined approach and the willingness to think the unthinkable required for proper strategising. It involves translating an aspirational vision into strategic action; assessing competing scenarios and making hard choices. Doing X requires dropping Y, an approach inimical to business-as-usual politics which favours ‘all of the above’ policies to maximise transient political support. If the Government’s industrial strategy is to be more than a branding exercise, ministers should be able to answer the question: ‘What strategic choices are being made?’
Soon after he retired in 2013, Britain’s most successful manager was put through his paces by Harvard Business School. Analysis of a decade’s worth of player transfer data revealed Sir Alex Ferguson to have been a uniquely effective portfolio manager of talent. ‘He is strategic, rational and systematic.’1
‘What is strategy?’ is the title of a famous 1996 paper by the management guru Michael Porter. ‘The essence of strategy,’ Porter wrote ‘is choosing what not to do. Without

GOING THROUGH THE MOTIONS
2
trade-offs, there would be no need for choice and thus no need for strategy.’2 Porter drew a distinction between improving operational effectiveness – doing the same thing as now except doing it better – and strategy, and asked why so many companies failed to have a strategy.
The answer is that managers find strategy difficult, Porter found. ‘Caught up in the race for operational effectiveness, many managers simply do not understand the need to have a strategy.’3 According to Porter, organisational realities work against strategy. ‘Trade-offs are frightening, and making no choice is sometimes preferred to risking blame for a bad choice. Companies imitate one another in a type of herd behaviour, each assuming rivals know something they do not.’4
Strategy comes from the top. ‘You can’t ever lose control,’ Sir Alex says.5 According to Porter, it depends on leadership. ‘With so many forces at work against making choices and trade-offs in organisations, a clear intellectual framework to guide strategy is a necessary counterweight. Moreover, strong leaders willing to make choices are essential.’6 AG Lafley, former CEO of consumer giant P&G, also linked leadership with making strategic choices, pointing out that managers don’t like making them. ‘In my forty-plus years in business, I have found that most leaders do not like to make choices. They’d rather keep their options open. Choices force hands, pin them down, and generate an uncomfortable degree of personal risk.’7
Instead Lafley wanted his team at P&G to understand that ‘strategy is disciplined thinking that requires tough choices’.8 Together with his strategy consultant and co-author Roger Martin, Lafley’s Playing to Win: How Strategy Really Works (2013) set out how the two developed Porter’s insights and applied them to turning around P&G, in the

3
WHAT IS STRATEGY?
process gaining $100bn of market value. They set out five inter-related questions:
1. What is your winning aspiration? Answering this requires defining what success looks like.
2. Where will you play? As Lafley and Martin note, ‘choosing where to play explicitly involved choosing where not to play’,9 and warn that ‘the status quo – continuing on in locations and segments you’ve always been – is all too often an implicit, unexamined choice’.10
3. How will you win? Defining the business’s value proposition; its competitive advantage.
The last two are about execution:
4. What capabilities must be in place?
5. What management systems are required?
#1 and #2 are relevant questions in developing an industrial strategy. #3 is less so. Porter defined two generic ways for companies to win – cost leadership and product differentiation – choices companies, not countries, make. Attempts by governments to influence that choice by pursuing higher costs in an attempt to prevent a race to the bottom are likely to prove self-defeating, as cost is also important in product differentiation strategies. As Lafley and Martin put it,
In a successful differentiation strategy, the company offers products or services that are perceived to be distinctively more valuable to customers than are competitive offerings, and is able to do so with approximately the same cost structure that competitors use.11 (emphasis added)

GOING THROUGH THE MOTIONS
4
P&G’s high margin product lines still need a competitive cost base:
This meant providing unique value to consumers (through brand differentiation and innovative products). And it meant maintaining a cost position that would let P&G offer that value to the consumer at an attractive price and still make a healthy profit.12
An industrial strategy that does not help business improve their cost performance is likely to be a losing strategy.

5
2What is industrial strategy?
If defining a business strategy is conceptually hard, developing an industrial strategy (IS) is doubly hard.
‘There is no single, clear, and pervasive definition of strategy and even less consensus on how to build one. When a strategy succeeds, it seems like magic, unknowable and unexplainable in advance but obvious in retrospect.’ – Lafley and Martin, pp.2-3
On forming the Government, the Prime Minister created a massive new department with industrial strategy in its name and put Greg Clark, a PhD economist and former management consultant, to put the IS into the BEIS. This is a big ask of Whitehall – a test of capability (#4) and management systems (#5) to manage and deliver an industrial strategy.
In her foreword to the industrial strategy green paper, the Prime Minister set out three clear requirements that IS should meet:
• The vote to leave the European Union is a rejection of the status quo, the clear implication being continuity, business-as-usual policies would not suffice;
• It should go beyond creating the conditions for businesses to succeed and envisages a new, active role for government; and

GOING THROUGH THE MOTIONS
6
• The Prime Minister specifically highlighted the need to raise productivity.
The difficulty in defining what an industrial strategy should be is reflected in the first page of the green paper’s summary where we learn what it isn’t. It isn’t going to be a repeat of the 1970s with nationalised lame ducks, picking winners and poorly directed investment. ‘This is not about the Government directing the economy or determining the industries of the future from Whitehall,’ the green paper states.1
7
3Industrial policy in the 1980s
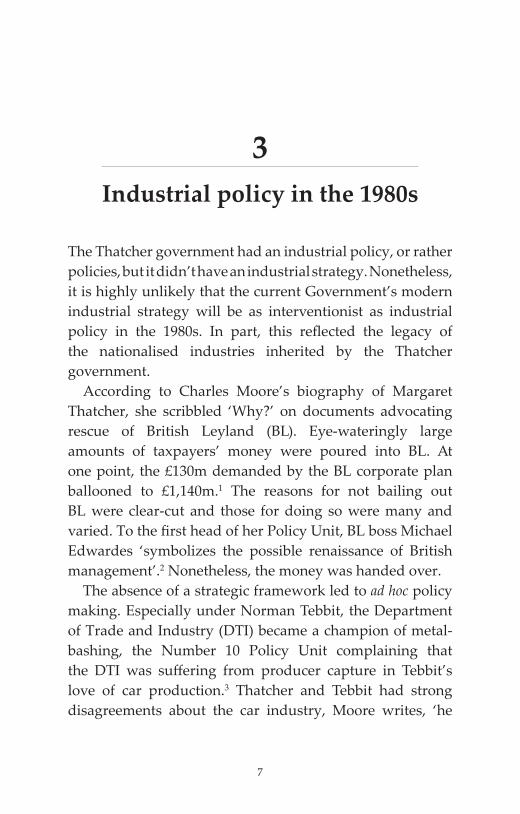
The Thatcher government had an industrial policy, or rather policies, but it didn’t have an industrial strategy. Nonetheless, it is highly unlikely that the current Government’s modern industrial strategy will be as interventionist as industrial policy in the 1980s. In part, this reflected the legacy of the nationalised industries inherited by the Thatcher government.
According to Charles Moore’s biography of Margaret Thatcher, she scribbled ‘Why?’ on documents advocating rescue of British Leyland (BL). Eye-wateringly large amounts of taxpayers’ money were poured into BL. At one point, the £130m demanded by the BL corporate plan ballooned to £1,140m.1 The reasons for not bailing out BL were clear-cut and those for doing so were many and varied. To the first head of her Policy Unit, BL boss Michael Edwardes ‘symbolizes the possible renaissance of British management’.2 Nonetheless, the money was handed over.
The absence of a strategic framework led to ad hoc policy making. Especially under Norman Tebbit, the Department of Trade and Industry (DTI) became a champion of metal-bashing, the Number 10 Policy Unit complaining that the DTI was suffering from producer capture in Tebbit’s love of car production.3 Thatcher and Tebbit had strong disagreements about the car industry, Moore writes, ‘he

GOING THROUGH THE MOTIONS
8
wanting a continuing British volume-car base and she thinking that ‘the only thing was to close the whole thing down and stop the money leaking’.4
The pro-automotive policy was extended from the lamest of lame ducks to Japanese car transplants. David Merlin-Jones has noted this first required ‘sweeteners’ to attract Japanese companies to Britain and, once here, to defending their output as British: ‘Thatcher re-orientated the priority of regional aid towards encouraging already highly equipped and technologically advanced companies like Nissan to settle and employ a workforce neglected by British companies.’5 When Nigel Lawson’s 1984 budget reduced the value of capital allowances used as sweeteners to get Nissan to Sunderland, the prime minister agreed personally to soothe the company’s feelings.6
Along with the automotive sector, aerospace was the other favoured industrial sector in the 1980s, a position the two maintain to this day. The Thatcher Foundation archive has copies of letters dating from 1983 between Tebbit and fellow ministers pressing for British launch aid for Airbus over Treasury objections. On the copy of a letter to the Foreign Secretary, the prime minister’s private secretary had written: ‘Mr Tebbit refuses to be rushed into a decision on launch aid for the A320’ – all underlined.7 Clearly there were major policy differences between ministers on the matter before they agreed to back the project.
In addition to carrots, the Thatcher government used sticks. So-called Voluntary Restraint Agreements (VRAs) covered nearly half of all Japanese exports to Britain. Although formally an advocate of free trade, in practice, policy was often protectionist. When the European Commission was working on ending all quota restrictions on Japanese exports, Britain leaned towards the hardline
9
INDUSTRY POLICY IN THE 1980s
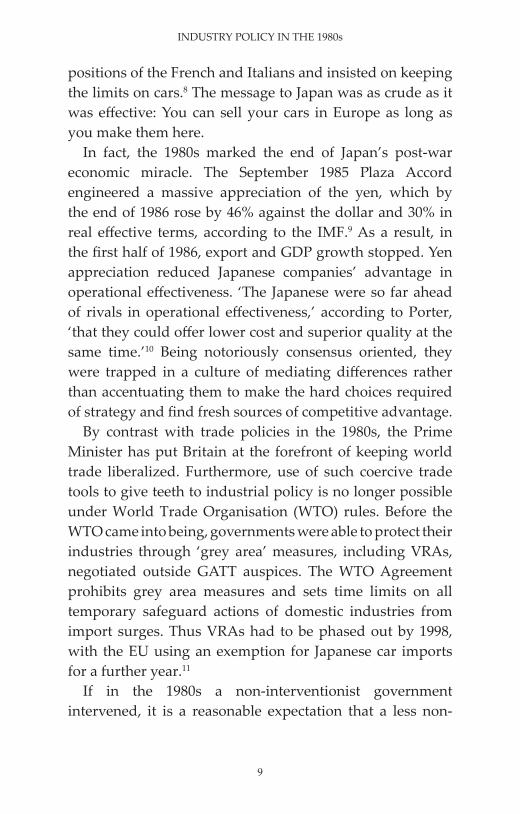
positions of the French and Italians and insisted on keeping the limits on cars.8 The message to Japan was as crude as it was effective: You can sell your cars in Europe as long as you make them here.
In fact, the 1980s marked the end of Japan’s post-war economic miracle. The September 1985 Plaza Accord engineered a massive appreciation of the yen, which by the end of 1986 rose by 46% against the dollar and 30% in real effective terms, according to the IMF.9 As a result, in the first half of 1986, export and GDP growth stopped. Yen appreciation reduced Japanese companies’ advantage in operational effectiveness. ‘The Japanese were so far ahead of rivals in operational effectiveness,’ according to Porter, ‘that they could offer lower cost and superior quality at the same time.’10 Being notoriously consensus oriented, they were trapped in a culture of mediating differences rather than accentuating them to make the hard choices required of strategy and find fresh sources of competitive advantage.
By contrast with trade policies in the 1980s, the Prime Minister has put Britain at the forefront of keeping world trade liberalized. Furthermore, use of such coercive trade tools to give teeth to industrial policy is no longer possible under World Trade Organisation (WTO) rules. Before the WTO came into being, governments were able to protect their industries through ‘grey area’ measures, including VRAs, negotiated outside GATT auspices. The WTO Agreement prohibits grey area measures and sets time limits on all temporary safeguard actions of domestic industries from import surges. Thus VRAs had to be phased out by 1998, with the EU using an exemption for Japanese car imports for a further year.11
If in the 1980s a non-interventionist government intervened, it is a reasonable expectation that a less non-

GOING THROUGH THE MOTIONS
10
interventionist one will do so. As Merlin-Jones puts it, ‘contrary to common belief, Thatcher and her ministers were not very laissez-faire in their industrial policy’.12
Strategy is about bringing coherence to the activities of a business and the policies of a government. According to Porter, the strategy of Southwest Airlines – the pioneer of the Low Cost Carrier model – involves a whole system of activities, not a collection of parts. ‘Its competitive advantage comes from the way its activities fit and reinforce one another.’13
‘The best strategies have mutually reinforcing choices at their heart.’ – Lafley and Martin, p.89
At a bare minimum, the virtue of having an industrial strategy is bringing coherence to industrial policy which it would otherwise lack. Thus a key function of an effective industrial strategy is to ensure that government interventions support rather than impede achievement of the strategy’s objective and gives ministers a clear framework for developing and prioritising policy. To do so, it must have the trio of characteristics that Sir Alex Ferguson brought to Manchester United. Above all, it must be systematic.

11
4The aspiration
The green paper defines its purpose. ‘We have to raise our productivity,’ the Prime Minister says in her foreword.1 Greg Clark defines the strategy’s objective: ‘To improve living standards and economic growth by increasing productivity and driving growth across the whole country.’2 The focus on the importance of productivity is correct, but the analysis is not thoroughly grounded.
Workers in America, France and Germany produce as much in four days as British workers do in five, giving the impression of a huge gap and unwarranted pessimism. The comparison with France in particular omits the impact of France’s much lower employment rate (63.6% in 2014Q3) than the UK’s (72.0%).3 As shown on the chart below comparing G-7 output per hour and employment rates, UK productivity is slightly less than Canada but 19.4% higher than Japan.
Draw a line between the US and Japan, and the UK is (just) to the right, the outliers being Germany (high employment rate and high productivity) and Italy, with OECD-average productivity and the lowest employment rate of the G-7. Recent work undertaken by the Office of National Statistics shows that the gap between the UK and the EU15 in GDP per capita closed somewhat as result of revisions to the Purchasing Power Parity weights.

GOING THROUGH THE MOTIONS
12
Figure 1: G7 labour output per hour and the employment rate (2014)
Britain’s problem is less the level of labour productivity compared to other countries than the failure of productivity to recover and grow after the 2007/8 recession. As shown in Figure 2 below, the UK suffered the sharpest fall (2.6%) in productivity in terms of GDP per hour worked. Germany, which saw a 2.4% contraction in GDP per hour, experienced a rapid productivity rebound. In the six years to 2015, GDP per hour worked rose by 7.3% in Germany. Over the same period, UK labour productivity rose by a 3.8%, an annualized rate of 0.62%.
Figure 2: GDP per hour worked (1990 = 100)
65
60
55
50
45
30
2455 60 65 70 75 80
Employment rate – 2014 Q3 (%)
Out
put
per
ho
ur –
201
4(U
SD
co
nsta
nt p
rice
s an
d P
PP
s)
France
Italy
US
Germany
Japan
G-7 average
OECD averageCanadaUK
+
+
100
110
120
130
140
150
160
100
110
120
130
140
150
160
1990
1991
1992
1993
1994
1995
1996
1997
1998
1999
2000
2001
2002
2003
2004
2005
2006
2007
2008
2009
2010
2011
2012
2013
2014
2015
Canada France Germany Italy Japan UK USA

13
THE ASPIRATION
This has had enormous consequences. According to a 2014 estimate by the Office for Budget Responsibility (OBR), in a high productivity scenario, public sector net debt would fall to 56.7% by 2019-20, while under a low productivity scenario, debt would rise to 86.6%.4 Income tax receipts have repeatedly fallen short of the OBR’s expectations because it assumed productivity growth would return to its historical average. ‘Understanding the cause of weak productivity growth... remains the most important uncertainty in our (and most people’s) forecasts,’ the OBR says.5
Yet the BEIS green paper features little analysis of the ‘productivity puzzle’ and provides fewer answers.
Successful strategy is grounded in thorough analysis of the problem being addressed. BEIS’s failure to systematically analyse the causes of the productivity slowdown reduces the likelihood of the resulting strategy achieving its objective. It is a strategy of groping in the dark.
For clues to the answer to Britain’s productivity puzzle, one has to look elsewhere. Annex A of the Treasury’s 2015 productivity white paper contains a brief but extremely valuable section on the productivity puzzle, ranking five factors that might be implicated. The first is that the financial crisis impaired resource allocation across the economy and cites a range of supporting evidence:
• It notes the slowdown in Total Factor Productivity (TFP), i.e., including the efficiency with which the economy uses capital as well as labour, which accounts for almost all the slow-down since 2008.
• A marked increase in the dispersion of rates of return on capital and a breakdown in the link between firms’ employment growth and relative productivity ranking.

GOING THROUGH THE MOTIONS
14
‘This implies that resources were less efficiently allocated across firms following the crisis and that successful firms have been less able to expand,’ the Treasury notes.6
• The proportion of employees who move from one employer to another each quarter (the churn rate) fell substantially in the aftermath of the crisis and remained low, averaging 28% less than it did in the five years to the crisis.
The evidence thus points to a marked slowing down of the circulation of capital and labour through the economy since the financial crisis. Low labour market churn rate suggests that this effect is wider than successful firms being unable to obtain finance to expand (i.e., the culprit being an impaired banking system). It is also unsuccessful ones being financed to remain in business.
Support for the Treasury’s impaired resource allocation thesis comes from a 2015 OECD study, The Future of Productivity:
The main source of the productivity slowdown is not so much a slowing of innovation by the most globally advanced firms, but rather a slowing of the pace at which innovations spread through the economy: a breakdown in the diffusion machine.7
The OECD notes the ‘cleansing’ effect on productivity-enhancing reallocation during typical recessionary episodes. Even though US productivity (measured in terms of GDP per hour worked) accelerated through the 2007/8 recession, the last recession in the US was less productivity-enhancing than previous episodes, the OECD says.8 That assessment is likely to be even more pertinent to the UK. In the two years from the 1992 trough of the early 1990s recession,

15
THE ASPIRATION
productivity grew at an average of 3.1% a year – five times faster than the productivity growth during the current recovery phase. If current trends are sustained, it will take ten years to accomplish what it took in just two years of recovery from the early 1990s recession.
The evidence presented in the Treasury productivity white paper and by the OECD suggests that the Great Recession and the counter-cyclical policies still in place have had the opposite to a cleansing effect in seriously impairing the allocative efficiency of the economy. In particular, this implies that the Bank of England’s policy of ultra-low interest rates is a factor in flat-lining productivity and the Government’s continuing difficulties in reducing the structural deficit and bringing borrowing under control.
Such a diagnosis runs counter to the current Keynesian consensus on macro-economic policy. Because decisions on interest rates have been out-sourced to the Bank’s Monetary Policy Committee, the Government is constrained in what it can say and do.
According to the OECD, future economic growth depends largely on ‘reviving the diffusion machine, which propelled productivity growth for much of the 20th century, most notably in manufacturing.’9 Doing so would not only accelerate productivity growth, but would also be likely to reduce income inequality, as recent evidence points to higher wage inequality reflecting the increased dispersion in average wages paid across firms. Raising the productivity of laggard firms via diffusion could, the OECD argues, ‘contain increases in wage inequality. Diffusion also reduces the cost and increases the quality and variety of goods and services, thereby raising real incomes.’10
The OECD study also highlights the importance of the age-profile of small firms. ‘A key message,’ the OECD

GOING THROUGH THE MOTIONS
16
says, ‘is that creative destruction and up-or-out dynamics are central: entry [i.e., small business start-up] matters but what happens next is crucial – all else equal, young firms should grow rapidly or exit [i.e., ‘up-or-out’] but not linger and become small-old firms.’11 A vibrant economy would see young firms either growing rapidly or exiting. The criticality of diffusion and the innovation borne by rapidly expanding start-ups imply policies that promote well-functioning product, labour and risk-capital markets and avoiding policies that trap resources in inefficient firms, the OECD says.12
By contrast, diffusion is mentioned only once by the BEIS in the industrial strategy green paper. This in the context of the Government’s willingness to enter into a sector deal (‘an open call to business to organize behind strong leadership … to address shared challenges and opportunities’).
The implication is that BEIS sees the principal channel through which new technology and good practice are diffused is companies collaborating in sector working parties rather than through competitive market mechanisms, as advocated by the OECD.13 Such a bureaucratic view of economic progress also biases policy toward established companies and against fast-growing young companies that are focused on innovation and the market and lack the resource to sit around tables debating sector strategies with competitors and the government.
Indeed, the sector-deal approach adopted by BEIS harks back to the sectoral working parties (SWPs) of the Wilson government’s 1975 An Approach to industrial strategy white paper, which described its approach as less of a strategy and more of a methodology. This led to the setting-up of 40 tripartite SWPs, initially covering over two-thirds of manufacturing industry.14
The recycling of the corporatist sector working party approach

17
THE ASPIRATION
deployed four decades ago suggests BEIS has a public sector mindset that sees knowledge diffusion as a top-down bureaucratic process rather than seeking to improve the efficient functioning of markets as knowledge diffusion machines.
More positively, the green paper re-commits to encouraging inward investment, noting the impact of Nissan in upgrading automotive production technology, and promises to prioritise its efforts on attracting inward investment that maximizes wealth creation. Although hardly novel, that marks a break with 1970s-style industrial strategy and is one way the government can pro-actively improve knowledge diffusion.
18
5Productivity and regional
disparities
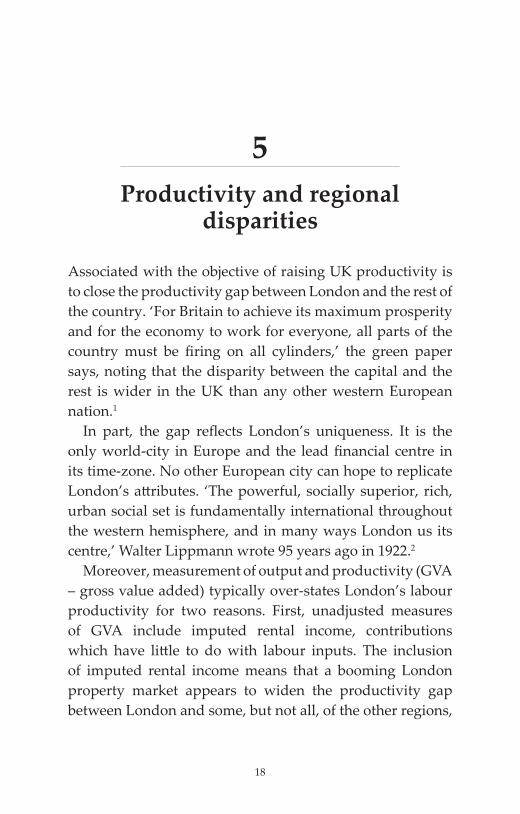
Associated with the objective of raising UK productivity is to close the productivity gap between London and the rest of the country. ‘For Britain to achieve its maximum prosperity and for the economy to work for everyone, all parts of the country must be firing on all cylinders,’ the green paper says, noting that the disparity between the capital and the rest is wider in the UK than any other western European nation.1
In part, the gap reflects London’s uniqueness. It is the only world-city in Europe and the lead financial centre in its time-zone. No other European city can hope to replicate London’s attributes. ‘The powerful, socially superior, rich, urban social set is fundamentally international throughout the western hemisphere, and in many ways London us its centre,’ Walter Lippmann wrote 95 years ago in 1922.2
Moreover, measurement of output and productivity (GVA – gross value added) typically over-states London’s labour productivity for two reasons. First, unadjusted measures of GVA include imputed rental income, contributions which have little to do with labour inputs. The inclusion of imputed rental income means that a booming London property market appears to widen the productivity gap between London and some, but not all, of the other regions,

19
PRODUCTIVITY AND REGIONAL DISPARITIES
the biggest effect being on Northern Ireland (+4.0 percentage points), Scotland (+1.5) and the North West (+1.6).3
The second relates to the problems measuring the GVA of financial intermediation. The largest component of financial intermediation GVA derives from the margin over the risk-free rate of interest (FISIM – Financial Intermediation Services Indirectly Measured). But as the Bank of England’s Andrew Haldane argued in a 2010 speech, this measure does not adjust for risk. The pre-financial crisis banking ‘productivity miracle’ might have been a mirage – ‘a simple, if dramatic, case of risk illusion by banks, investors and regulators’.4
It is not smart to base a strategy on an unobtainable objective. Having the goal of the nations and regions closing the productivity gap with London is setting up the strategy for failure. It creates undue pessimism about how some regions are performing and risks over-looking areas where there are serious problems of economic under-performance.
Figure 3 (overleaf) uses a productivity measure excluding imputed rental income and removes London from the national average. This helps highlight regions that are performing relatively well (Scotland, the South East and the East of England); that the majority of the rest under-perform the average by less than ten percent (the South West at less than one percent below the average, to the North West, the East Midlands, the North East, the West Midlands and lastly Yorkshire and Humberside); and highlights the productivity laggards (Wales and Northern Ireland).
For most regions, the distribution of productivity performance suggests that the challenge is less about the productivity of the firms already located there than growing the firms already there and attracting new ones. As the ONS observes, ‘high-productivity firms are present in each region

GOING THROUGH THE MOTIONS
20
of Great Britain’.5 However, within the average productivity numbers hide important details:
• Of all British regions, Wales has the largest proportion of firms reporting negative GVA per worker and of firms paying workers more than the value of what they produce.6 This suggests the presence of a high level of hidden unemployment and signals a potential economic crisis for the principality with too many uncompetitive and inefficient firms.
• By contrast, after London, Aberdeen is the city region with the highest nominal GVA per hour worked at around 15% higher than the UK average (including London).7
Aberdeen’s high value generation and the role of energy in it provide a clue to the regional disparities that have bedevilled Britain in one form or another since the 1930s. Since Roman times, London has always been Britain’s most wealthy region. From the mid-18th century, the economic geography of Great Britain started its transformation, with textile manufacturers wishing to be close to their sources of
140.00
120.00
100.00
80.00
60.00
40.00
20.00
0.00
North
Eas
t
North
Wes
t
York
shire
and
the H
umber
East M
idlands
Wes
t of E
nglan
d
East o
f Eng
land
South
Eas
t
South
Wes
t
Wale
s
Scotla
nd
North
ern
94.08 96.33 92.63 95.14 93.00106.65
116.61
99.10
87.27
104.42
86.11
Figure 3: GVA per hour worked 2015 UK ex-London = 100

21
PRODUCTIVITY AND REGIONAL DISPARITIES
energy – initially water-driven power then coal – rather than to their markets.
Industrialisation followed by de-industrialisation is, in large part, the story of many of Britain’s disadvantaged regions. One would therefore expect an industrial strategy to analyse the causes of de-industrialisation and develop ideas to slow it down and reverse it – a strategy for re-industrialisation. Instead the section in the green paper on driving growth across the whole country is thin, peppered with platitudes (‘A modern industrial strategy will have recognition of the importance of places at its heart’) and hearty tautologies (‘For Britain to achieve its maximum prosperity, and for the economy to work for everyone, all parts of the country must be firing on all cylinders’).8

22
6Infrastructure spending
Infrastructure spending has become something of a cliché as an economic cure-all. Without offering any evidence, the green paper claims that regional productivity differences reflect, amongst other things, weaknesses in infrastructure and connectivity, upgrading infrastructure being the third of the industrial strategy’s ten pillars. This involves projects like the Northern Powerhouse Rail, the Midlands Rail Hub and HS2 (‘driving regeneration schemes across the UK’.)1
Politicians point to France, Japan and now China with lots of high speed rail and conclude we must have them too in the political equivalent of ‘Man City Syndrome.’
‘You cannot define yourself by your rivals and competitors or change your strategy and approach because of something they do. For years Manchester City, the other club in Manchester, tried to define themselves by what we did. Their chairman, Peter Swales, regularly referred to us as “Them across the road”. He couldn’t get Manchester United out of his head. Instead of seeking to improve Manchester City, and concentrate what was under his control, he worried about us. It made no sense.’ – Alex Ferguson & Michael Moritz, Leading (2016), p.308
The evidence for the effectiveness of infrastructure as a Keynesian tonic for feeble growth is poor. Harvard
23
INFRASTRUCTURE SPENDING
economics professor Edward Glaeser points that between 1991 and 2008, Japan spent $6.3 trillion on infrastructure:
But while these trillions in spending may have kept some people working, no one can look at the Japanese numbers and conclude that the money has ramped up the growth rate. Moreover, the largesse is part of the reason that the nation now labours under a crushing public debt, worth 230 percent of GDP. Japan is less, not more, dynamic after its infrastructure bonanza.2
Infrastructure spending involves large increases to both sides of the government’s balance sheet. Debt and equity used to fund private sector investment self-liquidates if the investment turns out to be a dud. By contrast, government debt used to fund public infrastructure keeps its value on the debit side of the balance sheet even if the asset turns out to be worth less than it cost.
To retain their value on the asset side of the balance sheet, infrastructure assets must boost overall economic performance. The weakness of infrastructure spending as an economic cure-all is that it is very hard to demonstrate that it actually improves economy-wide performance. Based on OECD productivity data (GDP per hour worked), Japan’s labour productivity growth put it in the middle of the G7 countries that actually ran the productivity growth race (Italy dropped out at the turn of the century). The winners – the US and the UK, with the UK far out in front before being over-taken by the US during the 2008 recession – are often characterised as economies hamstrung by tired, dilapidated infrastructure.
Most discussion of productivity focus on labour productivity. Unless you’re a Marxist, capital has a cost reflected on the liabilities side of the balance sheet. For

GOING THROUGH THE MOTIONS
24
this reason, a better metric is multifactor productivity, comparing the efficiency with which economies use capital as well as labour. On this basis, Japan’s post-1990 productivity performance shrinks from an average of 1.26% a year to 0.62% a year, dropping from the middle of the G7 pack to the bottom of the G7 other than Italy.
By contrast, until the 2008 recession, the UK was top of the pack, with an average multifactor productivity growth rate of 1.40% a year. Along with Germany (3.8% lower in 2009 than in 2007), the UK (4.1% lower in 2009) had the sharpest fall in multifactor productivity. However, German productivity staged a sharp recovery and by 2015, was 3.8% higher than the 2007 peak. Ominously, Britain joins Italy as the only G7 economy with multifactor productivity below its level in 2007 (1.42% and 3.28% respectively). Self-evidently, going down the Japanese route of high infrastructure spending is not going to cure Britain’s post-2008 productivity growth malaise.
The evidence supporting the macro-economic argument that high levels of infrastructure spending, especially on transport infrastructure, boosts long-term productivity growth is slight
95
100
105
110
115
120
125
130
95
100
105
110
115
120
125
130
1990
1991
1992
1993
1994
1995
1996
1997
1998
1999
2000
2001
2002
2003
2004
2005
2006
2007
2008
2009
2010
2011
2012
2013
2014
2015
Canada France Germany Italy Japan UK USA
Figure 4: Multifactor productivity (1990 = 100)
25
INFRASTRUCTURE SPENDING
and Japan’s record suggests high levels of infrastructure spending subtracts from productivity growth. However, the increase in public debt used to fund it is all too real, possibly trapping the economy in the doldrums of low interest and growth rates indefinitely.
Over the last two decades or so, there has been increasing recourse to financing high cost/low return infrastructure through consumer levies, thereby pushing the associated liabilities off the government’s balance sheet altogether. According to Sir Ian Byatt, the first water regulator and former deputy chief economic adviser to the Treasury, it was Chris Patten who first discovered the ministerial credit card. Patten realised water privatization enabled him to finance environmental projects without going to the Treasury.3
In substance, there is little fundamental difference between tax-funded infrastructure and funding infrastructure through off-balance sheet consumer levies – they both roll up as liabilities on households, squeezing living standards. However, levies are inferior to taxation in a number of respects:
• Taxation is progressive, levies are regressive – pushing more of the burden onto the less well-off and Just About Managing families.
• Weaker cost control and accountability, points repeatedly made by the National Audit Office and Public Accounts Committee.
• Higher cost of private sector capital not offset by investment efficiency. This occurs when the public sector specifies inputs (wind and solar farms; HS2; the £4bn Thames Super Sewer) and not outputs (CO2 emissions; capacity and journey times; water quality).
GOING THROUGH THE MOTIONS
26
Current infrastructure policy is in a bad place. The green paper acknowledges that there have been problems ‘with the delivery of schemes. Projects have been delayed by years and provided at excessive cost.’4 In a 2009 paper ‘Survival of the unfittest,’ Bent Flyvbjerg, professor of major infrastructure projects at Oxford University, asked why the worst infrastructure gets built. Professor Flyvbjerg found that project managers and planners ‘lie with numbers’.5
More generally, Flyvbjerg comments that rich countries can afford to build financial and economic infrastructure disasters but did not become rich by building them: ‘They do so when they have become rich.’6
According to Flyvbjerg, a characteristic of poor value infrastructure is project lock-in or capture at an early stage, leaving analysis of alternatives weak or absent.7 Breaking project capture requires the Treasury in particular desisting from its new role as the cheer leader of infrastructure spending and bring a far more sceptical eye to claimed project economics which are invariably pumped up to make them appear more attractive.
Principles for achieving value-enhancing infrastructure investment
• Rank projects according to prospective Return on Investment (ROI)
• Projects relying on non-commercial benefits for ROI in all likelihood quite flaky
• Competition at all levels, most important being ‘Competition for the Plan’
• The public sector to define desired outputs, not specifying inputs (e.g., picking generating technologies in electricity, route alignments in rail etc.)

27
INFRASTRUCTURE SPENDING
• Proper risk transfer to private sector capital providers, so markets price project risk (ex political risk)
• Be constantly aware of the ongoing risk of capture by project teams – they will suppress information to keep projects alive
• Independent audit of project appraisals so auditors are on the hook for risks/downsides they are negligent in identifying
Let the chips fall where they fall – if markets give a negative answer, it’s telling you something important.
28
7M is for manufacturing
Although the green paper is not explicit on this point, to most people, an industrial strategy implies helping manufacturing industry. In fact, the green paper is rather coy in this regard. There is a rationale for policies that are supportive of manufacturing, but it isn’t to be found in the green paper. Indeed, the green paper is noteworthy for the unsystematic approach it takes to selection of favoured sectors.
According to a 2015 paper by the Washington, DC pro-blue collar think tank Economic Policy Institute by Robert E Scott:
• In 2013 manufacturing’s economic footprint is nearly three times as large as its share of direct economic output.1
• As a result, manufacturing has a large ‘indirect employment multiplier.’ For every person directly employed in manufacturing, manufacturing output supports more than 1.4 jobs elsewhere in the US economy.2
• Growth of multi-factor productivity in manufacturing averaged 3.3% a year between 1997 and 2012 – nearly one third higher than in the private, non-farm economy as a whole.3
• Manufacturing employs a higher share of workers without a college degree than does the economy as a

29
M IS FOR MANUFACTURING
whole. Notes Scott, ‘And while manufacturing jobs may not require a college education, they are not ‘unskilled.’ Manufacturing employs many highly skilled workers in high-productivity jobs and manufacturing wages are higher than average as a result’.4
US Bureau of Economic Analysis input-output data analysed by the Manufacturing Institute demonstrate the strength of manufacturing’s multiplier compared to other sectors. According to its analysis, $1 of manufacturing GDP generated an additional $1.33 of GDP across other sectors of the economy. This compares to 80 cents for the information sector, 66 cents for the retail trade and 61 cents for professional and business services.
Source: Manufacturing Institute
Far from being strategic, rational and systematic, the sector selection methodology outlined in the industrial strategy green paper is open to any sector ‘if they can demonstrate that they can take action to improve the competitiveness of their sector’.5 Thus, as part of its industrial strategy, BEIS is facilitating an independent review of the UK’s creative
$0.00 $0.20 $0.40 $0.60 $0.80 $1.00 $1.20 $1.40 $1.60
Manufacturing
Agriculture, forestry, fishing and hunting
Transportation and warehousing
Construction
Arts, entertainment and recreation
Information
Education, healthcare and social assistance
Retail trade
Other services, except government
Professional and business services
$1.33
$1.11
$1.00
$0.86
$0.81
$0.80
$0.72
$0.66
$0.63
$0.61
Figure 5: Economic Activity Generated by $1 of Sector GDP, 2012 (Updated April 2014).
GOING THROUGH THE MOTIONS
30
industries. If their respective multipliers are similar to those for the US, one pound of manufacturing industry GDP is worth 53p more than £1 of creative industries GDP because of its higher multiplier effect.
‘A choice to serve everyone, everywhere – or simply to serve all comers – is a losing choice.’ – Lafley and Martin, p.58
In addition to the higher multiplier effect of manufacturing observed in the US data, there is an important social dimension to de-industrialisation. A recent study by the Institute for Fiscal Studies finds that although income inequality amongst the majority of the population has fallen, weekly pay for men has become more unequal. Hourly pay has become more unequal and those on hourly pay are increasingly likely to be in part-time work. This combination, the IFS says, has resulted in a substantial increase in pay inequality between men. Twenty years ago, it was rare for men to work part-time (less than 30 hours a week). Now about one in four male employees with low hourly wages works part-time, a consistent trend over the past 20 years and pre-dating the recession.6
As noted above, automotive and aerospace have most favoured sector status because, from at least the 1980s, they have always been.* This recalls a criticism made by David Henderson in 1981 of a series of papers on industrial policy of what he called the ‘soap opera’ approach to the choice
*It was not always so. As minister of aviation in the first Wilson government, Roy Jenkins believed the aviation sector was too large and tried to cancel the Concorde project. The French strongly objected; Wilson wanted to join the Common Market, and the commercially disastrous project lived on. Similarly with automotive, the Labour government sought to rationalise what it saw as a sprawling sector with too many companies and brands.
31
M IS FOR MANUFACTURING
of industries and projects to support, soap opera being the mot juste for the green paper’s inclusion of the creative industries sector.
Like the green paper, the 1981 NIESR papers explicitly disavowed the doctrine of ‘picking winners’, but, similarly to the green paper ‘the rest of what they say is not consistent with this welcome disclaimer’.7 Indeed, with the exception of energy, the topic of the next section, there is little fresh or original thinking in the green paper which hadn’t featured in discussions on industrial strategy in the 1970s (see Box 1).
Box 1: Blasts from the past
The 1974-79 Labour government was the last government to pursue an explicit industrial strategy. As we’ve already seen, their approach used sectoral working parties which are a central feature in the BEIS green paper. In addition to the 1975 industrial strategy white paper, the Industry Act 1975 gave ministers power to block foreign take-overs and created the National Enterprise Board, originally conceived to take stakes in large manufacturing companies. The vocabulary of intervention – lame ducks, high flyers, ewe lambs, sacred cows, dark horses and white elephants – gives a flavour of the enduring challenges of industrial intervention when it is selective and discretionary rather than general and non-discriminatory.
A common theme then, and current today, is British industry’s technological weakness, poor industrial skills and backward level of vocational training. As before, this is to be addressed by measures such as more research and development (R&D) spending.
GOING THROUGH THE MOTIONS
32
But as Henderson pointed out in 1981, remedying technological backwardness was scarcely a novel concern:
One would not gather from what is said here is that industrial policies, science policy, and the volume and direction of R&D support had been virtually continuous subjects of concern to British governments over the past thirty years or so; nor is there any consideration of the conscious efforts made to accelerate economic growth through the medium of government support for science and technology. We hear nothing about the ‘white-hot technical revolution,’ nor the spirit and programmes that were associated with the new-forgotten MinTech.1

33
8E is for energy
Energy was a major input into Britain’s economic transformation during the Industrial Revolution. To justify its costly infrastructure policies, BEIS claims that it was infrastructure that spread previous industrial revolutions. The green paper gets the causality the wrong way around: energy drove connectivity.
Manufacturing involves altering, transforming and re-arranging matter which necessarily requires energy and cheap, abundant energy powered the Industrial Revolution. Manufacturing is intrinsically energy-intensive, as it is for the logistics required to support the manufacturing process through the supply chain to the end customer.
The fundamental role of energy in the universe and human society has been summarised in a brilliant thumbnail sketch of the Second Law of Thermodynamics by the Harvard psychologist Steven Pinker:
The Second Law of Thermodynamics states that in an isolated system (one that is not taking in energy), entropy never decreases … Closed systems inexorably become less structured, less organized, less able to accomplish interesting and useful outcomes, until they slide into an equilibrium of gray, tepid, homogeneous monotony and stay there.1
GOING THROUGH THE MOTIONS
34
Pinker goes on:
Why the awe for the Second Law? The Second Law defines the ultimate purpose of life, mind, and human striving: to deploy energy and information to fight back the tide of entropy and carve out refuges of beneficial order. An underappreciation of the inherent tendency toward disorder, and a failure to appreciate the precious niches of order we carve out, are a major source of human folly.2
Even the dematerialised information revolution requires energy to order, store, access and transmit information. As energy expert Mark Mill of the Manhattan Institute points out, that the internet uses a lot of energy is well established and should be unremarkable. ‘Trillions of dollars are now spent annually on electricity-consuming internet hardware to build out global networks. Today, roughly speaking, all of the world’s digital activities consume more energy than does global aviation.’3
Cheap energy makes life better. It makes industry more competitive. A bold industrial strategy would have halting and reversing de-industrialisation as its strategic goal, not through unsustainable subsidies but through sustainable competitive advantage. The lower energy costs go, the greater the competitive advantage, the more Britain can export and the greater Britain’s ability to attract foreign direct investment. Overseas trade is vital for post-Brexit Britain.
The green paper acknowledges that industrial electricity prices have ‘moved out of line’ (i.e., are considerably higher) than other European countries.4 As shown in Figure 6, for both medium (consuming between 500 and 2,000 MWh a year – equivalent to a big shop) and large industrial consumers (70,000 to 150,000 MWh a year – equivalent to

35
E IS FOR ENERGY
a big factory), UK electricity prices are far higher than any other EU nation. In the first half of 2016, for medium users, electricity costs were 56.7% higher than the EU average. The position is even worse for larger consumers – UK electricity costs are double the EU average. Only Spain comes close, but for large industrial consumers, British business suffers a 85.7% energy cost penalty against their Spanish competitors.
Sources: Eurostat; US Energy Information Administration
Brexit will substantially worsen the situation. British manufacturers could well experience some additional friction in exporting to the EU over and above the energy cost penalty. The Government aims to conclude a free trade agreement with the United States. Thus the comparator should not only be EU energy costs, which are some of the highest in the world, but also US. The horizontal line in Figure 6 represents the average electricity price paid by American industry (large and small) in the second half of 2016. According to BEIS, in 2015 UK industry paid an
Europ
ean
Union
(28 co
untri
es)
United
King
dom
Fran
ce Italy
Germ
any (
until
1990
form
er
terri
tory
of t
he F
RG)
Nethe
rland
s
Sweden
Spain
Poland
14
12
10
8
6
4
2
0
Figure 6: EU Energy Costs (2016H1) – euro cents per kWh
GOING THROUGH THE MOTIONS
36
average price of 9.50p per kWh, more than double the 4.51p per kWh paid by US industry.5
A free trade agreement with the US will expose the UK tradable goods sector to competition from manufacturers benefiting from the ongoing shale revolution and energy policies that are moving in the opposite direction from the EU’s. Unless the Government pre-emptively adopts a realistic energy policy based on driving down costs, a free trade agreement with the US would likely lead to intensified UK de-industrialisation.
The green paper states that energy costs constitute on average 3% of UK business expenditure and points out that there are 15 sectors, including steel, chemicals, glassmaking and ceramics, where energy costs represent 10% or more of total business expenditure.6 Higher energy costs come straight off a firm’s bottom line. While this might look small in relation to turnover, it isn’t in relation to profits. On the basis of an 8% operating margin (EBIT to turnover):
• For companies where energy costs are 3% of their costs, the 56.7% cost penalty for the medium is equivalent to 1.56 points of an eight percent profit margin, i.e., nearly twenty percent of operating profits;
• For larger users facing an 85.7% penalty, higher energy costs very nearly wipe out an 8% operating margin.
Unlike higher worker compensation to attract higher quality people and enhance motivation or higher levels of depreciation in respect of more investment in plant and machinery, a British business doesn’t get better electricity than its overseas competitors. Higher energy costs are a pure deadweight cost on business that is only avoidable at a cost.
In its March 2017 report on energy prices, the Committee on Climate Change has a straightforward message: ‘Firms

37
E IS FOR ENERGY
could cut these costs by improving energy efficiency.’7
The flaw in the committee’s advice to British business is obvious: So can their foreign competitors. They operate in tough markets. There is nothing proprietary about what British firms can do to cut energy usage. It also assumes that undertaking the investment to cut energy usage is costless. In this context, the US Environmental Protection Agency estimated that by 2030, the annualized costs to businesses and consumers of investing in energy efficiency to meet US emissions targets would be between $26.3bn and $32.5bn.8
Fortunately, BEIS takes a more business-friendly line than the climate change committee. Recognising that this constitutes a severe penalty, the green paper acknowledges there are fifteen sectors where energy costs represent more than ten percent of business expenditure. It is therefore putting in hand a roadmap to minimise business energy costs. Doing so requires honesty about how policy got us here. On this score, the green paper is deficient in blaming uncomfortably tight generating margins – which push up prices – on ‘the lack of a long-term energy strategy over previous decades.’9 As John Constable of the Renewable Energy Foundation points out, the green paper’s claim is simply incorrect:
Far from being the result of a strategy vacuum, the lack of firm generation capacity is one undesirable product amongst many of a very detailed but mistaken energy strategy. That failed strategy was for rapid decarbonisation grounded in the broadscale adoption of renewables against the cost gradient, ahead of the learning curve and without sufficient recognition of the consequent market distortions destroying investment signals for the still indispensable conventional generation, such as gas turbines and nuclear, required to guarantee security supply.10
GOING THROUGH THE MOTIONS
38
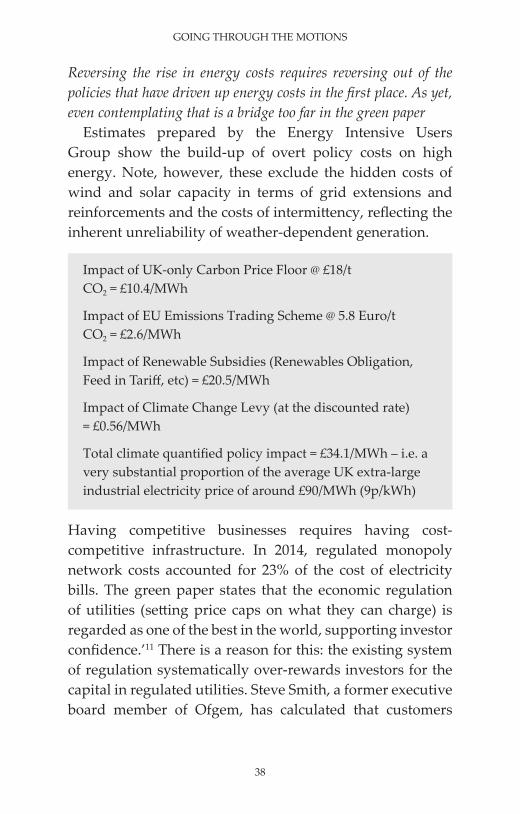
Reversing the rise in energy costs requires reversing out of the policies that have driven up energy costs in the first place. As yet, even contemplating that is a bridge too far in the green paper
Estimates prepared by the Energy Intensive Users Group show the build-up of overt policy costs on high energy. Note, however, these exclude the hidden costs of wind and solar capacity in terms of grid extensions and reinforcements and the costs of intermittency, reflecting the inherent unreliability of weather-dependent generation.
Impact of UK-only Carbon Price Floor @ £18/t CO2 = £10.4/MWh
Impact of EU Emissions Trading Scheme @ 5.8 Euro/t CO2 = £2.6/MWh
Impact of Renewable Subsidies (Renewables Obligation, Feed in Tariff, etc) = £20.5/MWh
Impact of Climate Change Levy (at the discounted rate) = £0.56/MWh
Total climate quantified policy impact = £34.1/MWh – i.e. a very substantial proportion of the average UK extra-large industrial electricity price of around £90/MWh (9p/kWh)
Having competitive businesses requires having cost-competitive infrastructure. In 2014, regulated monopoly network costs accounted for 23% of the cost of electricity bills. The green paper states that the economic regulation of utilities (setting price caps on what they can charge) is regarded as one of the best in the world, supporting investor confidence.’11 There is a reason for this: the existing system of regulation systematically over-rewards investors for the capital in regulated utilities. Steve Smith, a former executive board member of Ofgem, has calculated that customers
39
E IS FOR ENERGY
are being over-charged by £800m a year. Smith notes that local electricity distributors earn up to double the returns on equity allowed by Ofgem while National Grid in the UK is given a pre-tax return on equity of over 13% whilst its US infrastructure businesses get a shade over 8%.12
The current system of utility regulation, which also covers gas, water, BT’s copper-wire network, Network Rail and Gatwick and Heathrow airports, was first developed in the 1980s. In addition to the systematic over-charging of customers, it incentivises gold-plating and capital investment inefficiency (known to economists as the Averch-Johnson effect). A government that rejects business-as-usual complacency would review the system of utility regulation with a view to reforming it so monopoly utilities serve customers better at lower cost.
40
9Decarbonisation or
re-industrialisation?
As we saw in Chapter 1, Lafley and Martin emphasise the ‘where to play’ choice: choosing where to play explicitly involves choosing where not to play. Making, transforming and transporting things requires more energy than most other sectors of the economy. High energy costs therefore impact manufacturers more and wishing it weren’t so is not a policy.
Some advocates of industrial strategy are sanguine about this. Kate Barker, who is chairing an independent industrial strategy, has written that industrial ‘may be positively misleading’ before going on to advocate decarbonising the economy in what amounts to a Post-Industrial Strategy.1
A similar view was expressed in a Times leader hailing the reduction in carbon dioxide emissions from the power sector, arguing that Britain’s ‘long-term economic health depends on knowledge-intensive rather than energy-intensive industries’.2 Quite where this leaves workers not au fait with the knowledge economy is left unsaid but clear – in a cylindrical metal container with a lid on top.
The green paper takes a similar line on decarbonisation. ‘On climate change, the settled position is reflected in the Government’s commitment to meeting the legally-binding targets under the Climate Change Act.’3 Meeting these

41
DECARBONISATION OR RE-INDUSTRIALISATION?
targets precludes re-industrialisation – it renders any industrial strategy as little more than going through the motions.
Source: Defra
This can be seen by the gap between Britain’s emissions as reported under the UN climate convention (territorial basis in Figure 7, the basis for reporting progress on Britain’s domestic and international emissions reduction targets), and Britain’s consumption emissions or carbon footprint. Between 1997 and 2007, Britain’s carbon footprint rose as its territorial emissions fell. Then, for two years thanks to the recession, Britain’s carbon footprint shrank faster than territorial emissions but from 2011, the gap between territorial and consumption emissions started to widen again. As a result, in 2013 the gap between consumption and territorial emissions was wider in 2013 than in 1997, when embedded emissions in imports were 9.7% higher than they had been in 1997.
The divergence can be seen in the emissions numbers for the most recent year available. In 2013, measured on
1,000
900
800
700
600
500
400
300
200
100
0
1997
1998
1999
2000
2001
2002
2003
2004
2005
2006
2007
2008
2009
2010
2011
2012
2013
Production basis
Consumption basis
Territorial basis
Figure 7: Relationship of different measures of the UK’s CO2 emissions 1997 to 2013 Million tonnes CO2

GOING THROUGH THE MOTIONS
42
the conventional territorial basis, Britain’s greenhouse gas emissions fell by 2.4%, from 582.2m tonnes of carbon dioxide equivalent (MtCO2e) to 568.3 MtCO2e.4 The same year, Britain’s carbon footprint (including all six main greenhouse gases) rose by 3% to 1,075 MtCO2e, although Defra cautions that measuring overseas emissions embedded in imports is inherently uncertain (around 40% of imported greenhouse gas emissions are gases other than CO2). All broad product groups other than power and water saw rises in their CO2 emissions, the largest percentage increases coming from other manufacturing (+23%); mining (+19.5%); and metals (+17%).5
As Defra, the government department which compiles the consumption emissions, notes: ‘Since 1997, the UK economy has continued to move from a manufacturing base towards the services sector. One of the consequences of this is that more of the goods we buy and use are now produced overseas.’6 This has obvious implications for any industrial strategy worth its name and for economic policy more generally. Policies that succeed in stimulating metal-bashing and reversing de-industrialisation will see a rise in CO2 emissions.
Britain’s current account deficit is high historically and the highest of the G7. According to the Office of National Statistics, this can partly be attributed to UK earnings from overseas assets falling relative to the earnings of foreign investors in the UK. This is reflected in a deterioration in the UK’s net balance of overseas assets/liabilities, which last year recorded a net liability position of 14.4% of GDP. Our weak external position means that each year, foreigners are financing 5.5% of GDP. Our stock of liabilities to the rest of the world is thus cumulating at 5.5% of GDP a year.7
In the run-up to the EU referendum, the Governor of the Bank of England highlighted this vulnerability when he
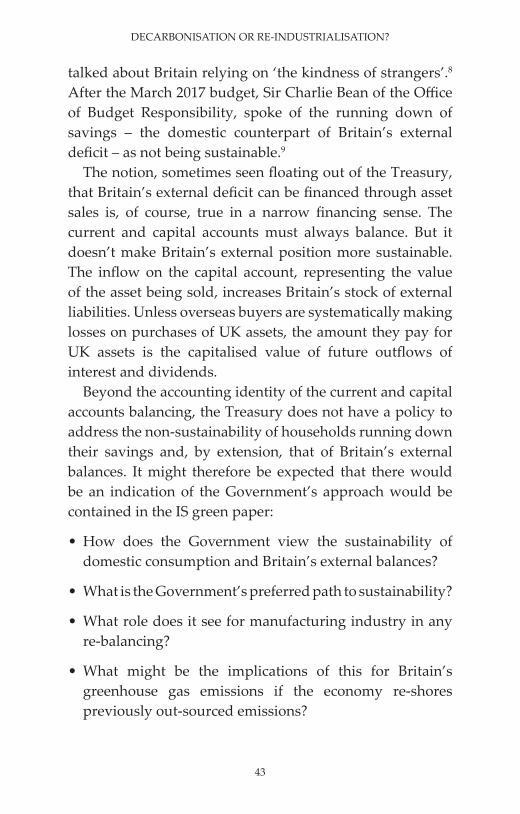
43
DECARBONISATION OR RE-INDUSTRIALISATION?
talked about Britain relying on ‘the kindness of strangers’.8
After the March 2017 budget, Sir Charlie Bean of the Office of Budget Responsibility, spoke of the running down of savings – the domestic counterpart of Britain’s external deficit – as not being sustainable.9
The notion, sometimes seen floating out of the Treasury, that Britain’s external deficit can be financed through asset sales is, of course, true in a narrow financing sense. The current and capital accounts must always balance. But it doesn’t make Britain’s external position more sustainable. The inflow on the capital account, representing the value of the asset being sold, increases Britain’s stock of external liabilities. Unless overseas buyers are systematically making losses on purchases of UK assets, the amount they pay for UK assets is the capitalised value of future outflows of interest and dividends.
Beyond the accounting identity of the current and capital accounts balancing, the Treasury does not have a policy to address the non-sustainability of households running down their savings and, by extension, that of Britain’s external balances. It might therefore be expected that there would be an indication of the Government’s approach would be contained in the IS green paper:
• How does the Government view the sustainability of domestic consumption and Britain’s external balances?
• What is the Government’s preferred path to sustainability?
• What role does it see for manufacturing industry in any re-balancing?
• What might be the implications of this for Britain’s greenhouse gas emissions if the economy re-shores previously out-sourced emissions?

GOING THROUGH THE MOTIONS
44
• Are there low cost options to meeting Britain’s international decarbonisation obligations, such as greater recourse to the EU’s Emissions Trading Scheme?
One will search in vain for answers, as these questions are not even posed in the green paper. These omissions enable the green paper to evade the strategic choice between decarbonisation, necessitating absolute reductions in greenhouse gas emissions, and re-industrialisation, implying emitting more by making more. An economic re-balancing has major implications for meeting decarbonisation targets. At the same time, high energy costs constitute a major obstacle to achieving such a re-balancing.

45
10Errors and omissions
The green paper’s anti-energy bias is manifested in a further significant omission. Primary energy, in the form of North Sea oil, is the source of Aberdeen’s high productivity. BEIS is nominally responsible for energy, yet the green paper treats the E in BEIS as being exclusively about having more high cost green energy and, more recently, trying to square the circle with industrial competitiveness.† There is not a single mention of fracking or shale gas and there is no mention of Britain’s vast coal reserves under the North Sea. According to Dermot Roddy, formerly professor of energy at Newcastle University, ‘If we could extract just a few per cent of that coal it would be enough to power the UK for decades or centuries.’1
Roddy co-founded a firm to pioneer the technology to
†The Green Paper states that the difference between UK and European industrial electricity prices is ‘now mainly due to our higher wholesale prices and networks costs’ (p.91), which is like saying ‘higher prices are caused by higher costs.’ The Green Paper bases its startling claim on a 2015 paper produced for the Belgian Federal Commission for Electricity and Gas Regulation. This paper states that the UK is an expensive outlier for all electricity profiles, but it does not explain the causes of the UK’s higher costs, for example, there is not even one mention of the UK’s £18 per tonne carbon price floor tax which no other EU member state has. CREG, A European comparison of electricity and gas prices for large industrial consumers (28 April 2015), p.6

GOING THROUGH THE MOTIONS
46
recover gas from coal seams under the sea-bed off the North East coast, a proposal that included a power plant and gas processing plant to provide feedstock for the region’s chemicals industry. The firm’s request for a government letter of support to provide comfort to a potential investment by the Qatari government was rejected by the government. Justifying the decision that led to the firm’s collapse, the then prime minister David Cameron said the government had withdrawn support from carbon capture schemes because they were not economically viable compared with nuclear or offshore wind.2
The government has an Office of Unconventional Gas and Oil sitting in BEIS but it doesn’t form part of its proposed industrial strategy. It therefore neglects the powerful private sector engine of economic regeneration of depressed regions that is transforming swathes of the United States. Pennsylvania sits atop of the Marcellus shale formation, containing an estimated 141 trillion cubic feet of methane. The state’s Department of Labor and Industry reckons the Marcellus shale has been responsible for hundreds of thousands of jobs. Washington county, in the depressed south-west corner of the state, became home to 150 businesses, including several large energy companies, and now styles itself as the Energy Capital of the East. An area hit hard by the collapse of the steel industry in the 1980s is now seeing blue-collar jobs that pay white collar money, according to an October 2015 report on PennLive.com.3
Fracking has propelled the United States into being the largest and fastest growing producer of hydrocarbons in the world. In just two years, US oil production grew more than it had declined over the previous twenty. The $300-$400bn of annual economic gain from the oil and gas boom had been greater than the average annual GDP expansion of
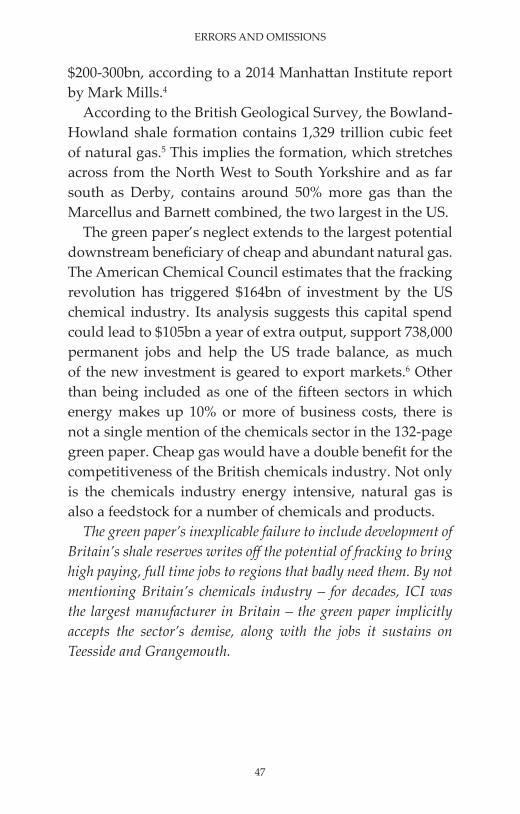
47
ERRORS AND OMISSIONS
$200-300bn, according to a 2014 Manhattan Institute report by Mark Mills.4
According to the British Geological Survey, the Bowland-Howland shale formation contains 1,329 trillion cubic feet of natural gas.5 This implies the formation, which stretches across from the North West to South Yorkshire and as far south as Derby, contains around 50% more gas than the Marcellus and Barnett combined, the two largest in the US.
The green paper’s neglect extends to the largest potential downstream beneficiary of cheap and abundant natural gas. The American Chemical Council estimates that the fracking revolution has triggered $164bn of investment by the US chemical industry. Its analysis suggests this capital spend could lead to $105bn a year of extra output, support 738,000 permanent jobs and help the US trade balance, as much of the new investment is geared to export markets.6 Other than being included as one of the fifteen sectors in which energy makes up 10% or more of business costs, there is not a single mention of the chemicals sector in the 132-page green paper. Cheap gas would have a double benefit for the competitiveness of the British chemicals industry. Not only is the chemicals industry energy intensive, natural gas is also a feedstock for a number of chemicals and products.
The green paper’s inexplicable failure to include development of Britain’s shale reserves writes off the potential of fracking to bring high paying, full time jobs to regions that badly need them. By not mentioning Britain’s chemicals industry – for decades, ICI was the largest manufacturer in Britain – the green paper implicitly accepts the sector’s demise, along with the jobs it sustains on Teesside and Grangemouth.

48
11The Brexit opportunity
In her Lancaster House speech, the Prime Minister said the British people had voted to leave the EU and embrace the world. ‘We are leaving the European Union, but we are not leaving Europe,’ the Prime Minister has declared.1 She spoke of her ambition for a truly global Britain, ‘a great, global trading nation that is respected around the world and strong, confident and united at home.’
Domestic and EU energy policies have given Britain some of the highest energy costs in the world. That freedom means Britain can change course and set a new goal: To have the lowest energy costs of any country in Europe.
Is this realistic? Is it too ambitious? Weak ambition signifies a weak strategy. A too-modest aspiration is far more dangerous than a too-lofty one. ‘Too many companies eventually die a death of modest aspirations,’ according to Lafley and Martin.2 In its early years, New Labour aimed for Britain being one of the three countries with the lowest energy costs in the EU. Beating the EU on energy costs is easier now as EU policies force up energy costs while hydrocarbon prices have been falling.
The green paper’s energy aspiration is couched in terms of affordability, a word which appears around a dozen times in the document. Rather than driving energy costs as low as they can go, affordability carries a suggestion of

49
THE BREXIT OPPORTUNITY
setting a hurdle for business – the highest cost energy that industry can surmount without demonstrably damaging their ability to compete. Teams of civil servants and econometricians can then justify current policy settings by saying they didn’t find evidence that high energy costs are damaging business performance. It’s an approach to industrial policy that turns British industry into Just About Managing firms.
The Committee on Climate Change went so far as to assert in its March 2017 report on energy costs that decarbonisation was only a ‘small contributor’ to the higher energy costs faced by British business, the main cause of high electricity prices being wholesale and network costs.3
In making this claim, the committee appears to believe that Britain’s unilateral carbon price floor has a negligible impact on electricity costs.
But whatever the cause of high energy costs, the aim should be to maximize industry’s competitiveness. Doing so would remove the fundamental contradiction at the heart of the green paper. Competitiveness and productivity are viewed as major challenges. Yet under current policy, high energy costs are a burden to be borne, the issue for policy being how it should be shared around to palliate its most damaging effects on business competitiveness.
A new approach to energy policy would turn it into a source of competitive advantage. It would use the opportunity of leaving the EU to re-direct energy policy to make Britain Europe’s low-cost energy manufacturing base. It would turn a head wind for British manufacturers into a tail wind and send a clear message to firms already here and potential overseas investors about the long-term attractiveness of investing in Britain.

GOING THROUGH THE MOTIONS
50
‘One of the biggest lessons I had learned in my years at P&G was the power of simplicity and clarity. I found that clearer, simpler strategies have the best chance of winning, because they can be best understood and internalized by the organization. Strategies that can be explained in a few words are more likely to be empowering and motivating; they make it easier to make subsequent choices and to take action.’ – A.G. Lafley (Lafley and Martin, p.156)
51
12Strategy and leadership
Like statesmanship, strategy is a test of leadership. The first requirement of both is the ability to recognise reality and respond accordingly.
‘Strategy needn’t be mysterious… It requires clear and hard thinking, real creativity, courage, and personal leadership’. (Lafley and Martin, p.6)
‘If something cannot go on forever, it will stop.’ Herb Stein, who coined Stein’s Law, served as the chairman of President Nixon’s Council of Economic Advisers, was talking about economic phenomena such as trade imbalances that can self-correct. Energy policy won’t self-correct because it is under political control. The only thing that will change its trajectory is the accumulated economic pain it causes. Realism is recognising that policy is unsustainable; that the longer it stays in place, the more damage it causes; that at some point, policy will change because an economic sledgehammer forces politicians to make that change or suffer the political consequences; and that it is better to anticipate than to react to the inevitable. Rather than wait upon external events like a black-out, a genuine industrial strategy would have examined the implications of energy policy for industry’s productivity and competitiveness and analysed alternative energy policy scenarios.

GOING THROUGH THE MOTIONS
52
The evidence in Britain is mounting that current energy policy is unsustainable:
• British industry faces the highest energy costs in Europe, a fact that is not now in dispute
• Far from wind and solar being cheap, as renewable vested interests claim, even the Committee on Climate Change concedes that renewable energy is currently more expensive than burning fossil fuels.1 These costs are likely to rise because wind and solar suffer from diseconomies of scale owing to the, as yet unquantified, costs they impose on the rest of the grid (system costs)
• To sustain public acceptance for the high costs of decarbonization, in its March 2017 on energy costs and bills, the Committee on Climate Change had to resort to the subterfuge of shifting the focus to energy bills and treating investment in energy efficiency as zero cost
• Evidence that current policy is in its terminal phase is the sponsoring department suppressing data that contradict the policy. BEIS and its predecessor sat on an expert report examining the full system costs of renewables for well over a year and then excised all quantitative data on the system costs of green energy.2
The process of adapting policy to fit reality is already well under way in Australia. Malcolm Turnbull first became Liberal party leader as a global warming crusader. After losing the leadership because of his support for Labour’s decarbonisation policies, Turnbull spoke of climate change as the ultimate long-term problem: ‘We have to make decisions today, bear costs today so that adverse consequences, dangerous consequences are avoided many decades into the future.’3
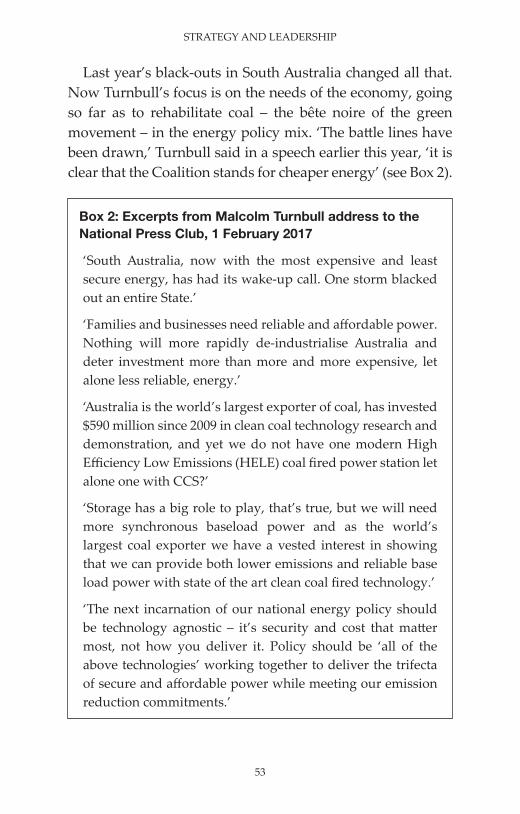
53
STRATEGY AND LEADERSHIP
Last year’s black-outs in South Australia changed all that. Now Turnbull’s focus is on the needs of the economy, going so far as to rehabilitate coal – the bête noire of the green movement – in the energy policy mix. ‘The battle lines have been drawn,’ Turnbull said in a speech earlier this year, ‘it is clear that the Coalition stands for cheaper energy’ (see Box 2).
Box 2: Excerpts from Malcolm Turnbull address to the National Press Club, 1 February 2017
‘South Australia, now with the most expensive and least secure energy, has had its wake-up call. One storm blacked out an entire State.’
‘Families and businesses need reliable and affordable power. Nothing will more rapidly de-industrialise Australia and deter investment more than more and more expensive, let alone less reliable, energy.’
‘Australia is the world’s largest exporter of coal, has invested $590 million since 2009 in clean coal technology research and demonstration, and yet we do not have one modern High Efficiency Low Emissions (HELE) coal fired power station let alone one with CCS?’
‘Storage has a big role to play, that’s true, but we will need more synchronous baseload power and as the world’s largest coal exporter we have a vested interest in showing that we can provide both lower emissions and reliable base load power with state of the art clean coal fired technology.’
‘The next incarnation of our national energy policy should be technology agnostic – it’s security and cost that matter most, not how you deliver it. Policy should be ‘all of the above technologies’ working together to deliver the trifecta of secure and affordable power while meeting our emission reduction commitments.’

GOING THROUGH THE MOTIONS
54
The reception that greeted publication of the green paper has been one of disappointment. This is unsurprising, for it is a document that shows little sign of the analytical rigour and structured thinking needed to make good what the Prime Minister says she wants from a modern industrial strategy:
• It identifies productivity as the country’s principal economic challenge but does not advance credible policies to address it.
• It acknowledges that Britain does not do infrastructure well, but recycles infrastructure spending as an economic cure-all, ignoring Japanese evidence to the contrary.
• It proposes an industrial strategy that does not have industry at its heart, prioritising decarbonisation over re-industrialisation.
• Evidence from the US shows that re-shoring manufacturing is possible thanks to the fracking revolution and having highly competitive energy costs.
• Access to abundant primary energy – first water power, then coal – is the development story of Britain’s industrial heartlands. Yet the potential of fracking to turn the North West into the energy capital of Europe is ignored, as is developing Britain’s undersea coal reserves, and it writes the hydrocarbon-intensive chemicals sector out of the strategy’s script.
A laundry list of existing government policies is not a strategy nor does it constitute a break with post-Brexit business- as-usual. Instead of playing to win, the green paper is playing to lose.

55
Notes
1. What is strategy?
1 Anita Elberse with Sir Alex Ferguson ‘Ferguson’s Formula,’ Harvard Business Review (October 2013), p.5
2 Michael E Porter, ‘What is Strategy,’ Harvard Business Review (November-December 1996), p.70
3 Michael E Porter, ‘What is Strategy,’ Harvard Business Review (November-December 1996), p.75
4 Michael E Porter, ‘What is Strategy,’ Harvard Business Review (November-December 1996), p.75
5 Anita Elberse with Sir Alex Ferguson ‘Ferguson’s Formula,’ Harvard Business Review (October 2013), p.7
6 Michael E Porter, ‘What is Strategy,’ Harvard Business Review (November-December 1996), p.77
7 AG Lafley and Roger L Martin, Playing to Win: How Strategy Really Works (Boston, Mass, 2013), p.48
8 AG Lafley and Roger L Martin, Playing to Win: How Strategy Really Works (Boston, Mass, 2013), p.50
9 AG Lafley and Roger L Martin, Playing to Win: How Strategy Really Works (Boston, Mass, 2013), p.53
10 AG Lafley and Roger L Martin, Playing to Win: How Strategy Really Works (Boston, Mass, 2013), p.58
11 AG Lafley and Roger L Martin, Playing to Win: How Strategy Really Works (Boston, Mass, 2013), p.83
12 AG Lafley and Roger L Martin, Playing to Win: How Strategy Really Works (Boston, Mass, 2013), p.142
2. What is industrial strategy?
1 HMG, Building Our industrial strategy (January 2017), p.10

GOING THROUGH THE MOTIONS
56
3. Industrial policy in the 1980s1 Charles Moore, Margaret Thatcher: The Authorized Biography, Vol.
One (London, 2013), pp.515-5172 Charles Moore, Margaret Thatcher: The Authorized Biography, Vol.
One (London, 2013), pp.515-5173 Charles Moore, Margaret Thatcher: The Authorized Biography, Vol.
Two (London, 2015) p.1924 Charles Moore, Margaret Thatcher: The Authorized Biography, Vol.
Two (London, 2015) p.905 David Merlin-Jones, ‘Time for Turning,’ Civitas Review (Vol. 7 Issue 1,
January 2010), p.36 Charles Moore, Margaret Thatcher: The Authorized Biography, Vol.
Two (London, 2015) p.1867 Norman Tebbit letter to Sir Geoffrey Howe, 30 November 1983
accessed via http://www.margaretthatcher.org/archive/results.asp?w=prem191411
8 Christopher Braddick, ‘Distant Friends – the Age of Globalization,’ in Ian Nish and Yoichi Kibata, The History of Anglo-Japanese Relations 1600-2000 Vol. II (London & New York, 2000) p.285
9 IMF, World Economic Outlook (WEO) Tensions from the Two-Speed Recovery: Unemployment, Commodities, and Capital Flows (April 2011), Box 1.4
10 Michael E Porter, ‘What is Strategy,’ Harvard Business Review (November-December 1996), p.62
11 See ‘Safeguards: emergency protection from imports’ at https://www.wto.org/english/thewto_e/whatis_e/tif_e/agrm8_e.htm
12 David Merlin-Jones, ‘Time for Turning,’ Civitas Review, Vol. 7 Issue 1 (January 2010), p.3
13 p.70
4. The aspiration1 HMG, Building Our industrial strategy (January 2017), p.32 HMG, Building Our industrial strategy (January 2017), p.53 OECD4 HM Treasury, Fixing the Foundations: Creating a more prosperous nation,
CM 9098 (July 2915), p.65 Office for Budget Responsibility, Press Notice ‘The OBR’s historical
forecast database: a prickle of porcupines,’ 26 January 20166 HM Treasury, Fixing the Foundations: Creating a more prosperous nation,
CM 9098 (July 2915), para A.9

57
NOTES
7 OECD, The Future of Productivity (2015), p.128 OECD, The Future of Productivity (2015), p.259 OECD, The Future of Productivity (2015), p.1210 OECD, The Future of Productivity (2015), p.3611 OECD, The Future of Productivity (2015), p.4512 OECD, The Future of Productivity (2015), p.1013 HMG, Building Our industrial strategy (January 2017), pp.100-10214 Alan Bailey, ‘Not all ‘the bad old days’: Revisiting Labour’s 1970s
industrial strategy,’ IPPR, 7 February 2013 http://www.ippr.org/juncture/not-all-the-bad-old-days-revisiting-labours-1970s-industrial-strategy
5. Productivity and regional disparities
1 HMG, Building Our industrial strategy (January 2017), p.392 Walter Lippmann, Public Opinion: How Media Shapes Public Perception
& How that Changes Society (1922, 2004 edition), p.293 ONS. The largest falls in GVA from excluding imputed rental income
is the South West (-2.2), the South East (-1.4), the East of England (-1.4) and London (-1.1)
4 Andew Haldane, ‘The Contribution of the Financial Sector – Miracle or Mirage,’ 14 July 2010
5 ONS, ‘UK Productivity introduction: July to Sept 2016,’ 6 January 2017, p.12
6 ONS, ‘UK Productivity introduction: July to Sept 2016,’ 6 January 2017, Fig.7
7 ONS, ‘UK Productivity introduction: July to Sept 2016,’ 6 January 2017, Fig.6
8 HMG, Building Our industrial strategy (January 2017), p.107
6. Infrastructure spending
1 HMG, Building Our industrial strategy (January 2017), p.512 Edward L Glaeser, ‘If you build it … Myths and realities of America’s
infrastructure spending,’ City Journal, Summer 20163 Rupert Darwall, Central Planning with Market Features: How renewable
subsidies destroyed the UK electricity market, (CPS, 2015), p. ix4 HMG, Building Our industrial strategy (January 2017), p.535 Bent Flyvbjerg, ‘Survival of the unfittest: why the worst infrastructure
gets built – and what we can do about it,’ Oxford Review of Economic Policy, Vol 25, No 3 (2009), p.358
GOING THROUGH THE MOTIONS
58
6 Bent Flyvbjerg, ‘Survival of the unfittest: why the worst infrastructure gets built – and what we can do about it,’ Oxford Review of Economic Policy, Vol 25, No 3 (2009), p.358
7 Bent Flyvbjerg, ‘Survival of the unfittest: why the worst infrastructure gets built – and what we can do about it,’ Oxford Review of Economic Policy, Vol 25, No 3 (2009), p.345
7. M is for manufacturing
1 Robert E Scott, ‘The Manufacturing Footprint and the Importance of US Manufacturing Jobs,’ EPI, 22 January 2015, p.7
2 Robert E Scott, ‘The Manufacturing Footprint and the Importance of US Manufacturing Jobs,’ EPI, 22 January 2015, p.7
3 Robert E Scott, ‘The Manufacturing Footprint and the Importance of US Manufacturing Jobs,’ EPI, 22 January 2015, p.9
4 Robert E Scott, ‘The Manufacturing Footprint and the Importance of US Manufacturing Jobs,’ EPI, 22 January 2015, p.8
5 HMG, Building Our industrial strategy (January 2017), p.1026 Chris Belfield, Richard Blundell, Jonathan Cribb, Andrew Hood,
Robert Joyce & Agnes Norris Keiller, ‘Two decades of income inequality in Britain: the role of wages, household earnings and redistribution,’ IFS (January 2017), pp.4-5
7 David Henderson, ‘Comments on Chapter 7’ in Charles Carter (ed), Industrial Policy and Innovation (NIESR, 1981), p.173
8 David Henderson, ‘Comments on Chapter 7’ in Charles Carter (ed), Industrial Policy and Innovation (NIESR, 1981), p.172
8. E is for energy
1 Steven Pinker, ‘2017: What Scientific Term Or Concept Ought To Be More Widely Known?’ https://www.edge.org/response-detail/27023
2 Steven Pinker, ‘2017: What Scientific Term Or Concept Ought To Be More Widely Known?’ https://www.edge.org/response-detail/27023
3 Mark P Mills, ‘Pokémon’s Big Carbon Footprint Illustrates Energy Reality,’ Forbes.com, 25 July 2016 https://www.forbes.com/sites/markpmills/2016/07/25/pokemons-big-carbon-footprint-a-virtual-reality-games-teaching-moment-about-energy-reality/#68e55e821faf
4 HMG, Building Our industrial strategy (January 2017), p.915 Committee on Climate Change, Energy prices and bills – impacts of
meeting carbon budgets (March 2017), Fig.3.56 HMG, Building Our industrial strategy (January 2017), p.91

59
NOTES
7 Committee on Climate Change, Energy prices and bills – impacts of meeting carbon budgets (March 2017), p.8
8 EPA, Regulatory Impact Analysis for the Clean Power Plan Final Rule (October 23, 2015), Table 3-3
9 HMG, Building Our industrial strategy (January 2017), p.8910 John Constable, ‘Electricity and the UK’s ‘Industrial Strategy,’’ Global
Warming Policy Foundation, 23 January 2017 http://www.thegwpf.com/electricity-and-the-uks-industrial-strategy/
11 HMG, Building Our industrial strategy (January 2017), p.10212 Steve Smith, ‘The (r)evolution of network price determination
processes,’ RPI 25th Anniversary Conference, 12 September 2016
9. Decarbonisation or re-industrialisation?
1 Kate Barker, ‘There is more to industrial strategy than picking winners,’ Financial Times, 7 March 2017
2 The Times, ‘A Cleaner Future,’ 7 March 20173 HMG, Building Our industrial strategy (January 2017), p.894 DECC, UK Greenhouse Gas Emissions, Final Figures 3 February 20155 Defra, ‘UK’s Carbon Footprint 1997-2013,’ February 2017, p.6 6 Defra, ‘UK’s Carbon Footprint 1997-2013,’ February 2017, p.2 7 ONS, ‘UK Balance of Payments, The Pink Book: 2016,’ 29 July 20168 Reuters, ‘BoE’s Carney says Brexit fears could pose current account
deficit risk,’ 27 January 20169 Jasper Jolly, ‘Budget 2017: Consumer-led growth is unsustainable says
former Bank of England deputy governor Sir Charlie Bean,’ CityA.M. 8 March 2017
10. Errors and omissions
1 Mail Online, ‘Coal find could fuel UK for centuries: Vast deposits totalling up to 23trillion tonnes found under the North Sea,’ 31 March 2014
http://www.dailymail.co.uk/news/article-2593032/Coal-fuel-UK-centuries-Vast-deposits-totalling-23trillion-tonnes-North-Sea.html#ixzz4cnQsK1dQ
2 Graeme Whitfield, ‘Government comes under fire after collapse of North East energy company,’ www.chroniclelive.co.uk, 2 March 2016
http://www.chroniclelive.co.uk/business/business-news/government-comes-under-fire-after-10979902

GOING THROUGH THE MOTIONS
60
3 Candy Woodall, ‘‘Energy Capital of the East’: Marcellus Shale drilling brings economic boost,’ PennLive.com, 22 October 2015 http://www.pennlive.com/midstate/index.ssf/2015/10/energy_capital_of_the_east_mar.html
4 Mark P Mills, Where The Jobs Are: Small Businesses Unleash America’s Energy Employment Boom (Manhattan Institute, February 2014), p.3 & p.10
5 British Geological Survey & DECC, The Carboniferous Bowland Shale gas study: geology and resource estimation (July 2013), p.3
6 American Chemistry Council, ‘U.S. Chemical Industry Investment Linked to Shale Gas Tops $164 Billion,’ 6 April 2016
https://www.americanchemistry.com/Media/PressReleasesTranscripts/ACC-news-releases/US-Chemical-Industry-Investment-Linked-to-Shale-Gas-Tops-164-Billion.html
11. The Brexit opportunity
1 Rt Hon Theresa May MP, ‘The government’s negotiating objectives for exiting the EU: PM speech,’ 17 January 2017
2 AG Lafley and Roger L Martin, Playing to Win: How Strategy Really Works (Boston, Mass, 2013), p.35
3 Committee on Climate Change, Energy prices and bills – impacts of meeting carbon budgets (March 2017), p.103
12. Strategy and leadership
1 Committee on Climate Change, Energy prices and bills – impacts of meeting carbon budgets (March 2017), p.7
2 Frontier Economics, Whole power system impacts of electricity generation technologies: A report prepared for the Department of Energy and Climate Change (February 2016)
3 Sydney Morning Herald, ‘Turnbull to cross floor: read his full speech,’ 8 February 2010
http://www.smh.com.au/environment/climate-change/turnbull-to-cross-floor-read-his-full-speech-20100208-nmrs.html