the industrial ccs support framework in the netherlands
TRANSCRIPT
The Industrial CCS Support Framework in the Netherlands
2021

BELLONA UK 2
Disclaimer
Author:Justus Andreas Design and Layout: Rebecka Larsson
Bellona endeavours to ensure that the information disclosed in this report is correct and free from copyrights but does not warrant or assume any legal liability or responsibility for the accuracy, completeness, interpretation or usefulness of the information which may result from the use of this report. © 2021 by the Bellona Foundation. All rights reserved. This copy is for personal, non-commercial use only. Users may download, print or copy extracts of content from this publication for their own and non-commercial use. No part of this work may be reproduced without quoting the Bellona Foundation or the source used in this report. Commercial use of this publication requires prior consent of the Bellona Foundation.

BELLONA UK 3
Summary & Key Aspects of the CCS Programme:
◆ Through the carrot and stick approach of the SDE++ and Carbon tax, the Dutch government is rewarding early deployment of CCS.
◆ CCS application is fundamentally motivated by emission reduction requirements and objectives and is solely targeting industrial emissions.
◆ CCS is capped at a total of 7.2MtCo2 from industrial processes and about 3MtCO2 per year for waste gas power generation from industrial processes, i.e. at the Tata Steel Mill in Ijmuiden.
◆ The SDE++ provides a 15-year CfD-like subsidy support covering the ‘uncommercial’ cost of CCS operation, i.e. the cost above the EU ETS price. Free allowances under the ETS are retained and volumes of CO2 from industrial applications that are captured and stored do not incur a charge under the new Dutch carbon tax system.
◆ No new industrial CCS subsidies will be granted after 2035 to reflect its role as a transitionary technology.
◆ Ownership of Transport and Storage (T&S) infrastructure is retained by operators, who are publicly owned (e.g. EBN and Gasunie 100% by Dutch government and the Port of Rotterdam Authority 50/50 between the Municipality and the Government).

BELLONA UK 4
IntroductionThe Dutch government implemented two
complementary measures to create the framework
that would both require and enable industry to
reach its reduction targets:
◆ a feed-in contractual subsidy mechanism
under the SDE1 ++ scheme to reward the most
cost-efficient CO2 reductions in industry. This
covers the uncommercial part of investing and
operating CCS on industrial plants; and
◆ a carbon tax, increasing gradually over the next
decade and reaching at least 125 EUR/tCO2 by
2030.
The renewed government support for CCS in the
Netherlands is rooted in the self-imposed but legally
required emission reduction targets on its path to
achieve net-neutrality by 2050.
At the end of 2020, the Dutch government ran the
first round of its SDE++ subsidy programme. For
the first time, the programme included support for
CCS in industry. The original SDE scheme was first
introduced in 2006 and merged two separate policy
schemes supporting renewable energy and CHP. It
became SDE+ in 2012 and the SDE++ in 2020, turning
a renewable support system into a CO2 reduction
scheme.
The SDE framework has an embedded lowest-cost
and market-based approach by holding auctions in
which projects bid to offer. Free allowances under
the EU ETS are retained by all emitters covered by
the ETS. The SDE++ will run in its current form until
2025 with a total budget of €30 billion. CCS support
is limited to a maximum of 7.2 MtCO2/year to help
prevent it displacing of implementing other cost-
effective tools nor hinder the development of long
term sustainability solutions.
1 SDE stands for Stimulering duurzame energieproductie en klimaattransitie, or ‘Stimulating sustainable energy production and climate transition’.
The in parallel introduced carbon tax acts effectively
as a floor price under the EU ETS, by topping up
the EUA price when it is below the level of the
tax. Together the two policies of the SDE++ and
the carbon tax provided a “carrot” and “stick” to
frontload innovation.
The 2015 ‘Urgenda case’ ruled that reducing
emissions was necessary for the Dutch
government to protect its citizens’ human rights.
The government was thereby forced to correct
its climate policy for 2020. Targets for 2030 were
subsequently set at 49% with pathways by the
Dutch environmental agency (PBL) identifying
the required emission reductions per sector.
For the industry, it meant the elimination of an
annual 14million tonnes of CO2 by 2030.
The government launched a dialogue program,
called ‘Climate Tables’ to ensure the necessary
measures had the support of key stakeholders.
These tables brough together representatives
from government, the private sector and civil
society to discuss measures for each sector of
the economy, including industry. The resulting
final ‘Climate Agreement’ of 2019 therefore
sought to be carried by key actors, although the
government also ensured its own prerogatives
were followed. For industry, the Agreement
entailed a policy framework to enable CCS
through a combination of support instruments,
most notably the SDE++, and increasing
penalties for emitting CO2 through a new
carbon tax.
The Dutch Constitutional Climate Decision and its consequences

BELLONA UK 5
The SDE++: Creating a business case of industrial CCSThe SDE++ subsidy is a contractual payment of the difference between
a base rate and a correction amount. The base rate is the price required
to make an investment economic, i.e. the cost of the investment and
operation of the climate technology. For CCS the base rate covers the
cost to capture, transport and store (T&S) the CO2. While the base rate
remains unchanged over the contract period, the correction rate will
be adjusted annually. The correction amount reflects the market price
of the output, for renewables this is the market price of electricity. For
CCS support the correction rate represents the average EU ETS of the
respective year. The effective SDE subsidy is therefore the difference
amount between the market value and the production cost. It thus acts
as a Contract for Difference (CfD).
Both, installations already with a capture unit installed and those without
can apply for funding, if the former adds at least one compressor to the
installation. New industry installations with a CO2 capture and storage
as part of the project are eligible for support for the additional costs
of CCS. The notion of CCS as a transitional technology for industrial
decarbonisation is reflected in the decision to not offer any new SDE++
funding contracts for CCS after 2025.
SDE++ is only available for CO2 that is stored and does not cover the cost for CO2 capture that is instead used,
for example in horticultures. To allow an emitter to both use and store captured CO2, and receive respective
financial support for the latter, the operator has to allocate the CO2 that is stored through the associated
share of full-load hours.
To ensure the timelines, pricing and scale of CO2 capture and transport and storage are aligned, project
applications need to provide a declaration with the T&S operating parties to this effect. To enable CO2
transport hubs and prevent the higher risk and cost of single sink to source T&S, multiple emitters can,
and should, apply with the same T&S partners that in turn have to guarantee sufficient available capacity
for all their commitments. The contract amount is generally paid out to the emitter to cover own capture
costs and remunerate the T&S services. However, subsidy payments can also be made directly to the T&S
operators through a separate agreement between the partners and the government. Due to the complexity
and scale of CCS projects, a contracting period of 2.5 years and implementation period of 5 years are in place.
The first SDE++ round ran between November and December 2020 with a total budget of €5 billion. Each
capture project bid in a multi-phase tender process for a 15-year subsidy contract. The process ranks projects
based on levels of subsidy intensity. Only projects below the respective cost threshold, i.e. base rate, were
able to apply during each phase.

BELLONA UK 6
The subsidy intensity is calculated by taking the application amount (the base rate) minus the long-term
price (for CCS this is €/t CO2) divided by the emission factor. The long-term price is the expected subsidy
requirement per tonne of CO2. The emission factor represents the rate of CO2 stored per tCO2 currently
emitted and thereby reflects the cost per tonne of CO2 emissions avoided12. Subsidies are paid out per
measured unit of output, in this case stored CO2. The subsidy intensity equation for CCS looks like this:
To exemplify: For a new CCS project that has a base rate of 95€ (costs, for example, 70€ for capture and 25€
for transport and storage per tonne of CO2), with a long-term price (i.e. correction amount, the average ETS
price) of 37€23 and a 90% emission factor, read: capture rate, the ‘Subsidy intensity’ would be 64.44€/tCO2.
Assuming phasing and rate levels from Figure 1, this project would be eligible to compete during the first
phase of the tender process. A competing project that has a lower cost (base rate) of 90€ yet an emission
factor of only 80% would result in a Subsidy Intensity of 66.25€/tCO2. In this case, the first project would be
more likely to receive the SDE++ contract due to his lower intensity (€/t CO2 abated).
The subsidy that is ultimately granted represents the maximum amount received over the duration period
of the subsidy. This amount reflects the specified capacity and production, the latter being capped at a
maximum full-load hours for each technology. If production is less, then the total subsidy amount will be
adjusted accordingly.
2 Note the term ‘avoided’ here refers to the actual CO2 prevented to reach the atmosphere regarding CCS and the ex-pected emission effect of renewable electricity on the grid.3 This is the long-term price used in the example by the Dutch government: https://english.rvo.nl/sites/default/files/2020/11/Brochure%20SDE%20plus%20plus%202020.pdf
Figure 1: Phasing and rates for CCS, Source: RVO,2020
Phasing and rates for low-carbon production
Maximum phase amout/base amount Base greenhouse gas amount
2020 provisional correction amount
Maximum full-load
hours
Commissioning period
Subsidy term
Category Phase 1 €/unit of product
Phase 2 €/unit of product
Phase 3 €/unit of product
Phase 4 €/unit of product
€/unit of product
ETS facility (inlcu, ETS correction)
€/unit of product
Non-ETS facility €/
unit of product
hours/year years years
CO2 capture and storage (CCS)
Existing CO2 capture in existing production processes (4000 full-load hours)
86,9640 86,9640 86,9640 86,9640 25,264 25,264 25,164 4000 5 15
Existing CO2 capture in existing production processes (8000 full-load hours)
62,4760 62,4760 62,4760 62,4760 25,264 25,264 25,164 8000 5 15
New CO2 capture in exist-ing production processes (8000 full-load hours)
96,1773 100,3310 100,3310 100,3310 25,264 25,264 25,164 8000 5 15
New CO2 capture in new production processes (8000 full-load hours)
92,3040 92,3040 92,3040 92,3040 25,264 25,264 25,164 8000 5 15
Electrification
Electrolytic hydrogen production
0.0512 0.0556 0.0764 0.1030 0.027 0.032 0.032 2000 4 15
Unit of product is in tonne CO2 for CO2 capture and storage and in kWh for the other categories.
Subsidy intensity [euros/tonne CO2] =(application amount [euros/tonne CO2] -long-term price [euros/tonne CO2] / (emission factor [kg CO2/tonne CO2/] / 1,000
CCS subsidyintensity

BELLONA UK 7
The SDE++ categorises according to capture (pre or post-combustion) and conversion types (gaseous or
liquid) and whether the installation is pre-existing or new-built. These categories are reflected in different
base-amounts for the phasing. There is, however, no reflection of the distance to the storage site. Nor is
there a sustainability criterion that reflects on the long-term value and necessity of a particular industry
in a net-zero future. The fundamental approach of the system remains to ensure lowest cost projects and
prevent excessive pricing for the T&S service.

BELLONA UK 8
The Carbon Tax: raising the floor of the carbon price
The Dutch carbon tax came into force on January 1st, 2021. It aims to
bridge the gap between EU and Dutch emission reduction targets.
Although a state tax, the Dutch Emissions Authority (NEa) is the
responsible body instead of tax authorities. The income from the CO2
tax will be used to finance green initiatives in the form of subsidies.
The level of the tax, or carbon rate, has been set out from now until
2030; from €30/tCO2 in 2021 to €125/tCO2 by 2030. Power generation is
technically exempt from the carbon tax but subject to a ‘minimum CO2
electricity price’ with a trajectory of €12.30/tCO2 in 2021 to €31.90/tCO2
by 2030. The tax mainly applies to emitters covered by the EU ETS, but
also extends to waste incinerators. Others are exempt, such as district
heating or greenhouse horticultures.
Crucially, CO2 from industrial processes that is captured and stored is excluded from this carbon tax, since
CO2 is not emitted.
The tax acts effectively as a floor price under the EU ETS, by topping up the EUA price when it is below the
level of the tax. The effective tax level is therefore the difference between the EUA price and the carbon tax
rate that year. For example, if the tax is €30/tCO2 and the EUA price is €25/tCO2 a tax of €5/tCO2 is payable. If
the EUA price is above the level of the carbon rate, no tax is paid. In this way the tax determines a minimum
level for the carbon price (a floor price) but does not prevent the carbon price from going higher if EUA prices
exceed the statutory rate. There is no negative carbon tax rate, with government paying back the difference.
Installations that are not part of the ETS but covered under the new tax, such as waste incinerators, need to
pay the tax in full.
Similar to the free allowances under the EU ETS, the Dutch carbon tax has a carbon-leakage protection
mechanism, providing so called ‘dispensation rights’ to energy intensive industries (EII) exposed to
international competition. Similar to EUA free allowances these dispensation rights effectively remove the
carbon costs for a benchmark level of emissions.
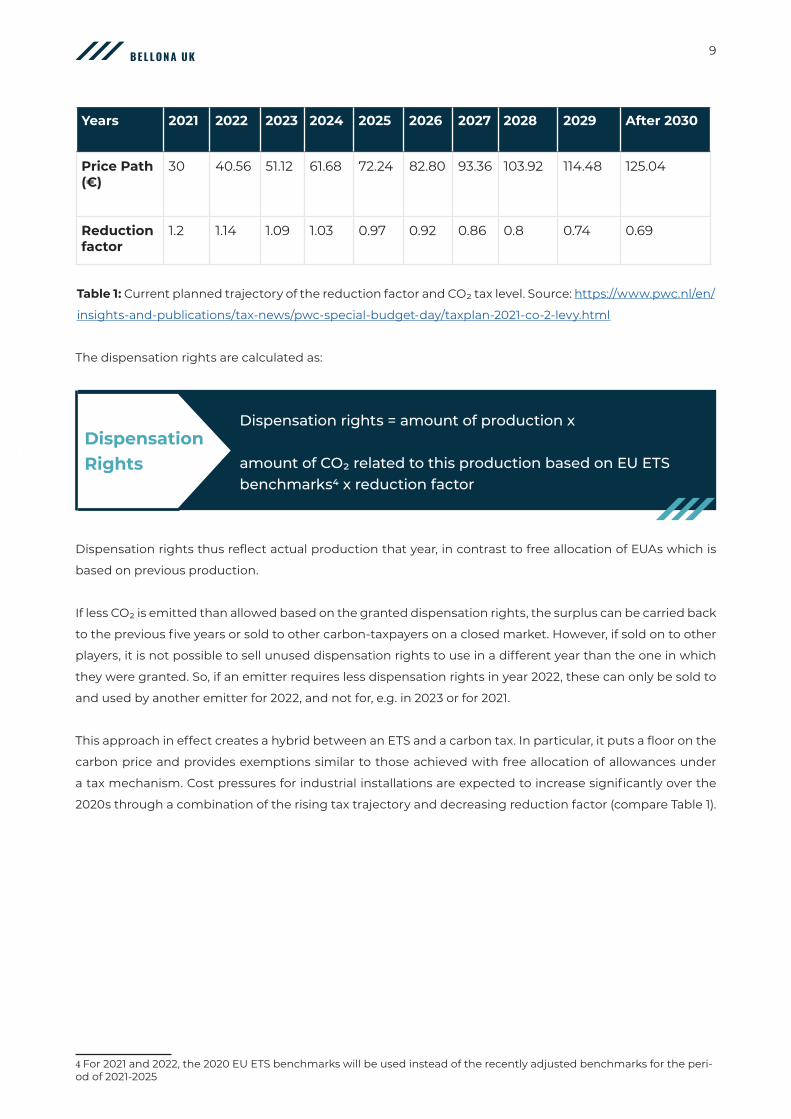
To ensure there remains enough “stick” to drive emission reduction investments, dispensation rights will
decrease annually in accordance with the set ‘reduction factor’. The reduction factor is 1.2 for 2021, due to fall
below 1 by 2025 and to 0.69 by 2030.
Years 2021 2022 2023 2024 2025 2026 2027 2028 2029 After 2030
Price Path (€)
30 40.56 51.12 61.68 72.24 82.80 93.36 103.92 114.48 125.04
Reduction factor
1.2 1.14 1.09 1.03 0.97 0.92 0.86 0.8 0.74 0.69
BELLONA UK 9
The dispensation rights are calculated as:
Dispensation rights thus reflect actual production that year, in contrast to free allocation of EUAs which is
based on previous production.1
If less CO2 is emitted than allowed based on the granted dispensation rights, the surplus can be carried back
to the previous five years or sold to other carbon-taxpayers on a closed market. However, if sold on to other
players, it is not possible to sell unused dispensation rights to use in a different year than the one in which
they were granted. So, if an emitter requires less dispensation rights in year 2022, these can only be sold to
and used by another emitter for 2022, and not for, e.g. in 2023 or for 2021.
This approach in effect creates a hybrid between an ETS and a carbon tax. In particular, it puts a floor on the
carbon price and provides exemptions similar to those achieved with free allocation of allowances under
a tax mechanism. Cost pressures for industrial installations are expected to increase significantly over the
2020s through a combination of the rising tax trajectory and decreasing reduction factor (compare Table 1).
4 For 2021 and 2022, the 2020 EU ETS benchmarks will be used instead of the recently adjusted benchmarks for the peri-od of 2021-2025
Table 1: Current planned trajectory of the reduction factor and CO2 tax level. Source: https://www.pwc.nl/en/
insights-and-publications/tax-news/pwc-special-budget-day/taxplan-2021-co-2-levy.html
Dispensation Rights
Dispensation rights = amount of production x
amount of CO2 related to this production based on EU ETS benchmarks4 x reduction factor

BELLONA UK 10
The SDE++, ETS Free Allowances and the CO2 Tax in practice
As with other emission savings technologies, emitters do
not have to purchase ETS allowances for CO2 that has been
captured and stored. In addition, any installation receiving
SDE++ support retains its free allowances under the EU ETS.
The incentive to invest in carbon capture, transport and
storage under the SDE++ therefore functions in two ways.
i) The money previously paid to buy ETS allowances for
emitted CO2 is now invested into a technology that prevents
CO2.
ii) Free allowances previously used to cover emissions, can
now be sold.
Current free allowance rates are typically at about 80% against the benchmark emissions. It is therefore safe
to assume that an average industrial installation will be able to cover all residual emissions (for example in
case of a 90% capture rate about 10% of current emissions) through free allowances and trade the remaining
allowances.
As with the ETS, CO2 that is captured and stored does not incur a CO2 tax under Dutch law. Through the
dispensation rights, a share of CO2 emissions is also exempt. If an installation produces 500Mt of output and
emits 1.5tCO2/tonne of product, the calculation of CO2 tax dispensation rights would look as follows:
By 2030, this amount will have reduced to 517MtCO2 under the reduction factor of 0.69 and the current
benchmark. In practice the benchmark is also likely to reduce.1
An installation deploying CCS under the current policy framework is unlikely to require purchasing ETS
allowances or paying a CO2 tax, due to the retention of free allowances and dispensation rights under the
tax. This provides further incentive to reduce emissions, complementing the cost recovery framework
under the SDE++ for the CCS technology itself. The possible reflection of CCS emission reductions in future
ETS benchmarks (e.g. reducing from 1.5tCO2/tonne of output to 0.15tCO2/tonne of output) would, however,
reduce the value of free allocation, and this would lead to a need for further support.
5 1.2 in 2020, reduced to 0.69 by 2030
Production amount X CO2 related to this production (EU ETS benchmark) X reduction factor5
500Mt x 1.5tCO2/tonne of output x 1.2 = 900MtCO2
Calculation of CO2 tax dispensation rights

BELLONA UK 11
Delivering CCS for Industry in the Netherlands; and beyondThere are several CCS project clusters under consideration and development in the Netherlands, for example
at the Chemelot and Terneuzen clusters, and at waste incinerators across the country. The Porthos Project
at the Port of Rotterdam and the Athos project connecting industry around the Nordzeekanaal and the Tata
Steel Works at Ijmuiden stand out in terms of strategic importance for Dutch climate plans to be achieved.
Porthos: Oversizing the Backbone of Industrial Decarbonisation in the region
Industry located in the Port area have been cutting emissions over the past years, yet still emit over 13.5%
of total Dutch emissions, or over 25MtCO2 a year (2019 data)1. The Porthos project is a coalition of the Port
of Rotterdam, EBN and Gasunie all of which are entirely publicly owned, either through the Rotterdam
municipality or the Dutch government. The project is developing a backbone CO2 infrastructure in the port
area, which is to be operational by 2024. It is currently the most advanced large-scale CCS project within the
EU.
The Porthos infrastructure is to service both emitters in the immediate proximity to the port, and, in the
future, emitters from further afield. This will most likely be via the rivers Meuse and Rhine towards the Dutch
chemical cluster at Chemelot and the German industrial heartland in North Rhine Westphalia. As such,
despite current expected levels of 2.5 MtCO2 for T&S in the Port area, there are plans to build an infrastructure
(i.e. pipeline) able to accommodate 10 MtCO2 per annum. Given the SDE++ only remunerates actually stored
CO2, the commercial risk of oversizing infrastructure is absorbed by EBN and Gasunie.
6 https://www.portofrotterdam.com/en/news-and-press-releases/carbon-emissions-port-rotterdam-drop-swifter-nation-al-average
BELLONA UK 12
Athos: Integrating CO2 Usage and Storage for Industry
The Athos project has been initiated by the Port of Amsterdam, TATA Steel, Gasunie and EBN. It seeks to
connect and integrate industry around Ijmuiden and Amsterdam. At its heart stance the single largest
emitter and job provider in the Netherlands: the integrated steel mill of TATA steel with about 5 million
tonnes CO2 per year. Athos entails a CCS component for a share of the emissions in the region. Storage is to
take place into empty aquifers, oil or gas fields off the coast of the northern Netherlands. The project is still
in the planning phase with operations only to begin in the second half of this decade.
Together with the ports of Antwerp and Zeebrugge, who announced a merger in early 2021, Rotterdam also
forms the TransPorts project. For this trans-European CO2 infrastructure dimension, Porthos was awarded
Project of Common Interest status by the European Commission under the Connecting Europe Facility and
received over €100 million in subsidies in February 2021.
During the first round of the SDE++, companies from the port area totalling some 2.5Mt CO2 applied for
funding. All are connected to the shared Porthos T&S infrastructure. In May 2021, the Dutch government
awarded 2 bn € in SDE++ subsidy to six projects to capture their CO2 and remunerate Porthos for the
operation of the transport and storage component.

www.bellona.org2021
BELLONA UK 13
More Bellona Publications on the topics of Industrial Decarbonisation and CCS
An Industry’s Guide to Climate Action
https://bellona.org/publication/an-industrys-guide-to-climate-change
Building Back Greener
https://bellona.org/publication/policy-brief-building-back-greener-uk
Laying the Foundations for a Net Zero Society
https://bellona.org/publication/joint-paper-laying-the-foundations-for-a-net-zero-society
Norway’s Longship CCS Project
https://bellona.org/publication/briefing-norways-longship-ccs-project
Models for Transport and Storage of Captured CO2
https://bellona.org/publication/models-for-transport-and-storage-of-captured-co2
Contract Incentives for Industrial Carbon Capture
https://bellona.org/publication/contract-incentives-for-industrial-carbon-capture