the indodairy smallholder survey (ishs) from farm-to-fact · the indodairy smallholder survey...
TRANSCRIPT
The IndoDairy Smallholder Survey (ISHS)From Farm-to-Fact
Policy Roundtable Discussion9 October 2018
Jack HetheringtonThe Centre for Global Food and Resources,
The University of [email protected]

Acknowledgements
• The Australian Centre for International Agricultural Research (ACIAR)– AGB/2012/099: Improving Milk Supply, Competitiveness and Livelihoods of
Smallholder Dairy Chains in Indonesia
• Contributors to this research:
– The Centre for Global Food and Resources (CGFAR), The University of Adelaide:• Rohan Yargop, Jack B. Hetherington, Wendy J. Umberger, Julianne Haensch,
Rida Akzar
– The Indonesian Centre for Agricultural Socio Economic and Policy Studies (ICASEPS), The Indonesian Agency for Agricultural Research and Development (IAARD), The Ministry of Agriculture:• Erwidodo, Handewi S. Purwati, Ening Ariningsih, Erma Suryani, Iwan Setiajie,
Tuti Bastuti
– Australasian Dairy Consultants / Subtropical Dairy:• Brad Granzin
– Bogor Agricultural University (IPB)
– The Indonesian Centre for Animal Research and Development (ICARD), IAARD
2

Factsheets
Factsheet 1: Introduction to the IndoDairy
Factsheets
Factsheet 2: IndoDairy Smallholder
Household Survey Sampling Design and
Survey Roll-out
Factsheet 3: Overview of Household and
Farm Characteristics
Factsheet 4: Farmer’s Attitudes, Perceptions
of Change and Future Aspirations
Factsheet 5: Dairy Farm Inputs
Factsheet 6: Milk Productivity, Price and
Quality
Factsheet 7: Dairy Farming Costs, Revenue
and Profitability
Lembar Fakta 1: Pendahuluan: Proyek
“IndoDairy” & Survei Rumah Tangga Peternak
IndoDairy
Lembar Fakta 2: Survei Rumah Tangga
Peternak IndoDairy
Lembar Fakta 3: Gambaran Karakteristik
Rumah Tangga dan Peternakan Sapi Perah
Lembar Fakta 4: Sikap, Persepsi terhadap
Perubahan, dan Harapan Peternak
Lembar Fakta 5: Input dalam Usaha Ternak
Sapi Perah
Lembar Fakta 6: Produktivitas, Harga dan
Kualitas Susu
Lembar Fakta 7: Biaya, Pendapatan, dan
Profitabilitas
https://www.indodairy.net/resources/ https://www.indodairy.net/publikasi/3

Attitudes and perceptions of change
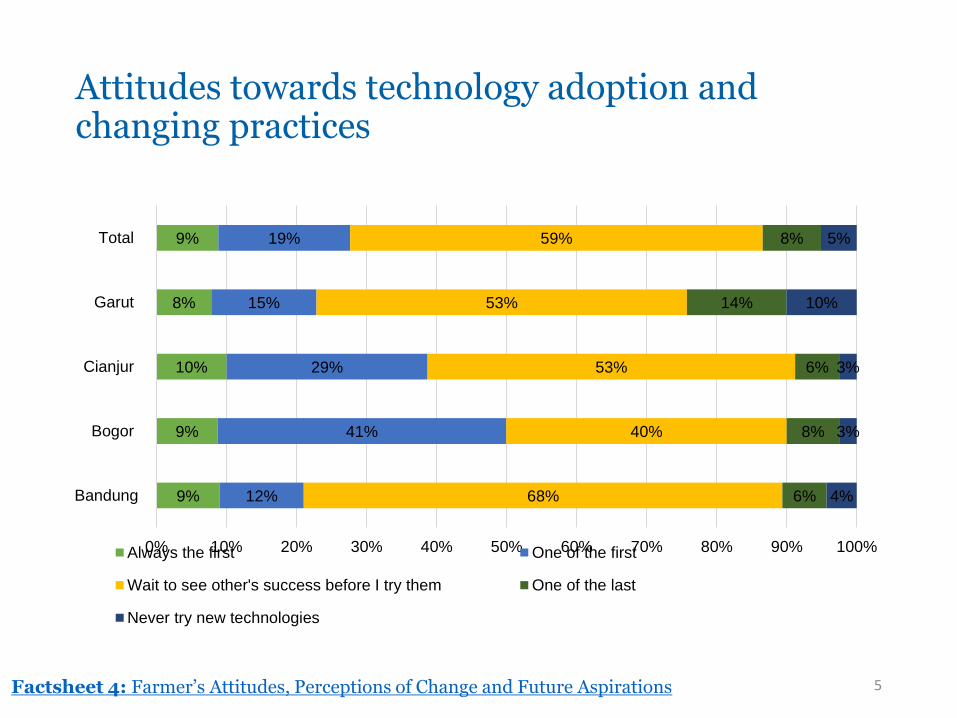
Attitudes towards technology adoption and changing practices
9%
9%
10%
8%
9%
12%
41%
29%
15%
19%
68%
40%
53%
53%
59%
6%
8%
6%
14%
8%
4%
3%
3%
10%
5%
0% 10% 20% 30% 40% 50% 60% 70% 80% 90% 100%
Bandung
Bogor
Cianjur
Garut
Total
Always the first One of the first
Wait to see other's success before I try them One of the last
Never try new technologies
Factsheet 4: Farmer’s Attitudes, Perceptions of Change and Future Aspirations 5

Perceptions: Current rating and changes since 2014
-1.00 -0.50 0.00 0.50 1.00
Price of milk
Price of concentrates
Quality of grass and forages
Availability of land to purchase
Availability of grass and forages
Availability of concentrates
Availability of dairy nutritional information
Availability of technologies to improve milk yields
Availability of marketing information
Availability of credit
Availability of veterinary services
Availability of veterinary medicines
Availability of extension services
Number of milk buyers
Roads in your district
Farmers' perception of change in availability and quality of inputs and services since 2014
Farmers' current rating of availability and quality of inputs and services
Factsheet 4: Farmer’s Attitudes, Perceptions of Change and Future Aspirations 6
Some notable differences between districts
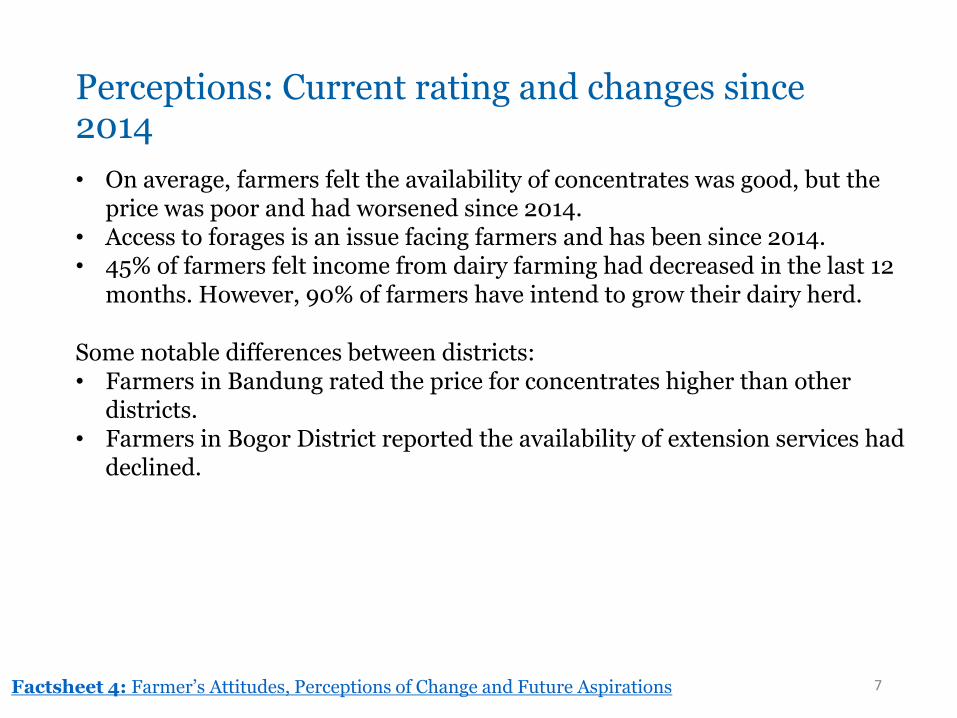
Perceptions: Current rating and changes since 2014
Factsheet 4: Farmer’s Attitudes, Perceptions of Change and Future Aspirations 7
• On average, farmers felt the availability of concentrates was good, but the price was poor and had worsened since 2014.
• Access to forages is an issue facing farmers and has been since 2014. • 45% of farmers felt income from dairy farming had decreased in the last 12
months. However, 90% of farmers have intend to grow their dairy herd.
Some notable differences between districts:• Farmers in Bandung rated the price for concentrates higher than other
districts. • Farmers in Bogor District reported the availability of extension services had
declined.

8
19%
19%
33%
23%
32%
19%
28%
46%
49%
63%
39%
31%
0% 20% 40% 60% 80% 100%
Bandung
Bogor
Cianjur
Garut
Increased No change Decreased
Change in total income received from
milk sales in past 12 months.
36%
34%
33%
26%
28%
25%
28%
38%
36%
41%
40%
36%
0% 20% 40% 60% 80% 100%
Bandung
Bogor
Cianjur
Garut
Increased No change Decreased
Change in total number of dairy cattle in
the past 12 months.
12%
16%
24%
12%
56%
36%
46%
64%
32%
48%
30%
24%
0% 20% 40% 60% 80% 100%
Bandung
Bogor
Cianjur
Garut
Increased No change Decreased
Change in total number of milking cows in
the past 12 months.
15%
15%
30%
21%
37%
23%
31%
46%
48%
63%
38%
33%
0% 20% 40% 60% 80% 100%
Bandung
Bogor
Cianjur
Garut
Increased No change Decreased
Change in total average milk produced per
day in the past 12 months.

Production costs, revenue and profits
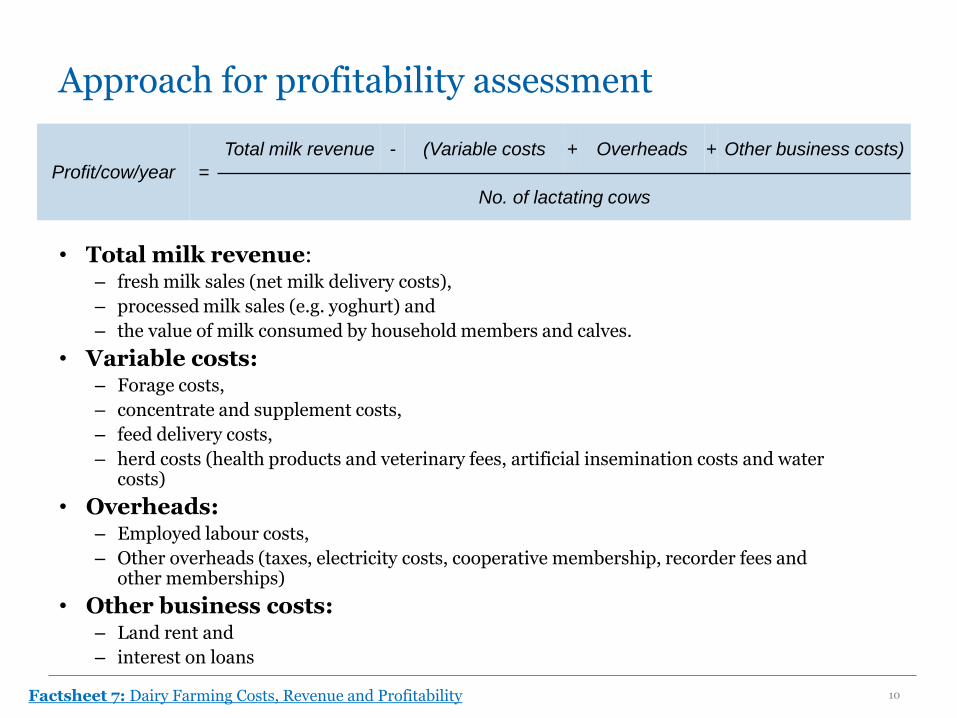
Approach for profitability assessment
• Total milk revenue: – fresh milk sales (net milk delivery costs),
– processed milk sales (e.g. yoghurt) and
– the value of milk consumed by household members and calves.
• Variable costs: – Forage costs,
– concentrate and supplement costs,
– feed delivery costs,
– herd costs (health products and veterinary fees, artificial insemination costs and water costs)
• Overheads:– Employed labour costs,
– Other overheads (taxes, electricity costs, cooperative membership, recorder fees and other memberships)
• Other business costs: – Land rent and
– interest on loans
10
Profit/cow/year =
Total milk revenue - (Variable costs + Overheads + Other business costs)
No. of lactating cows
Factsheet 7: Dairy Farming Costs, Revenue and Profitability

Total annual revenue
• The average total revenue:– 68 million IDR (USD
$4,695) per annum.
• Bogor = highest annual revenue
• Garut = lowest annual revenue
• This is affected by farm size, total farm milk production, and other factors.
11
70.1
103.1
69.8
42.0
67.9
0
20
40
60
80
100
120
Bandung Bogor Cianjur Garut Total
Re
ve
nu
e (
Mil
IDR
/an
nu
m)
Factsheet 7: Dairy Farming Costs, Revenue and Profitability

Cost per litre of milk
• To account for farm size, milk production and other factors – looked at costs per litre of milk produced.
• Average total cost per litre:– 2,750 IDR (USD $0.19/L).
• Highest cost per litre is for concentrates and supplements (e.g. cassava waste).
12
-
500
1,000
1,500
2,000
2,500
3,000
3,500
Bandung Bogor Cianjur Garut Total
Cost (I
DR
/L)
Forage costs Concentrates and supplements
Feed delivery costs Herd costs
Employed labour Other overheads
Other business costs
Factsheet 7: Dairy Farming Costs, Revenue and Profitability

Revenue per litre of milk
• Revenue per litre:– 4,760 IDR (USD $0.33).
• Most revenue from fresh milk sales (e.g to KUDs)– 4390 IDR/litre
• Consumed milk:– 300 IDR/litre
• Processed milk sales:– 70 IDR/litre
• Highest = Bogor
13
-
1,000
2,000
3,000
4,000
5,000
6,000
Bandung Bogor Cianjur Garut Total
Re
ve
nu
e (
IDR
/L)
Fresh milk Consumed milk Processed milk
Factsheet 7: Dairy Farming Costs, Revenue and Profitability
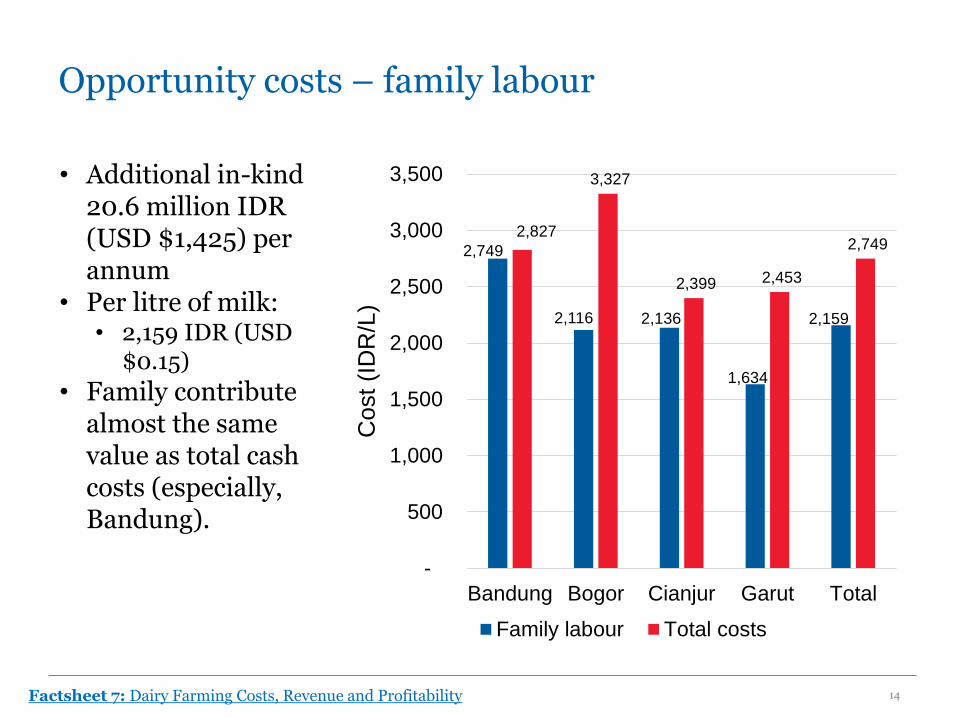
Opportunity costs – family labour
14
2,749
2,116 2,136
1,634
2,159
2,827
3,327
2,399 2,453
2,749
-
500
1,000
1,500
2,000
2,500
3,000
3,500
Bandung Bogor Cianjur Garut Total
Cost
(ID
R/L
)
Family labour Total costs
• Additional in-kind 20.6 million IDR (USD $1,425) per annum
• Per litre of milk: • 2,159 IDR (USD
$0.15)
• Family contribute almost the same value as total cash costs (especially, Bandung).
Factsheet 7: Dairy Farming Costs, Revenue and Profitability

Compare - Costs, Revenue and Profit per litre
15
2,827
3,327
2,399 2,453 2,749
4,703
5,547
4,477 4,578 4,756
1,875 2,220
2,077 2,125
2,007
-
1,000
2,000
3,000
4,000
5,000
6,000
Bandung Bogor Cianjur Garut Total
Valu
e (
IDR
/L)
Production Costs Revenue Profit margin
• Differences between costs and revenue between districts• No significant differences in profit margin
Factsheet 7: Dairy Farming Costs, Revenue and Profitability
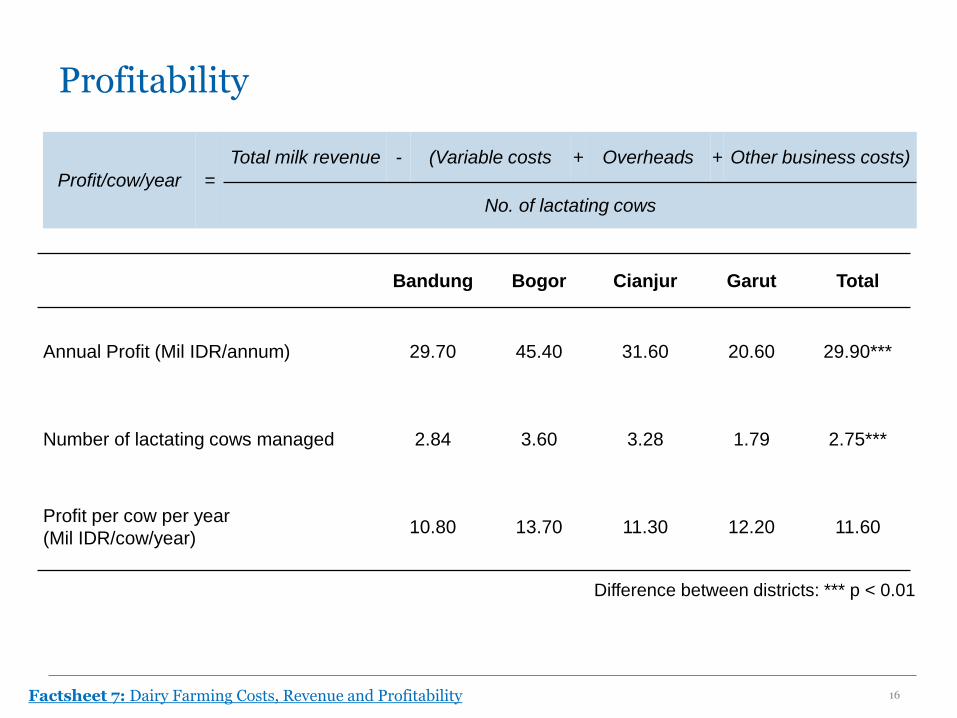
Profitability
Bandung Bogor Cianjur Garut Total
Annual Profit (Mil IDR/annum) 29.70 45.40 31.60 20.60 29.90***
Number of lactating cows managed 2.84 3.60 3.28 1.79 2.75***
Profit per cow per year
(Mil IDR/cow/year)10.80 13.70 11.30 12.20 11.60
16
Profit/cow/year =
Total milk revenue - (Variable costs + Overheads + Other business costs)
No. of lactating cows
Difference between districts: *** p < 0.01
Factsheet 7: Dairy Farming Costs, Revenue and Profitability

Profit quartiles
17
Quartile Description NAverage profit per cow per year
IDR USD1
Quartile 1 Low profits 150 -258,845 -17.90
Quartile 2 Low to mid profits 150 8,831,048 610.74
Quartile 3 Mid to high profits 150 13,800,000 954.39
Quartile 4 High profits 150 23,900,000 1,652.89
1Exchange rate 1 USD = 14,459.50 Indonesian Rupiah on 27 July 2018
Factsheet 7: Dairy Farming Costs, Revenue and Profitability

Comparison of costs and profits per litre by quartiles
18
-
1,000
2,000
3,000
4,000
5,000
6,000
Quartile 1 Quartile 2 Quartile 3 Quartile 4
Valu
e (
IDR
/L)
Forage costs Concentrates and supplementsFeed delivery costs Herd costsEmployed labour Other overheadsOther business costs ProfitFamily labour
Factsheet 7: Dairy Farming Costs, Revenue and Profitability

100%
58%43%
32%
42% 57% 68%
Costs Profit margins
19
Quartile 1 Quartile 3Quartile 2 Quartile 4
Costs and profits (per litre) by quartiles – proportion of total revenue
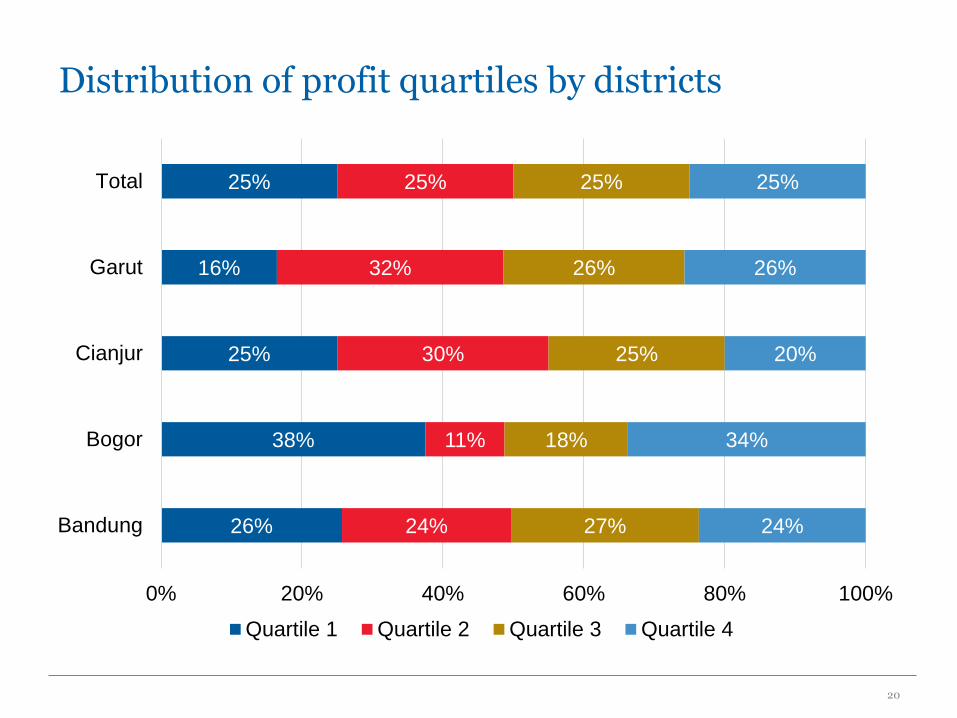
Distribution of profit quartiles by districts
20
26%
38%
25%
16%
25%
24%
11%
30%
32%
25%
27%
18%
25%
26%
25%
24%
34%
20%
26%
25%
0% 20% 40% 60% 80% 100%
Bandung
Bogor
Cianjur
Garut
Total
Quartile 1 Quartile 2 Quartile 3 Quartile 4

Differences in household and farm characteristics

Q1 Q2 Q3 Q4
48% 56% 57% 53%
What is Different Between Profit Quartiles?
-258,845 8,831,048 13,800,00023,900,000
48.5 42.8 48.4 42.3 44.7 38.8 46.6 41.1
Profitability (IDR/cow/year)
Age
Milking cows
Milk production (L/cow/day)
2.9 milking cows 3.3 milking cows 2.7 milking cows 2.1 milking cows
13.5L/cow 14.6L/cow 15.1L/cow 17.1L/cow
Proportion of miking cows of total herd

Milk price
4,4314,396
4,447
4,5624,554
4,506
4,575
4,709
4,2974,267 4,278
4,391
4,000
4,100
4,200
4,300
4,400
4,500
4,600
4,700
4,800
Pri
ce (
IDR
/L)
Average price Highest price Lowest price
Q1 Q2 Q3 Q423

Milk quality knowledge
41%
57%
4%
58%
40%
23%
28%
0%
14%
22%
0%
10%
20%
30%
40%
50%
60%
70%
Total Solids Fat Content Somatic CellCount
Total PlateCount
Milk Density
Do you know what this is? Do you know the measurement for your milk?
24

Concentrates
97.3%96.7%
94.0%
88.0%
82%
84%
86%
88%
90%
92%
94%
96%
98%
Q1 Q2 Q3 Q4
11%Farmers who know the
quality of their
concentrates
14.3
0
5
10
15Average crude
protein content of
concentrates (%)
(n = 65)
Proportion of concentrate use
(% of farmers)
Knowledge and quality of concentrates
are not different between quartiles, but
they are generally low. 25

Summary
• While revenue and costs are different between districts, profit margins are consistent.
• When farmers were grouped by profitability– The least profitable farmers, on average,
make little to no profits.
– The most profitable farmers make 24 mil IDR per cow per year.
• Most profitable farmers:– Manage costs more effectively, in
particular, concentrates and supplements:
• Possibly suggests they are able to procure cost effective feeds and balance cattle diet
– Achieve the highest milk price, some diversification of income.
26

Summary
• Knowledge of milk quality parameters – generally low
– Understanding of the concept was between 40% and 58% for key factors (TPC, fat, total solids, milk density). Somatic Cell Count was 4%
• This could be improved through training and extension activities
– Awareness of their milk quality measurement was less than 30% for all factors
• This could be improved through investment in equipment
• Knowledge of concentrates quality – very low
– Could be addressed through training and testing/labelling of concentrates.
– Protein content should be aiming for 16% - challenging to access raw materials
– Concentrates are an important element to the diet of dairy cattle (energy, protein and other nutrients).
27

Terima kasih!!!!Jack Hetherington
Research Associate
The Centre for Global Food and Resources
The University of Adelaide
www.Indodairy.net