the indian media & entertainment industry 2017
TRANSCRIPT
The Indian Media & Entertainment Industry
2017Trends & Analysis - Past, Present & Future
Chaitanya ChinchlikarVice President – Whistling Woods International
Vice President – Mukta Arts [email protected]
Source: FICCI-KPMG Report 2017
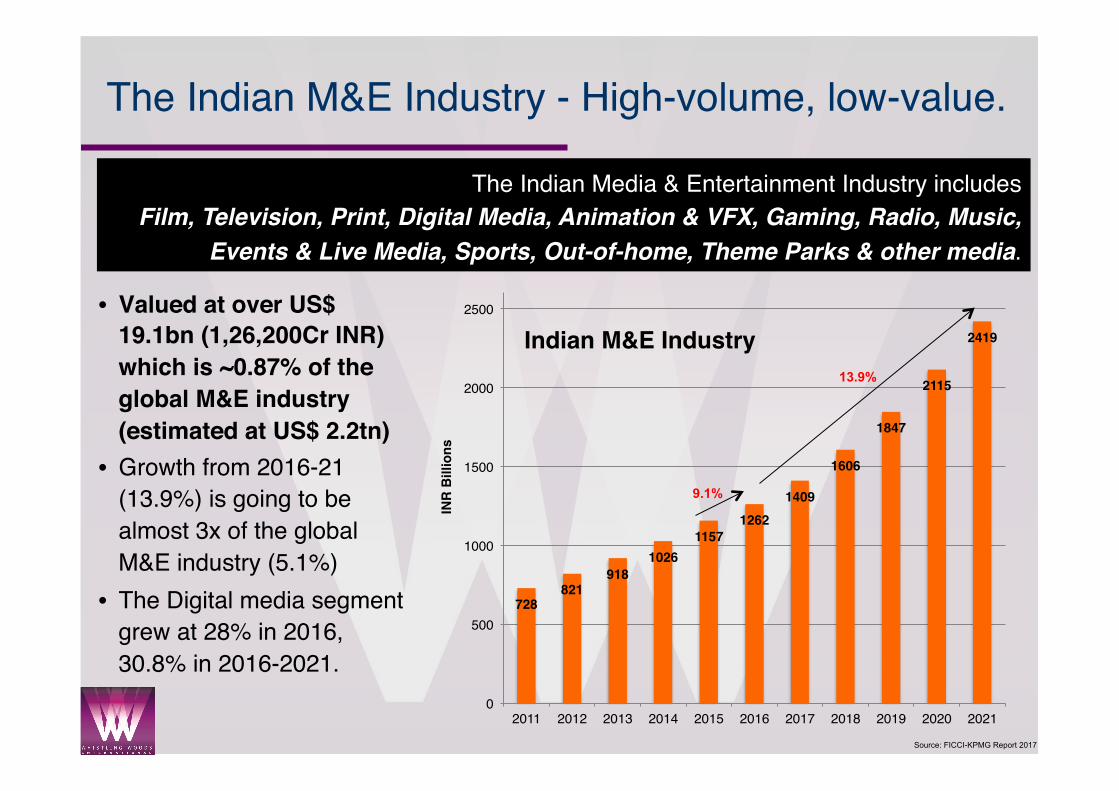
The Indian M&E Industry - High-volume, low-value.
The Indian Media & Entertainment Industry includesFilm, Television, Print, Digital Media, Animation & VFX, Gaming, Radio, Music,
Events & Live Media, Sports, Out-of-home, Theme Parks & other media.
• Valued at over US$ 19.1bn (1,26,200Cr INR) which is ~0.87% of the global M&E industry (estimated at US$ 2.2tn)
• Growth from 2016-21 (13.9%) is going to be almost 3x of the global M&E industry (5.1%)
• The Digital media segment grew at 28% in 2016, 30.8% in 2016-2021.
728821
9181026
11571262
1409
1606
1847
2115
2419
0
500
1000
1500
2000
2500
2011 2012 2013 2014 2015 2016 2017 2018 2019 2020 2021
INR
Bill
ions
Indian M&E Industry
9.1%
13.9%
Source: FICCI-KPMG Report 2017
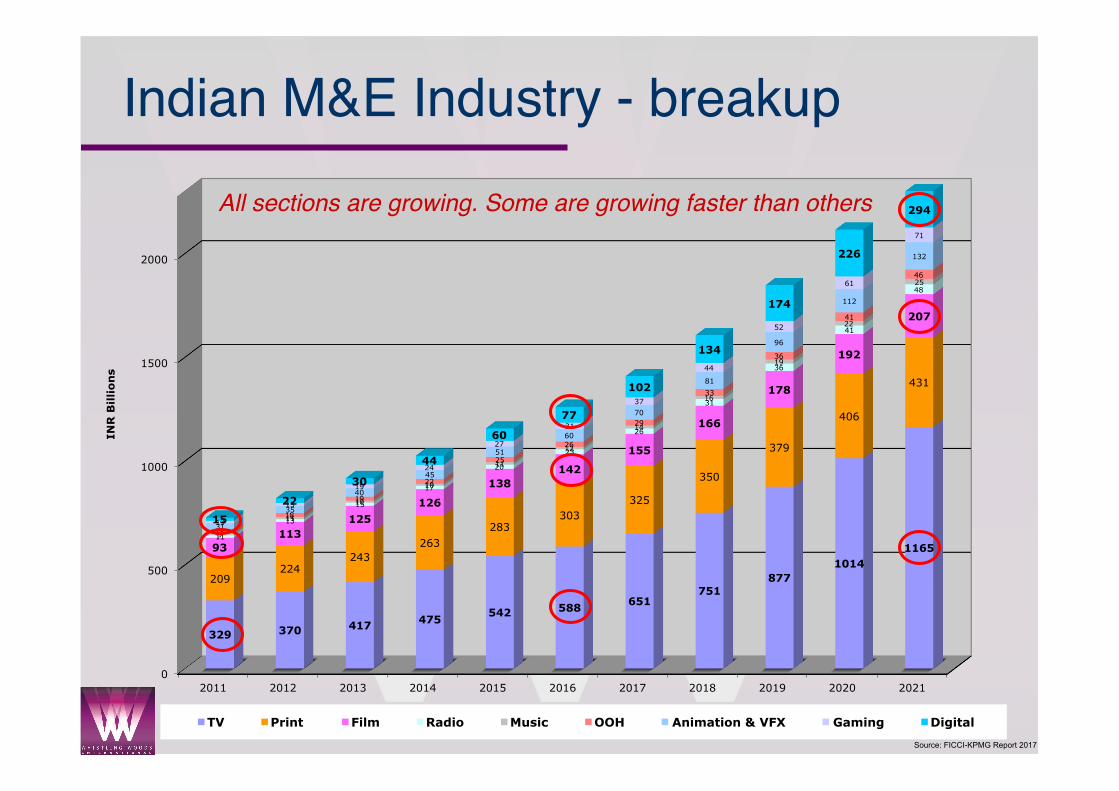
Indian M&E Industry - breakup
0
500
1000
1500
2000
2011 2012 2013 2014 2015 2016 2017 2018 2019 2020 2021
329 370 417 475 542 588
651 751
877 1014
1165
209 224
243 263
283 303
325
350
379
406
431
93 113
125
126
138 142
155
166
178
192
207
11
13
15
17
20
23
26
31
36
41
48
9
11
10
10
11
12
14
16
19
22
25
18
18
19
22
25
26
29
33
36
41
46
31
35
40
45
51
60
70
81
96
112
132
13
15
19
24
27
31
37
44
52
61
71
15
22
30
44
60
77
102
134
174
226
294
INR
Billio
ns
TV Print Film Radio Music OOH Animation & VFX Gaming Digital
All sections are growing. Some are growing faster than others
Source: FICCI-KPMG Report 2017
2011 2012 2013 2014 2015 2016 2017 2018 2019 2020 2021
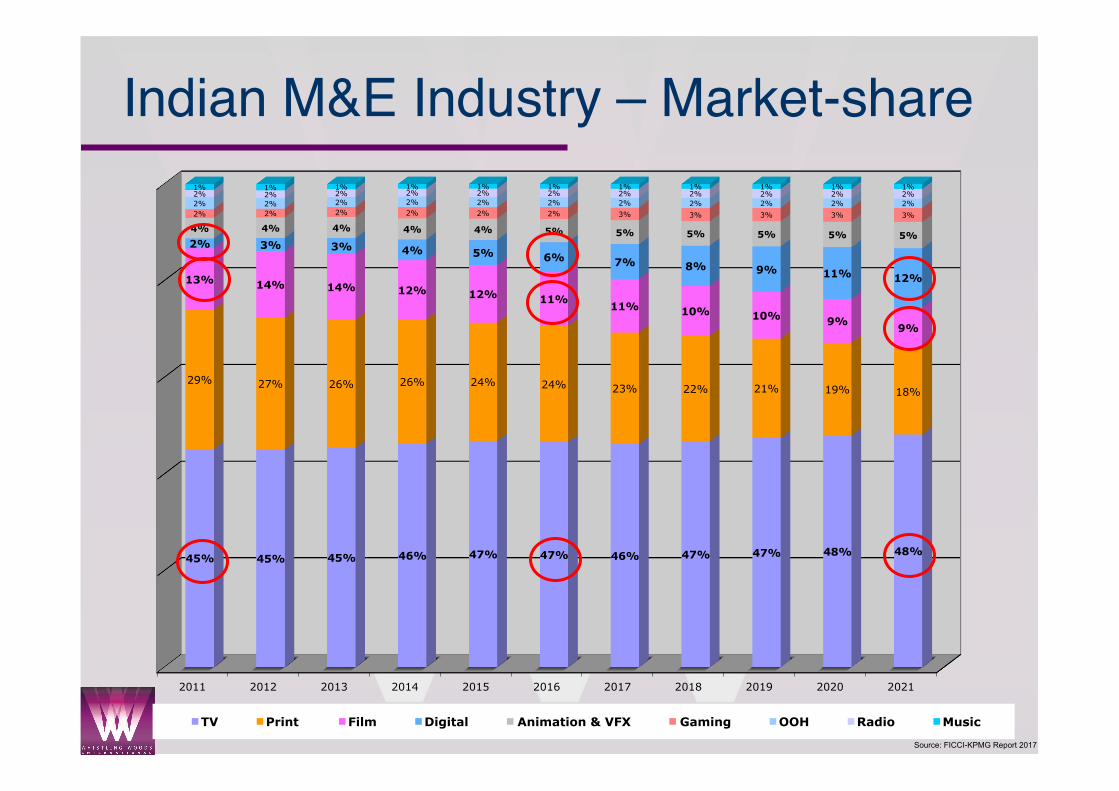
45% 45% 45% 46% 47% 47% 46% 47% 47% 48% 48%
29% 27% 26% 26% 24% 24% 23% 22% 21% 19% 18%
13% 14% 14% 12% 12% 11% 11% 10% 10% 9%
9%
2% 3% 3% 4% 5% 6% 7% 8% 9% 11% 12%
4% 4% 4% 4% 4% 5% 5% 5% 5% 5% 5%
2% 2% 2% 2% 2% 2% 3% 3% 3% 3% 3%
2% 2% 2% 2% 2% 2% 2% 2% 2% 2% 2% 2% 2% 2% 2% 2% 2% 2% 2% 2% 2% 2% 1% 1% 1% 1% 1% 1% 1% 1% 1% 1% 1%
TV Print Film Digital Animation & VFX Gaming OOH Radio Music
Indian M&E Industry – Market-share
Source: FICCI-KPMG Report 2017
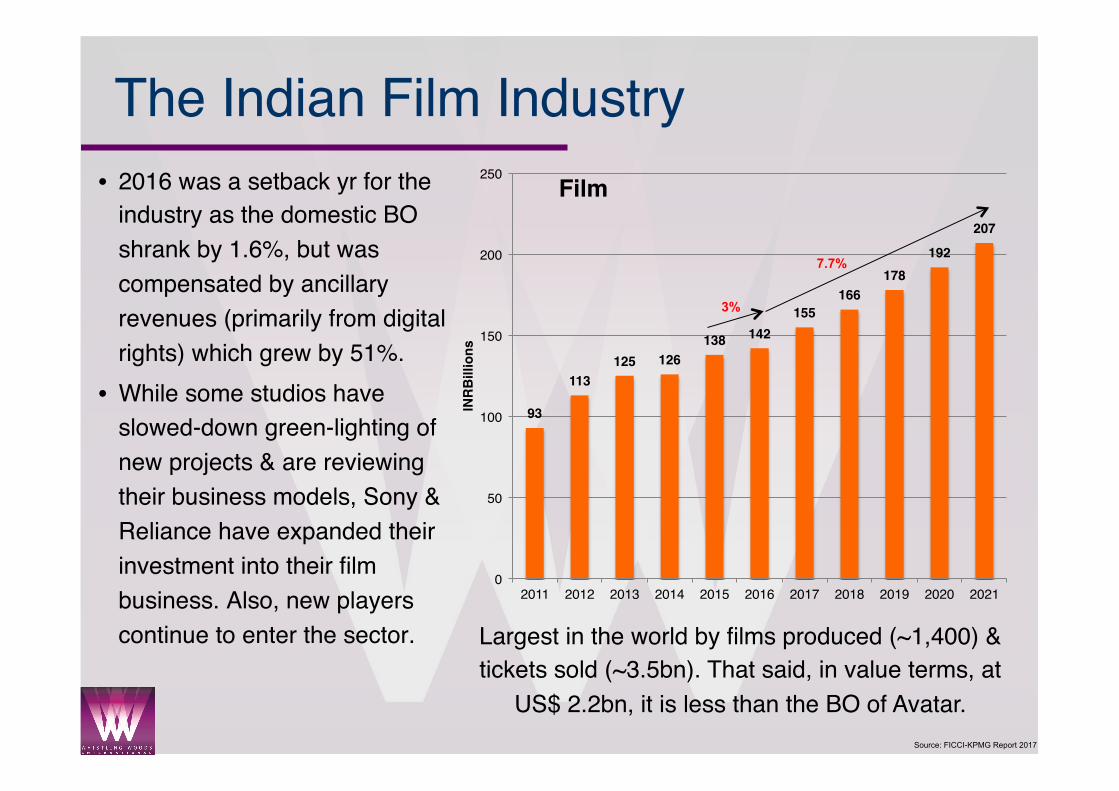
The Indian Film Industry• 2016 was a setback yr for the
industry as the domestic BO shrank by 1.6%, but was compensated by ancillary revenues (primarily from digital rights) which grew by 51%.
• While some studios have slowed-down green-lighting of new projects & are reviewing their business models, Sony & Reliance have expanded their investment into their film business. Also, new players continue to enter the sector. Largest in the world by films produced (~1,400) &
tickets sold (~3.5bn). That said, in value terms, at US$ 2.2bn, it is less than the BO of Avatar.
93
113125 126
138 142155
166178
192
207
0
50
100
150
200
250
2011 2012 2013 2014 2015 2016 2017 2018 2019 2020 2021
INR
Bill
ions
Film
3%
7.7%
Source: FICCI-KPMG Report 2017
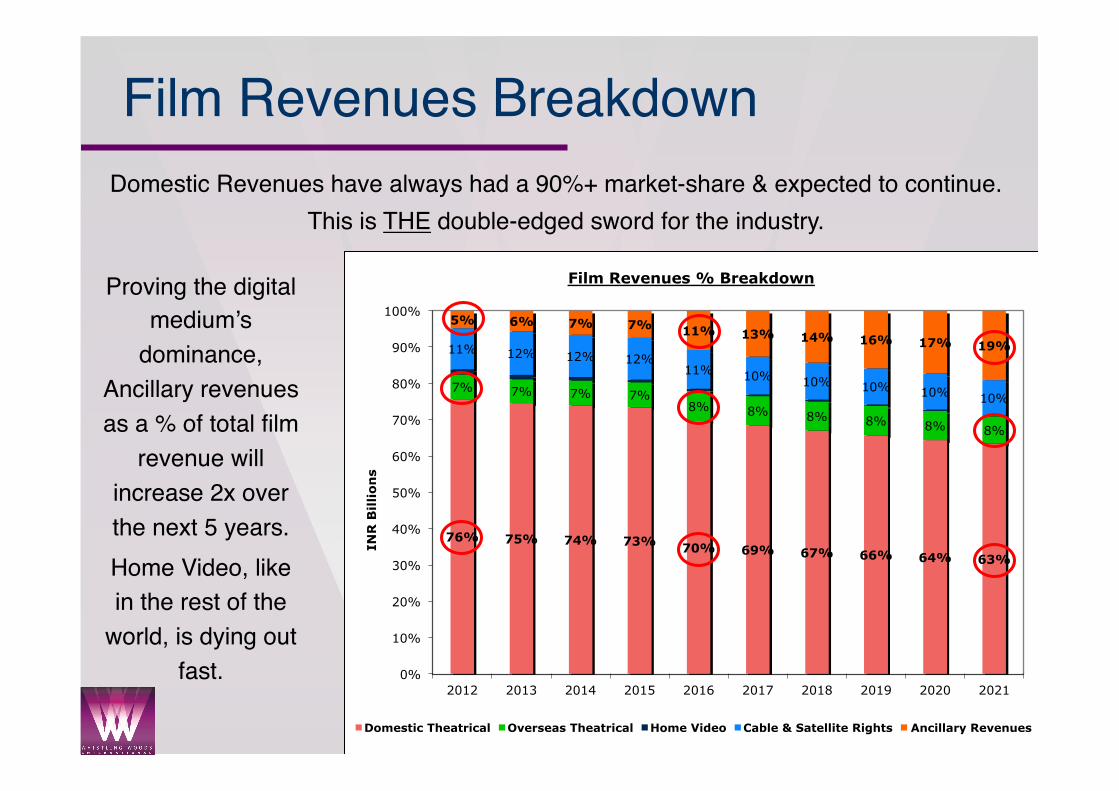
Film Revenues BreakdownDomestic Revenues have always had a 90%+ market-share & expected to continue.
This is THE double-edged sword for the industry.
Proving the digital medium’s
dominance, Ancillary revenues as a % of total film
revenue will increase 2x over the next 5 years.Home Video, like in the rest of the
world, is dying out fast.
76% 75% 74% 73% 70% 69% 67% 66% 64% 63%
7% 7% 7% 7% 8% 8% 8% 8% 8% 8%
11% 12% 12% 12% 11% 10% 10% 10% 10% 10%
5% 6% 7% 7% 11% 13% 14% 16% 17% 19%
0%
10%
20%
30%
40%
50%
60%
70%
80%
90%
100%
2012 2013 2014 2015 2016 2017 2018 2019 2020 2021
INR
Billio
ns
Film Revenues % Breakdown
Domestic Theatrical Overseas Theatrical Home Video Cable & Satellite Rights Ancillary Revenues
Source: FICCI-KPMG Report 2017
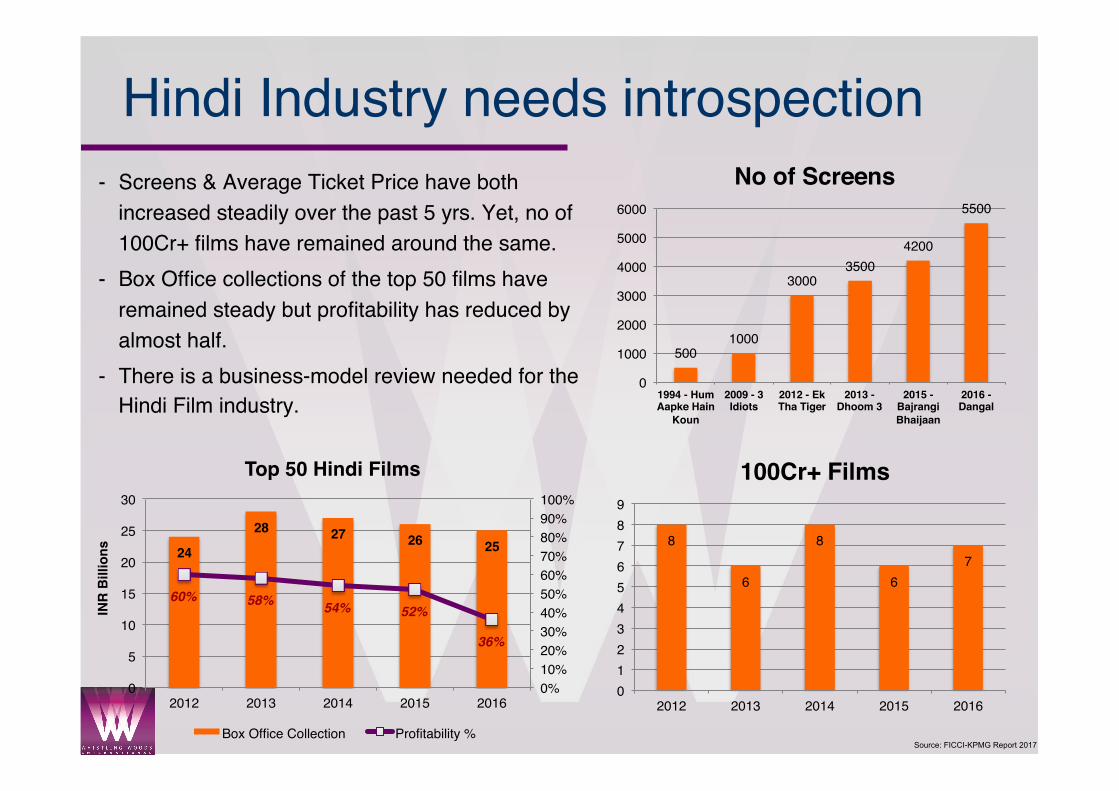
Hindi Industry needs introspection- Screens & Average Ticket Price have both
increased steadily over the past 5 yrs. Yet, no of 100Cr+ films have remained around the same.
- Box Office collections of the top 50 films have remained steady but profitability has reduced by almost half.
- There is a business-model review needed for the Hindi Film industry.
5001000
30003500
4200
5500
0
1000
2000
3000
4000
5000
6000
1994 - Hum Aapke Hain
Koun
2009 - 3 Idiots
2012 - Ek Tha Tiger
2013 - Dhoom 3
2015 - Bajrangi Bhaijaan
2016 - Dangal
No of Screens
8
6
8
67
0123456789
2012 2013 2014 2015 2016
100Cr+ Films
24
28 27 26 25
60% 58% 54% 52%
36%
0%10%20%30%40%50%60%70%80%90%100%
0
5
10
15
20
25
30
2012 2013 2014 2015 2016
INR
Bill
ions
Top 50 Hindi Films
Box Office Collection Profitability %
Source: FICCI-KPMG Report 2017
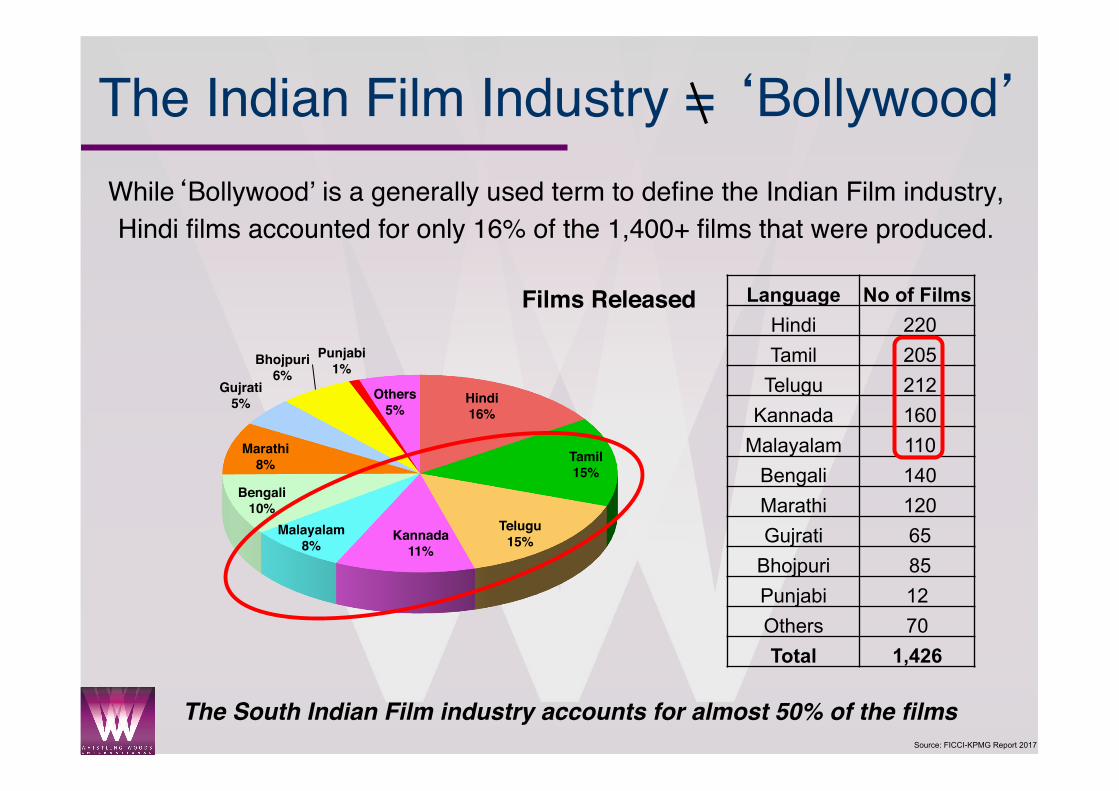
The Indian Film Industry = ‘Bollywood’While‘Bollywood’ is a generally used term to define the Indian Film industry, Hindi films accounted for only 16% of the 1,400+ films that were produced.
The South Indian Film industry accounts for almost 50% of the films
Language No of Films Hindi 220 Tamil 205
Telugu 212 Kannada 160
Malayalam 110 Bengali 140 Marathi 120 Gujrati 65
Bhojpuri 85 Punjabi 12 Others 70 Total 1,426
Hindi16%
Tamil15%
Telugu15%Kannada
11%Malayalam
8%
Bengali10%
Marathi8%
Gujrati5%
Bhojpuri6%
Punjabi1%
Others5%
Films Released
Source: FICCI-KPMG Report 2017
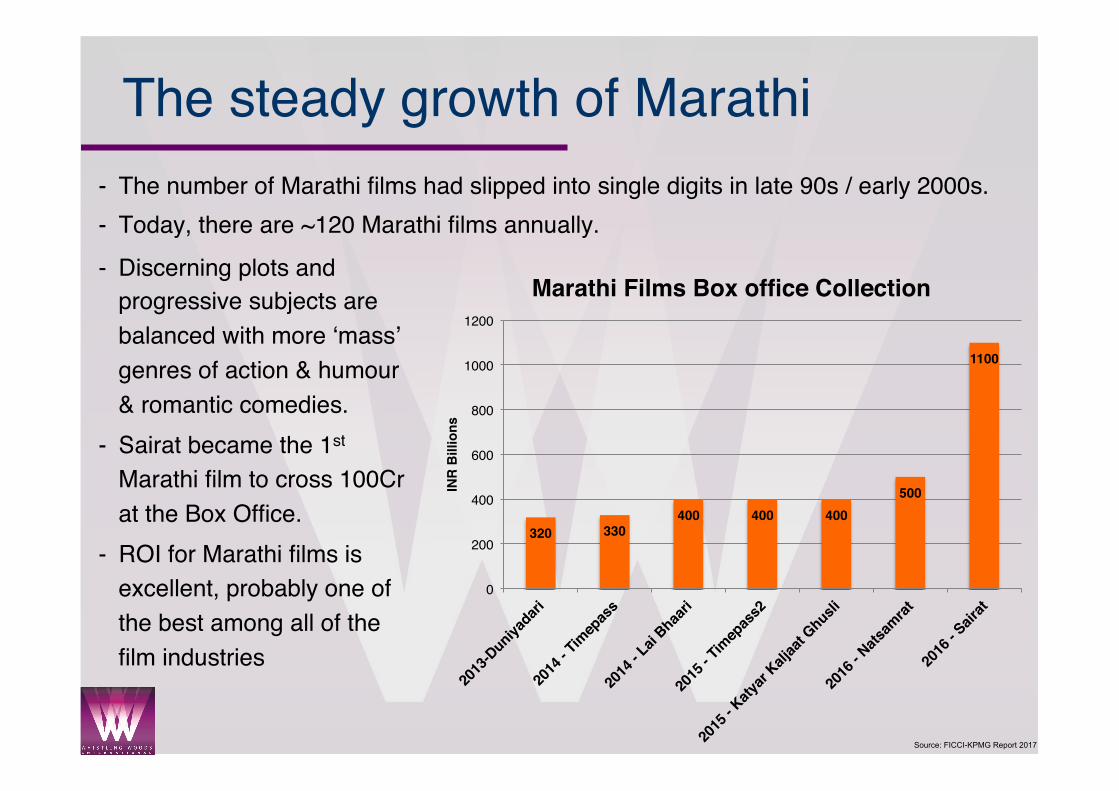
The steady growth of Marathi- The number of Marathi films had slipped into single digits in late 90s / early 2000s.- Today, there are ~120 Marathi films annually.
320 330400 400 400
500
1100
0
200
400
600
800
1000
1200
INR
Bill
ions
Marathi Films Box office Collection- Discerning plots and
progressive subjects are balanced with more ‘mass’ genres of action & humour & romantic comedies.
- Sairat became the 1st Marathi film to cross 100Cr at the Box Office.
- ROI for Marathi films is excellent, probably one of the best among all of the film industries
Source: FICCI-KPMG Report 2017
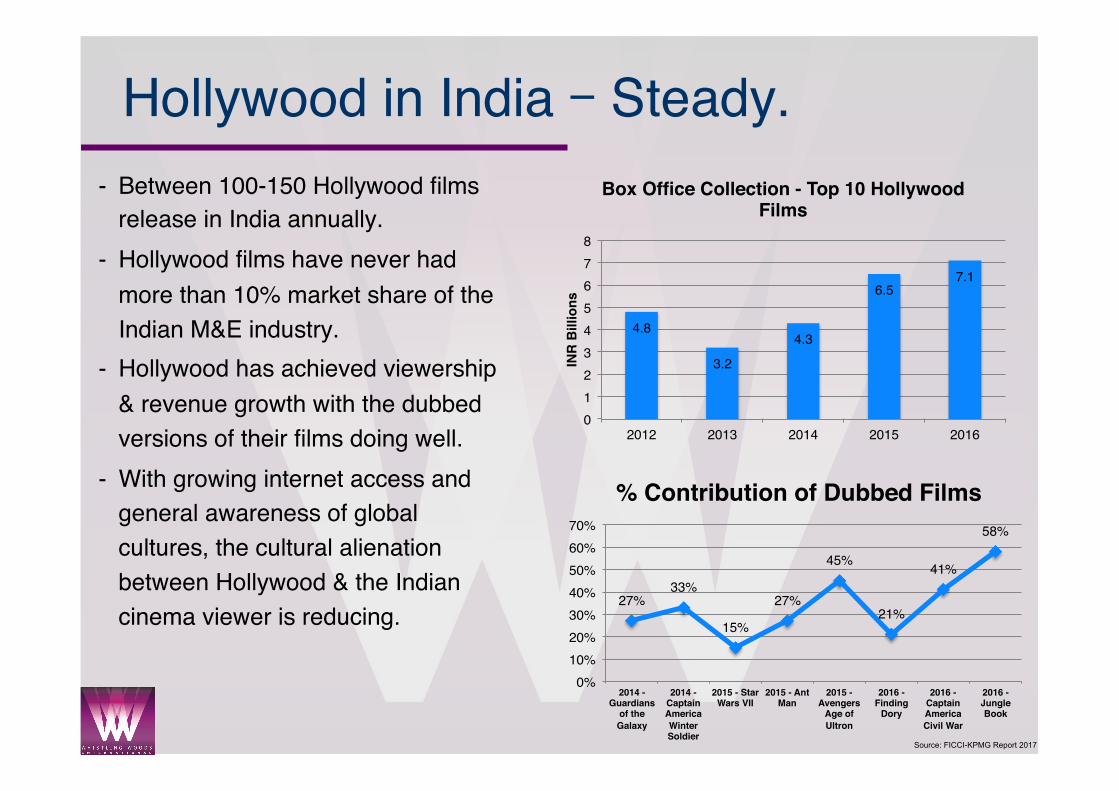
Hollywood in India – Steady.- Between 100-150 Hollywood films
release in India annually.- Hollywood films have never had
more than 10% market share of the Indian M&E industry.
- Hollywood has achieved viewership & revenue growth with the dubbed versions of their films doing well.
- With growing internet access and general awareness of global cultures, the cultural alienation between Hollywood & the Indian cinema viewer is reducing.
4.8
3.2
4.3
6.57.1
012345678
2012 2013 2014 2015 2016
INR
Bill
ions
Box Office Collection - Top 10 Hollywood Films
27%33%
15%
27%
45%
21%
41%
58%
0%10%20%30%40%50%60%70%
2014 - Guardians
of the Galaxy
2014 - Captain America Winter Soldier
2015 - Star Wars VII
2015 - Ant Man
2015 - Avengers
Age of Ultron
2016 - Finding
Dory
2016 - Captain America Civil War
2016 - Jungle Book
% Contribution of Dubbed Films
Source: FICCI-KPMG Report 2017
Film – Revenue SplitWhen you pay Rs 100 for a movie ticket, what is the split?
• Gross – 100% (Rs 100)
• Entertainment Tax – 30% (Rs 30)
• Exhibitor – 50% of balance 70% (Rs 35)
• Distributor – 50% of balance 70% (Rs 35)
• Producer(s) / Co-producer(s) – depends on what deal they have made with distributor – Outright / MG / Commission / Distribution Fee – and with each other.
• P&A funding – deal specific, but usually is Last-In-First-Out.
• Talent – actors / director – may or may not have sweat equity.
Source: FICCI-KPMG Report 2017
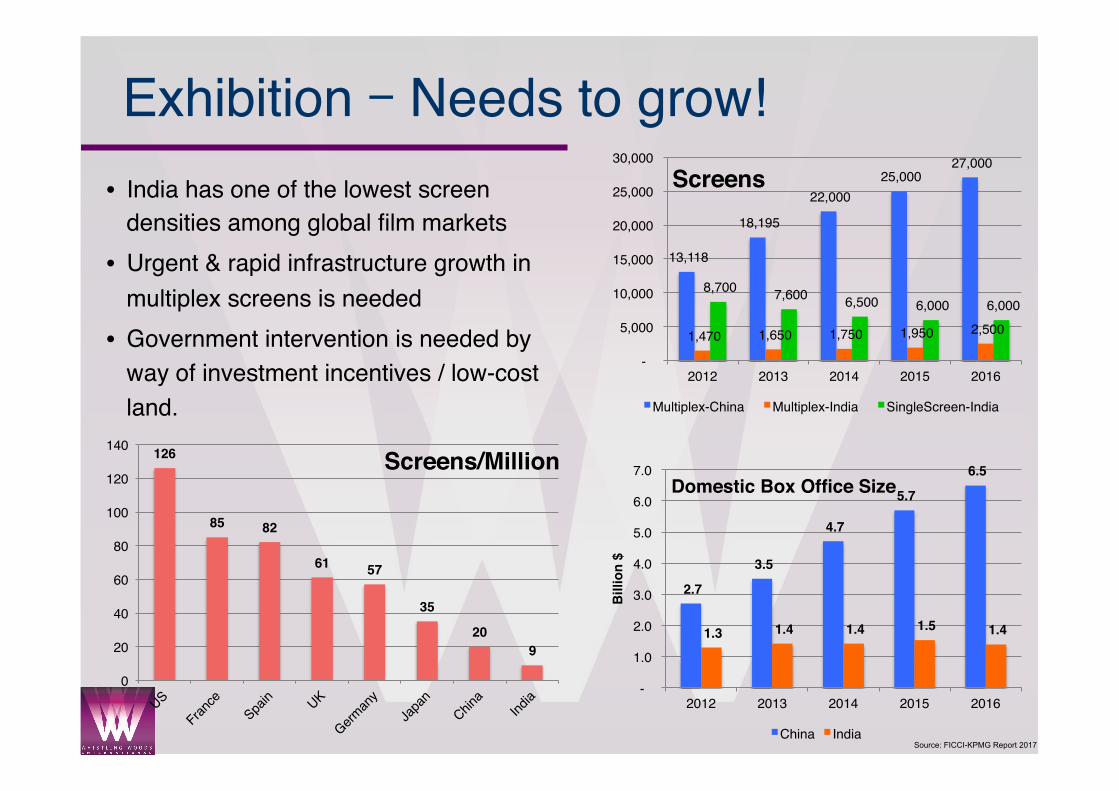
Exhibition – Needs to grow!• India has one of the lowest screen
densities among global film markets• Urgent & rapid infrastructure growth in
multiplex screens is needed• Government intervention is needed by
way of investment incentives / low-cost land.
126
85 82
61 57
35
209
0
20
40
60
80
100
120
140Screens/Million
2.7
3.5
4.7
5.7
6.5
1.3 1.4 1.4 1.5 1.4
-
1.0
2.0
3.0
4.0
5.0
6.0
7.0
2012 2013 2014 2015 2016
Bill
ion
$
Domestic Box Office Size
China India
13,118
18,195
22,000 25,000
27,000
1,470 1,650 1,750 1,950 2,500
8,700 7,600 6,500 6,000 6,000
-
5,000
10,000
15,000
20,000
25,000
30,000
2012 2013 2014 2015 2016
Screens
Multiplex-China Multiplex-India SingleScreen-India
Source: FICCI-KPMG Report 2017
The Indian Film Industry - Key points• Urgent and significant scale needed in Film education.• Screens need to grow to double in 5 yrs; Government incentive
schemes will be needed.• Globally-merchandisable, home-grown IP brand(s) needed.• Hindi industry needs to review its business model. If costs are going to
continue to rise, the films need to start doing better in overseas high-value markets. Alternatively, be more cost efficient and viewer-relevant.• Regional shows its importance – Marathi, Gujarati, Punjabi• Hollywood films box office growing (on the back of dubbed films),
though not as much as to threaten domestic content. • Funding avenues, beyond the studios, grow with banks (IDBI, Exim,
Kotak, YES), Film Funds, Crowd-funding all becoming serious options.
Source: FICCI-KPMG Report 2017
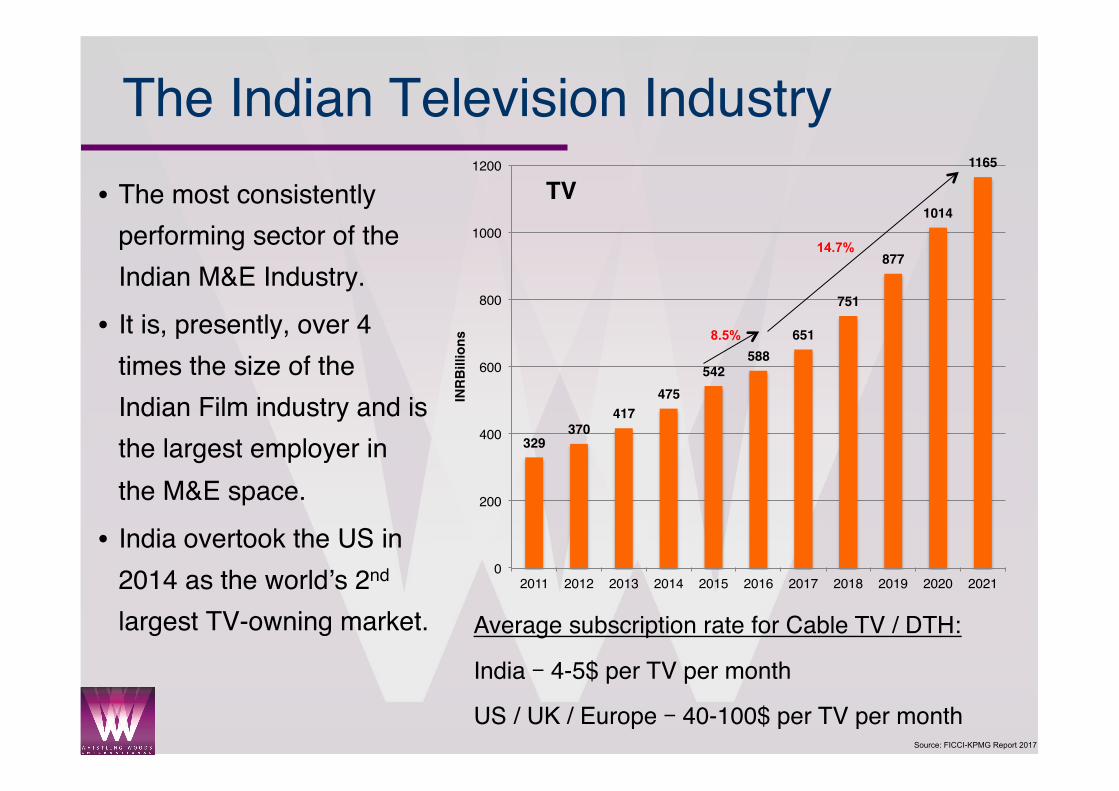
The Indian Television Industry• The most consistently
performing sector of the Indian M&E Industry.
• It is, presently, over 4 times the size of the Indian Film industry and is the largest employer in the M&E space.
• India overtook the US in 2014 as the world’s 2nd largest TV-owning market. Average subscription rate for Cable TV / DTH:
India – 4-5$ per TV per month
US / UK / Europe – 40-100$ per TV per month
329370
417475
542588
651
751
877
1014
1165
0
200
400
600
800
1000
1200
2011 2012 2013 2014 2015 2016 2017 2018 2019 2020 2021
INR
Bill
ions
TV
8.5%
14.7%
Source: FICCI-KPMG Report 2017
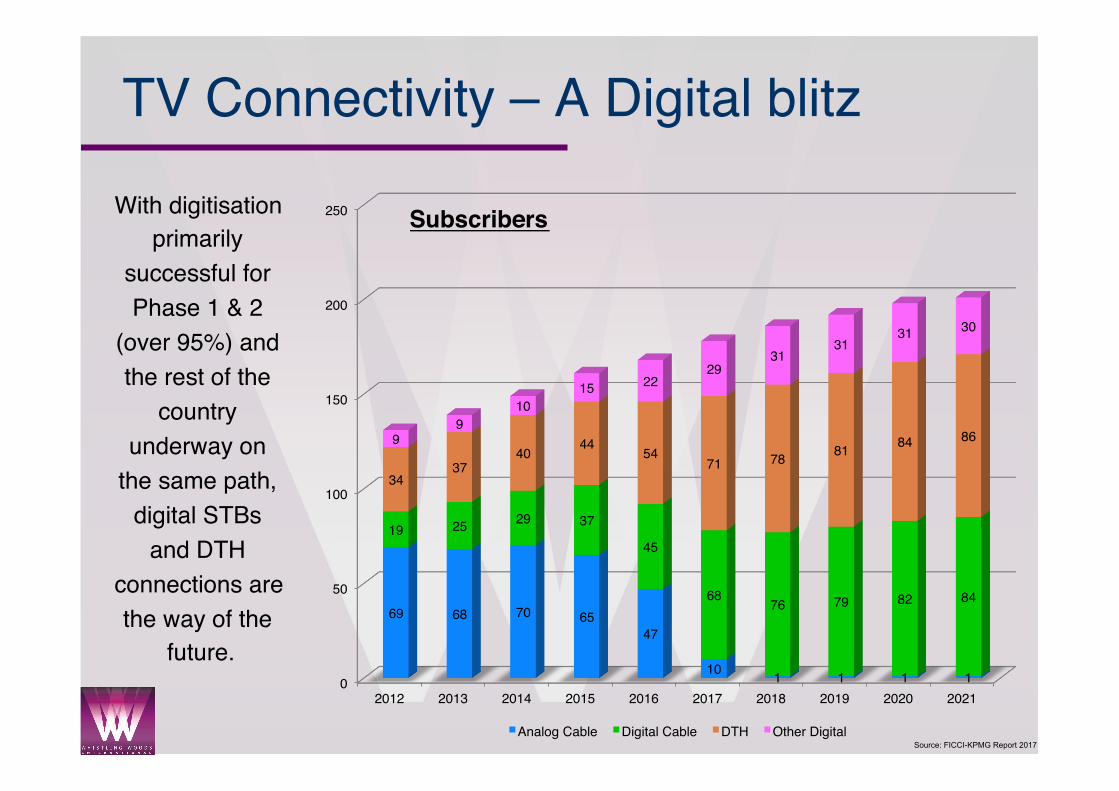
TV Connectivity – A Digital blitz
With digitisation primarily
successful for Phase 1 & 2
(over 95%) and the rest of the
country underway on
the same path, digital STBs
and DTH connections are the way of the
future.0
50
100
150
200
250
2012 2013 2014 2015 2016 2017 2018 2019 2020 2021
69 68 70 6547
10 1 1 1 1
19 25 29 37
45
68 76 79 82 84
3437
40 44 5471 78 81 84 869
910
15 2229
3131
31 30
Subscribers
Analog Cable Digital Cable DTH Other Digital
Source: FICCI-KPMG Report 2017
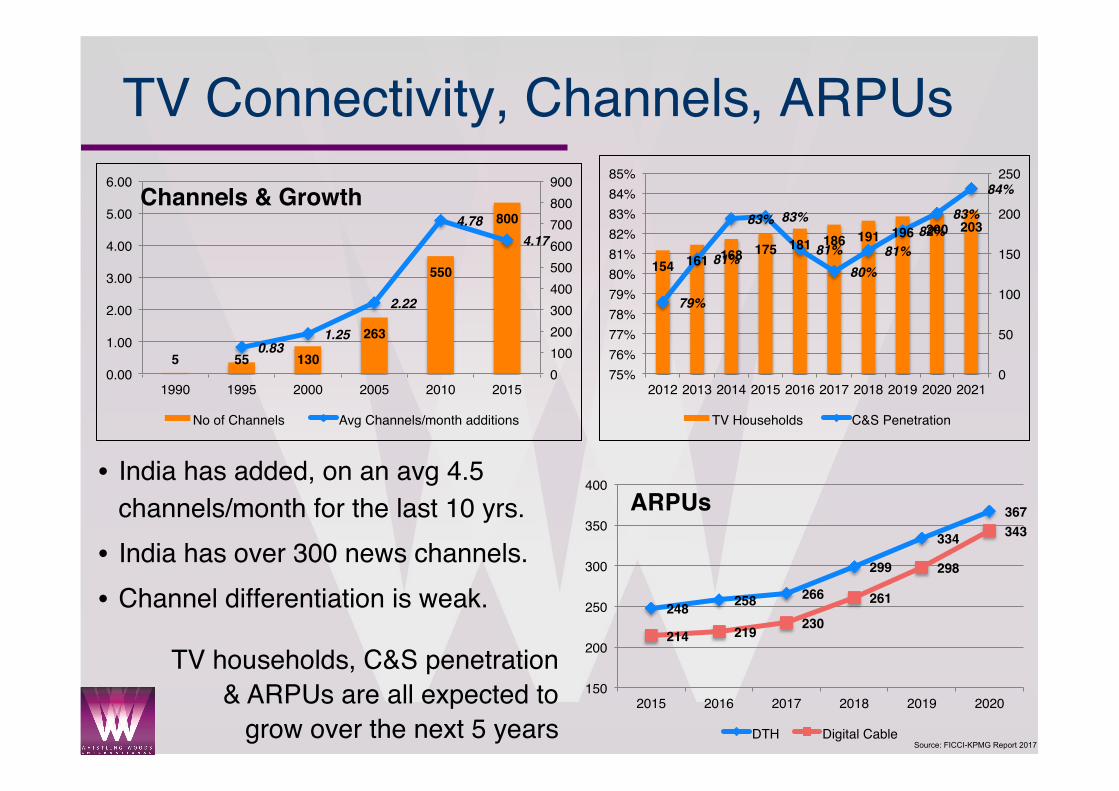
TV Connectivity, Channels, ARPUs
• India has added, on an avg 4.5 channels/month for the last 10 yrs.
• India has over 300 news channels.• Channel differentiation is weak.
TV households, C&S penetration & ARPUs are all expected to
grow over the next 5 years
5 55 130
263
550
800
0.831.25
2.22
4.784.17
0100200300400500600700800900
0.00
1.00
2.00
3.00
4.00
5.00
6.00
1990 1995 2000 2005 2010 2015
Channels & Growth
No of Channels Avg Channels/month additions
154 161 168 175 181 186 191 196 200 203
79%
81%
83% 83%
81%80%
81%82%
83%
84%
0
50
100
150
200
250
75%76%77%78%79%80%81%82%83%84%85%
2012 2013 2014 2015 2016 2017 2018 2019 2020 2021
TV Households C&S Penetration
248 258 266
299
334
367
214 219 230
261
298
343
150
200
250
300
350
400
2015 2016 2017 2018 2019 2020
ARPUs
DTH Digital Cable
Source: FICCI-KPMG Report 2017
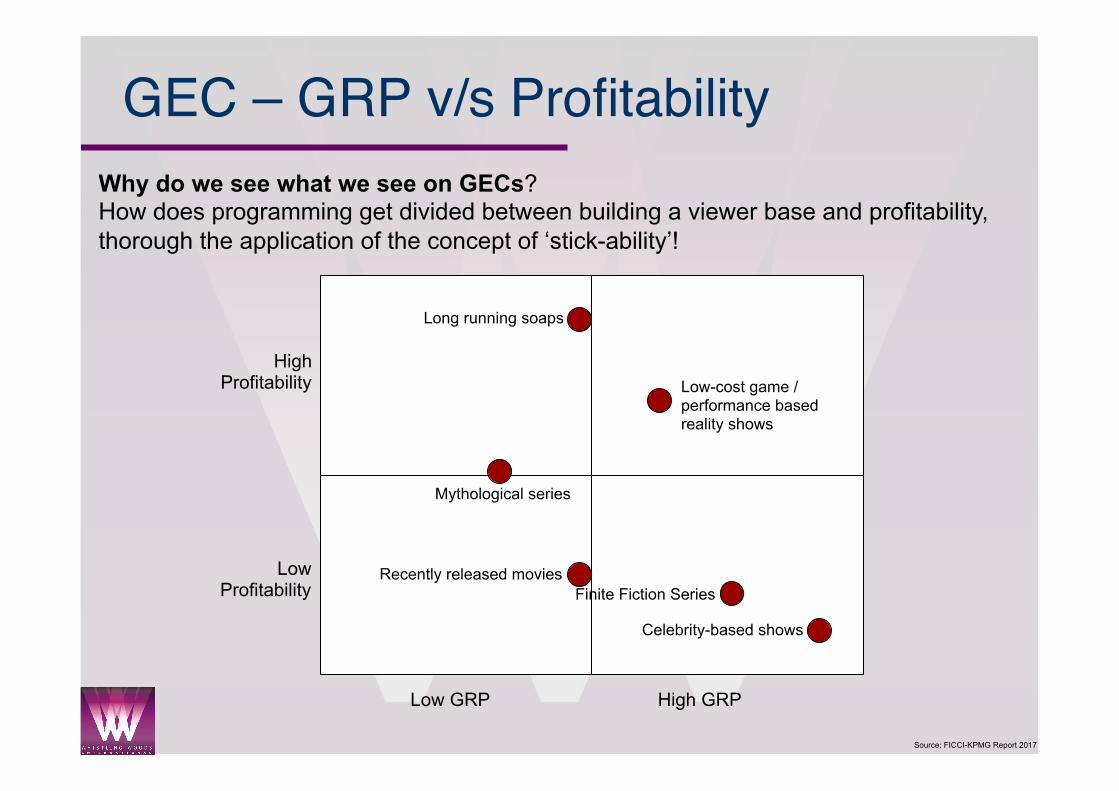
GEC – GRP v/s Profitability
Low GRP High GRP
Low Profitability
High Profitability
Long running soaps
Low-cost game / performance based reality shows
Mythological series
Recently released movies
Celebrity-based shows
Why do we see what we see on GECs? How does programming get divided between building a viewer base and profitability, thorough the application of the concept of ‘stick-ability’!
Finite Fiction Series
Source: FICCI-KPMG Report 2017
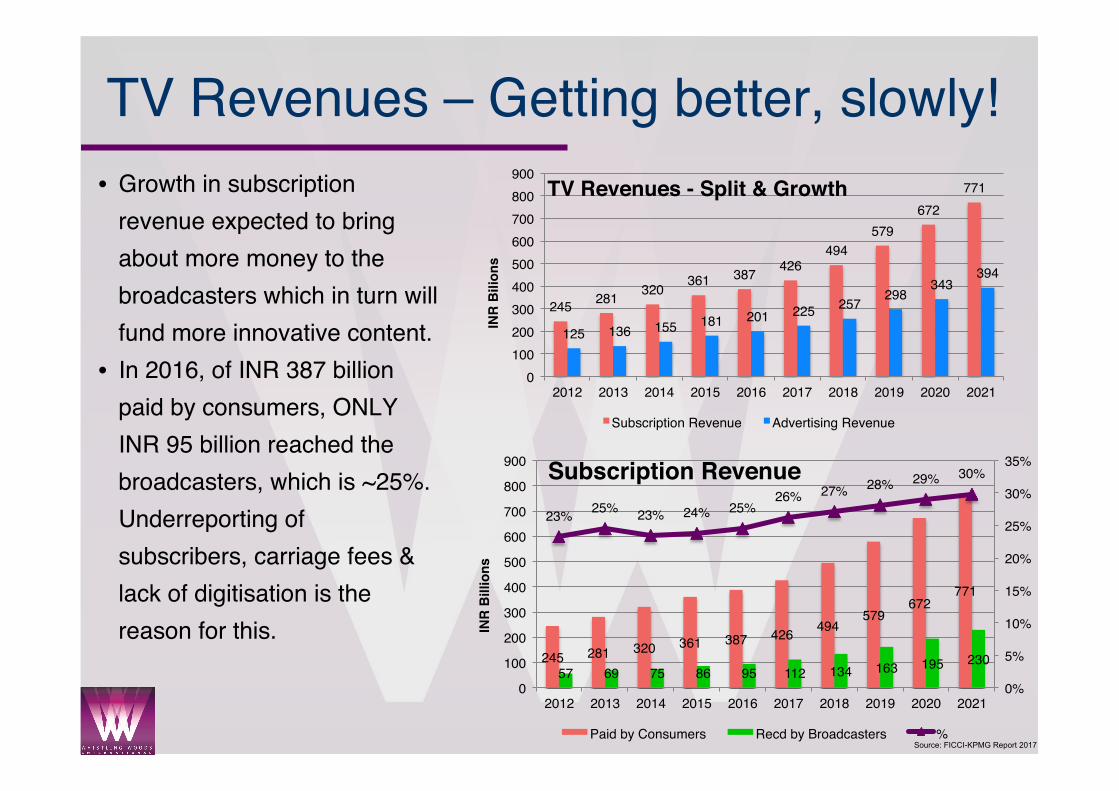
TV Revenues – Getting better, slowly!• Growth in subscription
revenue expected to bring about more money to the broadcasters which in turn will fund more innovative content.
• In 2016, of INR 387 billion paid by consumers, ONLY INR 95 billion reached the broadcasters, which is ~25%. Underreporting of subscribers, carriage fees & lack of digitisation is the reason for this.
245 281 320 361 387 426494
579672
771
125 136 155 181 201 225 257 298343
394
0100200300400500600700800900
2012 2013 2014 2015 2016 2017 2018 2019 2020 2021
INR
Bili
ons
TV Revenues - Split & Growth
Subscription Revenue Advertising Revenue
245 281 320 361 387 426 494579
672771
57 69 75 86 95 112 134 163 195 230
23% 25% 23% 24% 25%26% 27% 28% 29% 30%
0%
5%
10%
15%
20%
25%
30%
35%
0
100
200
300
400
500
600
700
800
900
2012 2013 2014 2015 2016 2017 2018 2019 2020 2021
INR
Bill
ions
Subscription Revenue
Paid by Consumers Recd by Broadcasters %
Source: FICCI-KPMG Report 2017
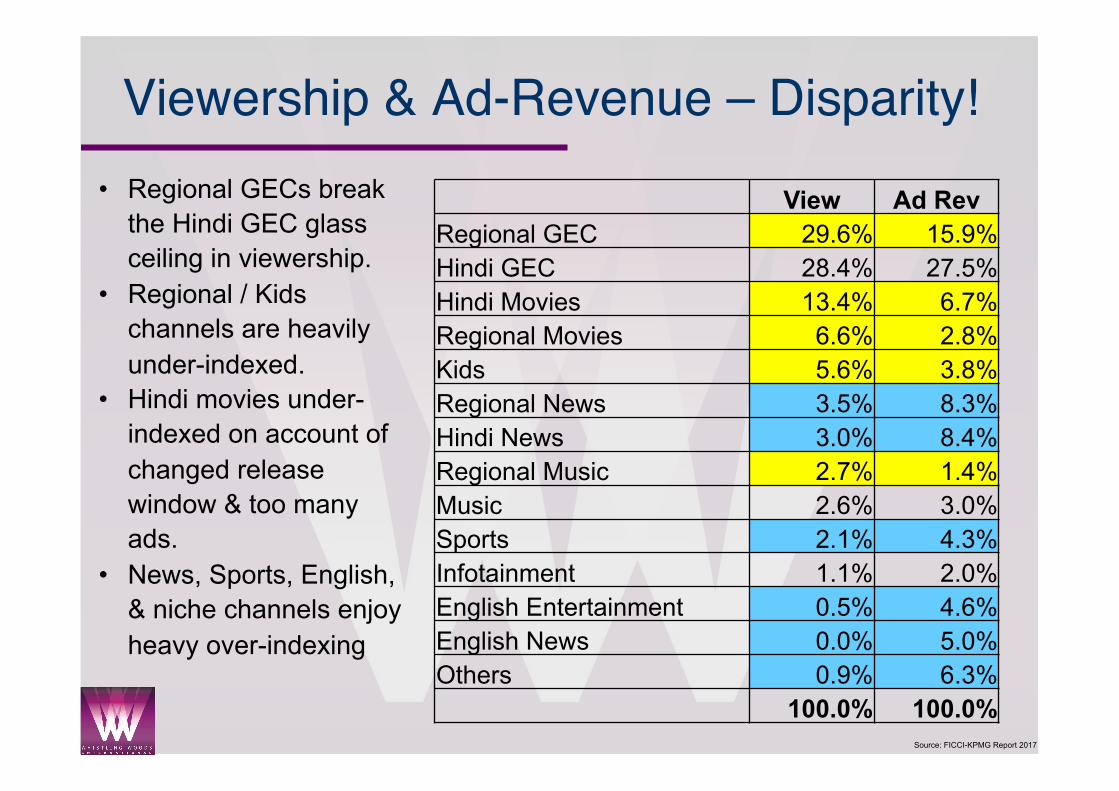
Viewership & Ad-Revenue – Disparity!
View Ad Rev Regional GEC 29.6% 15.9% Hindi GEC 28.4% 27.5% Hindi Movies 13.4% 6.7% Regional Movies 6.6% 2.8% Kids 5.6% 3.8% Regional News 3.5% 8.3% Hindi News 3.0% 8.4% Regional Music 2.7% 1.4% Music 2.6% 3.0% Sports 2.1% 4.3% Infotainment 1.1% 2.0% English Entertainment 0.5% 4.6% English News 0.0% 5.0% Others 0.9% 6.3%
100.0% 100.0%
• Regional GECs break the Hindi GEC glass ceiling in viewership.
• Regional / Kids channels are heavily under-indexed.
• Hindi movies under-indexed on account of changed release window & too many ads.
• News, Sports, English, & niche channels enjoy heavy over-indexing
Source: FICCI-KPMG Report 2017
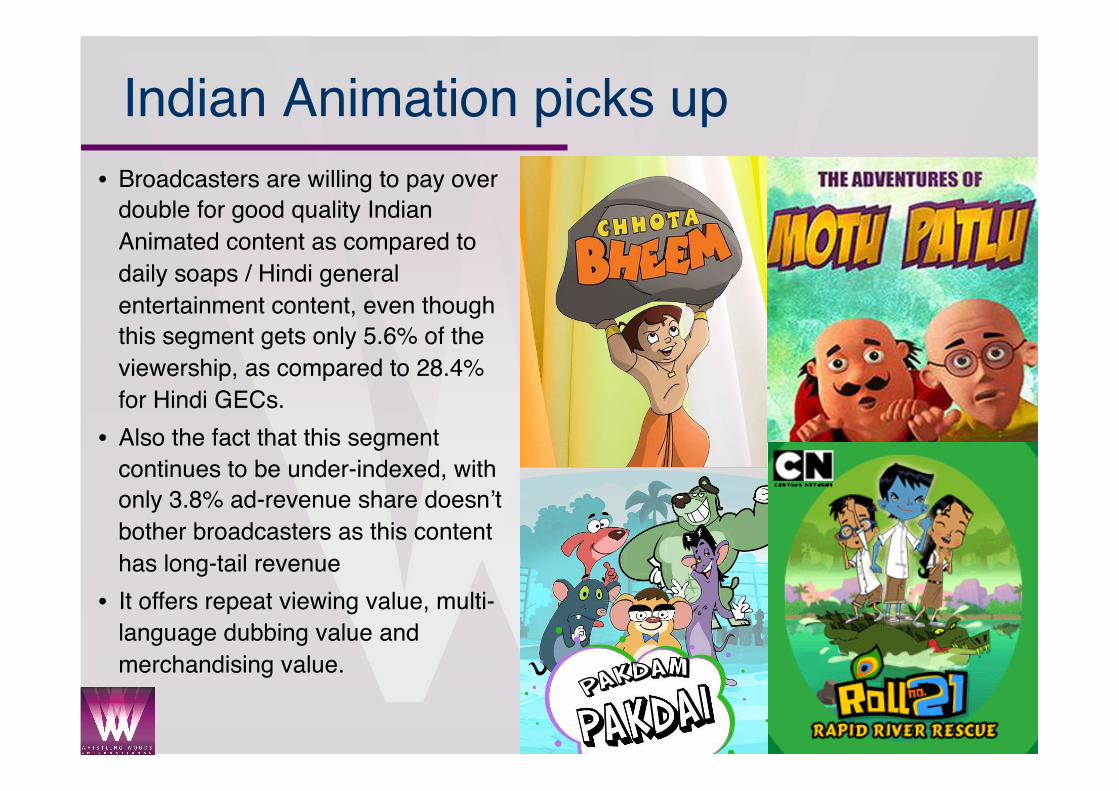
Indian Animation picks up• Broadcasters are willing to pay over
double for good quality Indian Animated content as compared to daily soaps / Hindi general entertainment content, even though this segment gets only 5.6% of the viewership, as compared to 28.4% for Hindi GECs.
• Also the fact that this segment continues to be under-indexed, with only 3.8% ad-revenue share doesn’t bother broadcasters as this content has long-tail revenue
• It offers repeat viewing value, multi-language dubbing value and merchandising value.
Source: FICCI-KPMG Report 2017
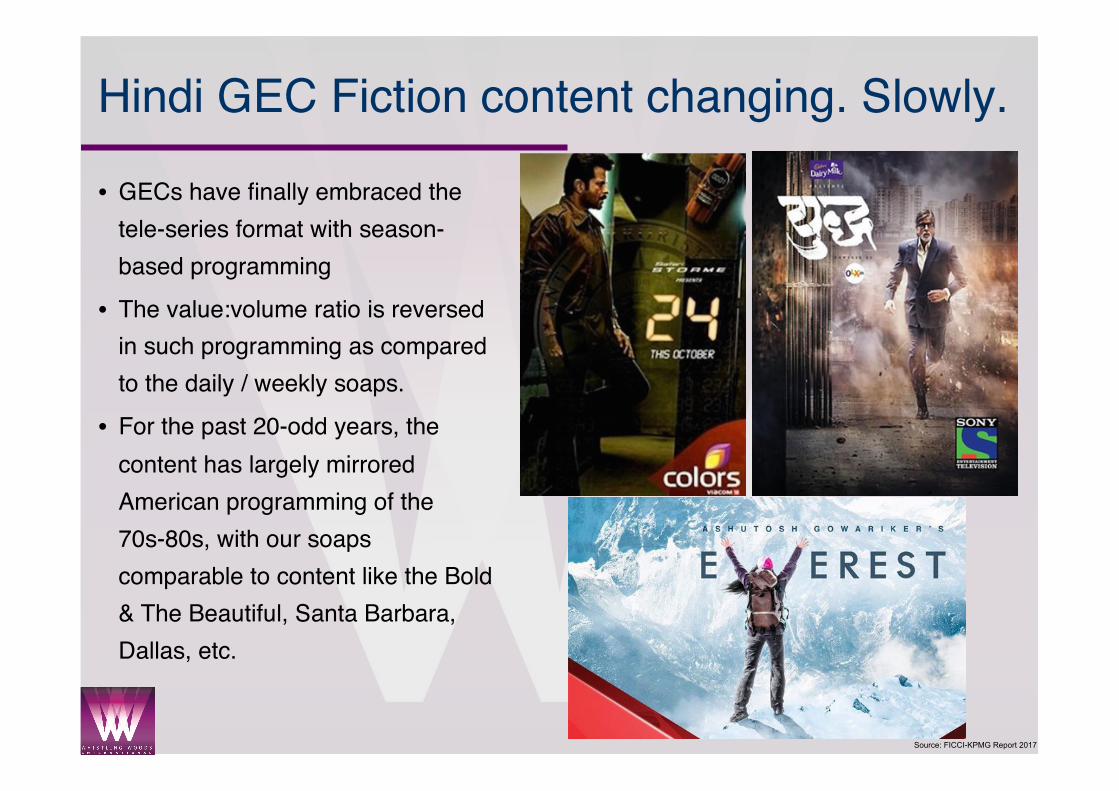
Hindi GEC Fiction content changing. Slowly.
• GECs have finally embraced the tele-series format with season-based programming
• The value:volume ratio is reversed in such programming as compared to the daily / weekly soaps.
• For the past 20-odd years, the content has largely mirrored American programming of the 70s-80s, with our soaps comparable to content like the Bold & The Beautiful, Santa Barbara, Dallas, etc.
Source: FICCI-KPMG Report 2017
TV – Key Points• Digitisation – increased revenue for the broadcaster, should lead to
more investment in content (& hence better quality content)• Global proliferation of Indian-origin content is increasing, albeit for
the Indian diaspora only. This is THE BIG opportunity.• Indian animation on TV is starting to matter.
• Hindi GECs are exploring new content programming & a changed value:volume mix in revenue models.
• Lack of quality viewership measurement systems (CPRP v/s CPT) is an issue. Hopefully, BARC should resolve this.
• Targeted advertising is the next step
Source: FICCI-KPMG Report 2017
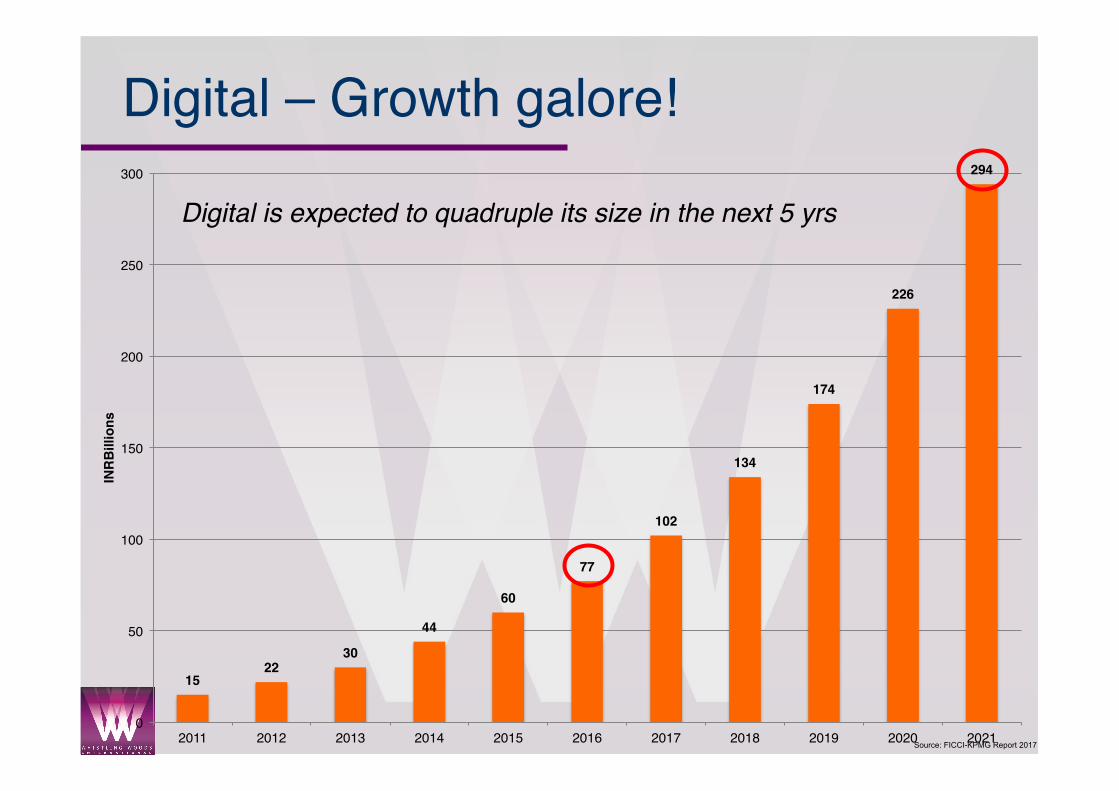
Digital – Growth galore!
1522
30
44
60
77
102
134
174
226
294
0
50
100
150
200
250
300
2011 2012 2013 2014 2015 2016 2017 2018 2019 2020 2021
INR
Bill
ions
Digital is expected to quadruple its size in the next 5 yrs
Source: FICCI-KPMG Report 2017
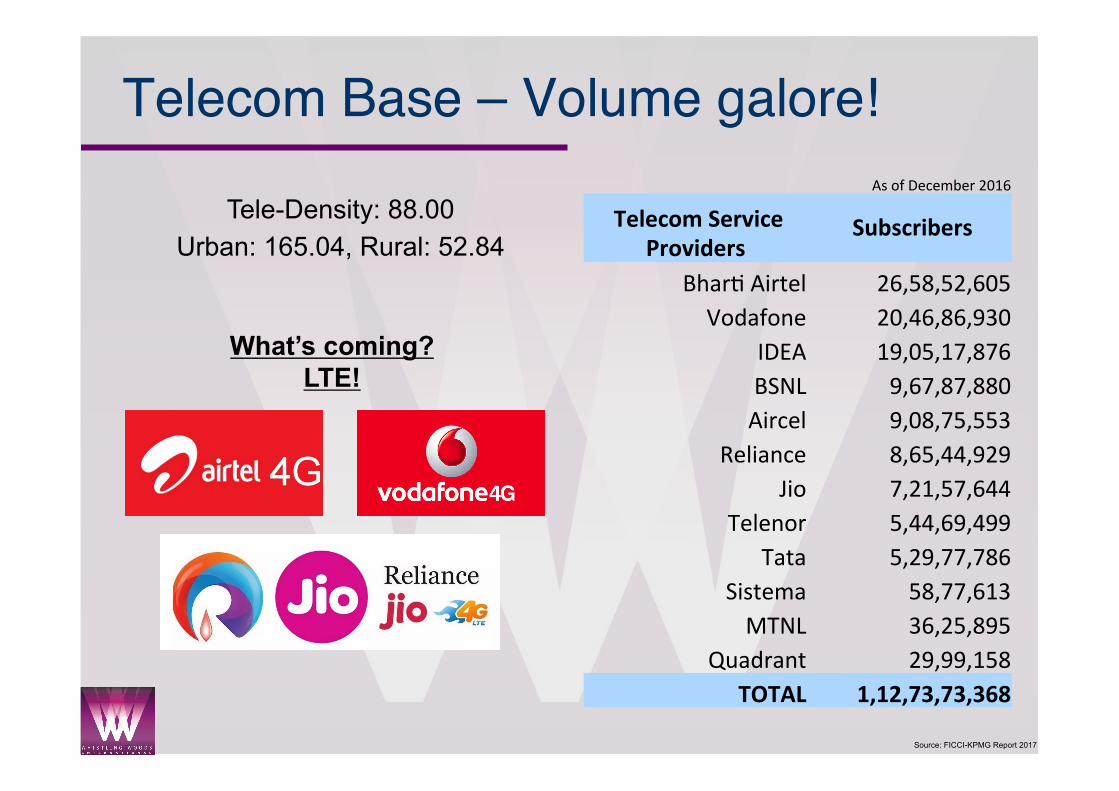
Telecom Base – Volume galore!
Tele-Density: 88.00 Urban: 165.04, Rural: 52.84
What’s coming? LTE!
AsofDecember2016
TelecomServiceProviders
Subscribers
Bhar3Airtel 26,58,52,605Vodafone 20,46,86,930
IDEA 19,05,17,876BSNL 9,67,87,880Aircel 9,08,75,553
Reliance 8,65,44,929Jio 7,21,57,644
Telenor 5,44,69,499Tata 5,29,77,786
Sistema 58,77,613MTNL 36,25,895
Quadrant 29,99,158TOTAL 1,12,73,73,368
Source: FICCI-KPMG Report 2017
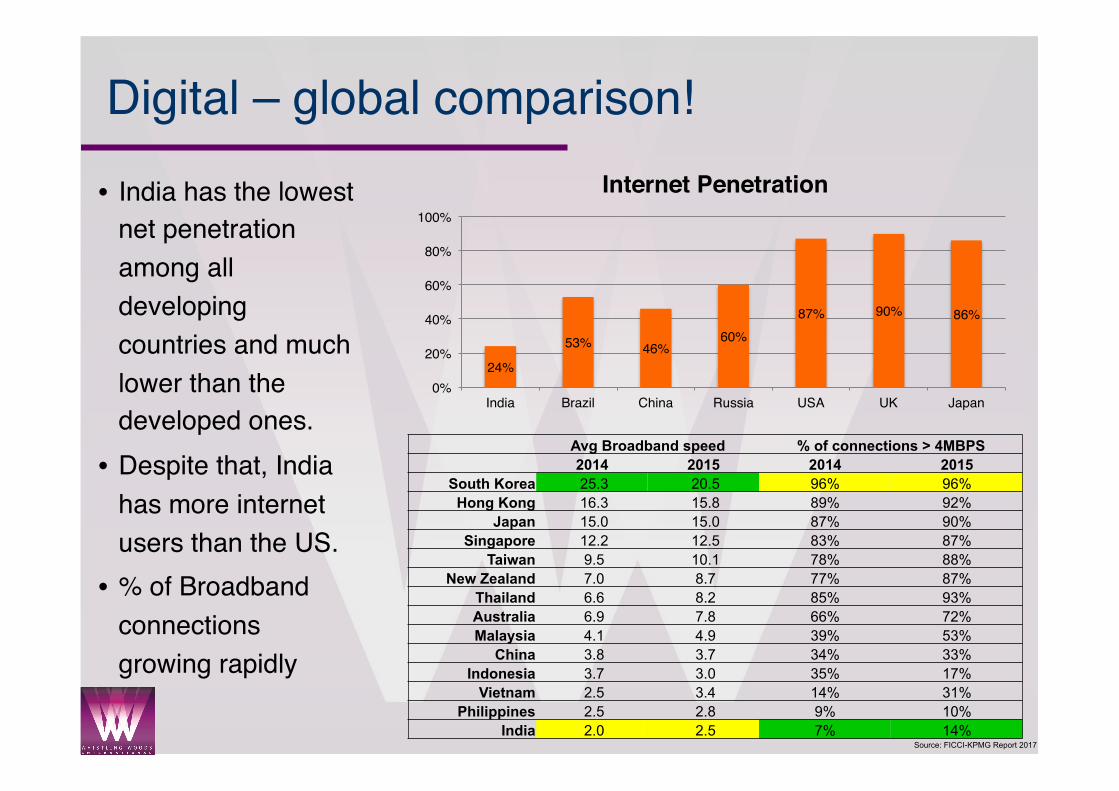
Digital – global comparison!
• India has the lowest net penetration among all developing countries and much lower than the developed ones.
• Despite that, India has more internet users than the US.
• % of Broadband connections growing rapidly
Avg Broadband speed % of connections > 4MBPS 2014 2015 2014 2015
South Korea 25.3 20.5 96% 96% Hong Kong 16.3 15.8 89% 92%
Japan 15.0 15.0 87% 90% Singapore 12.2 12.5 83% 87%
Taiwan 9.5 10.1 78% 88% New Zealand 7.0 8.7 77% 87%
Thailand 6.6 8.2 85% 93% Australia 6.9 7.8 66% 72% Malaysia 4.1 4.9 39% 53%
China 3.8 3.7 34% 33% Indonesia 3.7 3.0 35% 17%
Vietnam 2.5 3.4 14% 31% Philippines 2.5 2.8 9% 10%
India 2.0 2.5 7% 14%
24%
53% 46%60%
87% 90% 86%
0%
20%
40%
60%
80%
100%
India Brazil China Russia USA UK Japan
Internet Penetration
Source: FICCI-KPMG Report 2017
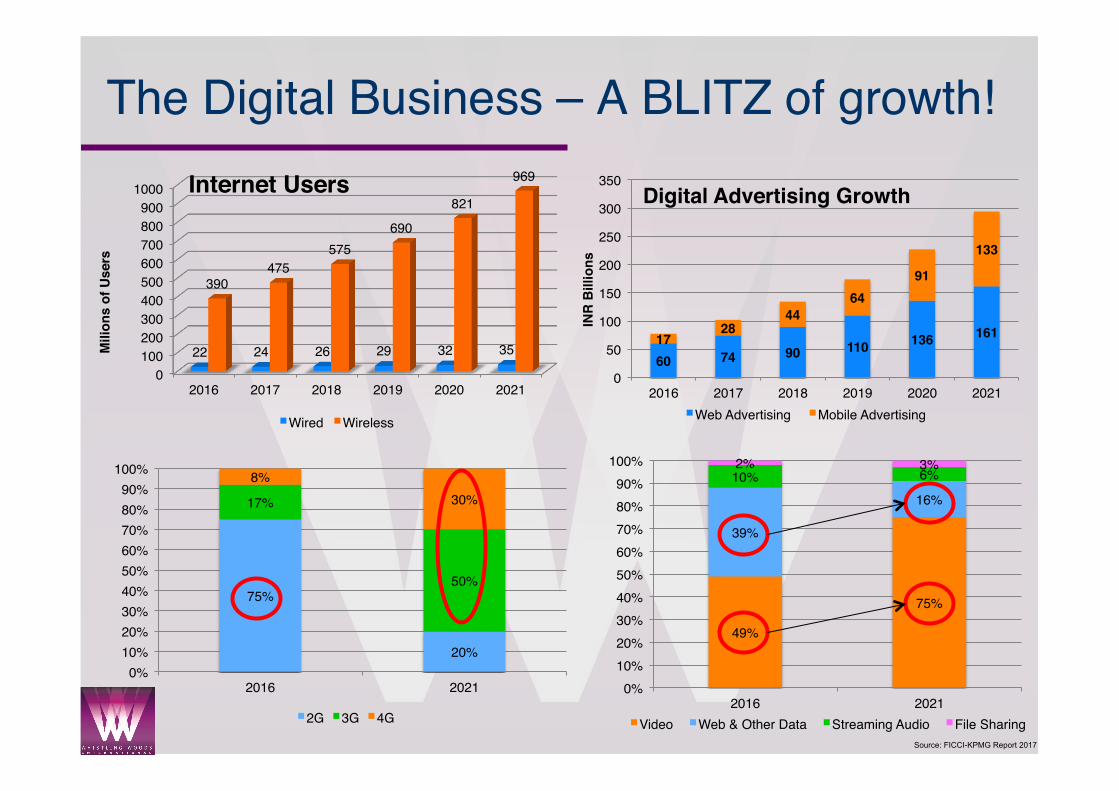
The Digital Business – A BLITZ of growth!
0100200300400500600700800900
1000
2016 2017 2018 2019 2020 2021
22 24 26 29 32 35
390475
575690
821
969
Mili
ons
of U
sers
Internet Users
Wired Wireless
60 74 90 110 136 1611728
4464
91
133
0
50
100
150
200
250
300
350
2016 2017 2018 2019 2020 2021
INR
Bill
ions
Digital Advertising Growth
Web Advertising Mobile Advertising
75%
20%
17%
50%
8%30%
0%10%20%30%40%50%60%70%80%90%
100%
2016 2021
2G 3G 4G
49%
75%
39%
16%10% 6%2% 3%
0%10%20%30%40%50%60%70%80%90%
100%
2016 2021Video Web & Other Data Streaming Audio File Sharing
Source: FICCI-KPMG Report 2017
Content - Global Digital Platforms
Source: FICCI-KPMG Report 2017
Indian Digital Platforms
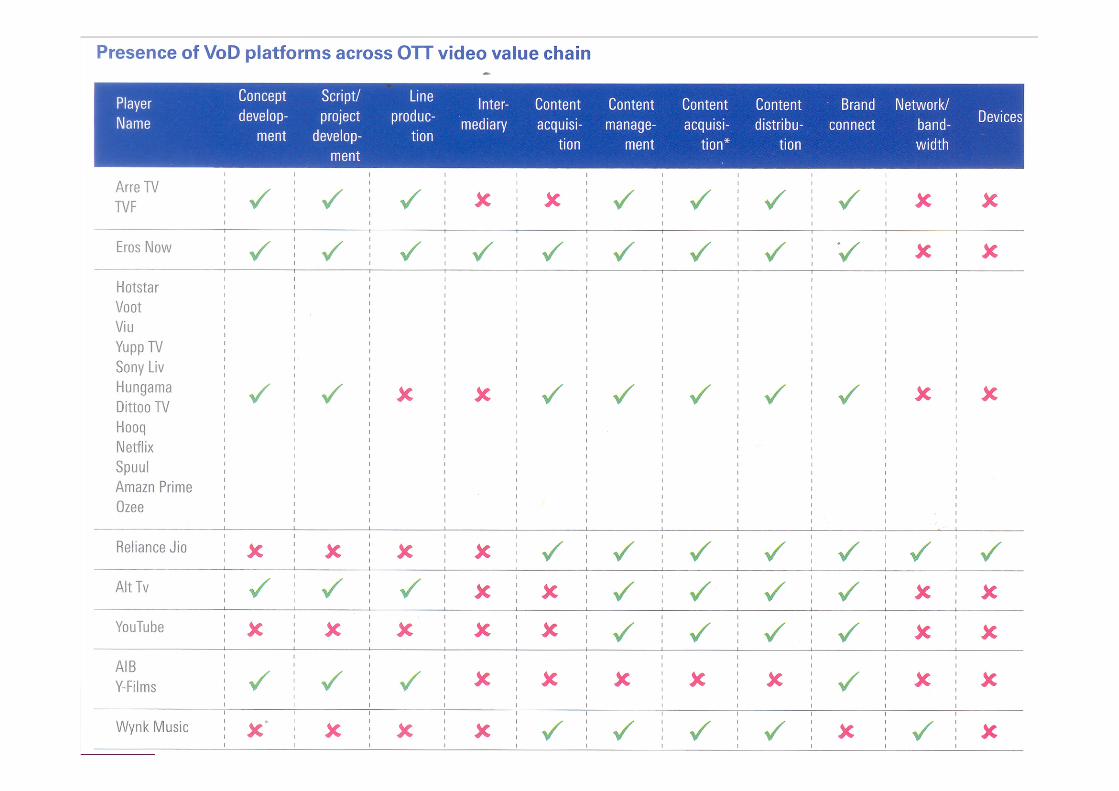
Source: FICCI-KPMG Report 2017
Source: FICCI-KPMG Report 2017
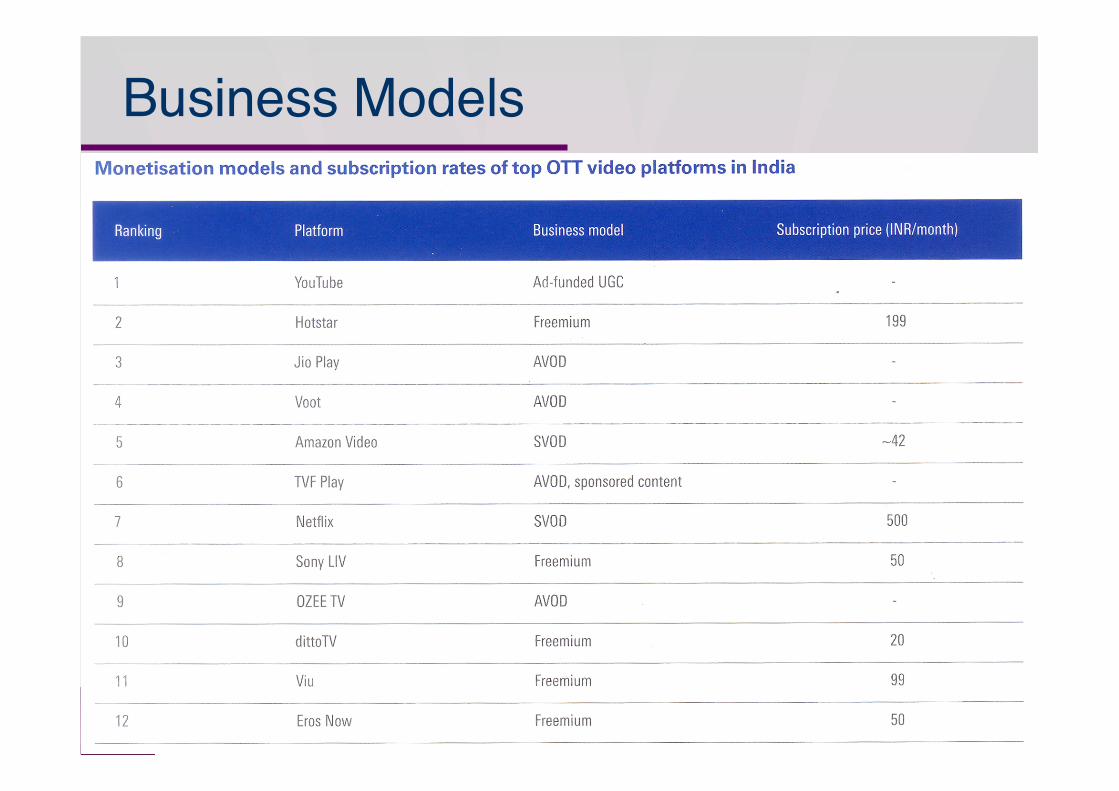
Business Models
Source: FICCI-KPMG Report 2017
YouTube• Clear Market leader:
o YouTube has over 1 billion users — 1/3rd of all net users see at least 1 YouTube video everyday.
o People watching a YouTube video online has grown 40% & watch-time has grown ~50%, annually for the past 2 years
o Creator revenue has increased 50% annually for the past three years.o All of the top 100 global brands run ads on YouTubeo YouTube has paid out over $1 billion for legitimate content claims
• YouTube has launched local versions in more than 88 countries & in 76 different languages (covering 95% of the Internet population).
• Over 50% of YouTube views come from mobile devices. On mobile, the average viewing session is now more 40 minutes.
Source: FICCI-KPMG Report 2017
Digital – No more a ‘also’ platform• The Digital platforms of web, mobile & web-connected smart TVs are the
present & the future.
• Content expected to follow a parallel trajectory to Cable & Satellite TV.
• Content consumption modes & patterns are changing with a large number of sub-18-yr-olds finding their ‘stars’ online.
• YouTube is taking the Indian market very seriously and has set up their 7th global ‘YouTube Space’ & also a ‘YouTube Educator Lab’ in India, in partnership with Whistling Woods.
• ANALYTICS & TARGETING – Audience analytics, Content-based analytics, Predictive analytics, Campaign analytics
Source: FICCI-KPMG Report 2017
The Opportunities in Digital• IP Creation• Digital is a writers’ medium – HOW?
• Look beyond digital as JUST a 3rd screen with limited censorship
• Multi-formatting ALL content to include Digital platforms (10% extra effort)
• Specialised writing / content structure for ‘Indian’ digital platforms
• Utilising the entire spectrum of the platform – clickable / interactive video, AR/VR (360 deg video, etc), gamification of content & more
In any industry, building volume is hard. India already has the volume and is likely to be the largest digital free market by 2020-22. We now need to build
value to each unit of volume. Only way to do it is quality.
Source: FICCI-KPMG Report 2017
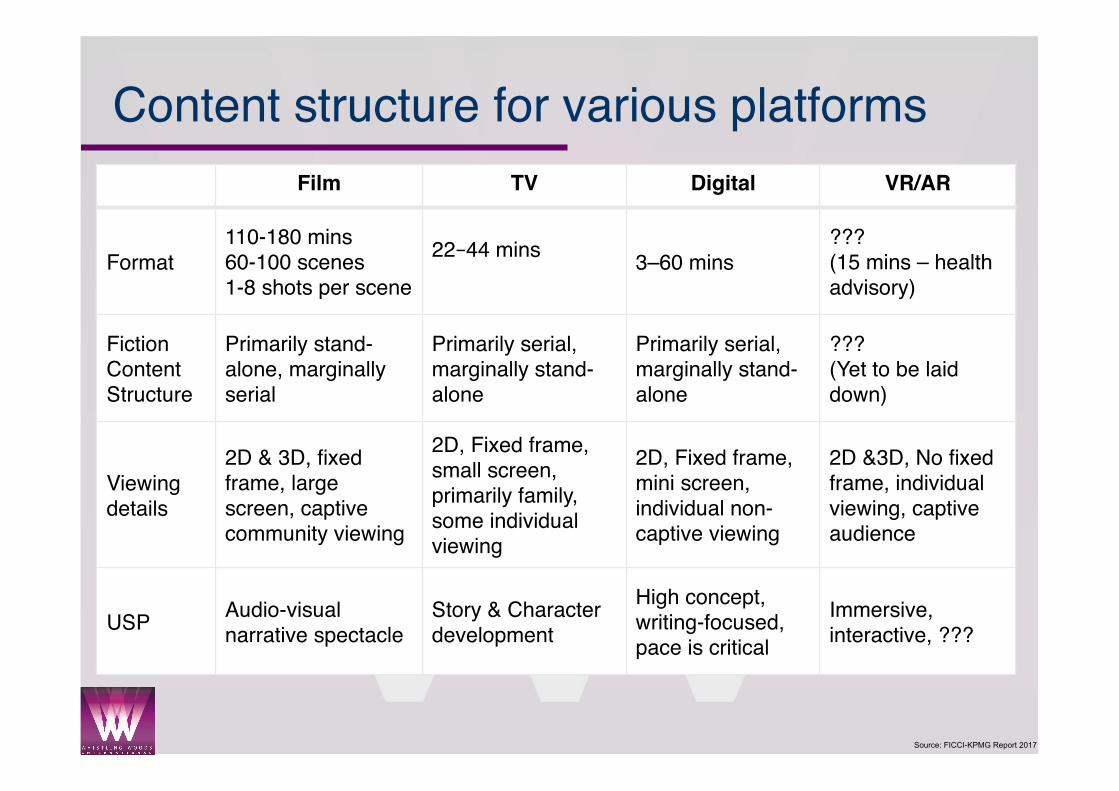
Content structure for various platformsFilm TV Digital VR/AR
Format110-180 mins60-100 scenes1-8 shots per scene
22–44 mins 3–60 mins???(15 mins – health advisory)
Fiction Content Structure
Primarily stand-alone, marginally serial
Primarily serial, marginally stand-alone
Primarily serial, marginally stand-alone
???(Yet to be laid down)
Viewing details
2D & 3D, fixed frame, large screen, captive community viewing
2D, Fixed frame, small screen, primarily family, some individual viewing
2D, Fixed frame, mini screen, individual non-captive viewing
2D &3D, No fixed frame, individual viewing, captive audience
USP Audio-visual narrative spectacle
Story & Character development
High concept, writing-focused, pace is critical
Immersive, interactive, ???
Source: FICCI-KPMG Report 2017
31 3540
4551
6070
81
96
112
132
0
20
40
60
80
100
120
140
2011 2012 2013 2014 2015 2016 2017 2018 2019 2020 2021IN
RB
illio
ns
Animation & VFX
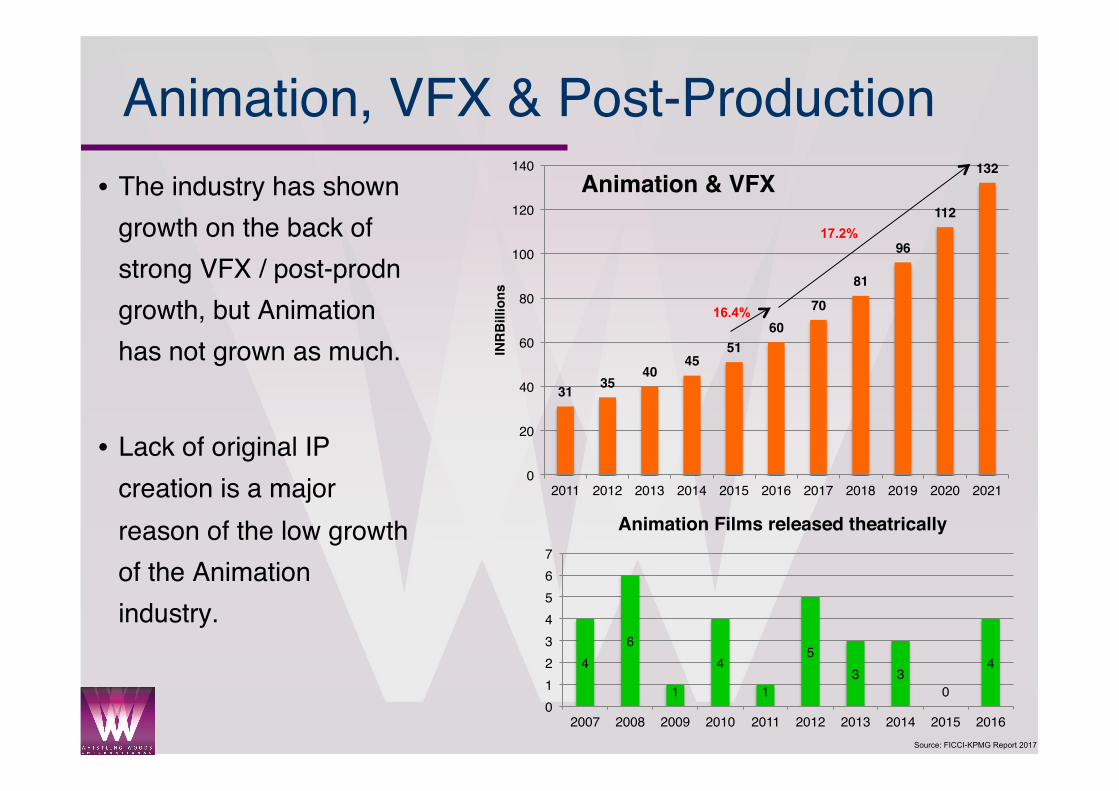
Animation, VFX & Post-Production• The industry has shown
growth on the back of strong VFX / post-prodn growth, but Animation has not grown as much.
• Lack of original IP creation is a major reason of the low growth of the Animation industry.
17.2%
16.4%
46
1
4
1
53 3
0
4
01234567
2007 2008 2009 2010 2011 2012 2013 2014 2015 2016
Animation Films released theatrically
Source: FICCI-KPMG Report 2017
22% 20% 18% 16% 15% 14% 13% 13% 12% 11%
13% 12% 11% 11% 10% 10% 9% 9% 8% 7%
22% 23% 25% 28% 32% 35% 37% 39% 42% 44%
44% 45% 45% 45% 43% 42% 40% 39% 39% 38%
0%10%20%30%40%50%60%70%80%90%
100%
2012 2013 2014 2015 2016 2017 2018 2019 2020 2021
Animation Services Animation IP Creation VFX Post-Prodn
7.6 8.0 8.1 8.3 8.9 9.7 10.8 12.1 13.2 14.2 4.5 4.7 5.1 5.6 6.1 6.8 7.5 8.2 8.7 9.5 7.7 9.3 11.3 14.4 18.9 24.0 30.2 37.6 46.7 57.8
15.5 17.7 20.4 22.8 25.7
29.0 32.8
37.7 43.3
50.2
-
20.0
40.0
60.0
80.0
100.0
120.0
140.0
2012 2013 2014 2015 2016 2017 2018 2019 2020 2021
INR
Bill
ions
Animation Services Animation IP Creation VFX Post-Prodn
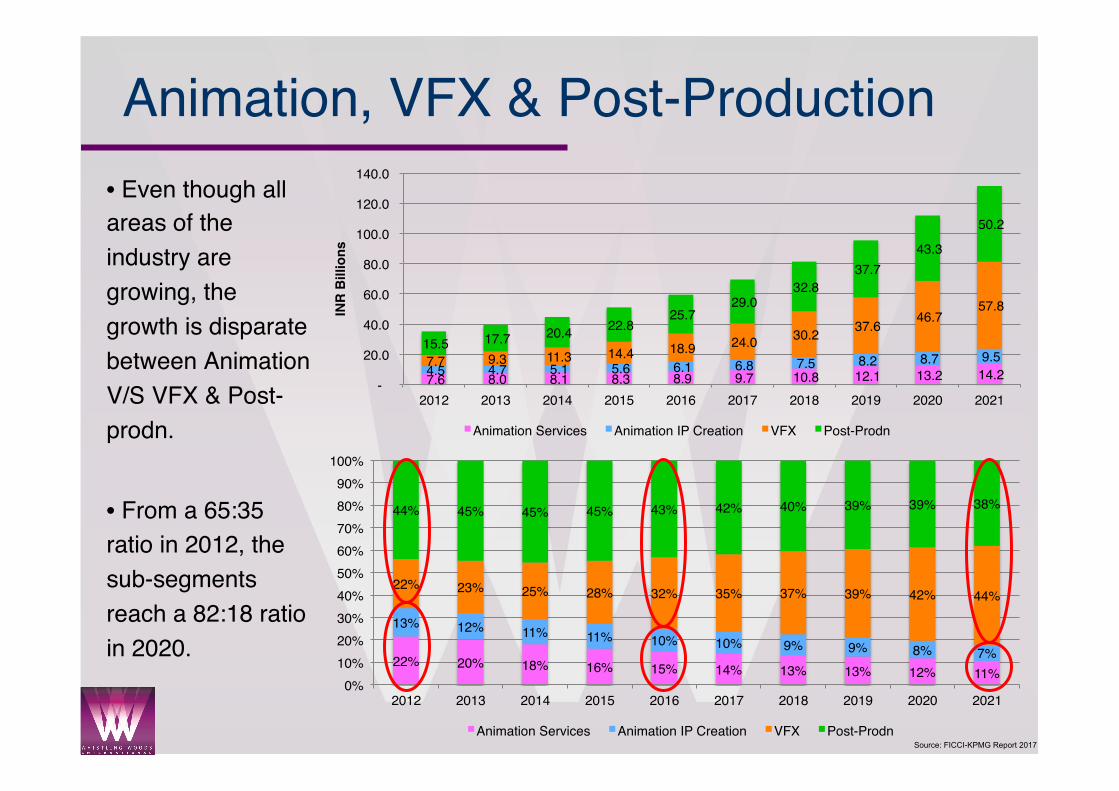
Animation, VFX & Post-Production• Even though all areas of the industry are growing, the growth is disparate between Animation V/S VFX & Post-prodn.
• From a 65:35 ratio in 2012, the sub-segments reach a 82:18 ratio in 2020.
Source: FICCI-KPMG Report 2017
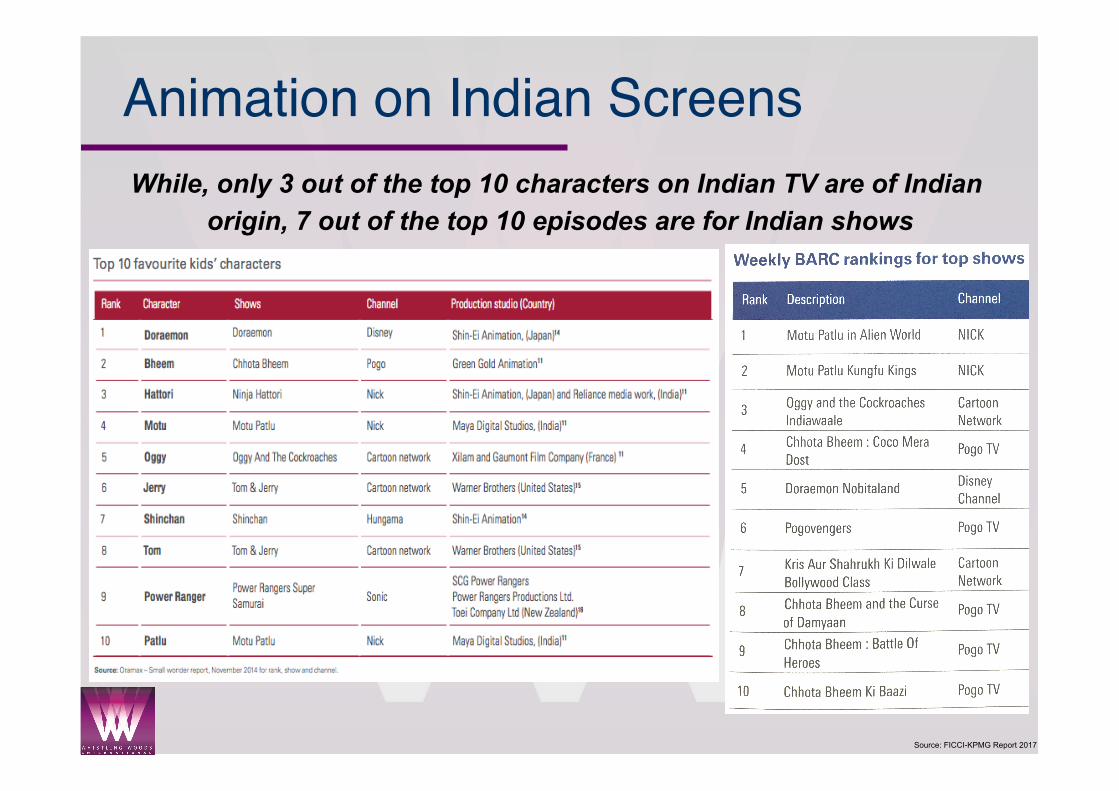
Animation on Indian ScreensWhile, only 3 out of the top 10 characters on Indian TV are of Indian
origin, 7 out of the top 10 episodes are for Indian shows
Source: FICCI-KPMG Report 2017
13 1519
24 2731
3744
52
61
71
0
10
20
30
40
50
60
70
80
2011 2012 2013 2014 2015 2016 2017 2018 2019 2020 2021
INR
Bill
ions
Gaming
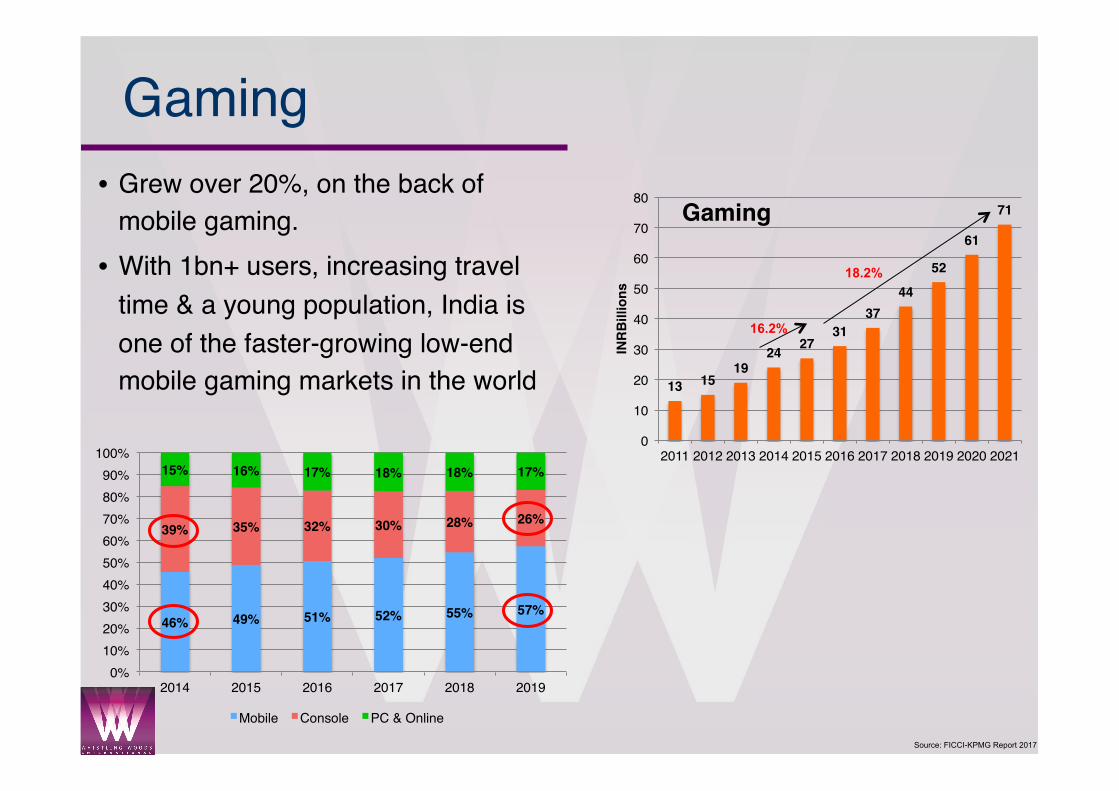
Gaming• Grew over 20%, on the back of
mobile gaming.• With 1bn+ users, increasing travel
time & a young population, India is one of the faster-growing low-end mobile gaming markets in the world
18.2%
46% 49% 51% 52% 55% 57%
39% 35% 32% 30% 28% 26%
15% 16% 17% 18% 18% 17%
0%10%20%30%40%50%60%70%80%90%
100%
2014 2015 2016 2017 2018 2019
Mobile Console PC & Online
16.2%
Source: FICCI-KPMG Report 2017
911
10 1011
1214
16
19
22
25
0
5
10
15
20
25
2011 2012 2013 2014 2015 2016 2017 2018 2019 2020 2021
INR
Bill
ions
Music
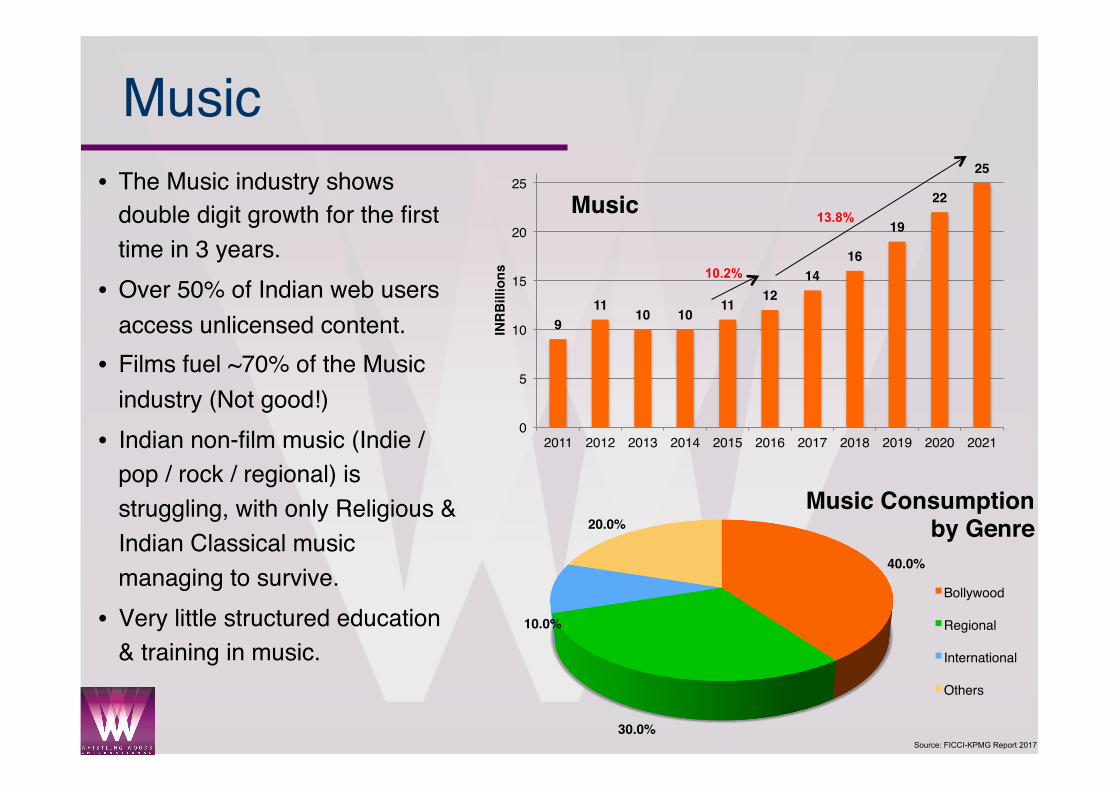
Music• The Music industry shows
double digit growth for the first time in 3 years.
• Over 50% of Indian web users access unlicensed content.
• Films fuel ~70% of the Music industry (Not good!)
• Indian non-film music (Indie / pop / rock / regional) is struggling, with only Religious & Indian Classical music managing to survive.
• Very little structured education & training in music.
13.8%
10.2%
40.0%
30.0%
10.0%
20.0%Music Consumption
by Genre
Bollywood
Regional
International
Others
Source: FICCI-KPMG Report 2017
1113
1517
2023
26
31
36
41
48
0
5
10
15
20
25
30
35
40
45
50
2011 2012 2013 2014 2015 2016 2017 2018 2019 2020 2021IN
RB
illio
ns
Radio
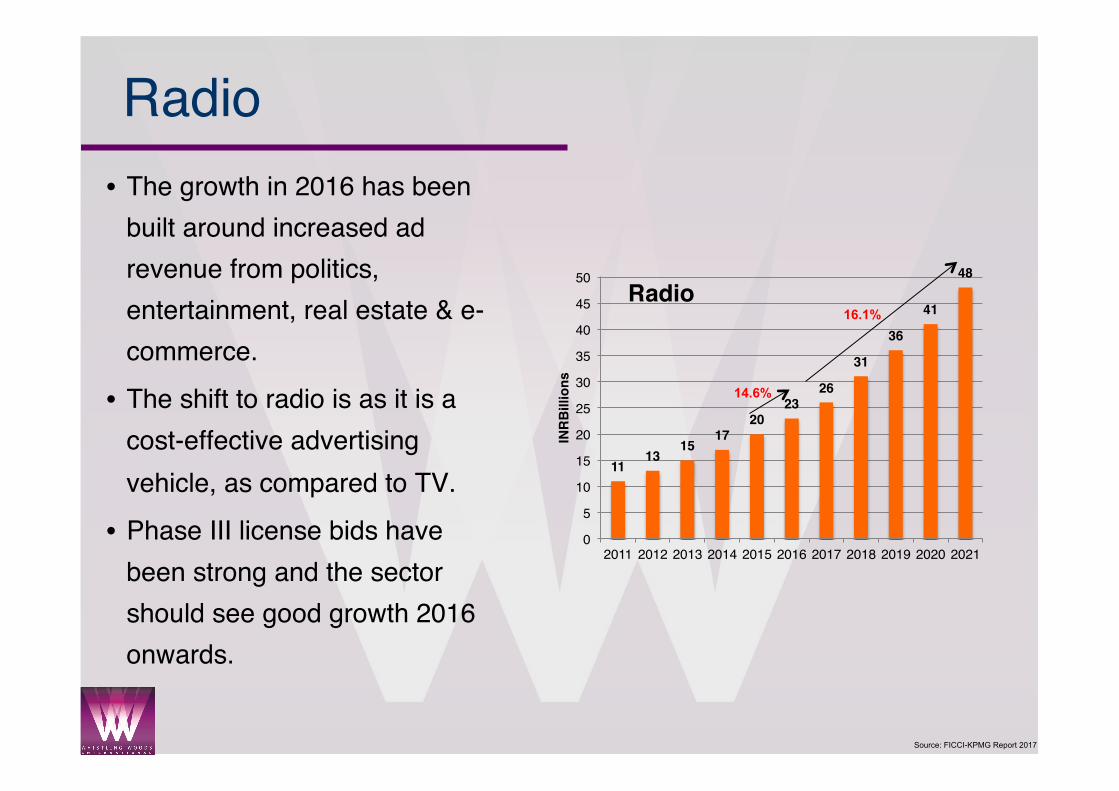
Radio• The growth in 2016 has been
built around increased ad revenue from politics, entertainment, real estate & e-commerce.
• The shift to radio is as it is a cost-effective advertising vehicle, as compared to TV.
• Phase III license bids have been strong and the sector should see good growth 2016 onwards.
16.1%
14.6%
Source: FICCI-KPMG Report 2017
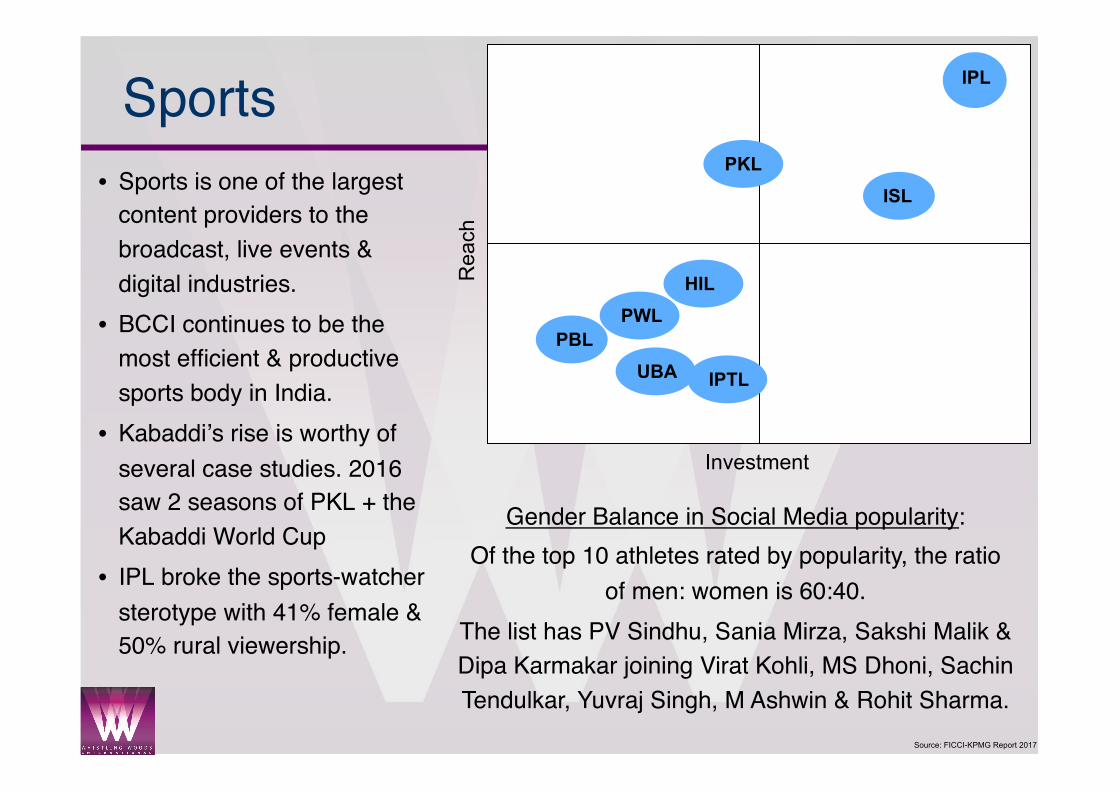
Sports• Sports is one of the largest
content providers to the broadcast, live events & digital industries.
• BCCI continues to be the most efficient & productive sports body in India.
• Kabaddi’s rise is worthy of several case studies. 2016 saw 2 seasons of PKL + the Kabaddi World Cup
• IPL broke the sports-watcher sterotype with 41% female & 50% rural viewership.
IPL
Rea
ch
Investment
ISL PKL
IPTL
PWL PBL
UBA
HIL
Gender Balance in Social Media popularity:Of the top 10 athletes rated by popularity, the ratio
of men: women is 60:40.The list has PV Sindhu, Sania Mirza, Sakshi Malik & Dipa Karmakar joining Virat Kohli, MS Dhoni, Sachin Tendulkar, Yuvraj Singh, M Ashwin & Rohit Sharma.
Source: FICCI-KPMG Report 2017
Live Events
• Yet to be ‘organised’
• Growth of ~33%
• Margin growth flat
• Government / Political spending (elections / events) still the largest contributor
• Licensing issues
• Taxation issues
• Live IP-based entertainment on the rise:
o Stand up Comedy
o Theatre
Source: FICCI-KPMG Report 2017
Theme Parks
• Current size Rs 29.3 billion. Expected to grow to Rs 70 billion by 2021 with a 19.1% CAGR.• Destination tourism based around entertainment yet to
consolidate• Evolution:
o 1980s – Appu Gharo 1990s & 2000s – Esselworldo 2010s – Imagica & Wonderlao 2016 – INR 300 bn+ investment committed for 10 parks across India
Source: FICCI-KPMG Report 2017
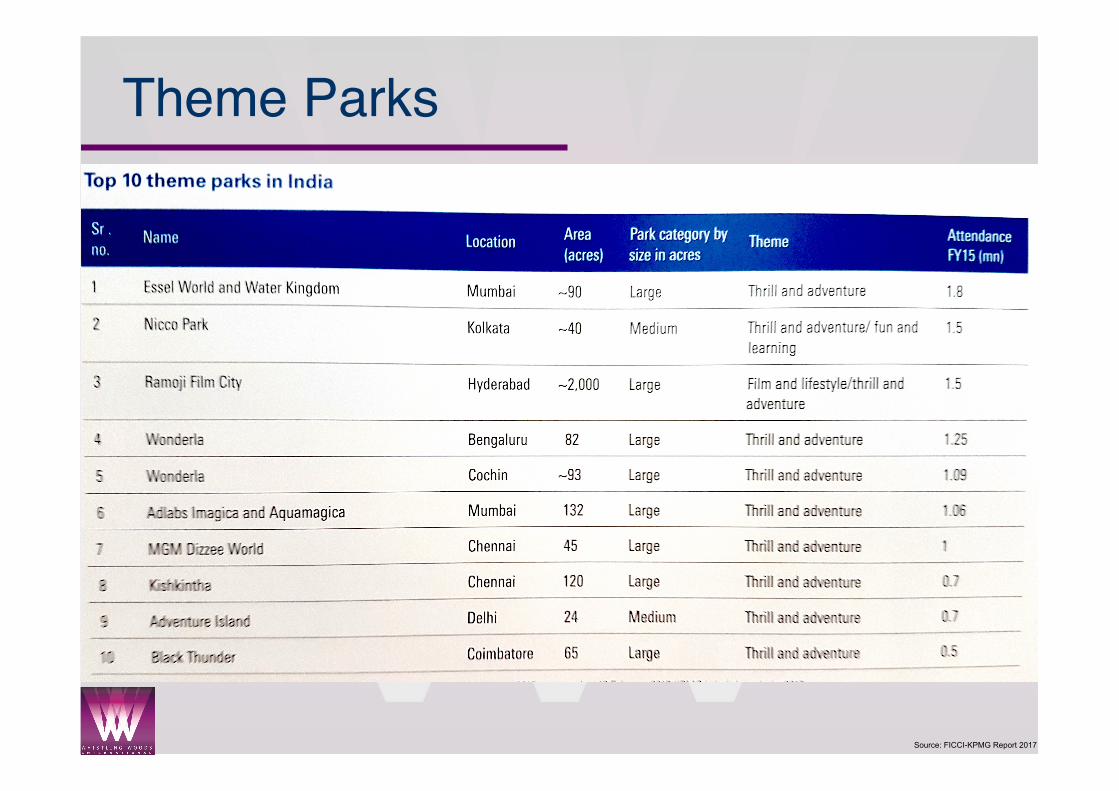
Theme Parks
Source: FICCI-KPMG Report 2017
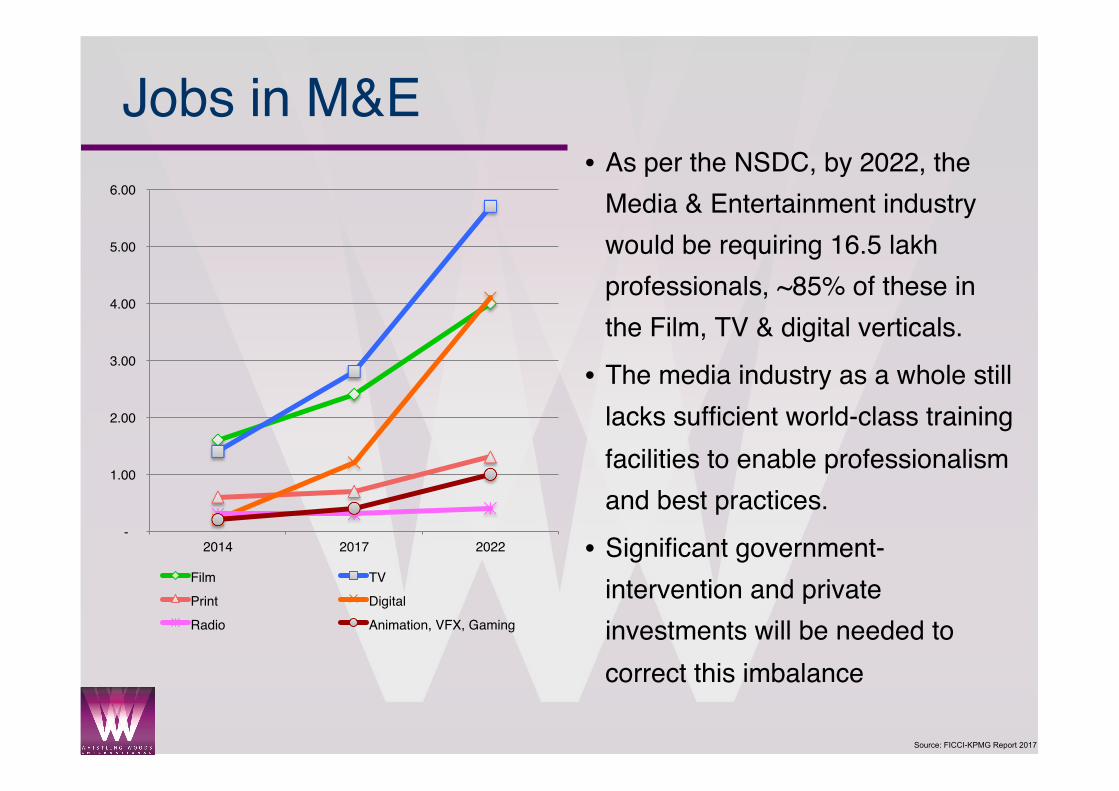
Jobs in M&E• As per the NSDC, by 2022, the
Media & Entertainment industry would be requiring 16.5 lakh professionals, ~85% of these in the Film, TV & digital verticals.
• The media industry as a whole still lacks sufficient world-class training facilities to enable professionalism and best practices.
• Significant government-intervention and private investments will be needed to correct this imbalance
-
1.00
2.00
3.00
4.00
5.00
6.00
2014 2017 2022
Film TVPrint DigitalRadio Animation, VFX, Gaming
Source: FICCI-KPMG Report 2017
What are the pain-points of the Indian M&E Industry?
• Lack of original Intellectual Property creation leading to lack of a globally merchandisable brand.
• M&E Education & Training o Of the 4 lakh people employed, nearly 75% involved in content creation have
no formal training.
o Very few world-class Film & Media institutes with a combined output of approx 500 graduates a year, with 200 of them being from a single institute.
• Innovation – Lack of original formats or technical / narrative innovation.
• Piracy - Affects every sector of the industry & causes nearly 35% revenue reduction
Source: FICCI-KPMG Report 2017
The Great Opportunities in M&E
In the M&E industry, building volume is hard. India already has the volume. We now need to build value to each unit of the already
existing volume. This is done by enhancing quality.
The big opportunities in Indian M&E are:
• IP creation – interoperable IPs across Film, TV, Digital
• Education in M&E
• Content for Digital platforms
• Screens for Film
Thank You!Chaitanya Chinchlikar
[email protected] President - Business Development, Whistling Woods International
Chief Technology Officer, Whistling Woods InternationalVice President - Strategy, Mukta Arts Ltd
Business Head - Digital Media, Mukta Arts Ltd