the indian economy an overview and analysis. class exercise: what else could have happened? what...
TRANSCRIPT
The Indian Economy
An Overview and Analysis
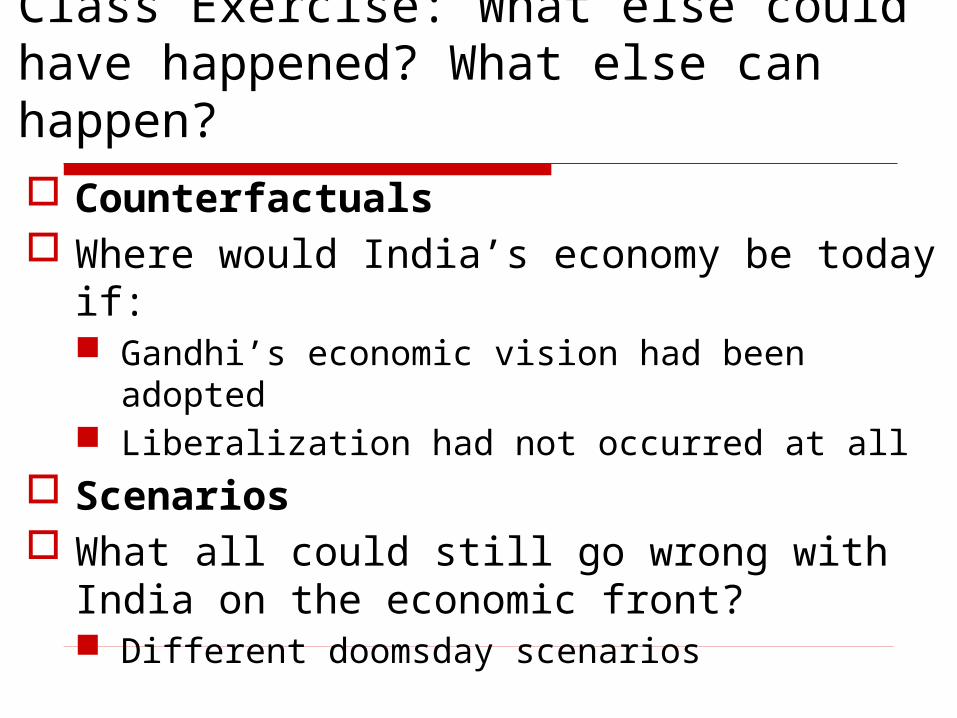
Class Exercise: What else could have happened? What else can happen? Counterfactuals Where would India’s economy be today if:
Gandhi’s economic vision had been adopted Liberalization had not occurred at all
Scenarios What all could still go wrong with India on
the economic front? Different doomsday scenarios
The Evolution of India’s Economy
4
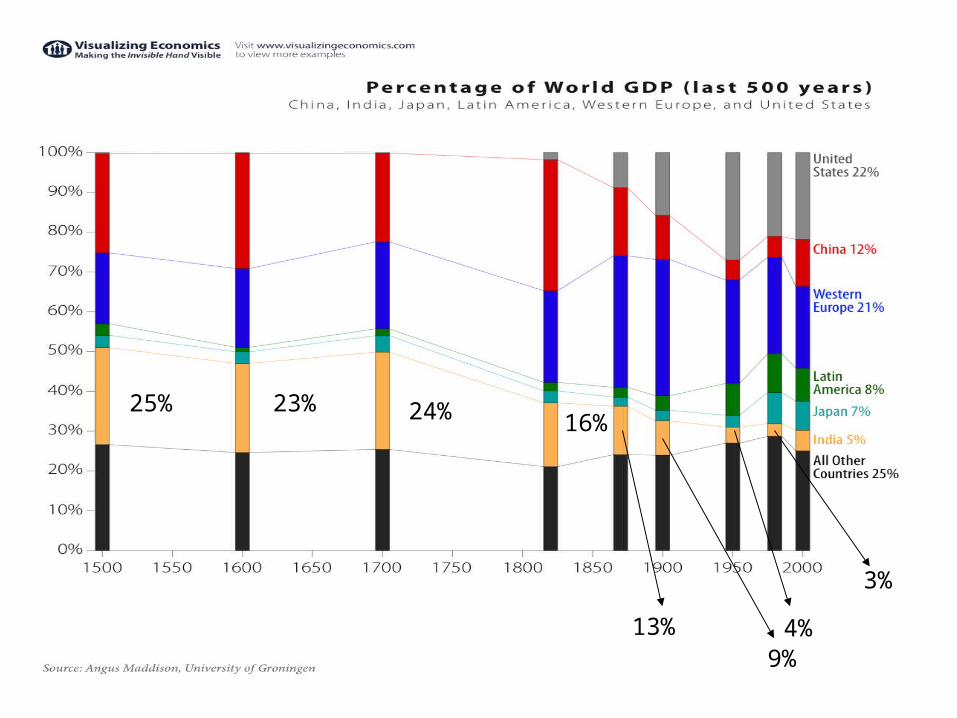
25%
23% 24% 16%
13%9%
4%
3%
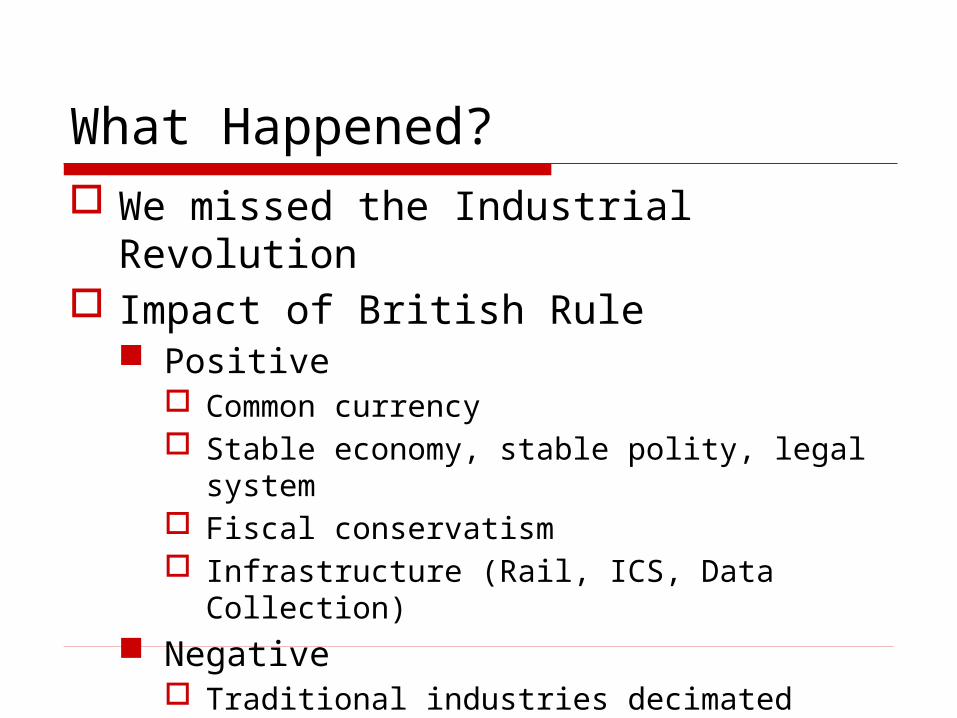
What Happened? We missed the Industrial Revolution Impact of British Rule
Positive Common currency Stable economy, stable polity, legal system Fiscal conservatism Infrastructure (Rail, ICS, Data Collection)
Negative Traditional industries decimated (Textiles) Did not invest in industrializing India
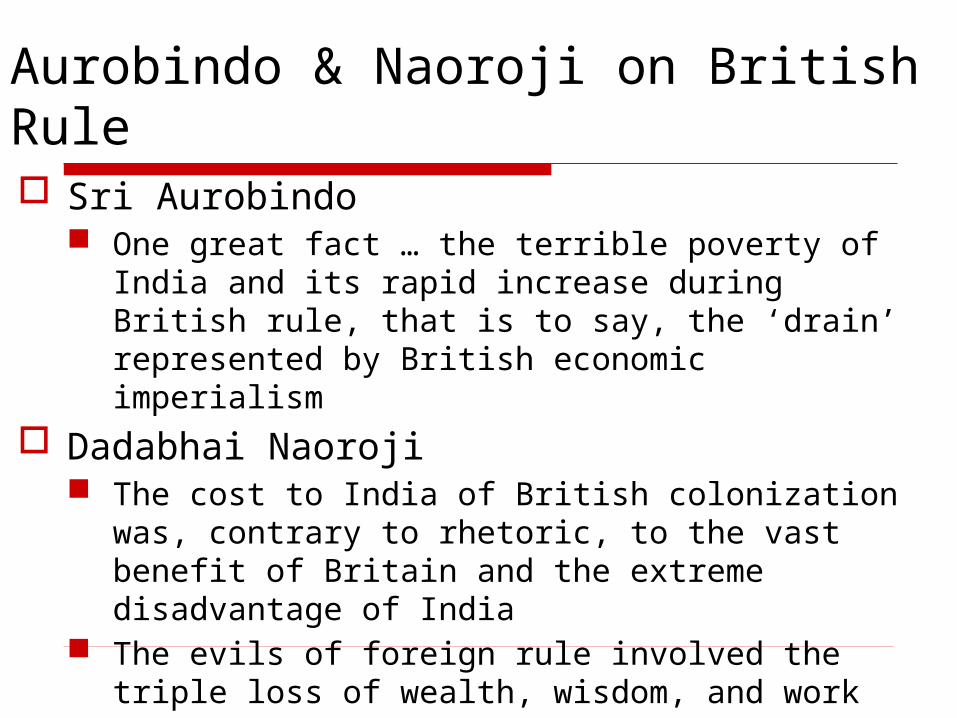
Aurobindo & Naoroji on British Rule Sri Aurobindo
One great fact … the terrible poverty of India and its rapid increase during British rule, that is to say, the ‘drain’ represented by British economic imperialism
Dadabhai Naoroji The cost to India of British colonization was,
contrary to rhetoric, to the vast benefit of Britain and the extreme disadvantage of India
The evils of foreign rule involved the triple loss of wealth, wisdom, and work
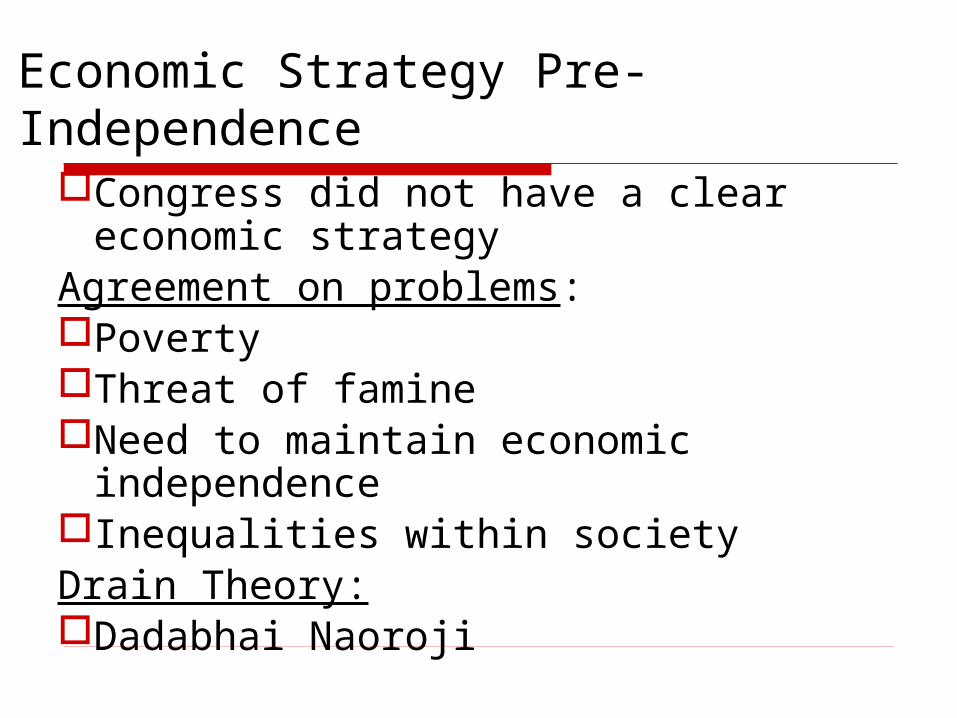
Economic Strategy Pre-IndependenceCongress did not have a clear economic
strategyAgreement on problems:PovertyThreat of famineNeed to maintain economic independenceInequalities within societyDrain Theory:Dadabhai Naoroji
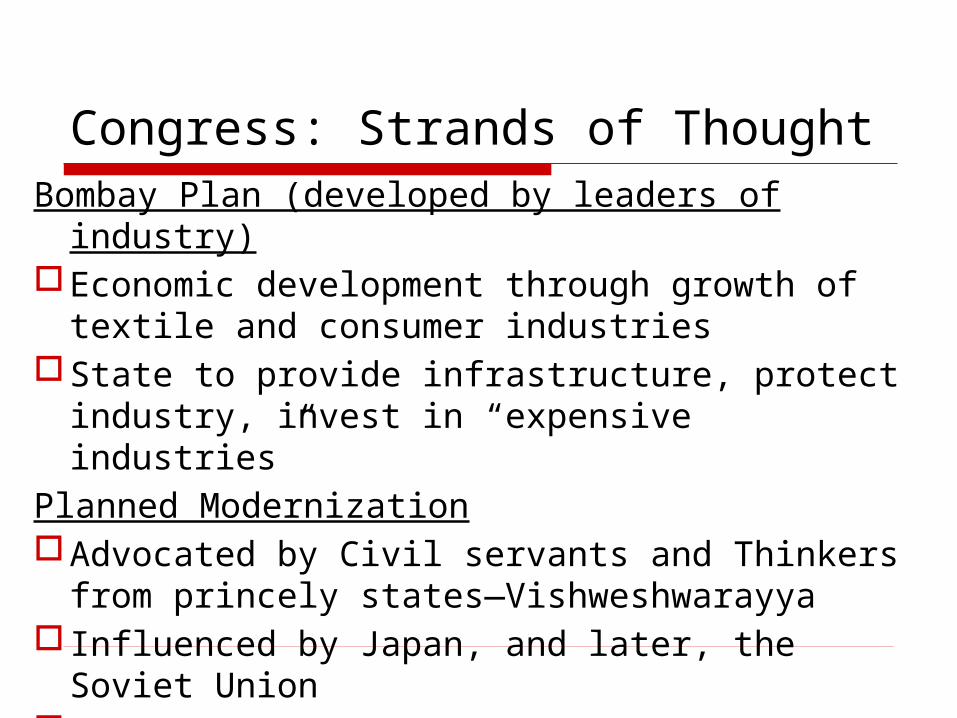
Congress: Strands of ThoughtBombay Plan (developed by leaders of industry)Economic development through growth of textile
and consumer industriesState to provide infrastructure, protect industry,
invest in “expensive industries”Planned ModernizationAdvocated by Civil servants and Thinkers from
princely states—Vishweshwarayya Influenced by Japan, and later, the Soviet UnionPragmatic view of roles of industry, stateExpert panel to provide intellectual brain

Congress: Strands of ThoughtNehru & Bose Imperialism propelled by capitalist expansionState to develop “mother” industriesOwnership in public sector for redistributive
and security reasonsGandhi“Industrialize and perish”Caste (and consequent occupational roles)
can be dissolved through moral persuasionDecentralized, independent development
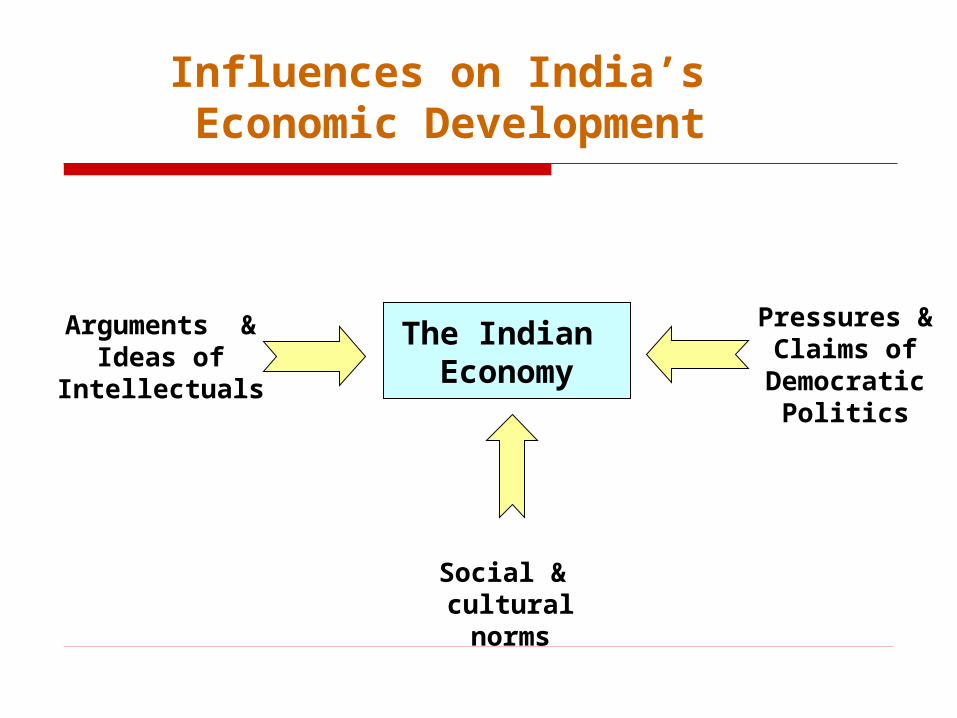
The Indian Economy
Arguments &Ideas of
Intellectuals
Pressures &Claims of
DemocraticPolitics
Influences on India’s Economic Development
Social & culturalnorms

Four Phases of India’s Economic Growth—Panagariya (2008)
Phase I (1951-65): Takeoff under Liberal Regime; Open foreign investment
policy; relatively open trade policy until late 1950s; investment licensing tightens only towards the late 1950s, early 1960s
Phase II (1965-81): Socialism strikes with a vengeance
Phase III: Ad hoc liberalization during 1975-79, 1980-84 and then
more substantial liberalization during 1985-86 and 1986-87.
Phase IV (1988-present): Systemic and systematic liberalization
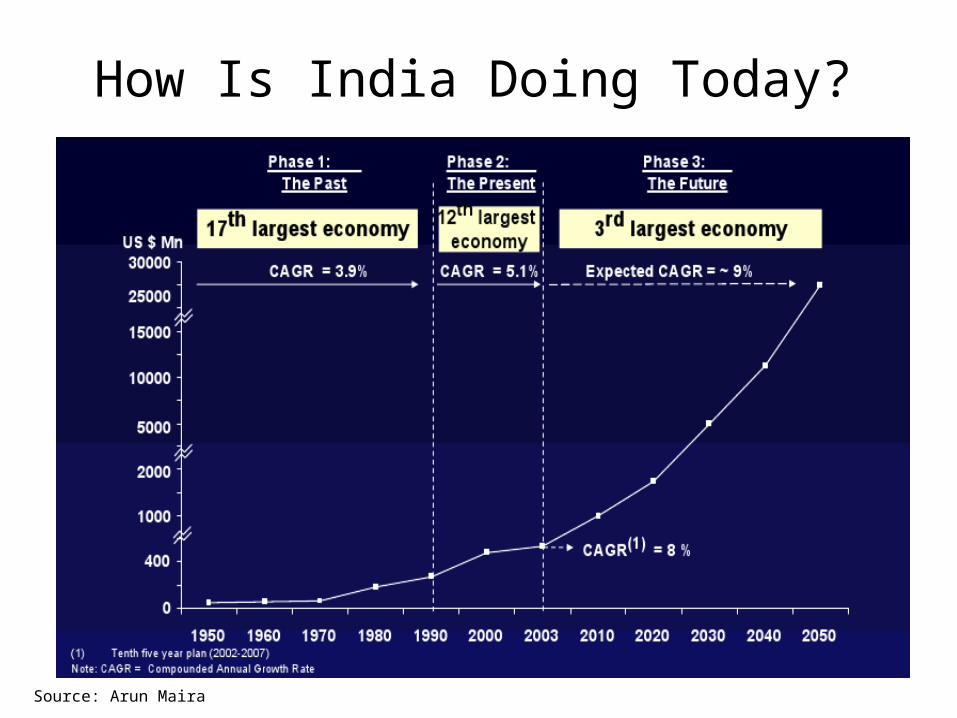
How Is India Doing Today?
Source: Arun Maira
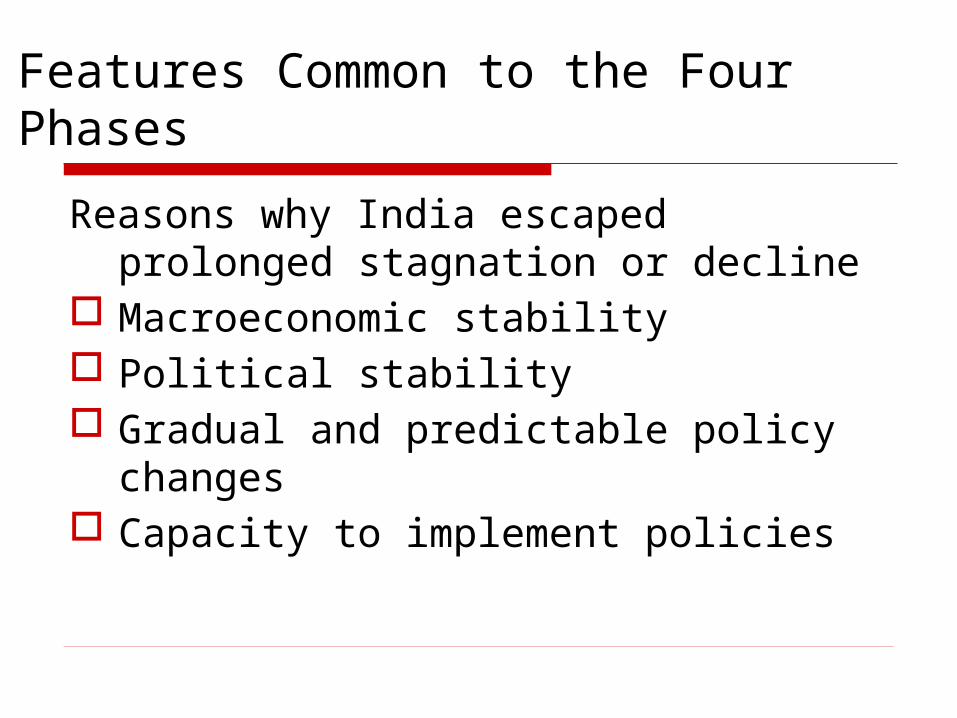
Features Common to the Four Phases
Reasons why India escaped prolonged stagnation or decline
Macroeconomic stability Political stability Gradual and predictable policy
changes Capacity to implement policies
Post-Independence: The Agenda in the Early Years (Phase I)
Multipronged Development => Self-relianceRapid industrialization; import subs’n; K goodsPrevention of foreign capital dominationLand reforms: abolish zamindari; land to tenant Introduction of CooperativesGrowth with equity: therefore positive
discrimination and reservations for SC & STState to play central role through direct
participation in the economic process => active public sector
Planned rapid industrialisation within a democratic & civil libertarian framework (an uncharted path!)
Nehruvian Activist AgendaConstitutional democracyEconomic & social redistributionState-directed industrialization
State to create conditions for economic expansion; Forego quicker growth (through consumer industries) for
long-term development State industrial investment would be a counterweight to
“cyclical swings and fashions of private investment” Productive public sector => resources for redistribution (1947 AICC Committee: “transfer from private to public
ownership should commence after a period of five years”) Nehru does not push fully due to lack of consensus =>
Mixed Economy prevails

Nehruvian Theory & Practice Economic planning within mixed economy
Unique combination of democracy, markets and economic planning Industrial licensing system
More restrictive after Industrial Policy Resolution 1956 Tariff policy (infant industry protection) Emphasis on import substitution
Foreign exchange shortages justify such regulation Mahalanobis Model: Heavy + Capital Goods Industries
Public Sector captures “commanding heights of the economy” Small scale industry protection; expected to address unemployment Significant investments in health and education; neglected by British
Science & Technology: Atomic Energy, National Labs, CSIR => India’s scientific manpowerIn practice, pragmatism rather than doctrinaire approach; not much opposition from organized business, which was actively consulted; lays the foundation for India’s physical and human infrastructure, the precondition for modern India’s development
Problems Nehru facedUnequal distribution of land ownership
defended by a powerful social orderPower to legislate regarding land reforms
given to states Low levels of productivityÞ Great inequalities of social order largely
preserved• Bureaucracy to push developmental agenda• Industrialization based on Planning
Commission for strategy, & bureaucrats for implementation
Nehru’s Achievements and the Immediate Post-Nehru PeriodModerate growthDemocratic legitimacyEconomic stability through prudent financial
managementUndermined by crisesPolitical discontinuity – Shastri’s early deathWars with China (1962) & Pakistan (1965)Successive monsoon failures – 1965, 1966Devaluation of currency to get IMF aid
Indira Gandhi – Early Years (Phase II)
Fears about India’s external vulnerability Had to establish herself politically
Used economic policy as active instrument Success of green revolution created bullock
capitalists as economic and political force State subsidies to gain their support Other interest groups flexed their muscles Economic populism to gain support of poor Leftward shift – bank nationalization Constraints on pvt. industry (e.g. MRTP) Indirect taxes to fund populism Fiscal conservatism broadly maintained

By the late 1980s … (Phase III) Protectionist system of controls primarily to sustain
state, not support development Huge bureaucracy to “rein in business” Deficits increased, fiscal prudence slowly declined Rising interest rates made foreign borrowing costly to
fund deficit, more conditions put by foreign lenders Rajiv Gandhi enters and moves toward liberalization
Lowers taxes and tariffs, introduces computers Telecom Revolution
Even though teledensity does not rise that much, the Public Call Offices make communication available to all easily

The Fiscal Crisis in 1991 Collapse of Soviet Union dented trade flows Gulf War in 1991 boosted oil import bill Forced repatriation of Indian migrant workers from
the Gulf reduced inflows of workers’ remittances. Withdrawal of non-resident Indian deposits As foreign exchange reserves dwindled, India was
forced ask the IMF for balance of payments support A new government came to power in June 1991 with
an immediate agenda of: Stabilization (devaluation, deficit reduction) Liberalization of the domestic economy Opening up to international trade
Liberalization (Phase IV)Dismantling of licensing systemRemoval of MRTP (earlier restricted growth)Removal of technology import restrictionsRemoval of physical constraints on importsReduced tariffsReduced taxesFERA FEMA & Current account convertibility
(allows cos to access ForEx to expand overseas)Companies had freedom to price IPOsDivestment in public sector
Factors Enabling Growth Post-Liberalization
Entrepreneurship Dismantling of license raj lowered costs Competition from foreign companies (100% allowed in
high-tech)—led to learning, partnering, tech adoption Pent-up demand unleashed Institutions were in place to nurture markets India’s affordable, educated workforce as a
comparative advantage Scaling up in employee numbers readily possible Cos knew how to deal with very price sensitive market Leapfrogging possible—little burden of legacy systems Foreign Direct Investment increased substantially
ConcernsUnaimed liberalization could:
Widen the gap in social opportunity between rich & poor Sharpen rural-urban divide Increase regional imbalances
Number of poor large in absolute terms Economy has to be evaluated on the basis of what happens
to poor & dispossessed Is growth all that matters? What about quality of life?
Is India drifting dangerously towards a state of indebtedness and economic dependency in an uncertain world economy?
Is Indian policy to be dictated by World Bank etc?
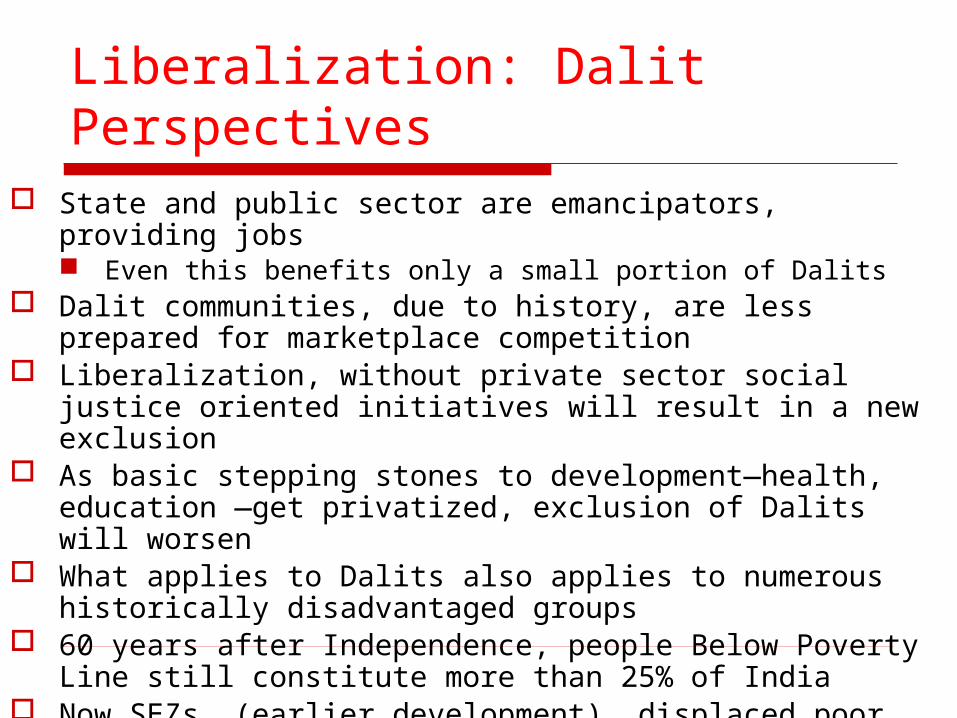
Liberalization: Dalit Perspectives State and public sector are emancipators, providing jobs
Even this benefits only a small portion of Dalits Dalit communities, due to history, are less prepared for
marketplace competition Liberalization, without private sector social justice oriented
initiatives will result in a new exclusion As basic stepping stones to development—health, education
—get privatized, exclusion of Dalits will worsen What applies to Dalits also applies to numerous historically
disadvantaged groups 60 years after Independence, people Below Poverty Line still
constitute more than 25% of India Now SEZs, (earlier development), displaced poor without
making them benefit from progress

The reforms are not simply about the renegotiation of India’s relationships with the global market-place, nor even are they about the relationships of private capital with the Indian state in the formal economy; the reforms are also about the reworking of the idea of the State itself and of the state’s capacity to work on behalf of those who stand outside India’s (expanding) social and economic elites.—Corbridge and Harriss, 2000, p. 169
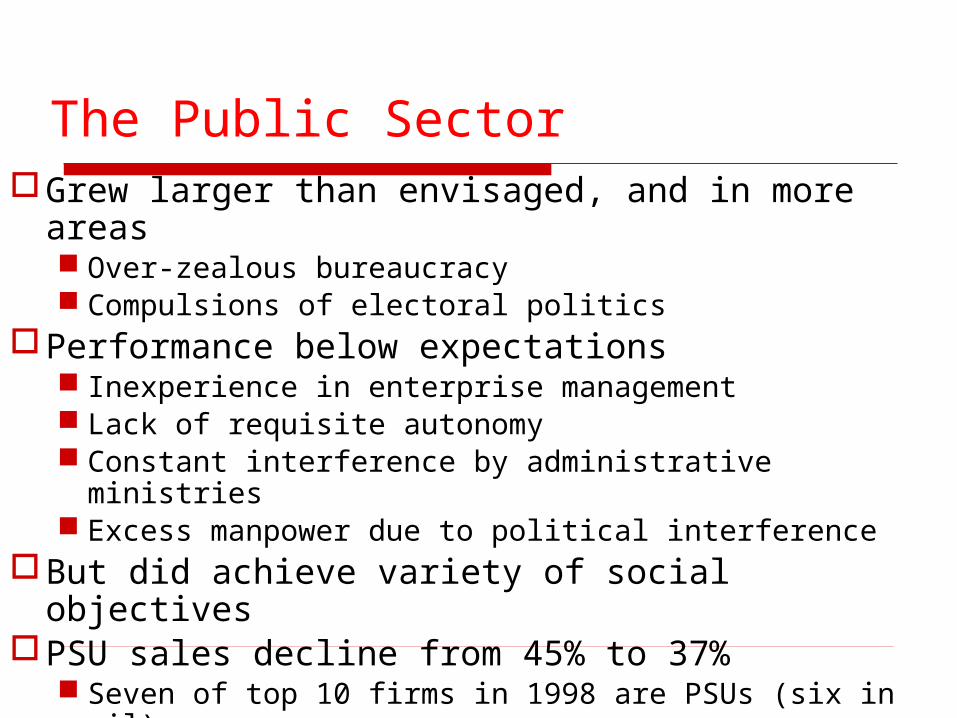
The Public SectorGrew larger than envisaged, and in more areas
Over-zealous bureaucracy Compulsions of electoral politics
Performance below expectations Inexperience in enterprise management Lack of requisite autonomy Constant interference by administrative ministries Excess manpower due to political interference
But did achieve variety of social objectivesPSU sales decline from 45% to 37%
Seven of top 10 firms in 1998 are PSUs (six in oil) Privatization slow: Modern Foods, Sterlite Navratna privatization or disinvestment now opposed
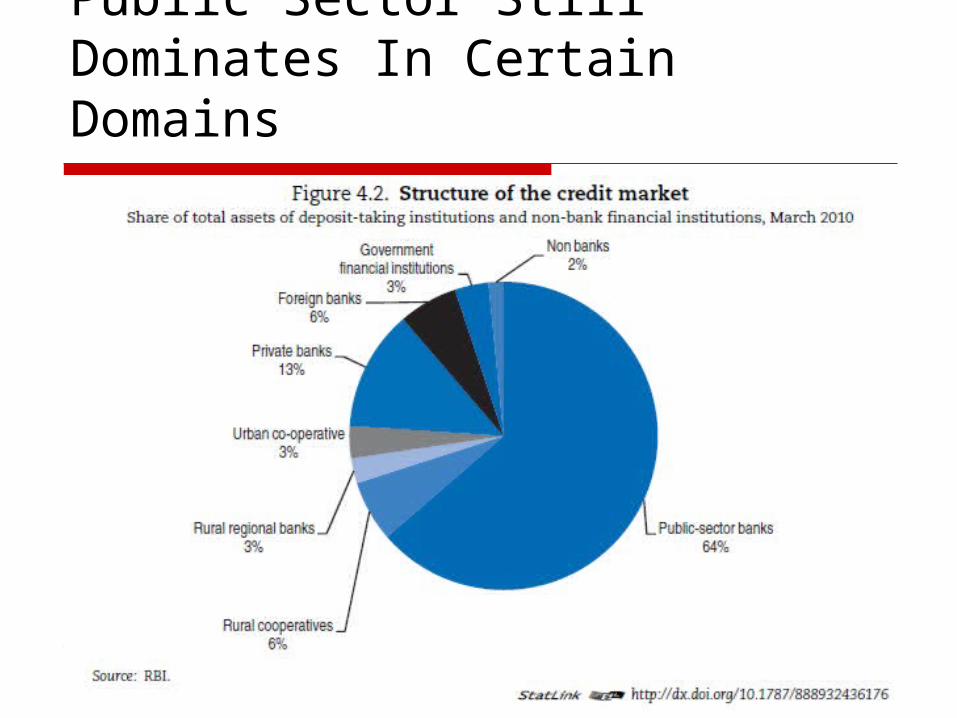
Public Sector Still Dominates In Certain Domains

But Not In Others:Air India!
At the close of financial year 2009-10, Air India has incurred a cumulative loss of over Rs 13,300 crore since its merger with Indian Airlines in 2007
Before the merger in 2006-07, the losses reported by erstwhile Air India and Indian Airlines were Rs 447.93 crore and Rs 240.29 crore, respectively.

Arvind Subramanian comments … The Indian state, despite rapid economic growth, has
deteriorated over time. Whether it is providing basic law and order, or ensuring sanctity of contract, or delivering public services, the stench of decline is hard to ignore.
There is a fundamental asymmetry between state and markets. It is easier to create markets than it is to create state capacity or to prevent its deterioration. Creating markets is a lot about letting go, establishing a reasonable policy framework, and allowing the natural hustling instinct to take over.
Building state capacity, on the other hand, is quite different. It involves overcoming collective action problems, mediating conflict, creating accountability mechanisms where outputs are multiple and fuzzy and links between inputs and outputs murky, and contending with the deep imprints of history.

India: Still Trapped in Red Tape
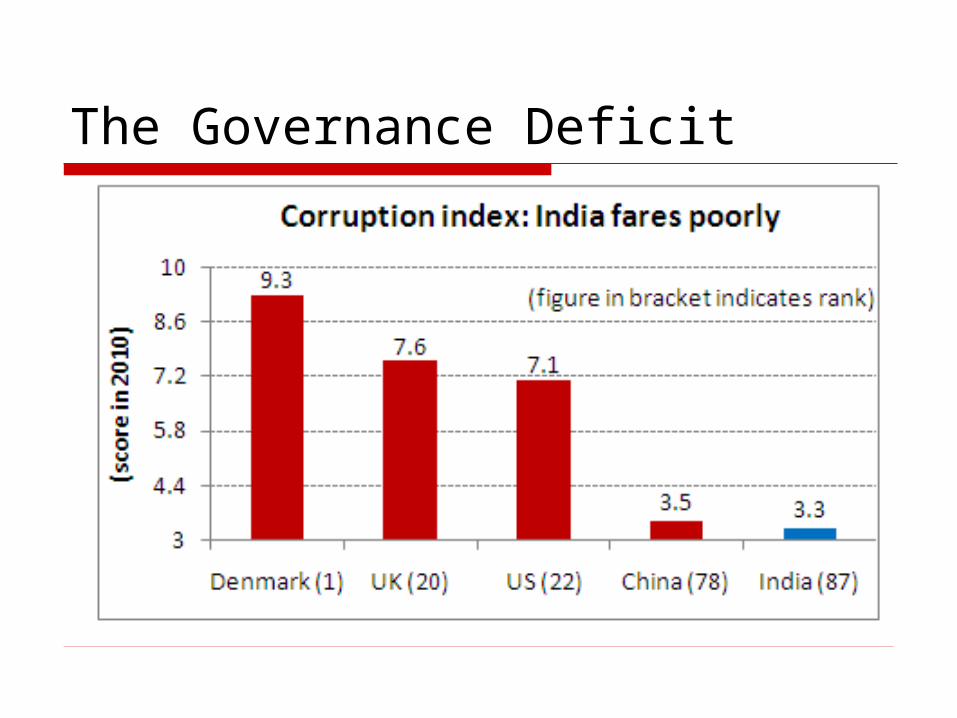
The Governance Deficit
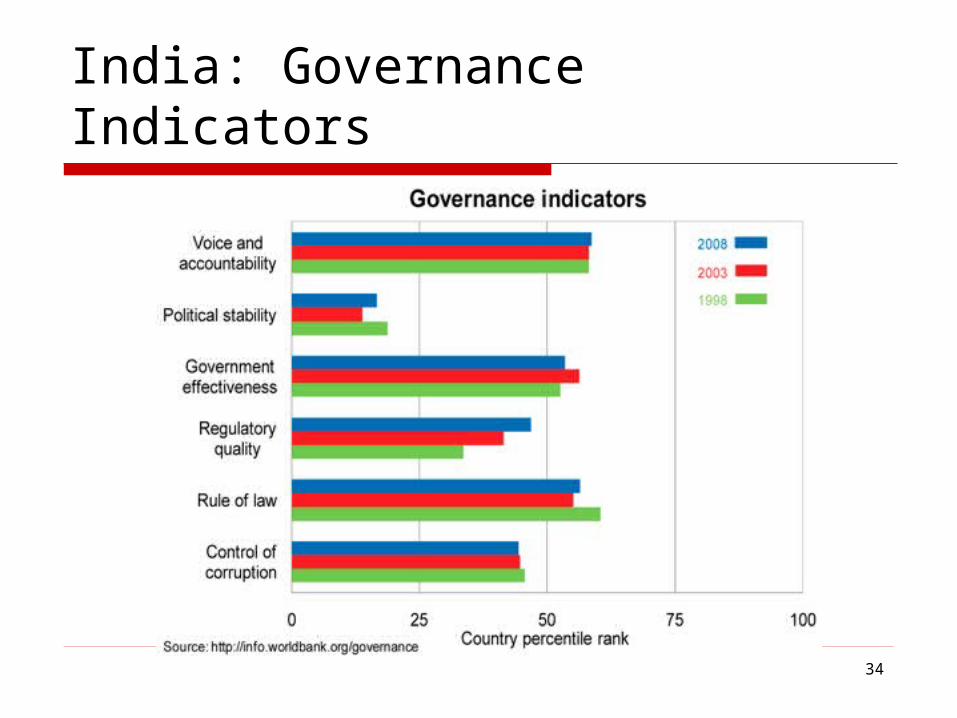
India: Governance Indicators
34

Today’s and Tomorrow’s India
https://www.youtube.com/watch?v=muJGrASkXEA

India is growing!
India will be the third largest economy by 2040 India will be the 5th largest consumer market by 2025
Source: Economist
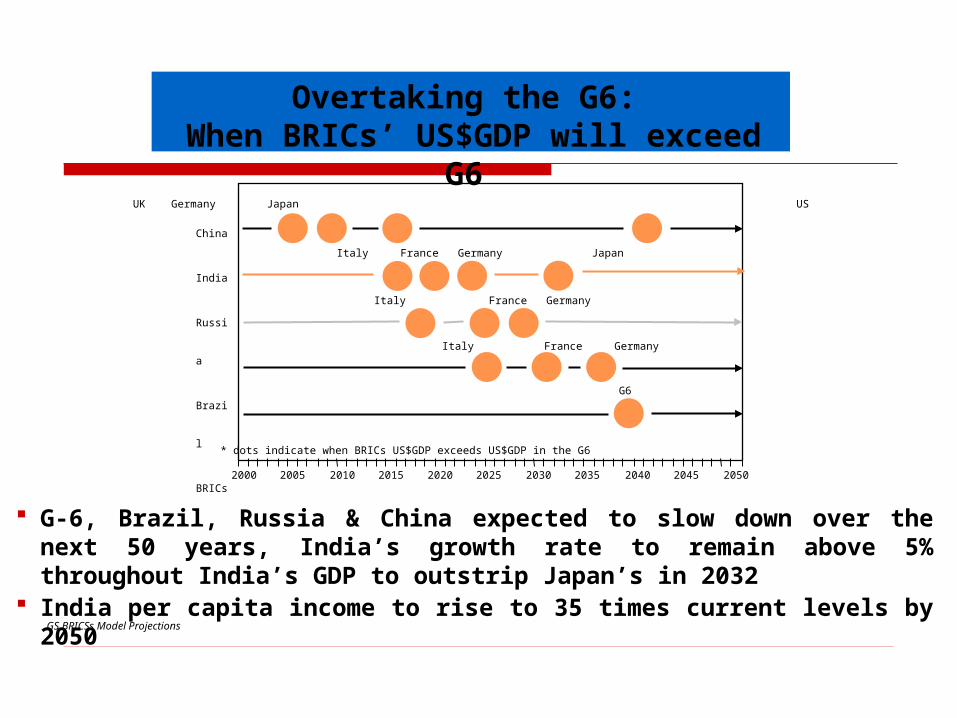
G-6, Brazil, Russia & China expected to slow down over the next 50 years, India’s growth rate to remain above 5% throughout India’s GDP to outstrip Japan’s in 2032
India per capita income to rise to 35 times current levels by 2050GS BRICSs Model Projections
China
India
Russia
Brazil
BRICs
2000 2005 2010 2015 2020 2025 2030 2035 2040 2045 2050
UK Germany Japan US
Italy France Germany Japan
Italy France Germany
Italy France Germany
G6
* dots indicate when BRICs US$GDP exceeds US$GDP in the G6
The BRICs Verdict on the Indian Economy
Overtaking the G6: When BRICs’ US$GDP will exceed G6

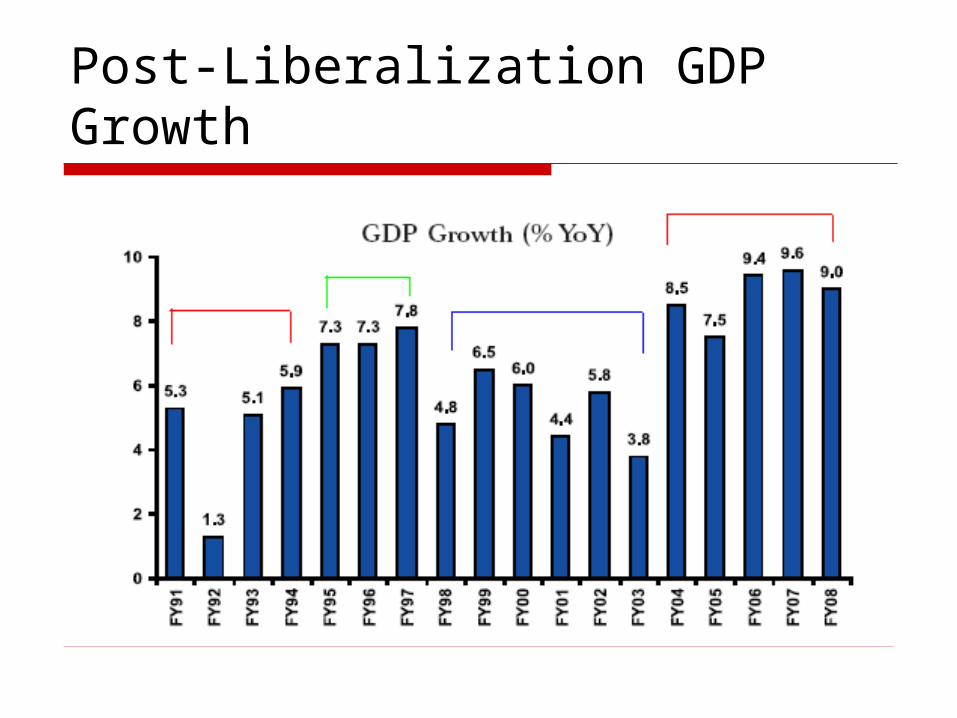
Post-Liberalization GDP Growth

The Current Year

Factors Driving India’s Growth

A Rising Savings Rate
1980-81 1990-91 2000-01 2010-11
Savings rate/GDP, /%
18.5 22.8 23.7 34
Source: Government of India, Economic Survey 2010-11, www.indiabudget.nic.in
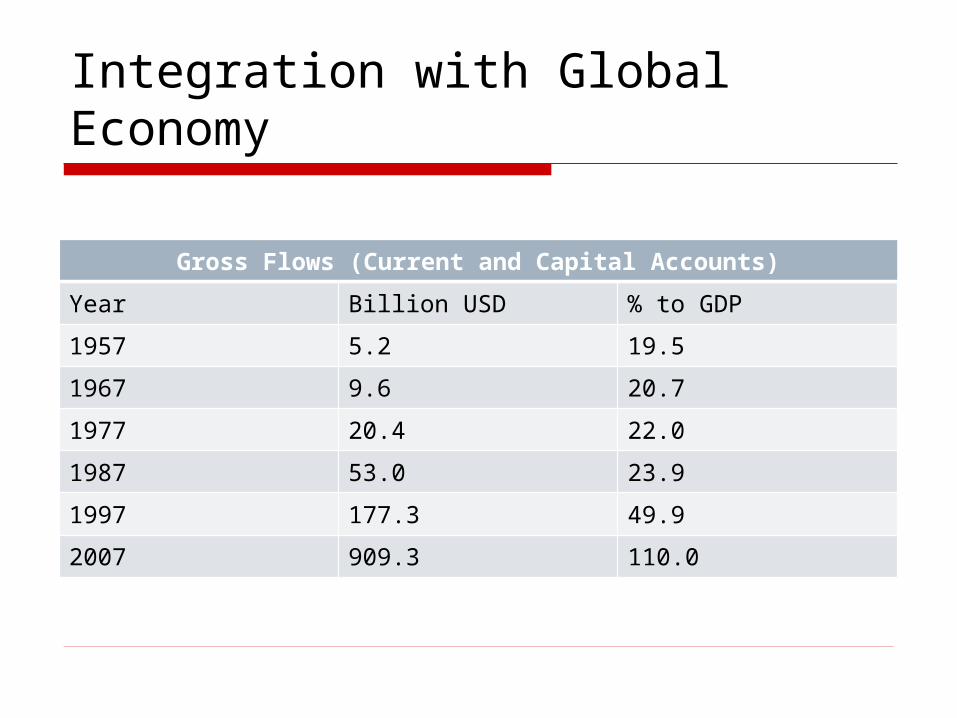
Integration with Global Economy
Gross Flows (Current and Capital Accounts)
Year Billion USD % to GDP
1957 5.2 19.5
1967 9.6 20.7
1977 20.4 22.0
1987 53.0 23.9
1997 177.3 49.9
2007 909.3 110.0
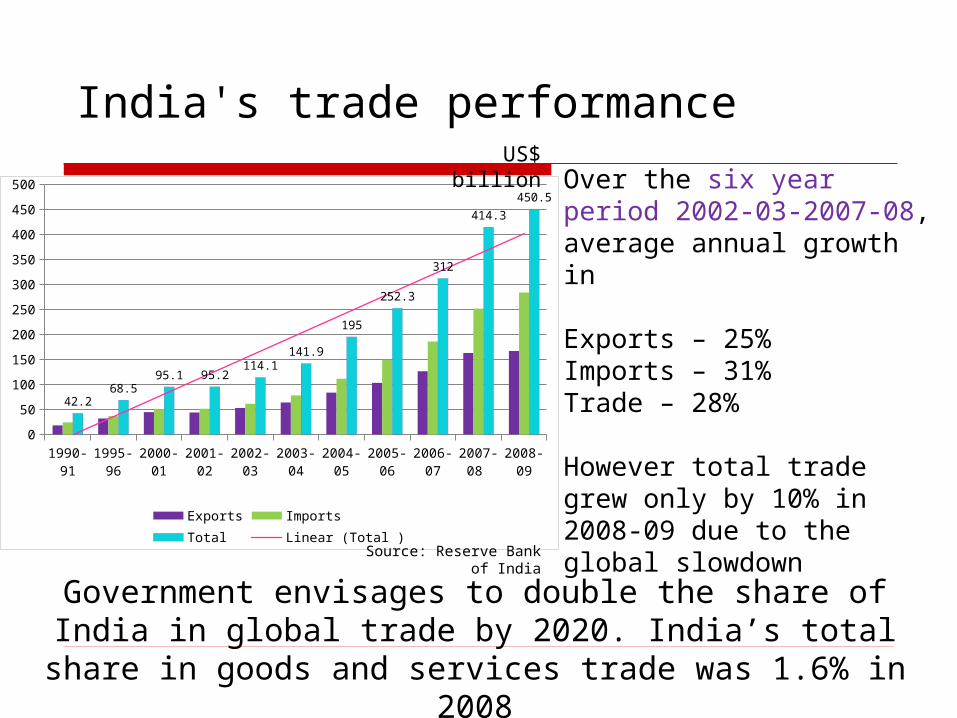
India's trade performance
1990-91
1995-96
2000-01
2001-02
2002-03
2003-04
2004-05
2005-06
2006-07
2007-08
2008-09
0
50
100
150
200
250
300
350
400
450
500
42.268.5
95.1 95.2114.1
141.9
195
252.3
312
414.3
450.5
Exports Imports Total Linear (Total )
US$ billion
Source: Reserve Bank of India
Government envisages to double the share of India in global trade by 2020. India’s total share in goods and services trade was 1.6% in 2008
Over the six year period 2002-03-2007-08, average annual growth in
Exports – 25%Imports – 31%Trade – 28%
However total trade grew only by 10% in 2008-09 due to the global slowdown
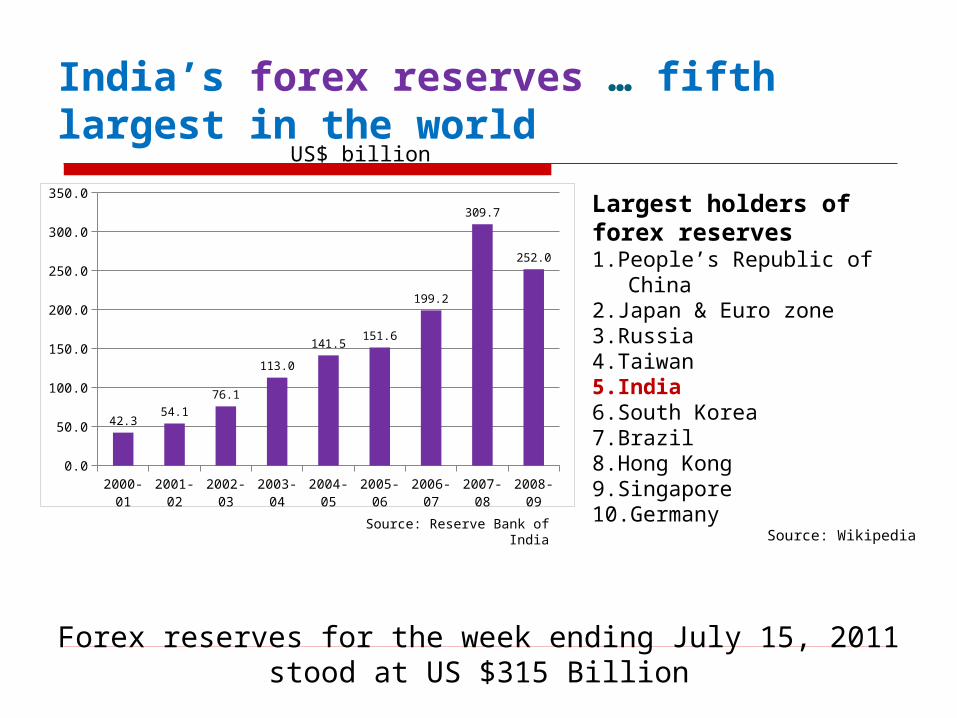
India’s forex reserves … fifth largest in the world
2000-01 2001-02 2002-03 2003-04 2004-05 2005-06 2006-07 2007-08 2008-090.0
50.0
100.0
150.0
200.0
250.0
300.0
350.0
42.354.1
76.1
113.0
141.5151.6
199.2
309.7
252.0
US$ billion
Source: Reserve Bank of India
Largest holders of forex reserves1.People’s Republic of China2.Japan & Euro zone3.Russia4.Taiwan 5.India6.South Korea7.Brazil8.Hong Kong9.Singapore 10.Germany
Source: Wikipedia
Forex reserves for the week ending July 15, 2011 stood at US $315 Billion

Inflation level….
Average 1991-92 to
1999-00
2000-01 2001-02 2002-03 2003-04 2004-05 2005-06 2006-07 2007-08 2008-090.0
1.0
2.0
3.0
4.0
5.0
6.0
7.0
8.0
9.0
7.9
7.1
3.73.4
5.4
6.4
4.4
5.44.7
8.4
Wholesale Price Index (in percent)
Source: Reserve Bank of India
Inflation touched a peak of 12.8% in August 2008 due to increased pressure on global commodity prices
Wholesale price index for the month of February 2010 was 9.9% (y-o-y)

Index of Industrial Production
Avg growth 1990s
2000-01
2001-02
2002-03
2003-04
2004-05
2005-06
2006-07
2007-08
2008-09
0.0
2.0
4.0
6.0
8.0
10.0
12.0
14.0
6.2
5.3
2.9
6.0
7.4
9.2 9.1
12.5
9.0
2.5
6.1
5.0
2.7
5.7
7.0
8.4 8.2
11.6
8.5
2.6
Manufacturing General
(in percent)
Source: Central Statistical Organization
For the economy to clock 8-10% growth, manufacturing sector needs to grow by at least 12%
Manufacturing sector has witnessed a perceptible slowdown due to(i) Global meltdown and (ii) Contractionary monetary policy stance of RBI IIP Growth inApril’09 - 1.2%May’09 - 2.2%June’09 - 7.8%July’09 - 7.2%Aug’09 - 10.2%Sept’09 - 9.1%Oct’09 - 10.3%Nov’09 - 11.7%Dec’09 - 16.8%Jan’10 - 16.7%
March 2011 7.8 %
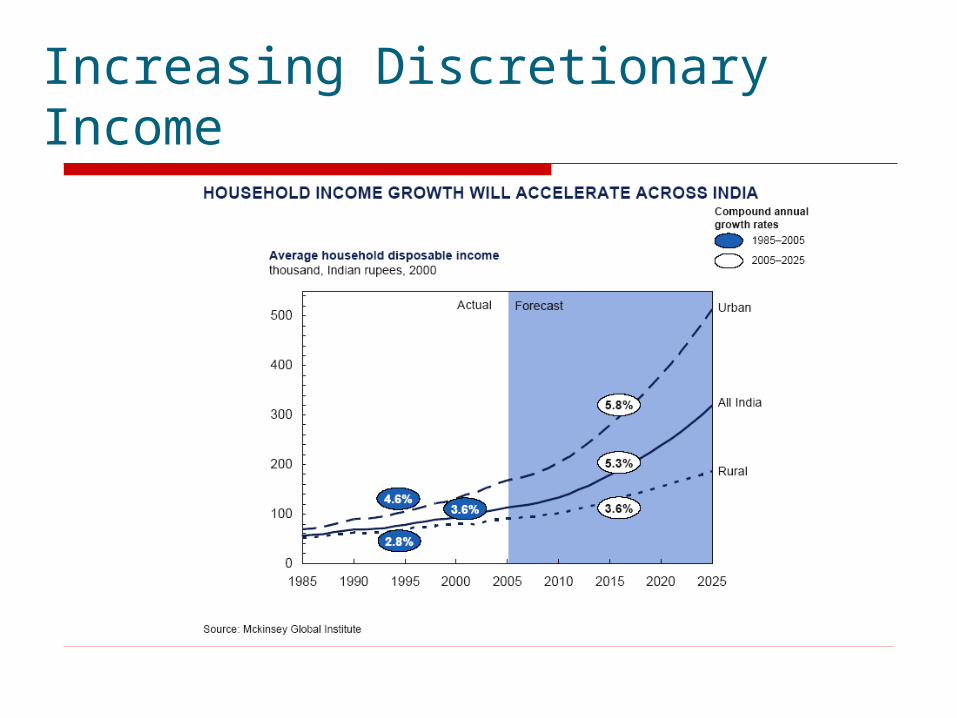
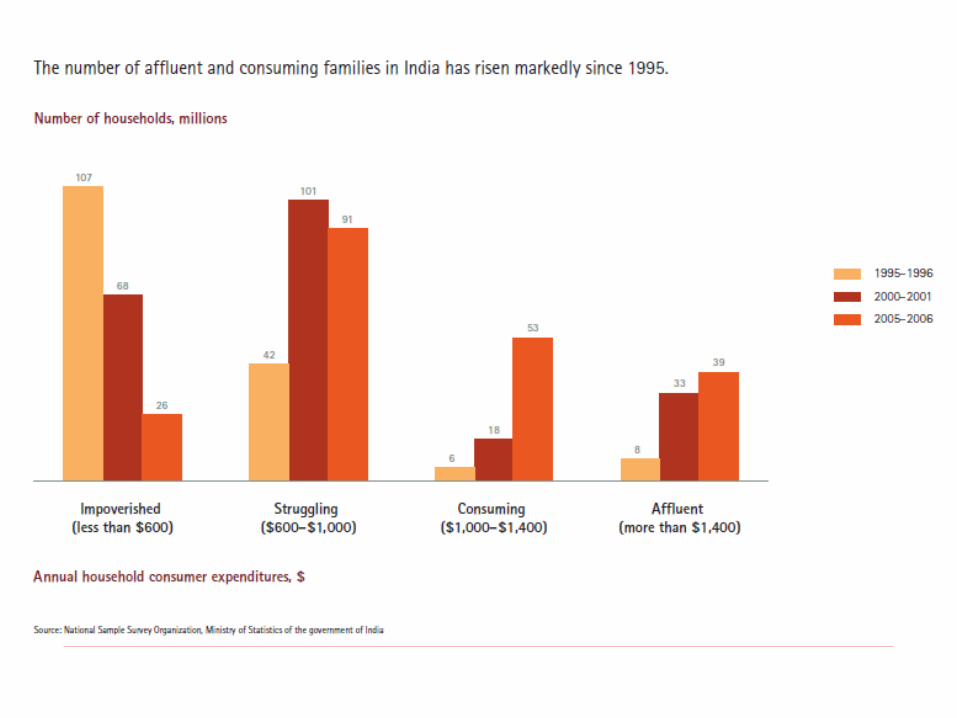
Increasing Discretionary Income
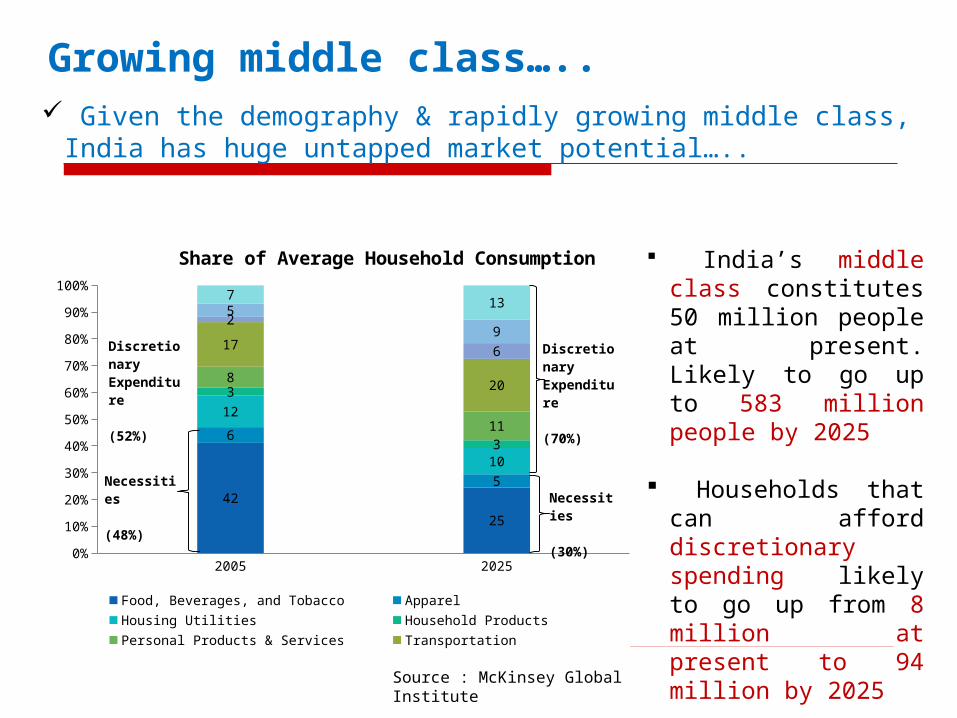
Given the demography & rapidly growing middle class, India has huge untapped market potential…..
2005 20250%
10%
20%
30%
40%
50%
60%
70%
80%
90%
100%
42
25
6
5
12
10
3
3
8
11
17
20
2
6
5
9
7 13
Share of Average Household Consumption
Food, Beverages, and Tobacco Apparel Housing Utilities Household ProductsPersonal Products & Services Transportation Communication Education & RecreationHealth Care
Discretionary Expenditure (52%)
Necessities (48%) Necessities
(30%)
Discretionary Expenditure (70%)
Source : McKinsey Global Institute
India’s middle class constitutes 50 million people at present. Likely to go up to 583 million people by 2025
Households that can afford discretionary spending likely to go up from 8 million at present to 94 million by 2025
Growing middle class…..
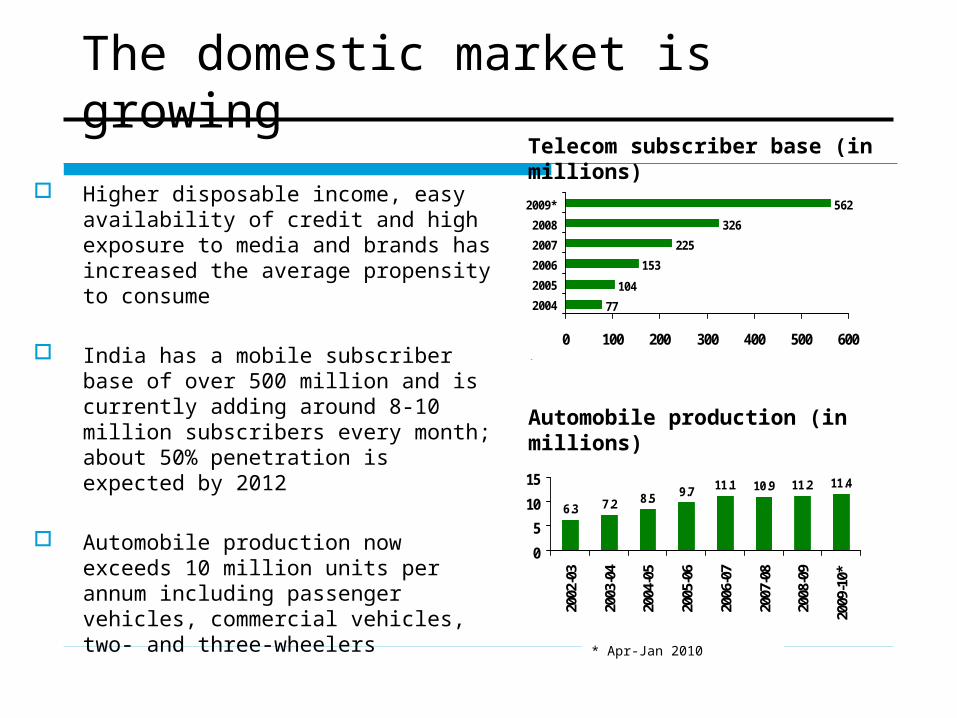
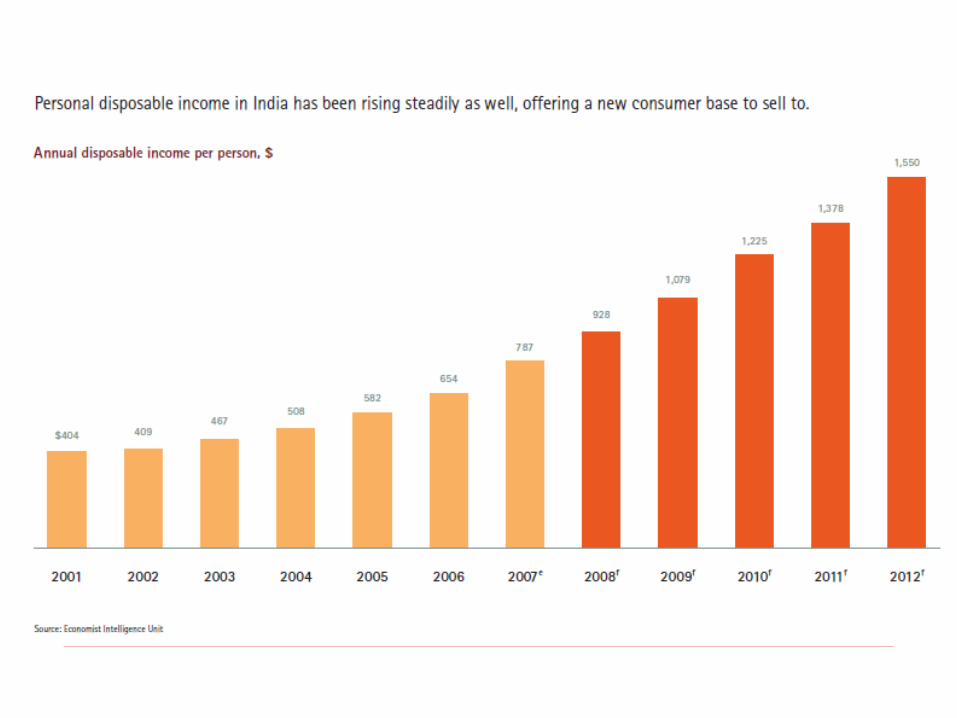
Higher disposable income, easy availability of credit and high exposure to media and brands has increased the average propensity to consume
India has a mobile subscriber base of over 500 million and is currently adding around 8-10 million subscribers every month; about 50% penetration is expected by 2012
Automobile production now exceeds 10 million units per annum including passenger vehicles, commercial vehicles, two- and three-wheelers
77
104
153
225
326
562
0 100 200 300 400 500 600
2004
2005
2006
2007
2008
2009*
*Upto 31st Dec 2009
6.3 7.2 8.5 9.7 11.1 10.9 11.2 11.4
0
5
10
15
2002
-03
2003
-04
2004
-05
2005
-06
2006
-07
2007
-08
2008
-09
2009
-10*
Telecom subscriber base (in millions)
Automobile production (in millions)
The domestic market is growing
* Apr-Jan 2010
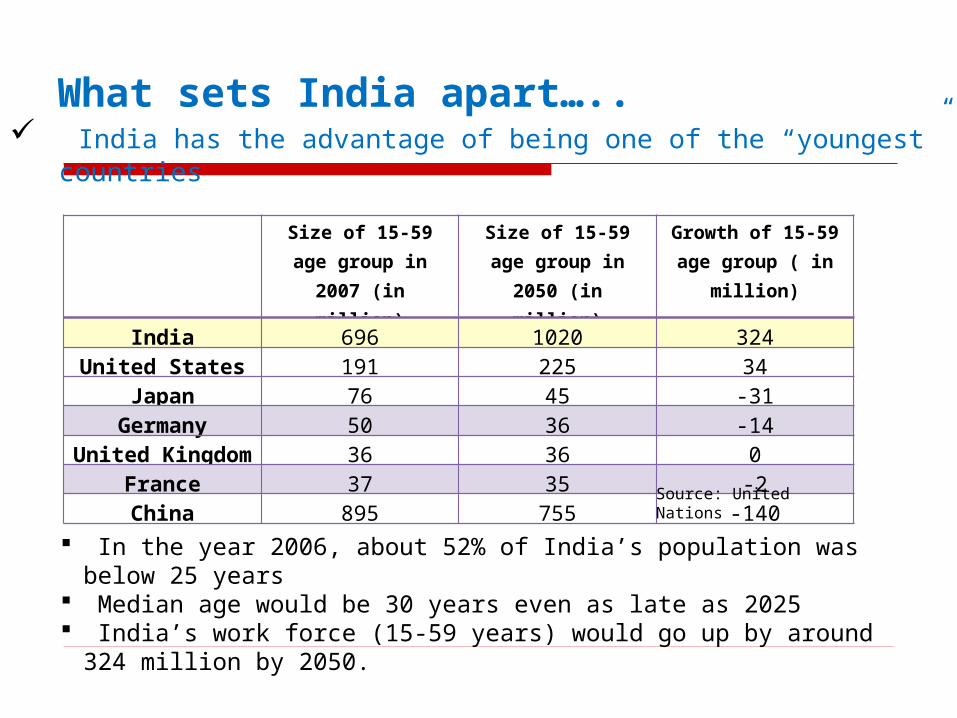
India has the advantage of being one of the “youngest” countries
In the year 2006, about 52% of India’s population was below 25 years Median age would be 30 years even as late as 2025 India’s work force (15-59 years) would go up by around 324 million by 2050.
Size of 15-59 age group in 2007 (in million)
Size of 15-59 age group in 2050 (in million)
Growth of 15-59 age group ( in million)
India 696 1020 324United States 191 225 34
Japan 76 45 -31Germany 50 36 -14
United Kingdom 36 36 0France 37 35 -2China 895 755 -140
What sets India apart…..
Source: United Nations
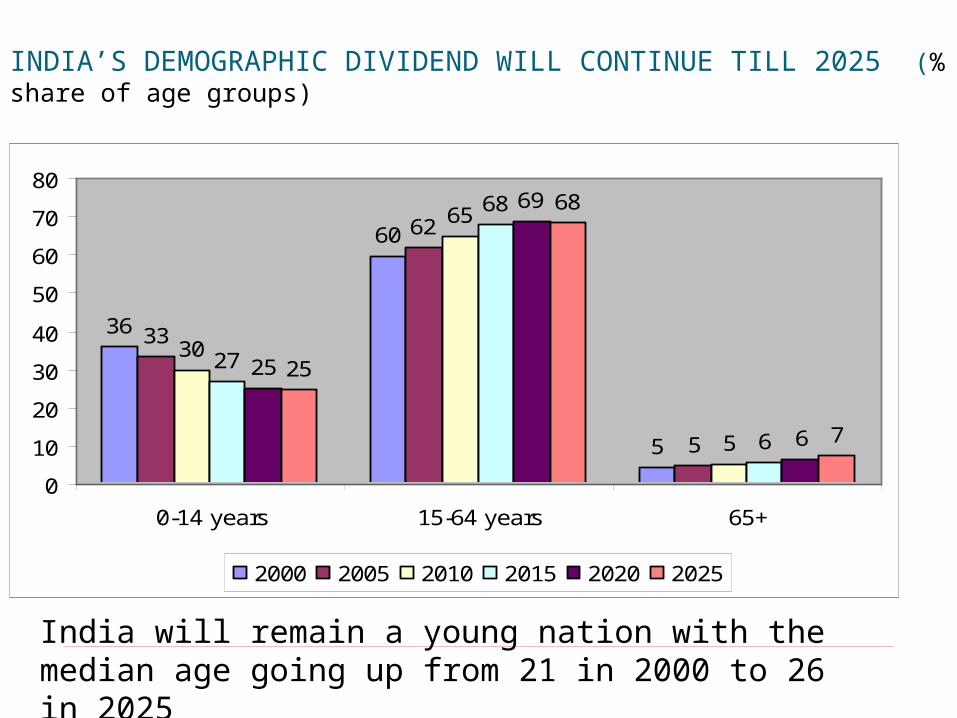
INDIA’S DEMOGRAPHIC DIVIDEND WILL CONTINUE TILL 2025 (% share of age groups)
36
60
5
33
62
5
30
65
5
27
68
6
25
69
6
25
68
7
0
10
20
30
40
50
60
70
80
0-14 years 15-64 years 65+
2000 2005 2010 2015 2020 2025
India will remain a young nation with the median age going up from 21 in 2000 to 26 in 2025
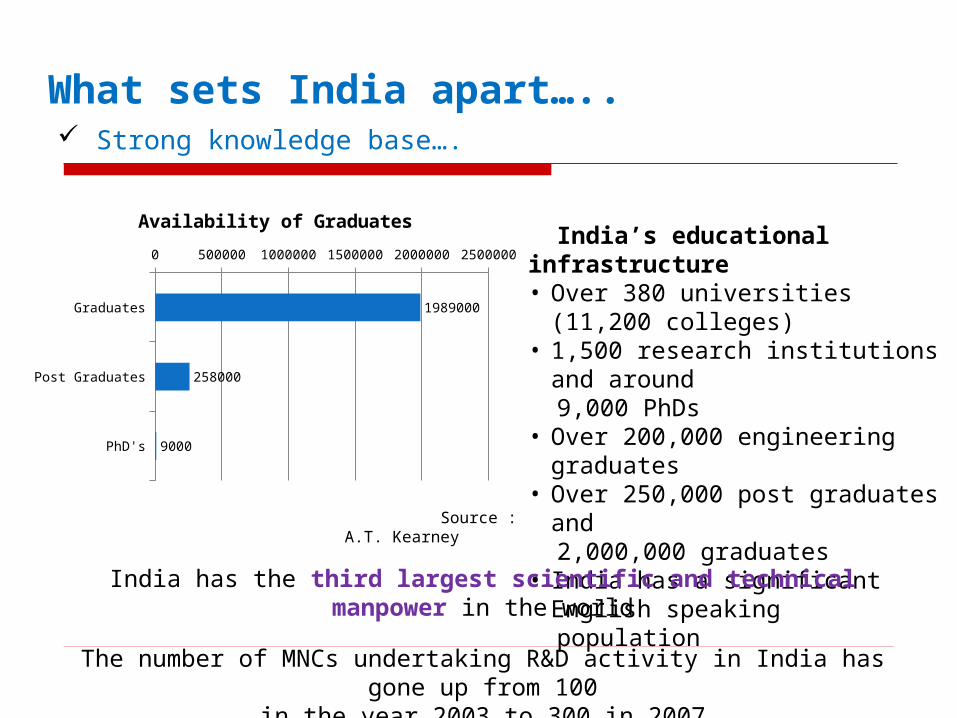
Strong knowledge base….
Graduates
Post Graduates
PhD's
0 500000 1000000 1500000 2000000 2500000
1989000
258000
9000
Availability of Graduates
Source : A.T. Kearney
India’s educational infrastructure• Over 380 universities (11,200 colleges)• 1,500 research institutions and around 9,000 PhDs• Over 200,000 engineering graduates• Over 250,000 post graduates and 2,000,000 graduates• India has a significant English speaking population
India has the third largest scientific and technical manpower in the world
The number of MNCs undertaking R&D activity in India has gone up from 100 in the year 2003 to 300 in 2007
What sets India apart…..
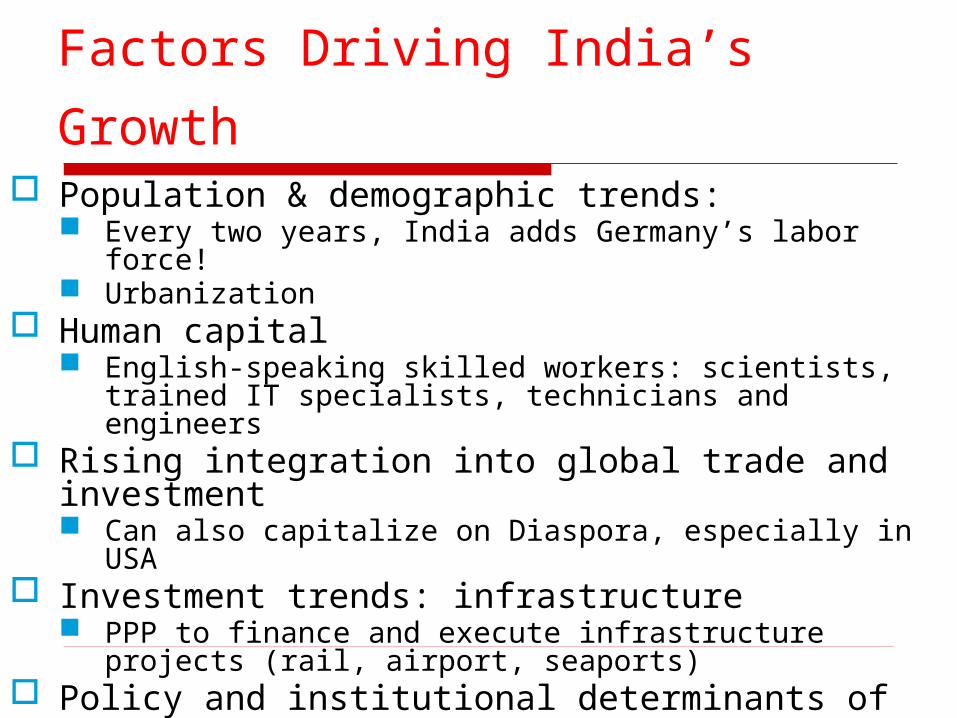
Factors Driving India’s Growth Population & demographic trends:
Every two years, India adds Germany’s labor force! Urbanization
Human capital English-speaking skilled workers: scientists, trained IT
specialists, technicians and engineers Rising integration into global trade and investment
Can also capitalize on Diaspora, especially in USA Investment trends: infrastructure
PPP to finance and execute infrastructure projects (rail, airport, seaports)
Policy and institutional determinants of growth Macro policies Institutional and regulatory environment

Drivers of Economic Transformation Spirit of entrepreneurship
Unleashed with the IT revolution and emergence of BPO / outsourcing industry
Rise of knowledge based industry, taking cue from successful entrepreneurs in the Silicon Valley
IT industry leveraged on Modular Development and Global Delivery Model Benefits from 24 hr work day and productivity gains
Technology drove outsourcing of business processes Indian IT Cos devising strategies to move up value chain Other sectors transforming are Pharma and Auto-ancillaries Huge opportunities seen in improving supply chain
efficiencies and catering to domestic market across sectors Telecom revolution unleashes tremendous economic impact

India Growth Story:
The Constraints Infrastructure remains a critical bottleneck Quality of education archaic; not innovation-oriented
How can we educate 500 million youngsters properly? PSUs still hold monopoly in some sectors
Aerospace, defense production & nuclear power prodn. Reforms slowed due to need for political consensus Capital markets still not very efficient Slow growth in agriculture, occupation of 60% people Urbanization at a rapid pace, but not planned or
managed carefully Can lead to huge impacts on environment & efficiency
Challenge to ensure inclusive growth, Economic gains to be equitably distributed while
evolving right incentives for growth


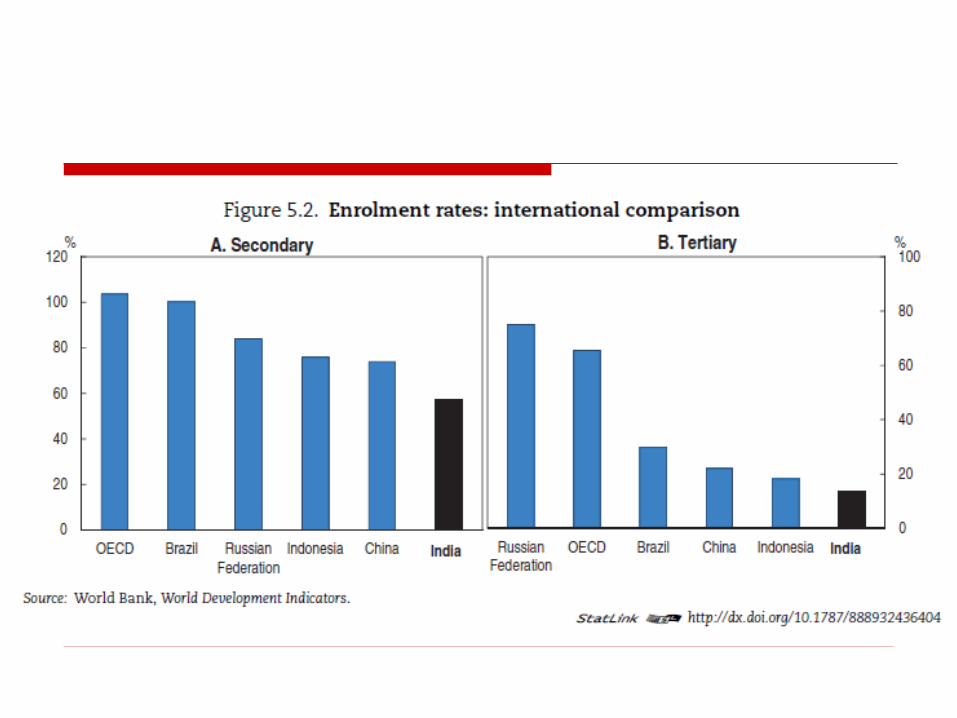
Arvind Subramanian again … Growth may itself cause changes which have in turn a
growth-reinforcing effect – a positive feedback loop. A good example is education. For long, development
economists bemoaned the poor levels of educational attainment in India, directing their critique at the government’s failure to supply better education.
But economic growth changed the education picture dramatically. It increased the returns to, and hence the demand for, education.
And if government supply remained weak, consumers simply turned to the private sector to meet their demand for education.
Improvements in educational attainment over the last 15 years are attributable in part to more rapid growth.

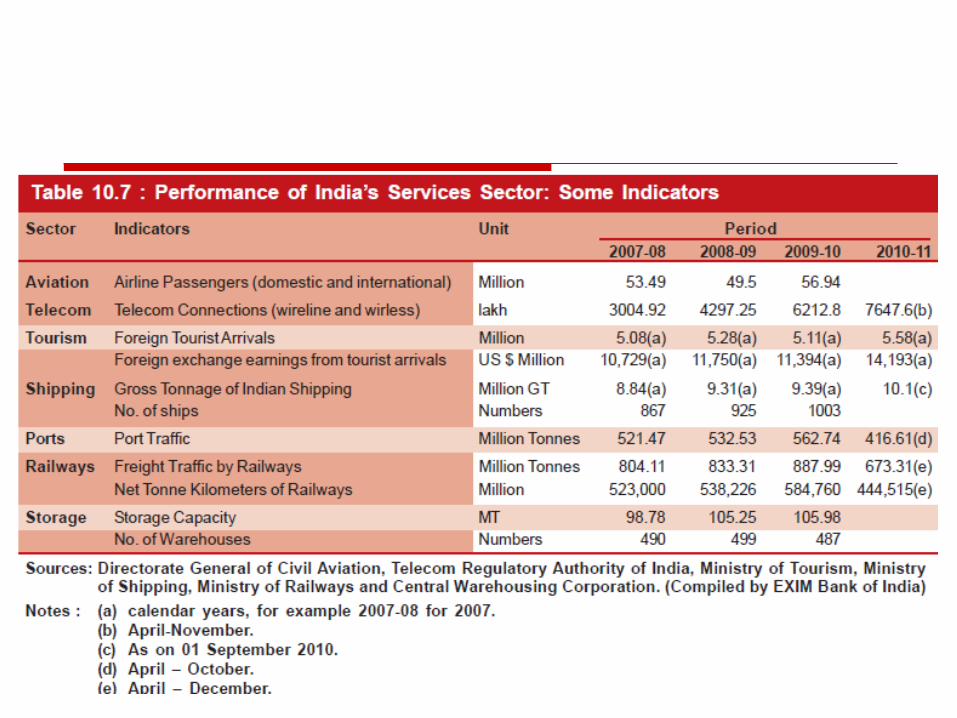
India’s Services-led Growth: Leapfrogging Over Manufacturing?

The Changing Composition of India’s Gross Domestic Product
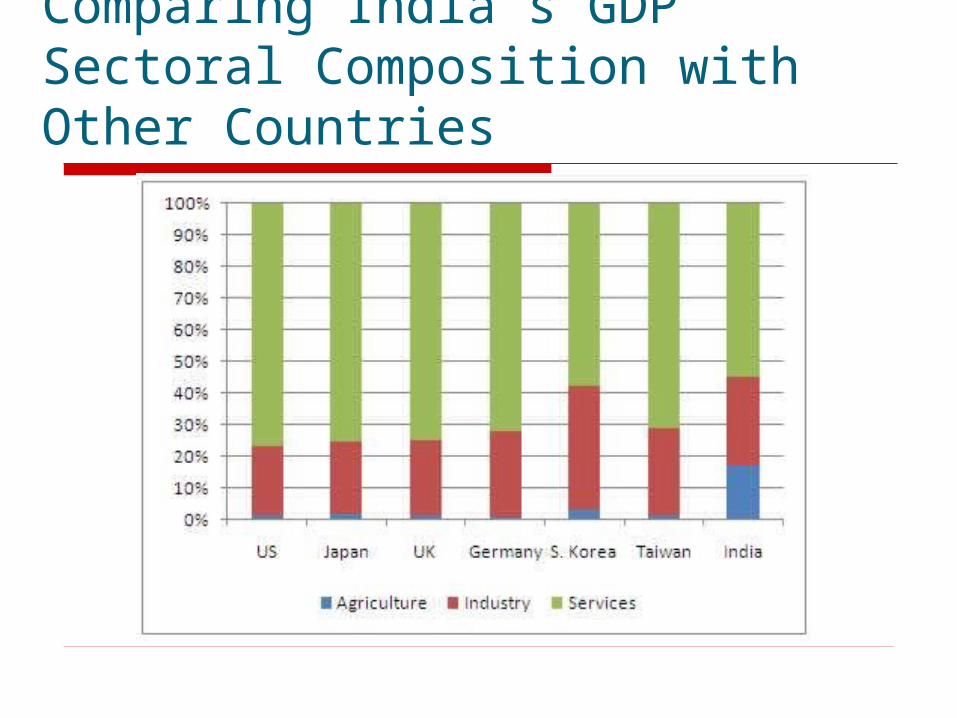
Comparing India’s GDP Sectoral Composition with Other Countries

Service Sectors Trade- wholesale and retail Hotels and Restaurants Railways Transport- road, water, air Communication- postal, money orders, telegrams, phones, overseas
communication Banking Insurance Dwellings, Real Estate Legal services Business services- renting of machinery, computers, accounting Public administration, defense Personal- domestic laundry, barber, beauty shops, tailors, recreation,
entertainment Community services- education, research, medical, religious
Source: Barry Eichengrem, & Poonam Gupta, April 2010
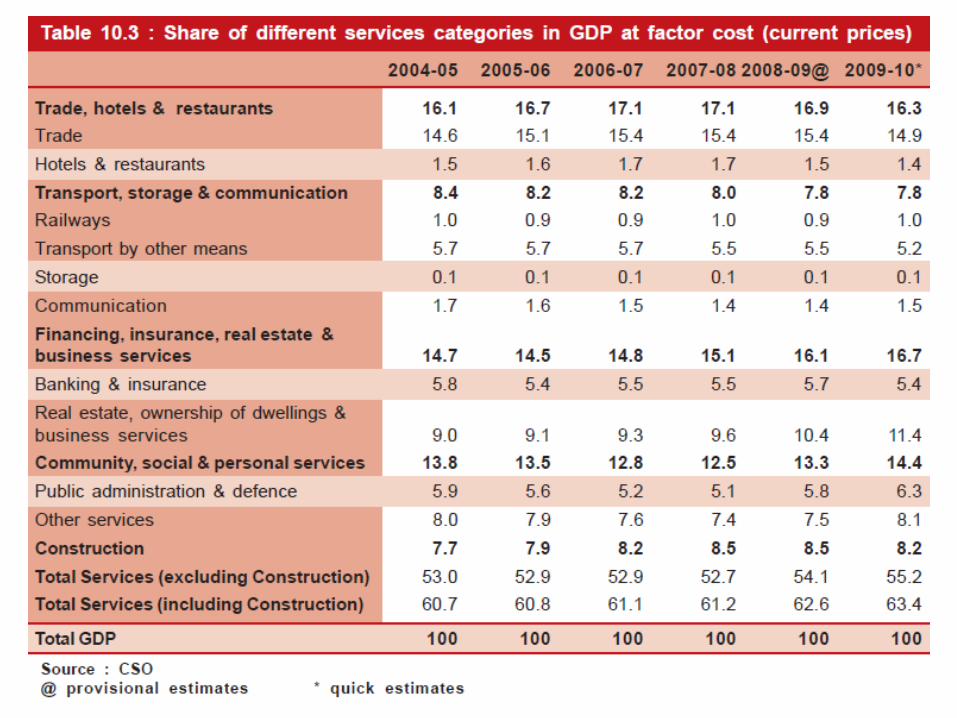
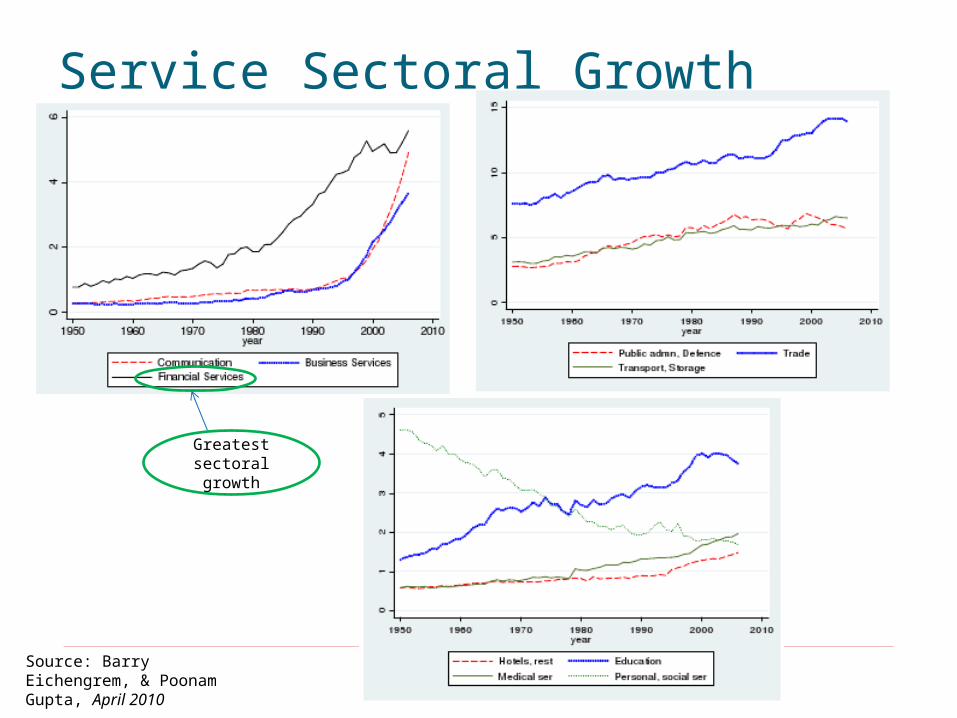
Service Sectoral Growth
Greatest sectoral growth
Source: Barry Eichengrem, & Poonam Gupta, April 2010
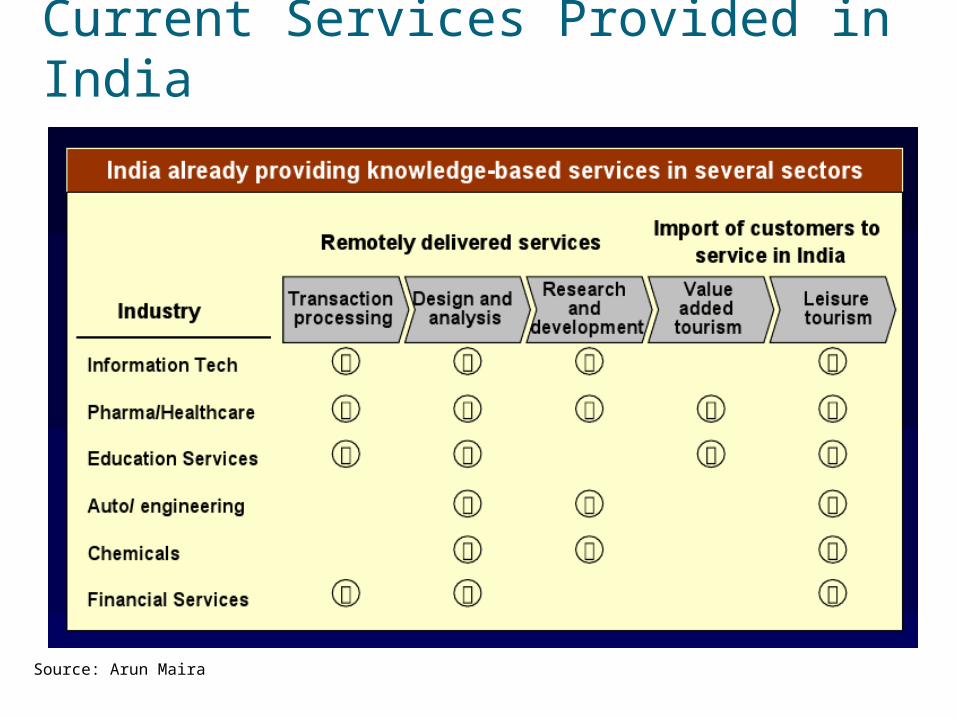
Current Services Provided in India
Source: Arun Maira
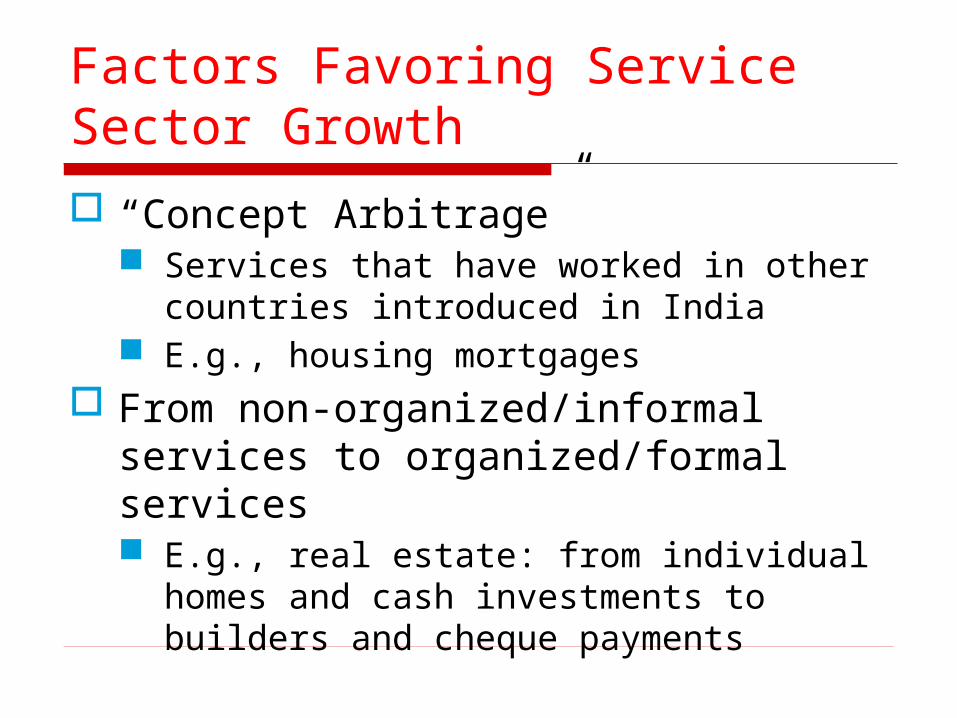
Factors Favoring Service Sector Growth
“Concept Arbitrage” Services that have worked in other
countries introduced in India E.g., housing mortgages
From non-organized/informal services to organized/formal services E.g., real estate: from individual homes
and cash investments to builders and cheque payments
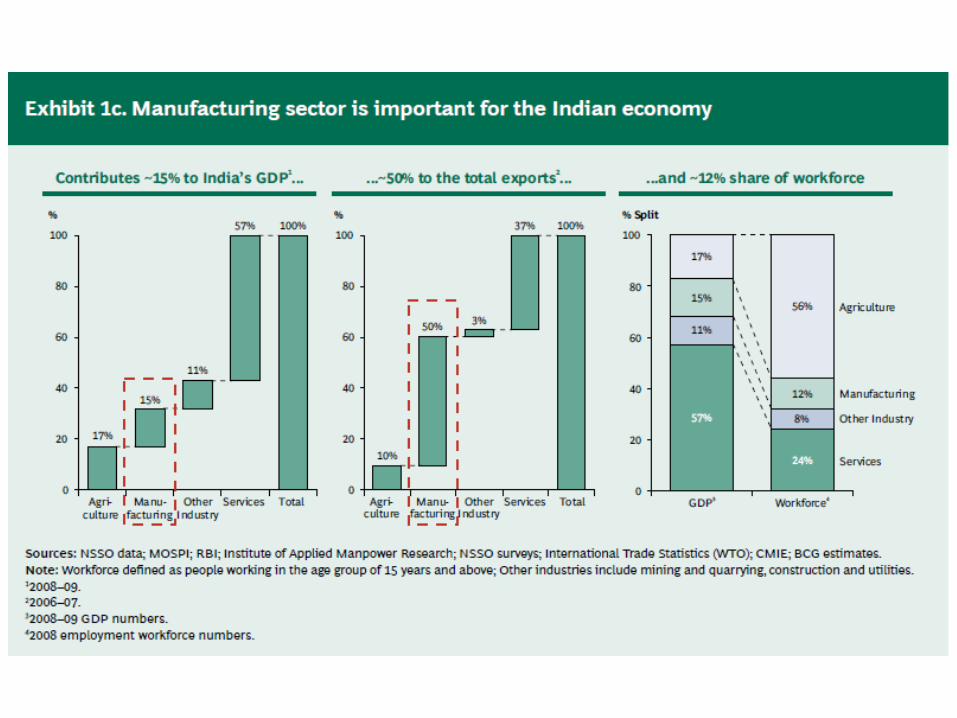
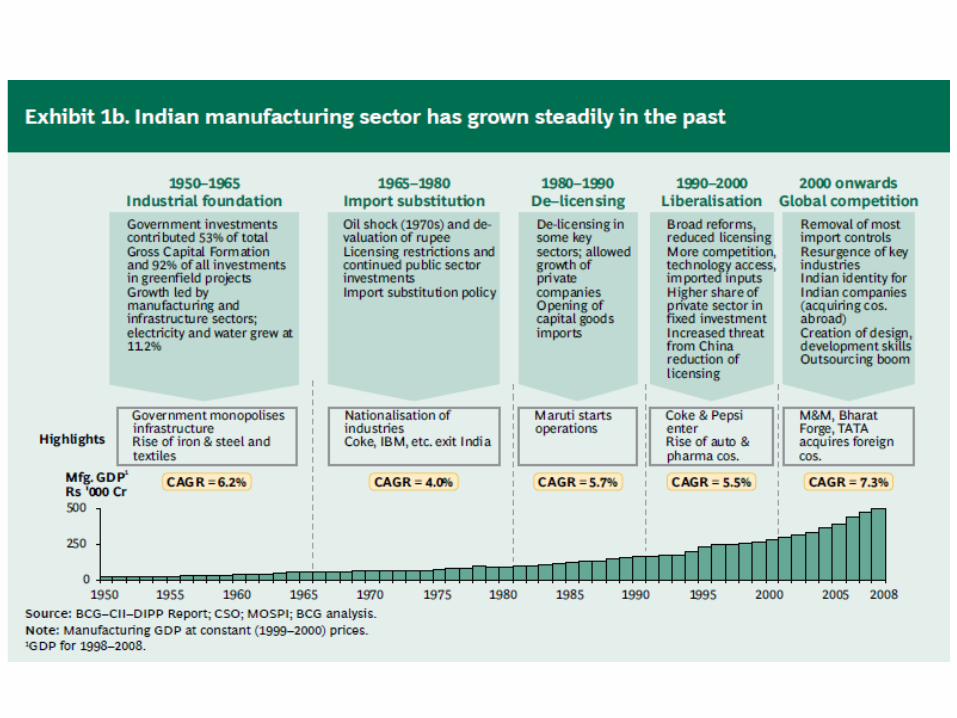
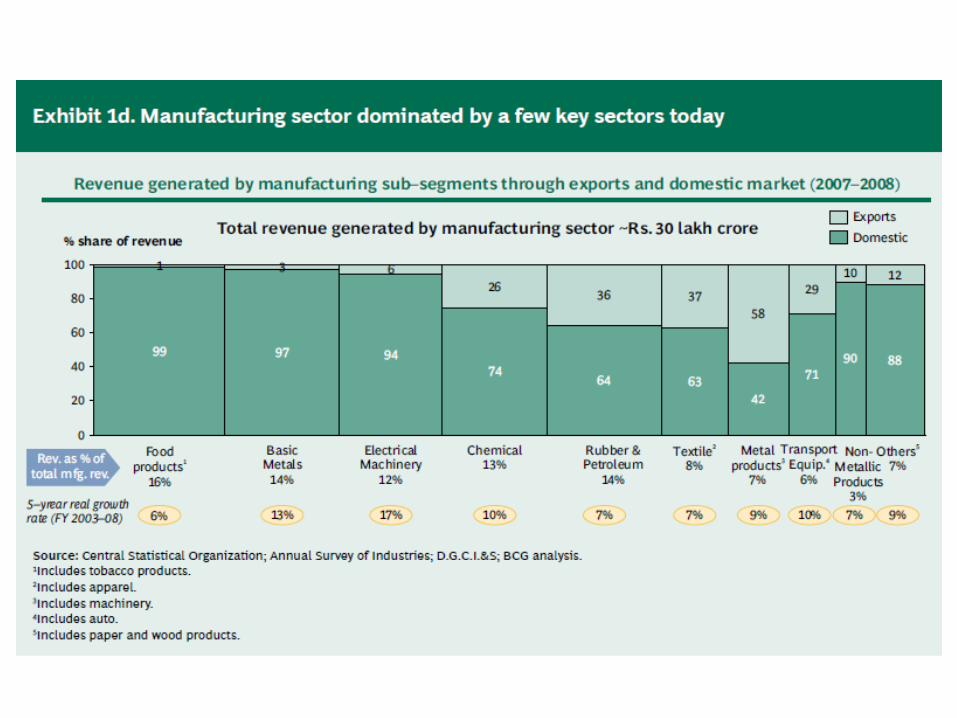
India’s Manufacturing Sector
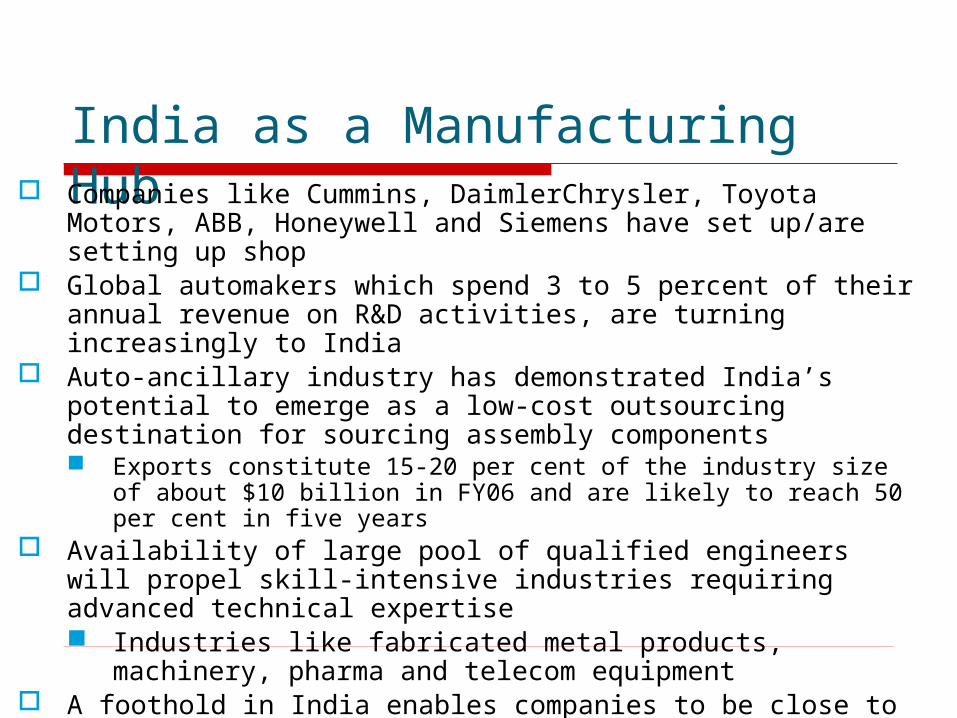
India as a Manufacturing Hub Companies like Cummins, DaimlerChrysler, Toyota Motors, ABB,
Honeywell and Siemens have set up/are setting up shop Global automakers which spend 3 to 5 percent of their annual
revenue on R&D activities, are turning increasingly to India Auto-ancillary industry has demonstrated India’s potential to
emerge as a low-cost outsourcing destination for sourcing assembly components Exports constitute 15-20 per cent of the industry size of about $10
billion in FY06 and are likely to reach 50 per cent in five years Availability of large pool of qualified engineers will propel skill-
intensive industries requiring advanced technical expertise Industries like fabricated metal products, machinery,
pharma and telecom equipment A foothold in India enables companies to be close to consumers
so as to identify the pulse of the market and respond rapidly
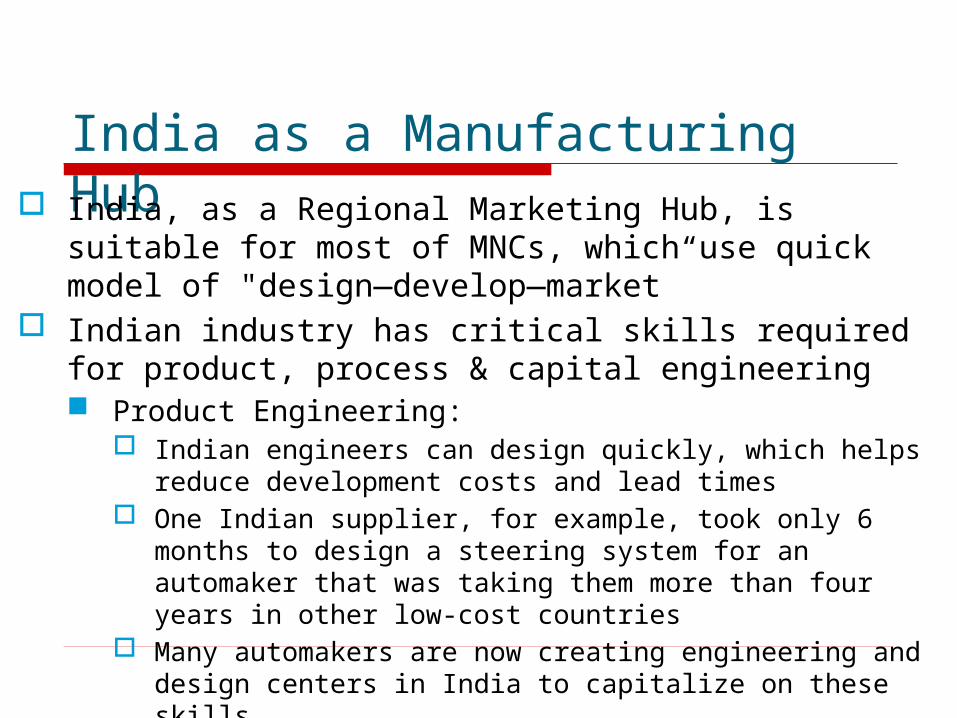
India as a Manufacturing Hub India, as a Regional Marketing Hub, is suitable for
most of MNCs, which use quick model of "design—develop—market”
Indian industry has critical skills required for product, process & capital engineering Product Engineering:
Indian engineers can design quickly, which helps reduce development costs and lead times
One Indian supplier, for example, took only 6 months to design a steering system for an automaker that was taking them more than four years in other low-cost countries
Many automakers are now creating engineering and design centers in India to capitalize on these skills

India as a Manufacturing Hub
Process Engineering: Redesign of manufacturing processes to make
them more labor intensive and less capital intensive enabling overall cost reduction
“De-automating” the production processes used in Western factories can cut overall manufacturing cost by 20%
Capital Engineering India’s advanced tooling and machinery industry
makes it possible to produce capital equipment locally
India is also now at par with global standards, as far as communication infrastructure is concerned

Frugal Engineering A philosophy that implies a “clean sheet”
approach to product design. Not about cutting features from existing
products but designing from scratch to meet needs of emerging markets
In India, customers are hard pressed for funds and look for products at lower costs, but do not compromise on product quality, functioning, comfort and environment friendliness.
Examples: Tata Nano GE’s $1000 ECG Machine Nokia 1100 mobile handset
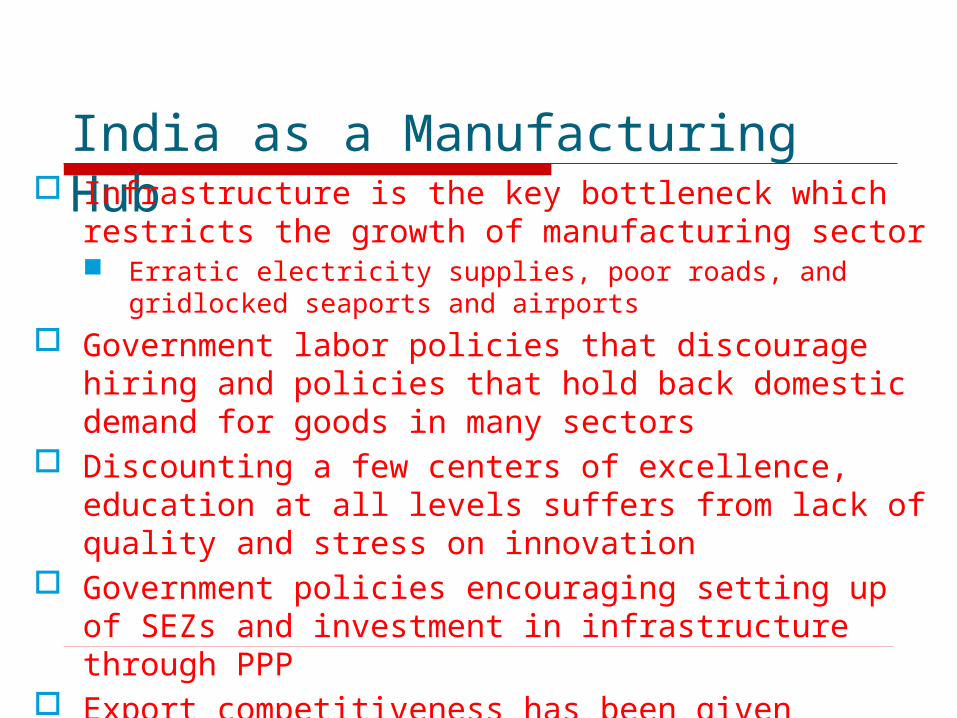
India as a Manufacturing Hub Infrastructure is the key bottleneck which restricts
the growth of manufacturing sector Erratic electricity supplies, poor roads, and gridlocked
seaports and airports Government labor policies that discourage hiring
and policies that hold back domestic demand for goods in many sectors
Discounting a few centers of excellence, education at all levels suffers from lack of quality and stress on innovation
Government policies encouraging setting up of SEZs and investment in infrastructure through PPP
Export competitiveness has been given priority

Sourcing Components: Toyota
Toyota was the first auto maker to recognize India as a source of components
Invested $ 200 million in JVs to help local suppliers scale in their manufacturing operations
Focused on localizing content for Qualis and Corolla models
Turned India into a regional sourcing hub through economies of scale in manufacturing
Also invested significant amounts in offering training and processes to bring Indian suppliers up to its global standards
INDIA’S BOOMING MIDDLE CLASS
Who are they? According to the National Council of Applied
Economic Research, the term "middle class" applies to those earning between $4,000 and $21,000 a year ($20,000-$120,000 in purchasing power parity terms).
But this definition suits only about 60m (under 6 per cent) of the population. Nevertheless, there seems to be an underlying intuition about the "middle class-ness" of those moving up from $5 a day to $10
People who employ household help are middle class?
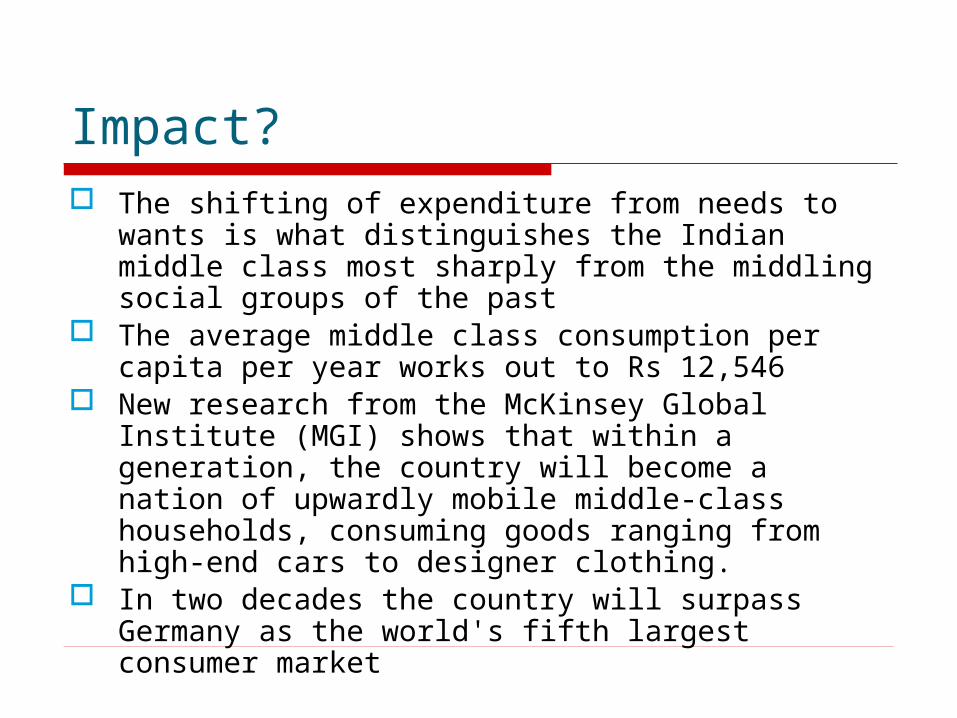
Impact? The shifting of expenditure from needs to wants is
what distinguishes the Indian middle class most sharply from the middling social groups of the past
The average middle class consumption per capita per year works out to Rs 12,546
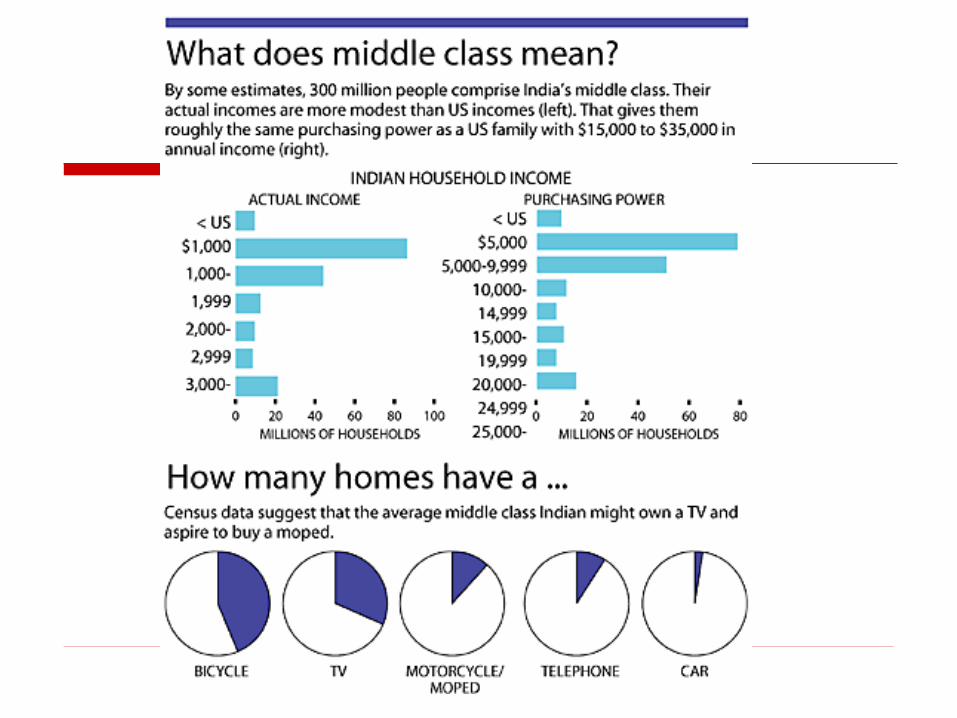
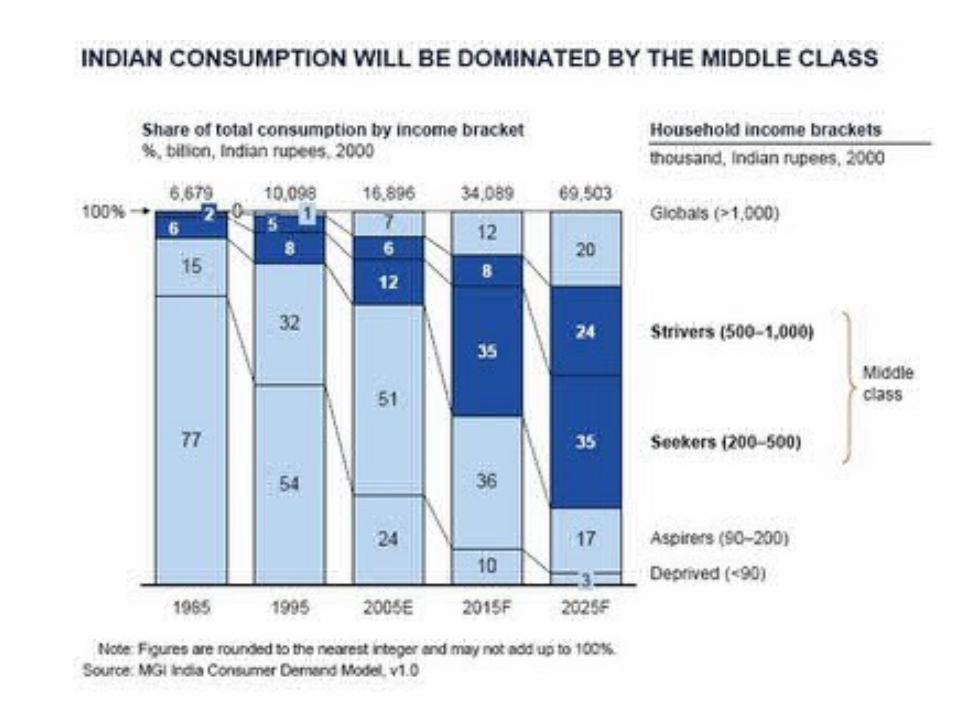
New research from the McKinsey Global Institute (MGI) shows that within a generation, the country will become a nation of upwardly mobile middle-class households, consuming goods ranging from high-end cars to designer clothing.
In two decades the country will surpass Germany as the world's fifth largest consumer market


Value-conscious consumers Before India embarked on its program of economic
reforms, the country had only 0.8 fixed telephones per 100 people, and virtually no mobile phones.
Now, mobile phone subscribers are expected to reach 211 million by end-2008.
India's mobile market is currently growing even faster than China's, and overall communications spending will grow at a very rapid 13.4 percent per year over the next two decades.
Other fast-growing categories will include transport, education and health care.
But India’s mobile telephony costs are among the lowest in the world (and companies still make profits!)
How the Indian Consumer Really Behaves?
https://www.youtube.com/watch?v=vJaHbUru7Ok
Urbanization and India Urban India accounts for about 30 per cent of the
total population (about 300 million) and its share is expected to rise to about 40 per cent by 2030.
By 2015, about $90 billion needs to be invested in urban infrastructure excluding metro railway projects. But what would be available, on the basis of 2004 figures and projections, is only $10 billion.
In 2007, the housing shortage was about 24 million units and it is expected to touch 26 million by 2012.
About 99 per cent of this deficit pertains to lower income groups.
93

Growth of Middle India Much of the consumption and income growth is not in
the metros, its in the Tier II and Tier III cities 51 districts in India have at least one town with a
population of more than 500,000. Together, they have twice the market potential of the four metros (Mumbai, Delhi, Chennai and Kolkata) combined. (RK Swamy BBDO)
Towns such as Chandigarh, Ahmedabad, Jaipur, Lucknow, Indore and Pune have three-quarters or more of the affluence levels of Mumbai. On growth potential they do even better. That small-town urban India is attractive in terms of purchasing power, time spent on media, and product consumption comes across clearly.
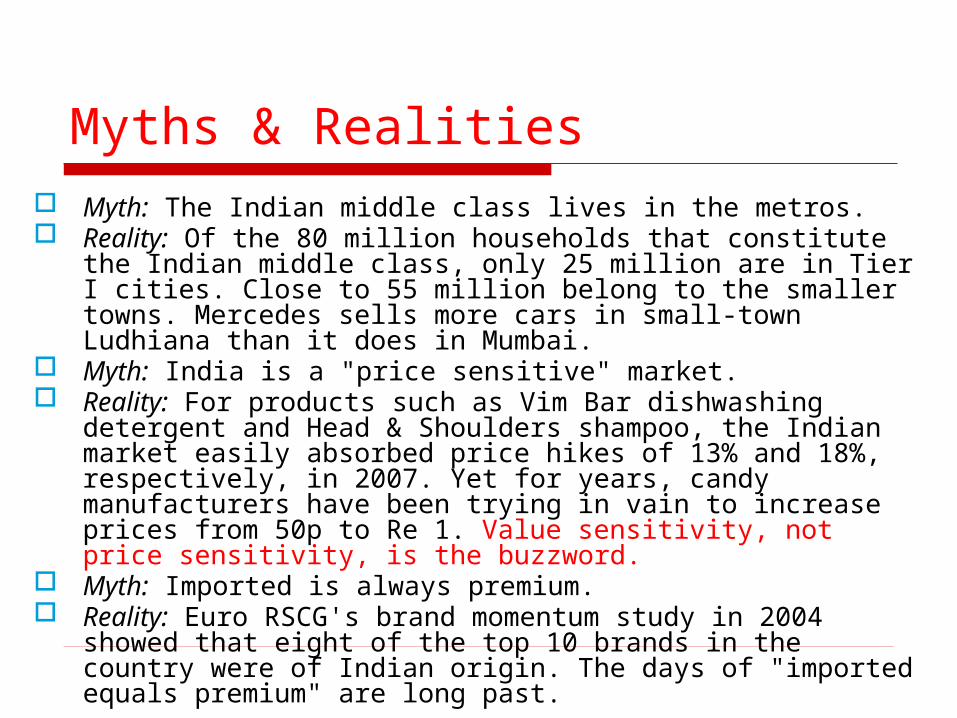
Myths & Realities Myth: The Indian middle class lives in the metros. Reality: Of the 80 million households that constitute the Indian
middle class, only 25 million are in Tier I cities. Close to 55 million belong to the smaller towns. Mercedes sells more cars in small-town Ludhiana than it does in Mumbai.
Myth: India is a "price sensitive" market. Reality: For products such as Vim Bar dishwashing detergent
and Head & Shoulders shampoo, the Indian market easily absorbed price hikes of 13% and 18%, respectively, in 2007. Yet for years, candy manufacturers have been trying in vain to increase prices from 50p to Re 1. Value sensitivity, not price sensitivity, is the buzzword.
Myth: Imported is always premium. Reality: Euro RSCG's brand momentum study in 2004 showed
that eight of the top 10 brands in the country were of Indian origin. The days of "imported equals premium" are long past.
Entrepreneurial Indian middle class also marked by
entrepreneurial spirit — focused in thought, global in outlook, proactive in approach, and meticulous in execution – Rishikesha T. Krishnan, IIMB Professor
Represented by companies such as Infosys and Bharti Airtel
All have been global in outlook in terms of adopting global standards, the best technology and operating on global scales
Examples of middle class to billionaires

A Mega Market Online? Between now and 2015, internet users in India
will more than triple to 350 million, according to a recent study by McKinsey & Co. This will make India’s online population larger than the entire current population of the United States.
As a result, get ready for the tipping points that are set to change the way businesses interact with consumers and clients. So be wise: look at where the trends are pointing, and position yourself and your business ahead of the curve.
India’s online trends are relevant on a global scale, too: of the world’s 1.14 billion internet users, 100 million are Indian.
Trends Changing the Face of Technology Penetration in India 1. Smartphones. India’s mobile growth is
already impressive, but in addition to voice and SMS, increased smartphone penetration will allow an entire generation of Indians to access the Web on their handsets without needing a computer. Today only 8% of Indian households have access to a PC. However, by 2015, the mobile phone is expected to help unlock internet access, with more than half of the anticipated 350 million internet users accessing the internet from their mobile phones.
2. Mobile Commerce. Today, in India people primarily research the features, benefits and prices of products and services online and then buy offline. This is why popular eCommerce portals, such as those in the retail and travel sectors, in India have offline delivery and payment options. But online purchases on mobile phone are making strides: 38% of mobile internet users say they have used their phones to shop online.
3. The power of women. Today, Indian women make up only 20-30% of the online population, Asia’s lowest percentage. (Thailand has the highest, with 72.5% women users). Although with more than 25.45 million users India is the world’s fifth biggest Facebook nation, only 29% of them are female, according to data provided by comScore, a company that focuses on digital market intelligence. But this figure is likely to increase in coming years: If other Asian markets are any indication, over time the percentage of women online should come closer to 50%.

4. Cloud computing. Cloud computing services are already more popular than they are in many other parts of the world, with 88% of respondents to one survey conducted by KPMG saying they use cloud services for applications such as emails, sharing photos and videos. As broadband penetration increases, cloud service use will also grow. Half of India’s internet users now watch videos online. The potential of online video in India was made obvious during the cricket World Cup: Although in January 2011 Indians watched 3.4 million online videos, views sky-rocketed to 37 million in March.
5. Social media. This is destined to keep growing – in India as elsewhere. Social media and micro-blogging services such as Twitter will become increasingly important sources of feedback about products, policies, and people – with users more likely to voice their opinions, especially when they’re negative.
The Formal Corporate Sector

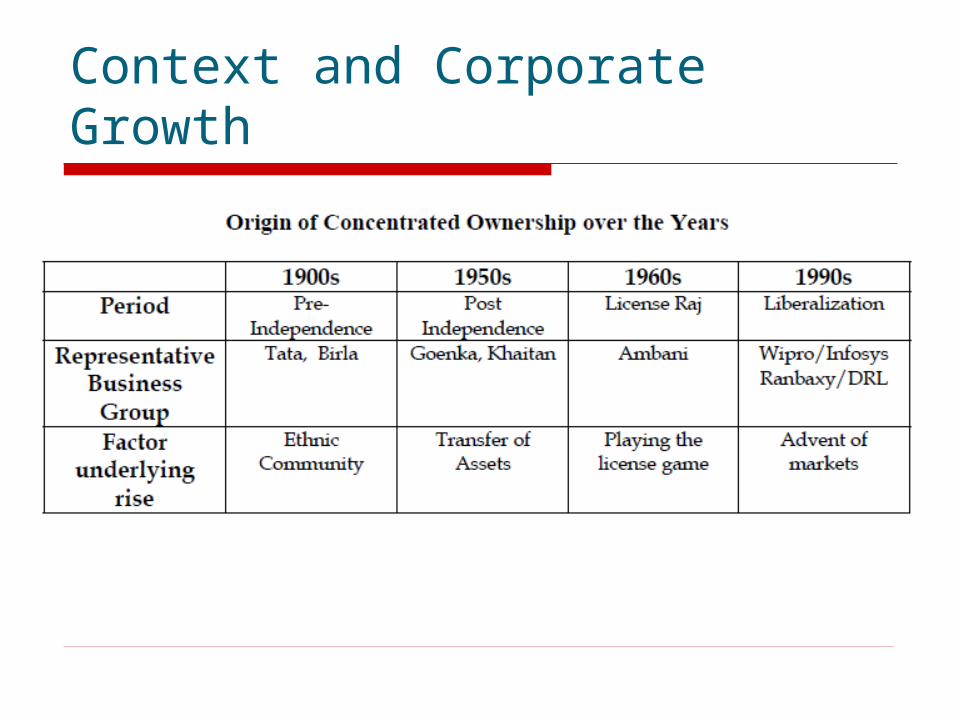
Indian Entrepreneurship Before Independence…1800s
Opium Trade with China--Jamsetji Jeejeebhoy, etc
Inter-War PeriodHeavy Industry
Tatas, Birlas, Dalmias, Walchand, Singhanias Maharaja of Mysore—Steel (Vishweshwarayya)
Textile Mill Magnates
Indian Business Houses in Pre-liberalization Era
Expansion & consolidation (in spite of constraints of industrial policy) expansion of industrial base Acquisition of British business houses in India Growth in 1914-47 due to British focus on World Wars; Great
Depression Strategic use of industrial licensing system
Corner licenses to prevent competition Expand into unrelated lines just because license is obtained Compete easily in political markets of corridors of power Precious little innovation
Dependent on State Funds Industrialists often owned small % of shares; LIC, etc. rest
Global expansion by far-sighted houses (e.g. Aditya Birla) Third generation splits weakened many houses
External pressures on joint-family Availability of funding from FIs and banks
Context and Corporate Growth
Indian Business Houses in Pre-liberalization Era
Weak on technology, qualityControl remained with family
members, though family members better educated over time
Forward-looking houses high on professionalization
Business became more respectable, but few could attain the status of pre-independence business leaders!
Impact of liberalization on Business
Liberalization => competition => technical change. But Indian business also now more ambitious & efficient (better K/output)
Existing business houses invest in new product lines, more focused Tatas sell TOMCO to HLL; SRF sells finance arm, buys core biz
Some efforts at tech development; more R&D (esp. Pharma) Import of technology Nicholas Piramal buys entire R&D lab of Hoechst Entry of multinationals challenges Indian cos. Lots of JV, M&A, acquisition of Indian firms (Parle)
New class of entrepreneurs Educated, informed, ambitious, progressive; not old money
IT Success No products; efficient processes; leverage educated raw
material & labour cost arbitrage; untouched by government

Now, the Indian Multinational? LN Mittal: does his empire qualify? Bharat Forge, Moser Baer, Wipro, Tata Steel,
Aditya Birla, all buying companies abroad Aditya Birla group expanded overseas since license-
permit raj days, to avoid dealing with Indian government restrictions on growth
ONGC Videsh: a PSU in international markets The Entrepreneurial Success of the Indian
Diaspora and its demonstration effect

The Other India
The Informal Sector As per 2005 Sample Survey on Employment and
Unemployment (NSS) 93 percent of India’s total labor force, and 82 percent of its non-agricultural labor force is informally employed.
Informal workers produce legal goods and services, but engage in operations that are not registered or regulated by fiscal, labor, health, and tax laws.
They construct buildings, clean homes, sew clothes, and weld car parts.
Produces about 60%of India’s GDP [Kabra 2003]. Despite their contributions, informal workers in India and
elsewhere live in dire poverty and insecurity.

India’s Informal Sector Low level of organisation; small in scale usually employing
< ten workers and often from the immediate family; Heterogeneity in activities; Easier entry and exit than in formal sector; Usually minimal capital investment; little or no division
between labour and capital; informal capital sources Mostly labour intensive work, requiring low-level skills;
usually no formal training as workers learn on the job; Labour relations based on casual employment and or
social relationships as opposed to formal contracts; Due to their isolation and invisibility, workers in the
informal sector are often largely unaware of their rights, cannot organise them and have little negotiating power with their employers and intermediaries (ILO 2000).
Informal Sector’s Changed Labour Movement Strategies
First, because informal workers are not coming together on a shop floor every day, they organize around the neighborhood.
Second, because they have no legal right to make demands on their employers, they are using their power as voters to make demands on the state.
Finally, since the target of their demands has changed, the nature of their demands has changed from traditional work benefits – minimum wages and job security – to welfare benefits – education scholarships, houses, and health clinics.
These strategic changes enable Indian informal workers to bypass their employer, avoid disrupting production, and protect their fragile incomes.
To operationalize their movements, informal workers are launching tripartite organizations, known as “welfare boards.”

In December 2008, the Indian parliament passed the Unorganized Sector Workers’ Social Security Bill to cover informal workers’ life, disability, health, and old age insurance.
The largest program under this Act, The Rashtriya Swasthya Bima Yojana (RSBY) or “National Health Insurance Program” provides 750 dollars to informal workers’ families to cover medical expenses at participating hospitals.
Social Regulation of Indian Economy Gender Caste Religion Classes:
Labour: in dependent alliance with caste patrons Capital: rise of Intermediate Class; dominate non-metros
State Regulation: doesn’t go below surface Huge untaxed, unregulated, externality-driven economy Tremendous corruption at implementation level
Reforms create more opportunity for market exploitation of rents and labour Conversion of black money to white

END
https://www.youtube.com/watch?v=PAYG0-PdXZE