the incidence and costs of inpatient falls in hospitals · 2 | the incidence and costs of inpatient...
TRANSCRIPT

The incidence and costs of inpatient falls in hospitals July 2017

Delivering better healthcare by inspiring
and supporting everyone we work with,
and challenging ourselves and others to
help improve outcomes for all.

1 | The incidence and costs of inpatient falls in hospitals > Contents
Contents
Foreword ........................................................................................ 2
1. The incidence of inpatient falls ................................................... 4
2. The estimated costs of inpatient falls ......................................... 8
3. The potential savings from reducing falls ................................. 17
4. Bibliography ............................................................................. 20
For more background information and details of working assumptions see the annexes in the accompanying resource. We are working hard to improve our presentation of information. How did you find this report? We’d value your comments. Please send to mailto: [email protected]

2 | The incidence and costs of inpatient falls in hospitals
Foreword
A fall in hospital can be devastating. The human cost of falling includes distress,
pain, injury, loss of confidence, loss of independence and increased morbidity and
mortality. Falling also affects the family members and carers of people who fall, and
has an impact on quality of life, health and social care costs.
Falls represent significant cost to trusts and the wider healthcare system, with
annual total costs to the NHS alone from falls among older people estimated by the
National Institute for Health and Care Excellence (NICE) in 2015 at £2.3 billion.
We know that work is well underway across hospitals to prevent serious harm to
those who fall. We want to ensure they have the information, tools and
understanding to improve reporting and care. In 2016, as part of our work to
support providers to deliver the safest and best quality care to patients, we
reviewed the national and international evidence on falls prevention. We went on to
invite acute, community and mental health trusts to join a falls improvement
collaborative. Some trusts were performing well but wanted to continue that: others
were at the beginning of their journey to achieve best practice.
Nineteen trusts took part in this collaborative which aimed to achieve a 5%
reduction in falls rates, calculated by reported falls adjusted for under-reporting,
comparing whole-year 2017/18 data with a baseline of 2016/17. In keeping with
research evidence we are also encouraging the falls work away from a mainly
nursing or patient safety issue towards a multiprofessional focus. Our aim is to
support participants representing all professional groups to achieve best practice by
focusing on practice areas that would potentially have greatest impact to improve
care for this vulnerable group of patients.
Before the launch of the collaborative in January 2017, we commissioned an
economic review to describe the scale of the problem in financial terms and provide
a model to scope potential financial savings if, by implementing best practice
(Fallsafe Royal College of Physicians1), reductions in falls incidence and associated
harms could be realised. The review aimed to help answer the following questions:
1 www.health.org.uk/programmes/closing-gap-through-clinical-communities/projects/fallsafe-project

3 | The incidence and costs of inpatient falls in hospitals
• What is the incidence of inpatient falls in hospital in England?
• What are the estimated costs hospitals incur as a result of inpatient falls?
• What are the potential cost savings from reducing falls by implementing
well-evidenced multidisciplinary interventions?
• What are the potential savings to hospitals from taking these actions?
We understand from the National audit of inpatient falls 20152 that there is variance
in the way that falls prevention is delivered across providers. Our work sets out to:
• improve assessment, interventions and care
• improve the quality of reporting
• bring together and share exemplar initiatives and innovations to inspire
collaborative improvement.
Ruth May
Executive Director of Nursing
2 National audit of inpatient falls 2015, Royal College of Physicians. Available at:
www.rcplondon.ac.uk/projects/outputs/naif-audit-report-2015

4 | The incidence and costs of inpatient falls in hospitals
1. The incidence of inpatient falls
In 2015/16, as in previous years, falls were the most commonly reported type of
incident in acute and community hospitals and the third most commonly reported
type of incident in mental health hospitals (see Annex 2 Falls breakdown in
2015/16), in the patient safety incidents reported to the National Reporting and
Learning System (NRLS).3
Based on data submitted to the NRLS, around 250,000 falls were reported in
2015/16 across these three hospital settings (see Figure 1 below).4
Figure 1: Breakdown of total reported inpatient falls 2015/16
Source: National Reporting and Learning System 2015/16
3 The NRLS) is a national reporting system that enables providers to report patient safety incident
reports to a national database. Its main purpose is to enable learning from patient safety incidents in the NHS. It was established as a voluntary scheme and therefore does not provide a definitive number of patient safety incidents in the NHS. This report uses safety thermometer data where there is no NRLS data. 4 The volume of inpatients (admission without day cases) in acute is 7.4 million compared with
110,000 in mental health and 32,000 in community hospitals in 2015/16. (HES)

5 | The incidence and costs of inpatient falls in hospitals
Differences in case mix, to some extent, drive a large proportion of the variation in
reported falls rates by setting (see Figure 2). A much greater proportion of
inpatients in community hospitals is older (ie over 65) than in acute and therefore
more likely to fall (see Annex 3: Falls by severity, age and hospital setting). 5
Figure 2: Estimated reported fall rates per 100 patients and 1000 bed days
2015/166 7
Older inpatients also tend to stay longer in these settings than in acute hospitals
(particularly in mental health) and this increases the likelihood of each patient falling
several times.8 Further, patients with mental health problems are typically more
vulnerable to increased risks of falling due to treatments and/or medications in
addition to multiple medical co-morbidities.
This analysis does not present variations in reported falls rates at the trust level as
this could be misleading because of:
5 The percentage of inpatients over 65 in 2015/16 is 42% in an acute setting, 33% in a mental health
setting and 60% in a community setting. (HES) 6 The number of falls is from the NRLS, the number of patients is from Hospital Episode Statistics
(HES) and the number of occupied bed days is from NHS England Unify2 data.
Falls per 100 patient = Falls per 1000 bed day fall = 7 Both the RCP and NPSA rates are estimates – they might not be comparable to our calculations
due to differences in the datasets as not every trust is involved in their calculation. The rates are also based only on ‘reported falls’. Differences in the level of reporting practices mean comparing rates over different time periods may not be consistent. 8 The average length of stay among the over-65 age group in an acute setting is 3.8 days, 20 in a
community setting and 56 in a mental health setting (HES).

6 | The incidence and costs of inpatient falls in hospitals
• potential under-reporting in trusts – the degree of which will vary by trust
and potentially across time
• differences in patient case mix which means that patients’ risk of falling may
vary significantly.
The NRLS requires reporters to assign one of five degrees of severity of harm: no,
low, moderate, severe and death. A report by the National Patient Safety Agency
(NPSA) in 2007 applied falls definitions to these categories (see Table 1):
• no harm: where no harm came to the patient, eg no visible bruising
• low harm: required first aid, minor treatment, extra observation or
medication, eg graze on right hand
• moderate harm: likely to require outpatient treatment, admission to hospital,
surgery or a longer stay in hospital, eg fractured pubic rami
• severe harm: where permanent harm, such as brain damage or disability,
was likely to result from the fall, eg fractured neck of femur
• death: where death was the direct result of the fall.9
Table 1: Breakdown of reported falls within age groups by severity 2015/16
(all hospital settings in England)
Note: Unclassified values when splitting the number of falls by age account for around 12%
of all reported falls. We have allocated the missing values into age groups based on the
current observed split for age classified falls.
Looking at the rate of reported falls by severity across two broad age groups
(patients over and under 65 years old), 77% of all reported inpatient falls happen to
patients over 65 and they are more likely to be harmed. Interestingly, the over-65
9 Death as a reported outcome of a fall is likely to be underestimated in incident reports because it is
rarely reported at the time of a fall. However, injuries resulting in severe harm such as hip fracture or subdural haematoma may result in increased mortality. Not all reports will be updated to reflect this outcome (partly because there may be other contributing factors). As with the total number of reported falls, the number of deaths as a result of a fall is likely to represent an ‘at least state’.

7 | The incidence and costs of inpatient falls in hospitals
age group represents only 40% of total admissions according to Hospital Episode
Statistics.
Not only are reported falls among older patients more likely to result in some
degree of harm, where harm does result, it is three times more likely to be severe.
Older patients are also likely to be relatively frailer before the fall and therefore
more likely to sustain more serious harm as a direct result of the fall.
Reported falls among older patents in acute settings were more likely to result in
either moderate or severe harm than falls in either mental health or community
hospitals (see Annex 3: Falls by severity, age and hospital setting).

8 | The incidence and costs of inpatient falls in hospitals
2. The estimated costs of inpatient falls
Falls have a number of direct and indirect impacts on patients and hospitals (see
Figure 3 below).
Figure 3: Direct and indirect impacts of inpatient falls
Both the likelihood and scale of these impacts will vary according to the age of the
patient and the severity of the fall.
There may be non-physical impacts – particularly if people are older – irrespective
of whether or not the falls resulted in a physical injury. These may include loss of
confidence, isolation, and greater reliance on long-term social care.
In some cases, the impact of inpatient falls may also extend beyond hospital
settings (ie after discharge needs for rehabilitation in the community) and result in
costs to the wider health and social care system.

9 | The incidence and costs of inpatient falls in hospitals
Quantifying impacts
We drew on publicly available evidence to inform our working assumptions on the
impact of falls on hospital resources (see Table 2).
Table 2: Key assumptions in our qualification of costs
See Annexes 4-7 for further details on these working assumptions.
Based on these assumptions, we calculated the average cost of a fall at £2,600
(see Table 3 and Figure 4 for average costs of falls by age group and reported
severity of harm).

10 | The incidence and costs of inpatient falls in hospitals
Table 3: Average estimates of the cost per fall by age
Figure 4: Breakdown of all costs per fall by reported severity and age
This implies a total yearly combined cost to hospitals of reported inpatient falls of
around £630 million (see Table 4 below for a breakdown by hospital sector).

11 | The incidence and costs of inpatient falls in hospitals
Table 4: Total estimated costs of reported inpatient falls by hospital setting10
Falls among older groups account for approximately 77% of total reported falls but
around 87% of total costs.
This represents around 25% of the estimated £2.3 billion total system cost of falls
(both inside and outside hospitals) by NICE (2015).These costs are indicative. They
should not be used for local decision-making without taking into account the local
length of stay impacts of falls that will drive the estimated cost.
However, using these estimates, we estimated the indicative cost at acute
hospitals, mental health hospitals and community hospitals, based on the annual
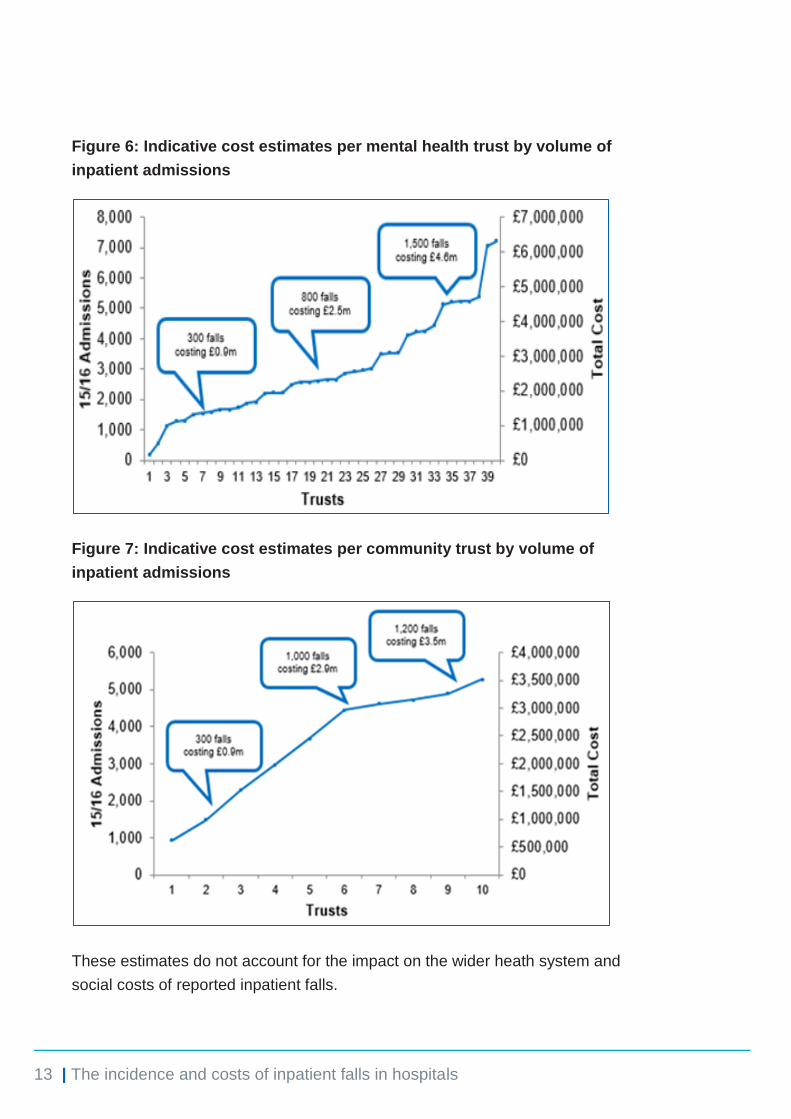
volume of admissions. See Figures 5, 6 and 7 below.
10
The NHS Litigation Authority (NHSLA) commented: ‘The figures for clinical claims and non-clinical falls are highly likely to be unreliable due to the way these claims are recorded.’ This means that they may include staff as well as patient litigation costs.

12 | The incidence and costs of inpatient falls in hospitals
Figure 5: Indicative cost estimates per acute trust by volume of inpatient
admissions11
Note: Using the estimated falls rate per 1,000 bed days, a provider with 800 beds
will have approximately 1,500 falls at a cost of £3.9 million. This is different from the
£92,000 NPSA estimate in 2007 because of impacts costed, inflation and
differences in assumptions about the fall rate.
11
Number of trusts based on HES admissions for 2015/16 – this excludes specialist trusts and trusts with a null admission value.
13 | The incidence and costs of inpatient falls in hospitals
Figure 6: Indicative cost estimates per mental health trust by volume of
inpatient admissions
Figure 7: Indicative cost estimates per community trust by volume of
inpatient admissions
These estimates do not account for the impact on the wider heath system and
social costs of reported inpatient falls.

14 | The incidence and costs of inpatient falls in hospitals
These will include impacts on, for example:
• out-of-hospital rehabilitation services:
– some patients need to access rehabilitation services in the community
(for example physiotherapy) once discharged from hospital to fully
recover from the fall
– for working-age patients, the rehabilitation process may result in loss of
productivity and/or earnings which may put pressure on services that are
already facing significant increases in demand
• the need for care/nursing home:
– older patients who fall in hospital are more likely to need care and be
discharged into social/nursing care homes
– in some cases, family and friends will provide ongoing care needs, which
may represent productivity losses and/or loss in earnings for them
• the risk of further falls in the community:
– the loss of confidence, particularly among older patients, that falls may
result in, may place some patients at a much greater risk of further falls
both inside and outside hospital. This may increase the risk of
readmission to hospital and/or the demand on other services to deal/treat
repeat falls in the community, eg the impact on GPs, emergency
services, emergency and minor injury departments and other
falls/fracture/frailty liaison services
• mental health:
– the loss of confidence and increased isolation for some patients after an
inpatient fall (regardless of how severe), as well as other psychological
impacts which may increase the demand for GP services, as well as
mental health services, and in the medium to longer term increase the
demand for social care services.
There has been little work to estimate these wider costs of inpatient falls – probably
because of data limitations and challenges in distinguishing which ongoing care
needs are directly attributable to a hospital fall. However, given the likely scale of
these costs further research in this area would be valuable.

15 | The incidence and costs of inpatient falls in hospitals
Length of stay sensitivity analysis
Our assumptions about extra days in hospital as a result of reported falls with no or
low harm are the most uncertain and this affects our estimates as these falls
account for a large majority of total falls and 88% of our total costs.
We based our figure on the average of two studies: Vass and Morello. Vass is
based on a small sample in a single UK trust from 2009-11 and Morello is based on
a sample of six hospitals in Australia from 2011-13 (which might not be
comparable). This gives us 8.2 days for no harm and 9 days for low harm.
To reflect this uncertainty we looked at two scenarios (see Table 5) based on 50%
and 25% reductions in the current length of stay assumptions. Based on these
assumptions, the estimate of total cost is reduced to between £354 million (44%
lower than our central estimate) and £494 million (22% lower than our central
estimate). Table 6 provides a breakdown of these estimates by hospital setting.
Table 5: Sensitivity of no and low harm cost per fall to length of stay
assumptions

16 | The incidence and costs of inpatient falls in hospitals
Table 6: Sensitivity of no and low harm overall cost to length of stay
assumptions
Given the limited evidence on the impact of falls with little or no harm on increasing
the length of stay in hospital, future research should focus on building this evidence
base.

17 | The incidence and costs of inpatient falls in hospitals
3. The potential savings from reducing falls
There is evidence (for example the FallSafe project) that assessments and
interventions that take into account a range of factors to identify and treat
underlying reasons for falls in hospitals could reduce the incidence by 25-30%.
Based on our estimates of the costs of falls, reduction on this scale could mean
around 57,000 fewer falls per year and reduce the annual cost of falls by up to 25%
(see Table 7 for a breakdown of these potential savings across settings).
In practice, trusts vary a great deal in how they report falls, which means that some
will have more scope than others to reduce the number of falls (even if the
conditions set out in Figure 8 are met). Some trusts, for example, will already have
successful processes and policies for reducing falls and low reported rates of falls
as a result (given their patient and length of stay profile). For these trusts, the scope
for further reductions may be much lower than for trusts that currently perform
poorly on this measure and have a lot of scope for reducing falls.
Other points to take into account:
• the evidence on falls reduction is largely focused in older patient groups so
we have limited reductions to falls across the >65 age group
• we have applied the same 25-30% reduction across all levels of reported
severity and assumed that all trusts can reduce falls by this rate. We
recognize that this is a simplifying assumption and that in practice (as we
have highlighted above), we know that trusts will have very different starting
points and so the potential scale of reduction would vary a lot across
individual trusts.
• if trusts target efforts at reducing the most severe types of falls (rather than
all falls), this saving could be significantly higher.
Despite the evidence of potential for significant reduction in falls, these practices
are not being applied systematically across hospital trusts.

18 | The incidence and costs of inpatient falls in hospitals
Designing and implementing practices of the kind covered by the FallSafe project
across individual providers is not, however, without challenge and ensuring that
reductions are sustained in the longer term intensifies this challenge.
The evidence from successful and sustainable falls prevention programmes
suggests there are broadly five key factors in reducing the number of falls in
hospital (see Figure 8):
• board and ward level support: for example, appointing an executive lead of
the programme, establishing a multidisciplinary strategic falls group and
setting an ambitious but achievable target
• engaging frontline staff in design: to encourage their buy-in and also ensure
that implementation is feasible
• education and training: to ensure that all staff are appropriately aware of fall
risk factors
• good quality reporting data: for example, accurate and timely reporting of
hospital falls to identify the scale and nature of the problem and enable
accurate monitoring of progress, including adjustment for seasonal
variations
• culture change: ensuring that falls are perceived as a multidisciplinary issue
and prevention is shared responsibility.
Although trusts should be ambitious in setting targets to reducing avoidable falls,
reducing falls to zero will not be a realistic target for any hospital because:
• trusts will always have to make a challenging trade-off between
encouraging patient mobility/independence and minimising the risks of
patient falls
• in some cases, falls will be a necessary part of a patients’ rehabilitation
process
• the costs of trying to eliminate all risk is likely to be prohibitively high.

19 | The incidence and costs of inpatient falls in hospitals
Figure 8: Key success factors for successful implementation and sustainable
results
Table 7: Summary of potential savings from reducing the number of falls
Note: The savings are based on the total cost of falls of £634 million. The cost savings
here are the gross savings and do not include implementation and/or running costs.
20 | The incidence and costs of inpatient falls in hospitals
4. Bibliography
Age UK (2010) Stop Falling: Start saving Lives and Money.
Bates D, Pruess K, Souney P, et al. (1995) Serious falls in hospitalized patients:
correlates and resource utilization. American Journal of Medicine 99:137–43
Bradley C (2013) Trends in hospitalisations due to falls by older people, Australia
1999–00 to 2010–11. Injury research and statistics no. 84. Cat. no. INJCAT 160.
Canberra: Australian Institute of Health and Welfare
British Geriatrics Society (2007) Falls.
Chamberlain M, Pugh H (2015) Improving inpatient care with the introduction of a
hip fracture pathway. BMJ Quality Improvement Reports 2015.
The Chartered Society of Physiotherapy (2014) The cost of falls.
Department of Health (2009) Falls and fractures – effective interventions in health
and social care.
Department of Health (2009) Fracture prevention services: an economic evaluation.
Foundation of Nursing Studies (2001) Reducing Patient Falls in an Acute General
Hospital.
Haines T, Hill A, Hill K, Brauer S, Hoffmann T, Etherton-Beer C, McPhail S (2013)
Cost effectiveness of patient education for the prevention of falls in hospital:
economic evaluation from a randomized controlled trial. BMC Medicine 11.1 (2013):
n. pag. Web.
Healey F, Lowe D, Dariwski A, Windsor J, Treml J, Byrne L, Husk J, Phipps J
(2013) Falls prevention in hospitals and mental health units: an extended evaluation
of the FallSafe quality improvement project. Age Ageing. 2014 Jul;43(4):484-91.
Health Evidence Network (2004) What are the main risk factors for falls amongst
older people and what are the most effective interventions to prevent these falls?

21 | The incidence and costs of inpatient falls in hospitals
The Health Foundation (2011) The FallSafe project.
Hempel S, Newberry S, Wang Z, Shekelle P, Shanman R, Johnsen B, Perry T,
Saliba D, Ganz D (2012) Review of the Evidence on Falls Prevention in Hospitals:
Task 4 Final Report. Santa Monica, CA: RAND Corporation.
www.rand.org/pubs/working_papers/WR907
Leal J, Gray AM, Prieto-Alhambra D, Arden NK, Cooper C, Javaid MK, Judge A
(2015) Impact of hip fracture on hospital care costs: a population-based study.
Osteoporosis International 2016 Feb 27(2): 549-58
The King’s Fund (2013) Exploring the system-wide costs of falls in older people in
Torbay.
Lawrence T, White C, Wenn R, Moran C (2005) The current hospital costs of
treating hip fractures. Injury 36, pp88-91
Monash University (2009) Modelling the impact, costs and benefits of falls
prevention measures to support policy makers and program planners.
Morello, R (2012) In-hospital fall injuries: Where, when and how do they occur? 6-
pack falls prevention.
Morello R, Barker A, Watts J, Haines T, Zavarsek S, Hill K, Brand C, Sherrington C,
Wolfe R, Bohensky M, Stoelwinder J (2015) The extra resource burden of in-
hospital falls: a cost of falls study. Medical Journal of Australia 2015 Nov 2:
203(9):367
National Audit Office (2007) Maintaining good health for older people with dementia
who experience fractured neck of femur.
NHS Institute of Innovation and Improvement (2010) Staying safe − preventing falls.
National Institute for Health and Care Excellence (2013) Falls: Assessment and
prevention of falls in older people.
National Patient Safety Agency (2010) Slips, trips and falls in hospitals.
National Patient Safety Agency (2007) Slips, trips and falls in hospitals.

22 | The incidence and costs of inpatient falls in hospitals
Oliver D, Healey F, Haines T (2010) Preventing Falls and Fall-Related Injuries in
Hospitals. Clinics in geriatric medicine 26:4, pp645–692
Patient Safety First (2009) Reducing harm from falls.
Royal College of Physicians (2015) National Audit of Inpatient Falls.
Royal College of Physicians (2015) National hip fracture database annual report.
Royal College of Physicians (2014) National hip fracture database extended report.
Scuffham P, Chaplin S, Legood R (2003) Incidence and costs of unintentional falls
in older people in the United Kingdom. Journal of Epidemiology and Community
Health. 2003 Sep; 57(9): 740–744
Spetz J, Brown D, Aydin C (2015) The Economics of Preventing Hospital Falls. J
Nurs Adm. 2015 Jan;45(1):50-7.
Watson W (2011) Costing and cost-effectiveness in falls prevention. The University
of New South Wales, Falls Prevention Network Forum.
Vass C, Sahota O, Drummond A, Kendrick D, Grainge M, Sach T, Gladman J, Avis
M 2013. REFINE-REducing Falls in In-patieNt Elderly using Bed and Chair
Pressure Sensors in Acute Hospital Care: A Randomised Controlled Trial. Age and
Ageing 2013; 42: ii20–ii22
Watson B, Salmoni A, Zecevic A (2015) Falls in an acute care hospital as reported
in the adverse event management system. SCIEDU: Journal of Hospital
Administration (2015) 4: 4

© NHS Improvement July 2017 Publication code: IG 15/17
Contact us:
NHS Improvement
Wellington House
133-155 Waterloo Road
London
SE1 8UG
0300 123 2257
improvement.nhs.uk
Follow us on Twitter @NHSImprovement
This publication can be made available in a number of other formats on request.