the importance of choosing precipitation...
TRANSCRIPT

Received: 6 August 2017 Accepted: 10 October 2017
DO
I: 10.1002/hyp.11381R E S E A R CH AR T I C L E
The importance of choosing precipitation datasets
Micheal J. Simpson1 | Adam Hirsch2 | Kevin Grempler2 | Anthony Lupo2,3
1Water Resources Program, School of Natural
Resources, University of Missouri, 203‐TABNR Building, Columbia, MO 65211, USA
2Soil, Environmental, and Atmospheric Science
Department, School of Natural Resources,
University of Missouri, Columbia, MO 65211,
USA
3Department of Natural Resources
Management and Land Cadastre, Belgorod
State National Research University, Belgorod,
308015, Russia
Correspondence
Micheal J. Simpson, University of Missouri,
Water Resources Program, School of Natural
Resources, 203‐T ABNR Building, Columbia
65211, MO, USA.
Email: [email protected]
Funding information
National Science Foundation, Grant/Award
Number: IIA‐1355406
Hydrological Processes. 2017;1–13.
AbstractPrecipitation data are important for hydrometeorological analyses, yet there are many ways to
measure precipitation. The impact of station density analysed by the current study by comparing
measurements from the Missouri Mesonet available via theMissouri Climate Center and Commu-
nity Collaborative Rain, Hail, and Snow (CoCoRaHS) measurements archived at the program
website. The CoCoRaHS data utilize citizen scientists to report precipitation data providing for
much denser data resolution than available through the Mesonet. Although previous research
has shown the reliability of CoCoRaHS data, the results here demonstrate important differences
in details of the spatial and temporal distribution of annual precipitation across the state of
Missouri using the two data sets. Furthermore, differences in the warm and cold season
distributions are presented, some of which may be related to interannual variability such as that
associated with the El Niño and Southern Oscillation. The contradictory results from two
widely‐used datasets display the importance in properly choosing precipitation data that have
vastly differing temporal and spatial resolutions. With significantly different yearly aggregated
precipitation values, the authors stress caution in selecting 1 particular rainfall dataset as
conclusions drawn could be unrepresentative of the actual values. This issue may be remediated
by increased spatiotemporal coverage of precipitation data.
KEYWORDS
CoCoRaHS, Mesonet, precipitation, rain gauge, rainfall heterogeneity
1 | INTRODUCTION
Precipitation data are some of the most fundamental parameters
necessary for hydrometeorological analyses. In spite of this need, the
majority of data are, typically, recorded automatically via rain‐gauge
networks. The Community Collaborative Rain, Hail, and Snow
Network (CoCoRaHS) is one network that is maintained by thousands
of public volunteers (Cifelli et al., 2005; Kelsch, 1998; Moon, Guinan,
Snider, & Lupo, 2009; Reges & Doelsken, 2011; Reges et al., 2016).
Originating at Colorado State University as the result of the flash flood
of 1997 (Petersen et al., 1999; Weaver, Gruntfest, & Levy, 2000),
CoCoRaHS is a grassroots volunteer network of daily precipitation
observations within the United States, the Canadian Provinces, the
U.S. Virgin Islands, the Commonwealth of Puerto Rico, and the
Bahamas. Through implementation of low‐cost measurement tools,
volunteers of all ages and backgrounds collect precipitation data, often
daily, between 6 and 10 a.m. local time. Observations are uploaded to
the CoCoRaHS website (https://cocorahs.org) or through a variety of
apps, which are immediately available to the public.
wileyonlinelibrary.com/journa
To aid in the calibration and validation of National Aeronautics and
Space Administration's Soil Moisture Active/Passive satellite, volun-
teers are also able to take routine measurements of soil moisture and
report to the CoCoRaHS website via 0–2″ soil samples. Furthermore,
community efforts to collect and disseminate information regarding
soil moisture aids in the United States Department of Agriculture's
drought monitoring process via 7–9″ soil samples. Volunteers are also
capable of measuring evapotranspiration (ET) through a gauge
(ETgauge) that simulates crop reference ET. The ETgauge is a modified
evaporimeter (atmometer) such that crop albedo and vapour diffusion
resistance parameters (i.e., leaf properties) are simulated via a ceramic
evaporating cup covered with a green‐coloured canvas. Due to the
setup of the device, the ceramic evaporator at the top of the ETgauge
more closely simulates grass references ET (ETo).
In addition to being a community effort, many organizations utilize
the data that are generated from the CoCoRaHS network including,
but not limited to, the National Oceanic and Atmospheric
Administration and the National Hydrologic Warning Council.
Furthermore, several peer‐reviewed publications utilize the data
Copyright © 2017 John Wiley & Sons, Ltd.l/hyp 1

2 SIMPSON ET AL.
ranging from hydrologic analyses (e.g., Bunkers, Smith, Driscoll, &
Hoogestraat, 2015; Grant et al., 2013; Smith, Smith, Baeck, & Miller,
2015), atmospheric aerosol analyses (e.g., Fang & Yongmei, 2012;
Kelleners & Verma, 2012; Kelly et al., 2012), and verification of precip-
itation estimations from radar (e.g., Moon et al., 2009; Kluver et al.,
2016; Martinaitis et al., 2014; Smith et al., 2015; Wolfe & Snider,
2012; Zhang, Qi, Langston, Kaney, & Howard, 2014). Therefore, the
applications of the data generated from the CoCoRaHS network are
very broad and impactful in several different fields of science.
Utilizing citizens to collect precipitation data has several advan-
tages over traditional automatic electrical devices. For example, local
random errors (Ciach & Krajewski, 1999a; Habib, Krajewski, & Kruger,
2001; Kitchen & Blackall, 1992), effects of turbulence (Habib,
Krajewski, Nespor, & Kruger, 1999), and underperformance of gauges,
particularly during instances of convective precipitation (Ciach, 2002;
Ciach & Krajewski, 1999b) can result in errors of up to 20%
(Frankhauser, 1997) for automated instrumentation. Similarly, many
errors have been documented through the implementation of radar
to estimate precipitation (Berne & Krajewski, 2013), despite its
superior spatial and temporal coverage (Simpson, Hubbart, & Fox,
2016). These errors include degraded performance as the range from
the radar increases (Seo, Breidenbach, Fulton, Miller, & O'Bannon,
2000; Smith, Seo, Baeck, & Hudlow, 1996; Ryzhkov, Giangrande, &
Schurr, 2003), errors in estimating the drop size distribution (Bringi
et al., 2003; Zhang, Vivekanandan, & Brandes, 2001), and inaccurate
representations of precipitation shape (Beard & Chuang, 1987;
Gorgucci, Baldini, & Chandrasekar, 2006; Gorgucci, Scarchilli,
Chandrasekar, & Bringi, 2000).
In Missouri, the collection of CoCoRaHs data began in March
2012. Moon et al. (2009) detailed the establishment of CoCoRaHs
observations in the state, examining the distribution of CoCoRaHs
instruments during the first 4 years and then comparing the quality
of CoCoRaHS reports to the National Weather Service (NWS),
Cooperative Observer Program, and radar‐derived measurements
during the remnants of hurricanes Gustav and Ike (September 2008).
Moon et al. (2009) concluded that the CoCoRaHs observations were
consistent with NWS Cooperative Observer Program and radar‐
derived estimates of precipitation for these two events. Occasionally,
errant data are found, and the local NWS offices (and KY3 TV in
Springfield) are instrumental in helping the Missouri Climate Center
quality control the data.
One of the multiple advantages CoCoRaHS data provides over
automated rain gauges and radar is the quality control associated with
the data. For example, tipping buckets can become clogged, resulting
in erroneous collection of precipitation (Ciach, 2002), whereas radars
may suffer from erroneous rain rate calculations from radome wetting
(Kurri & Huuskonen, 2008) and bright‐band contamination (Cunha,
Smith, Baeck, & Krajewski, 2013; Kumjian, 2013; Ryzhkov et al.,
2003). Albeit, collection of data is once daily, resulting in a loss of
temporal resolution; CoCoRaHS has the benefit of daily inspection,
which allows for superior quality control of data. However, few reports
have detailed the findings from the CoCoRaHS network.
The overarching objective of the current study was to analyse the
performance of 10 years of CoCoRaHS data within the state of
Missouri, from 2007 to 2016. Due to the daily resolution of the data,
aggregation to yearly analyses were conducted to produce an under-
standing of the spatial heterogeneity of precipitation in the state of
Missouri. Additionally, data were separated into warm and cool
seasons to determine any seasonal impacts on precipitation trends.
Results will be compared with the Missouri Mesonet's tipping‐bucket
rain gauge network to determine accuracy and overall agreement.
Therefore, the current study will analyse the performance of a densely
populated gauge network operated by multiple individual citizens
compared to several automated tipping‐bucket rain gauges. Results
will further our understanding as to the reliability of the public for
documenting rainfall data in comparison to automated devices, which
are more sparsely located in terms of yearly and seasonal resolutions.
Furthermore, any differences between the two precipitation sources
would highlight the need for increased spatiotemporal precipitation
coverage, as these sources typically serve as ground truth for radar
quantitative precipitation estimate studies (e.g., Ryzhkov et al., 2003;
Simpson et al., 2016).
2 | DATA AND METHODOLOGY
2.1 | CoCoRaHS data
The CoCoRaHS data were retrieved from the domain http://cocorahs.
org, particularly from the state of Missouri for the current analyses.
Since the beginning of CoCoRaHS data inMissouri (2006; Table 1), over
1,648 separate locations have been established to record precipitation.
However, because CoCoRaHS is a community‐driven organization,
individuals will move or cease precipitation collection for personal mat-
ters. Subtracting these stations results in, as of July 2017, 1,186 current
stations (Figure 1). As outlined in Moon et al. (2009), many stations are
associated with major urban centres (e.g., Columbia, Kansas City,
Springfield, and St. Louis) in addition to some smaller towns (e.g., Rolla).
In order to analyse a decade's worth of data, the stations that have been
collecting precipitation data since the admission of Missouri into the
CoCoRaHS network to 2016 were included for this study, totaling 75
stations (Figure 2).
Precipitation data were collected at the 75 separate stations and
were recorded in inches by individuals who are admitted to the
program contingent upon the use of a standard 4‐inch (10.16 cm)
overflow tube, whereby the funnel directs precipitation into the
measuring tube, magnifying the amount of precipitation by an order
of magnitude. This allows the resolution of rainfall to be measured to
the nearest 0.254 mm. If 25.4 mm of precipitation is recorded within
a day, the excess rainfall is collected in the overflow tube. If users
observe less than 0.254 but more than zero millimetre within a 24‐hr
period, the result is recorded as trace (“T”). Furthermore, the individual
operators are instructed to not report morning dew that may form on
the gauge. If individuals miss a 24‐hr period, but return several days
later with precipitation within their gauge, they are instructed to sub-
mit a “multiple day accumulation form,” in which data is entered as
an asterisk (*) for the time period to operator was absent from the
device. The total amount of accumulated rainfall over the time period
is reported after the last asterisk has been recorded. From the data
retrieved, no instances of multi‐day reports occurred from the 75

FIGURE 1 Community Collaborative Rain, Hail, and Snow Network stations in the state of Missouri with overlay of counties as of July 2017
TABLE 1 List of areas in addition to year admitted to the Community Collaborative Rain, Hail, and Snow Network
Year Regions admitted to the CoCoRaHS network
1998 Colorado
2003 Wyoming
2004 Kansas
2005 New Mexico, Texas, Maryland, Virginia, District of Columbia, Pennsylvania, Indiana
2006 Missouri, Oklahoma, Montana, Illinois, and Alaska
2007 Nevada, Wisconsin, Tennessee, South Dakota, Iowa, North Carolina, New York, Florida, Alabama, Kentucky, and Oregon
2008 Louisiana, New Jersey, South Carolina, Rhode Island, Georgia, Washington, Utah, Michigan, Mississippi, California, and North Dakota
2009 Idaho, Ohio, Massachusetts, Vermont, Arkansas, West Virginia, Hawaii, Connecticut, New Hampshire, Maine, Arizona, Delaware,and Minnesota
2012 Canada
2013 Nebraska
2014 Puerto Rico
2015 U.S. Virgin Islands
2016 Bahamas
Note. CoCoRaHS = Community Collaborative Rain, Hail, and Snow Network.
SIMPSON ET AL. 3
stations utilized between December and January (i.e., intra‐annually;
https://www.cocorahs.org/State.aspx?state=MO).
Methods for measuring snowfall are different from measuring rain.
For example, the inner measuring cylinder and funnel are

FIGURE 2 The 75 Missouri Community Collaborative Rain, Hail, and Snow Network stations (blue squares) and 22 Missouri Mesonet stations(green circles) utilized for the current study
4 SIMPSON ET AL.
recommended to be removed for measurements of snow water con-
tent and other frozen precipitation, such that snowfall accumulates in
the outer (i.e., overflow) cylinder. The observer is instructed to pour
X amount of warm water into the detached inner cylinder and intro-
duce that to the snow in the outer cylinder. After all of the snow has
melted, the water with the newly melted snow amount is re‐intro-
duced to the inner cylinder for a total amount. The difference between
X amount of warm water and the new total amount of water is the
reported daily precipitation amount the observer records. Alterna-
tively, the snowfall can be melted down and then be measured by
pouring the melted liquid into the inner cylinder.
Although errors associated with CoCoRaHS measurements are
not well documented, it has been observed that typical errors include,
but are not limited to imprecise readings from the meniscus of precip-
itation measurements, evaporation from strong solar radiation in the
afternoon, wind effects (i.e., turbulence), and inaccuracies in snow
melting and snow measuring techniques.
2.2 | Missouri Mesonet data
The Missouri Mesonet is comprised of several fully equipped weather
stations that record air temperature, relative humidity, wind direction
and speed, precipitation, barometric pressure, solar radiation, and soil
temperature at a depth of 2 and 4 inches. For the purpose of this
study, precipitation will be analysed as compared against the results
of that obtained from CoCoRaHS measurements. From the 35 stations
that are operational as of July 2017, only 22 have historical data dating
back to 2006 (Figure 2).
Precipitation data from the Missouri Mesonet are recorded via a
Campbell Scientific TE525 tipping bucket. Each rain gauge has a
15.24 cm orifice that introduces up to 0.254 mm of precipitation to a
fulcrum device, which causes a tip to be registered. Gauge errors range
from −1% to 1%, −3% to 0%, and −5% to 0% for precipitation up to
25.4 mm hr−1, 25.4 to 50.8 mm hr−1, and 50.8 to 76.2 mm hr−1, respec-
tively. To mitigate the errors associated with the rain gauges, each
device is located, approximately, 1 m above the ground with properly
maintained vegetation height to decrease effects from turbulence.
Furthermore, all stations are located at a minimum of twice the
distance of the height of the nearest building.
The tipping buckets also have a limit as to their performance during
extreme temperatures. For example, themanufacturer states the optimal
performance of theTE525 tipping bucket series is between 0 and 50 °C.
For all stations, no daily maximum temperature exceeded 50 °C, whereas
2% of the days had a minimum temperature below 0 °C. Due to the
relatively low number of days below the manufacturer‐recommended
temperature, these were included in the analyses to determine
whether any significant (p < .05) differences exist between the tipping
bucket reports and the CoCoRaHS data during the cool season.
2.3 | Warm and cool season definition
Due to its inland location and lack of proximity to large bodies of water,
Missouri is subject to frequent changes in temperature. Consequently,
Missouri has a continental type of climate that is characterized by strong
seasonality (Ahrens & Henson, 2014). The summer months typically
exhibit warm, moist air masses that produce convective (i.e., heavy)
precipitation over relatively short‐time periods. Mesoscale convective
complexes are frequent, which provide a mix of convective and
stratiform precipitation to theMidwest during the evening hours. Addi-
tionally, stratiform precipitation is frequent following the convective
leading edge of cold frontal passages, which typically occur bi‐weekly.
Conversely, during El Niño conditions, the Midwest is susceptible to
prolonged high pressures, primarily through blocking patterns, which
produce prolonged drought periods.
Winter months are typically characterized as cool and humid, in
which snowfall and rainfall events are frequently observed. All of

SIMPSON ET AL. 5
Missouri experiences freezing temperatures every year. Furthermore,
there are an average of 110 days with temperatures below 0 °C for
the northern half of the state, whereas the number of freezing days
reduce to approximately 70 in the bootheel (i.e., south‐east) region.
The warm and cool seasons are defined such that an agronomic
perspective is invoked, whereby freeze probabilities are considered
over a climatological (i.e., 30 years) period. From 1986 to 2016, the
only month with a mean average temperature below 0 °C was January,
whereas February and December averages 0.83 and 0.55 °C,
respectively. Furthermore, March and November registered average
temperatures of 6.5 °C. Therefore, November to March were desig-
nated as the “cool” season, whereas April to October are referred to
as the “warm” season. Therefore, the warm and cool seasons have 7
and 5 months, respectively (Lebedeva et al., 2017).
2.4 | Data processing
The aggregated summation values were ingested into ArcGIS Desktop
10.5, in which Kriging interpolations were conducted between each of
the 75 CoCoRaHS locations and the 22 Missouri mesonet stations.
From the diverse literature of regarding the use of spline or inverse
distance weighting being the superior technique (e.g., Declercq,
1996; Gallichand & Marcotte, 1993; Weber & Englund, 1992) to the
Kriging procedure (e.g., Creutin & Obled, 1982; Laslett & McBratney,
1990; Rouhani, 1986; Weber & Englund, 1994), Zimmerman, Pavlik,
Ruggles, and Armstrong (1999) provides evidence that the Kriging
method is significantly superior to the inverse distance weighting
method in terms of sampling pattern, noise, and correlation. Therefore,
the interpolation scheme invoked for the current study was the spherical
Kriging method, using 12‐point interpolations.
Differences between the Missouri Mesonet and CoCoRaHS data
are, primarily, due to the aforementioned errors for each method of
precipitation collection. In general, most Mesonet stations are in the
vicinity of a CoCoRaHS location and, therefore, can assume to
FIGURE 3 Normal probability plots for the 75 Missouri Community Collab
experience the same amount of precipitation; External forcing (e.g., El
Niño or La Niña) of precipitation does not impact the overall differ-
ences in rainfall observed for the current study.
3 | RESULTS AND DISCUSSION
3.1 | Yearly Results
In order to determine whether the accumulation of data represents a
normal distribution, normal probability plots were constructed for each
year (Figure 3). Seven of the 10 years (2009, 2010, 2012, 2013, 2014,
2015, and 2016) produced statistically significantly (p < .05) evidence
that the precipitation data follow a normal distribution using the
Anderson–Darling test (Stephens, 1976). Years 2009, 2010, and 2013
exhibit data that is right skewed, indicating that the majority of stations
recording yearly precipitation lie below the mean (1,288.3, 1,140.8, and
1,150.5 mm respectively), overall. Conversely, years 2012, 2015, and
2016 exhibit left‐skewed precipitation data. Two thousand and seven
and 2011 rainfall amounts show high variance, with regionally large
precipitation amounts in the south‐west and south‐east, respectively.
In addition to determining the normality of the spatial distribution
of precipitation, boxplots were constructed also to visualize mean,
quartiles, and outliers of each of the 10 years of data (Figure 4). From
the aforementioned probability results, the years that rejected the null
hypothesis of normality under the Anderson–Darling test (e.g., 2007,
2008, and 2011) either resulted in a relatively large number of outliers
(e.g., 2007 and 2011) in addition to a large range of yearly accumulated
precipitation. Years 2012, 2013, and 2014 were neutral El Niño and
Southern Oscillation (ENSO) phases (Newberry, Lupo, Jensen, &
Rodriges‐Zalipynis, 2016), which also resulted in the most evenly dis-
tributed rainfall amounts for the state of Missouri. This is evidenced by
the near‐symmetrical quartiles between the mean values in addition to
the symmetry of the variability outside of the upper and lower quartiles.
orative Rain, Hail, and Snow Network stations
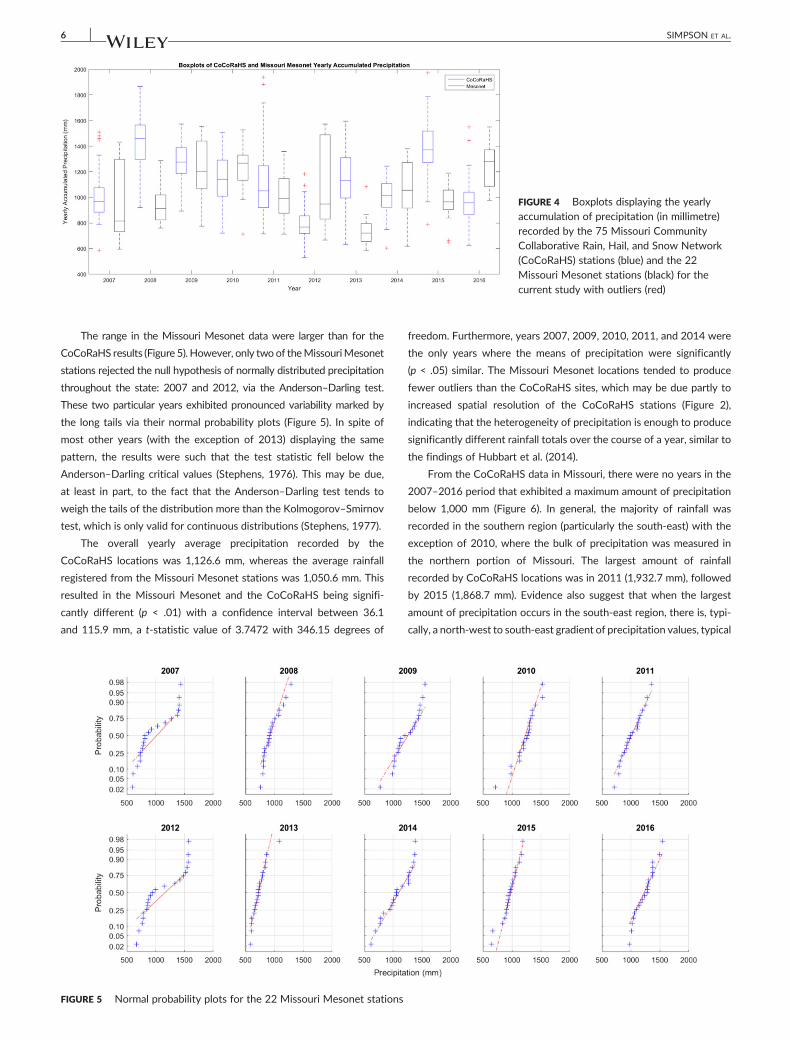
FIGURE 4 Boxplots displaying the yearlyaccumulation of precipitation (in millimetre)recorded by the 75 Missouri CommunityCollaborative Rain, Hail, and Snow Network(CoCoRaHS) stations (blue) and the 22Missouri Mesonet stations (black) for thecurrent study with outliers (red)
6 SIMPSON ET AL.
The range in the Missouri Mesonet data were larger than for the
CoCoRaHS results (Figure 5). However, only two of theMissouriMesonet
stations rejected the null hypothesis of normally distributed precipitation
throughout the state: 2007 and 2012, via the Anderson–Darling test.
These two particular years exhibited pronounced variability marked by
the long tails via their normal probability plots (Figure 5). In spite of
most other years (with the exception of 2013) displaying the same
pattern, the results were such that the test statistic fell below the
Anderson–Darling critical values (Stephens, 1976). This may be due,
at least in part, to the fact that the Anderson–Darling test tends to
weigh the tails of the distribution more than the Kolmogorov–Smirnov
test, which is only valid for continuous distributions (Stephens, 1977).
The overall yearly average precipitation recorded by the
CoCoRaHS locations was 1,126.6 mm, whereas the average rainfall
registered from the Missouri Mesonet stations was 1,050.6 mm. This
resulted in the Missouri Mesonet and the CoCoRaHS being signifi-
cantly different (p < .01) with a confidence interval between 36.1
and 115.9 mm, a t‐statistic value of 3.7472 with 346.15 degrees of
FIGURE 5 Normal probability plots for the 22 Missouri Mesonet stations
freedom. Furthermore, years 2007, 2009, 2010, 2011, and 2014 were
the only years where the means of precipitation were significantly
(p < .05) similar. The Missouri Mesonet locations tended to produce
fewer outliers than the CoCoRaHS sites, which may be due partly to
increased spatial resolution of the CoCoRaHS stations (Figure 2),
indicating that the heterogeneity of precipitation is enough to produce
significantly different rainfall totals over the course of a year, similar to
the findings of Hubbart et al. (2014).
From the CoCoRaHS data in Missouri, there were no years in the
2007–2016 period that exhibited a maximum amount of precipitation
below 1,000 mm (Figure 6). In general, the majority of rainfall was
recorded in the southern region (particularly the south‐east) with the
exception of 2010, where the bulk of precipitation was measured in
the northern portion of Missouri. The largest amount of rainfall
recorded by CoCoRaHS locations was in 2011 (1,932.7 mm), followed
by 2015 (1,868.7 mm). Evidence also suggest that when the largest
amount of precipitation occurs in the south‐east region, there is, typi-
cally, a north‐west to south‐east gradient of precipitation values, typical

FIGURE 6 Yearly cumulative precipitation totals for Missouri from 2007 to 2016 in millimetre using the Community Collaborative Rain, Hail, andSnow Network stations
SIMPSON ET AL. 7
of precipitation patterns in theMidwest (Birk, Lupo, Guinan, & Barbieri,
2010). For several of the years (e.g., 2011, 2014, and 2016), when the
maximum precipitation is located in the bootheel (i.e., south‐eastern)
region, the minimum is, typically, located in the south‐west. This could
be due, at least in part, to mesoscale and/or synoptic events associated
with the impact the Ozark Plateau has on precipitation regimes. How-
ever, this conjecture would need further study.
For Boone County, Missouri (centre of Missouri), which contains
the City of Columbia, one of the largest cities in the state, the effects
of an urban heat island effect on precipitation amount is evident
(Akyuz et al., 2004). For example, all stations located within Boone
County recorded larger cumulative precipitation amounts than any
other station within a 50‐km radius for all years except 2009 and
2012. These results are consistent with those found in Hubbart et al.
(2014), indicating that localized urban regions exhibit larger precipita-
tion amounts than surrounding rural areas.
The years of 2012 and 2016 registered the least amount of
rainfall (614.2 and 663.2 mm, respectively) since 2007. For 2012,
the largest amount of precipitation occurred in the south‐west (near
Joplin, MO) with a minimum to the north, whereas the opposite
was true for the year of 2016, such that the minimum amount of
precipitation was to the south‐west (and north‐east), but the maximum
was located in the south‐east. As stated above, most years exhibited
a north‐west‐south‐east precipitation gradient with noticeable
exceptions of 2007 and 2010, both of which were characterized by
relatively strong El Niño during the warm season.
TheMissouri Mesonet displayed less heterogeneity of precipitation,
in spite of the data being relatively more evenly spaced than the
CoCoRaHS stations (Figure 2). However, the general pattern of annual
precipitation totals increasing to the south was evident with the
Mesonet, similar to the CoCoRaHS results (Figure 7). In spite of this
similarity, for themajority ofMissouriMesonet stations, the precipitation
patterns were nearly opposite to what was reported from CoCoRaHS.
For example, for 2007, the largest annual precipitation amount as
measured by CoCoRaHS was in the south‐west (1,435.6 mm), whereas
the largest annual precipitation amount recorded by the Mesonet was
in the south‐east (1,431.8 mm). Furthermore, the range of minimum
precipitation for 2007 was over 200 mm less for the Mesonet. Similar
patterns of opposing maximum and minimum of precipitation were
observed for all years with the exception of 2008, 2014, 2015, and 2016.
The largest values of precipitation recorded by the Mesonet were
found in 2012 (1,574 mm), which happened to be the lowest recorded
maximum for the CoCoRaHS data (1,005.8 mm), with the maximum
being in the south‐east and south‐west regions of the state, respec-
tively. The highest precipitation values for the majority of the state of
Missouri were recorded in 2009, the only year that both methods of
rainfall collection displayed a consistently large precipitation amount.
3.2 | Seasonal results
The warm season precipitation totals, typically, exhibited the same
spatial pattern as the yearly accumulation of rainfall for the CoCoRaHS
data (Figure 8), which is to be expected as convective precipitation
dominates during the warm season, yielding larger rainfall amounts in
comparison to relatively shallow storm systems during the cool season,
which generates lower liquid precipitation (Birk et al., 2010).
The largest contribution of the warm season precipitation to the
yearly total were in (92.5%) and 2007 (83.1%), both weaker El Niño

FIGURE 8 Warm season cumulative precipitation totals for Missouri from 2007 to 2016 in millimetre using the Community Collaborative Rain,Hail, and Snow Network stations
FIGURE 7 Yearly cumulative precipitation totals for Missouri from 2007 to 2016 in mm using the Missouri Mesonet stations
8 SIMPSON ET AL.
years during the warm season (see Center of Ocean and Atmosphere
Prediction Studies: http://www.coaps.fsu.edu/pub/JMA_SST_Index/).
The absolute largest warm season precipitation amounts were 2010
(1,304.9 mm) and 2008 (1,224.3 mm), and 2007 was the third largest
(1,207.9 mm). Conversely, 2012 yielded the smallest contribution by
warm season precipitation (667.1 mm), which comprised 66.3% of
the total annual precipitation for the year. Both 2015 and 2016 also
had warm season precipitation amounts below 1,000 mm (975.2 and
986.3 mm, respectively), which are characterized as relatively strong
El Niño summers. Therefore, it may be summarized that during weak
El Niño years, the south‐east is primarily associated with low precipita-
tion amounts during the warm season (i.e., drought conditions) with

SIMPSON ET AL. 9
large precipitation amounts elsewhere (primarily to the west and
north), whereas strong El Niño years are characterized by overall drier
than normal summers where the bulk of precipitation is localized to the
south‐eastern portion of Missouri. However, this is a limited sample
and studies such as Birk et al. (2010) show that ENSO behaviour in
Missouri can change over time as related to interdecadal variability
such as that associated with the Pacific Decadal Oscillation.
The overall minimum in warm season CoCoRaHS precipitation
amount for the current 10‐year study were for years 2011 (336.6 mm),
2010 (350.3mm), and 2012 (399.6mm), whichmay be due, at least in part,
to the dominant neutral phase during this time period. However, the
regions of largest recorded rainfalls were different for each years, ranging
from the south‐east, south‐west, and overall north of Missouri.
Conversely, the largest values of the minimum amount of precipitation
for the warm season were for years 2009 (864.9 mm), 2008 (807.4 mm),
and 2015 (758.3 mm). Unlike the maximum precipitation amounts, the
minimum precipitation values were not attributed to a single ENSO phase
nor a transition of phases (Newberry et al., 2016). Interestingly, with the
exception of 2007–2008 and 2013–2014, the warm season precipitation
amount in the south‐eastern region displays a nearly oscillatory pattern of
maximum/minimum precipitation amount for the state of Missouri.
In general, rainfall patterns for the cool season were maximum in
the south‐eastern region of Missouri for each of the 10 years of the
current study (Figure 9). Furthermore, CoCoRaHS recorded precipita-
tion patterns of the cool season match especially well for annual pre-
cipitation totals for 2007, 2010, 2011, 2012, and 2016. However, for
2008 and 2012, the cool season rainfall amount contributed to an
extended portion of the south.
The evidence of the urban heat island effect in Boone County
(Central Missouri) is prevalent through many of the years, especially
FIGURE 9 Cool season cumulative precipitation totals for Missouri from 20and Snow Network stations
2007 and 2015. For example, the stations in Central Missouri for the
cool season of 2007 registered an average precipitation total of,
approximately, 350 mm, whereas the surrounding areas, up to
150 km from Central Missouri, registered below 200 mm of precipita-
tion. The same general magnitudes were recorded for 2014, but the
areal extent of rainfall totals were larger to the south‐east.
For all years with the exception of 2015, the overall warm season
precipitation maximums were larger than the cool season maximums.
Although designated a relatively strong El Niño, the 2015–2016 cool
season registered 987.5 mm of precipitation in the south‐east, com-
pared to maximum of 975.2 mm in the north‐west during the warm
season. This could be due, at least in part, to the relatively warmer than
average winter that occurred during 2015–2016, resulting in an unsea-
sonably large amount of severe weather reports during December.
From a regional perspective, the maximum amount of cool season
precipitation in the south‐east of Missouri was more than the
maximum amount of warm season rainfall for 2007 (634.8 mm com-
pared to 500 mm), 2010 (453.9 mm compared to 350.3 mm), and
2015 (987.5 mm compared to 800 mm), all characteristically warm
season El Niño events. Therefore, it is possible that during El Niño
events, the majority of precipitation in the south‐eastern portion of
Missouri occurs during the cool season.
The Missouri Mesonet warm season accumulation of precipitation
least closely matched the CoCoRaHS pattern of precipitation than the
yearly data (Figure 10). For example, the maximum of warm season
precipitation for the CoCoRaHS and Mesonet data were in the
south‐west and south‐east for 2007, respectively, whereas the
maximum for 2008, 2009, 2011, and 2014 for in the north‐east and
south‐west, central and south‐west/north‐east, south‐east and
north‐east, and north and south‐east, respectively. Furthermore, the
07 to 2016 in millimetre using the Community Collaborative Rain, Hail,

FIGURE 10 Warm season cumulative precipitation totals for Missouri from 2007 to 2016 in millimetre using the Missouri Mesonet stations
10 SIMPSON ET AL.
only year that showed any correlation between warm season and
annual total precipitation patterns was for 2013 and 2015.
Overall, the absolute maximum warm season Missouri Mesonet
rainfall amount was for 2009 (1,192.7 mm), with 2011 not far behind
(1,102.0 mm). Additionally, 2010 and 2008 also registered over
1,000 mm of precipitation for the warm season (1,059.8 and
1,009.8 mm, respectively). The lowest warm season maximum precip-
itation values were 2013 (805.2 mm) and 2016 (831.9 mm). The
FIGURE 11 Cool season cumulative precipitation totals for Missouri from
extreme minimum values of precipitation were for years 2010
(614.3 mm) and 2016 (608.5 mm), whereas the lowest values of warm
season precipitation, overall, were recorded during the years of 2013
(340.1 mm) and 2012 (356.8 mm), and both years were classified as
ENSO neutral.
For all 10 years of the current study, the Missouri Mesonet
recorded the maximum amount of cool season precipitation in the
south‐east (Figure 11), similar to the results presented by the cool
2007 to 2016 in millimetre using the Missouri Mesonet stations

SIMPSON ET AL. 11
season CoCoRaHS sites. Conversely, all of the minimum amount of
rainfall for the cool season were located in the north, primarily to the
north‐west. Years 2011, 2012, 2015, and 2016 registered, overall,
lowest precipitation amounts along the northern border of Missouri,
whereas 2007, 2010, 2012, and 2015 all recorded their lowest precip-
itation amounts along the western edge of the state.
4 | CONCLUSIONS
Multiple methods for collecting precipitation data at a point location
exist, but the means of how the rainfall is collected varies. Typically,
automated rain gauges in the form of tipping buckets collect precipita-
tion data to ameliorate the attention necessary for the precipitation
collection process. However, Colorado State initiated the CoCoRaHS
network, which implements the general public to record daily precipi-
tation values in order to increase the spatial resolution of rainfall
collection, as automated rain gauges become relatively expensive over
time. Since the CoCoRaHS program was implemented in 1998, the
United States, U.S. Virgin Islands, Canada, Puerto Rico, and the
Bahamas have joined to aid in the rainfall collection. Even though data
have been collected, results from studies using these data are relatively
few in the literature. Therefore, the current study analyzes 10 years of
75 separate CoCoRaHS precipitation data and compares the results to
22 Missouri Mesonet sites.
Seven out of the 10 years used in the current study reported a
normal distribution of rainfall across the state of Missouri as recorded
by the CoCoRaHS sites, whereas 8 of the 10 Missouri Mesonet
stations were normally distributed. This may be due, at least in part,
to the fact that there were more CoCoRaHS site locations in
comparison to the Missouri Mesonet. This resulted in, overall, there
being a significant (p < .01) difference between the CoCoRaHS and
Missouri Mesonet yearly precipitation totals. When the entire 10‐year
dataset was divided into yearly accumulations, half of the years of
precipitation were significantly different between CoCoRaHS and the
Missouri Mesonet. Furthermore, it was shown that the most spatially
even distribution of rainfall were, primarily, during ENSO neutral years
(i.e., years 2012, 2013, and 2014).
The urban heat island effect (Hubbart et al., 2014) was evident,
but mostly for the CoCoRaHS data, primarily due to the increase
spatial resolution of rainfall. It was noticed that during weak El Niño
years, the south‐east is primarily associated with low precipitation
amounts during the warm season (i.e., drought conditions) with large
precipitation amounts elsewhere (primarily to the west and north).
Conversely, strong El Niño years are characterized by overall drier than
normal summers where the bulk of precipitation is localized to the
south‐eastern portion of Missouri. For all years with the exception of
2015, the overall warm season precipitation maximums were larger
than the cool season maximums.
There were many instances in which the precipitation regimes
were opposite in the two precipitation datasets. For example, the
maximum of warm season precipitation for the CoCoRaHS and
Mesonet data were in the south‐west and south‐east for 2007, respec-
tively, whereas the maximum for 2008, 2009, 2011, and 2014 for in
the north‐east and south‐west, central and south‐west/north‐east,
south‐east and north‐east, and north and south‐east, respectively.
Furthermore, only 2 years showed any correlation between precipita-
tion patterns, 2013 and 2015.
The results presented improve our understanding of the impacts
of different methods of collecting precipitation. In this case, the
CoCoRaHS network is a much denser precipitation network than the
Missouri Mesonet and has been shown to more reliable than tipping‐
bucket measurements (Moon et al., 2009). For example, unpublished
comparisons exhibited that tipping‐bucket rain gauges used by the
Fort Collins, Colorado storm‐water utility were 10–20% lower than
CoCoRaHS gauges (Reges et al., 2016). Research conducted by the
West Texas Mesonet (www.mesonet.ttu.edu/) noted systematic low
bias on the order of 5–10% over varying precipitation regimes.
Depending on the precipitation data used, such as the current study,
significantly (p < .01) different results may occur, especially when
aggregated over yearly time scales. This may, in turn, yield in some
cases opposite results for the spatial and temporal resolution of rainfall
over regions as large as Missouri.
Furthermore, the quality control that is implicit with the
CoCoRaHs data exceeds that of many different Mesonets within the
contiguous United States (Reges et al., 2016). Specific examples
include manual measurements of snowpack being combined with
snow water equivalent reported by citizens that are utilized by the
Snow Telemetry system (Pagano, Garen, & Sorooshian, 2004), in
addition to the Airborne Gamma Radiation Snow Survey Program
(Carroll, 2001). The combination of these validations enhances the
National Operational Hydrologic Remote Sensing Center's remote
sensing, snow modelling, and spatial analysis programs (Clow, Nanus,
Verdin, & Schmidt, 2012).
With limited studies comparing the performance of CoCoRaHS to
other sources of precipitation data, the current study presents a novel
discussion comparing the results of 10 years' worth of rainfall data.
With statistically significant (p < .05) differences for most years, results
indicate the importance in carefully choosing a source of rainfall data.
Furthermore, the results point towards the importance of the public
in the collection and dissemination of rainfall data, which may yield
more accurate calibrations of radar rainfall estimates and hydrologic
modelling.
ACKNOWLEDGMENTS
This material is based upon work supported by the National Science
Foundation under Grant IIA‐1355406. Any opinions, findings, and
conclusions or recommendations expressed in this material are those
of the authors and do not necessarily reflect the views of the National
Science Foundation. We would also like to thank the anonymous
reviewers who helped in the preparation of this manuscript.
ORCID
Micheal J. Simpson http://orcid.org/0000-0002-5950-3310
REFERENCES
Ahrens, C.D., & Henson, R. (2014). Meteorology Today. Cengage Learning,586 pp.

12 SIMPSON ET AL.
Akyuz, F. A., Market, P. S., Guinan, P. E., Lam, J. E., Oehl, A. M., & Maune, W.C. (2004). The Columbia, Missouri, Heat Island Experiment (COHIX) andthe influence of a small city on the local climatology. Transactions of theMissouri Academy of Science, 38, 56–71.
Beard, K. V., & Chuang, C. (1987). A new model for the equilibrium shape ofraindrops. Journal of the Atmospheric Sciences, 44, 1509–1524.
Berne, A., & Krajewski,W. F. (2013). Radar for hydrology: unfulfilled promiseor unrecognized potential? Advances in Water Resources, 51, 357–366.
Birk, K., Lupo, A. R., Guinan, P. E., & Barbieri, C. E. (2010). The interannualvariability of Midwestern temperatures and precipitation as related tothe ENSO and PDO. Atmosfera, 23, 95–128.
Bringi, V. N., Chandrasekar, V., Hubbert, J., Gorgucci, E., Randeu, W., &Schoenhuber, M. (2003). Raindrop size distribution in different climateregimes from disdrometer and dual‐polarized radar analysis. Journal ofthe Atmospheric Sciences, 60, 354–365.
Bunkers, M. J., Smith, M., Driscoll, D., & Hoogestraat, G. (2015). Hydrologicresponse for a high‐elevation storm in the South Dakota Black Hills.NOAA/NWS Rapid City, SD, Internal. Report. 21 pp.
Carroll, T. (2001). Airborne Gamma Radiation Snow Survey Program: Auser's guide. Version 5.0, NOAA, 14 pp.
Ciach, G. J. (2002). Local random errors in tipping‐bucket rain gaugemeasurements. Journal of Atmospheric and Oceanic Technology, 20,752–759.
Ciach, G. J., & Krajewski, W. F. (1999a). On the estimation of radar rainfallerror variance. Advances in Water Resources, 22, 585–595.
Ciach, G. J., & Krajewski, W. F. (1999b). Radar‐rain gage comparisonsunder observational uncertainties. Journal of Applied Meteorology, 38,1519–1525.
Cifelli, R., Doesken, N., Kennedy, P., Carey, L. D., Rutledge, S. A.,Gimmestad, C., & Depue, T. (2005). The community collaborative rain,hail, and snow network: Informal education for scientists and citizens.Bulletin of the American Meteorology Society, 86, 1069–1077.
Clow, D. W., Nanus, L., Verdin, K. L., & Schmidt, J. (2012). Evaluation ofSNODAS snow depth and snow water equivalent estimates for theColorado Rocky Mountains, USA. Hydrological Processes, 26,2583–2591.
Creutin, J. D., & Obled, C. (1982). Objective analyses and mappingtechniques for rainfall fields: An objective comparison. Water ResourcesResearch, 2, 413–431.
Cunha, L. K., Smith, J. A., Baeck, M. L., & Krajewski, W. F. (2013). An earlyperformance of the NEXRAD dual‐polarization radar rainfall estimatesfor urban flood applications. Weather Forecasting, 28, 1478–1497.
Declercq, F. A. N. (1996). Interpolation methods for scattered sample data:Accuracy, spatial patterns, processing time. Cartography and GeographicInformation Systems, 23, 128–144.
Fang, T. B., & Yongmei, L. (2012). Personal real‐time air pollution exposureassessment methods promoted by information technological advances.Annals of GIS, 18(4), 279–288.
Frankhauser, R. (1997). Influence of systematic errors from tipping bucketgauges on urban runoff simulation. Use of Historical Rainfall Seriesfor Hydrological Modeling. Preprints, 3rd Int. Workshop on Rainfall inUrban Areas, 37–44.
Gallichand, J., & Marcotte, D. (1993). Mapping clay content for subsurfacedrainage in the Nile delta. Geoderma, 58, 165–179.
Gorgucci, E., Baldini, L., & Chandrasekar, V. (2006). What is the shape of araindrop? An answer from radar measurements. Journal of theAtmospheric Sciences, 63, 3033–3044.
Gorgucci, E., Scarchilli, G., Chandrasekar, V., & Bringi, V. N. (2000).Measurement of mean raindrop shape from polarimetric radar observa-tions. Journal of the Atmospheric Sciences, 57, 3406–3413.
Grant, N., Saito, L., Weltz, M., Walker, M., Daly, C., Stewart, K., & Morris, C.(2013). Instrumenting wildlife water developments to collect hydrome-teorological data in remote western U.S. catchments. Journal ofAtmospheric and Oceanic Technology, 30, 1161–1170.
Habib, E., Krajewski, W. F., & Kruger, A. (2001). Sampling errors of tipping‐bucket rain gauge measurements. Journal of Hydrological Engineering, 6,159–166.
Habib, E., Krajewski, W. F., Nespor, V., & Kruger, A. (1999). Numericalsimulation studies of rain gauge data correction due to wind effect.Journal of Geophysical Research, 104, 723–734.
Hubbart, J. A., Kellner, E., Hooper, L., Lupo, A. R., Market, P. S., Guinan, P.E., … Svoma, B. M. (2014). Localized climate and surface energy fluxalterations across an urban gradient in the central U.S. Energies, 7,1770–1791.
Kelleners, T. J., & Verma, A. K. (2012). Modeling carbon dioxide productionand transport in a mixed‐grass rangeland soil. Vadose Zone Journal, 11,1539–1663.
Kelly, G. M., Taubman, B. F., Perry, L. B., Sherman, J. P., Soulé, P. T., &Sheridan, P. J. (2012). Relationships between aerosols and precipitationin the southern Appalachian Mountains. International Journal ofClimatology, 14, 2016–3028.
Kelsch, M. (1998) The Fort Collins flash flood: Exceptional rainfall andurban runoff. Preprints, 19th Conference on Severe Local Storms,Minneapolis, MN, American Meteorology Society, 404–407.
Kitchen, M., & Blackall, M. (1992). Representativeness errors in compari-sons between radar and gauge measurements of rainfall. Journal ofHydrology, 134, 13–33.
Kluver, D., Mote, T., Leathers, D., Henderson, G. R., Chan, W., & Robinson,D. A. (2016). Creation and validation of a comprehensive 1° by 1° dailygridded North American dataset for 1900–2009: Snowfall. Journal ofAtmospheric and Oceanic Technology, 33, 857–871.
Kumjian, M. R. (2013). Principles and applications of dual‐polarizationweather radar. Part II: Warm‐ and cold‐season applications. Journal ofOperational Meteorology, 1, 243–264.
Kurri, M., & Huuskonen, A. (2008). Measurements of the transmission lossof a radome at different rain intensities. Journal of Atmospheric andOceanic Technology, 25, 1590–1599.
Laslett, G. M., & McBratney, A. B. (1990). Further comparison of spatialmethods for predicting soil pH. Soil Science Society of America Journal,54, 1553–1558.
Lebedeva, M. G., Lupo, A. R., Henson, C. B., Solovyov, A. B., Chendev, Y. G.,& Market, P. S. (2017). A comparison of bioclimatic potential in twoglobal regions during the late 20th century and early 21st century.International Journal of Miometeorology, in press.
Martinaitis, S.M., Qi, Y., Cocks, S., Tang, L., Kaney, B., Zhang, J., Howard,K. (2014). Improving MRMS Q3 precipitation estimation in thewestern United States: Preliminary results. Extended Abstract, 39thNational Weather Association Annual Meeting, Salt Lake City, UT,D3.4.
Moon, J. T., Guinan, P. E., Snider, D. J., & Lupo, A. R. (2009). CoCoRaHS inMissouri: Four years later, the importance of observations. Transactionsof the Missouri Academy of Science, 43, 7–18.
Newberry, R. G., Lupo, A. R., Jensen, A. D., & Rodriges‐Zalipynis, R. A.(2016). An analysis of the Spring‐to‐Summer transition in the CentralPlains for application to long range forecasting. Atmospheric and ClimateScience, 6, 375–393.
Pagano, T., Garen, D., & Sorooshian, S. (2004). Evaluation of official west-ern U.S. seasonal water supply outlooks, 1922‐2002. Journal ofHydrometeorology, 5, 896–909.
Petersen, W. A., Carey, L. D., Rutledge, S. A., Knievel, J. C., Johnson, R. H.,Doesken, N. J., … Weaver, J. (1999). Mesoscale and radar observationsof the fort Collins flash flood of 28 July 1997. Bulletin of the AmericanMeteorology Society, 80, 191–216.
Reges, H., & Doesken, H. (2011). Creating a volunteer observing network.World Meteorology Organization Bulletin, 60(1), 48–52.
Reges, H. W., Doesken, N., Turner, J., Newman, N., Bergantino, A., &Schwalbe, Z. (2016). CoCoRaHS: The evolution and accomplishmentsof a volunteer rain gauge network. Bulletin of the American MeteorologySociety, 97, 1831–1846.

SIMPSON ET AL. 13
Rouhani, S. (1986). Comparative study of ground‐water mappingtechniques. Ground Water, 24, 207–216.
Ryzhkov, A. V., Giangrande, S., & Schurr, T. (2003). Rainfall measurementswith the polarimetric WSR‐88D radar. National Severe StormsLaboratory Rep. Norman: OK; 98.
Seo, D. J., Breidenbach, J., Fulton, R., Miller, D., & O'Bannon, T. (2000).Real‐time adjustment of range‐dependent biases in WSR‐88D rainfallestimates due to nonuniform vertical profile of reflectivity. Journal ofHydrometeorology, 1, 222–240.
Simpson, M. J., Hubbart, J. A., & Fox, N. I. (2016). Ground trothedperformance of single and dual‐polarized radar rain rates at largeranges. Hydrological Processes, 30, 3692–3703.
Smith, B. K., Smith, J. A., Baeck, M. L., & Miller, A. J. (2015). Exploringstorage and runoff generation processes for urban flooding through aphysically based watershed model. Water Resources Research, 51,1552–1569.
Smith, J. A., Seo, D. J., Baeck, M. L., & Hudlow, M. D. (1996). An intercom-parison study of NEXRAD precipitation estimates. Water ResourcesResearch, 32, 2035–2045.
Stephens, M. A. (1976). Asymptotic results for goodness‐of‐fit statisticswith unknown parameters. Annals of Statistics, 4, 357–369.
Stephens, M. A. (1977). Goodness of fit for the extreme value distribution.Biometrika, 64, 583–588.
Weaver, J. F., Gruntfest, E., & Levy, G. M. (2000). Two floods in Fort Collins,Colorado: Learning from a natural disaster. Bulletin of the AmericanMeteorology Society, 81, 2359–2366.
Weber, D. D., & Englund, E. J. (1992). Evaluation and comparison of spatialinterpolators. Mathematical Geology, 24, 381–391.
Weber, D. D., & Englund, E. J. (1994). Evaluation and comparison of spatialinterpolators, II. Mathematical Geology, 26, 589–603.
Wolfe, J. P., & Snider, J. R. (2012). A relationship between reflectivity andsnow rate for a high‐altitude s‐band radar. Journal of AppliedMeteorology and Climatology, 51, 1111–1128.
Zhang, G., Vivekanandan, J., & Brandes, E. (2001). A method for estimat-ing rain rate and drop size distribution from polarimetric radarmeasurements. IEEE Transactions on Geoscience and Remote Sensing,39, 830–841.
Zhang, J., Qi, Y., Langston, C., Kaney, B., & Howard, K. (2014). A real‐timealgorithm for merging radar QPEs with rain gauge observations andorographic precipitation climatology. Journal of Hydrometeorology, 15,1794–1809.
Zimmerman, D., Pavlik, C., Ruggles, A., & Armstrong, M. P. (1999). An exper-imental comparison of ordinary and universal kriging and inversedistance weighting. Mathematical Geology, 31, 375–390.
How to cite this article: Simpson MJ, Hirsch A, Grempler K,
Lupo A. The importance of choosing precipitation datasets.
Hydrological Processes. 2017;1–13. https://doi.org/10.1002/
hyp.11381