the importance of boundaries - australian policy...
TRANSCRIPT

The importance of boundaries
Colin Hughes
Emeritus Professor of Politic Science, University of Queensland
Research Paper 1 (November 2007)
Democratic Audit of Australia Australian National University Canberra, ACT 0200 Australia http://democratic.audit.anu.edu.au The views expressed are the authors and do not necessarily reflect those of the Democratic Audit of Australia.
2
If elections are to be thought fair, their outcomes should correspond as closely as possible to the inputs of voter preferences. A particular percentage of the votes counted for a party should produce close to the same percentage of the seats won by that party. Down that path lie the topics of partisan bias and proportional representation with multi-member electoral districts as the most common solution. But there is a second criterion of fairness which is that outcomes should correspond to the numbers of electors or people to be represented. That criterion is often called equality, and down that path lie the topics of malapportionment and enforced equality as a solution. The two criteria may not work in the same direction.1 In Australia the problem of equality has been debated mainly with respect to the dichotomy of town and country, �town� usually meaning the State capital(s) which have been invariably by far the largest urban center in each State and �country� the rest, though sometimes the larger provincial cities and towns get lumped in with their local metropolis. Should town voters have the same quantity of representation, measured by the number of electors in the electoral districts, as country voters? There has also been a sub-plot, which is what this paper is about, that concerns the existence of a small number of electoral districts spread over exceptionally large areas in which the population, and consequently the numbers of electors, is relatively thin on the ground and widely scattered. These electoral districts are believed, with some justification, to experience special problems with securing effective representation in the political process. Australia has pioneered both machinery and procedures which are required to address those problems. Recently the increasing frequency with which that machinery and those procedures have been used to re-draw existing electoral boundaries may have stimulated controversy about the process and the acceptability of its outcomes. Most recently, in 2006 a �redistribution� of their House of Representatives electoral districts (known as �divisions� and used for federal and Tasmanian lower house elections) in two States produced considerable controversy, rather more in New South Wales where a division dating back to Federation had been abolished than in Queensland where a new division was created for the first time. The outstanding characteristic of both divisions was their large area and the wide scatter of their population centers. The paper will look at a century of federal boundary-drawing in those two States, New South Wales and Queensland, and try to provide a body of evidence to inform criticism and judgment and against which the most recent outcomes might have been assessed. Drawing divisional boundaries: a short history The boundaries of electoral districts may be taken off the peg by using boundaries already created for some other purpose. Australia�s federal upper house, the Senate, has used the State boundaries which date from the colonial era for electing first 36, then 60 and now 72 Senators, and post-federation Territorial boundaries for another four Senators. Fifteen other Australian legislative chambers are elected on boundaries specially drawn for the purpose. The remaining exceptions are all bicameral States, one 1 Colin Hughes, 1978, �Fair and Equal Constituencies�, Journal of Commonwealth and Comparative Politics 16 (3): 256-71.

3
(Tasmania) where the House of Assembly boundaries are the same as those drawn for the federal lower house but the electoral districts are multi-member and election is by proportional representation, and two (New South Wales and South Australia) where there are no upper house boundaries and the members are elected at large for the whole State; like the Senate they use colonial State boundaries and proportional representation. There was a time in some States when there were a third level of boundaries. In such cases the State was divided into several zones, the zonal boundaries were prescribed by legislation and usually the redistribution commissioners could not draw electoral districts that crossed them. There is now only one instance of zoning and it affects the State upper house in Western Australia. Representative government was introduced to Australia early in the 19th century. Thereafter electoral district boundaries were drawn, ostensibly by the colonial legislature but actually by the colonial government of the day. Starting with New South Wales in 1893 and following a recent development in New Zealand, responsibility for the process was passed to ad hoc commissions, recruited usually from the local judiciary and the local public service and subject to rules contained in local legislation. The change was well received and that arrangement spread gradually to the other five colony/state jurisdictions. Immediately after Federation in 1901 it was adopted for the House of Representatives, with a separate one-member commission appointed for each State. This paper ignores the States� experience to concentrate on federal redistributions and as the two combined have generated only a modest literature2 some further explanation is necessary. In the United States, where the process is called �redistricting,� there is in sharp contrast a vast and often polemical literature although only 10 per cent of the population has �heard a lot� about the process.3 As to the persons appointed to conduct federal redistributions, initially the provision of the Commonwealth Electoral Act (hereafter CEA) read merely that the single commissioner should be �one person in each State� (CEA 1902, s.13). When the commission was enlarged to three persons the provision became �one shall be the Chief Electoral Officer or an officer having similar qualifications, and, if his services are obtainable, one shall be the Surveyor-General of the State or an officer having similar qualifications� (CEA 1918, s.6(1)). The Chief Electoral Officer was the career public servant who headed the Electoral Office, a branch within a federal ministerial department, but with considerable independence recognised de facto. A section of the Electoral Office existed in each State, headed by a Commonwealth Electoral Officer (CEO) answerable to Canberra, and a tiny office, presided over by the Divisional Returning Officer (DRO), was set up in each division. The CEOs were later renamed Australian Electoral Officers (AEOs), and they and the Chief Electoral Officers were made statutory officers as a further guarantee of their independence.
2 E.g. Michael Maley, Trevor Morling and Robin Bell, 1996, �Alternative ways of redistricting with single-member seats: the case of Australia,� in Iain McLean and David Butler (eds.), Fixing the Boundaries: Defining and Redefining Single-Member Electoral Districts, Aldershot, Dartmouth, pp.119-46. 3 E.g. David Butler and Bruce Cain, 1992, Congressional Redistricting: Comparative and Theoretical Perspectives, New York, Macmillan; Pew Research Centre, 2006, �Lack of Competition in Elections Fails to Stir Public� released 27 October (people-press.org).

4
Finally, in 1983, the Electoral Office became a statutory body, the Australian Electoral Commission (AEC), the Chief Electoral Officer became the Electoral Commissioner and was joined by two part-time Commissioners, the chairman of the Commission who must be a judge or a retired judge, and �the non-judicial appointee� who is required to be the head of a federal department or hold an equivalent post (CEA 1918, s.70(2)) and has invariably been the Commonwealth Statistician. At the same time, the process was divided into two stages. Initially there are four members (called the �redistribution committee�). The Electoral Commissioner presides over all redistribution committees, and the other members are the AEO for that State, and two specified State officials, the Auditor-General and the Surveyor-General (CEA 1918, s.60(2)). During the later stage, on appeal so to speak, these four are joined by the two part-time members of the AEC (the body is called the �augmented commission�) and the judge presides. As to actual practice, in the beginning the Commonwealth Electoral Officer usually, but not invariably, drew the electoral boundaries for his own State. After three commissioners were required, he and the State�s Surveyor-General would be joined usually by the public service head of a federal department in the State, one that required close knowledge of that State�s geography. In 1975 the Labor government, which had extensive changes to electoral law in mind but was frustrated by a hostile Senate, used the statutory discretion over the third place to choose more widely: for the three states with the most numerous seats a retired State public servant and two academics who had written about electoral matters (including for Queensland the present writer) were appointed, but that was a rare departure from the norm and is no longer possible under the Act. When responsibility passed from politicians to �neutral� commissioners, statutory provisions set criteria to be applied but those provisions still left considerable discretion. Three criteria could best be thought of as qualitative: �community of interest,�4 means of communication and physical features. Others might be partly quantitative, like setting the permissible maximum deviation from a State zonal average (the �quota�) but without saying anything about location within the permitted range. When a State had created zones for its own elections, those zones would have their own, separate quotas. Sometimes a criterion might look qualitative but yet be capable of being rendered quantitative, like �existing boundaries of divisions� which could be quantified as the proportion of electors remaining in their original divisions but never was in the legislation. The permissible quota deviation criterion perforce outranked all others as commissioners frequently and ruefully have acknowledged. In the earliest reports, when argument was optional, individual commissioners sometimes referred with apparent favoritism to a particular criterion e.g. in the New South Wales 1903 report there is a steady refrain of �well-defined natural features� at the end of many divisional descriptions.
4 Australian Electoral Commission, 1985, Community of Interest (Research Report No.3 of 1985), Canberra, AGPS.
5
Among the earliest reports two displayed some originality, but neither was taken up subsequently as a model to be adopted by, or imposed on, all commissioners. In 1903 the South Australian report by W.R. Boothby,5 incidentally the only redistribution commissioner to have a division named after him, assembled occupational statistics for each division, presumably as a measure of community of interest.6 In 1906 the New South Wales report ranged more widely than that; it will be discussed below. But the statute, and this applies to the state legislation as well as the federal, never assigned weights to the criteria it listed, nor required each division to be approximately equal in merit in the application of the qualitative criteria - or in demerit for failure to apply them, or how far in proximity to or distance from the limits set by the quantitative criteria. Nor did it say whether Parliament thought it preferable to have one dog�s breakfast of a division and the rest nearly perfect in compliance, or for each to have a similar number of defects. A hundred years on, redistribution commissioners are no better placed when working with the original criteria, though since 1983 there has been a significant addition to the quantitative criterion that seeks to average enrolment equality out over time instead of concentrating on the moment the redistribution began. On the other hand, improvements to the input of the process and protections for its independence from partisan considerations have gradually been added. So, on the input front, from 1968 onwards public input has been made public (initially published in a separate volume, then as microfiches and finally as CD-Roms) at the same time as the commissioners� printed reports, though the commissioners� deliberations have always been and remain confidential.7 The current, and most complex, version of the federal system begins with publicly accessible written input, is followed by publicly accessible written comment on that input, holds public hearings, produces a set of proposals, receives publicly accessible written comment on those proposals, confirms or amends those proposals and, if any changes are thought to be �significantly different� from the first proposed boundaries, may hold another round of public hearings. On the independence front two developments are significant. Originally there had been a very real possibility of a parliamentary veto. Prior to 1983 either chamber could fail to vote on proposals, or it could defeat a motion to adopt the proposals or vote to reject them, but there never was a power to amend the commission�s proposals vested in the legislature. In 1983 the parliamentary veto was abolished, and now what the commission finally decides goes into effect forthwith. Second, also since 1983, initiation of the redistribution process has been taken out of the hands of the government of the day and is determined by constitutional and statutory provisions. However the possibility of minor tinkering with the system is always there, as when the Northern Territory was at risk of losing one of its two divisions, and the statutory formula for calculating the Territories� entitlements to seats was slightly modified (CEA 1918, s.47) to make this less likely.
5 Geoffrey Hawker, 1969, �Boothby, William Robinson &c,� in Douglas Pike (ed.), Australian Dictionary of Biography, v.3, Melbourne, Melbourne University Press, pp.196-97. 6 Report by the Commissioner (Mr. W.R. Boothby) appointed to distribute the State of South Australia into Divisions, 1903, C.P.P., v.2, No.20. 7 Colin Hughes and Don Aitkin, 1970, �The Federal Redistribution of 1968: A case study in Australian political conflict�, Journal of Commonwealth Political Studies 8 (1), pp.18-39.

6
There have also been several technological improvements. One of the greatest dangers, particularly for the States with the most divisions, is losing a parcel of electors from the on-going count whilst redistributing, or else counting them twice by putting a parcel into two divisions simultaneously. Such errors were likely to be discovered late in the day and prove difficult and time-consuming to locate and correct. Adding machines, first mechanical and then electric, helped somewhat with keeping track of total numbers but were not foolproof. Meanwhile the United States, with its multiplicity of electoral jurisdictions and decades of technological experiments in electoral administration, moved on and there were demands that Australia follow. In 1983 for the first time a computer program was written to keep track all of the time of all of the electors in the state being redistributed; it also gave instant access to a running count for every division in that state. There was only sufficient time then to introduce it for the three largest states, but once its worth was proven attention moved on to the cartographic component of the process. The original boundaries for the first election in 1901 relied primarily on the existing State electoral districts in which the electors, now federal as well in their status, were located. Subsequently each federal division was broken down into �sub-divisions� for roll-keeping and election management purposes, and these became the building blocks for the redistribution process and appear by name in the redistribution reports. When necessary a sub-division could be split into two or more parts to go their separate ways, whereupon the local DRO and staff were required to do the necessary sums using their local knowledge. Votes were also collected and published by sub-division (and not by polling place until 1984) which made calculating partisan considerations easier and encouraged inertia when revising boundaries. Within sub-divisions, roll management came to rely on regular �habitation reviews,� house-to-house canvassing by temporary staff recruited for the purpose who established from occupants or neighbours whether persons listed on the roll still lived there and if there were persons qualified to be on the roll but not enrolled who could be required to do so. The canvassers were allocated �walks� by their local DROs, and these lists of addresses showing the electors resident at each address became the basic unit below the sub-division for such electoral problem-solving as might require the information. The �habitation review� process closely resembled that followed for the quinquennial national census � and indeed electoral officials assisted in census work. However, a different set of small geographical units, the census collector�s districts (CCD), had been created for that purpose. Consequently the Commonwealth�s two most comprehensive lists of its citizens rested on quite different smallest-unit boundaries, an undesirable state of affairs for comparisons of data. As the CCDs were the more stable � the many uses to which census data are put required longer time series � electors were re-allocated to their CCD. This change, and the assistance of CSIRO mapping specialists, allowed the redistribution process after 1984 to be computer-driven with electoral maps on screen whilst boundaries were drawn and numbers of electors calculated. More options could be considered, and their consequences followed through the state, much more quickly and accurately. Thus, for example, at the 2006 NSW redistribution there were 11,857 CCDs available to be used as the smallest building blocks when fine-tuning was required,

7
although in practice it was the larger Statistical Local Areas (SLAs), made up of a number of CCDs, which appear in the reports and are the mainstay of the redistribution process. About the same time sub-divisions were effectively abolished for roll-keeping although they remain a ghostly presence in the CEA. The intention when they were first introduced had been that they should contain small numbers of electors who could be readily identified by local polling officials and party poll-watchers. At the 1910 election over a quarter of the national total of electors were located in sub-divisions that had fewer than 2000 on the roll and over two-thirds were in those under 5000; only 4.4 per cent were in sub-divisions exceeding 10 000. But by 1983 the proportion in sub-divisions below 2000 in enrolment was down to 1.4 per cent and in those below 5000 to 14.8 per cent whilst 42.5 per cent were in sub-divisions over the 10 000 mark. Moreover, practice varied considerably among the States. Tasmania (13.2 per cent) and New South Wales (19.9 per cent) had the smallest proportions in sub-divisions with more than 10 000 electors, Victoria (42.0 per cent) and Queensland (53.3 per cent) were in between, Western Australia (77.4 per cent) and South Australia (87.3 per cent) the highest. Abandonment of sub-divisions in practice promptly became one of the complaints made by critics of the 1983 changes on the ground that it opened the way to massive voting fraud.8 However the criticism incorrectly claimed that the sub-division system had required �a voter to attend a particular polling booth close to home� which it did not. That option is known as �precinct voting� and, whilst it is common overseas, it never had much appeal in Australia because of the mobility of the population on any one day. From the 1992 reports onwards the building blocks being moved in whole or in part have been the SLAs which, because they correspond to local government authority areas, are better known to the public. The Commonwealth Constitution (s.24) allocates House of Representatives seats to the constituent, still six in number, States according to their population, subject to a guarantee of a minimum of five members to each of the original States. Despite two enlargements of membership since 1901, prior to the 1949 and 1984 general elections, the provision still benefits one State, Tasmania, but to the extent of only one seat. Originally it benefited Western Australia as well. Unlike the United States, there was little relative movement among the constituent States during the 20th century. The percentages of House of Representatives seats for each State at the first general election in 1901, and the two �enlargement� elections in 1949 and 1984, and at the forthcoming 2007 election vary little. New South Wales went down from a high of 38.8 per cent (1949) to 32.7 per cent (2007); Victoria down from 30.7 per cent (1901) to 24.7 per cent (2007); South Australia down from 9.3 per cent (1901) to 7.3 per cent (2007); Tasmania down from 6.7 per cent (1901) to 3.3 per cent (2007); Queensland went up from 12.0 per cent (1901) to19.3 per cent (2007); Western Australia up from 6.7% (1901) to 10.0% (2007); and the Territories recorded 2.0 per cent (1984) and 2.7 per cent (2007). Only one State (Western Australia) has moved in rank order and it went up only one place to overtake South Australia. Probably the most striking statistic that could be compiled is the relative decline in division numbers, and therefore potentially in political importance, 8 Brian Wilshire, 1992, The Fine Print: Australia’s Special Role in the New World Order, Round Corner, NSW, the Author, pp.50-52.

8
of the three south-eastern corner States combined (Victoria, South Australia and Tasmania) from 46.7 per cent (1901) to 35.3 per cent (2007). On the next question the Commonwealth Constitution is silent, but since the CEA 1902 the allocation of electoral districts within each State has always depended on enrolment numbers. Using a continuous roll and with compulsory enrolment operating since 1911, this choice produces a very different situation from allocation of seats by population, for example when counted at a decennial census as in the United States, for the Australian statistics are as close to up to date as the daily flow of enrolment changes allows. Immediately after Federation the federal government set up its own enrolment machinery and began to compile its own rolls. Subsequently, over decades each of the States negotiated a �joint roll agreement� whereby primary roll-compiling activities were undertaken by the federal authority and roll information was supplied as required to the States� equivalent bodies. Initially redistributions were likely to be conducted every five years after the census as was envisaged by the Representation Act 1905. However there was no obligation to do so, and both census and redistribution might be postponed if the government of the day thought that advisable. Since 1977, following a High Court decision9 and consequent legislation, it has been obligatory to check State population relativities for each successive House of Representatives before it is elected; that requires launching the process fairly soon after the previous election. If a State lost or gained a seat, there being a slight flexibility in the total membership number so that changes need not balance exactly, a redistribution of that State has to follow. When the two mainland Territories, the Australian Capital Territory (ACT) and the Northern Territory, eventually secured full-voting-rights representation in the House of Representatives (allowed but not guaranteed by the Constitution), they were brought within the same numbers-allocating regime by legislation. Since 1983 holding a redistribution for a State or Territory has been obligatory, if (i) it has lost or gained a seat, (ii) seven years (a term intended to allow three general elections to be held on one set of boundaries unless either of the other triggers operates) have passed since its previous redistribution, or (iii) more than a third of its divisions have been �malapportioned� i.e. deviated from the average by more than 10 per cent for two successive months. To allow public scrutiny of the third possibility, each month current enrolments of all divisions were published in the Government Gazette though this has recently stopped.10 To date this trigger has never operated, and all post-1983 redistributions have been started by one or other of the first two.11 One consequence of the new regime was that the six States soon got out of step. Tasmania, with its constitutional guarantee of five seats, could never lose a seat but neither was it ever able to gain one. New South Wales, at the other end of the scale, lost
9 Attorney-General (ex rel. McKinlay) v Commonwealth (1977) 7 ALR 159. 10 Peter Brent and Simon Jackman, 2007, A shrinking Australian electoral roll, Discussion Paper 11/07, Canberra, Democratic Audit of Australia, Australian National University. 11 Commonwealth Electoral Act 1918, Part IV.

9
two seats over the period, but managed to time its losses to the end of a regular cycle. Thus those two States have not had premature redistributions. South Australia also lost two seats over the period, got though the first cycle satisfactorily but has since had two premature redistributions, in 1999 and 2003. Victoria, another State to have lost two seats, one in 1989 during the first cycle and the other in 1994 before its new, second cycle had finished, but has since made it through the third cycle. Western Australia, like Victoria, failed to make it through the first cycle, its second cycle was completed, but the third fell short again; its problem was growth and the gain of two additional seats. Queensland has deviated most from the pattern originally hoped for. Having survived the first cycle, the State subsequently experienced the addition of five more seats, one at a time. Since 1992 there has been only one federal election in Queensland which was fought on the same boundaries as applied at the previous election. Concentrating on the two States featured in this paper, since the 1984 enlargement redistribution relatively static New South Wales has been redistributed only three times (1992, 2000, 2006) but steadily growing Queensland has been through the mill five times (1992, 1994, 1997, 2003 and 2006). The Electoral and Referendum Amendment Act, no.94, 1998, s.12 (now CEA 1918, s.63A) introduced a concept of �projection time� which gave the AEC power to set the half-way time in a shorter period if the Commission was of the opinion that a further redistribution �will or may be required� sooner than seven years, but to date experience with that modification has been too limited to pass judgment on its effectiveness. The 2006 redistributions and partisan advantage With that background information made available, the paper can now turn to the latest redistributions of two States, New South Wales and Queensland, which took place in 2006 because the first State had lost a seat and the second had gained a seat. Although approximately half of all 150 federal divisions were involved in the two redistributions, New South Wales going from 50 to 49 and Queensland from 28 to 29, public criticism was very much concentrated on only two of the divisions that resulted. Each was especially large in area, including as they did substantial portions of the archetypical �outback,� and their initial and final versions were criticised for the over-large areas created and apparent disregard of the community of interest criterion.12 Readers who come from a tradition of partisan manipulation of electoral boundary-drawing should turn to the relevant Research Note13 compiled by the Statistics and Mapping section of the federal Parliamentary Library. It calculates how the votes recorded at the previous general election (2004) would transfer into the new boundaries
12 Scott Bennett, 2007, �Save Country Seats�: the NSW redistribution 2005-06,� Research Brief no.8, 2006-07, Canberra, Department of Parliamentary Services; see also Phillip Coorey, 2006, �Electoral redistribution sets of a game of musical seats, Sydney Morning Herald, 14 September; editorial, 2006, �The seats of the problem,� Sydney Morning Herald, 15-16 September; Lachlan Heywood, 2007, �Voters given scant regard,� Courier-Mail, 3 February. 13 Queensland and New South Wales proposed redistributions, 2006, 2006, Canberra, Department of Parliamentary Services.

10
and then divides them, on the basis of the distribution of preferences at that election between the two government-forming possibilities, the Australian Labor Party (ALP) and the Coalition of the Liberal and National parties, thereby creating what is called the �two-party-preferred vote� for the new divisions. Given the requirement of compulsory voting and a complete set of numbered preferences for all candidates on each division�s ballot-paper if a vote is to be valid at a federal election, an excellent measure of partisan advantage is available. Gwydir, the division in New South Wales that disappeared, had been solid (68.4 per cent) for the Coalition. Flynn, the division that appeared in Queensland, would have been less solid (56.8 per cent) and there was some uncertainty which Coalition partner might win it, but on an initial examination there is no partisan advantage to be seen from the loss or gain of a seat. But what about all the other divisions which would have been affected by changed boundaries? On the Research Note�s figures only two divisions in New South Wales and none in Queensland would change hands simply as a result of the 2006 redistributions. Of the two changes in New South Wales, Calare was a special case which might cancel out the other, Parramatta. Perhaps closer examination, especially of marginal seats, would reveal more? The importance of the marginal seats was emphasized more than 30 years ago by the present Prime Minister, then only recently arrived in the House of Representatives but � according to the Labor MP who spoke next � already representing the Liberal Party at redistribution hearings, when debating the 1975 redistribution of New South Wales:
So the pattern emerges in New South Wales, so far as the marginal seats are concerned, in which Labor marginal seats are to be significantly strengthened and Opposition marginal seats are, in many cases, to be significantly weakened. These are the seats that really count so far as holding power in Australia is concerned. The Labor Party knows that it is electoral history in the rural areas of Australia and that its last hope of hanging on to power is to hold the large urban areas of Australia, particularly in Sydney and Melbourne. It is therefore no real coincidence that we find in the metropolitan area a pattern that so clearly favours the Labor Party.14
The present writer has long believed that in electoral districts where the previous winning two-party-preferred vote lies between 52 per cent and 50 per cent, the outcomes at the next election will be virtually unpredictable because of the possible influence of random and unusual factors. Nevertheless, because of the attention they receive in media discussion, we might as well start with them, first those in New South Wales. There were five such divisions after the 2004 election. Two held by the ALP (Banks, Richmond) were slightly improved by the 2006 redistribution, but not enough to take them out of the highly marginal category. The third, previously held by the ALP (Parramatta) with 50.8 per cent, lost enough (1.7 percentage points) to move it into the Coalition�s column. Moreover, in 2004 there had been special circumstances favoring the ALP which would not apply in 2007. 14 C.P.D., v.HofR 95 (22 May 1975), p.2727,

11
The two divisions notionally held by the Coalition are very different. Both are at the south-eastern end of the chain of transfers of electors, consequent on the abolition of an existing division, with which this paper will eventually be concerned and so are affected by exceptionally large numbers of electors being moved in or out. One (Calare) was in fact not held by a Coalition MP but by an Independent, and its two-party-preferred vote is an artificial construct produced by recounting the ballot-papers for their Labor and Liberal preferences only. Calare recorded the thinnest of Coalition majorities (50.6 per cent) in 2004 though in the real world the Independent had started with an absolute majority (50.2 per cent) of first preferences and that majority grew substantially (to 71.2 per cent) on the final count where his opponent was the Liberal candidate. However after the 2006 redistribution the two-party-preferred Coalition vote in the new Calare had increased so substantially (by 8.9 percentage points) that the Independent incumbent�s future at the 2007 election was brought into doubt. Initially he indicated that he might stand for the Senate instead, but then ill health required his retirement from political life. The incident has implications for the choice of electoral systems that lie beyond the scope of this paper.15 The other Coalition-held division (Greenway) is a simpler story. An even larger increase (by 10.8 percentage points) in the Coalition two-party-preferred vote moved the division into the �safe� category with 60.8 per cent of the two-party-preferred vote. In addition to those five divisions, there were 18 (seven ALP, eleven Coalition) where the winner�s two-party-preferred vote lay between 52 per cent and 60 per cent in 2004 and so might be thought potentially marginal. In only one ALP-held division did a hostile swing exceed 2 percentage points, and there (Werriwa) the seat remained safe. In only two Coalition-held divisions did the hostile swing exceed 2 percentage points, and both are interesting. In Macquarie the swing (9.4 percentage points) was large enough to move a previously fairly safe seat into the ALP column, but that division was sandwiched between Calare and Greenway and so was part of the major upheaval following on the need to abolish one division to be discussed below. In Wentworth, the other division, the adverse swing (3.0 percentage points) was much less, but for some time Wentworth had been an isolated Liberal island surrounded by ALP territory and the sea, and thus vulnerable to any redistribution that required its enlargement. It now had an additional reason to be of interest, a new MP who was spoken of as a potential Prime Minister. On this occasion its final boundaries were modified very slightly from the original proposals.16 Overall then, the redistribution in New South Wales had minimal party political implications. Where there were any, they appeared to be connected with the decision to make one division (Gwydir) disappear, a matter to which we will return. Queensland may be disposed of more quickly. There was only one division won by less than 52 per cent and it was unaffected. There were 15 (six ALP, nine Coalition) between 52 per cent and 60 per cent, and only one experienced a change greater than 2 percentage
15 Rodney Smith and John O�Mahony, 2006, �The cartel parties model and electoral barriers,� in Ian Marsh (ed.), Political Parties in Transition?, Sydney, Federation Press, pp.94-115. 16 2006 Redistribution of New South Wales Into49 Electoral Divisions, Canberra, Australian Electoral Commission, p.12.

12
points, Hinkler where the Coalition gained (3.4 percentage points) and again it was a consequence of the appearance of a new division (Flynn). There is not much partisan advantage to be seen. Characterising redistributions We can turn now to what will be the main theme of this paper. The federal system of redistributing divisions over the century since it was invented has had a history of matching the harsh realities of Australian geography and demography with Australian popular values of fairness and equality. It is a task which has been especially difficult in areas where those realities press hardest. The record for each of the two States will be divided into three sections corresponding to the original size of the House of Representatives (1901-48) and its two subsequent enlargements (1949-83 and 1984-present), and each redistribution dealt with separately whether or not it came into effect subsequently. There is little by way of precedent for the examination of such a series of redistributions. Looking first at individual redistributions, which begin as a set of proposals for that redistribution, listing every movement of electors from one division to another would swamp the story with detail, even though occasionally chains of relatively small transfers may be significant. Similarly, if the data were presented as a matrix of all possible exchanges at the redistribution, particularly for the New South Wales data when many divisions would have only a couple of neighbours in the area now of interest and could not engage in direct transfers with the majority of seats in the matrix. It would be better to work towards a few statistics extracted for this purpose from the reports, and these have been consolidated in tables in the Appendix. The first statistic must indicate the extent to which the boundary of the area containing the very big divisions has been affected. It goes to the question of how different the area which is the focus of discussion here is from the neighboring divisions (the names of which are italicized in the tables summarising particular redistributions), and measures the extent to which the redistribution respected the existing boundary of that area, or moved electors across that notional line into or out of the area. A percentage of the quota applying at that redistribution is the most suitable figure, as it is also for some other matters, because over the century under review absolute numbers have changed substantially. In 1903 the quota for New South Wales was 22 684 and the permissible minimum below it 18 148; in 2006 the equivalent figures were 87 931 and 79 138. The permissible 20 per cent variation from quota in 1903 had been cut to 10 per cent by 2006. For the other state, Queensland, in 1903 the quota was 24 678 and the permissible minimum 19 742; in 2006 the quota was 85 220 and the permissible minimum 76 698. Given it is the big divisions with which the paper is concerned, only the permissible minimum is relevant but had it addressed, say, outer suburban divisions the permissible maximum would have been required as well. A hundred years ago the electors were much fewer in number but, as should soon become apparent, the arguments about the divisions to which they were allocated have remained much the same.

13
The second statistic, which has been anticipated in very recent redistribution reports, is the proportion of electors remaining in the same division for each division in the area of interest. The third is how many and which divisions were �unchanged�, �slightly changed� or �substantially changed�, or �abolished�. For this purpose, a substantial change has been taken to occur when <75 per cent of electors remain in their original division. The label �unchanged� does not mean that the division is exactly as it was before. Usually new electors will have been added, and so the label is most often applied to divisions which were low on enrolment and have been added to. A fourth statistic identifies transfers either in or out of a division on a scale likely to affect its character. An arbitrary 25 per cent of the current quota has been adopted as the minimum for either sort of transfer to be �significant� and again it should be remembered that when one of the divisions involved in such a transaction lies outside the big divisions� area its name will be italicised. Inevitably for a marginal seat a gain or loss much smaller than 25 per cent of quota can affect the result. Except for the quota and the permissible minimum which applied at that redistribution, figures are rounded to the nearest hundred and percentages to the first decimal place. Anyone wishing to follow the story with maps can turn to G. Rhodes, I. Duncan, C. Pennyfield and E. Syne, Commonwealth of Australia 1901-1988: Electoral Redistributions, the contribution of the AEC and the Australian Surveying and Land Information Group, Department of Administrative Services, to the Australian Bicentenary celebrations. However failed redistributions are not included there. Post-1988 boundary changes, initially those proposed and subsequently those which were implemented, are recorded in outline in the AEC�s occasional publication, Electoral Newsfile, starting at Number 15 (August 1991). Detailed maps are contained in the commissioners� reports starting with 1968, at which point the �commissioners� are re-titled �distribution commissioners,� and this applies to the �lapsed� redistributions of 1975. A comprehensive list of all redistributions of the States and Territories, identified up to 1983 as �accepted� or �rejected� or �lapsed� because of Parliament�s role in the process, can be found in the latest Parliamentary Handbook of the Commonwealth of Australia. The malapportionment record There might be a reasonable expectation at this point that the paper could be in large part about malapportionment. There was certainly discussion about �fairness� during the 2006 redistribution � so what about �equality�? How much weightage was traditionally, or recently, given to the divisions which were large in area? Was there much difference in practice between New South Wales and Queensland? Was malapportionment likely to vary over the life of a particular redistribution? A variety of measures of malapportionment for the House of Representatives as a whole 1901-84 have been published,17 but as they are not broken down by State they would be of little assistance here. 17 Colin Hughes, A Handbook of Australian Government and Politics 1965-74, 1977, Canberra, Australian National University Press, pp.129-35, and id., 1986, A Handbook of Australian Government and Politics 1975-84, Sydney, Australian National University Press, pp.225-26.

14
The rest of the paper looks at redistributions and their enrolment numbers at the point of time when the redistribution figures were finalised in a report by the commissioner(s) and, prior to 1984, given to the responsible minister to present to the Commonwealth Parliament. Whether that report was ever accepted and the numbers it sought to change were put into effect is a different matter and will be specified. The paper is intended to show how those charged with conducting a redistribution of a particular State dealt with what will hereafter be called its �big divisions�, and not at what happened when the successors to those numbers (for enrolments inevitably marched on as soon as the new boundaries were in place) became operational at a general election, most importantly at the next general election and the elections that followed. (If a by-election has to be held after a redistribution has been effected, the roll that would have applied with the superceded boundaries has to be constructed.) �Big� is a suitable label for those divisions most distant from the State capital, mainly characterized by grazing and mining but with some agriculture and, especially, the largest in area in their State. �Rural� or �non-urban� would not be as suitable for some of them contain substantial cities like Broken Hill, Dubbo, Albury, Wagga Wagga and Tamworth in New South Wales, and Rockhampton, Mackay, Townsville and Cairns in Queensland. It is area, coupled with distance from the main center of population and of public life, that matters, and that most sharply defines the two areas which are the focus of this paper. However, before getting around to them, this section of the paper will look at the enrolment numbers which applied at the 41 general elections for the House of Representatives 1901-2004. A simple statistic for that purpose is the ratio between the average enrolment of the big divisions and the average enrolment for the whole State, expressed as a percentage. It should be remembered that, because of the relatively small numbers of big divisions involved, the enrolment size, whether much bigger or smaller, of one division can distort the combined statistic that describes all four or nine (depending on which State is being examined, Queensland or New South Wales). That record shows that in the past there was almost always some degree of weightage for the big divisions. At only four elections did the bloc of big divisions in New South Wales have a higher average enrolment than the State as a whole; for Queensland the number is six. All but one (NSW 1913) of these occurred after 1983. But the degree of difference has never been very large: at only two elections (NSW 1901, 1903) did the big divisions fall below 80 per cent of the statewide figure � with 78.1 per cent the lower of the two. From 1949 onwards the big divisions� weightage within their respective States was reduced and after 1984 it could be negative. As for the possibility of malapportionment within the big divisions� areas in the two States, it is obvious that those largest in area were relatively advantaged prior to 1984. The statistics that follow come from the redistributions� final reports and any earlier exercises are disregarded, but include the lapsed and defeated redistributions before 1984. In New South Wales, the division of Darling invariably had one of the two smallest enrolments up to and including the 1968 redistribution, and Riverina was most frequently the other. Divisions in the eastern part of the area rarely made it in to the two-smallest-
15
enrolments category whereas the division with the largest enrolment, with one exception was invariably in the eastern sector of the area. In Queensland the pattern was even more pronounced. With three exceptions, the two smallest enrolments were in Kennedy and Maranoa (provisionally labeled �Flynn� in 1975), and with four exceptions the largest enrolment was Herbert�s. Whether or not those outcomes indicate a growing convention to look after the largest among the big divisions that was thought binding by the redistribution commissioners, they certainly contributed to a folk-memory along that line amongst rural politicians. The second enlargement of the House, coincident with the 1983 redistribution, marked a clear diminution of big division weightage. In the subsequent eight elections, only one falls below 95 per cent for New South Wales and none do so for Queensland, whilst as already indicated three NSW elections and six Queensland elections are above the 100 per cent line. The explanation for this phenomenon is simple. In 1983 a further quantitative requirement had been added to the CEA which required the commissioners to �as far as practicable, endeavour to ensure that, 3 years and 6 months after the making of the determination, the number of electors enrolled in each Electoral Division � will be equal.�18 That formula has evolved to today�s more complex �would not, at the projection time determined under section 63A, be less than 96.5% or more than 103.5% of the average divisional enrolment� (s.66). The intention was to introduce a form of handicapping to the system: those divisions which would grow slowly or even decline in enrolment would start with larger enrolments, those which would grow rapidly started with smaller enrolments. Spread over three elections all divisions in a state should average out about the same, and so their electors would have roughly equal electoral power in that longer run. The addition ruled out any attempt to advantage the majority of rural divisions, which on past form would grow slowly if at all, by ensuring that their enrolments would be set at quota, below it, or well below it. Those on the coast which were likely to grow steadily, even rapidly, would be started back in the field and move up. The original formula of �be equal� was, of course, unattainable if strictly applied, and it was necessary to guess how much deviation a judge might accept as inevitable if judicial review of proposals was sought. A figure of plus or minus 2 per cent was selected and applied, and after the event inserted in the CEA. That figure was subsequently raised to 3.5 per cent, and eventually was subject to an ad hoc inquiry by the JSCEM.19 Because the big divisions were more likely to decline in enrolment, relatively, at a redistribution they would be put above quota, sometimes well above, and might still be there at the first election after the redistribution. At the next election their enrolments would decline towards the statewide average and at the third, and final in the life of that redistribution be below that average. Thus, over the eight elections since the change, the big divisions of New South Wales recorded 100.5, 99.5 and 95.9 per cent of their State�s
18 Commonwealth Electoral Legislation Amendment Act, no.144, 1983, s.25Z9(4)(a). 19 Joint Standing Committee on Electoral Matters, Report on the Effectiveness and Appropriateness of the Redistribution Provisions of Parts III and IV of the Commonwealth Electoral Act 1918, 1995,Canberra, AGPS.

16
average during the life of the 1983 redistribution, then went back up to 107 per cent after the 1992 redistribution, and down again 98.2 and 94.8, most recently up to 100.8 after the 2001 redistribution and down again to 99.7 per cent. In contrast Queensland successfully completed only one full three-election cycle, with big division figures of 102.7, 101.2 and 98.3 per cent, after which successive changes in the State�s number of seats and consequent redistributions in 1994, 1997 and 2003 ensured it kept conducting the first election at which the new formula would put the big divisions above quota, after which acquisition of an additional seat sent the State back to the start of the cycle again. The question whether anything can be done about the Queensland phenomenon will be raised at the end of the paper. New South Wales 1901-48 In the absence of Commonwealth legislation under which the job could be done, four of the six colonies, about to become States, had their initial House of Representatives electoral boundaries drawn for them by their colonial, subsequently State, parliaments. In the case of New South Wales the process created nine divisions (out of 26 for the whole State). For the time being, they might have been labeled �inland� because they did not reach the coast or were not within, or substantially overlapping, the Sydney and Newcastle urban areas. This paper focuses on the nine divisions, although two neighbouring divisions, Robertson and Werriwa, frequently return to play small parts with swaps across the notional area boundary. Table 1 identifies the original nine and the new divisions introduced subsequently, that existed at the beginning of each of the three periods defined by House of Representatives membership size. The exclusion of coastal divisions removes the division of Eden-Monaro which might otherwise have appeared to be of interest, but as will appear below its involvement with the divisions that are included was relatively limited and its economic fortunes and enrolment numbers followed a different path. Te 1903 redistribution In 1901 three divisions, Barrier, Darling and Gwydir, bordered on Queensland; two, Barrier and Riverina, bordered on South Australia; and two, Riverina and Hume, bordered on Victoria. Drawing the boundaries of those five divisions was constrained to that extent; s.29 of the Commonwealth Constitution says House of Representatives divisions may not cross state boundaries. The 1906 commissioner wrote:
[I]n considering these [extra-Metropolitan] Divisions as a whole, it is necessary to begin from the outside, and, with the whole of them constantly kept in sight, to work inwards, the outside boundaries of the State being immovable lines.20
20 Report by the Commissioner (Judge Murray) appointed for the purpose of Distributing the State of New South Wales into Electoral Divisions, 1906, C.P.P., v.2, No.7, p.33.

17
Table 1 NSW divisions 1901 1949 1984
Barrier √ - - Bland √ - - Canobolas/Calare √ √ √ Darling √ √ √ Gwydir √ √ √ Hume √ √ √ Macquarie √ √ √ New England √ √ √ Riverina √ √ √ Farrer - √ √ Lawson - √ - Parkes - - √
The other four divisions did not reach an inter-state boundary, New England (which missed it narrowly), Canobolas, Macquarie and Bland. When boundaries had to be redrawn those divisions could expand or contract in any direction, and as we will see it is also possible to start in the middle of the area and then move around the periphery, clockwise or anti-clockwise. Under the State legislation, its Federal Elections Act 1900, the NSW legislature had not been bound by any restrictions on permissible deviation from the State�s quota when drawing the first boundaries. The three westernmost of what were to be the big divisions, Barrier (22.9 per cent below quota), Darling (25.3 per cent below), and Riverina (23.2 per cent below), came into existence already exceeding what would become in 1902 the permissible 20 per cent deviation below quota. Only one big division, New England, was over quota and that by only five percentage points. In 1903 Commonwealth legislation had been passed and electoral officials appointed, and the first federal redistribution could begin. With the �Federation Drought� as his backdrop, a single commissioner, William Houston, was put to redrawing the NSW boundaries. The new CEA 1902 had imposed several important rules. The commissioner had to place his proposals before the Parliament where either chamber could reject (or fail to pass) them and tell him to try again. A set of qualitative criteria had to be given consideration in the process, and there was a criterion which was binding, the 20 per cent permissible deviation. The quota was 22 680 and the permissible minimum 18 148. The number of electors (which he called their �quantity of electoral power�) in the State had just been more or less doubled by the enfranchisement of women, but the big divisions contained more males than females and so benefited less, and the intense drought had driven out many electors who had settled in the good years. Houston�s report21 does not follow what was to be the regular practice of redistribution commissioners from the 1912 redistribution onwards, providing convenient information for each proposed division of 21 Report of the Commissioner (Mr. William Houston) appointed to distribute the State of New South Wales into Divisions, 1903, C.P.P., v.2, No.42.

18
its electors coming in and where they came from, and its electors going out and where they went. The federal roll was very new, whereas the role the old State electoral districts had played in the construction of divisions for the 1901 election was still obvious and he often spoke of them. On the other hand, the 1903 report did contain detailed explanation and argument for his proposals, a desirable practice that would soon atrophy. It warrants generous reporting, as the first of its line and because of its similarities with the most recent report in 2006. Houston declared his statewide assumptions: when more favorable seasons returned, the country population would grow, and in any event suburbs would expand and the inner city population contract. However, the limitations of the quota had prevented giving �as full effect as was desired� to the qualitative criteria. Although the number of divisions allocated to New South Wales remained unchanged, the nine big divisions were collapsed into eight. One, Barrier, would disappear and the commissioner explained why in language very like the arguments abroad in 2006:
25. As the revision approached the western limit of the State, the complications incident to the recession of population, and the small ratio of increase of electoral power, as compared with the high ratio in the eastern division, became more manifest. 26. In addition to this, examination disclosed isolated centres or knots of voting power, more or less remote from each other, and scattered over immense tracts of country, at the best of times never more than sparsely populated but, at the present, practically depopulated. 27. The extraordinary condition of thing[s] in the western division, and the slight accretions of electoral power in that division, as compared with other parts of the State, conjoined with the operation of the quota, produced a situation of almost insuperable difficulty in regard to electoral division.22
The westernmost part of New South Wales then comprised three divisions: Barrier with 15 200 electors, Darling with 12 100 and Riverina with 14 900, a total of 42 200. The commissioner boiled them down to two, Darling with 18 400 and Riverina with 18 900, a total of 37 200, and shipped the leftover 5000 away in small (and explained) packets to the four divisions that lay to their east. The proposed Darling and Riverina were the last two divisions discussed in his report, and they had a lengthy defence:
Many of the difficulties experienced up to the present stage have been due chiefly to the necessity for an adjustment of boundaries to provide for the relief of a congestion of electoral power within thickly-populated areas of comparatively small extent. The situation now to be faced rests, for the most part, on conditions absolutely the converse of the above, as, dispersed over an area of nearly one-half of the State, there can be found only 37,248 adult electors.23
22 Ibid., p.6. 23 Ibid., p.11.

19
That meant only two divisions could be formed, but there was a further problem in that two-thirds of that number were to be found in a few widely-separated centres. Broken Hill contained 12 000 electors, half a quota, after which there was a considerable drop down to the seven centres between 1000 and 2000 and another six with fewer than 1000.
Looking at the pursuits and interests of the people in this part of the State, and especially the sporadic distribution of the voting power, it seems impossible to avoid the inclusion, in one or other of the two new divisions, of unsympathetic elements. The design which has been adopted, though far from symmetrical, provides, as far as practicable, that common interests are preserved in each division. The only departure from this principle exists in the southern division [Riverina] � 24
Unfortunately the paucity of numbers relating to transfers in this report rules out the calculations that can be derived from subsequent reports. In the event the 1903 report was not implemented and special legislation was passed to preserve the original divisions for one more election. On 14 August 1903 William Lyne (who had given up ministerial responsibility for electoral matters three days earlier) moved �That this House disapprove of the proposed distribution of the State of New South Wales� on the ground that the drought had depopulated certain areas:
Though I have the fullest confidence in the Commissioner, I venture to affirm that if any honourable member will study the electoral map submitted, and will carefully note where a country electorate has been taken away, he will find that the legislative provision relating to community of interests has not been respected, and that the condition obtaining in one part of a district are entirely different from those which prevail in another part. In this connexion I might instance the inclusion of the lower Riverina country, whose interests are both pastoral and agricultural, with towns like Cobar and White Cliffs, where, it is true, there is light pastoral country, but where the bulk of the people are miners.25
Lyne added that a candidate in that division would have to pass through both Victoria and Sydney to visit all its parts, depending as he would have to on the existing railway system. His motion was amended to add �in order that a fresh distribution be proposed by the Commissioner of the State�, and the amended version passed 31-15, Protectionists and Labor defeating Free Traders.26 The brief debate on the rejection motion also raised questions about the suitability of George Lewis, the new Chief Electoral Officer, for that office and his previous career in the State�s Department of Lands, and about the condition of the rolls (in effect, whether all those electors had really left the area or might the rolls be defective). In Lewis� favor he had been closely involved with introducing the NSW
24 Ibid., p.12. 25 C.P.D., v.15 (14 August 1903), pp.3643, 3646. 26 Ibid., p.3669; (31 August 1903), p.3785.

20
innovative model of redistribution machinery and one of the three who undertook the original 1900 federal distribution. It was asked whether three commissioners might not do a better job than one had just done.27 The 1906 redistribution In 1906 Judge C.E.R. Murray, a �frequent royal commissioner,�28 was appointed to try again with New South Wales having been awarded an additional seat. By then the westernmost trio, Barrier, Darling and Riverina, had grown to 50 000 electors in total, but with the quota at 24 936 each of the three was still on or below the permissible minimum of 19 949, and again there was need to abolish what was being called an �extra-Metropolitan� division. In his report29 the commissioner came at last to the western end of the State.
It is at this stage necessary to consider how the great western country can be disposed of, with its very small and scattered population, though with a concentrated mass at Broken Hill; hemmed in, as it is, by Queensland, South Australia, and Victoria. Where population is so sparse, and yet must be counted, for the purposes of distribution, by scores of thousands, the position of limiting boundaries, even though by great distances apart, is a very important element.30
Murray�s solution to the problem was very different from Houston�s (see Appendix: Table 2). Barrier, starting with 20 000 electors, was slightly topped up from the western end of Riverina, so that it now ran the whole length of the border with South Australia. Darling, with only 14 200 needed more assistance and was topped up with a significant from the western end of Robertson, a division outside the area, and smaller numbers from Canobolas and Gwydir. Instead of using only the three most troublesome divisions to resolve his difficulties, Murray chose to dismember a division further east, Bland, which with only 19 800 electors was just below the permitted minimum. Bland provided significant transfers to Riverina which had started with only 16 000, thereby disposing of the remaining hard case among the westernmost three, and to Canobolas, and the rest of its electors were divided between Hume and Werriwa. The process of dismembering western divisions to comply with statewide requirements had begun, exactly a hundred years before 2006. Canobolas, now pushed beyond the quota maximum, passed most of its newfound surplus on to Macquarie, and because it had been so drastically altered by the exchanges was renamed Calare. This solution had been found within the area of the nine divisions, with a net transfer in that equaled only 1.6 per cent of the area�s starting enrolment, and one still dependent on putting the three westernmost divisions near the bottom of the permitted range. Murray
27 Ibid., pp.3781-84; Janet Howse, 1986, �Lewis, George,' in Bede Nairn and Geoffrey Serle (eds.), Australian Dictionary of Biography v.10, Melbourne, Melbourne University Press, pp.92-93. 28 Eds. H.J. Gibbney and Ann Smith, n.d., A Biographical Register 1788-1939, v.2, Canberra, Australian Dictionary of Biography, Australian National University, p.130. 29 Report by the Commissioner (Judge Murray)… New South Wales. 30 Ibid., p.35.

21
formulated a doctrine to justify this course, expressed in language more judicial than Houston�s.
Unless there is something to indicate the improbability of substantial increase in thinly-settled country, or the likelihood of a comparative congested population becoming denser in a ratio above the average, it may be taken as a guiding rule, within fairly moderate limits, that an extension above the quota (or the average) is justifiable in a thickly-peopled, and a reduction is appropriate in a sparsely-occupied, Division; but violent irregularities must be avoided. � It now becomes quite clear that the end of this redistribution, necessarily leaving the margins of the State to retain the individuality of their Divisions, must be a merger of Divisions about the centre.31
Perhaps, though this can only be speculation, the possibility of such little ventures into quasi-judicial activism encouraged the subsequent abandonment of explanations for decisions. With the first two redistributions having been initiated at three year intervals (1903, 1906), and thereby coinciding with a single maximum term of the House of Representatives, it was understandable that drawing boundaries that could last would be thought desirable, but how might this be achieved in practice? In Victoria the commissioner had thought the limits of the permitted range should be avoided lest they be breached too soon:
This provision [the 20 per cent variation], I think, makes it obligatory on the Commissioner to leave in each proposed division a sufficient margin below the maximum number of electors, and above the minimum, to prevent any probable movement of population within a few years, bringing about the condition mentioned in the provision, since frequent changes of the boundaries of electorates are inconvenient, and to be avoided as far as practicable.32
But in Western Australia the commissioner preferred putting them all near the quota:
� I have endeavoured to maintain as close an agreement with the quota as was consistent with such [qualitative criteria] considerations, in the first place that appeared to be the intention of the Act, and, in the second, because such a course would, in all probability, obviate the necessity for a further redistribution in the near future, it being evident that the more extensive use is made of the margin of allowance the greater is the likelihood that fluctuations in population will, at no distant date, cause that margin to be exceeded.33
31 Ibid., pp.33, 36. 32 Report by the Commissioner (Mr. C.A. Topp) appointed for the purpose of distributing the State of Victoria into Electoral Divisions, 1906, C.P.P., v.2, No.8, p.4. 33 Report by the Commissioner (Mr. M.A.C. Fraser) appointed for the purpose of distributing the State of Western Australia into Electoral Divisions, 1906, C.P.P., v.2, No.10, p.5.
22
So long as each State was dealt with as a separate exercise by a different person, minor variations in approach were likely. If nothing was said by way of explanation, these would be less obvious. The 1906 proposals were duly accepted. The three 1912 redistributions In 1912 the CEA had been amended to adopt the original NSW state model and hereafter three commissioners were appointed. In New South Wales the State�s Surveyor-General, F. Poate, was chairman.34 There had been no change in the State�s number of seats but statewide enrolment had increased by 39 per cent, the quota was up to 34 657 and the permissible minimum grown to 27 726. In the western part of the State solutions were relatively non-threatening and certainly easier to produce, and the process was further assisted by a significant net transfer of electors into the area. Whilst a few transactions were substantial, none reached our measure of �significant�, and only two divisions would be �substantially� altered. Calare would lose 11 500 and gain 9700, and Macquarie with 5100 out and 12 700 in. The report was dated 15 October 1912 and on 29 October some very minor corrections were communicated to the responsible minister, which had the unfortunate effect of suggesting excessive haste in the main report (see Appendix: Table 3). It was at this point that commissioners generally stopped recording explanations for what they proposed. The responsible minister, King O�Malley, moved approval of the NSW proposals in the House of Representatives on 31 October where the motion passed 25-24. The Opposition had asked for another distribution on the ground of disregard of community of interest in the proposals, and referred to the fact that a State redistribution was also under way. Tasmania, it was said, provided a good model where Commonwealth and State boundaries were made to coincide, and it was also pointed out that the 1910 Labor Conference voting 70-51 had supported a policy for two State districts to be within one federal district. The debate is of interest for the speeches of Bruce Smith on general principles, and of the Labor members for Barrier and Riverina about their own divisions which sound remarkably like what has been said by their successors for that part of the state at regular intervals ever since.35 But when George Pearce, the minister representing O�Malley in the Senate, sought approval on 8 November the motion was defeated 12-14. In their second attempt36 the numbers to be moved became larger and the resulting changes more substantial and provided the one instance when as many as two of the area�s divisions were to be abolished (see Appendix: Table 4). Macquarie and Riverina were each carved into three portions, and like Bland before them would vanish from the electoral map. Darling, the third westernmost division, would be topped up from Calare. Gwydir, instead of being left pretty much alone as in the first version, would retain less than half its current enrolment and, after being topped up from New England and
34 Report by the Commissioners appointed for the purpose of distributing the State of New South Wales into Electoral Divisions, 1912, C.P.P., v.2, No.48. 35 C.P.D. v.47 (31 October 1912), pp.4921, 4925-27, 4930-34. 36 Corrections in the Report by the Commissioners appointed for the purpose of distributing the State of New South Wales into Electoral Divisions, 1912, C.P.P., v.2., No.49.

23
Robertson, be renamed Namoi. The second report was also rejected, this time in the House of Representatives, 26-32 and by a non-partisan vote � Smith did not vote, Thomas (Barrier) was for it and Chanter (Riverina) against. A third attempt was then directed.37 That report38 reverted to the first report�s proposals, was accepted without debate,39 and implemented as the 1913 redistribution (see Appendix: Table 3 again). The first and second reports nicely illustrate the minimalist and maximalist modes of redistributing: the first with one division substantially changed and no substantial transfers, the second with three substantially changed divisions � one so substantial its name has to be changed � and one division disappearing and six substantial transfers. The explanation is to be found in the first line of the tables in the Appendix. In the first exercise the big divisions� area as a whole gained half a quota, in the second it lost three-quarters of a quota. The 1922 redistribution By 1921 long-term demographic changes were again at work and New South Wales had gained a seat, up to 28. The quota was 39 478 and the permissible minimum 31 583. However two of the three westernmost divisions had lost enrolment absolutely since the 1912 redistribution: Barrier and Darling were substantially down and adjacent Gwydir was down as well, but the third of the westernmost divisions, Riverina, had grown a trifle. The mining and pastoral industries were still shedding employment, but irrigation was starting to counter the general trend of rural depopulation. Gwydir was becoming more like Barrier and Darling, Riverina less like them. More significant though for the number of divisions which had to be put in play was the growth of the gap between the enrolment averages of what were being called the �metropolitan divisions� and the �non-metropolitan divisions� � and would continue to be so characterised until the 1960s when the second category was subdivided between �substantially urban� and �substantially rural�. The last category later became �extra-metropolitan�. The gap, which had been less than 5000 electors in 1912, was now greater than 14 000. Clearly one or more big divisions would risk dismemberment to accommodate growth in the rest of the State outside the area. The commissioners reverted40 to the second-1912 report�s strategy but with only one division going, and now there was a modest the extension of the area (see Appendix: Table 5). Barrier should be divided between Darling and Riverina, and disappear. Riverina should make small adjustments with Darling, Calare and Hume and still be slightly ahead at the end of the swaps. Gwydir was also in deficit to begin with, but not as far down as Barrier and Darling and after receipt of a net 10 800 from Darling had an increased in enrolment at the end.
37 C.P.D., v.49 (15 December 1912), p.7505. 38 Further Report (No.3) by the Three Commissioners appointed for the purpose of re-distributing the State of New South Wales into Electoral Divisions, 1912, C.P.P., v.2, No.70. 39 C.P.D., v.49 (20 December 1912), p.7570. 40 Report by the Commissioners appointed for the purpose of redistributing the State of New South Wales into Electoral Divisions, 1921, C.P.P., v. 2, No.20.

24
The 1931 redistribution In 1930 redistributions were started in four States, the three largest in population and Western Australia. The usual practice would have been to wait for the census due in June 1931, but as that had been postponed as an economy measure in the growing crisis, it had been decided to start earlier.41 Unusually Stewart Irwin, who had served in 1922 as the CEO for New South Wales, was the Electoral Office member of the commission although now he was Chief Electoral Officer for the whole country.42 The selection may have been intended to utilise his knowledge from the previous event. There were still 28 divisions to be defined. The quota of 51 776 and the permissible minimum of 41 421 were now more than twice the equivalent figures for the first redistribution conducted in 1903. The gap of 3000 between �metropolitan� and �non-metropolitan� averages that had been left by the 1921 redistribution had blown out to 9000 by 1930, and the Commissioners sought to compress the gap to 4500 (see Appendix: Table 6). Their proposals submitted in 1931 were not approved, despite regular inquiries in Parliament as to how the matter was progressing, and so attention can be concentrated on what were now the three worst-cases, the two divisions previously in that category, Darling and Riverina once Barrier was gone, joined now by Gwydir. In the 1931 proposals Riverina was to be left alone, apart from two minor additions totaling 300 electors. Darling would lose about 4000, equally divided between Calare and Gwydir, and from Gwydir gain over 10 000. Gwydir, because of those changes plus another 1400 going to Calare, would be compensated by 15 600 coming 2000 from Darling, 5000 from New England, and 8500 from Robertson. The sole �significant transfer� restored a numerically viable Macquarie with electors from Robertson which was being abolished in order to create a new suburban division. The new Macquarie would have extended from Gosford and Wyong to Bathurst, after which its inclusioin in the big divisions� area would have been problematical. Exceptionally, the 1931 commissioners quoted a bit of input to their deliberations, a �protest� from the leader of the federal Country Party, Dr Earle Page, primarily about his own coastal division of Cowper but with wider implications:
That the proposed redistribution of Federal Electorates imposes unfair conditions upon the Electorate of Cowper and upon the Electors and Representatives of Country Electorates throughout the Commonwealth by reason of the failure of the Commissioners to use the power of discrimination granted under the Act in fixing the quotas for Country Electorates as near as possible to 40,000 and the quota of City Electorates as near as possible to 60,000.43
41 C.P.D., v.126 (31 July 1930), p.5076. 42 Report by the Commissioners appointed for the purpose of redistributing the State of New South Wales into Electoral Divisions, 1931, C.P.P., v.3, No.159. 43 Ibid., p.5.
25
The commissioners responded in their report that they had applied the Act. The 1934 redistribution There was a change of government in 1932, and the redistribution machinery was started up again in 1933 with the same number of divisions to work with. The quota was 53 115 and the permissible minimum 42 412. In the meantime the gap between �metropolitan� and �non-metropolitan� averages had fallen to 7500, which may be evidence of the flight from the cities during the Great Depression. An unusually large addition to the area was made.44 Riverina was again barely touched, and Darling gained a net 8600 from Gwydir which would be the most substantially impacted of the largest three, losing on its western boundary, mainly to Darling, and gaining on its eastern boundary from Robertson and New England (see Appendix: Table 7). Robertson, which was not abolished this time, restored New England with the redistribution�s one �significant transfer� and consequently had to move to Sydney�s northern edge where it has stayed. The proposals for New South Wales were accepted by Parliament, but Victoria had to be done again and Western Australia was done again twice and not finalized until 1937. By the last election (1946) held on the 1934 boundaries, five of the seven western divisions in New South Wales were slightly under the 20 per cent below average divisional enrolment, New England was just above the cut-off and Macquarie substantially above the cut-off but still below the average enrolment. Had there been a redistribution conducted at that time, only minor adjustments would have been needed, but instead the size of the House was increased from 75 to 120. New South Wales 1948-83 The 1948 redistribution Between 1934 and 1948 enrolment in New South Wales grew from 1.4 million to 1.9 million, but as the number of divisions allocated to the State was increased in 1948 from 28 to 47 the redistribution quota fell. It was not until 1962 that the quota and permissible range figures got back to twice what they had been in 1903 once more � which is where they had been before the enlargement in 1948. The substantial reduction in the quota removed the usual pressure to abolish a division somewhere in the western part of the State and lowered the minimum number of electors required to constitute a division to 32 013.45 The starting problem of all the previous redistributions was reversed. Two additional divisions could be created in the big divisions� area, and for once the usual suspects for abolition were able to function as net givers and �substantial transfers� were plentiful (see Appendix: Table 8).
44 Report by the Commissioners appointed for the purpose of redistributing the State of New South Wales into Electoral Divisions, 1934, C.P.P., v.2, No.233. 45 Report by the Commissioners appointed for the purpose of redistributing the State of New South Wales into Electoral Divisions, 1948, C.P.P., v.5, No.30.

26
Darling could provide 14 500 to one of the new divisions, called Bligh by the commissioners but its name was changed to Lawson by Parliament, and a further 4200 to Riverina and 300 to Gwydir. After being topped up with 3300 from Calare it was still a couple of thousand above the minimum. Riverina contributed 6000 to the second new division, which the commissioners proposed naming Farrer, and 8700 to the division they called Hume which had been the principal donor to the creation of Farrer, and was still comfortably above the minimum. Parliament subsequently swapped the two names around, designating as Farrer the southern division which contained both Albury and Wagga Wagga, and retaining the name of Hume for its northern neighbour which extended further along the Hume Highway. The third of the westernmost divisions, Gwydir, received 300 from Darling and another 1500 from New England but, after giving a massive 14 600 to Bligh-Lawson, was still well above the minimum. For the first time there could be new divisions in the big divisions� area, two of them, and that could happen even though there was a substantial net loss of electors transferred out of the area. The old Hume had provided two-thirds of the enrolment of the new division which the commissioners proposed calling Farrer, and ordinarily that would have been a good reason for still calling it Hume. But the old Hume also had provided three-quarters of the enrolment of the division the commissioners wanted to call Hume, and that might have been thought a stronger case. By contrast the new division further north, Bligh-Lawson, received its electors in almost equal amounts from Darling and Gwydir, plus lesser numbers from Calare and New England, and clearly required a new name. Overall it appeared that, half a century on, the big divisions� area in western New South Wales now included a south-eastern corner which was growing more rapidly than the rest of the area, even if that corner was not keeping up with the coast in general and the Newcastle-Sydney-Wollongong urban conglomeration in particular. With the massive changes that creation of two new divisions involved, it was not surprising that the percentage of electors remained in their original divisions was low. The 1955 redistribution The government changed in 1949 and a redistribution was started in 1954 with a quota of 43 482, but in so short a period of time minimal alterations were needed in the western part of the State, mainly tidying up based on electoral experience since 1949 (see Appendix: Table 9).46 Whilst New South Wales had lost a seat, down to 46, the permissible minimum had risen only to 34 786, and none of the nine big divisions was below that figure. Darling, which had been created close to the permissible bottom of the range in 1948, was within a thousand of the new figure and was given that many more electors. The most altered division, Macquarie on the area�s eastern edge, still retained 84.5 per cent of its original electors. When the new boundaries were put to the House of Representatives in May 1955, they produced an outburst from Eddie Ward � who was quite satisfied with what had happened to East Sydney � that was unusual for the allegation made: 46 Report by the Commissioners appointed for the purpose of redistributing the State of New South Wales into Electoral Divisions, 1955, C.P.P., v.2, No.65.

27
But I must say, even if I hurt somebody�s feelings, that I believe that considered upon a State basis these are the worst boundaries, from the viewpoint of an impartial consideration of such an important matter, that could possibly be fixed, and I have no hesitation in saying that this is probably the greatest illustration, at least in Commonwealth history, of the gerrymander of electorates.47
As to general principles he agreed with the point made in the earlier debate about Queensland boundaries that the 20 per cent margin should be reduced, but he specified a matter concerning one of the inland divisions, Lawson. There had been, Ward said, a transfer of Coonamble from that �very precarious seat� to Darling �already strongly held by Labour.� (pp.1317-18). That brought out Lawrence Failes, Member for Lawson for the division�s entire life 1949-69, who dealt with an aspect of the allegation that was not immediately apparent in Ward�s speech but presumably circulated in the parliamentary corridors:
At the outset, let me say that I resent very strongly the veiled suggestion of the honourable member for East Sydney that I was a party to an attempt to influence the commissioners in my favour. The commissioners gave me the courtesy of an interview. After meeting them, I do not believe that they are the type of men who would be influenced by any one. I lodged an objection and was granted permission to discuss it with the commissioners, but my objection was not upheld. Indeed, the original proposed redistribution of the Lawson was not altered. (pp.1318-19)
He added that Ward had referred to Coonamble where Failes was behind by 370 votes, but failed to mention additions to the division where Labor was 540 ahead, so he had lost ground overall on the changes. The predominant interest in the latter was mining, and the debate then moved on to which of the mines were still operating. The exchange nicely illustrates how selective use of readily available evidence can cloud electoral debates. Ward�s suspicions were backed by Les Haylen who spoke of �an ironclad gerrymander� evidenced by the Victorian division held by the Prime Minister which had been left unaltered. Another member for one of the big divisions, New England�s David Drummond, wondered if changing the machinery to a judge assisted by assessors from the political parties might make outcomes more acceptable (p.1325). The report was subsequently adopted on a party vote.48 The 1962 redistribution By 1962 the same government was still in office but it had had a nasty shock at the 1961 general election, surviving by only one seat. Despite the post-war population boom New South Wales was due to lose a seat on the 1961 census figures, as were two other States; 47 C.P.D., v.HofR 6 (1 June 1955), p.1315. 48 Ibid., (6 June 1955), p.1334.

28
Victoria was to gain one. As a consequence of the two factors the NSW quota had risen to 48 363 and the permissible minimum to 38 690.49 Only Darling was below the permissible minimum, but no big division was anywhere near equaling the quota. Once again it would be necessary for the big divisions� area to lose a seat, and again Gwydir was chosen to be that division (see Appendix: Table 10). The other two westernmost divisions, Riverina and Darling, would require only topping up by a couple of thousand. Riverina�s gain involved only Farrer which in turn would take more electors from Hume, but Darling�s exchanges were slightly more complicated as they involved Gwydir and Lawson, the two divisions proposed for the most drastic changes. Gwydir�s other major beneficiary, New England, had to export surplus electors from its western area and consequently involve the three coastal divisions north of Newcastle in restoring its numbers. More usually a few hundred electors along the mountain range that separated coast from inland might move east or west as was required and substantial movements were confined to the middle of the notional boundary to the west of the Hunter Valley and Sydney. Overall the 1962 proposals sought to tip a substantial number of electors (net 5.4 per cent of the area�s original enrolment) out of the area to achieve what appeared to be their objective of keeping the big divisions clearly below the quota of 48 363. Six of the nine would have been just over 45 000, 93 per cent of the quota, and a seventh was just under. Only one (Macquarie) was near the quota at 47 000, and Darling, ever the problem child, was well below at 42 000 though still clear of the permissible minimum. However the Country Party was dissatisfied with the outcomes for divisions they held � in particular the disappearance of two safe seats, Gwydir, and Dawson in Queensland - and was ready to combine with the Labor Party to reject the proposals. That led to all six reports not being proceeded with.50 When they had been tabled, the responsible minister had proposed changing the names of two metropolitan divisions and said defensively:
These reports then are the decisions of independent men, appointed under a system devised, with the best skill which preceding Parliaments could devise, to prevent the accusation of party political considerations governing the very vital � indeed the completely fundamental � aspect of a workable democracy, namely the election of members to the Parliament.51
When the House returned to the matter, the Leader of the Opposition, Arthur Calwell, immediately moved disapproval. Variations from the quota were all over the place, and the six largest divisions in the country (which included Darling and three divisions in Queensland) had been allowed the maximum departure from the quota which did not
49 Report by the Commissioners appointed for the purpose of redistributing the State of New South Wales into Electoral Divisions, 1952, C.P.P., v.3, No.105. 50 Peter Golding, 1996, Black Jack McEwen: Political Gladiator, Melbourne, Melbourne University Press, pp.209-10. 51 C.P.D., v.Hof R 37 (4 October 1962), pp.2726-27).

29
conform to CEA provisions. He went on to refer to a unanimous recommendation of the 1959 Constitution Review Committee that the margin should be cut to 10 per cent.52 The Country Party leader, John McEwen, responded with a lengthy speech which in passing criticized the commissioners in South Australia for considering future population trends when there was no such statutory criterion, and made the case for special provisions for rural divisions:
We believe that the 20 per cent. discretionary departure from the quota, which has existed for almost 60 years, should be not only retained but also employed in a manner which will produce more healthy results for the Australian community. This provision could be used to give full weight to such consideration as means of communications. We believe also that for rural constituencies the departure from the quota should average not less than 10 per cent., and that in the gigantic electorates which have been identified � there are half a dozen of them � the departure should be 20 per cent. (p.2879)
Labor�s deputy leader, Gough Whitlam, equally eloquent, reiterated the case for more equality (pp.2879-87), after which the Prime Minister observed it was clear that the proposal was not going to be approved. As he said, whilst he was not in the mood to make an obituary speech the proposal was dead. Procedurally he could not move adjournment of the debate, so he would move that he continue his remarks at a later hour �adding for good measure that I have not the slightest intention of continuing them.� (p.2588). It might be added that an allocation of seats to States made under the constitutional provisions had not yet been recognised as justiciable. The 1968 redistribution In 1968 there had been another census and there was a different Prime Minister. The postponed redistribution took place under rules which had been modified in an important respect. In 1965 Peter Nixon, then a Country Party back-bencher but since 1967 the minister responsible for electoral matters, had put the case for making the redistribution process public with immediate access to the successive batches of public input. Consequently each of the 1968 commissioners� reports was accompanied by a separate, larger volume containing the suggestions, comments and objections lodged with the commissioners, which for the first time were contemporaneously available for commentators and students.53 There was also a slim volume containing the dissent of the Chief Electoral Officer who had chaired the New South Wales commission from the majority (the NSW Commonwealth Electoral Officer and the state�s Deputy Surveyor-General) decision on a section of the boundary between two divisions.54 New South Wales still had to lose a seat, enrolments had grown so that the quota was up to 52 805
52 Ibid., (4 December 1962), pp.2870-71). 53 Hughes and Aitkin, �The Federal Redistribution of 1968�. 54 Statement by Distribution Commissioner F.L. Ley showing reasons for dissent from proposals relating to the Divisions of Lyne and New England, 1968, Canberra.

30
and the permissible minimum to 42 244. Again a big division had to go (see Appendix: Table 11).55 Three divisions in the area were below the permissible minimum � Hume and Lawson narrowly, Darling badly so; none was up to quota, with Macquarie the nearest to it at 50 700. Of the three westernmost divisions Riverina was left untouched, Darling received modest additions from Gwydir and Lawson, but whilst the third, Gwydir, survived this time it was going to be drastically altered when Lawson was abolished (see Appendix: Table 11). In addition to several small transfers to Darling and out of the area to Paterson, Gwydir having given 10 000 to New England received 20 000 from Lawson. The abolition of that division set off a diminishing chain sequence southwards of unusual length: Lawson 14 500 to Calare, Calare 11 300 to Hume, and Hume 2500 to Farrer. The remaining bits of Lawson went to Macquarie and Paterson. The matter about which the commissioners had divided was another transfer out of the area, 2100 from New England to Lyne.56 For the first time, in another contribution to better informing any subsequent debate, the report showed the percentage deviation from quota of each proposed division and its area, its population at the recent (1966) census and population per square mile. Darling was the worst at 18.6 percentage points below quota, and Riverina, Calare, Hume and Gwydir were all more than10 percentage points below. New England and Farrer were between 10 per cent and quota. Only Macquarie was above quota at 6.1 percentage points. It is about this time that a plausible case could be made for Macquarie�s exit from the category of big divisions for thereafter its transactions with its old associates, whether in or out, became relatively insignificant � until 2006 when a big division had to be abolished. When debate began Whitlam, now Leader of the Labor Party, sought to amend the motion for adoption by adding an expression of the House�s reluctance to do so, first because of failure to recognize �inequality of population,� a point reflecting his personal preference for populations rather than enrolments when defining divisions, and to provide votes of equal value, and second for ignoring the Commonwealth Constitution�s objective �of making equal representation of equal numbers of people the fundamental ground of the House of Representatives.�57 It appears from a complaint to the Speaker by a Liberal member that Len Devine, who had recently followed Ward in the division of East Sydney which was now scheduled to disappear, interjected about �riding instructions� for the commissioners. They were defended by the Country Party�s Doug Anthony, the responsible minister before the redistribution started, who said that whilst his party was unhappy as they had lost a seat [Lawson], the redistribution had been too long delayed and:
This redistribution has been carried out by commissioners, who have acted independently and honourably and have done their job to the letter of the law.
55 Report by the Distribution Commissioners appointed for the purpose of redistributing the State of New South Wales into Electoral Divisions, 1968, Canberra. 56 Hughes and Aitkin, �The Federal Redistribution of 1968�, p.34. 57 C.P.D., v.HofR 60 (25 September 1968), p.1453.
31
Fewer aspersions or doubts have been cast on the commissioners in this redistribution than on any previous redistribution by the Commonwealth. This is mainly because of amendments that were introduced to the Commonwealth Electoral Act.58
He went on to complain that Whitlam had said the redistribution suffered from �malapportionment� rather than �gerrymander� on the ground that all three parties held country divisions. Whitlam�s amendment was rejected on a party vote, but the House then adopted a different amendment proposed by the Liberal MP who had complained about Devine�s interjection:
but regrets that the Report did not have better regard to the trend of population changes in the State, which were not applied in a uniform manner in relation to all the other factors required to be taken into account.59
The amendment was carried on party lines and the report then adopted, only to be reopened some days later to alter the name of a metropolitan division in New South Wales � and another in Victoria � to recognise two deceased Labor Prime Ministers, Chifley and Scullin. The 1975 redistribution The government changed in 1972, but the new government�s intentions for major revisions in the CEA were frustrated by a hostile Senate. Only one change managed to slip through, reduction of the permitted variation from quota from 20 per cent to 10 per cent. That was possible because the amendment had been contained in one of the Bills that constituted justification for the double dissolution of 1974, and was subsequently passed by the joint sitting of Parliament held under the constitutional provision for resolving inter-cameral deadlocks. The ALP government was returned in 1974, but did not secure control of the Senate. Nevertheless a redistribution was initiated, with the same number (45) of divisions allocated to New South Wales. Only two of the eight big divisions were by then above the new permitted minimum, Macquarie comfortably so and New England marginally. The commissioners proposed fairly substantial transactions across the area�s eastern border, but they effectively cancelled out (see Appendix: Table 12). Given the widespread shortfall of numbers with five divisions below the permissible minimum of 56 489, an existing division had to go and this time Riverina was selected. Almost four-fifths of its electors would have moved westwards into Darling, the balance north to Calare and east to Farrer. Darling, once again starting with the smallest enrolment, would receive 41 000 new electors and pass 24 000 on to Gwydir which would pass 12 000 to Paterson and so out of the big divisions� area. The seven remaining 58 Ibid., p.1464. 59 Ibid., p.1506.
32
divisions all ended up close to the quota of 62 765, a very different outcome compared to the 1968 redistribution. Darling, despite retaining only 48.3 per cent of its original electors, would keep its name. The commissioners explained:
A number of those who commented on the suggestions were objecting to any move which your Distribution Commissioners might make towards abolishing a rural division. However, after consideration of the dispersal of the population throughout the State it was obvious that there were insufficient electors in the country to retain therein the existing number of electoral divisions.60
Across the State they had abolished two metropolitan divisions and Riverina, and created three new metropolitan divisions. The responsible minister, Fred Daly, moved adoption of the report on 22 May 1975.61 He referred to the extent of public input � the commissioners had traveled to 37 centres to inform themselves directly and 13 boundaries had been altered in response to objections. But he anticipated the outcome by warning that the National Country Party leader, Doug Anthony, had said from the beginning that his party would not support any proposals despite the new legislation, and noted that the NCP had not lodged an initial submission until they had seen what was in the Liberal Party�s. Anthony came out of his corner swinging:
[The Minister�s] speeches have not been objective speeches presenting a case to the Australian people. They have reeked with party politics and they have done everything possible to poison the thinking of the Australian people against the country people and the National Country Party members who represent a majority of those people. It has been a vendetta carried out against the Country people of the nation by a person who has a political hatred of country people. The hatred reeks out of him. He cannot control himself.62
Anthony pointed out that the legislation in question was now being challenged in the High Court by the State governments of New South Wales, Victoria and Queensland, and suggested the old 20 per cent margin be written into the Commonwealth Constitution, an idea the Labor leader, Gough Whitlam, had endorsed in 1955. Gwydir and Kennedy in Queensland were mentioned, together with the traditional worst case, Kalgoorlie in Western Australia, and the rest of the world compared:
Every democratic country except Australia provides for considerably smaller numbers of voters in large, scattered electorates than in tiny, compact city
60 Report by the Distribution Commissioners appointed for the purpose of redistributing New South Wales into Electoral Divisions, 1975, Canberra, p.3. 61 C.P.D. v.HofR 95 (22 May 1975), pp.2716-20. 62 Ibid., p.2720.
33
electorates � and that includes Britain where a tolerance of several hundred per cent is provided, Canada and the United States.63
Moreover the reduction in tolerance had not only been applied, it had been taken to extremes so much so that the big enrolments were now in the country and the small enrolments in small city divisions. Finally, a new redistribution would be required after the 1976 census. The Member for Riverina added that the timetable for inputs had been too tight. The House approved the proposals by a party vote of 59-54 but when they were moved in the Senate they were promptly defeated 27-29, one of the two Independent Senators voting with the Opposition and the other absent. The Whitlam Government had anticipated this outcome, and promptly re-introduced each set of redistribution proposals embodied in a separate Bill which might then be used for the next double dissolution and so, even if the Senate remained hostile, could be carried at a subsequent joint sitting. The debates on the Bills added little to the subject, save that the deputy leader of the NCP called the legislation �the gerrymander� which the Labor Party sought to introduce, and Daly pointed out that the Labor Party currently held 20 country seats. The Bills were passed by the House and defeated in the Senate on much the same numbers as had been the original proposals. The 1977 redistribution The government was removed in the constitutional crisis a few months later, and the incoming government chose not to restore the 20 per cent limits around quota, but instead tied the commissioners� hands more firmly to the benefit of rural divisions by extending the quantitative criterion in the CEA. No division having an area of 5000 square kilometers or more should have more electors than any division having an area less than that. Effectively all rural divisions should have fewer electors than any urban division. With area now a material consideration, the table in each report which listed the proposed divisions had to add divisional areas to divisional enrolments and percentage deviations from quota. The change was applied in a redistribution of all the States only in 1977, and at a subsequent redistribution of Western Australia in 1979. Application of the area quantitative criterion had only a limited effect for New South Wales in 1977, for in the advantaged rural divisions the average enrolment was only approximately 3500 less than the average in the disadvantaged remaining divisions. Another change to the rules at this point was the requirement that allocation of seats among the States (and Territories) be calculated early in the life of each new House of Representatives, and if a change occurred then a redistribution had to take place of that State (or Territory). The second change, about timing, has applied ever since. In the eastern part of the big divisions� area, Macquarie was well above the quota of 71 149 and two other divisions, Farrer and New England, were safely over the permissible minimum of 64 035. However shortfalls further west were large enough to 63 Ibid., p.2721.

34
require that one division be abolished (see Appendix: Table 13). Large transfers both ways across the area boundary cancelled out, but the most substantial impacted on Paterson which shifted westwards, giving up 16 700 electors to Newcastle and Lyne whilst collecting 23 200 from three divisions on its western side. Nevertheless the 49 800 it retained from the old Paterson are sufficient to continue to exclude it from the big divisions area for current purposes. The division chosen for abolition in 1977 was Darling which was shared in remarkably equal portions between Gwydir (24 458 electors) and Riverina (24 709). Their consequent areas were also similar, Gwydir at 242 672 sq.km. and Riverina at 251 777 sq.km., and their enrolments similarly distanced from the quota, Gwydir 4.3 per cent below and Riverina 3.5 per cent below. Only one other division had an area that exceeded 50 000 sq.km., Hume which was just over. Macquarie, shrunk to a mere 1839 sq.km., was renamed Lawson by the commissioners, but the Parliament restored its old name. Only New England retained all its original electors, Calare and Macquarie were drastically altered, more so than the two which accommodated the break-up of Darling, Gwydir and Riverina. For the area as a whole the retention statistic was slightly lower than at the previous, rejected redistribution. The report came up for debate on 27 October 1977. Anthony was now defending the proposals against an ALP allegation that changes made after the objections had been favourable to the Liberals (in particular the former Prime Minister, William McMahon, whose seat in Sydney appeared to be marginal and was subsequently lost in a by-election after his retirement). Any �complaints about manipulations or gerrymanders� produced the rejoinder that in New South Wales the Whitlam Government had made �the five seats with the largest number of voters � enormous country electorates�.64 More to the point about possible malpractice was the intervention of a Queensland Liberal, Kevin Cairns, on the subject of divisional name changing to raise his own State�s redistribution:
I am fascinated as to what causes them to change. I say to the House I am totally convinced they [the commissioners] acted on evidence other than that presented to them in public documents.65
He went on to explain why divisional names were important in Queensland � because of the terms of the agreement on which the Coalition rested � and to point to the fact that a name had been changed prior to the final report in Queensland. That change of name was subsequently investigated by a Royal Commission.66
64 C.P.D. v.HofR 107 (27 October 1977), p.2531. 65 Ibid., p.2537. 66 Royal Commission of Inquiry: Matters in Relation to Electoral Redistribution Queensland 1977, Report, 1978, Canberra, AGPS.

35
A more reflective comment came from J.W. Sullivan, Member for Riverina, whose division on this occasion had been combined with Darling and at the previous failed redistribution had disappeared completely:
I say at the outset, that I have nothing to say against the work done by the redistribution commissioners. To put it bluntly, if we give a group of men a stupid task we must expect a stupid answer. The commissioners were given a stupid task in 1974-75. They were given a stupid task this year. Nothing will change that situation. The arguments tonight have been put forward by those who see political variations in the boundaries drawn by commissioners. After all, what is this game but a political game. If we cannot accept the decision of the umpire we should not play in the match.67
The proposals were then accepted by a low vote on party lines. New South Wales 1984-2006 The 1984 redistribution In 1983 the government changed, and the incoming government established a joint select committee of Parliament to consider electoral reform.68 Its recommendations ranged widely; two matters not previously mentioned which are particularly relevant to this study were that commissioners were required to give reasons for their proposals and area was added to the subjective criteria. Finally, the extension of public involvement in the redistribution process led to two, sometimes significantly different, set of proposals being prepared for them and subsequently published. With two sets of �reasons� now available, the commissioners� ideas and their interaction with public input became much more accessible. Enlargement of membership of the House of Representatives to 148 had increased New South Wales� entitlement to 51 seats, up eight, causing the quota to decline slightly, down to 65 907, and the permissible minimum to 59 316. Each existing division was comfortably above quota, and as the big divisions� area now contained 8.2 quotas the redistribution committee members, who included the present writer ex officio, could add a further division if they wished. Instead, in their initial proposals they stuck with seven divisions and exported the extra quota of electors by moving the area�s boundary westwards, to the benefit of Paterson and two new divisions, Gilmore and Lindsay, which were linked eastwards to the Illawarra and Sydney regions respectively. Within the diminished area they identified two main problems: the presence of two large and growing provincial cities, Albury and Wagga Wagga, in the same division, Farrer, and the character of the existing division of Riverina. The first was dealt with by surgery on Farrer and Hume, the second by reviving a division called Darling and causing Riverina to disappear.69 67 C.P.D. v.HofR 107 (27 October 1977), p.2550. 68 Joint Select Committee on Electoral Reform, 1983, First Report, Canberra, AGPS. 69 1984 Redistribution of New South Wales into Electoral Divisions, 1984, v.1, Canberra, AGPS, p.115.

36
At the area level, the proportion of electors who would remain in their original divisions, those drawn in 1977, dropped to a new low, beating the previous record set in 1948 when the first enlargement of the House of Representatives had taken place. Developments outside the area led to major changes to the initial proposals. In a cross-border transfer Paterson was to receive over a quarter of a quota of electors from Calare plus 2000 more from Gwydir, pass almost half a quota on to Hunter and thereby move westwards. At the subsequent round of hearings, the indignation that such a change to Paterson had produced led the augmented commission to rethink its starting point and to create an eighth division in the area. The massive movement of electors from Macquarie to Lindsay on the western outskirts of Sydney was retained, but Paterson was abolished and instead of receiving electors from them sent even more to Calare and Gwydir. That allowed a new division, named Parkes after the Father of Federation, to be created to the west of Gwydir using 37 000 electors from Gwydir, 16 500 from Calare, 12 600 from Hume, and a handful from the defunct Paterson. There had previously been a division named Parkes, located in the middle of Sydney, which was abolished in 1968. The new one extended far enough south to include the town of Parkes but that was not the point. The division that now lay between the new division of Parkes and the South Australian border was re-named Riverina-Darling, drawn predominantly (83 per cent of a quota) from the old Riverina and topped up from Gwydir and Hume. Gwydir plummeted from 83.0 per cent to 41.0 per cent of its old electors, and the area retention figure dropped still further. Those who had been critical of the new Paterson were startled to see it disappear and be replaced by Parkes. To cover a situation where the augmented commission started what was at least in part a new ball-game, the CEA was amended to provide, first, an opportunity for a second round of objections and, second, public hearings if the augmented commission made substantial changes to the redistribution committee�s proposals. Thereafter there could be three sets of reasons stated during a redistribution: the initial reasons forming part of the report of the redistribution committee, the proposal for the redistribution forming part of the report of the augmented commission and, if necessary, the reasons for the determination made by the augmented commission. The 1992 redistribution In 1992, New South Wales lost a seat, and the redistribution took place with an increased quota of 73 513 and a permissible minimum of 66 162. One division, Riverina-Darling, had fallen below permissible minimum, but only two, Macquarie and New England, were above quota and only Macquarie by much. With only 7.8 quotas to start with, the redistribution committee modified the area boundary substantially and made up the shortfall by a net importation of electors (see Appendix: Table 15). To digress briefly, Gilmore which was involved in the boundary changes, had originally been criticised in 1984 for extending across the big divisions� boundary from �Cowra to Nowra�. In fact it largely corresponded to the original (1901-3) Werriwa that had
37
extended even further west to a point beyond Cowra. From 1934 onwards Werriwa had gradually crept north-eastwards until in 1948 it completed its metamorphosis into a peripheral metropolitan division. Gilmore remained virtually unchanged in 1999, but in 2006 resumed the process that it had started in 1992, shedding inland electors who were in the minority and becoming more clearly coastal in character. As for the perpetual far western problem, the redistribution committee referred to dissatisfaction with the existing Riverina-Darling, and reverted to having two divisions. One was based on the region traditionally known as �the Riverina� and its several irrigation areas and reclaimed that name. The other, comprising the grazing and mining western part of the State, would absorb the western part of Riverina-Darling into Parkes. Thus two �post-Federation� divisions, Farrer (dating from 1948) and Parkes (from 1984) now ran along the border with South Australia instead of the original (1901) Barrier and Riverina. Paterson was resurrected, composed of parts of several Hunter Valley and coastal divisions but now well away from the concerns of the western and middle parts of the State. At the augmented commission stage there was some grumbling about the inclusion in Riverina of some centers which were said to look to Albury and consequently should be in the division of Farrer. Subject to some very minor revisions, the proposals for Riverina and all the other divisions were upheld, but the two State officials dissented on the Riverina proposals at both redistribution committee and augmented commission stages.70 The 1999 redistribution In 1999 the number of seats allocated to New South Wales remained unchanged. The quota, 82 202, was exceeded in the big divisions� area by only one division, Macquarie, and the permitted minimum, 66 162, was missed only by Riverina, so the majority of divisions in the area were relatively close together. On the other hand, the area collectively contained only 7.5 quotas. Instead of abolishing a division and exporting the resulting surplus, the redistribution committee maintained the same number of divisions and moved 38 500 electors from a generously endowed outer metropolitan division, Macarthur, into Hume (see Appendix: Table 16). To dispose of the resultant surplus and at the same time solve a number of shortfalls, Hume transferred out almost as many, the largest batch going to Riverina, its worst-off neighbor � and even 1000 eastwards across the area boundary. For the area as a whole the retention statistic was the best it had been since 1955. The report introduced a �displacement� statistic calculated at �approximately 11% of the electors,� which is an alternative to the �retention� statistic used in this paper. In the second round the augmented commission made only one tiny adjustment involving 380 electors.
70 1992 Redistribution of New South Wales into Electoral Divisions, 1992, v.1, Canberra, AGPS, p.11.
38
Gwydir: a brief recapitulation So much of the dissatisfaction with the 2006 redistribution was focused on Gwydir that before examining that redistribution in some detail it might be helpful to extract and repeat that division�s experience over the previous century as is evidenced in its retention statistics. Prior to 2006, and excluding 1903 because the necessary figures are unavailable, there were 18 occasions when Gwydir�s boundaries came under review. Since the 1983 changes the provisional and final reports could be counted separately, but for 1999 the provisional version was confirmed in the final report. It was never left alone, though several times the retention rate was 98 per cent or better. Six times (1906, 1912 first report, 1912 third report, 1922, 1955, 1968, 1975, 1977, 1984 proposed, 1999) it was only slightly changed. Eight times it was substantially changed. Five times (1931, 1934, 1948, 1992 proposed, 1992 final) it fell below the cut-off point for substantially and slightly within the 70-75 per cent range), and three times it was very substantially altered. In the 1912 second report the retention rate fell to 46.4 per cent and a change of name to Namoi was suggested; in 1962 the division would have been abolished; and in 1984 final report the retention rate fell to 41.0 per cent but the name Gwydir continued even though 49.2 per cent of its electors had gone into the new division called Parkes. It could be said that Gwydir had had three near-death experiences prior to 2006. As for the other biggest and westernmost divisions, Barrier always had a 100 per cent retention rate until its abolition because it invariably had to be topped up. That was the case with Darling too until 1922 when it was caught up in the abolition of Barrier. Darling then swung between very substantial changes (62.1 per cent, 48.3 per cent) in years when the House had been enlarged and there were more divisions to be drawn (1948, 1984) and high retention rates (1931, 1934, 1955, 1962) or no change (1968), until it vanished into Riverina in 1977. Riverina was proposed for abolition twice (1912 second report, 1975) and twice experienced substantial change (1948, 1992 proposed). There were four occasions (1931, 1934, 1962, 1968) when Riverina reported no change, and for the remainder it was only slightly changed. Loss of enrolment, relative or absolute, put all four of these divisions at risk regularly, and two wild cards � whether transfers across the area�s notional boundary increased or reduced the pressure for abolishing a division, and whether enlargement of House membership occurred to reduce the pressure � contributed substantially to how the problem was resolved. Another long perspective is provided by following the location of Dubbo which, as by far the largest city in the northwestern sector of the area, can be seen as the pivot around which other divisions have to move. Dubbo started off in Robertson, went to Darling in 1906, to Gwydir in 1922, returned to Darling in 1934, into the new division of Lawson in 1949, back to Gwydir in 1968, and finally into the new division of Parkes in 1984 where it has stayed ever since. Drawing divisional boundaries in the north-western part of the area since 1906 has in large part meant deciding where Dubbo is to go (about which the CEA offers little help), and then rearranging everybody else to comply with the statutory limitations on numbers, whilst at the same time recognizing community of interest when and where it is possible to do so.

39
In the beginning Broken Hill offered an alternative large urban centre focus in the far west, but so close to the South Australian border that it could not act as a pivot, only as a large building block. Once it could no longer justify a division of its own, redistribution commissioners dealing with it were left with two choices, going south from Broken Hill and then up the Murray along the State border as far as was necessary to achieve a quota, or else seeking a quota by going due east in the direction of Dubbo whilst keeping the border with Queensland on the left. Following the abolition of Barrier, Broken Hill took the second option, went into Darling and stayed there until 1977, but Dubbo was rarely in the same division. It would have been from 1931 had those proposals been accepted, and it was from 1934 to 1948. But when the first option was adopted and Broken Hill moved into Riverina in 1977, Dubbo remained in Gwydir. When Broken Hill�s division became Riverina-Darling and backed away from the Murray River in 1984, Dubbo could be moved into Parkes. Thus, apart from one brief period 1934-48, the two cities had never been in the same division until 1992 by which stage Broken Hill itself contained only 23 per cent of the prevailing quota compared to Dubbo�s 28 per cent. At the 1999 redistribution those figures were 19 per cent and 29 per cent respectively, and when the 2006 redistribution committee proposed sending Broken Hill off to Riverina once more they were 16 per cent and 28 percent respectively, which certainly entitled Dubbo to possession of the field. Broken Hill then joined a division with an even larger city at the opposite end of the division, Albury with 35 per cent of a quota. To anticipate the next section briefly, in 2006 the redistribution committee decided to eliminate one division by combining Gwydir and Parkes, and thereby create a large surplus, and to move 39 000 electors, well over the �significant transfer� line, from Calare to Macquarie. It then reflected that it could restore Calare�s numbers with either Dubbo plus one smaller centre, or with four smaller centres. The first option would help dispose of the surplus, but it was flawed.
In considering these possibilities the committee noted that the removal of Dubbo from Parkes would result in that division not containing a major regional centre. The committee noted that such a move would have extended Calare further west to obtain the required electors and would have created a division based on tenuous communities of interest.71
In the event a different set of calculations allowed Dubbo to stay in Parkes/Gwydir and the surplus to be moved from Parkes/Gwydir to Calare to Macquarie and finally out of the area into Greenway which had been created in 1984. The 2006 NSW redistribution New South Wales had once more lost a seat, the quota was 87 931 and the permissible minimum 79 138. The big divisions� area contained 7.5 quotas and so could move either
71 2006 Proposed Redistribution of New South Wales into Electoral Divisions, n.d. ,Canberra, AEC, p.19.
40
way: bring in half a quota and retain the eight divisions or move half a quota out and settle for seven. The redistribution committee noted that population had declined in the north and north-west of the State but was holding steady in the center and south-west, and the report�s map illustrating enrolment trends showed four of the declining divisions stretching out on an east-west axis and the fifth, New England, on a north-south axis. It proceeded to state a set of principles it would apply �after taking into account the criteria contained in the Electoral Act wherever possible�. The principles might also be seen as a useful gloss on those criteria rather than creating alternatives:
reflecting the movement of western electors towards major centres upholding and restoring divisional communities of interest ensuring means of communication and travel were considered diminishing historical constraints imposed by geographical regions and features in the light of improving communications and transport minimising the extent of elector movement to proposed divisions.72
The application of those principles in a situation of declining enrolments led the redistribution committee to the conclusion that Gwydir and Parkes should be merged, and thereby they could work to seven divisions. At the same time the redistribution committee advanced a concept of the �regional links� which connected the state�s main areas, rural, coastal and metropolitan. These links were the long-established road and rail corridors and they could be used to deal with continued population drift by linking under-populated areas west of the Great Dividing Range with remedial population sources east of the Range � a process which had been spoken of earlier in this paper as moving the western area�s only adjustable boundary. Finally the committee went on to create what might be thought a new and reasonable criterion that all rural districts should contain one major centre, but it could also be considered an application of the existing community of interest criterion.73 Employment of these considerations led to the usual range of varying consequences for the several divisions (see Appendix: Table 17). New England remained intact with a small addition, and Riverina did almost as well. Farrer and Hume were only marginally altered. But the other three divisions had retention rates barely over the half mark: Calare, Macquarie and Parkes. The area collectively had a low retention rate, and there had been substantial border-crossing transfers with a net loss of 68 000 electors eastwards, very much the ultimate reflection of the commissioners� statistic that the merger of Gwydir and Parkes had produced 82 000 surplus electors who had to be moved somewhere else. The disappearance of Gwydir produced a wave of criticism evidenced by the 1,989 objections lodged to the redistribution. Bennett�s Research Brief for the Parliamentary Library74 provides an admirable account which need not be duplicated here. Despite the scale of protest, it was unsuccessful for the reasons the augmented commission set out.
72 Ibid., p.18. 73 Ibid., p.26. 74 Bennett, �Save Country Seats�.

41
As a common response to criticism of a particular division is to complain that the critic(s) should suggest an alternative solution, it might be noted that several objectors including the federal leader of the National Party and the party�s deputy leader in the Senate, both representing New South Wales electors, specified the metropolitan, and safe for the Labor Party, seat of Blaxland as a suitable sacrificial substitute. More of a look in the rear-view mirror was provided by the party�s former federal leader who was Deputy Prime Minister when the 5,000 sq.km. criterion was added to the statutory criteria:
I have always been conscious that if democracy is to work fairly and with justice some allowance needs to be made in the voting system to compensate for the remoteness or inability of the elected representative to be in close contact with the voters. While Australia seems to have unfairly glossed over the principal [sic] most other countries do give a weighting for this factor.75
How much weighting and which other countries is left to the reader to find out for themselves though presumably his remarks 30 years earlier in 1975 already cited would help. Nor was there a suggestion that the parliamentary veto which had worked so effectively in 1962 should be restored. But before suggesting remedies it may be time to see how the system worked in a different state. Queensland 1901-48 Applications of the CEA�s redistribution rules to Queensland encounter a geographical situation quite unlike the one we have just been examining. In 1901 only nine divisions were allocated to the State, only four of which resembled those in the western part of New South Wales. The remaining five divisions, urban or closely-settled rural, occupied the south-eastern corner of the State. The boundary between the two blocs of divisions was shorter than in New South Wales, and the opportunities to move enrolment surpluses or deficits across that boundary more limited. Although such a boundary was never given statutory recognition, serious players believed that one existed. For example, the Liberal Party�s Queensland division put to the commissioners of 1968:
Our primary suggestion is that the Commissioners should retain two (2) categories of electoral Divisions, namely Metropolitan and Extra-Metropolitan. These categories have become universally understood and accepted. There is no need nor facility for any other category in Queensland. An identifiable boundary between the Metropolitan and the Extra-Metropolitan Divisions was established by the redistribution of 1948.76
Recognising that boundary would have added the two divisions, Wide Bay and Darling Downs, labeled �closely-settled rural� earlier in the paragraph, to the four more remote,
75 Public Objection Number 504: The Right Hon. J.D. Anthony. 76 1968 Redistribution of the State of Queensland into Electoral Divisions – Volume II: Copies of the Suggestions, Comments or Objections lodged with the Distribution Commissioners for the State of Queensland, 1968, Canberra, p.4.

42
larger, and thinly-settled with which this paper is concerned. After the 1948 redistribution Fisher became a third member in that intermediary category of division. A second distinguishing feature was that Queensland�s basic transport and communication system had developed differently from the New South Wales system. Instead of a single railway network radiating out from Sydney, three separate systems had been laid down, running westwards from the ports of Townsville, Rockhampton and Brisbane, and only gradually joined together by a south-to-north line which ran along the coast and eventually reached Cairns. This fragmentation of transport and communications produced a three-layered State so clearly divided that a provision of the Commonwealth Constitution (s.7) had allowed Queensland to elect its six senators from three separate upper house divisions if it wished to do so. It did not wish that, and the occasional �new state� movements which sought to remove North Queensland and even Central Queensland from the State failed to get off the ground. Nevertheless attempts to recognize �community of interest� outside the metropolitan area had to cope with not only the continent-wide trinity of mining, pastoral and agricultural economic interests, but also at least three geographical interests, possibly four if Far North Queensland and its port at Cairns were to be dealt a hand. Finally, the influence of inter-state boundaries was much less obvious. Maranoa always accounted for the NSW and South Australian borders, and the only uncertainty was the extent to which it shared the Northern Territory border with Kennedy. In 1901 the Queensland legislature, using the State�s electoral districts as building blocks, had created the four divisions which are of interest for this paper. Maranoa, on the railways� southern line, started as soon as closer settlement on the Darling Downs thinned out and ran along the NSW border to South Australia and the Northern Territory. Capricornia extended along the central line almost to Barcaldine and up the coast from Gladstone almost to Mackay; Rockhampton was its principal center. Herbert occupied the rest of the coast up to and including Cape York peninsula, and contained three major urban centers � Cairns, Townsville and Mackay. Kennedy, the principal center of which was a mining town, Charters Towers, occupied the rest of inland Queensland. It spread along the western part of the central line and almost all of the northern line and, at the end of a long border with Maranoa, reached the upper half of the Northern Territory boundary. These four divisions remain the only players of concern here until the enlargement of the House of Representatives in 1949 when another two, Leichhardt and Dawson, joined the field. The narrative of this part of the paper will concern transfers among those four together with, for the most part minor, transactions with the south-eastern area divisions they touched � Wide Bay and Darling Downs, and after 1949 Fisher as well. The 1903 redistribution The redistribution proposed in 1903 was based on a quota of 24 675 and a permissible minimum of 19 792. Only Kennedy at 18 897 required remedial action, but the continuing use of State electoral districts as building blocks led to the transfer of a large area, Cook electoral district � effectively the whole of Cape York peninsula, from

43
Herbert. The report77 reproduced two objections received, from the Cairns Political and Progress Association and the Member for Herbert, F.W. Bamford. The Association lamented the loss to Kennedy and was concerned with the relationship between area and effective representation, and with communities of interest:
No one man could have adequately represented the pastoral, mining, and coastal agricultural interests comprised in so large an area [as Kennedy], nor could he have visited even a fair proportion of the centres with a view to obtain on the one hand, an idea of the needs of the electors; or, on the other, to satisfy them that this candidate was a fit and proper person to represent them. Moreover, we as electors resident in the district hitherto under the influence of the above League felt that we were practically disfranchised owing to the preponderance of voters concerned in the pastoral and mining industries, and who would probably return a candidate possessed of none of that expert knowledge which is required by one who aspires fairly to represent the interests of tropical agriculture.78
Bamford threw in another community of interest point - the lack of it between the graziers of the west and the pearlers of Thursday Island, whilst the Association observed that Kennedy and Maranoa together occupied two-thirds of the State�s area but contained less than a sixth of its enrolment. When the report came before the House of Representatives on 18 August 1903, William Lyne as the responsible Minister immediately moved disapproval. The reason he put forward was the drought � as it had been argued for New South Wales, but there was also a complaint by the Member for Capricornia, Alexander Paterson, that the 20 per cent deviation from quota was too narrow for rural divisions, to which Andrew Fisher, the Member for Wide Bay, said 25 per cent would have been preferable. A South Australian MP, Charles Kingston, who had resigned from the ministry a month earlier over industrial relations legislation, alleged that the commissioner, who was a State public servant, had been improperly interviewed by two State ministers, the Premier and the Minister for Railways. The commissioner�s status was analogous to that of a judge, Kingston thought, and all communications to him should be in writing.79 Three more non-Queenslanders joined the debate. Patrick Glynn, backed by Isaac Isaacs, raised the question whether the Minister had to refer the matter back to the commissioner if Parliament had disapproved, and concluded that the CEA required it. Joseph Cook defended the power to reject:
77 Report of the Commissioner (Mr. Archibald McDowall) appointed to distribute the State of Queensland into Divisions, 1903, C.P.P., v.2, No.41; the argument may be followed on a small-scale map of the State electoral districts (1887) in D.B. Waterson and J. Arnold, 1982, Biographical Register of the Queensland Parliament 1930-1980 , Canberra, Australian National University Press, p.117. 78 Ibid., pp.3-4. 79 C.P.D., v.15 (19 August 1903), pp.3557-58).

44
No one has ever set up the contention that we must perforce accept the dictation of the Commissioner. No one has put forward an absurd proposition of that kind; not has any one said that we should surrender ourselves politically, body and soul into the hands of the Commissioner.80
That surrender had to wait another 80 years. For the time being the House voted 37-16 to reject as Protectionists and Labor defeated Free Traders. The 1906 redistribution By 1906 with a quota of 26 019 and a permissible minimum of 20 815 only one of the four divisions, Herbert, remained above the permitted minimum. The commissioner declared his intention to cause the least disturbance whilst complying with the criteria (see Appendix: Table 18). Herbert was left as it was. Kennedy could be enlarged only from Maranoa and moved south. The size of Maranoa�s deficit required both expansion eastwards into Darling Downs and north-east into Capricornia. Capricornia remedied its own and the area�s deficits by extending south along the coast to include Bundaberg. In the commissioner�s opinion that made it �an eastern maritime Division,�81 but Rockhampton�s role as the rail-head and urban hub for the central part of the State left it a division properly included in the area which is of interest for this paper. The State electoral districts, usually kept whole but split occasionally, continued to be designated as the building blocks. Expansion of the railway system (which continued in Queensland for some time after it had virtually ended in New South Wales) could be used to justify transfers, but problems had been created by changes relevant to the criteria:
Some of these boundaries, owing to the progress of settlement and the extension of surveys, are not now quite appropriate, therefore, in such cases, although existing boundaries have been practically adhered to, they have been made to conform to the later conditions.82
In the commissioner�s opinion, at the statewide level the scale of deviation from the quota was well within the statutory limits, and should avoid any need for redistribution until the number of seats was altered �unless some unexpected movements of population occur.� Closely-settled divisions with smaller areas were put above the quota, and the sparsely-populated larger divisions below it.83 Unfortunately the reports of this period are less than comprehensive for the exact numbers of electors being moved and may refer to enrolments within State districts, and consequently a few statistics are approximations. The Senate accepted the proposals without debate, but when Littleton Groom, the responsible Minister (and Member for the division of Darling Downs, which was later
80 Ibid., p.3861. 81 Report by the Commissioner (Mr. R.H. Lawson) appointed for the purpose of distributing the State of Queensland into Electoral Divisions, 1906, C.P.P., v.2, No.9, p.12. 82 Ibid., p.10. 83 Ibid., p.18.
45
renamed Groom in his honour and that of his father � the only transported convict to sit in the Commonwealth Parliament, albeit for only a few weeks prior to his death in 190184), moved acceptance in the House, Sir John Forrest raised the problem of big divisions and use of the 20 per cent margin. Groom agreed �the vastness of the divisions� was a difficulty for the commissioner and instanced adjacent Maranoa (742 000 sq.km.).85 The brief debate then moved on to divisional names. There was already a State district named Kennedy which could lead to confusion, and Bamford thought it might better be called Browne after a State Minister of Mines (1899, 1903-04).Groom thought �Artesia� might be preferable for Maranoa which was also the name of a State district. The 1912 redistributions In 1912 there were three commissioners. On the first try they failed to agree. The chairman, an assistant under-secretary from the State�s Home Secretary�s department, and the Chief Surveyor submitted a majority report dated 21st June,86 but the Electoral Office�s W.H. Graham dissented, mainly over Maranoa�s boundaries. There had been some growth in enrolments, the quota was up to 31 388 and the permissible minimum to 25 111. Sub-divisions had been introduced in 1908 and were now the official building blocks. Only Kennedy was below the minimum; remarkably the other three were above quota, Herbert so much so that it had the largest enrolment in the State. The majority proposed that Herbert retain the Cape York peninsula (see Appendix: Table 19). Initially the intention had been to add Kennedy�s Gulf of Carpentaria coast to Herbert (an idea never advanced again) and, a move which ever since would be controversial whenever anything like it has been proposed or undertaken, extend Kennedy through to the Pacific Ocean by giving it some coastal strip between Bowen and Mackay. Capricornia reverted to its pre-1906 character by returning the Bundaberg area to Wide Bay and moving west once more at the expense of Maranoa. The majority report noted that there had been complaints about mixing coastal and western areas, but Rockhampton was their �natural outlet� and the central line serviced the whole division.87 As for controversial Maranoa, the majority�s solution was to leave it reduced in area and with an enrolment now well below the quota. An indication of relative differences in impact of the transfer of thinly-settled areas is that Maranoa would lose about 20 per cent of its previous area (742 000 sq.km.) and Capricornia gained more than 150 per cent of its previous area (71 000 sq.km.) in the same transaction that involved only 8100 electors. What went on in that transferred area was the concern of the main thrust of the dissenting report.88 Graham began by complaining that the 1908 sub-divisional boundaries had been too much ignored by the majority; they would have to be re-done at some expense in the 84 Joan Rydon, 1975, A Biographical Register of the Commonwealth Parliament 1901-1972, Canberra, Australian National University, pp.94-95. 85 C.P.D., v.31 (13 June 1906), p.117. 86 Report by Messrs. W.J. G all and A.A. Spowers, A Majority of the Commissioners appointed for the purpose of re-distributing the State of Queensland into Electoral Divisions, 1912, C.P.P., v.2, No.10. 87 Ibid., pp.6-7. 88 Report by Mr. W.H. Graham, One of the Commissioners appointed for the purpose of re-distributing the State of Queensland into Electoral Divisions, 1912, C.P.P., v.2, No.11.

46
near future to recognize overdue changes of the State electoral districts.89 He then proposed some minor changes reflecting railway extensions, and an area being better served for electoral administration purposes. His most substantial complaint concerned was the transfer from Maranoa to Capricornia. A sheep-raising area was moved from a division which was nothing but sheep-raising to one which had no sheep, when compliance with quota requirements could have been met without the change. Moreover, Capricornia had been the third fastest growing division in the State since 1906, the boundaries of nine Commonwealth sub-divisions would be affected, and the Barcoo State electoral district boundary which had been used to define the transfer was likely to change in the near future.90 The practice of showing in redistribution reports which State electoral districts fitted into which federal divisions became essential when recognition of the State electoral boundaries was made a statutory criterion in 1918 and reports continued to do this until 1962. Graham followed his dissenting report with a second document dated 12th July.91 It pointed out that Herbert�s surplus was much the same size as Kennedy�s deficit, and equal to the numbers involved in the transfer of Bowen and Mackay and argued that there were two sugar-growing areas in Herbert and the southern one could be split off. (The sugar industry which had �opened up� much of coastal Queensland had survived the end of indentured labour and the repatriation of a proportion of the Pacific Islander workforce at the beginning of the century, and continued to be the principal factor for growth and settlement between Cairns and Mackay.) True it would introduce what Graham called �a foreign interest� into Kennedy, but no other practicable solution to the problem could be found. On 23rd July King O�Malley, the responsible minister, moved agreement to the majority report. Bamford (still the Member for Herbert) observed darkly that in 1903 he had �made a charge of gerrymandering against some person or persons unknown with the result that the distribution was rejected�92 and moved the matter be referred back to the commissioners.That was carried 27-25 on a free vote. The commissioners returned a month later with a unanimous report (see Appendix: Table 20).93 It complained that Parliament had given no �indication of the grounds on which the proposed distribution was rejected,� apart from the speech by Bamford. That difficulty remained until 1983 when the power to reject was abolished. Mackay and Bowen were again seen as �a foreign interest� if they went to Kennedy and split the northern sugar interest, then contained wholly in Herbert, for Mackay had been called �Sugaropolis� in the 19th century. A tiny part was more Kennedy than it was Herbert and that could be
89 Ibid., p.4. 90 Ibid., pp.5-9. 91 Tentative Recommendation in relation to Divisions of Herbert and Kennedy, State of Queensland, by Mr. W.H. Graham, One of the Commissioners appointed for the purpose of redistributing the State of Queensland into Electoral Divisions, 1912, C.P.P, v.2, No.13. 92 C.P.D., v. 45 (23 July 1912), p.1114. 93 Further Report by the Three Commissioners appointed for the purpose of re-distributing the State of Queensland into Electoral Divisions, 1912, C.P.P., v.2, No.31.

47
moved, and the bit near Mackay could still go to Capricornia, but that was all. Kennedy�s deficit would have to be met at the expense of Capricornia. The result of the changes was to recognize area and spread the four divisions out. Herbert still the largest in enrolment was well above quota, Capricornia was just on quota, and the two largest divisions, Kennedy a bit below quota and Maranoa at 27 600 was still well clear of the permissible minimum. The second report was accepted on 10th October without a division, though Bamford continued to grumble and was supported in his complaints by the Member for Capricornia. The 1922 redistribution In 1921 the commissioners, with Sowers back and now the chairman, began by formally separating the State�s divisions into three metropolitan and seven extra-metropolitan. The two divisions largest in area and nearing the permissible minimum of 31 337, Kennedy and Maranoa, would go below the quota of 39 171 (see Appendix: Table 21). Much of the commissioners� work consisted in reversing what had happened in 1912 and thereby restoring what had happened in 1906, but now it was done without stating reasons. As in 1906 the area benefited from the transfer in of electors equal to a third of a quota. Bundaberg and district came back to Capricornia from Wide Bay, and Capricornia returned to Kennedy its western parts around Clermont. Herbert, well over quota, transferred the Atherton Tableland to Kennedy and still remained above quota. Kennedy also received electors from Maranoa which was more than compensated by two adjacent pieces of Darling Downs. The redistribution, the commissioners noted, allowed 57 of the 72 State electoral districts to be used as federal sub-divisions.94 In the Senate there was a complaint that:
The distribution will make it almost impossible for Labour, as we have known it in the past to secure that representation which it is entitled to, and which it formerly enjoyed.95
But in both chambers approval was granted without divisions being required. At the previous general election (December 1919) Labor had won only three seats of the State�s ten with 46.8 per cent of the House vote; at the subsequent (December 1922) election it won only two with 41.4 per cent, retaining Capricornia and Kennedy but losing Maranoa where the Labor vote was down 7 percentage points. As that figure was not much over the statewide decline of 5 points and the defeat followed the death in office of James Page, an archetypal outback Labor MP96 who had held the seat since 1901, it would be difficult to claim boundary changes in 1922 caused the loss.
94 Report by the Commissioners appointed for the purpose of redistributing the State of Queensland into Electoral Divisions, 1922, C.P.P., v. 2, No.22. 95 C.P.D., v. 99 (2 August 1922), p.966. 96 Rydon, A Biographical Register, p.173.

48
The 1931 redistribution As previously noted, the 1931 census had been postponed. Once again there were ten divisions allocated to Queensland, the quota had risen substantially to 47 964 and the permissible minimum to 38 372. The difference between the two �coastal� big divisions which were above quota, and the two �inland� which were now below permissible minimum, well below in Kennedy�s case, had widened. The solution was partly to reverse what had been done in 1922, and more substantially to try again to take Kennedy through to the coast where the electors were thicker on the ground (see Appendix: Table 22).97 Capricornia should send a smaller number (only a quarter of a quota) in Bundaberg and district back to Wide Bay, and regain electors in the west from Maranoa and Kennedy. Maranoa should open a new line of cross-area boundary transactions with Wide Bay in the Burnett district, and thereby keep net movement in and out of the area to a minimum. The main action should involve Kennedy and Herbert. Kennedy would receive stretches of the coast north and south of Townsville and give up the Atherton Tableland. But, as happened with the New South Wales report, these proposals lapsed in the tumultuous last days of the Scullin government. The 1934 redistribution In 1934, despite the country being in the depths of the Great Depression, the quota had risen slightly to 51 447 and the permissible minimum to 41 158, but the spread of the four divisions within the area was much the same as in 1931. The commissioners were more restrained with two of the divisions (see Appendix: Table 23). Capricornia should give up even less from the Bundaberg district, just 4000 electors, and gain nothing. Maranoa should lose nothing, gain a bit less from Wide Bay, and pick up a bit from Darling Downs. As to the continuing Herbert-Kennedy problem, Herbert would retain its southern, sugar-growing area but its northern boundary would stop at Innisfail, whilst Cairns and the Cape York peninsula would be transferred to Kennedy which would retain the Atherton Tableland. The proposals were nodded through in July 1934, and incidentally pointed the way for future solutions once the membership of the House had been enlarged. Thus Littleton Groom regretted that Pittsworth had left his division, Darling Downs, and thought it could be remedied at the next redistribution.98 Queensland 1948-83 Between 1934 and 1948 Queensland�s enrolment grew from just over 0.5 million to 0.67 million. With 18 members to be elected rather instead of the previous 10 the quota was reduced to 37 197 and the permissible minimum to 29 758, figures that fell between those which had applied at the 1912 and the 1922 redistributions. Had the redistribution been conducted prior to the 1946 general election based on enrolments at that time, the permissible minimum would have been 52 826 and the quota 66 032, and all four 97 Report by the Commissioners appointed for the purpose of redistributing the State of Queensland into Electoral Divisions, 1931, C.P.P., v.3, No.157. 98 C.P.D., v.144 (5 July 1934), p.281.

49
divisions would still have fallen between those numbers. But with the enlargement of the House of Representatives, it was now possible for the commissioners to create six divisions rather than four and be able to send surpluses almost equal to a quota off to four adjacent south-eastern divisions, both the old divisions with which the original four had exchanged electors in the past, Wide Bay and Darling Downs, and the new divisions, Fisher and McPherson, as well. Enlargement of the House can matter a lot, but it may not alter long established patterns. Whether it does either, may depend on which State is involved. Queensland�s experience was very different from that of New South Wales. The 1948 redistribution Reading southwards along the big divisions� area boundary from its northern end, all adjacent divisions received electors, Wide Bay from Capricornia and Maranoa, Fisher from Maranoa, Darling Downs from Maranoa, and McPherson from Maranoa (see Appendix: Table 24). The two new divisions within the area joining the original four were Dawson, made up of 13 000 electors from Capricornia and 21 500 from Herbert, and Leichhardt (the commissioners had suggested it be called �Dalrymple�), receiving 29 000 from Kennedy and 7500 from Herbert. Three of the original four divisions received no new electors, and contained only their old electors. Kennedy, not surprisingly because it lay in the middle, was the key. To help compensate for its massive contribution to the new division of Leichhardt, which would comprise Cairns, the Atherton Tableland, Cape York peninsula and the Gulf of Carpentaria coast, Kennedy got bits and pieces from its old neighbours: 2500 from Capricornia, 4500 from Herbert, and 3000 from Maranoa. In consequence Kennedy both moved southwards � Maranoa no longer bordered on the Northern Territory, only on South Australia. Kennedy also finally reached the Pacific Ocean at Bowen � it was said at the time and for a while afterwards because the sitting Member was Minister for the Navy. It was inevitable that the enlargement of the House would be criticized, but a South Australian Liberal, P.A. McBride, joined the Queensland debate to argue that the Chifley Government�s prior intentions might have been frustrated:
� [A]t the critical moment when the Government saw nothing but disaster ahead it decided to increase the numbers of members of the Senate and the House of Representatives for no other purpose than to make safe seats for Labour. That plan has already caused great disappointment in the ranks of my friends opposite. They have talked about jerry-mandering [sic] by the Electoral Commissioners that they have themselves appointed.99
In the event, at the September 1946 election Labor had won five of ten Queensland seats with 43.0 per cent of the House vote; at the December 1949 election it could manage only three out of 18 with 39.5 per cent of the vote. Herbert, where preferences had to be distributed, and Kennedy were two of the three it retained. 99 C.P.D., v.199 (22 September 1948), p.140.

50
Once the report had been tabled there was little discussion except of divisional names. Two new divisions in the metropolitan area had been named Bowman and Ryan after Labor stalwarts from the party�s early days. Among the large new divisions the commissioners� choice of �Dalrymple� was altered to �Leichhardt�, but when a Liberal front-bencher, Josiah Francis, attempted to rename Dawson as �Leichhardt� and call the other new division �Macrossan� the proposal failed on the voices. The 1955 redistribution The 1955 redistribution retained the same number of divisions, but � unlike the usual pattern in New South Wales � enrolment in the extra-metropolitan divisions had grown slightly faster than in the metropolitan. The quota was 41 309 and the permissible minimum 33 048. Kennedy was slightly below that minimum and Herbert and Leichhardt slightly below quota. Four divisions, Herbert, Kennedy, Leichhardt and Maranoa, were effectively left alone apart from for minor adjustments (see Appendix: Table 25). But south of Townsville substantial changes were made to the two remaining divisions and there was some rethinking of 1948 decisions. Dawson transferred 12 000 electors from the northern suburbs of Rockhampton and further north to Capricornia where they indisputably belonged. But, more controversially, it then expanded further west with 7000 from Capricornia, and swung southwards around Capricornia to reach the Pacific Ocean again just north of Bundaberg, thereby picking up another 3500 from Wide Bay. The resulting shape of the division inevitably attracted criticism. Overall the big divisions� area enrolments varied from Kennedy�s just above the permissible minimum to Herbert�s still below quota. When adoption was moved on 31 May 1955 the Member for Herbert still grumbled about several matters. There had been a story that the Prime Minister had told Queensland Liberal MPs that they would have to accept the decisions of the commissioners and a report in the Brisbane morning paper claimed that there would be changes before the final report. He hinted that a petition presented by the flamboyant Mayor of Rockhampton had influenced decisions for Capricornia, and that the senior Liberal Minister from Queensland, Alan Hulme, had done well from late changes. Hulme denied allegations of improper influence, raised a very rare (by US standards) complaint about the shape of a division � Dawson was 400 miles long and 15 miles wide at its narrowest, and then anticipated future developments in the process:
I believe that the provisions of the existing act are outmoded. There is inconsistency in relation to the evidence which commissioners take in the various states. In Queensland, the commissioners did not hear evidence from anyone. In another State, the commissioners asked the political parties whether they had any views on the redistribution of electoral boundaries. That is an unfortunate inconsistency. Not only should evidence be taken by the commissioners, but opportunity should be given for discussion with them as well.100
100 C.P.D., v.HofR 6 (31 May 1955), pp.1311-12.

51
Members of political parties should be able not merely to present evidence but to hold discussions with commissioners before the final proposals were presented. The report was accepted on the voices. The 1962 redistribution In 1962 Queensland was due to lose a division and this time the metropolitan divisions had grown slightly faster than the extra-metropolitan � even though the only two divisions to actually lose enrolment were the inner-city Brisbane and Griffith. The quota was 48 374 and the permissible minimum 38 099. The commissioners first chose Wide Bay to be abolished and then in response to �a number of objections and some suggestions� preferred Dawson (see Appendix: Table 26).101 As already mentioned, the abolition of Dawson had been one of the political considerations which led to all the proposed 1962 redistributions lapsing. The report left four divisions virtually untouched � Herbert, Kennedy, Leichhardt and Maranoa, the only exception being 100 electors to go from Kennedy to Capricornia to rectify a border problem, and concentrated on disposing of Dawson�s 38 800 electors. The great majority, 27 000, would go to Capricornia and smaller packets move out of the area to Wide Bay and Fisher. Capricornia would pass only 10 000 on to Wide Bay and be left with a bloated enrolment of 56 500, well over quota and, for the first time in 60 years one of the big divisions would be getting close to the permissible maximum then set at 58 049. As both Fisher and Wide Bay totaled only 49 000 each at this point, they might appear to have been suitable recipients for some of Capricornia�s surplus, but Wide Bay was already bumping against the southern outskirts of Rockhampton and Fisher was no better placed to grow northwards. Community of interest would have been conspicuously violated in both divisions. The one occasion when Queensland faced the constantly recurring New South Wales problem of what to do when a big rural division has to be abolished confirms how unsatisfactory any solution is likely to be in such circumstances. Only half the 21 000 electors surplus to the six divisions� needs could be exported easily. The other half either had to be left where they had first landed, in Capricornia, or else re-directed to Maranoa. But Maranoa, though only slightly above permissible minimum, was huge in area and traditionally sensitive about the matter. It would need to shift most or all of an equivalent number of electors to either or both of its eastern neighbours. One possibility would have to be Darling Downs, which was thought to be a rural seat and was already well above quota at 53 000. The alternative, McPherson, was the fastest growing division in the state and, having grown by 15 000 since the previous redistribution, had just dumped more than 10 000 electors into Darling Downs. Kennedy, the only other possible destination if Maranoa was brought into play, had an equally strong plea of large area to ask to be left alone. 101 Report by the Commissioners appointed for the purpose of redistributing the State of Queensland into Electoral Divisions, 1962, C.P.P., v.3, No.106, p.4.

52
The 1968 redistribution By 1968 the threat of Queensland losing a seat was over, and as a consequence the quota had increased only slightly to 50 714 and the permissible minimum to 40 572. The divisions biggest in area, Kennedy and Maranoa, were both under permissible minimum, and only Herbert was over quota. The commissioners said nothing about metropolitan and extra-metropolitan growth rates, quite possibly because those figures would have been all over the place, and it appeared that any movements across the area boundary could be modest. On their first try the commissioners were unable to agree on its extent (see Appendix: Table 27). The majority wished to bring in only 15 per cent of a quota of electors from Wide Bay and McPherson into Kennedy and Maranoa respectively. The dissenting Commonwealth Electoral Officer, Ivan Weise, proposed 42 per cent of a quota come from McPherson, Darling Downs and Fisher, and all to go into Maranoa.102 Two sets of proposals were produced, but without reasons being stated by the majority. The majority�s chain of transfers had the effect of reducing Dawson�s inland component and increasing its coastal component, vice versa for Kennedy, thereby concentrating Dawson as a northern and coastal division. Weise�s dissent argued a number of points of which the most interesting for the purposes of this paper concerned Kennedy and Maranoa. In his opinion Kennedy had come too far into the south-east of the State, and both Kennedy (then 247 500 sq.km.) and Maranoa (194 565 sq.km.) extended from the State�s western boundary to within 140 miles of Brisbane. To deal with that problem he attempted to reconstruct Kennedy and Maranoa and give greater recognition of community of interest in each. The western part of Maranoa, containing 33.4 per cent of a quota, would be combined with the western part of Kennedy, containing 47.9 of a quota if a quota, in a new division tentatively called �Vickers�. The eastern part of Maranoa, with 45.6 per cent of a quota, would be combined with western bits of McPherson, Darling Downs and Fisher in a new division tentatively called �Moonie�. (These were the days of great hope for the oil industry in that vicinity.) The eastern part of Kennedy would be added to Dawson and pull it further west instead of it shifting east as the majority sought to do. When the report was put to the House Whitlam queried how a divided report could be dealt with and was assured that it was still a report in the names of the three commissioners. The Member for Dawson, Rex Patterson, who moved disapproval, said the ALP preferred Weise�s version, and engaged in some detailed criticism of the majority�s proposals. Gayndah which had been added to Kennedy really was not a pastoral area as the majority had stated, the inclusion of Carmila in Capricornia for the convenience of keeping to a sub-division boundary was not right, and whilst the south-east corner of Kennedy was quite close to Brisbane the north-west part of Leichhardt was far from the capital, yet Kennedy had fewer electors than did Leichhardt. He also got in a dig at one commissioner being the head of the federal department headed by the senior
102 Report by the Distribution Commissioners appointed for the purpose of redistricting the State of Queensland into Electoral Divisions, 1968, Canberra; Statement by Distribution Commissioner I.F. Weise showing reasons for dissent from the proposals relation to the Divisions of Capricornia, Darling Downs, Dawson. Fisher, Kennedy, Maranoa and Wide Bay, 1968, Canberra.

53
Liberal minister from Queensland.103 A Liberal MP, Dr Wylie Gibbs, joined in criticism of the commissioners by arguing that both Weise and the state�s Valuer-General had limited expertise for drawing electoral boundaries. He suggested that a different formula for selecting commissioners be adopted: a demographer, the �Chief Electoral Commissioner� (presumably the head of the Electoral Office) and a judge.104 Another Labor Member said the shape of Dawson resembled a hung sheep and called it a gerrymander, but the responsible Minister, Peter Nixon, defended the majority�s version with a mass of credible voting statistics.105 The proposals were adopted by the House on a party vote, but in the Senate their progress became caught up in the question of an early dissolution, and were referred back to the commissioners on a 26-24 vote in which the Democratic Labor Party�s senators supported the ALP.106 The majority repeated their proposals for five divisions and slightly increased the number of electors from the southern end of Dawson going to Capricornia (see Appendix: Table 28). Weise stated he still thought his proposals were necessary to conform to the requirements of the CEA.107 When that report came back to Parliament, it was accepted by the Senate on 21 November with the DLP now voting against the Labor motion to reject, and by the House on 26 November.108 The 1975 redistribution In 1975, Wiese again in the chair with two new commissioners (one of whom was the present writer), and still 18 divisions to be drawn, a new redistribution began. The quota was 64 865 and the permissible minimum, now fixed at a ±10 per cent deviation from quota, 58 379. Three divisions were below the permissible minimum � Capricornia slightly and Kennedy and Maranoa substantially below � and the area contained only 5.2 quotas. Either a division would have to be abolished, or a substantial number of electors would have to be added to the area, or all six divisions would have to be crammed close to the permissible minimum and the other 12 Queensland divisions pushed towards the permissible maximum with community of interest likely to suffer as a result. The commissioners chose to abolish a division, Kennedy, create a differently named division, provisionally called �Flynn� that incorporated almost all of Maranoa and the southern and western parts of Kennedy, and keep as small as possible movements across the area boundary from Darling Downs and Wide Bay (see Appendix: Table 29). The proposals produced a substantial number of objections, three-quarters of which were concerned with the proposed �Flynn� and the area and community of interest questions it raised. In response the commissioners altered the boundary between �Flynn� and Dawson with a net gain in electors and reduction in area for �Flynn�, and reversed the flow of electors
103 C.P.D., v.Hof R 60 (19 September 1968), pp.1568-70. 104 Ibid., pp.1572-73. 105 Ibid., pp. 1595, 159-98. 106 C.P.D., v.S 38 (10 October 1968), p.1190. 107 Report by the Distribution Commissioners appointed for the purpose of redistributing the State of Queensland into Electoral Divisions on Fresh Re-distribution, 1968, Canberra. 108 C.P.D., v.S 39 (26 November 1968), p.2508.
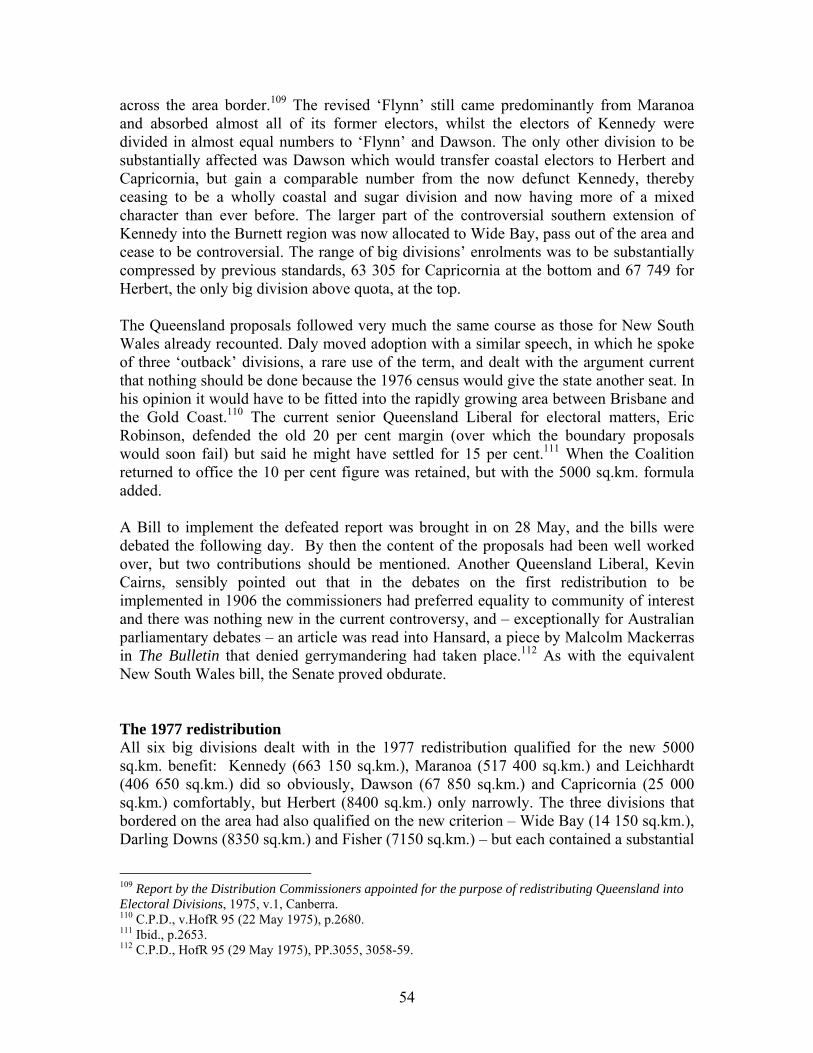
54
across the area border.109 The revised �Flynn� still came predominantly from Maranoa and absorbed almost all of its former electors, whilst the electors of Kennedy were divided in almost equal numbers to �Flynn� and Dawson. The only other division to be substantially affected was Dawson which would transfer coastal electors to Herbert and Capricornia, but gain a comparable number from the now defunct Kennedy, thereby ceasing to be a wholly coastal and sugar division and now having more of a mixed character than ever before. The larger part of the controversial southern extension of Kennedy into the Burnett region was now allocated to Wide Bay, pass out of the area and cease to be controversial. The range of big divisions� enrolments was to be substantially compressed by previous standards, 63 305 for Capricornia at the bottom and 67 749 for Herbert, the only big division above quota, at the top. The Queensland proposals followed very much the same course as those for New South Wales already recounted. Daly moved adoption with a similar speech, in which he spoke of three �outback� divisions, a rare use of the term, and dealt with the argument current that nothing should be done because the 1976 census would give the state another seat. In his opinion it would have to be fitted into the rapidly growing area between Brisbane and the Gold Coast.110 The current senior Queensland Liberal for electoral matters, Eric Robinson, defended the old 20 per cent margin (over which the boundary proposals would soon fail) but said he might have settled for 15 per cent.111 When the Coalition returned to office the 10 per cent figure was retained, but with the 5000 sq.km. formula added. A Bill to implement the defeated report was brought in on 28 May, and the bills were debated the following day. By then the content of the proposals had been well worked over, but two contributions should be mentioned. Another Queensland Liberal, Kevin Cairns, sensibly pointed out that in the debates on the first redistribution to be implemented in 1906 the commissioners had preferred equality to community of interest and there was nothing new in the current controversy, and � exceptionally for Australian parliamentary debates � an article was read into Hansard, a piece by Malcolm Mackerras in The Bulletin that denied gerrymandering had taken place.112 As with the equivalent New South Wales bill, the Senate proved obdurate. The 1977 redistribution All six big divisions dealt with in the 1977 redistribution qualified for the new 5000 sq.km. benefit: Kennedy (663 150 sq.km.), Maranoa (517 400 sq.km.) and Leichhardt (406 650 sq.km.) did so obviously, Dawson (67 850 sq.km.) and Capricornia (25 000 sq.km.) comfortably, but Herbert (8400 sq.km.) only narrowly. The three divisions that bordered on the area had also qualified on the new criterion � Wide Bay (14 150 sq.km.), Darling Downs (8350 sq.km.) and Fisher (7150 sq.km.) � but each contained a substantial
109 Report by the Distribution Commissioners appointed for the purpose of redistributing Queensland into Electoral Divisions, 1975, v.1, Canberra. 110 C.P.D., v.HofR 95 (22 May 1975), p.2680. 111 Ibid., p.2653. 112 C.P.D., HofR 95 (29 May 1975), PP.3055, 3058-59.

55
urban population. If that were to be defined by having sub-divisions containing close to 10,000 electors or more, the urban proportions of total enrolment in the three were: Wide Bay 57.8 per cent in Bundaberg, Gympie and Maryborough; Darling Downs 65.7 per cent in Toowoomba, and Fisher 60.8 per cent in Landsborough (effectively Caloundra), Nambour and Caboolture. Despite sharing in the benefit, they were different, However the average enrolments for the three classes of division suggest relatively little use was made of the amendment: the six big divisions averaged 63 939, the three middle divisions 65 433, and the ten remaining divisions (effectively Brisbane, Ipswich and the Gold Coast) 66 872. Statistics for the existing divisions� areas with which the redistribution started were not given, but as the portions transferred were relatively compact the changes made by the redistribution would not have mattered very much. Queensland had acquired an additional seat, and with a quota of 65 877 and a permissible minimum of 59 290 there were now only 5.4 quotas in the area.113 Maranoa and Kennedy were both well under the permissible minimum, Capricornia barely over it, and the easy solution was to top those three from outside the area and make minimal changes to the other three or leave them alone (see Appendix: Table 30). Capricornia received a modest number from Wide Bay, Kennedy rather more from Wide Bay, and Maranoa, which had been the worst off, a more substantial number still from Darling Downs, Fisher and Wide Bay. With a new government in control of the Senate the report was nodded through. Two enduring points about Queensland redistributions might be made at this point. First, Maranoa, always prone to relative decline in enrolments, starts at the Northern Territory border and runs eastwards along the NSW border until it includes whatever is thought to be its appropriate enrolment at that redistribution. Eventually it approaches Toowoomba, traditionally the center of the Darling Downs socio-economic region and too large a packet of electors to be included with anything more than a modest hinterland. Consequently when the numbers require more territory be acquired on Maranoa�s eastern edge, the division has either to flow to the north of Toowoomba and eventually into the Burnett district, or to the south of Toowoomba and into the Granite Belt, or sometimes do both simultaneously. This was the occasion for a massive thrust to the north of Toowomba. Second, an earlier paragraph showed Wide Bay being depleted to assist the three larger divisions (Maranoa, Kennedy and Capricornia) to its west, north-west and north. After that process its enrolment had been reduced to the point Maranoa had been at when the redistribution began, and consequently Wide Bay was in need of relief on a similar scale. This could only be achieved by a chain process such as occurred regularly in redistributions of the New South Wales big divisions� area but not Queensland�s. To enable the transfer into the Queensland area several divisions as far off as Brisbane had to be involved as well. Ryan, the far end of the chain, did a swap with the division of Brisbane, and received electors from Moreton and Oxley, after which it was able to transfer some to Griffith and 10 500 northwards to Petrie. Petrie, which had started over 113 Report by the Distribution Commissioners appointed for the purpose of redistributing Queensland into Electoral Divisions, 1977, v.1, Canberra.

56
quota, could then pass 15 500 to Fisher, whence 17 500 went to Wide Bay, bringing that division on the area border back to acceptability. It was a chain that snowballed rather than diminished as it moved north. Queensland 1984-2006 The 1984 redistribution Another enlargement of the House, but proportionately smaller than that which had taken place in 1948, brought the quota down only slightly to 62 618 and the permissible minimum to 56 356. Vigorous population growth through most of Queensland left only one of the six existing big divisions, Kennedy, below the permissible maximum of 68 880 and their area as a whole with 7.1 quotas. The redistribution committee members, who included the present writer, could have created another division within the area, but chose instead to export a quota of electors to divisions in the south-eastern corner (see Appendix: Table 31). The most substantial contribution would go from Capricornia to the new division of Hinkler and thereby give it two provincial cities, Gladstone and Bundaberg, plus the rural territory between Bundaberg and Rockhampton which had gone back and forth between Capricornia and Wide Bay from the earliest redistributions. Smaller numbers from Kennedy and Maranoa would go to Wide Bay which would supply the balance it needed to Hinkler. Finally along the area boundary, Maranoa gave smaller numbers of electors to Fisher and (net) to Darling Downs. Within the area Capricornia would be brought back to quota mainly by electors from Dawson, and Leichhardt, which was now challenging Herbert for the title of fastest growing big division, received smaller numbers from Herbert and transferred the Atherton Tableland and part of the Gulf of Carpentaria coast to Kennedy. Maranoa lost a quarter of a quota to divisions along its eastern border, and collected almost as many from Kennedy around Longreach. Kennedy was consequently been pulled northwards as it was being trimmed on its always controversial south-eastern flank. The committee�s reasons particularly relevant to this paper are both general and particular. The general point was that the lower quota now meant that the State�s larger provincial cities, including three within the area, Cairns, Townsville and Rockhampton, and one just outside it, Toowoomba, were on the verge of making a quota by themselves and needed very small hinterlands.
[W]hereas it was often possible in the past to define the hinterlands of those cities with some precision and attach them to the appropriate city, in the present redistribution this has not always been possible. The Redistribution Committee considered that it is undesirable to split any city or town between two Divisions, and noted that in previous redistributions nothing caused greater dissatisfaction with proposals. However an inevitable consequence of preserving each provincial

57
city intact is that less satisfactory decisions have to be taken for the areas between the cities.114
As for the biggest divisions:
The Committee was also very much aware that three existing Divisions, Leichhardt, Kennedy and Maranoa, are already among the largest in the Commonwealth and that any increase in their area should be brought about only as a last resort. Unfortunately each of those Divisions comprises a mix of Subdivisions, some with huge areas and relatively small enrolments and others closer to the coast whose areas are smaller and enrolments more substantial. Adjustments in one sort of area have apparently disproportionate consequences in the other sort, and in the western areas of all three Divisions, apart from Mt Isa, transfers of relatively small numbers of electors inevitably entail the movement of very large areas.115
The augmented commission conducted four �inquiries� relevant to the big divisions, and made three minor changes as a result. The most significant moved the boundary between Leichhardt and Kennedy southwards to maintain the community of interest of the Aboriginal community of Kowanyama with its affines to the north. But a suggestion to vary another stretch of that boundary was rejected on the ground that to have allowed it would have ensured that at the next redistribution the southern boundary of Leichhardt would have to move into the suburbs of Cairns.116 Kennedy extended to the Pacific Ocean once more, albeit on a narrow front, and as a consequence rapidly-growing Leichhardt was cut off from the rest of the State into which it could be expected to send surplus electors. Thus each end of the Kennedy-Leichhardt boundary was solidly pegged in place by different manifestations of community of interest. The 1992 redistribution The 1984 redistribution survived though the first complete three-elections cycle. When the process began again in 1992, Queensland had gained a seat, but the quota had still risen to 72,526 and the permissible minimum to 65,274. With only 6.1 quotas in the area, and the need to put all six divisions slightly above quota because of accelerating enrolment growth in the south-east corner of the State, the redistribution committee could keep transfers across the area border to a minimum (see Appendix: Table 32). Warwick and the district between Warwick and Toowoomba (14.2 per cent of a quota) moved from extra-metropolitan Rankin into Maranoa together with a small number from Darling Downs, thereby allowing the Blackwater-Emerald area (14.1 per cent of a quota) concerned primarily with coal-mining to move from Maranoa into Capricornia.117
114 1984 Redistribution of Queensland into Electoral Divisions, 1984, v.1, Canberra, AGPS, p.58. 115 Ibid., pp.58-59. 116 Ibid., pp.17-18. 117 1992 Redistribution of Queensland into Electoral Divisions, 1992, v.1, Canberra, AGPS.

58
The Labor Party objected to what had happened at the point where the boundaries of Kennedy, Maranoa and Capricornia met, and the augmented commission made modest changes to keep particular shires undivided and retain existing divisional boundaries as much as possible.118 Overall, the division most impacted by the redistribution, Leichhardt, which had provided 9000 electors net to Kennedy and increased its coastal component, still retained 85.5 per cent of its electors. The 1994 redistribution At this point the three-elections cycle starts to fall apart for Queensland. There had to be another redistribution in 1994 because the State had secured another seat, bringing the total up to 26. The quota was up to 76 697, the permissible minimum to 69 028, and the area now held 6.3 quotas. After a tidying-up operation, five of the six divisions were started over quota, which in Kennedy�s case was approaching the permissible maximum (see Appendix: Table 33). Herbert, the only division not to keep all its electors, gave a few to Kennedy and to Dawson, and the total effect of the redistribution was minimal.119 The 1997 redistribution The 1997 redistribution followed a similar pattern. Again there was an additional seat for the State, and with the quota at 78 121 and the permissible minimum at 70 309 the number of quotas in the area was up slightly to 6.4. All six divisions were above quota and Dawson was above the permissible maximum. The redistribution committee noted input complaining that redistributions were too frequent and communities were being disrupted as a consequence and, statewide at least, sought to reduce the number of electors being moved out of their current divisions (see Appendix: Table 34).120 However surplus electors were passed out of the area, from Capricornia to Hinkler and Wide Bay and from Maranoa to Groom. Within the big divisions� area there were still a few controversies. When it was proposed that 7500 electors, some south of Cairns and some on the western side of the Atherton Tableland, be moved from Leichhardt where they were surplus to requirement into Kennedy where they were needed, there were objections. More were subsequently taken from south of Cairns and far fewer from the western edge of Leichhardt, but the total number, 7200, was barely changed.121 A number of objections sought to preserve the status quo on that boundary but, as the augmented commission said, subsequent research �revealed that any changes to the proposal produced outcomes which resulted in changes of equal or greater scale� and, more generally, a change in the number of seats was likely to have had an extensive impact.
118 Ibid., p.8. 119 1994 Redistribution of Queensland into Electoral Divisions, 1994, v.1, Canberra, AGPS. 120 1997 Redistribution of Queensland into Electoral Divisions, 1997, v.1, Canberra, AGPS. 121 Ibid., p.8.
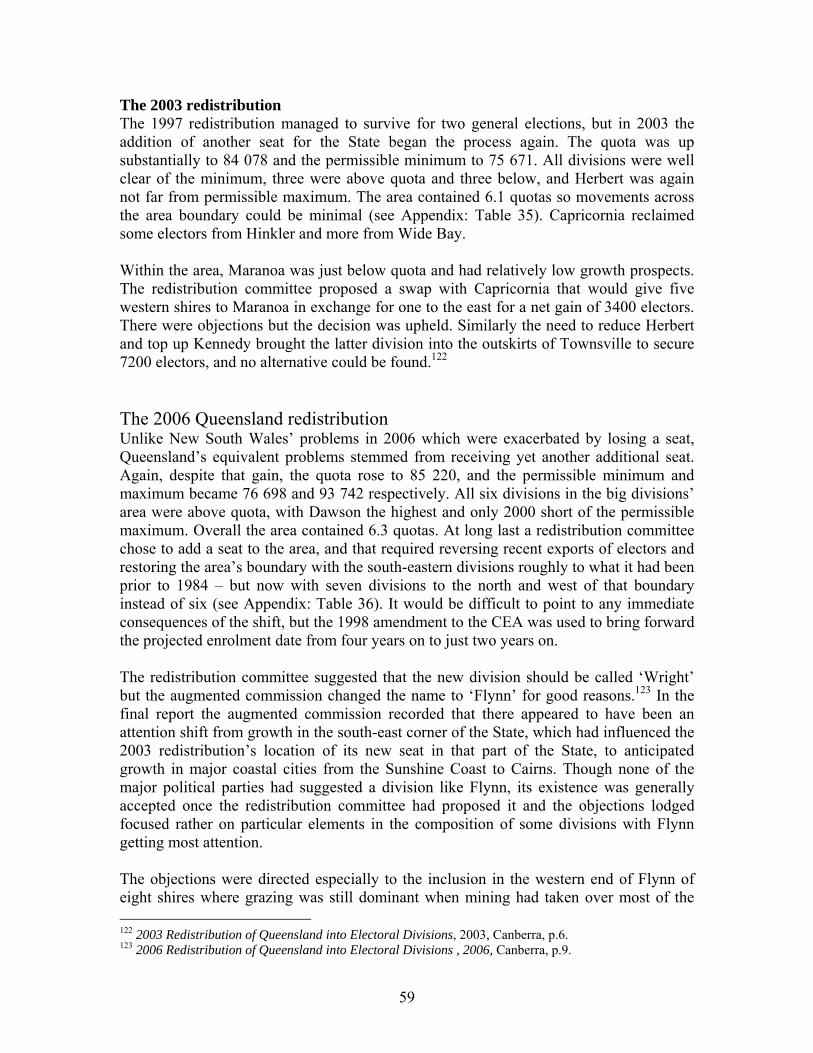
59
The 2003 redistribution The 1997 redistribution managed to survive for two general elections, but in 2003 the addition of another seat for the State began the process again. The quota was up substantially to 84 078 and the permissible minimum to 75 671. All divisions were well clear of the minimum, three were above quota and three below, and Herbert was again not far from permissible maximum. The area contained 6.1 quotas so movements across the area boundary could be minimal (see Appendix: Table 35). Capricornia reclaimed some electors from Hinkler and more from Wide Bay. Within the area, Maranoa was just below quota and had relatively low growth prospects. The redistribution committee proposed a swap with Capricornia that would give five western shires to Maranoa in exchange for one to the east for a net gain of 3400 electors. There were objections but the decision was upheld. Similarly the need to reduce Herbert and top up Kennedy brought the latter division into the outskirts of Townsville to secure 7200 electors, and no alternative could be found.122 The 2006 Queensland redistribution Unlike New South Wales� problems in 2006 which were exacerbated by losing a seat, Queensland�s equivalent problems stemmed from receiving yet another additional seat. Again, despite that gain, the quota rose to 85 220, and the permissible minimum and maximum became 76 698 and 93 742 respectively. All six divisions in the big divisions� area were above quota, with Dawson the highest and only 2000 short of the permissible maximum. Overall the area contained 6.3 quotas. At long last a redistribution committee chose to add a seat to the area, and that required reversing recent exports of electors and restoring the area�s boundary with the south-eastern divisions roughly to what it had been prior to 1984 � but now with seven divisions to the north and west of that boundary instead of six (see Appendix: Table 36). It would be difficult to point to any immediate consequences of the shift, but the 1998 amendment to the CEA was used to bring forward the projected enrolment date from four years on to just two years on. The redistribution committee suggested that the new division should be called �Wright� but the augmented commission changed the name to �Flynn� for good reasons.123 In the final report the augmented commission recorded that there appeared to have been an attention shift from growth in the south-east corner of the State, which had influenced the 2003 redistribution�s location of its new seat in that part of the State, to anticipated growth in major coastal cities from the Sunshine Coast to Cairns. Though none of the major political parties had suggested a division like Flynn, its existence was generally accepted once the redistribution committee had proposed it and the objections lodged focused rather on particular elements in the composition of some divisions with Flynn getting most attention. The objections were directed especially to the inclusion in the western end of Flynn of eight shires where grazing was still dominant when mining had taken over most of the 122 2003 Redistribution of Queensland into Electoral Divisions, 2003, Canberra, p.6. 123 2006 Redistribution of Queensland into Electoral Divisions , 2006, Canberra, p.9.

60
division. These shires would have preferred to be in Maranoa and denied they had any connection with Gladstone, the division�s principal city located at the opposite end of the division. The augmented commission, which had held a meeting attended by seven of the eight Mayors involved at Longreach in the middle of the discontented shires, recognised their claims as �weighty� and looked for an alternative.
But, ultimately, its endeavours were in vain: the inexorable imperative of numbers stood in the way. Every compensatory adjustment that was suggested either failed the test of the numbers or would, had it been adopted, have caused even greater problems, affecting a number of other divisions across the State, under the criteria set by the legislation.124
Adding the shires to Maranoa would exacerbate that division�s problems with size and the number of separate communities that had to be looked after, whereas the future development of Gladstone might create new links and some links already existed between the western eight shires and the substantial town of Emerald which was also in the new division and closer to them. Flynn received the lion�s share of electors brought into the area to create its seventh division; the largest parcel coming from a division outside the area, Hinkler. That transfer provided Flynn with the obligatory substantial urban centre in Gladstone together with the stretch of coast that usually went with urban centres in Queensland, but it also repeated Kennedy�s controversial thrust south-eastwards to some extent by moving into the Burnett once again when, in a minor part of settling Flynn�s boundaries, additional electors were added from Wide Bay. On the map the division ran mainly through more thinly-populated territory west along the central railway line; the augmented commission preferred to speak of the highways involved. Hinkler�s remaining urban centre, Bundaberg, now looked south once more as there had been a large transfer from Wide Bay including the growing coastal city of Hervey Bay. Wide Bay�s loss in turn set off a chain-reaction that extended southwards into the Sunshine Coast and produced partisan grievances at the points where National Party and Liberal Party seats, rather like tectonic plates, slid over one another. It may well have been the series of such changes, consequential on the creation of Flynn, which made the new division as controversial as it was � though the dissatisfaction of the western shires fitted best into traditional categories of complaint. A second lot of transactions across the area boundary restored Maranoa to quota after it had contributed substantially to Flynn. Blair, a relatively new division in the south-east, had been assembled in the 1997 redistribution from surplus parts of four peri-metropolitan divisions that were being pushed north and west by expansion of the metropolitan area, now contributed to Maranoa. The transfer into Blair at the time of its creation of 20 000 electors from the division of Oxley had been especially controversial because of the supposed adverse effect on Pauline Hanson�s chances of winning a seat in the House of Representatives. Despite leading on first preferences at the 1998 election, she was defeated on preferences in Blair. In an associated tidying-up operation that 124 Ibid., pp.7-8. The report includes maps which show local government authority boundaries.

61
happened to involve the area boundary, some electors from Groom were added to Maranoa. Within the area itself there was one largeish (but falling well short of �substantial� with enrolment total numbers now so high) secondary transfer involved in getting Flynn up to quota, and a pair of minor instances that sought to rectify earlier less-than-ideal decisions. In the first category, Capricornia gave electors from west of Rockhampton to Flynn, and was compensated from Dawson south of Mackay. Dawson in turn got a smaller number from Herbert. In the second category, Leichhardt transferred electors to Kennedy from the outskirts of Cairns, and Kennedy passed rather more to Herbert from the outskirts of Townsville. A recurring problem, which has usually proved insoluble, involves one division creeping too close to the principal urban centre of a neighbour, an unwelcome outcome mentioned previously in the context of the 1984 redistribution. The area�s high retention rate, together with the fact that only one division, Maranoa (with a 76.3 per cent retention rate), came close to being substantially altered, confirms that the intention to minimize movements of electors was achieved. Conclusions Can any lessons be drawn from the evidence, briefly sampled here, that covers two States � which contain half the Commonwealth�s population � and a century of independent officers� attempts to apply principles laid down for them by the legislature? The first, trite, conclusion must be that geography matters. Queensland is the simpler of the two cases. That part of the State where the four, then six, now seven, big divisions are to be found is and has been dominated by a string of major coastal cities � Cairns, Townsville, Mackay, Rockhampton and, more recently, Gladstone � but there have always been two divisions, Kennedy and Maranoa, which were different. Since the decline of Charters Towers early in the 20th century there has been only one major inland city in the State, Toowoomba, and that is close to Brisbane and located in a compact, tightly knit division � originally called Darling Downs after the district, later Groom � outside the area with which we are concerned. Kennedy has always contained both Charters Towers and Mt Isa which soon supplanted it with consequent tensions as to where the Electoral Office�s divisional office should be located. But at the 1912 redistribution (the first using sub-division figures) those two towns contained only 39 per cent of the divisional enrolment. By 1948 the proportion was down to 25 per cent and by 1984 up again but only to 30 per cent. Maranoa has been even less well provided with a major urban centre. Until very recently its biggest, Dalby, accounted for only 18 per cent (1912), 19 per cent (1948) and 15 per cent (1984) of Maranoa�s enrolment. Once away from the coast Queensland�s urban centres are small and distant from each other when compared with inland New South Wales. A great many square kilometres have to be moved to round up a few thousand electors, as successive redistribution commissioners have complained. Beyond the natural periphery of the area of big divisions lie two smaller cities whose main links might have been thought to lie in the opposite direction, but still could be

62
pushed into the area to make up the numbers. Bundaberg was twice incorporated in Capricornia, in 1906-12 and 1922-48, but is now separated from Capricornia by Hinkler. Warwick was added to Maranoa in 1992 and by the 2006 redistribution provided 22 per cent of its enrolment, but it is located too far from the main west-east axis of Maranoa that passes through Dalby and ends in Toowomba to perform the usual functions of a division�s urban centre. Its smaller neighbour, Stanthorpe, had already joined Maranoa in 1969. Between Warwick and Bundaberg lies a curve of relatively closely-settled shires with one or more medium size towns which have been disassembled and moved about regularly as the numbers required despite their complaints. Traditionally inland Queensland was dominated by mining and grazing, with grazing divisible between sheep and cattle if a distinction was required, but the work forces required by each of these �industries� have been relatively small and declined steadily through the 20th century. Agriculture was confined mainly to the coast and along the boundary between the big divisions� area and the rest, but with a few pockets like the Atherton Tableland and the Central Highlands further inland. The recent multiplication of towns in what is now the coal-mining inland has gone some way to stopping or even reversing the downward trend of the inland population, but the work force in open-cut mining is relatively small, and the new communities coal has created tend to be linked to particular coastal cities, first as their ports and then as their residential bases, rather than pick one of their number which is centrally located to become dominant. One plausible candidate for such a promotion, Emerald, started in Capricornia, went to Maranoa 1906-12, back to Capricornia 1912-1948, to Kennedy 1948-84, back to Maranoa 1984-2006, and now is in Flynn, which says something about the long-term instability of boundaries away from the coast. Longreach, which is further west on the central railway line and should have less mobile, started in Maranoa but was transferred to Kennedy in 1912 and stayed there � albeit always close to the southern boundary of the division � until transferred to Capricornia in 1997 and back to Maranoa in 2003. Some inland towns move more often than others. The attractions of living on the coast dominated Australian demographic trends in the period reviewed here, and have kept those of Queensland�s big divisions which run along the coast in step with the State as a whole, and sometimes a step ahead. They did not work for Kennedy and Maranoa, and consequently most Queensland redistributions have begun with two inter-related problems, how to get those two divisions up to an acceptable level and, second, what to do to fix the other, usually minor, problems that follow from the first activity or else could result from minor variations in enrolment growth in the other two or (after 1949) four divisions of the area. Our other case, New South Wales, has been more complicated. There all the big divisions have always lacked the attractions of coastal living, and consequently have experienced a steady decline in population and enrolment relative to the whole State which in turn has slipped slightly in the national cut-up of seats. Since 1948 the NSW share of the national pool of seats has fallen by 6 percentage points whilst Queensland�s has risen by more than 4 points. Only once (1962) has Queensland faced the anguish of a redistribution that followed the loss of a seat, and that trauma was ended when the redistribution was

63
abandoned. New South Wales had it actually happen five times, 1955, 1968, 1977 (when two seats were lost), 1992 and 2006, as well as being anticipated in the lapsed redistribution of 1962. Inland New South Wales has been likely to experience regularly the double jeopardy of a need to abolish a seat somewhere in the State and the evidence of its relative decline in enrolments pointing to where that can be done. Moreover, it is probably �easier� (which may mean �less controversial�) to redraw a smaller number of boundaries than a larger number just as, to adapt Sir Henry Parkes� excellent metaphor for the redistribution process, it is easier to build a house of cards with a few cards rather than having to use the whole deck. In this paper three categories of boundary have been mentioned. One is the boundaries between States and they constrain redistribution possibilities because they cannot be crossed. Another is the boundaries which each division shares with a contiguous neighbour. The more such neighbours a division has, the more options there will be for moving electors in or out to resolve the division�s own and wider problems. Finally there is a notional boundary between a group of divisions which may have a case for special consideration and the rest of their State. Such a boundary defining the big divisions� area has figured so prominently in the preceding discussion. The second and third categories can be examined in the light of statistics that count and calculate the averages of the number of boundaries each division has with other divisions, both within the big divisions� area and across the area border, at each effective i.e. implemented redistribution of which there have been 13 for New South Wales and 15 for Queensland. Usually for New South Wales the typical big division has had between two and three contiguous neighbors within the big divisions� area. Averages greater than three were uncommon and arose from a particular redistribution when the pool was enlarged and the subsequent one when change was minimal � 3.3 and 3.4 in 1948 and 1955. Potentially of greater interest because it raises the question whether the electors of the big divisions warrant special consideration, there were rather fewer contiguous divisions across the area boundary. All the instances prior to 1977 were below 2.0 and went down to just over 1.0 a couple of times (1955 and 1948). Thus those inter-divisional boundaries may have had a special significance but there were fewer of them as well, and so they were less available as well as undesirable. The area boundary crossing averages are distorted by two divisions, Macquarie and New England. They account for at least half the shared boundaries at every redistribution, and deserve attention as further illustrations of the extent to which the redistribution experience of particular divisions can vary. To start with, their respective retention rate averages are very different and retention rates are always a matter of concern to redistribution commissioners and electors alike, high rates are good and low rates are bad. In 2006 Macquarie was drastically altered and New England remained unchanged, but over the seven redistributions prior to 1984 there was little difference between them, Macquarie�s average retention rate was 82.8 per cent and New England�s 87.9. However, in the four redistributions 1984-99 they appear to be very different, as Macquarie�s average retention rate is 66.3 per cent and New England�s is 98.3 per cent. Macquarie�s

64
boundaries were drastically redrawn twice (1984 and 2006) but New England�s were never subject to more than minor tinkering. Reverting to the equation of �substantial� with a cut-off set at 75 per cent, over the 13 redistributions Macquarie was hit hard four times (1948, 1977, 1984 and 2006) but New England only once (1948). A possible explanation, already mentioned, could be that the NSW big divisions� area boundary is almost impervious from the Queensland border down to the Hunter Valley, then becomes permeable for some distance, and finally tightens up again once the Hume Highway has been crossed and resumes being almost impervious down to the Victorian border. More plausible might be that Macquarie is too close to the demographic explosion of the western suburbs of Sydney, and is frequently put in play to solve problems generated outside the big divisions� area. The small number of Queensland�s big divisions, and the limited length of the area boundary dividing them from the rest of the State, produces very different outcomes. The average score for boundaries within the area varied little � as did the total number of divisions within the area � with 2.7 seven times and 2.5 five times out of a possible 15 redistributions. Only once did the average rise to 2.8 and that was 2006 when a seventh division was added to the area. Divisions paired along the area boundary were almost always the same two, Capricornia with Wide Bay and Maranoa with Darling Downs. The exceptional cases when some other division touched the area boundary, Dawson (1955) and Kennedy (1969, 1977), were much criticised as unnatural extensions of an �inland� division or a �northern� division. After 1948 there were additional divisions across the boundary to exchange electors with, usually involving Maranoa, but very recently the number of divisions on the south-eastern side of the area boundary may have begun to contract again. New South Wales traditionally has had more problems with area border crossing than Queensland because it had more places where such problems were likely to occur. A second tentative conclusion, also likely to be trite but given past neglect of the topic still worth making, is that a major alteration in a State�s number of divisions to be redistributed may be more disruptive than the addition or subtraction of a single division to or from the pool, and the latter may to be more disruptive than when there is no change at all in the size of the pool. Table 37, derived from final reports only, offers some evidence. For both States, the two redistributions when the House was enlarged (1948, 1984) have conspicuously lower retention rates than the substantial number of redistributions when the number of divisions in the State remained unchanged, and the consequences are much the same for both States. But in the redistributions when there was only slight change, usually one division more or less, the picture is more complicated. In the first place, New South Wales usually has a loss and Queensland usually has a gain. Second, in New South Wales the big divisions� area consistently declines against the State as a whole, whilst in Queensland it holds its own. Thus accommodating a change is more likely to be pushed into the area in New South Wales, but could end up anywhere in Queensland. The result is that Queensland�s retention rate is much higher � except for the one instance when there was a statewide decline and an area division was to be sacrificed.

65
The proposal that Dawson be sacrificed, it will be remembered, was half the explanation for the Coalition parties disagreeing on whether to accept the 1962 redistribution. In practice to fire a round of trenchant criticism at how the redistribution process has been worked on any occasion, only one suspect division is needed. Similarly participants in the consultative process will suggest the means to remove that division�s defects without examining the inevitable flow-on to adjacent divisions. Table 37 Change in statewide pool of divisions (n = number of redistributions) and big divisions� area retention rate (% = average) NSW Qld n % n % No change 5 86.7 7 87.3 Change -1 5 78.9 1 84.3 -2 1 72.6 0 n.a. +1 2 73.8 7 92.5 Large 2 63.2 2 62.8 Moving to the experience of individual divisions, when an arbitrary quantity, less than 75 per cent of electors remaining in their previous division, is used to suggest a qualitative change by labeling �substantial� impacts and pointing to �stressed� divisions, it should be borne in mind that there may be narrow misses. For example, the big divisions� area of New South Wales had figures just above that line in 1962 and 1992 and Queensland�s area-wide retention rate was just below that line once. Individual divisional figures may miss narrowly as well. In New South Wales the two House enlargement redistributions account for a disproportionate number of cases of stress, both area-wide � in 1948 (65.9 per cent) and 1984 (60.5 per cent), and for individual divisions � ten cases out of a total of 26. But some divisions are more likely to be �stressed� than others. Canobolas/Calare is the prize example with five instances (1906, 1912, 1962, 1968, 1977) in addition to the enlargement redistributions of 1948 and 1984, and it is possible that being in the middle of the area increases risk. Another �middle� division, the short-lived Lawson, fell below that line only once. Putting aside the enlargement redistributions, three �peripheral� NSW divisions went below the line twice, and another three once. Farrer is the only exception, but having been created in 1948 it was caught in the general melee of 1984. The more divisions there are, the more neighbors they are likely to have, and the more likely it is that a large transfer can be required or that a number of smaller ones will accumulate. There has been one division in the two States, Leichhardt, which since its creation in 1949 has had at most only two neighbors and more usually only one, tucked away as it is in a far corner of the area, the State and the Commonwealth. Dawson, which was the first Queensland division to be truly �in the middle,� is the one instance in that state of being �stressed� twice other than in the House enlargement scenarios. The difference between the two States continued in 2006. In Queensland only Maranoa (76.3 per cent) came close to falling below the line. In New South Wales the area as a whole (66.8 per cent) was below it, two interacting divisions, Calare (55.0 per cent) and

66
Macquarie (54.4 per cent), were well below, whilst the main subject of controversy, Parkes (52.6 per cent), was worse still. It can also be asked how often �significant� transfers across the big divisions� area border have to be made for these ought to be, by definition if the big divisions are inherently different, potentially more stressful. Looking at the outcomes of final reports (as shown in the Appendix tables), New South Wales recorded 26 internal and 10 cross-border substantial transactions, Queensland only 11 and 6 respectively. Not surprisingly, 18 out of the total of grand total of 53 are accounted for by the enlargement redistributions of 1948 and 1984, and another 5 by the failed redistribution of 1975 when a 10 per cent deviation from quota was first imposed. When the bag has been shaken that vigorously, the area boundary is more likely to be ignored. A focus on each State separately adds a couple of possibilities. Apart from the twin redistributions of 1931 and 1934, first lapsed and then achieved, and the vigorous shake-ups just mentioned, significant transfers are for New South Wales a recent phenomenon � and every redistribution since 1984 has had one. But for Queensland, apart from the shake-ups, they were an early phenomenon, confined to the first three redistributions as Bundaberg and district were tossed back and forth between Capricornia and Wide Bay. Not until 2006, and in the same general area though not involving the city of Bundaberg itself this time, was a substantial transfer made across the area border once more. That is not to say that the residents of one State may be become habituated to drastic changes to one or more of their divisions, while another will be affrighted by an unexpected rare phenomenon. It appears from what has been said or written, within the redistribution process itself and in the media and the parliaments concerned, that concern often focuses on a single case, the injury apparently done to the electors of one division by alleged neglect of one or, less often, a couple of the qualitative criteria. Attention to supposed misuse of, or alternatively the malign influence of, the quantitative criterion is ordinarily confined to the really professional players, the parliamentarians and a few of their party activists, who know of its existence and its statute-guaranteed ability to trump any one qualitative criterion, or the array of them if necessary. The intermediaries between the professionals and the electors, the journalists of the various media, almost invariably take each redistribution as a thing in itself and treat the outcome for any one division as quite separate from all the other happenings of the redistribution. The recent hubbub about Farrer and Flynn was no more than the latest chapter in a story that has been repeating itself for the past hundred years but is too often written up as if it were brand new. Is there anything to be done? The simplest answer to that question, one that would dispose of the problem completely, is to change the electoral system. If members of the House of Representatives were elected by some form of proportional representation, as are the members of the Senate, there would be no need for internal boundaries within each State or Territory. A variation on that reply could be that if local government authorities were sufficiently consolidated and their boundaries made difficult to alter, the number of members returned by each

67
could be determined by a population (or enrolment) formula � as is done now for the States � and there would be no need to draw internal boundaries just for parliamentary elections, provided again that some system of proportional representation were adopted. Weighing current dissatisfaction with redistribution procedures against the enduring hostility to proportional representation in the major parties, there can be little point in pursuing that line of thought, and we should turn instead to considering whether something needs to be done to the boundary-drawing process and, if so, what. We can start with the Commonwealth Constitution: what is now in it, should something be taken out, should something(s) be put in? Two existing provisions have been mentioned earlier. There is a prohibition, �A division shall not be formed out of parts of different States,� (s.29), and an exhortation �The number of members chosen in the several States shall be in proportion to the respective numbers of their people� (s.24) which, as interpreted by the High Court and applied in legislation by successive governments, has increased the frequency of redistributions and effectively ensured that they will take place. Being able to create a division that straddled one (or more) State boundaries has no obvious attractions, now that the two most plausible components of such a division, Broken Hill and Mt Isa, are both so diminished in the number of their electors. There is no need to tamper with s.24, but an amendment to the Commonwealth Constitution that would operate rather like the Commonwealth Electoral Legislation Amendment Act 1983, s.25ZC�s (now CEA s.76) scheme for a �mini-redistribution� might be considered. If a seat were gained by a State or Territory the existing largest division would be split into two, or if a seat were lost the two smallest contiguous divisions in the State or Territory would be merged; this safety-belt would operate for say three elections after each general redistribution. It might achieve the purpose Murphy, J. once thought the criterion of existing electoral boundaries intended, �any too frequent or unnecessary alteration of which may be disruptive of relations between an electorate and its member.�125 But the complexity of the idea, not to mention its hearty contempt for the principle of equality, would make it an unlikely venture with the electorate, even if a government with a majority in both chambers could be persuaded which is implausible its own right. It is unlikely that trying the same remedy by an amendment of the CEA would survive challenge in the High Court. As to the possibility of entrenching in the Constitution some valued provision which is at risk by being located in the CEA, when the High Court grappled with the matter in McGinty’s Case Dawson, J. conceded that it was possible:
It is fallacious reasoning to posit a system of representative government for which the Constitution does not provide and to read the requirement of that system into the Constitution by implication. An implication of that kind is drawn from an extrinsic source and not from the text of the Constitution. It imports into the Constitution values which the Constitution does not adopt notwithstanding that it is capable of accommodating them. The Constitution does not, for these reasons,
125 Attorney-General (ex rel. McKinlay) v Commonwealth of Australia, at 634.

68
contain by implication the principle expressed in the words �one vote, one value�, but the parliament may, should it consider it desirable to do so, adopt that principle in exercising its power to provide for electoral divisions. Indeed, it has done so in accordance with its view of the practicalities in the Commonwealth Electoral Act 1918 (Clth) [including s.66 which makes provision for the plus or minus 1/10 margin].126
Doug Anthony�s suggestion that a 20 per cent variation might be so enshrined was mentioned earlier. However the 1988 Fair Elections referendum, which sought to protect 10 per cent by this means, failed in every State, was carried in only 19 divisions, and secured only 37.6 per cent of the national vote.127 Amending the Commonwealth Constitution is a very long shot. Absent a better alternative, amending the CEA itself appears to be where one might realistically start. The first question might be who should draw the boundaries. The number per State (or Territory) has grown from one to three to four with six at the appellate stage, and that seems quite large enough. An unequivocally judicial element has been introduced without tainting the judicial, current or past, members with political mud-slinging. Having one member, the Electoral Commissioner, serve on all the redistribution committees, and all three members of the AEC serve on all the augmented commissions, avoids the risk of unwarranted variation in the application of the CEA. A suggestion of conversion from non-partisan to bi-partisan membership would quickly be met by reference to the American experience which proves the need for further machinery to resolve the deadlocks that regularly result in bi-partisan bodies. The next question comes in two parts � when to start and how long might the process be able to continue once it has started. The first half is tied up with the Constitution, as has been pointed out already and, apart from some juggling of a month or two in the passage of time after the last general election before the process kicks off, appears uncontroversial. The 1998 amendment may, it is too early to be certain, solve the problem of a State which is growing so rapidly that it is likely to need a redistribution for every new parliament. The South Australian House of Assembly is already subject to such a regime, but there does not appear to be any interest in adopting it federally. As to the second half of the question, in those countries which have thought about the matter Australia is often commended for the expedition with which it completes a redistribution. With the advent of continuous campaigning, it is likely that the major parties at least will want the maximum notice if the landscape has been changed. It might be that expansion of a political consultants� profession and its accumulation of redistribution expertise could help. Some years ago the present writer received a Christmas card from one such firm in the United States, showing Santa Claus at work drawing electoral boundaries on his terminal, and this is probably the way of the future for input, at least from the major players. 126 McGinty v Western Australia, 186 CLR 140, at 188, emphasis added. 127 1988 Referendums: Statistics, 1990, Canberra, AGPS.

69
Expedition also affects the question of judicial review, whether it should be encouraged or attempts made to prevent the possibility of it happening. Given the alacrity with which the courts, including the High Court, can dispose of knotty questions raised in the final weeks of campaigns, and the infrequency with which a genuine crisis (as distinct from a government�s pursuit of advantage) erupts in the parliamentary timetable, there is not much to worry about. Where there may be occasion for reflection, not least because it was a complaint made in respect of the 2006 redistribution, comes from the introduction of public hearings. How many should there be and how widely should they be spread through disputed territory? If the burghers of X are dissatisfied, is it unreasonable to ask them to travel to Y for their day in court? This is a problem in symbolic politics, and can best be judged by the redistribution authority concerned. It may also be a matter of exposition: the authority might be able to disabuse the dissatisfied by explaining the previously unmentioned consequences of giving them what they wanted, but this can easily be mistaken for dodging their grievance. When the decision was taken in 1983 to require giving reasons, one ground put to the JSCER was that particular decisions �may have been substantially influenced, or sometimes almost entirely determined, by more pressing or substantial considerations elsewhere,� and this is certainly being done.128 Perhaps the text might be more even extensive at the redistribution committee stage, especially about rejected alternatives. Perhaps other media forms could be utilised on the AEC�s website to present the arguments more effectively than prosy print. The substance of the thinking that shaped the proposals is certainly now in the public domain to an extent that it was not prior to 1983. Political review is another matter. The paper shows how often prior to 1983 proposals were rejected, and either the whole project abandoned or the commissioners told to try again, and sometimes told a second time. A warning that �the depoliticisation of redistributions is probably the most [recent change to electoral administration] at risk� among the 1983 amendments to the CEA has been published elsewhere.129 Whilst the special problems of extra-big divisions figured in the arguments that led to defeat or abandonment of redistributions prior to 1983, they were by no means the only justification offered, and it would be more realistic to say that partisan advantage was the principal cause when the redistribution of one State or many failed to secure acceptance. To that extent, the question lies outside the scope of this paper. Finally it might be asked whether the criteria to be applied should be altered. Little attention has been paid to the qualitative criteria for some time, and so far as is known no amendments have been in circulation or under scrutiny. In contrast the two quantitative criteria, the parameters around the quota and around the enrolment equality target, have been raised. It is difficult to see that the change from 20 per cent to 10 per cent for the
128 For example, for the area of concern in New South Wales in 2006 Proposed Redistribution of New South Wales into Electoral Divisions, n.d., Canberra, AEC, pp.20-21, 25-27 and 2006 Redistribution of New South Wales into Electoral Divisions, 2006, Canberra, AEC, pp.8-11. 129 Colin Hughes and Brian Costar, Limiting Democracy: The Erosion of Electoral Rights in Australia, 2006, Sydney, University of NSW Press, p.24.

70
first increased, reduced or had any significant effect on levels of satisfaction or dissatisfaction with redistributions before and after the number was changed. The same thing could be said, although the time periods on either side of the change are much shorter, for 2 per cent or 3.5 per cent halfway through the life of a redistribution, since anticipatory action has been provided in the CEA (s.63A(3)).. The nub of the matter is whether there should be some additional criterion that allows some divisions to be treated differently on the quantitative criterion, with area by far the strongest candidate for adoption. Experience of the 5000 square kilometer rule was short-lived, and the change was little taken up by the 1977 cohort of commissioners; to return to it would have to be an act of faith and/or blatant partisanship. A much less generous figure, 100 000 sq.km., would benefit the divisions discussed in the paper plus a couple more from Western Australia, South Australia and the Northern Territory. Although there is no equivalent federal experience to back it up, the formula greatly reduced redistribution-related disputation in Queensland when it was introduced there for state elections. If asked to do so by the Joint Standing Committee on Electoral Matters (it would be improper for the Minister to do so), it would be relatively easy for the AEC to model its effect in two or three scenarios for all the five jurisdictions likely to be involved. That is probably the only suggestion for possible change that warrants serious attention at the present time, but the opinion that some of the commentators on what happened in 2006 could do with a cold shower might be thrown in.

71
APPENDIX Table 2 Outcome of the 1906 redistribution Across area boundary +28.3% -17.1% net+11.3%* Divisions unchanged Barrier, Darling slight change Gwydir, Hume, Macquarie, New England, Riverina substantial change Canoblas abolished Bland Significant transfers Bland>Darling 25.1%, Bland>Riverina 31.3%* Electors in same division 67.7%** * % of a quota ** % of area original enrolment Table 3 Outcome of the 1912 redistributions I and III Across area boundary +63.5% -14.2% net+49.1%* Divisions unchanged Barrier, Darling, Hume, New England slight change Gwydir, Macquarie, Riverina substantial change Calare abolished Nil Significant transfers Nil Electors in same division 89.6%** * % of a quota ** % of area original enrolment Table 4 Outcome of the 1912 redistribution II Across area boundary +27.0% -105.7% net-78.3%* Divisions unchanged Barrier, Darling slight change Hume substantial change Canoblas, Gwydir, New England Abolished Macquarie, Riverina Significant transfers Gwydir>New England 37.5%, Macquarie>Nepean 31.9%,
Macquarie>Robertson 26.8%, New England>Gwydir-Namoi 29.2%, Riverina>Barrier 32.4%, Riverina>Calare 38.7%*
Electors in same division 69.7%** * % of a quota ** % of area original enrolment

72
Table 5 Outcome of the 1922 redistribution Across area boundary +53.2% -5.8% net+47.4%* Divisions unchanged Nil slight change Canoblas, Gwydir, Hume, Macquarie, New England, Riverina substantial change Darling abolished Barrier Significant transfers Darling>Gwydir 29.1%, Barrier>Darling 46.9%* Electors in same division 77.9%** * % of a quota ** % of area original enrolment Table 6 Outcome of the 1931 redistribution Across area boundary +90.3%* Divisions unchanged Hume, Riverinal slight change Calare, Darling, New England, Riverina substantial change Gwydir, Macquarie abolished Nil Significant transfers Robertson>Macquarie 24.8%* Electors in same division 87.8%** * % of a quota ** % of area original enrolment Table 7 Outcome of the 1934 redistribution Across area boundary +67.1%* Divisions unchanged Macquarie, Riverina slight change Calare, Darling, Hume, New England substantial change Gwydir abolished Nil Significant transfers Robertson>New England 26.38%* Electors in same division 90.8%** * % of a quota ** % of area original enrolment

73
Table 8 Outcome of the 1948 redistribution Across area boundary +29.5% -85.5% net -56.1%* Divisions unchanged Nil slight change Nil substantial change Calare, Darling, Gwydir, Hume, Macquarie, New England,
Riverina abolished Nil Significant transfers Darling>Lawson 36.2%, Gwydir>Lawson 38.9%. Hume>Farrer
65.1%, Macquarie>Mitchell 32.5%, New England>Paterson 43.9%*
Electors in same division 65.9%** * % of a quota ** % of area original enrolment Table 9 Outcome of the 1955 redistribution Across area boundary +67.1%* Divisions unchanged Farrer, Hume slight change Calare, Darling, Gwydir, Lawson, Macquarie, New England,
Riverina substantial change Nil abolished Nil Significant transfers Nil Electors in same division 96.3%** * % of a quota ** % of area original enrolment Table 10 Outcome of the 1962 redistribution Across area boundary -41.9%* Divisions unchanged Macquarie, Riverina slight change Darling, Farrer, Hume substantial change Calare, Lawson, New England abolished Gwydir Significant transfers Gwydir>Lawson 41.3%, Gwydir>New England 28.6%,
Lawson>Calare 29.9%* Electors in same division 75.0%** * % of a quota ** % of area original enrolment

74
Table 11 Outcome of the 1968 redistribution Across area boundary -21.1%* Divisions unchanged Darling, Farrer, Macquarie, Riverina slight change Gwydir, Hume, New England substantial change Calare abolished Lawson Significant transfers Lawson>Calare 27.5%, Lawson>Gwydir 30.2%* Electors in same division 82.4%** * % of a quota ** % of area original enrolment Table 12 Outcome of the 1975 redistribution Across area boundary +37.4% -22.7% net+14.7%* Divisions unchanged Calare, New England slight change Farrer, Gwydir, Hume, Macquarie substantial change Darling abolished Riverina Significant transfers Darling>Gwydir 38.4%, Eden-Monaro>Hume 27.3%,
Riverina>Darling 65.1%* Electors in same division 74.8%** * % of a quota ** % of area original enrolment Table 13 Outcome of the 1977 redistribution Across area boundary +30.4% -29.0% net+1.4%* Divisions unchanged New England slight change Farrer, Gwydir, Hume, Riverina substantial change Calare, Macquarie abolished Darling Significant transfers Darling>Gwydir 24.4%, Darling>Riverina 34.7%,
Macquarie>Calare 40.9%* Electors in same division 72.6%** * % of a quota ** % of area original enrolment

75
Table 14 Outcome of the 1984 redistribution (final) Across area boundary +107.9% -126.1% nwt-18.2%* Divisions unchanged Nil slight change New England, Riverina substantial change Calare, Farrer. Gwydir, Hume, Macquarie abolished Nil Significant transfers Calare>Parkes 25.3%, Farrer>Hume 43.0%, Gwydir>Parkes
56.1%, Macquarie>Lindsay 95.5, Paterson>Gwydir 49.4%, Riverina>Farrer 23.1% *
Electors in same division 60.5%** * % of a quota ** % of area original enrolment Table 15 Outcome of the 1992 redistribution (final) Across area boundary +55.8% -30.6% net+25.2%* Divisions unchanged Nil slight change Calare, Farrer, Macquarie, New England substantial change Gwydir, Hume, Parkes abolished Riverina-Darling Significant transfers Gilmore>Hume 53.9%, Hume>Riverina 51.7%, Riverina-
Darling>Parkes 38.4%* Electors in same division 76.4%** * % of a quota ** % of area original enrolment Table 16 Outcome of the 1999 redistribution (final) Across area boundary +69.3% -4.1% net+65.2%* Divisions unchanged Farrer slight change Calare, Gwydir, Macquarie, New England, Parkes, Riverina substantial change Hume abolished Nil Significant transfers Macarthur>Hume 47.1%* Electors in same division 90.6%** * % of a quota ** % of area original enrolment

76
Table 17 Outcome of the 2006 redistribution (final) Across area boundary +6.03% -84.1% net-78.3%* Divisions unchanged New England slight change Farrer, Hume, Riverina substantial change Calare, Macquarie, Parkes abolished Gwydir Significant transfers Calare>Macquarie 44.4%, Gwydir>Parkes 73.5%,
Macquarie>Greenway 44.9%, Parkes>Calare 41.9%* Electors in same division 90.6%** * % of a quota ** % of area original enrolment Table 18 Outcome of the 1906 redistribution Across area boundary +25.0%* (approx) Divisions unchanged Herbert, Kennedy slight change Capricornia, Maranoa substantial change Nil abolished Nil Significant transfers Wide Bay>Capricornia 25.0%*Electors in same division 94.4%** * % of a quota ** % of area original enrolment Table 19 Outcome of the 1912 redistribution (majority) Across area boundary -26.7%* Divisions unchanged Kennedy slight change Capricornia, Herbert, Maranoa substantial change Nil abolished Nil Significant transfers Capricornia>Wide Bay 26.7%, Maranoa>Capricornia 25.6%* Electors in same division 82.4%** * % of a quota ** % of area original enrolment
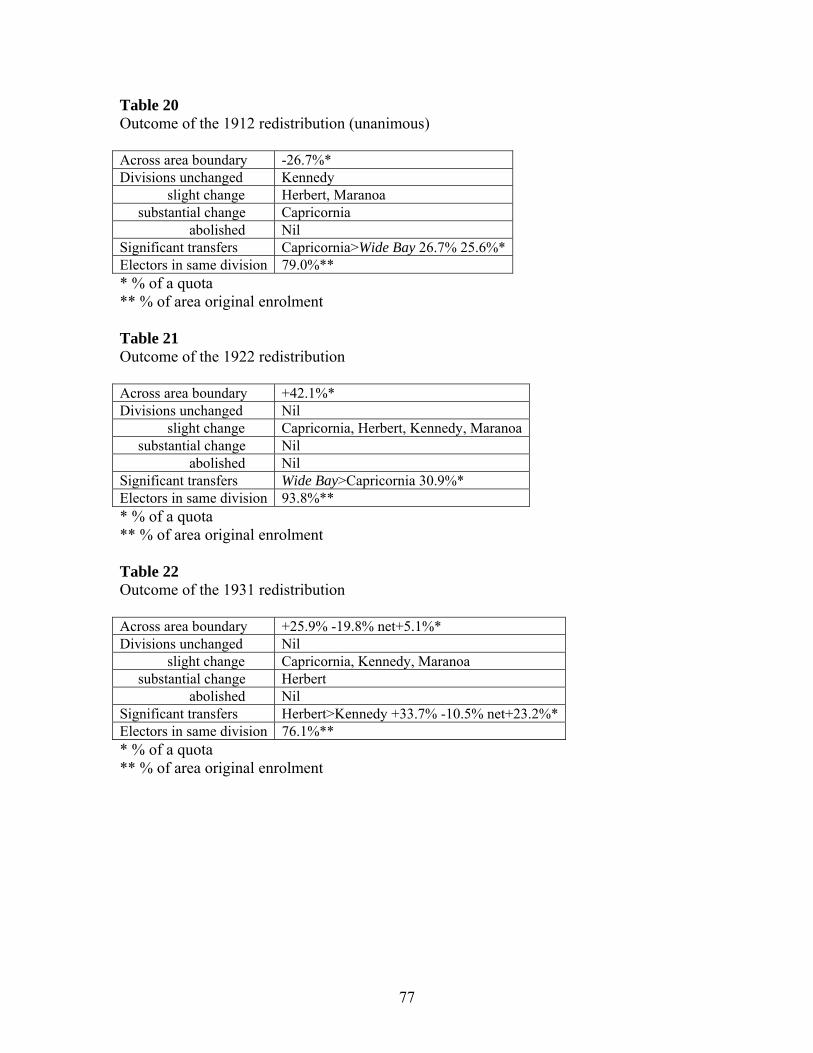
77
Table 20 Outcome of the 1912 redistribution (unanimous) Across area boundary -26.7%* Divisions unchanged Kennedy slight change Herbert, Maranoa substantial change Capricornia abolished Nil Significant transfers Capricornia>Wide Bay 26.7% 25.6%*Electors in same division 79.0%** * % of a quota ** % of area original enrolment Table 21 Outcome of the 1922 redistribution Across area boundary +42.1%* Divisions unchanged Nil slight change Capricornia, Herbert, Kennedy, Maranoa substantial change Nil abolished Nil Significant transfers Wide Bay>Capricornia 30.9%* Electors in same division 93.8%** * % of a quota ** % of area original enrolment Table 22 Outcome of the 1931 redistribution Across area boundary +25.9% -19.8% net+5.1%* Divisions unchanged Nil slight change Capricornia, Kennedy, Maranoa substantial change Herbert abolished Nil Significant transfers Herbert>Kennedy +33.7% -10.5% net+23.2%*Electors in same division 76.1%** * % of a quota ** % of area original enrolment

78
Table 23 Outcome of the 1934 redistribution Across area boundary +28.6% -8.0% net+20.5%* Divisions unchanged Kennedy, Maranoa slight change Capricornia substantial change Herbert abolished Nil Significant transfers Herbert>Kennedy +27.2%*Electors in same division 90.6%** * % of a quota ** % of area original enrolment Table 24 Outcome of the 1948 redistribution Across area boundary -91.8.0% Divisions unchanged Nil slight change Nil substantial change Capricornia, Herbert, Kennedy, Maranoa abolished Nil Significant transfers Capricornia>Dawson 34.8%, Capricornia>Wide Bay 37.5%,
Herbert>Dawson 58.1%, Kennedy>Leichhardt 77.4%* Electors in same division 53.1%** * % of a quota ** % of area original enrolment Table 25 Outcome of the 1955 redistribution Across area boundary +8.8% -0.3% net+8.5%* Divisions unchanged Herbert, Maranoa slight change Capricornia, Kennedy, Leichhardt substantial change Dawson abolished Nil Significant transfers Dawsont>Capricornia 29.6%* Electors in same division 90.6%** * % of a quota ** % of area original enrolment

79
Table 26 Outcome of the 1962 redistribution Across area boundary -24.1%* Divisions unchanged Herbert, Leichhardt, Maranoa slight change Kennedy substantial change Capricornia abolished Dawson Significant transfers Dawson>Capricornia 56.1%* Electors in same division 84.3%** * % of a quota ** % of area original enrolment Table 27 Outcome of the 1968 redistribution (majority I) Across area boundary +15.8%* Divisions unchanged Dawson, Maranoa slight change Capricornia, Herbert, Kennedy, Leichhardt substantial change Nil abolished Nil Significant transfers Nil Electors in same division 91.6%** * % of a quota ** % of area original enrolment Table 28 Outcome of the 1968 redistribution (majority II) Across area boundary +15.8%* Divisions unchanged Maranoa slight change Capricornia, Dawson, Herbert, Kennedy, Leichhardt substantial change Nil abolished Nil Significant transfers Nil Electors in same division 90.3%** * % of a quota ** % of area original enrolment

80
Table 29 Outcome of the 1975 redistribution Across area boundary -8.1%* Divisions unchanged Capricornia, Leichhardt slight change Herbert, Maranoa substantial change Dawson abolished Kennedy Significant transfers Kennedy>Dawson 30.3%, Kennedy>Maranoa/Flynn 32.6%* Electors in same division 76.2%** * % of a quota ** % of area original enrolment Table 30 Outcome of the 1977 redistribution Across area boundary +32.1%* Divisions unchanged Dawson, Kennedy, Leichhardt, Maranoa slight change Capricornia, Herbert substantial change Nil abolished Nil Significant transfers Nil Electors in same division 98.9%** * % of a quota ** % of area original enrolment Table 31 Outcome of the 1984 redistribution (final) Across area boundary +1.0% -87.3% net-86.3%* Divisions unchanged Nil slight change Dawson, Herbert, Leichhardt, Maranoa substantial change Capricornia, Kennedy Abolished Nil Significant transfers Capricornia>Hinkler 45.8%, Dawson>Capricornia 25.4%,
Leichhart>Kennedy 32.1%* Electors in same division 76.2%** * % of a quota ** % of area original enrolment

81
Table 32 Outcome of the 1992 redistribution (final) Across area boundary +19.7% -9.4% net+10.3%* Divisions unchanged Dawson slight change Capricornia, Herbert, Kennedy, Leichhardt, Maranoa substantial change Nil abolished Nil Significant transfers Nil Electors in same division 92.7%** * % of a quota ** % of area original enrolment Table 33 Outcome of the 1994 redistribution (final) Across area boundary -4.1%* Divisions unchanged Capricornia, Dawson, Kennedy, Leichhardt, Maranoa slight change Herbert substantial change Nil abolished Nil Significant transfers Nil Electors in same division 99.1%** * % of a quota ** % of area original enrolment Table 34 Outcome of the 1997 redistribution (final) Across area boundary -16.4%* Divisions unchanged Nil slight change
Capricornia, Dawson, Herbert, Kennedy, Leichhardt, Maranoa
substantial change Nil abolished Nil Significant transfers Nil Electors in same division 92.3%** * % of a quota ** % of area original enrolment
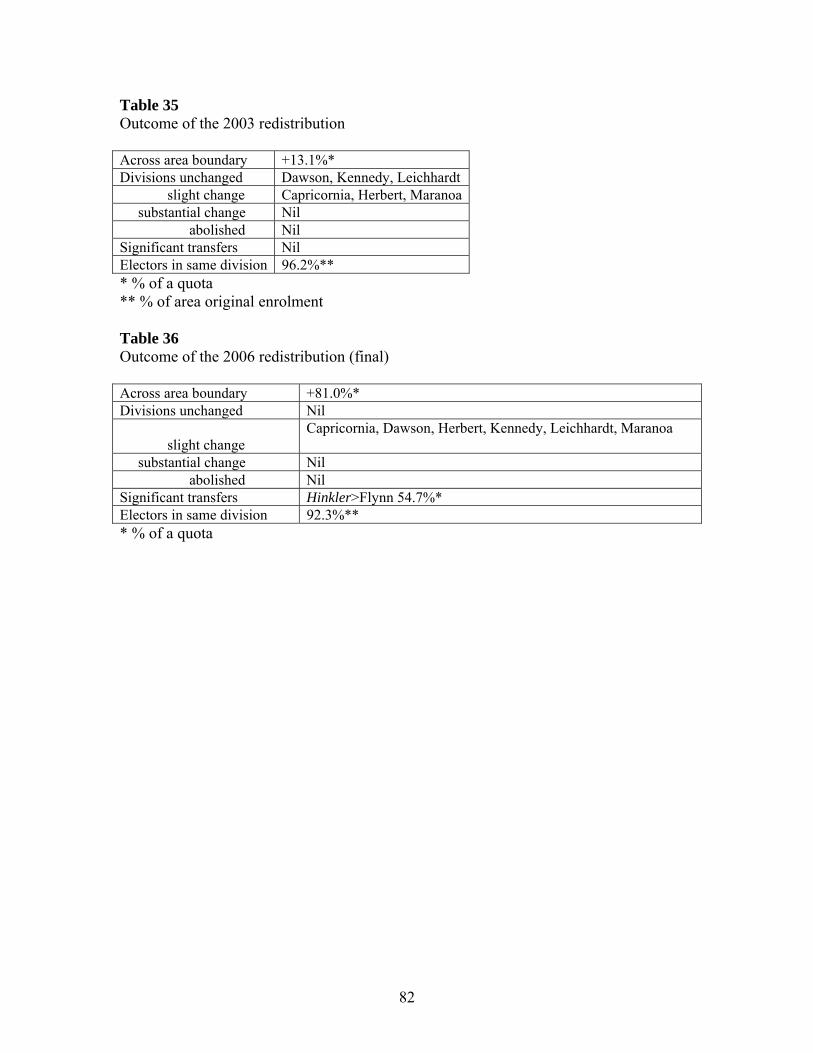
82
Table 35 Outcome of the 2003 redistribution Across area boundary +13.1%* Divisions unchanged Dawson, Kennedy, Leichhardt slight change Capricornia, Herbert, Maranoa substantial change Nil abolished Nil Significant transfers Nil Electors in same division 96.2%** * % of a quota ** % of area original enrolment Table 36 Outcome of the 2006 redistribution (final) Across area boundary +81.0%* Divisions unchanged Nil slight change
Capricornia, Dawson, Herbert, Kennedy, Leichhardt, Maranoa
substantial change Nil abolished Nil Significant transfers Hinkler>Flynn 54.7%* Electors in same division 92.3%** * % of a quota