the impacts of the massachusetts health care reform on ... · research will explore this issue...
TRANSCRIPT

1
The Impacts of the Massachusetts Health
Care Reform on Hospital Operating Cost
and Quality of Medical Services
An Interactive Qualifying Project Report submitted to the Faculty of
WORCESTER POLYTECHNIC INSTITUTE
in partial fulfillment of the requirements for the
Degree of Bachelor of Science
by
Yizheng Liao, Kate Pellegriti, Kun Peng, and Mingnan Sun
Date: March 4th
, 2011
Advisors: Fabienne Miller, Justin Wang

2
Table of Contents
Table of Figures ..........................................................................................................................4
Table of Tables ...........................................................................................................................5
Abstract ......................................................................................................................................6
1.0 Introduction ..........................................................................................................................7
2.0 Background Information........................................................................................................9
2.1 National Background .........................................................................................................9
2.2 Why Massachusetts? ........................................................................................................ 11
2.3 Timeline of the Reform .................................................................................................... 13
2.4 Properties of the Reform .................................................................................................. 15
2.5 The Short-term Results of the Reform .............................................................................. 16
2.6 An Example of International Reform ............................................................................... 18
3.0 Literature Review ................................................................................................................ 20
3.1 How to Measure Hospital Cost......................................................................................... 20
3.2 How to Measure the Quality of Health Services ............................................................... 21
3.3 How to Measure Impacts of Reform on Hospital Cost and Quality ................................... 25
3.4 Conclusion and Hypotheses ............................................................................................. 28
4.0 Methodology ....................................................................................................................... 29
4.1 Hypothesis Testing .......................................................................................................... 29
4.2 Data Collection Methods ................................................................................................. 30
4.2.1 Hospital Cost Data Collection ................................................................................... 30
4.2.2 Hospital Quality Data ................................................................................................ 36
4.2.3 Hospital List .............................................................................................................. 38
4.2.4 Population Data ......................................................................................................... 38
4.2.5 Control Variable Collection ....................................................................................... 38
4.3 Statistical Analysis........................................................................................................... 39
4.4 Difference-In-Differences ................................................................................................ 40
4.5 Econometric Modeling of the Health Industry .................................................................. 41
4.5.1 Cost Model ................................................................................................................ 42

3
4.5.2 Quality Model ........................................................................................................... 45
4.6 Regression Analysis ......................................................................................................... 49
5.0 Results ................................................................................................................................ 52
5.1 Descriptive Statistics ........................................................................................................ 52
5.2 Summary Statistics .......................................................................................................... 54
5.3 Results of Regression Analysis ........................................................................................ 62
5.3.1 Total Cost .................................................................................................................. 62
5.3.2 Salaries...................................................................................................................... 62
5.3.3 Quality ...................................................................................................................... 63
6.0 Discussion ........................................................................................................................... 68
6.1 Our Results ...................................................................................................................... 68
6.2 Limitation ........................................................................................................................ 69
6.3 Technological Impacts ..................................................................................................... 70
6.4 Further Research .............................................................................................................. 70
Bibliography ............................................................................................................................. 72
Appendix .................................................................................................................................. 76
Appendix A: Additional Information about the Properties of the Reform .............................. 76
Appendix B: CMS Defined Name for CMS Hospital and Health Care Complexes ................ 77
Appendix C: SQL Query for the Hospital Cost Data ............................................................. 78
Appendix D: Hospital List ..................................................................................................... 81
Appendix E: Regression Tables ............................................................................................. 85
Appendix F: Indicators Abbreviation ..................................................................................... 98
Appendix G: Graphs of Trends of Dependent Variables in Massachusetts, Connecticut and
Wisconsin ............................................................................................................................ 100

4
Table of Figures Figure 1 Health Care Spending Per Capita in 2004 ......................................................................9
Figure 2 National Infant Mortality Rates in 2004 (MacDorman & Mathews, 2008) ................... 10
Figure 3 Pie chart of Coverage Amongst Massachusetts Newly Insured Residents in 2007
(Steinbrook, 2008) ............................................................................................................. 17
Figure 4 Relational Tables in Access ......................................................................................... 33
Figure 5 Data Organization in CMS .......................................................................................... 34
Figure 6 Query Data .................................................................................................................. 36
Figure 7 Control Variables Used in Previous Research (Keeler, et al., 1992) ............................. 48

5
Table of Tables Table 1 Health Insurance Coverage in 2006 (Steinbrook, 2006) .............................................. 12
Table 2 Timeline of the Massachusetts Health Care Reform (Health Connector, 2009) ............. 14
Table 3 Measurement of Health Care Quality by National Healthcare Quality Report ............... 23
Table 4 Components of CMS 2552-96 Form ............................................................................. 31
Table 5 Contents of CSV files ................................................................................................... 32
Table 6 Cost Measurement Used ............................................................................................... 35
Table 7 Quality sub-database..................................................................................................... 37
Table 8 Quality Database Measurements ................................................................................... 37
Table 9 Control Variable Coordinate ......................................................................................... 39
Table 10 Difference-in-Differences Variables Table (Econometrics, 2006) ............................... 41
Table 11 Difference-in-Differences Table comparing CT and MA (Econometrics, 2006) .......... 41
Table 12 Hospital Ownership Code ........................................................................................... 52
Table 13 Descriptive Statistics of Hospital Sample .................................................................... 53
Table 14 Summary Statistics of Dependent Variables ............................................................... 55
Table 15 Summary Statistics of Explanatory Variables ............................................................. 57
Table 16 Dependent Variables (Before Reform and After Reform) ............................................ 58
Table 17 Control Variables (Before Reform and After Reform)................................................. 61
Table 18 Full Difference-in-Differences Regression Results ..................................................... 66

6
Abstract
In 2006, the Massachusetts legislature passed the landmark health care reform bill, “An
Act Providing Access to Affordable, Quality, Accountable Health Care,” with the hopes of
reforming the state health care industry. The main targets of this reform were to contain hospital
costs, to increase insurance rate and to improve quality of medical services. It is essential that we
research this reform and determine whether or not it was successful, as it serves as a model and
experiment for the national health care reform.
Therefore, the primary focus of this paper is to explore the overall impact of the
Massachusetts Health Care Reform on hospital operational costs and quality of medical services.
Cost and quality data were collected from Center for Medicare & Medicaid Services and
Hospital Compare websites. Three econometric models of cost, salaries and quality were
developed to examine the overall impacts of the reform on the hospital cost and quality of
medical services. Treatment measures of different diseases were used for quality dependent
variables. Hospital department salaries and total operational costs were used for the salaries and
cost dependent variables, respectively. Difference-in-differences technique was applied in the
models to ensure that the result was due to the reform rather than national trend.
Finally, regression results were analyzed to examine whether the aforementioned targets
were met after four years of reform. Consistent with our predictions, we found evidence that the
reform had positive effects on the quality of Massachusetts hospital services. We also found
evidence consistent with the premise that Massachusetts hospital costs were contained.

7
1.0 Introduction
The Massachusetts health care insurance reform refers to the legislation passed by the
General Court of the Commonwealth of Massachusetts, and signed into law by Governor Mitt
Romney on April 12, 2006. This legislation is of great importance, as it not only increases the
percentage of insured residents, but it also changed the health care insurance industry of
Massachusetts in a number of ways. For example, such legislation expanded subsidized
insurance and created a much more consumer-friendly health insurance market. In addition, the
results of this reform over the past four years have been mentioned and discussed in the design of
the national health care reform bill. There has been much research conducted on the impacts of
the reform, but little research has focused on its effects on both hospital cost structure and the
quality of medical care.
As demonstrated by Jha, A.K. et. al, there is an inevitable relationship between cost and
quality (Jha A. K., Orav, Dobson, Book, & Epstein, 2009). The motivation of the reform was to
contain hospital costs and improve the quality of health services. However, changing one factor
will also affect the other. There are many possible effects that the reform could have on the
relationship between cost and quality. For example, if the reform were to decrease the revenue
provided to the hospital, quality of health services could potentially decrease in effort to decrease
hospital costs. Alternatively, if there is a decrease in revenue, perhaps hospitals will be
encouraged to invest in improving health care quality to reduce costs of continued services due
to previous incompetent or inefficient care. However, if the reform were to increase hospital
revenue due to the increased insured rate, perhaps the hospital can afford to increase the quality
of medical services. Although these patterns make sense logically, there are examples of low-
cost hospitals that provide a better quality of healthcare than costly hospitals, as well as examples
of costly hospitals providing low-quality healthcare (Blumenauer, 2010). Thus, there is clearly a
correlation between the two factors, but how they affect each other remains unclear, just as it is
not clear how the reform will affect cost and quality (Jha A. K., Orav, Dobson, Book, & Epstein,
2009).
It is expected that the reform will affect both hospital operational costs and the quality of
medical services, as there were specific aspects of this legislature that aimed at cost containment

8
and quality improvement. For example, the Health Care Cost and Quality Council, which will be
discussed in more detail later, attempted to make the Massachusetts health care system more
efficient by trying to reduce the number of hospital visits for patients with preventable health
issues and trying to reduce the rate of nosocomial infection. By reducing these factors, the
quality of medical services would increase and hospital costs would be contained, as unnecessary
visits are reduced. However, it is also possible that the reform did not succeed in creating a more
efficient health care system. Because insurance coverage increased due to the reform, there was a
significant increase in the number of patients. Therefore, it is possible that hospital costs raised
after the reform due to an increase in demand. As aforementioned, it is possible that an increase
in costs could result in a decrease in the quality of medical services for affordability purposes.
Currently, both quality and cost are very important for hospitals‟ daily operations. Without
paying attention to quality, hospitals could not compete against others. Without focusing on cost,
hospitals could not survive the current economic recession. Hence, how to constantly improve
quality and contain costs is becoming a major topic for hospital top managers (Eldenburg &
Krishnan, 2010).
Because it is not clear how the reform affected hospital costs and health care quality, our
research will explore this issue further in order to determine the outcome of such important
legislature. This report will first provide the background information of the Massachusetts health
care reform, formally known as “An Act Providing Access to Affordable, Quality, Accountable
Health Care,” which is Chapter 58 of the Acts of 2006. This section will be followed by the
literature review section, which will explore the research that has been previously conducted on
this topic, and give further details on the specific research question of this project, which will be
followed by a methodology section explaining the processes of our research. Lastly, we will be
presenting the results of our research and analysis along with our conclusions.

9
2.0 Background Information
The main goal of the Massachusetts health care reform was to provide a universal
coverage plan for the residents of Massachusetts. This was achieved by mandating all the
residents to have health insurance, increasing employers‟ contributions to their employees‟
health coverage, and creating a more consumer-friendly health insurance market. Since
Massachusetts is the first and the only state in the United States to require health insurance
coverage for all of its residents, its implementation of such legislation is of interest to
policymakers, employers, and individuals across the nation. The next section will provide
national background in terms of health care cost and quality, which was a motivation for the
Massachusetts health care reform.
2.1 National Background
The United States of America is one of the leading nations in the world and spends more
money per capita on health care than any other nation (Roehr, 2008).
Figure 1 Health Care Spending Per Capita in 2004

10
As can be seen from Figure 1 above, the cost of health care spending per capita was
almost double for the United States than other developed countries. However, the country‟s
health care services lacked in quality, as the U.S ranked one of the lowest in terms of life
expectancy and infant mortality amongst developed countries (MacDorman & Mathews, 2008),
as shown in Figure 2.
Figure 2 National Infant Mortality Rates in 2004 (MacDorman & Mathews, 2008)
As is demonstrated by Figure 2 above, the infant mortality rate in the United States was
the highest among the developed countries by a significant amount. Once again, it was almost
double that of most of the other developed countries. In addition, the U.S. is the only
industrialized country that does not guarantee universal health care coverage (Waldman, 2010).
Access to health care has been a major social, political and economic issue in the U.S. for almost
a century. At least 45 million American people, about 15% of the nation‟s total population, are
completely uninsured, as of 2010 (Waldman, 2010). These citizens, therefore, are unable to seek
the primary care needed in order to take preventative measures. As a result, most uninsured
residents use the emergency room, driving up cost and usage, which burdens the state budget, as
the fund comes out of the Safety Net and, therefore, the taxpayers. For example, the cost of an

11
emergency room visit is anywhere from $373-$1030 compared to the maximum cost of a visit to
the primary care physicians of $168 or $220 for a new patient (Harvard Pilgrim Health Care,
2010). There is also data to demonstrate that emergency room visits were increasing between the
years 2004 and 2006 (Bigby, 2010).
Today, health care still remains one of the most complex issues in the U.S. The nation is
still trying to implement a universal coverage plan, but many obstacles stand in its way. While
the nation experienced a lot of pressure surrounding this reform, the state of Massachusetts has
received a lot of support from its residents since then (Long & Stockley, 2009).
2.2 Why Massachusetts?
In 2006, the state of Massachusetts enacted new health care reform legislation in order to
attempt to address the pivotal health care issue. In contrast with other states in the nation,
Massachusetts is a small and wealthy state which has a long history of being generous in giving
coverage to its residents. There were numerous reasons why this reform was able to take place in
Massachusetts. Amongst those reasons are the idea of pressure from the federal and state
government, shared responsibility, the pre-existing regulations of the health care system, and its
unique health care industry.
Federal pressure is an important factor to explain why the reform took place in
Massachusetts in 2006. Massachusetts received its federal funding through the authorized 1115
Demonstration Waiver, which allowed the state government to fund its own Medicaid program
and Uncompensated Care Pool. In 2005, when the state planned to renew its Waiver, the federal
government required that the state needed to change its health care system in order to
successfully renew the Waiver (Waldman, 2010). This type of pressure from the federal
government provided a perfect background for the reform to begin fermenting. The federal
support also helped the state to fund its health care reform. Therefore, both the federal pressure
and funding through the Section 1115 waiver played key roles in the initial design and the
ongoing operation of the Massachusetts reform initiative (Long & Stockley, 2009).

12
A crucial component of the health care coverage expansion in the health reform law is
the concept of shared responsibility. There are many who believed that one of the most important
reasons contributing to the passing of the legislation was the consensus between employer and
the state government, which did not exist in previous attempts to reform the health care system
(Seifert et. al, 2009). In 2006, Massachusetts already had the ninth highest rate of Employer-
Sponsored Insurance (ESI), which covered 68% of working people under the age of 65 years.
This is a relatively high rate compared to other states in the nation (See Table 1). Because the
majority of residents were already insured, employers did not need to cover as much of the
population as other states. Therefore, it was less expensive for Massachusetts to make such a
movement than other states. All of these factors described above make it more reasonable for the
government to gain support of this reform from employers.
Table 1 Health Insurance Coverage in 2006 (Steinbrook, 2006)
Massachusetts United States
Population in Millions 6.4 293.7
Employer Sponsored 59.5% 53.7%
Medicaid 12.7% 12.8%
Medicare 11.6% 11.8%
Individual 4.3% 4.8%
Other Public 0.7% 1.1%
Uninsured 11.2% 15.9%
As one can see from the table above, the number of residents insured through Medicaid,
Medicare, Individual and Other public insurers are practically the same in Massachusetts and in
the nation. The only significant difference between the two charts is the employer sponsored
insurance. In the case of Massachusetts, there is 59.5% of health insurance that is gained by
employer-based coverage in contrast to only 53.7% in the nation. Consequently, Massachusetts
is the optimal place to start a reform experiment with its low uninsured rate and relatively high
ESI rate. However, the Massachusetts Health Care Reform Law of 2006 was not the state‟s only
attempt at making changes to the health care system.

13
In 1985, the state government had established a “Free Care Pool,” which allowed free
emergency care to patients who could not afford it. In late 2007, Massachusetts launched a
program called the “Safety Net” to replace the Free Care Pool, which is for uninsured residents,
in order to reach a goal of universal coverage. The “Safety Net” is different from the Free Care
Pool in that it is less subsidized insurance for low-income residents, and those residents are
responsible for higher fees. After some argument, the compromise had been made and the reform
law finally was passed with a relatively small employer fine of $295 per uncovered employee per
year, which made it even easier to increase the number of insured residents.
Massachusetts also already had some relatively strict regulations on the health care
insurance market. In Connecticut and Wisconsin, insurance companies have the right to refuse to
cover individuals and to increase their premium based on their health history in other states,
which is not the case in Massachusetts. (Seifert & Swoboda, 2009). Secondly, the health care
insurance market of Massachusetts is mainly controlled by community-focused, non-profit
insurance plan providers. Due to these two factors, the Massachusetts health care industry is
slightly more consumer-friendly than in other states, making it a more convenient state to initiate
reform. The next section will provide a timeline of the reform process.
2.3 Timeline of the Reform
In 2005, politicians and reformists thought that it was time for a second attempt at health
care reform. They began advocating for the expansion of coverage. In April 2005 (Health Care
For All, 2005), Massachusetts Senate President Robert Travaglini and the State Governor Mitt
Romney formed a reform coalition to promote health reform plans (Geenberger, 2005). In June
2005, Romney presented the reform ideas and announced the individual mandate plan in
Massachusetts healthcare reform (Health Care For All, 2005). One month later, he introduced the
health reform proposal to the Massachusetts legislature. In August 2005, a new policy actor,
Affordable Care Today Association, filed a ballot initiative to place their proposal of healthcare
reform in the legislation by November 2006 (Health Care For All, 2005). Table 2 below contains
important dates and steps of the reform legislation.

14
Table 2 Timeline of the Massachusetts Health Care Reform (Health Connector, 2009)
APRIL 12, 2006 Health Reform becomes law.
OCTOBER 1, 2006
Commonwealth Care expands to those with
incomes below 100% of the Federal Poverty
Level (FPL).
JANUARY 1, 2007 Commonwealth Care expands to those with
incomes of up to 300% of the FPL.
MAY 1, 2007 The Commonwealth Choice becomes available.
JULY 1, 2007
All employers in Massachusetts are required to
offer sufficient plan, according to Health
Connector or they will be responsible for
employees‟ emergency medical care costs.
OCTOBER 1, 2007
Employers with 11 or more full-time-equivalent
Massachusetts employees must contribute
toward an employee health plan or suffer
penalty of up to $295 per employee, per year.
DECEMBER 31, 2007
Individual mandate for health insurance is
enforced or lose personal income tax deduction
on 2007 state taxes.
JANUARY 1, 2008
Penalties will now equal half the premium of
the lowest-cost Health Connector-certified
insurance plan.
JANUARY 1, 2009
Benefits an adult must carry to avoid penalties
now include prescription drug coverage,
preventative and primary care, and no annual
limit on treatment for any sickness.

15
2.4 Properties of the Reform
In order for Massachusetts to motivate the start of this universal health plan, the reform
legislation included some essential properties, such as: the creation of the Commonwealth Health
Insurance Connector, Commonwealth Choice and Commonwealth Care, the increased eligibility
for Medicaid, the organization of the Health Care Quality and Cost Council, the mandate for
individual health insurance, and laws involving employers‟ responsibilities. The next few
paragraphs will explain the purpose of the properties most significant to our research as well as
evaluate them, and explore them in greater detail.
Arguably, the most important part of the reform is the government‟s new role in the
health care industry through their creation of the organizations which allowed the health care
industry to be more consumer-friendly. For example, the government created the Health Care
Quality and Cost Council, which requires that any cost and patient data of hospitals and
physicians are made public (Waldman, 2009). Its purpose is to improve the quality of health care
and to control cost inflation. The Council measures the health care quality and cost in
Massachusetts by publishing annual reports. These reports provide information and different
types of measurements related to quality and cost for each hospital. The Council is also
responsible for setting quality and cost targets for the Massachusetts Health Care Reform. In the
“Roadmap to Cost Containment” issued by this Council, several key strategies were mentioned
to allow Massachusetts state government to control its health care cost inflation and to improve
the quality of health care. The Roadmap also suggested that Massachusetts should enact policies
that will have maximum impact on cost and quality. All of these measures were taken by the
government in order to motivate the movement towards a universal health plan.
Along with the reform legislation of 2006, came the mandate for all residents to have
health insurance. The mandate requires every citizen of Massachusetts that is of legal age to
obtain some form of health insurance if they are not covered by a government subsidized plan or
their employer (Tanner, 2006). Those under the age of eighteen years old are required to be
covered by their parents‟ plan (Steinbrook, 2006). This law was put into effect in July 2007 when
individuals who did not abide were not able to receive personal exemption from the state income
tax (about $219) (Tanner, 2006). Those who did not purchase insurance due to religious reasons

16
were exempt from these penalties (Kolstad & Kowalski, 2010), as well as anyone who earned
less than 150% of the federal poverty level or who was only without insurance for a period of
less than three months (Waldman, 2009). A health care safety net fund (provided by taxpayers)
still remained in order to cover those who could not afford insurance or were ineligible for
subsidized insurance, such as illegal aliens (Fisher, 2008). In 2007, only 5% of taxpayers were
uninsured, of which 40% were exempt from paying any penalty (Waldman, 2009). In 2008,
there was a 12% reduction from those who were penalized in 2007 (Waldman, 2009). Although
this mandate played an important role in the health reform movement, it still remains a
controversial subject to some. Some believe that it could possibly eliminate the discrimination
that occurs against some patients due to their health risks and needs by private insurance
companies (Blumberg & Holahan, 2009). On the opposing side, some believe that for the
government to require individuals to have health insurance is too invasive and may set the
precedent for the government to play a role in personal health decision issues (Tanner 2006). For
more information on some of the properties of the reform, see Appendix A. We will now move
on to the next section which will discuss the short-term effects of the reform.
2.5 The Short-term Results of the Reform
The reform certainly did accomplish an increase in coverage among state residents. In the
years leading up to the reform (2004-2006), about 88% had some form of health insurance,
which increased by about 5.5% to 93.8% of all residents that were insured in the years after the
reform (2008-2009) (Kolstad & Kowalski, 2010). In the few years after the reform, 352,170
more residents were insured (Kolstad and Kowalski, 2010). Figure 3 below depicts the pie chart
of coverage among Massachusetts residents.

17
Figure 3 Pie chart of Coverage Amongst Massachusetts Newly Insured Residents in
2007 (Steinbrook, 2008)
As can be seen from Figure 3 above, about half of the newly insured population (50.2%)
is covered under Commonwealth Care, which was created as a part of the reform, most of whom
(about 80%) do not pay premiums. About 18.2% of the newly insured residents are covered
under Medicaid, which is government subsidized. Almost a third, 31.3%, of the newly insured
population has private insurance, over a fifth of whom have obtained that insurance through
Commonwealth Choice, also a new program created by the reform. The reform significantly
increased the number of insured residents as is exemplified by these statistics. As can be seen
from the results presented above, the reform seems to have a positive impact on the health care
system, but more research is needed in order to assess whether or not it was successful in
accomplishing all of its goals. In the following section, we will explore examples of international
reform in order to learn about the possible impacts that this reform can have.
18
2.6 An Example of International Reform
Before their reforms, other countries also faced the issue of providing health care of
sufficient quality that was both affordable for hospitals and patients (Chiang, 1997). If we
examine the health care reforms in different countries, we can find an increasing competitive
trend amongst private hospitals around the world. The advantages of these reforms are a renewed
focus on the quality of care. The health care reform that took place in Taiwan will be discussed
in this section, chosen for its similar economic conditions to the United States.
After two decades of economic growth from the 1960s to the 1980s, Taiwan began its
health care reform in 1987. Initially, the government studied more the health care systems of
more than ten countries before combining all of their advantages to form their own system. In
1995, Taiwan founded a model called National Health Insurance (NHI), which is mostly
modeled after U.S. Medicare. There are many similarities between these two systems. However,
there is one major difference between these two models: the entire population is eligible for NHI,
while only the elderly are eligible for Medicare. Thus, NHI achieved universal coverage through
a governmentally controlled insurance provider. Employees are responsible for lower rates than
their employers. Generally, residents are responsible for a rate that remains stable, while low-
income individuals and veterans are fully subsidized. According to the Taiwanese model, every
person is free to select the hospital and physician of their choice without being concerned about a
waiting list. The package NHI offered covers preventative medical services, prescription drugs,
dental services, Chinese medicine and home nurse visits. The previously uninsured increased
their usage of medical services, since most preventative services, like annual checkups, are free
of charge and other regular services are offered at an affordable price (Lu and Hsiao, 2003). By
the end of 2001, 97% of the population was covered by this program. At that time, 70% of
patients were satisfied with equal access to health care, financial risk protection and equal quality
of the care provided (Chiang, 1997).
While the quality of health care greatly improved, health care costs only increased
slightly. Taiwanese spending on health care increased from 4.7% to 5.4% after NHI was enacted
(Chiang, 1997). However, the cost of health care per capita is still less than 900 U.S. dollars
(Chiang, 1997). The successes of the Taiwanese health care reform, such as the foundation of

19
NHI, the legislation on the health care industry and the affordable access are all important factors
that Massachusetts can take into account for its future. The aforementioned aspects of the
Taiwanese health care reform allowed for a better quality of health services, which is essential to
health care reform in general. From the international case we discussed above, it is evident that
the hospital cost and quality of health care are the two most significant measurements of the
success of health care reform. In the following Literature Review section, we will discuss these
two factors.

20
3.0 Literature Review
The objective of this literature review will be to inform the reader of the effects of the
Massachusetts health care reform on hospital costs and quality. We will first discuss examples of
literature that examine how we could go about defining and researching hospital cost and quality.
We will then discuss previous research that explored how hospital cost and quality were affected
by the reform.
3.1 How to Measure Hospital Cost
In order to analyze the cost effects of the Massachusetts health care reform, the hospital is
the primary focus. According to the “Analysis of Hospital Costs: A Manual for Managers”
(Shepard et al., 1998), cost finding and cost analysis are the processes of utilizing accounting
data to obtain the costs of hospital services.
Shepard et al.‟s (1998) article described the concept of cost centers, which are the centers
of activity in the hospital to which direct and indirect costs will be assigned. Based on the nature
of their work, three different types of cost centers can be identified: Patient Care, Intermediate
and Overhead. Patient Care Centers are those departments that provide direct patient services,
such as ambulatory care centers and wards. Intermediate cost centers provide ancillary services
to support inpatient treatments such as laboratory, pharmacy and radiology departments. The
third type, overhead cost centers, provides costs related to overhead support services such as
departments of finance and dietetics. It would be useful to explore the Patient Care Centers and
Intermediate Care Centers since it is these divisions of the hospital that residents come into direct
contact with, which means they will be most likely affect by the reform. Therefore, it is these
total operational costs and departments‟ salaries that will be used in our research, as they will be
most informative as to how the reform affected hospital costs. In conclusion, the methods
discussed in this article serve as a guide for research to be done on hospitals‟ operational costs.
Based on the different types of cost centers defined by the article, one can identify which of these
costs should be included in subsequent research (Shepard et al., 1998). Costs are not only
21
essential in evaluating the successes of the health care reform, but they are also essential to
hospital structure and function, as will be discussed next.
Decades ago, cost was not a primary concern. Consequently, hospitals had no incentive to
invest in information and accounting systems. After the change in regulation in 1983, price
became the primary basis of competition. Thus, cost became more and more important in
measuring a hospital‟s overall performance. In order to maintain financial viability, hospitals had
to increase their revenues by providing high-quality health care and lower their operating costs.
As is stated by the DHCFP‟s “Study of the Reserves, Endowments, and Surpluses of Hospitals in
Massachusetts,” hospitals need to manage their own financial resources to maintain operations,
provide high-quality patient care and make investments in new services, infrastructure and
technology (2010). Besides, under the most severe economic recession since Great Depression,
many hospitals, with their significant declining profit margins, need to cut costs and lower
research budgets and philanthropic giving. Therefore, it is absolutely necessary for hospitals to
increase their profitability and to control their costs in order to compete effectively against
others. A hospital cannot remain financially viable without earning and maintaining adequate
financial resources (Bigby & Morales, 2010). Hospital costs are not the only key factor that can
be affected by the reform, however, as the quality of medical services a hospital provides is also
very important.
3.2 How to Measure the Quality of Health Services
The definition of health care quality is broad and variable. The Institute of Medicine
defines quality as “the degree to which health services for individuals and populations increase
the likelihood of desired health outcomes and are consistent with current professional
knowledge” (Institute of Medicine, 2010). Specifically, Campbell (2000) separates quality of
care for both individual patients and populations into two categories: access and effectiveness.
The most basic understanding of access to health care providers is geographic/physical access
(Campbell, 2000). Effectiveness of health care is measured by an arrangement of diagnostic and
treatment indicators that include the ability to prescribe drugs patients need and the ability to
order diagnostic tests or procedures for patients (SteelFisher, 2009).

22
In SteelFisher‟s article, the quality of health care was realized as the amount of time
patients wait to get an appointment to see physicians, physicians‟ ability to prescribe drugs the
patients need, the costs that patients pay out of pocket for needed care, the amount of time
physicians can spend with a patient, physicians‟ ability to order diagnostic tests or procedures for
patients, the amount of time patients wait in the waiting room and other factors (SteelFisher,
2010). Generally, in other research, timeliness and effectiveness of treatment are the key
measurements of quality, both of which were present in Steelfisher‟s article. Other
measurements, however, such as cost for patients and detailed measurements and the physician‟s
ability to order diagnostic tests for patients tend to be omitted in a national report. An example of
the National Healthcare Quality Report is shown below in which both effectiveness of treatment
and timeliness is taken into account.
Our research will take both access and efficiency into account, although our primary
concern will be the latter, as it is the most likely factor to be affected by the Massachusetts health
care reform. As one of the core federal agencies handling the national health care issue, the
Agency for Healthcare Research and Quality publishes the National Healthcare Quality Report
annually. In its 2009 report, they used the specific outcomes and processes to measure the
quality. Table 3 shows the details of some of these measurements. The measurements are
selected from the full core measure set defined in 2005 by the Interagency Work Group. All core
measures fall into two categories: process measures, which track receipt of medical services, and
outcome measures, which reflect the results of medical care.

23
Table 3 Measurement of Health Care Quality by National Healthcare Quality Report
Section Process measures Outcome measures
Effectiveness:
Cancer
Women age 40 and over who
reported they had a mammogram
within the past 2 years
Rate of advanced stage
breast cancer per 100,000
women age 40 and over
Breast cancer deaths per
100,000 women
Effectiveness:
Diabetes
Adults age 40 and over with
diagnosed diabetes who received
all three recommended services
for diabetes in the calendar year
(hemoglobin A1c measurement,
dilated eye examination, and foot
examination)
Hospital admissions for
lower extremity amputation
per 1,000 population age 18
and over with diabetes
Patient Safety
Adult surgery patients who
received appropriate timing of
antibiotics
Adults age 65 and over who
received potentially
inappropriate prescription
medications
Adult surgery patients with
postoperative complications
Bloodstream infections or
mechanical adverse events
associated with central
venous catheter placement
Timeliness N/A
Adults who needed care
ASAP for an illness, injury,
or condition in the last 12
months who did not get care
as soon as wanted
Emergency department
visits in which patients left
w/o being seen

24
The Health Care Quality and Cost Council (HCQCC) of Massachusetts, the state
committee responsible for setting quality and cost policies and missions for the Commonwealth,
uses the same table to measure quality of health care in Massachusetts. Their annual report,
Measuring Health Care Quality and Cost in Massachusetts, described the health care quality and
cost changes in the state (HCQCC, 2009). In our research, only the measurements that exist for
all states will be used for comparison. The four major divisions that will be used are: surgery,
pneumonia, heart attack and heart failure. Within these four divisions, there are detailed
indicators for each hospital that are similar to those described above. The next section explores
the various effects of the reform on health care quality.
The aforementioned articles used essential indicators of the quality of hospital medical
services, such as lengths of stay in the hospital, usage of emergency room and access to services
which will remain important for further research. These articles addressed changes in the quality
of Massachusetts health care services before and after the reform, but they neglected the
comparison of these trends with other states to support the fact that they were products of the
reform instead of a common trend across the nation. In our research, we will compare important
measurements of hospital healthcare quality in Massachusetts, as well as Connecticut and
Minnesota to determine whether or not the changes observed in Massachusetts can be attributed
to the reform.
As Eldenburg and Krishnan‟s article (2010) stated, the U.S. health care system previously
encourage quality-based competition because there were virtually no incentives to control costs.
Hospitals only competed to offer superior technology and extensive services to attract patients.
The hospitals providing higher quality of health services formerly out-competed those providing
lower quality of services in order to contain costs. This demonstrates that quality was extremely
important in measuring a hospital‟s overall performance.

25
3.3 How to Measure Impacts of Reform on Hospital Cost and Quality
The larger implication of our research is to measure the successes and failures of the
reform in hopes that we can then learn from our mistakes before engaging in a national reform.
Specifically, we will be measuring the changes in hospital cost and the quality of medical
services the hospitals provide over a number of years for better insight on the effects of the
reform. Recently, in 2009, the Pioneer Institute for Public Policy Research published an article
describing how one might go about assessing the success of the reform based on the specific
goals that it had, such as to provide a better quality of health care, while still containing the costs
of doing so (Miltenberger & Poftak, 2009). Specifically, the reform addressed issues of cost and
quality by mandating that hospitals report cost and quality measures that would be made
available to the public and creating the Cost and Quality Council, which aimed to set standards
for the quality of health care patients received.
The crux of our research is to focus on these cost containments and improvements in
quality of health care efforts and measures. In order to examine the reform‟s ability to contain
costs, Miltenberger and Poftak suggest that research must explore cost and quality data that is
available on a “periodic,” basis, which we hope to accomplish in our research. Specifically, the
authors suggest to look at spending on healthcare as a whole. We will be researching hospital
operational costs, as this accounts for half of total healthcare spending along with clinical and
physician services (The Henry J. Kaiser Family Foundation, 2009).
It is essential, as these two authors mentioned, to look at data over a period of time. In
order to really evaluate the relative successes of the reform, as much pre-reform data as possible
needs to be collected in order to be used as a basis for comparison or a control. Although it is
important to explore cost containment after the reform, evaluating health care costs on a “whole”
basis, as Miltenberger and Poftak mentioned, is not the most effective way to examine cost
containment efforts, as there are so many factors that contribute to this spending that the impact
of the reform will most likely be obscured. For measurement of hospital costs beyond changes in
quantities and charges, Kolstad and Kowalski obtained all-payer cost to charge ratios on the
hospital level. This ratio represents the annual total cost of operating the hospital. In order to
accurately evaluate the impact of the reform on cost containment, specifically one level will be
focused on in our research, which is the hospital, since it is the hospital that provides the medical

26
services that are also being evaluated in terms of quality. There are also aspects of hospital costs,
however, that should not be taken into account, as they would not have been likely to be affected
by the reform and will, therefore, add noise to the data. Therefore, it was decided that only
hospital operation costs and department salaries over a period of time will be examined, as in
Kolstad and Kowalski‟s research.
In order to examine the progress in quality of care improvement, Miltenberger and Poftak
suggest to research various quality indicators, such as mortality rates, rate of nosocomial
infections (infections due to medical procedures), and effectiveness of heart surgery, while
comparing it to indicators of other states (Miltenberger and Poftak, 2009). Important quality
indicators will also be examined in our research. Specifically, the four major divisions of
indicators will be heart attack, heart failure, pneumonia and surgery because annual quality data
are provided on the treatment of these four conditions by the Medicare Hospital Compare
Quality of Care Database. Those indicators will be measured in terms of appropriateness of
treatment given, medical advice and preventative measures taken, just as suggested by
Miltenberger and Poftak‟s research. Multiple states will be looked at as this article mentioned,
which is essential in order to determine whether or not these impacts were due to the reform or
some other trend. This article neglected to mention, however, that the control states used should
have similar quality of health care to Massachusetts before the reform, in order to be a
meaningful comparison.
A report that was later issued in the Pioneer Institute attempted to respond to
Miltenberger and Poftak‟s suggested techniques for research. In their study, a metric system was
used in order to assess their performance and whether or not they achieved their goals (Lischko
& Manzolillo, 2010). Grades that they used in their assessment were A, which signifies
“excellent performance and that the goal as achieved”, B, which signifies “good performance
and that the goal was moderately achieved,” C, which signifies “mixed results and a need for
research,” D, which signifies “poor performance and that the goal was not achieved” and lastly, a
grade of I, which signifies that enough research is not available in order to assess the
performance (Lischko and Manzolillo, 2010). Just like our own research, they addressed changes
in the three quality indicators as compared to other states. In similar research, Kolstad and
Kowalski assessed changes in the quality of medical services by analyzing the length of stay of
patients, as well as the number of discharges. They indicated that both of these factors would be

27
helpful in determining the overall efficiency of health care (Kolstad & Kowalski, 2010).
Although these data give an overall view of how often and for how long patients visit the
hospital, these indicators are somewhat general and seem to focus on the accessibility of care.
From their findings of decreases in the length of stay and decreases in the number of discharges,
they concluded that there was an improvement in the overall quality of medical care given
(Kolstad & Kowalski, 2010). However, these data do not directly address effectiveness of
treatment, as we will address through our specific quality indicators.
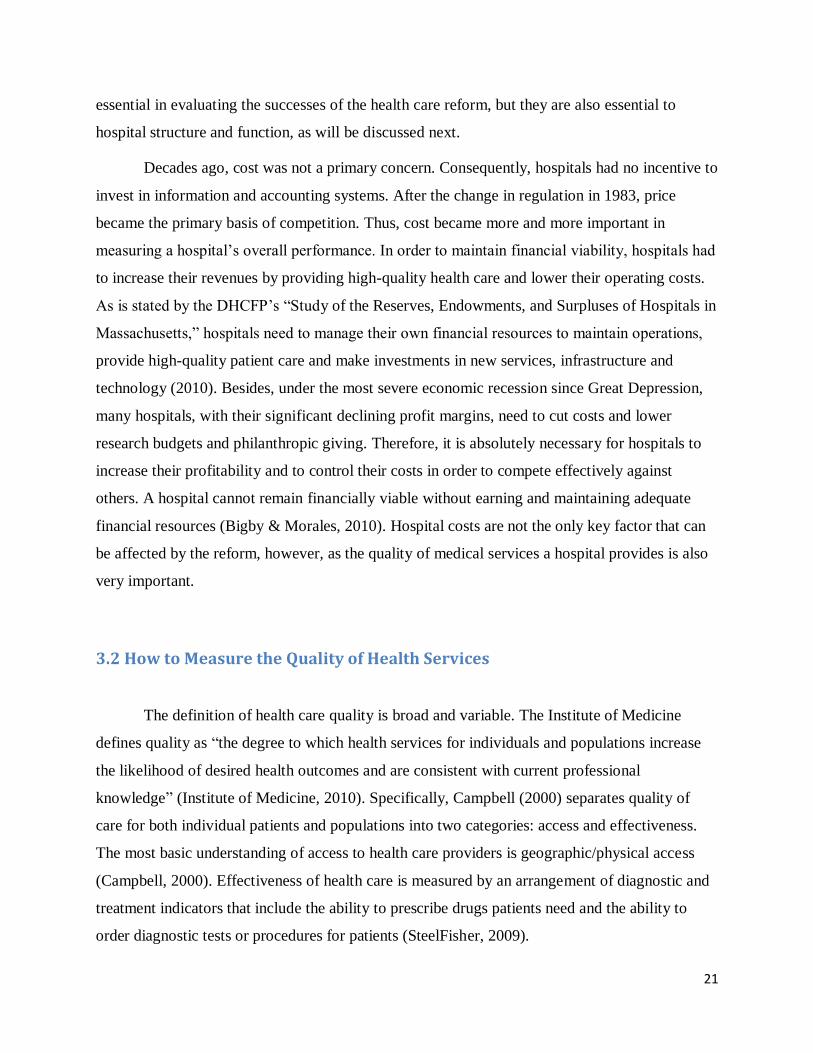
In their data analysis, Lischko and Manzolillo provided graphical analysis on patients‟
receipt of preventative antibiotics and the end of their treatment after surgery, as compared to
other states and the national average. They also specifically compared the percentage of patients
receiving effective care and preventative treatments, as well as patients receiving appropriate
care for heart attack, heart failure and pneumonia. These percentages, however, were only taken
into account for the years 2007 and 2009, both of which are post-reform. It is evident that the
measures of treatment for heart attack, heart failure and pneumonia are very important in
determining the quality of medical services, however these percentages lack detail in specific
indicators within these three divisions that give the reader or other researchers an idea of what
medical treatment the patient received. Multiple analyses can be used in order to evaluate the
effect of the reform on quality of medical services.
In order to further analyze their findings, Kolstad and Kowalski also used difference-in-
differences estimates. The factors analyzed using difference-in-differences analysis were the
impact of the reform on the number of medical procedures performed per patient and the total
cost per patient. This analysis performed on data before and after the reform, as well as for other
control states of New England demonstrated that in Massachusetts the reform reduced the
number of medical procedures conducted and that costs per patient also decreased (Kolstad &
Kowalski, 2010). This difference-in-differences analysis will also be used in our own research in
order to detect any changes in hospital operational costs, salaries or quality indicators after the
reform, as compared to the chosen control states, Connecticut and Wisconsin. This type of
analysis is significant because it allows one to associate any trends in data with the focus of
study, the Massachusetts health care reform.
For further analysis, Kolstad and Kowalski also generated a model, which aimed to
demonstrate all of the variables that affect the cost of procedures and how they could be

28
calculated. In their model, they included such variables as the listed price of a procedure, which
is based on the diagnosis related group (a system used to identify prices of particular procedures
depending on the medical condition) and the discount due to insurance coverage. In their model,
the listed group and the discount due to insurance are multiplied to find the cost of the medical
procedure. Because such a model really validates the essential factors in determining cost and
quality values, we will be generating our own model for calculating the total hospital operational
costs and the quality of medical services, in hopes that it will accurately portray the trends we
find.
3.4 Conclusion and Hypotheses
In conclusion, effective methods allow us to quantify both hospital cost and the quality of
health care in order to monitor changes over a period of time. The relationship between these two
factors and their importance has also been thoroughly researched. However, there is no research
focusing on the effects of the current Massachusetts health care reform on cost, quality and
salaries. The purpose of our research is to determine the effects of the reform on hospital costs,
quality of health care and salaries. One of the main goals of the Massachusetts Health Care
Reform is to improve the quality of health care services. In this project, we will try to determine
whether or not they were successful in achieving this goal. Our hypothesis is that the
Massachusetts quality of health care will improve after the reform, while that for the other states
will remain unchanged or improve at a lower rate. The second goal of this reform was to contain
hospital costs, according to our preliminary research. We will also try to determine whether or
not this was achieved. Our second hypothesis is that the cost of Massachusetts hospital will
remain relatively stable compared to other states. The Methodology section will describe the
technical methods used to further explore the impacts on hospital cost, quality and salaries after
the reform as compared to that of other states.

29
4.0 Methodology
The main objective of this research is to explore the effects of the Massachusetts health
care reform at the hospital level on costs and quality. Data on cost and quality will be collected
from before and after the reform in order to determine how they have changed and whether or
not the reform has a causal impact on hospital cost and quality of medical service. The hopes of
this reform were to increase coverage and access to health care across the state. In order to
accomplish this goal, it is possible that hospital costs and, therefore, quality of services will be
affected in some way. It is hypothesized that hospital costs were contained and the quality of
their service was improved as a result of the reform, but was that true? The analyses performed
on the data collected will allow these questions to be answered and will conclude whether or not
the results were just a common trend or truly a result of the reform, as hospital data from other
states will also be utilized. Two states, Connecticut and Wisconsin, which provide health care of
similar quality to Massachusetts and are somewhat similar economically will be used as control
groups in order to test these hypotheses (Commonwealth Foundation, 2009). Financial
statements of hospitals will be examined, as well as specific data on some indicators of the
quality of medical services. The following section will describe the hypothesis testing.
4.1 Hypothesis Testing
The overall hypothesis that was tested is that the Massachusetts health care reform
improved the quality of health care services provided by hospitals and contained hospital costs.
In order to measure both quality and cost changes due to the reform, hospital-level data will be
collected before and after the reform and be analyzed. Cost and quality data will also be
collected for Connecticut, as well as for Wisconsin in order to determine whether the changes in
Massachusetts can truly be attributed to the reform. The null hypothesis being tested is that the
changes in cost and quality in Massachusetts‟ hospitals are due to a common trend. The
alternative hypothesis, however, is that the cost and quality changes in Massachusetts‟ hospitals
are due to the Massachusetts Health Care Reform. If the patterns of hospital cost and quality data

30
in the control states, Connecticut and Wisconsin, do not mimic those of Massachusetts, the
alternative hypothesis will be supported and accepted.
4.2 Data Collection Methods
The data collection of this project is a very important stage. We tried to collect the data
from the reliable sources, such as the government office or department. The reason is the
unreliable data may affect the analysis results. In addition, we tried to collect the data as much as
possible. The following subsection will provide more details about the sources we used and the
data we collected.
4.2.1 Hospital Cost Data Collection
In order to collect sufficient hospital cost information, we obtained data from the Center
for Medicare & Medicaid Services (CMS), as the Medicare Providers are required to fill out the
Hospital and Health Care Complexes, CMS 2552-96. The CMS then publishes all the collected
complexes and provide it in electronic format for downloading1. Each complex contains several
MS Excel worksheets, which are called forms. The table below is a list of these forms.
1. Download address: http://www.cms.hhs.gov/CostReports

31
Table 4 Components of CMS 2552-96 Form
Form Index Form Name
Form A Adjustments
Form B Cost allocation based on cost center
Form C Cost-to-Charge Ratios
Form D Determining Costs
Form F Financial Statements
Form G Financial Statements
Form H Determine provider based HHA Medicare
Settlement
Form I Determine provider based renal dialysis costs
(Hospital) and RHC/FQHC (SNF)
Form K Determine Provider based hospice Medicare
costs
Form L Determine provider Medicare capital payment
Form M Determine RHC/FQHC Medicare settlement
Form J Determine provider based CORF Medicare
Settlement
Form S Provider summary information
Currently, on the CMS website, we can access the databases from the Fiscal Year 1996 to
the Fiscal Year 2010. Each year‟s folder contains four Comma-Separated Values (CSV) files.
Table 5 below shows the name of each file and the contents of each file. The specific year is
indicated by XXXX.

32
Table 5 Contents of CSV files
File Name Content
hosp_xxxx_RPT.csv Report variables and descriptive information,
such as the record id, provider id, and the data
that the cost report was submitted
hosp_xxxx_ALPHA.csv The character and numeric values such as the
provider address and if the hospital is teaching
hospital
hosp_xxxx_NMRC.csv Only numbers and wound include variables
such as number of discharges, total number of
beds and total cost by cost center
hosp_xxxx_ROLLUP.csv
In order to collect the data for each measurement, we input all the CSV files to MS
Access and then used Access to query the data. The name and type of each column of each file
are defined by the CMS (Appendix B). Each provider is assigned a unique ID, called Provider
ID, by CMS. Each year, CMS will assign a unique ID for the submitted report, called Report ID,
for each specific provider. Therefore, in this project, we used the Provider ID to organize the
hospital and used the Report Record Number to get the data for each measurement. All the files
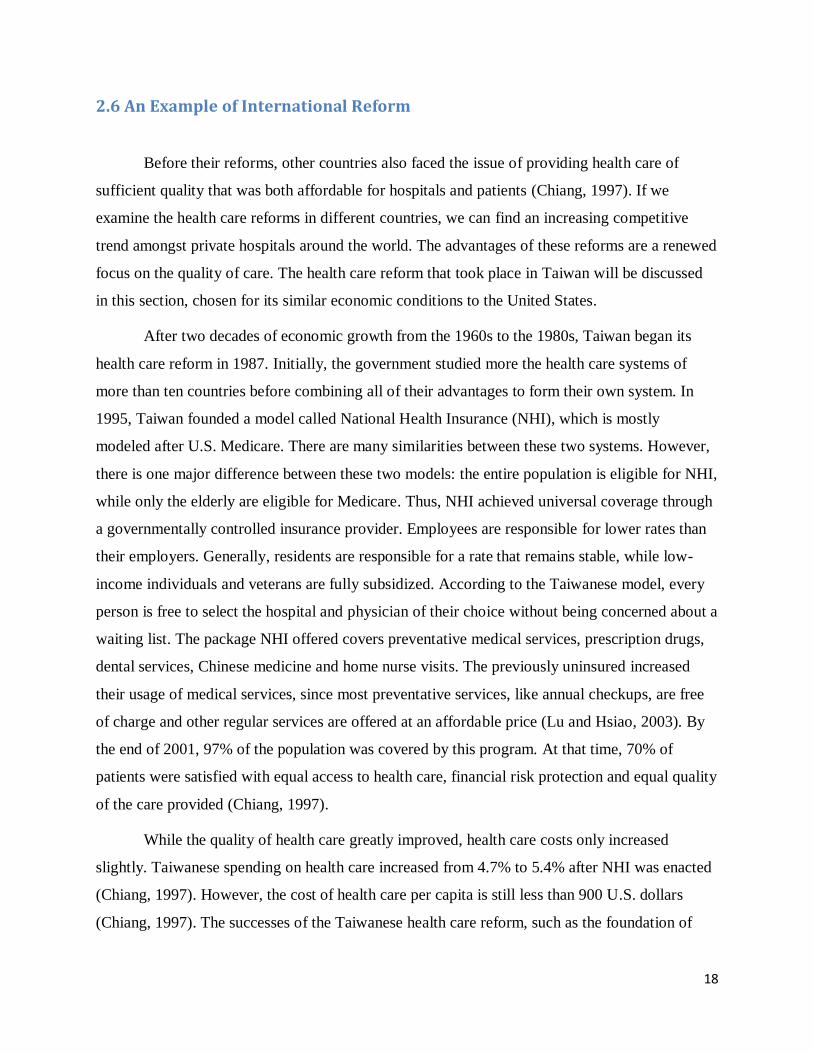
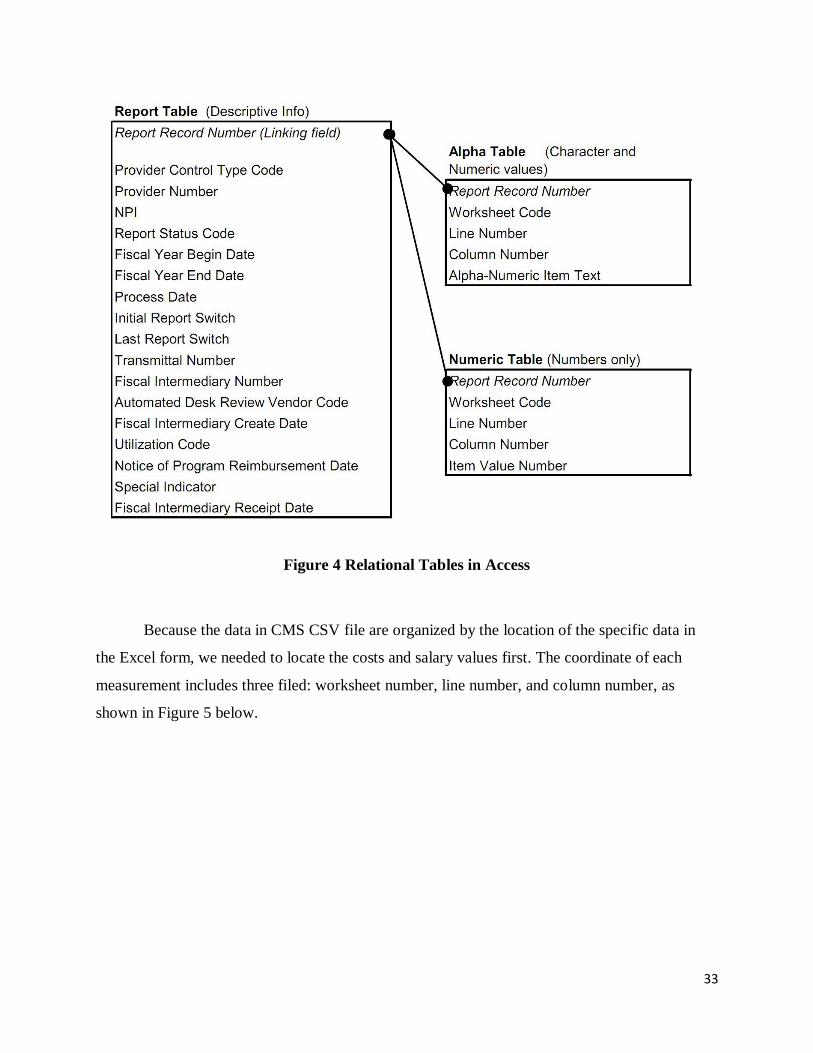
for each year are organized and connected by the Report Record Number, as shown in Figure 4
below.
33
Figure 4 Relational Tables in Access
Because the data in CMS CSV file are organized by the location of the specific data in
the Excel form, we needed to locate the costs and salary values first. The coordinate of each
measurement includes three filed: worksheet number, line number, and column number, as
shown in Figure 5 below.

34
Figure 5 Data Organization in CMS
In addition, we needed to identify the variable as either character or numeric because they
are included in different tables. For instance, if we would look for the number of beds in the file
hosp_xxxx_NUMR.csv because the variable is coded as characters. To determine the teaching
status of a hospital, we would check the contents in the file hosp_xxxx_ALPHA.csv because the
data should be a character. The table below shows the coordinate of each cost measurement we
used for this project.

35
Table 6 Cost Measurement Used
Measurement
Name File Name
Worksheet
Number
Worksheet
Code2
Line Code3
Column
Code4
Total
operation
cost
hosp_xxxx_N
UMR Form G2 „G200000‟ „04000‟ „0200‟
Operation
room salary
hosp_xxxx_N
UMR Form A „A000000‟ „03700‟ „0100‟
Radiology
room salary
hosp_xxxx_N
UMR Form A „A000000‟ „04200‟ „0100‟
Respiratory
therapy
salary
hosp_xxxx_N
UMR Form A „A000000‟ „04900‟ „0100‟
Physical
therapy
salary
hosp_xxxx_N
UMR Form A „A000000‟ „05000‟ „0100‟
Electrocardio
logy salary
hosp_xxxx_N
UMR Form A „A000000‟ „05300‟ „0100‟
Emergency
room salary
hosp_xxxx_N
UMR Form A „A000000‟ „06100‟ „0100‟
In Access database, we used the query to collect all the data. Here is an example query of
how we collected the total operation cost for the Fiscal Year 2009. The query is shown in SQL
format. The queries for the rest of the measurements are shown in Appendix C.
2 Used for querying
3 Used for querying, same as the line number in the specific worksheet
4 Used for querying, same as the column number in the specific worksheet

36
SELECT Sheet1.[Hospital Provider ID], Hosp_2009_NMRC_new.WKSHT_CD,
Hosp_2009_NMRC_new.LINE_NUM, Hosp_2009_NMRC_new.CLMN_NUM,
Hosp_2009_NMRC_new.ITM_VAL_NUM
FROM Hosp_2009_NMRC_new INNER JOIN (Sheet1 INNER JOIN Hosp_2009_RPT_new
ON Sheet1.[Hospital Provider ID] = Hosp_2009_RPT_new.PRVDR_NUM) ON
Hosp_2009_NMRC_new.RPT_REC_NUM = Hosp_2009_RPT_new.RPT_REC_NUM
WHERE (((Hosp_2009_NMRC_new.WKSHT_CD)="G200000") AND
((Hosp_2009_NMRC_new.LINE_NUM)='04000') AND
((Hosp_2009_NMRC_new.CLMN_NUM)='0200'));
Figure 6 below shows the format of the queried data.
Figure 6 Query Data
4.2.2 Hospital Quality Data
We collected the hospital quality data from the CMS Hospital Compare website5. Since
2005, CMS released a hospital quality Access Database every quarter. In order to stay consistent
in our research, we used the databases released in March every year.
Each quality database contains several sub-databases. For this project, we only used three
of them and Table 7 below describes each sub-database. Table 8 then shows the specific quality
of health care indicators that we used.
5 www.cms.gov/HospitalQualityInits/11_HospitalCompare.asp

37
Table 7 Quality sub-database
Database Name Description
Dbo_vwHQI_HOSP The basic information about each hospital
dbo vwHQI HOSP MSR XWLK The raw data for each measurement
dbo vwHQI FTNT The footnote for each raw data item
Table 8 Quality Database Measurements
Measurement Name Database Name Variable Type
Heart Attack Patients Given ACE
Inhibitor or ARB for Left
Ventricular Systolic Dysfunction
(LVSD)
dbo vwHQI HOSP MSR XWLK Dependent Variable
Heart Failure Patients Given
Smoking Cessation
Advice/Counseling
dbo vwHQI HOSP MSR XWLK Dependent Variable
Pneumonia Patients Given
Smoking Cessation
Advice/Counseling
dbo vwHQI HOSP MSR XWLK Dependent Variable
Pneumonia Patients Given the
Most Appropriate Initial
Antibiotic(s)
dbo vwHQI HOSP MSR XWLK Dependent Variable
Surgery Patients Who Received
Preventative Antibiotic(s) One
Hour Before Incision
dbo vwHQI HOSP MSR XWLK Dependent Variable
Surgery Patients Whose
Preventative Antibiotic(s) are
Stopped Within 24 hours After
Surgery
dbo vwHQI HOSP MSR XWLK Dependent Variable

38
The hospitals in the quality databases share the same Provider ID as the cost database.
Therefore, it was convenient for us to connect both databases together. Since the quality database
was already generated in MS Access format, we did not have to input the raw data into the
database.
4.2.3 Hospital List
For our research, we chose all of the acute hospitals in the Massachusetts, Connecticut
and Wisconsin. Also, we checked the quality data for each acute hospital and selected the
hospitals which submitted the quality data every year. The detailed hospital list is shown in
Appendix D.
4.2.4 Population Data
We also collected the population of the town where the hospital is located from the
United States Census Office6. Since the last two censuses took place in 2000 and 2010, we used
the estimated population given by the U.S. Census Office.
4.2.5 Control Variable Collection
We collected our control variable data from both cost databases and quality databases.
Below is Table 9, which shows the coordinate of each variable.
6 http://www.census.gov/

39
Table 9 Control Variable Coordinate
Measurement
Name
File Name Form Worksheet
Code
Line Code Column
Code
Number of
Beds hosp_xxxx_NUMR Form S31 „S300001‟ „01200‟ „0100‟
If the hospital
is teaching
hospital?
hosp_xxxx_ALPHA Form S2 „S200000‟ „02500‟ „0100‟
Ownership Dbo_vwHQI_HOSP N/A N/A N/A N/A
If the hospital
provides
emergency
service?
Dbo_vwHQI_HOSP N/A N/A N/A N/A
City Dbo_vwHQI_HOSP N/A N/A N/A N/A
County Dbo_vwHQI_HOSP N/A N/A N/A N/A
4.3 Statistical Analysis
In this research, statistical techniques were used to analyze data and evaluate the impacts
of the reform. The hospital operation cost data, as well as quality and salary data of
Massachusetts, Connecticut and Wisconsin was analyzed and the measures of central tendency
was calculated. These values helped to determine the trend of hospital operational cost. After
computing the operational cost and department salaries, the change of the cost was determined
and evaluated based on the reform. Standard deviation helped examine if the samples chosen
reflected the general trends of hospital operation cost in these three states.

40
4.4 Difference-In-Differences
Difference-In-Differences is a statistic and econometric technique used to measure the
effect of a treatment at a given period in time (Econometrics, 2006). In our studies, we compared
the hospital data before the Massachusetts health care reform against that after the reform to find
the overall impacts of the reform on the hospital quality and operational costs. However, there
were a lot of factors changing at the same time. For instance, there could have been a national
trend for increasing quality and containing cost which may have affected the hospital operations
in Massachusetts significantly. Therefore, in order to ensure that the changes in the hospital
quality and operational costs were due to the reform rather than the national trend, we decided to
use a Difference-in-Differences technique. Connecticut and Wisconsin were used as control
states since their hospital quality status, population size and health care coverage were similar to
those in Massachusetts before the reform. In addition, these states did not enact any health care
reform bill during our study period.
The equation for the Difference-In-Differences regression is the following:
Y=β0 + β1*(Time*MA) + β2*Time + β3*MA + ε (Econometrics, 2006)
In this equation, Y is the measurement of hospital operational cost and quality of medical
service. β2*Time is a time dummy, MA is a state dummy for Massachusetts, and Time*MA is the
interaction of the time dummy and the state dummy (a product of the two variables)
(Econometrics, 2006).
The chart below shows the time and the changes in hospital quality and cost in each state
(Econometrics, 2006). As shown by the table below, “a” represents Connecticut before the
reform, “d” represents Connecticut after the reform, “b” represents Wisconsin before the reform,
“e” represents Wisconsin after the reform, “c” represents Massachusetts before the reform, “f”
represents Massachusetts after the reform.

41
Table 10 Difference-in-Differences Variables Table (Econometrics, 2006)
Connecticut (control) Wisconsin (control) Massachusetts
Before Reform A B c
After Reform D E f
The following chart in Table 11 describes what each coefficient in the equation
represents (Econometrics, 2006).
Table 11 Difference-in-Differences Table comparing CT and MA (Econometrics, 2006)
Coefficient Calculation
β0 a; c
β1 (f-c)*(f-d)
β2 f-c
β3 c-a; f-d
From the two charts above, one can see that β0 is the constant, β1 represents the causal
effect of the reform, β2 measures the common time trend in all states after the reform, β3 captures
the difference between Massachusetts and the control states (Econometrics, 2006). The
difference-in-differences variables described above will be further explained below.
4.5 Econometric Modeling of the Health Industry
Econometric Modeling is “the quantitative analysis of actual economic phenomena based
on the concurrent development of theory and observation related by appropriate methods of
inference” (Samuelson, 1958). Econometric modeling can be used to estimate the dependent
variables and their relationship in an economic system.

42
4.5.1 Cost Model
The equations below are the econometric models for cost. The difference-in-differences
variables, as shown below, are the impact of the reform, whether the data is before or after the
reform, and the state from which the data was collected. The control variables include the size of
the hospital, the type of the hospital, and city size (population of the city in which the hospital is
located), whether it offers emergency services, and whether it is a teaching hospital, which will
be explained in the Control Variables section. The dependent variables are total operational cost
and salaries cost.
YTotal Cost = β0 + β1Time* MA + β2Time + β3MA + β4Size + β5Teaching + β6Type +
β7Emergency + β8Population + ε
YSalary = β0 + β1Time*MA + β2Time + β3MA + β4Size + β5Teaching + β6Type + ε
Dependent Variables:
The following list includes all of the dependent variables used in the cost model.
YCost: Total Operational Cost Adjusted by Inflation
We used total operational cost as the dependent variable in our model. This cost is
adjusted with the inflation rate to get the actual values. We then used the real cost to evaluate the
overall impacts of the reform on the hospital operational cost.
YSalary: Salaries Cost Adjusted by Inflation
We used physician salaries from different departments such as the Operating Room,
Radiology Room, Respiratory Therapy, Physical Therapy, Electrocardiology and Emergency
Room. All these costs were adjusted with the inflation rate to get more realistic values.

43
Difference-in-Differences Variables:
MA*Time (Dummy Variable): MA*Time = 1 if a hospital is in Massachusetts and is after
reform. Otherwise, MA*Time = 0
The reform variable described above is the most important variable in our model as it
shows the impact of the reform on the cost. We expect β1 to be close to zero because the target of
the Massachusetts health care reform is to contain hospital cost.
Time (Dummy Variable): Time = 1 if the hospital data is after reform (the first 2 years from July
2004 to June 2006 are pre-reform). Time = 0 if the hospital data is after reform (the later 3 years
from July 2006 to June 2009 are post-reform).
The time variable compares the pre-reform conditions to the post-reform conditions. In
our model, we consider FY2005 and FY2006 as pre-reform and FY2007, FY2008 and FY2009
as post-reform. We expect β2 to be positive because the hospital operational costs in all three
states are expected to increase over time.
MA (Dummy Variable): State = 1 if the hospital data is in Massachusetts. State = 0 if the hospital
data is in Connecticut or Wisconsin
MA is the state variable which compares the hospitals in Massachusetts against those in
Connecticut and Wisconsin. Our hypothesis is that β3 of Massachusetts should be close to zero as
the operational cost is expected to be contained in Massachusetts compared to Connecticut and
Wisconsin.

44
Control Variables:
Cost Equation found in Literature Review
The function above shows the relationship between total cost and different control
variables. In the function, ai1 is the total cost. Sio is the size of the ith hospital in the first period,
Pi and Mi are dummy variables indicating the hospital's location; ATi and Ti are dummy variables
representing the hospital's teaching status (Lave & Lave, 1970).
The city size, teaching status hospital size definitely have some effects on the costs and
quality of services of a hospital (Lave & Lave, 1970). In addition, in another article written by
Sloan et al. (2001), the hospital ownership was considered as one of the variables that will
impact on the hospital operational cost.
Size (Dummy Variable): Size = Extra Large if >400, Large if <400 and >200, Medium if <200
and >100, Small if <100.
Size is the hospital size variable. We classified all the hospitals into four different
categories based on their number of beds. These categories include Extra Large, Large, Medium
and Small. We expect β4 of Extra Large to be positive since big hospitals have higher operational
costs.
Teaching (Dummy Variable): Teaching = 1 if the hospital is teaching hospital. Otherwise,
Teaching = 0

45
Teaching is the teaching hospital variable. We expect that β5 will be positive because
teaching hospitals have higher costs than nonteaching hospitals.
Type (Dummy Variable): Proprietary, Governmental and Non-profit.
Type is the hospital type variable. There are three types of hospitals: Proprietary, Non-
profit and Governmental . We expect that β6 of Non-profit are positive because nonprofit
hospitals have higher operational costs than other hospitals.
Emergency (Dummy Variable): Emergency Service (Emergency = 1 if the hospital provides
emergency service. Otherwise, Emergency = 0)
Emergency is the Emergency Service variable. We expect β7 to be positive since the
hospital with emergency service are expected to have higher operational costs.
City Size (Continuous Variable): The population size of a city divided by fifty thousand
We hypothesize that β8 will be positive since the bigger the city, the higher the
operational cost for the hospital.
4.5.2 Quality Model
The equations below are an econometric model for the quality of medical services. The
dependent variables are the different measurements of medical services. The difference-in-
differences variables include the impact of the reform, whether the data is before or after the
reform, the state from which the data was collected. The control variables are the size of the
hospital, whether it is a teaching hospital, its ownership, whether or not it offers emergency
services and the population of the city in which the hospital is located. Several articles that are
mentioned below show that these control variables above have effects on the Massachusetts

46
health care reform. Therefore, we can use them in our model to find the overall impacts of the
reform on hospital quality (Sloan, Picone, Jr., & Chou, 2001 & Keeler, et al., 1992).
Yquality = β0 + β1Time*MA + β2Time + β3MA + β4Size + β5Teaching + β6Type + β7Emergency +
β8 Population + ε
Dependent Variables:
The following list includes all of the dependent variables used in the quality model.
Yquality (Continuous Variable):
Heart Attack Patients Given ACE Inhibitor or ARB for Left Ventricular Systolic
Dysfunction (LVSD);
Heart Failure Patients Given Smoking Cessation Advice/Counseling;
Pneumonia Patients Given Smoking Cessation Advice/Counseling;
Pneumonia Patients Given the Most Appropriate Initial Antibiotic(s);
Surgery Patients Who Received Preventative Antibiotic(s) One Hour Before Incision;
Surgery Patients Whose Preventative Antibiotic(s) are Stopped Within 24 hours After
Surgery
As demonstrated above, we have six different indicators to measure the quality of
medical services in the quality model. We used them separately to see the overall effects of the
reform on hospital quality.
Difference-in-Differences Variables:
The following list includes the Difference-in-Differences variables.

47
MA*Time (Dummy Variable): Already described above.
MA* Time is the most important variable in our model, symbolizing the impact of the
reform on the quality. Because the target of the Massachusetts health care reform is to improve
quality, we expect β1 to be positive.
Time (Dummy Variable): Already described above
As mentioned before, in our model, we consider 2005 and 2006 as pre-reform and
thereafter as post-reform. The quality of health care will be improved over the years, so we
expect that β2 to be positive.
MA (Dummy Variable): Already described above
Our hypothesis is that β3 should be zero as the hospital quality status in Connecticut and
Wisconsin are very similar to that in Massachusetts (State Data Center, 2009).

48
Control Variables:
Figure 7 Control Variables Used in Previous Research (Keeler, et al., 1992)
Before selecting our control variable, we conducted some preliminary research. As
shown above in Figure 7, the city size, teaching status, ownership and hospital size definitely
have some meaningful impacts on the effects of the reform (Keeler, et al., 1992). We also
included the emergency service in our model because we consider the hospitals which provide
emergency room services as ones that provide higher overall quality of care.
Size (Dummy Variable): Already described above
Just as in the cost model, we classified all the hospitals into four different categories
based on their number of beds. These categories include Extra Large, Large, Medium and Small.
We expect β4 of Extra Large to be positive since, as the previous table shows, big hospitals have
better quality of care. For other variables, we expect that their values are negative.
Teaching (Dummy Variable): Already described above

49
We expect that β5 is positive because, as the table shows, teaching hospital offers much
better medical services than nonteaching hospitals.
Type (Dummy Variable): Already described above
Just as in the cost model, we classified the three types of hospitals as: Proprietary, Non-
profit and Governmental. We expect that β6 of Non-profit hospitals are positive because
according to an article reviewed, nonprofit hospitals provide better quality of cares than other
types of hospitals (Sloan, Picone, Jr., & Chou, 2001). We also hypothesize that the beta values of
Proprietary and Governmental are negative (Sloan, Picone, Jr., & Chou, 2001).
Emergency (Dummy Variable): Already described above
Emergency is the Emergency Service variable. We expect β7 to be positive since as we
said previously, the hospitals with emergency service are expected to have higher quality of care.
Population (Continuous Variable): Already described above
Population is the city size variable. It measures the population of a city or town in which
the hospital operates. In our model, we divided the population size by fifty thousand. We
hypothesize that β8 will be positive as the table above shows that hospitals in bigger cities offer
better medical services than those in smaller cities.
4.6 Regression Analysis
Regression techniques were utilized to determine the relationships between hospital
operation cost factors, department salaries, as well as quality of medical services, and the reform.
The purpose of this regression analysis was to assess the accuracy of the models we generated.

50
In other words, we determined how well the independent variables could be used to predict the
values of the dependent variables (Bell, 2011).
The hospital cost data that was collected from the Centers for Medicare and Medicaid
Services (CMS), as well as the hospital quality data collected from the Medicare Hospital
Compare Quality of Care Database was entered into “Statistical Package for the Social Sciences”
(SPSS) and was organized by variable and hospital. Descriptive statistics were then performed
on the data (using SPSS) in order to eliminate any outliers that could skew the results of the
regression. Minimum and maximum were used to find such outliers, which included a total
operational cost of 0 for Umass Memorial of Massachusetts in 2009 and over 17,000 beds in
Mercy Medical Center of Wisconsin in 2009. This number of beds is an outlier, as it is
unrealistically large. The total operational cost outlier was deleted and the number of beds of
2008 for Mercy Medical Center was substituted for 2009.
As seen from the models presented above in Section 4.5, the dependent variable for the
cost model was the total hospital operational cost and the independent variables included
multiple control variables, such as hospital size (determined by the number of beds), whether it is
a teaching hospital, ownership of hospital (whether it is non-profit, proprietary or governmental),
city size (population of the city the hospital is located in) and whether it offers emergency
services. Dependent variables for the salary models include the salary of the emergency room,
operating room, radiology department, physical therapy department, and electrocardiology
department, while the independent variables remain the same as for total cost except that the
emergency services dummy variable and city population are eliminated. All total operational cost
and salary values were first adjusted depending on the inflation rate of that year before being
used in the regression. The dependent variable for the quality model was the pneumonia, heart
attack, heart failure, or surgery patient indicators collected through the database. In the quality
model, control variables, such as hospital size, whether it is a teaching hospital, city size and
whether it offers emergency services were included. We expect all of the control variables to
affect cost and quality, as we have found literature and previous research to support this.
However, the most significant variables that are included in both of the cost and quality models
are the difference-in-differences variables, which include the state, the year and the “reform
variable,” β1MA*Time, which is a product of the two. Separate regressions were run for cost
and quality, as well as department salaries, and we the results generated for the reform variable

51
were used to determine whether or not the reform has truly affected hospital cost and quality.
Specifically, we looked at the R-Squared value generated, which measures how successful the
regression is. A value of 1.00 means that the independent variables flawlessly predict the
dependent variables. The significance of the model was also used to measure how meaningful
the results of the regression are, as well as the significance of the specific coefficients. P-values
close to 0 symbolize a greater significance. Finally, the beta value was looked at in order to
determine specifically how the variables relate to each other. For example, a negative beta value
means that the independent variable has a negative effect on the dependent variable, while a
positive beta value means just the opposite.
Ideally, we were looking for an R-Squared value close to 1 to indicate that our
independent variables do predict our dependent variables. Although, we expected all of the
control variables to be significant, we paid most attention to whether or not the reform variable is
significant. If the reform really did affect hospital cost and quality in the way that was planned,
then the state and time should show significance in determining hospital cost and quality. If this
was true, then Massachusetts would have a higher quality of medical services after the reform
and contained costs, while the other states would not show such trends.

52
5.0 Results
The following results will present the collected hospital cost and quality data and analyze
the trends found.
5.1 Descriptive Statistics
In total, we collected the hospital quality and cost data from 153 hospitals from
Massachusetts, Connecticut and Wisconsin. Specifically, we collected the information from 30
hospitals from Connecticut, 61 hospitals from Massachusetts and 62 from Wisconsin. All of the
hospitals are acute care hospitals.
In the following section, we will discuss the hospital ownership in each state based on the
definition given by CMS. In CMS list, the hospitals are separated into thirteen classes, which are
listed in following table.
Table 12 Hospital Ownership Code
Ownership Code Description of Ownership
1 Voluntary Nonprofit, Church
2 Voluntary Nonprofit, Other
3 Proprietary, Individual
4 Proprietary, Corporation
5 Proprietary, Partnership
6 Proprietary, Other
7 Governmental, Federal
8 Governmental, City-County
9 Governmental, County
10 Governmental, State
11 Governmental Hospital District
12 Governmental, City
13 Governmental, Other

53
Table 13 below shows categorizes the hospitals in each state by ownership, size, whether
it is a teaching hospital and whether or not it offers emergency services.
Table 13 Descriptive Statistics of Hospital Sample
Variable Massachusetts Connecticut Wisconsin
Ownership
Governmental 1 1 1
Proprietary 5 1 4
Non profit 55 28 57
Size
Extra Large 7 4 5
Large 15 8 9
Medium 25 11 22
Small 14 7 26
Teaching 35 17 24
Emergency 56 29 60
In Connecticut, 28 hospitals, which are 93% of total hospital in Connecticut, are
voluntary non-profit hospitals and 58% of them are private sector. For the rest hospitals, one of
them is a government funded hospital and one is a proprietary hospital. Approximately 36% of
the hospitals are medium sized and there is almost an equal number of large and small hospitals.
About 57% are teaching hospitals and all but one hospital offer emergency services.
In Massachusetts, the voluntary non-profit hospital is still the largest group, which takes
90% of the total. Among these non-profit hospitals, 34 of them are in the private sector and 6 of
them are owned by church. For the rest hospitals, five hospitals are governmental and one of
them is proprietary. About 43% of the hospitals are medium sized and there are equal numbers of
large and small hospitals. Only about 12% are extra large hospitals. Nearly 60% are teaching
hospitals and all but two hospitals offer emergency services.
57 of the Wisconsin hospitals are voluntary non-profit hospitals. More than half of them
are private non-profit hospitals and 18 of them are church owned hospitals, which is the largest

54
amongst these three states. Besides these non-profit hospitals, only one hospital is funded by
government, which is different from other states. The other four are proprietary hospitals.
Approximately 42% of hospitals are small and 35% are medium sized. About 39% are teaching
hospitals and all but two offer emergency services.
5.2 Summary Statistics
The following tables and text will present the summary statistics of the collected data,
such as the mean and standard deviation. Table 14 below contains the hospital size data of our
sample. The data we analyzed here is from July 2004 till June 2009. We separate these 5 years
data into two groups: pre-reform and post-reform. We defined the first 2 years, which is from
July 2004 to June 2006 as pre-reform. Then we defined the later 3 years, which is from July 2006
to June 2009 as post-reform.

55
Table 14 Summary Statistics of Dependent Variables
Dependent Variables
MA CT WI
Definition Mean
Std.
Dev.
Sample
Size Mean
Std.
Dev.
Sample
Size
Mean Std.
Dev.
Sample
Size
Cost
Total Operating Cost (in millions) Hospital Total Operating Cost 281.892 345.831 302 246.777 205.741 149 169.571 172.442 285
Physician Salaries (in millions) Hospital Physician Salaries
Operating Room Operating Room Physician Salaries 6.522 8.144 294 5.734 4.956 144 3.524 3.474 284
Radiology Room Radiology Room Physician Salaries 5.548 6.387 298 3.457 3.090 144 2.993 2.969 269
Respiratory Therapy Respiratory Therapy Physician Salaries 1.478 1.427 295 1.628 1.354 140 1.059 1.055 270
Physical Therapy Physical Therapy Physician Salaries 1.878 1.937 267 1.766 1.205 119 1.667 1.229 254
Electrocardiology Electrocardiology Physician Salaries 1.039 1.394 290 0.815 1.217 129 0.691 1.172 193
Emergency Room Emergency Room Physician Salaries 6.377 5.271 289 7.860 4.725 145 2.710 1.679 267
Quality
Heart Attack Heart Attack Patients Given ACE Inhibitor or ARB for Left Ventricular
Systolic Dysfunction (LVSD)
0.836 0.210 209 0.828 0.213 106 0.851 0.245 196
Heart Failure Heart Failure Patients Given Smoking Cessation Advice/Counseling 0.808 0.212 143 0.861 0.221 75 0.869 0.181 183
Pneumonia
Pneumonia Patients Given Smoking Cessation Advice/Counseling 0.782 0.250 95 0.817 0.259 40 0.865 0.145 107
Pneumonia Patients Given the Most Appropriate Initial Antibiotic(s) 0.836 0.135 80 0.772 0.278 42 0.877 0.066 62
Surgery
Surgery Patients Who Received Preventative
Antibiotic(s) One Hour Before Incision
0.905 0.093 147 0.898 0.061 75 0.923 0.062 156
Surgery Patients Whose Preventative Antibiotic(s) are
Stopped Within 24 Hours After Surgery
0.854 0.134 145 0.845 0.111 72 0.825 0.174 145

56
The table above is the summary statistics for the dependent variables in our models. As
we can see clearly from the table, the total operational cost in Massachusetts is much higher than
that in Connecticut and Wisconsin. This rule also applies to the department salaries. Concerning
the quality of medical services, all the three states are at a similar level, which is why we decided
to use Connecticut and Wisconsin as our control groups. Appendix G presents the trends of these
dependent variables in a graphical format.
The table below is the summary statistics of the control variables. As can be seen in the
table, there are more small hospitals and fewer big hospitals in Wisconsin than in the other two
states. We can also see that the nonprofit is the dominant ownership for all of the three states.
The teaching hospital rates are much higher in Massachusetts and Connecticut than in
Wisconsin. Most of the hospitals provide emergency care. Finally, the city size in which the
hospital operates is much bigger in Massachusetts than in Connecticut or in Wisconsin. Table 16
below contains the statistic results of the dependent variables in Massachusetts and Wisconsin
before and after the reform.

57
Table 15 Summary Statistics of Explanatory Variables
Explanatory Variables
MA CT WI
Mean Std. Dev. Mean Std. Dev. Mean Std. Dev.
Hospital Size
Hospital_>400 0.115 0.319 0.133 0.341 0.077 0.268
Hospital_200-400 0.249 0.433 0.267 0.444 0.152 0.359
Hospital_100-200 0.403 0.491 0.360 0.482 0.348 0.477
Hospital_<100 0.233 0.423 0.240 0.429 0.423 0.495
Ownership
Ownership _Governmental 0.016 0.127 0.033 0.180 0.016 0.126
Ownership _Proprietary 0.066 0.248 0.027 0.162 0.052 0.222
Ownership _Nonprofit 0.902 0.298 0.933 0.250 0.916 0.278
Teaching Hospital 0.574 0.495 0.567 0.497 0.387 0.488
Emergency Service 0.921 0.270 0.960 0.197 0.965 0.185
Town Population_50K 3.228 4.441 1.307 0.849 1.880 3.179
Sample Size 305 150 310

58
Table 16 Dependent Variables (Before Reform and After Reform)
Explanatory Variables
MA CT
Before Reform After Reform Before Reform After Reform Simple DD
Definition Mean
Std.
Dev.
Sample
Size Mean
Std.
Dev.
Sample
Size
Mean Std.
Dev.
Sample
Size
Mean Std.
Dev.
Sample
Size
MA*
TIME
Std. Err.
Cost
Total Operating Cost
(in millions)
Hospital Total Operating Cost 272.080 352.266 122 288.505 342.249 180 221.748 177.058 60 263.650 222.388 89 -0.040 [60.416]
Physician Salaries
(in millions)
Hospital Physician Salaries
Operating Room Operating Room Physician Salaries 5.754 7.068 118 7.038 8.776 176 4.892 3.756 58 6.301 5.573 86 -0.010 [1.444]
Radiology Room Radiology Room Physician Salaries 5.071 5.681 119 5.866 6.813 179 3.158 2.478 58 3.659 3.441 86 0.022 [1.102]
Respiratory Therapy Respiratory Therapy Physician Salaries 1.355 1.274 117 1.560 1.519 178 1.499 1.204 56 1.714 1.446 84 -0.008 [0.283]
Physical Therapy Physical Therapy Physician Salaries 1.680 1.631 109 2.015 2.117 158 1.530 1.034 48 1.925 1.291 71 -0.018 [0.376]
Electrocariology Electrocardiology Physician Salaries 0.974 1.359 118 1.083 1.420 172 0.732 1.070 52 0.870 1.311 77 -0.013 [0.279]
Emergency Room Emergency Room Physician Salaries 5.620 4.644 116 6.885 5.608 173 6.870 3.800 59 8.540 5.179 86 -0.035 [1.008]
Quality
Heart Attack Heart Attack Patients Given ACE
Inhibitor or ARB for Left Ventricular
Systolic Dysfunction (LVSD)
0.772 0.259 92 0.887 0.144 117 0.746 0.254 52 0.906 0.120 54 -0.104 [0.048]
Heart Failure Heart Failure Patients Given Smoking
Cessation Advice/Counseling
0.685 0.238 58 0.892 0.143 85 0.808 0.207 28 0.893 0.225 47 0.274 [0.058]**
Pneumonia
Pneumonia Patients Given Smoking
Cessation Advice/Counseling
0.611 0.288 38 0.896 0.129 57 0.526 0.320 10 0.913 0.139 30 -0.199 [0.086]
Pneumonia Patients Given the Most
Appropriate Initial Antibiotic(s)
0.781 0.110 32 0.873 0.138 48 0.510 0.333 8 0.834 0.228 34 -0.574 [0.081]***
Surgery
Surgery Patients Who Received
PreventativeAntibiotic(s) One Hour
Before Incision
0.803 0.087 16 0.918 0.085 131 0.870 0.000 2 0.899 0.062 73 0.512 [0.060]
Surgery Patients Whose Preventative
Antibiotic(s) are Stopped Within 24
Hours After Surgery
0.731 0.122 16 0.869 0.128 129 0.890 0.000 2 0.843 0.113 70 0.715 [0.094]**

59
Explanatory Variables
MA WI
Before Reform
After Reform
Before Reform
After Reform
Simple DD
Definition Mean
Std.
Dev.
Sample
Size
Mean Std.
Dev.
Sample
Size
Mean Std.
Dev.
Sample
Size
Mean Std.
Dev.
Sample
Size
MA*
TIME
Std. Err.
Cost
Total Operating Cost
(in millions)
Hospital Total Operating Cost 272.080 352.266 122 288.505 342.249 180 162.558 164.782 124 174.972 178.440 161 0.006 [44.586]
Physician Salaries
(in millions)
Hospital Physician Salaries
Operating Room Operating Room Physician Salaries 5.754 7.068 118 7.038 8.776 176 3.390 3.265 123 3.627 3.633 161 0.071 [1.023]
Radiology Room Radiology Room Physician Salaries 5.071 5.681 119 5.866 6.813 179 2.928 2.841 117 3.042 3.072 152 0.057 [0.832]
Respiratory Therapy Respiratory Therapy Physician Salaries 1.355 1.274 117 1.560 1.519 178 1.010 1.018 118 1.096 1.084 152 0.036 [0.208]
Physical Therapy Physical Therapy Physician Salaries 1.680 1.631 109 2.015 2.117 158 1.574 1.071 111 1.740 1.338 143 0.050 [0.278]
Electrocariology Electrocardiology Physician Salaries 0.974 1.359 118 1.083 1.420 172 0.614 0.962 85 0.751 1.316 108 -0.009 [0.237]
Emergency Room Emergency Room Physician Salaries 5.620 4.644 116 6.885 5.608 173 2.543 1.506 116 2.839 1.797 151 0.100 [0.655]
Quality
Heart Attack Heart Attack Patients Given ACE
Inhibitor or ARB for Left Ventricular
Systolic Dysfunction (LVSD)
0.772 0.259 92 0.887 0.144 117 0.826 0.231 78 0.868 0.253 118 0.392 [0.050]***
Heart Failure Heart Failure Patients Given Smoking
Cessation Advice/Counseling
0.685 0.238 58 0.892 0.143 85 0.753 0.222 54 0.918 0.135 129 0.281 [0.036]*
Pneumonia
Pneumonia Patients Given Smoking
Cessation Advice/Counseling
0.611 0.288 38 0.896 0.129 57 0.800 0.168 42 0.907 0.111 65 0.399 [0.027]**
Pneumonia Patients Given the Most
Appropriate Initial Antibiotic(s)
0.781 0.110 32 0.873 0.138 48 0.864 0.059 32 0.891 0.072 30 -0.412 [0.051]**
Surgery
Surgery Patients Who Received
Preventative Antibiotic(s) One Hour
Before Incision
0.803 0.087 16 0.918 0.085 131 0.877 0.061 18 0.929 0.060 138 0.392 [0.050]***
Surgery Patients Whose Preventative
Antibiotic(s) are Stopped Within 24
Hours After Surgery
0.731 0.122 16 0.869 0.128 129 0.591 0.266 18 0.858 0.127 127 0.281 [0.036]*

60
The tables above just compare the dependent variables before reform against those after
reform in all the three states. As we can see from the tables above, the cost increases after the
reform for all the three states. The total cost, however, was relatively contained in Massachusetts
and Wisconsin, where it increased by about 6% and 7.5%, respectively. In Connecticut, the total
cost increased by about 19%. The operating room salary increased significantly in Massachusetts
and Connecticut by about 23% and 31%, respectively, while it only increased by about 6% in
Wisconsin. The emergency room salary increased in Massachusetts and Connecticut by 21% and
25%, respectively, and it only increased in Wisconsin by about 12%. The smaller departments
showed similar trends in all of the states and the quality of services increased in all states after
the reform. For Connecticut, only three of the simple DD regressions yielded significant values,
which were the quality regressions for heart failure, pneumonia patients receiving the most
appropriate antibiotic and surgery patients no longer receiving antibiotics 24 hours after surgery.
For the heart failure and surgery patients, the reform had a positive impact, while it had a
negative impact for pneumonia patients. It also indicates that the quality improves after the
reform in all the three states. For the comparison with Wisconsin, all of the quality regressions
were significant, indicating that the reform positively impacted all of the quality indicators
except for pneumonia patients who are no longer receiving antibiotic. Although, it is useful to
run the simple difference-in-differences regressions, one must keep in mind that these p-values
are subject to change once all of the control variables are included.
Table 17 below is the comparison table for the control variables before and after the
reform in Massahusetts and Connecticut. As we can see from Table 17, there are not many
changes between the values before the reform and those after the reform. The next section will
describe all of our generated regression analysis results.

61
Table 17 Control Variables (Before Reform and After Reform)
Explanatory Variables
MA CT WI
Before Reform After Reform Before Reform After Reform Before Reform After Reform
Mean Std. Dev. Mean Std. Dev. Mean Std. Dev. Mean Std. Dev. Mean Std. Dev. Mean Std. Dev.
Hospital Size
Hospital_>400 0.115 0.320 0.115 0.320 0.133 0.343 0.133 0.342 0.073 0.260 0.081 0.273
Hospital_200-400 0.246 0.432 0.251 0.435 0.267 0.446 0.267 0.445 0.153 0.362 0.151 0.359
Hospital_100-200 0.410 0.494 0.399 0.491 0.367 0.486 0.356 0.481 0.355 0.480 0.344 0.476
Hospital_<100 0.230 0.422 0.235 0.425 0.233 0.427 0.244 0.432 0.419 0.495 0.425 0.496
Ownership
Ownership _Governmental 0.016 0.128 0.016 0.127 0.033 0.181 0.033 0.181 0.016 0.126 0.016 0.126
Ownership _Proprietary 0.082 0.275 0.055 0.228 0.033 0.181 0.022 0.148 0.065 0.247 0.043 0.203
Ownership _Nonprofit 0.902 0.299 0.902 0.299 0.933 0.252 0.933 0.251 0.911 0.285 0.919 0.273
Teaching Hospital 0.574 0.497 0.574 0.496 0.567 0.500 0.567 0.498 0.387 0.489 0.387 0.488
Emergency Service 0.926 0.262 0.918 0.275 0.967 0.181 0.956 0.207 0.968 0.177 0.962 0.191
Town Population_50K 3.169 4.342 3.267 4.517 1.304 0.853 1.309 0.850 1.871 3.178 1.886 3.188
Sample Size 122 183 60 90 124 186

62
5.3 Results of Regression Analysis
As was previously described above in the Methodology section, a series of three
regressions were run: for cost, for quality, and for department salaries. This section will describe
the results that were generated by SPSS, starting with total cost in Table 18 below.
5.3.1 Total Cost
The regression run on the total cost model generated an R-Squared value of about 0.736,
which means that the dependent variables predicted total cost fairly accurately. As can be seen
from Table 16 above, the variable with the reform variable is insignificant, as well as the
dummy variable symbolizing which state the data was obtained. The other control variables of
hospital size, ownership, whether it is a teaching hospital and city population are all very
significant with significance values close to 0. Time and whether the hospital offers emergency
services appear to be slightly less important with values closer to 0.1, but are still significant.
From the beta values presented in Table 18, it is evident that larger hospitals, teaching hospitals,
nonprofit and government-owned hospitals have a higher total cost. Total cost is also higher in
Massachusetts and larger towns.
5.3.2 Salaries
We also ran regressions on models for various department salaries. Since we do not
expect many of the smaller departments to be affected by the reform because they were not
particularly targeted by any of the reform efforts, we will include those in Appendix B. The R-
squared value for the regression for the emergency room salary was 0.429, which is somewhat
meaningful, considering our independent variables accurately predicted our dependent variable
about half of the time. The reform variable is insignificant, as it generated a value of 0.369. As
can be seen from the results above, most of the control variables were significant except for the
dummy variable indicating nonprofit hospitals. The dummy variable indicating medium hospital
size and the dummy variable indicating time were significant with values around 0.05. Beta

63
values showed that larger hospitals had a larger emergency room salary and that salaries were
also higher for teaching hospitals. The emergency room salaries were also higher in
Massachusetts. The R-squared value for the operating room salary regression is 0.591, which is
slightly higher than that generated for the emergency room salary regression, and very
meaningful. The reform variable is insignificant, as it generated a value of 0.362. As exemplified
by the values above, there is a lot of variance in the significance of the independent variables in
this regression. Variables for size, teaching hospitals, and whether the hospital is located in
Massachusetts were most significant with values from 0 to close to 0.05. Other variables, such as
the reform variable, whether the hospital is located in Connecticut, and ownership are all
insignificant with values between 0.345 and 0.777. Beta values indicated that larger and teaching
hospitals had higher salaries. Hospitals in Massachusetts also had higher operating room salaries.
Generally, the trend in the cost and salary regressions seemed to be that the reform variable was
insignificant, but there were generally higher costs and salaries in Massachusetts.
5.3.3 Quality
Table 18 above also includes the quality results. The R-Squared value for the quality of
medical services administered to heart attack patients is much smaller than that above for total
cost at a value of 0.105, meaning that the independent variables do not have a very strong
correlation with the dependent variable. The reform variable generated a significance value of
0.582, which is insignificant. As can be seen from the significance values above, there is much
more variability in the values than those generated from the total cost regression. The variables
that were most significant with significance values of 0 were time and whether or not the hospital
was a teaching hospital. Whether or not the hospital provided emergency services, was also
somewhat significant with a significance value of 0.089. Other variables had much higher p-
values, all above 0.2 (except for the dummy value symbolizing if the data was obtained from
Massachusetts), and most of which were closer to 0.5 or higher. It is demonstrated by the
generated beta values that teaching hospitals provide a higher quality of medical services, which
was also supported by our preliminary research. It was also shown that quality generally
increased with time for all of the states.

64
The R-Squared value for the quality model for heart failure patients is still low at 0.326,
although it is significantly higher than that for heart attack patients. It is worth noting that the
reform variable seems to be significant here with a value of 0.068. It also generated a positive
beta value, indicating that the reform had a positive impact on the quality of medical services for
heart failure patients. As seen above, the p-values of the variables in this model also greatly vary
from 0 to almost 0.7 for the dummy variable “IF_CT.” The city population size and the dummy
variable “OWN_GOV” also seem to not be significant. However, the other control variables are
significant with values close to 0. The beta values indicated that all states had increased quality
of medical services over time and that there was increased quality in larger hospitals and larger
cities. However, there was a lower level of quality service provided in teaching hospitals, which
does not coincide with our preliminary research. There was also a lower level of quality services
provided in Massachusetts hospitals.
The R-Squared value for the quality of medical services of pneumonia patients receiving
medical advice for smoking cessation is the highest yet for the quality models with a value of
0.438. As can be seen from the values presented above in Table 10, the reform variable was
extremely significant with a value of 0.001. This means that the reform almost perfectly
predicted the quality of treatment of pneumonia patients, which, in this case, was medical advice
concerning smoking cessation. The regression also yielded a positive beta value, demonstrating
that the reform increased the quality of services administered to these patients. All of the control
variables except for the dummy variable for nonprofit hospitals and that for city population were
significant. Whether the hospital offered emergency services and the dummy variable for
whether or not the hospital was located in the state of Connecticut were also significant with
values closer to 0.03. Beta values indicated that the reform, time, hospitals offering emergency
services and larger hospitals all provided a higher quality of medical services for pneumonia
patients receiving medical advice. Governmentally owned hospitals and teaching hospitals
offered a lower quality of medical services.
The regression for pneumonia patients receiving the most appropriate antibiotic was
similar in terms of the R-squared value, which was 0.450. The reform variable was insignificant
with a p-value of 0.768. As can be seen above, many of the control variables, such as the dummy
variable for ownership, the dummy variable indicating a large hospital, the dummy variable
indicating the hospital is located in Massachusetts is insignificant. The reform variable is

65
insignificant, which is unlike some of the other quality regressions. Variables such as whether
the hospital offers emergency services, city population, time and whether the hospital is located
in Connecticut generated significant values, all close to 0. Whether the hospital was a teaching
hospital and extra large hospitals were also significant. Beta values demonstrated that
Connecticut hospitals provided a lower quality of care. The level of quality was increased,
however, for larger towns and hospitals that offered emergency services. Quality also increased
in all states with time.
The R-squared value generated for surgery patients receiving an antibiotic one hour after
incision was 0.139, which is significantly low. Such a low value suggests that our independent
variables are not very strong predictors or our dependent variable, quality of medical services of
surgery patients. As can be seen from the results above, the reform variable is significant in this
regression, along with the other difference-in-differences variables for determining which state
the hospital is in and time. It is interesting that the variables relating to reform, such as time and
state are significant, which is not common in the other regressions, while some of control
variables are insignificant. Quality for surgery patients receiving antibiotics increased with the
reform and time. Quality was generally lower, however, in Massachusetts and Connecticut than
Wisconsin.
The R-squared value for surgery patients who were no longer on antibiotic after 24 hours
is 0.221, which is significantly low, but is consistent with some of the other R-squared values
generated from the quality regressions. The reform variable is significant with a value of 0.095.
However, this time, a negative bet value was generated, indicating that the reform had a negative
impact on the quality of services. As shown above, many more of the control variables are
significant than the previous regression with the insignificant variables being city population,
ownership and the dummy variable indicating that the hospital is located in Connecticut. Beta
values indicated that larger hospitals offered a lower quality of medical services. However, the
quality of services increased with time and was higher for teaching hospitals and those that
offered emergency services. Generally, it was a trend in all of the quality regressions that the
quality of medical services increased in all states with time. It was also a trend in half of the
regressions that the reform had a positive effect on the quality of services with the exception of
the previous regression in which it had a negative impact. In the following Discussion Section,
we will discuss the implications of our results and make conclusions.

66
Table 18 Full Difference-in-Differences Regression Results
Cost Total Cost
Adjusted
Operation Room
Adjusted
Radiology Room
Adjusted
Respiratory Therapy
Adjusted
Physical Therapy
Adjusted
Electrocardiology
Adjusted
Emergency Room
Adjusted
MA*TIME -0.005 0.039 0.043 0.012 0.022 -0.012 0.046
[20.335] [0.592] [0.579] [0.148] [0.220] [0.181] [0.529]
TIME 0.037 0.044 0.018 0.043 0.061 0.049 0.070
[12.979] [0.376] [0.373] [0.095] [0.141] [0.125] [0.338]*
IF_MA 0.080 0.099 0.150 0.064 -0.054 0.093 0.287
[16.465]** [0.477]** [0.467]*** [0.119] [0.176] [0.148] [0.427]***
IF_CT 0.025 0.025 -0.046 0.078 -0.076 -0.022 0.377
[13.910] [0.401] [0.394] [0.101]** [0.154]* [0.127] [0.355]***
Hospital_>400 0.689 0.696 0.554 0.633 0.439 0.412 0.414
[21.821]*** [0.592]*** [0.571]*** [0.146]*** [0.226]*** [0.178]*** [0.531]***
Hospital_200-400 0.247 0.274 0.197 0.278 0.313 0.283 0.229
[17.075]*** [0.494]*** [0.477]*** [0.122]*** [0.183]*** [0.152]*** [0.444]***
Hospital_100-200 0.070 0.060 0.082 0.102 0.112 0.079 0.066
[12.766]*** [0.370]** [0.360]** [0.092]*** [0.139]** [0.116]* [0.335]*
Ownership
_Governmental
0.079 0.014 0.036 0.086 0.028 0.081 0.070
[43.903]*** [1.273] [1.239] [0.329]*** [0.504] [0.385]** [1.170]**
Ownership _Nonprofit 0.046 -0.008 0.047 0.039 0.055 -0.053 0.038
[19.925]** [0.605] [0.585] [0.156] [0.221] [0.190] [0.552]
Teaching Hospital 0.069 0.121 0.063 0.031 0.010 0.047 0.086
[13.145]*** [0.366]*** [0.355]* [0.090] [0.135] [0.112] [0.327]**
Town Population_50K 0.233
[1.742]***
Emergency
0.033
[23.230]
R^2 0.736 0.591 0.371 0.428 0.205 0.232 0.429
Sample Size 736 722 711 705 640 612 701

67
*** significance p-value < 1%
** significance p-value < 5%
* significance p-value < 10%
Quality Heart Attack Patients Given ACE
Inhibitor or ARB for Left
Ventricular Systolic Dysfunction
(LVSD)
Heart Failure Patients
Given Smoking
Cessation
Advice/Counseling
Pneumonia Patients
Given Smoking
Cessation
Advice/Counseling
Pneumonia Patients
Given the Most
Appropriate Initial
Antibiotic(s)
Surgery Patients Who
Received Preventative
Antibiotic(s) One Hour
Before Incision
Surgery Patients Whose
Preventative Antibiotic(s) are
Stopped Within 24 Hours After
Surgery
MA*TIME 0.040 0.136 0.304 -0.032 0.448 -0.263
[0.039] [0.037]* [0.046]*** [0.041] [0.026]*** [0.048]*
TIME 0.217 0.341 0.341 0.292 0.195 0.490
[0.025]*** [0.023]*** [0.029]*** [0.028]*** [0.017]*** [0.032]***
IF_MA -0.090 -0.197 -0.361 -0.129 -0.536 0.341
[0.031] [0.031]*** [0.038]*** [0.032] [0.025]*** [0.046]**
IF_CT -0.053 0.019 -0.132 -0.241 -0.158 -0.005
[0.027] [0.024] [0.034]** [0.030]*** [0.011]*** [0.020]
Hospital_>400 0.016 0.184 0.236 -0.189 -0.066 -0.164
[0.056] [0.051]** [0.051]*** [0.044]* [0.017] [0.031]**
Hospital_200-400 0.012 0.281 0.210 -0.008 0.014 -0.173
[0.034] [0.036]*** [0.037]*** [0.038] [0.013] [0.025]**
Hospital_100-200 0.050 0.093 0.139 0.135 -0.061 -0.163
[0.023] [0.020]** [0.029]*** [0.031] [0.010] [0.020]**
Ownership
_Governmental
-0.039 -0.058 -0.254 0.056 -0.020 -0.031
[0.075] [0.074] [0.083]*** [0.066] [0.031] [0.058]
Ownership _Nonprofit -0.063 0.117 -0.008 0.110 -0.011 -0.075
[0.046] [0.035]** [0.046] [0.048] [0.019] [0.037]
Teaching Hospital 0.220 -0.194 -0.177 0.144 0.067 0.225
[0.025]*** [0.023]*** [0.029]*** [0.028]* [0.010] [0.019]***
Population Size -0.032 0.035 0.001 0.332 -0.012 -0.018
[0.004] [0.005] [0.005] [0.004]*** [0.001] [0.002]
Emergency Service 0.076 0.235 0.160 0.612 -0.038 0.129
[0.066]* [0.057]*** [0.068]** [0.049]***
[0.020] [0.039]***
R^2 0.105 0.326 0.438 0.450 0.139 0.221
Sample
Size
511 401 242 184 378 362

68
6.0 Discussion
This section will provide the conclusions drawn from the results of our research, as well
as discuss the limitations of our project and suggestions for further research.
6.1 Our Results
As the previous tables in the summary statistics section show, the operational cost is
higher in MA and CT than in WI and the quality of medical service is the same in all the three
states. In addition, the overall operational cost and the department salaries have increased and the
quality of medical services has been improved since the reform. Also, the control variables have
not changed much since the reform in both cost and quality models.
It is evident from the results we obtained that there is a lot of variance between results
and their significance. Although the R-Squared value varied highly between regressions, it is
clear that the total cost model is somewhat more meaningful than the quality models, which
generated values around 0.7 and 0.1-0.600, respectively. The R-Squared values of the emergency
room and operating room salary regressions were around 0.5-0.6, which indicates that those
models were also somewhat accurate. It is certainly an interesting finding, however, that more of
the control variables appear to be significant in the quality models than the total cost model. It is
also worth noting that for half of the quality regressions, the reform variable is significant, and
has a positive impact on the quality of services. Although, it is significant in a fourth regression,
by which a negative beta value was generated. Overall, we do have evidence to believe that the
quality of medical services has been affected by the reform, but further research will be needed
for our results to be conclusive. Total costs and salaries generally seemed to be higher in
Massachusetts and the reform variable was insignificant. Although our research does not give
any evidence to support that the reform did impact hospital costs, there is other literature and
research that demonstrates otherwise. Therefore, it would also be useful to conduct further
research before coming to a conclusion. The limitations of our research that prevent us from

69
making such concrete conclusions, as well as suggestions for further research will be discussed
below.
6.2 Limitation
Just as with many research projects, there were a few limitations concerning ours that
may have affected some of our results. The most important of these limitations are those
surrounding the quality data, but there also some limitations surrounding other variables that
could have been included in the model, such as patient mix and the Hospital Herfendahl Index
(HHI).
For the cost data, consistent and detailed data was conveniently provided through the
CMS database. Detailed figures, such as total operational costs, specific department salaries,
cost of supplies were provided for each hospital, as required by the federal government.
However, there are no such requirements for hospitals to report detailed information on the
quality of medical services they provide. As a result, many of the hospitals did not report each
year of the four year time span that we researched, forcing us to eliminate them from our
regression analysis to stay consistent, which led to a very small sample size in many cases.
Because our sample was so small, it is difficult to say whether or not the results of our regression
could have been affected. Also, because the organization of this data through the Medicare
Hospital Compare Quality of Care Database only began recently in 2005, many of their
measurements for the four indicators changed from year to year. For example, in the earlier years
of 2005 and 2006, one of the measurements for heart attack is whether or not the patient was
given the proper treatment in ninety minutes or less, but this changed to sixty minutes or less in
later years. Thus, we really narrowed down the data we used to specific measurements of
indicators that has the largest number of reported percentages and consistent measurements,
which was not many. Lastly, all of the quality data is reported in percentages of patients for
which that particular measurements of one of the four indicators holds true. Therefore, it can be
very misleading if 100% of patients is reported for a particular measurement when the sample is
only 1 patient, which was the case for some indicators. Although these data were somewhat
helpful in our exploration of the quality of medical services, it would be even more helpful to

70
have access to data on patients other than those affected by heart attack, heart failure, pneumonia
or receiving surgery. Also, specific numbers, which hospitals are not required to report, such as
patient mortality rate, would have been useful.
Although, we tried to include as many control variables as we felt were appropriate for
our models, there still are more that we would have preferred to include if we had access to such
data, such as patient mix, which would evaluate the risks of patients being treated at a particular
hospital, and additional ways to account for competition between hospitals, such as the HHI,
both of which will be discussed in our suggestions for further research below.
6.3 Technological Impacts
Although our statistical and regression analysis results were not necessarily conclusive as
to how the Massachusetts Health Care Reform impacted hospital costs and quality of medical
services, it is clear that the reform has the ability to affect both of these factors according to our
preliminary research and own research. Another factor that has the potential to help contain costs
and improve quality is an improved electronic record keeping system (Liberto, 2009). For
example, Stephen Lieber, who represents technology companies in the health industry through
the Healthcare Information and Management Systems Society, mentioned that if a more efficient
record keeping were implemented, costs could be contained by avoiding repeats of tests or any
unnecessary examinations (Liberto, 2009). Additionally, if costs were contained, hospitals may
be able to invest more in improving their quality of medical services.
6.4 Further Research
It is clear from our research, that the topic of how the Massachusetts Health Care Reform
of 2006 affects hospital costs and the quality of medical services they provide has not reached a
level of saturation, as there is still much more about it that can be explored.

71
Due to the time constraints of this research project for academic purposes, we chose only
two states (both of which had similar quality of medical services to Massachusetts) to research,
which were Connecticut and Wisconsin. However, we do not doubt the value of studying even
more states, such as all of those in New England or all fifty states of the nation. It would
certainly be interesting to determine whether or not these changes were due to some geographic
trend. A study of all of the states would certainly be more telling as to whether a trend did occur.
There have been previous studies, such as that discussed in our literature review section by
Lischko and Manzolillo, that use a national mean to compare to the cost and quality data of
Massachusetts, but due to the high variability (economically and for quality of medical services),
we think it would be much more meaningful to look at each state individually.
There are also many other factors that may affect hospital cost and quality that
individuals conducting future research on this topic could look into. For example, HHI, which is
a measurement of competition between hospitals could most certainly have an effect on both cost
and quality. Because this data is not just provided, researchers would have to obtain the specific
location of each hospital and determine an area (such as a fifteen mile radius, for example) that
they would assume to be effective in measuring the HHI, which could possibly require some
research in itself. Patient mix, which is a measurement of risks of patients treated at a hospital,
would also be something to look into. Again, data does not appear to be easily provided on this
subject, so future researchers could explore on possible ways to calculate this with the data that
is available.

72
Bibliography Agency for healthcare quality and research. (2009). 2009 National Healthcare Quality Report. Retrieved
10 5, 2010, from Agency for healthcare quality and research: www.ahrq.gov/qual/nhqr09/nhqr09.pdf
Agency of Healthcare Rsearch and Quality. (2009). 2009 National Healthcare Quality Report. Washington
D.C: Agency of Healthcare Rsearch and Quality.
Altman, S. H., & Doonan, M. (2006). Can Massachusetts lead the way in health care reform? The New
England Journal of Medicine , 2093.
Archer, D. (2009, March 16). Massachusetts health reform near universal coverage, but no cost controls
or guarantee of quality, affordable health care for all. Retrieved Octobor 5, 2010, from Institute for
American's Future: http://ourfuture.org/healthcare/massachusetts
Bell, C. (2010, March 18). What Is Regression Analysis? Retrieved February 09, 2011, from
EconInformation.com:The Economics and Finance Information Page -- One-clickaccess to Current
Economic and Financial Data for Students,journalists, Investors and All Others Interested in Economics
Andfinance. : www.econinformation.com/cgi-bin/wea/regression_analysis.cgi
Bigby, J. A. (2010). Hospital Inpatient and Emergency Department Utilization Trends Fiscal Years 2004-
2008. DHCFP.
Bigby, J. A., & Iselin, S. (2009). Measuring Health Care Quality and Cost in Massachusetts. Boston:
Department of Health Care Finance and Cost.
Bigby, J. A., & Morales, D. (2010). Study of the Reserves, Endowments, and Surpluses of Hospitals in
Massachusetts. Boston: Department of Health Care Finance and Cost.
Bigby, J. A., & Weissman, S. J. (2009). Massachusetts Health Care Reform - Near-Universal Coverage at
What Cost? The New England Journal of Medicine , 2012-2015.
Blendon, R. J., Buhr, T., Sussman, T., & Benson, J. M. (2008). Massachusetts health reform: A public
perspective from debate through implementation. Health Affairs , 556.
Blumberg, L. J., & Holahan, J. (2009). The individual mandate -- an affordable and fair approach to
achieving universal coverage. The New England Journal of Medicine , 361.
Blumenauer, E. (2010). High Quality, Low Spending Medicare Hospitals .
Campbell, S., Roland, M. O., & Buetow, S. A. (2000). Defining Quality of Care. Social Science & Medicine ,
1611-1625.
Centers for Medicare & Medicaid Services. (2010). The emergency medical treatment & labor act.
Retrieved September 15, 2010, from https://www.cms.gov/EMTALA
Chiang, T.-l. (1997). Taiwan's 1995 health care reform. health Policy , 225-239.

73
Commonwealth of Massachusetts. (2006). Massachusetts Act Chapter 58 Section 47. 2006
Massachusetts Act . Boston, Massachusetts, U.S.A.
Econometrics. (2006, February 11). Difference in Difference Estimation. Retrieved November 29, 2010,
from Healthcare Economist: http://healthcare-economist.com/2006/02/11/difference-in-difference-
estimation/
Eldenburg, L., & Krishnan, R. (2010). Management Accounting Research in Health Care.
Freeman, R. (1998). Competition in context: the politics of health care reform in Europe. International
Journal for Quality in Health Care , 395 - 401.
Gabel, J. R., Whitmore, H., Pickreign, J., Sellhheim, W., Shova, K., & Bassett, V. (2008). After the
mandates: Massachusetts employers continue to support health reform as more firms offer coverage.
Health Affairs , 566.
Geenberger, S. S. (2005, April 6). Top officials to pitch plans to aid uninsured. Boston Globe .
Ham, C., & McKee, M. (1997). Health Care Reform: Learning fromInternational Experience. Buckingham,
UK: Open University Press.
Harvard Pilgrim Health Care. (2010). Typical Medical Costs in Massachusetts (outpatient only). Retrieved
November 28, 2010, from Harvard Pilgrim Health Care for Visitors:
https://www.harvardpilgrim.org/portal/page?_pageid=213,198311&_dad=portal&_schema=PORTAL
Health Connector. (2010). Commonwealth care program guide. Retrieved 9 15, 2010, from Health
Connector:
https://www.mahealthconnector.org/portal/binary/com.epicentric.contentmanagement.servlet.Conten
tDeliveryServlet/About%20Us/CommonwealthCare/Commonwealth%20Care%20Program%20Guide.pdf
Health Connector. (2009). Health Care Reform: Timeline. Retrieved 10 5, 2010, from Health Connector:
https://www.mahealthconnector.org/portal/site/connector/menuitem.aeceb4005a8e46bd7176b66033
468a0c/?fiShown=default
Health Connector. (2010). Health Care Reform: Timeline. Retrieved 10 5, 2010, from Health Connector:
https://www.mahealthconnector.org/portal/site/connector/menuitem.aeceb4005a8e46bd7176b66033
468a0c/?fiShown=default
Holahan, J., & Blumberg, L. (2006). Massachusetts health care reform: A look at the issues. health Affairs
, 432.
Institute of Medicine. (n.d.). Retrieved 10 5, 2010, from Institute of Medicine: Institute of Medicine
Jha, A. e. (2009). Measuring Efficiency: The Association of Hospital Costs and Quality of Care. Health
Affairs .

74
Jha, A. K. (2009). Measuring Efficiency: The Association Of Hospital Costs And Quality Of Care. Health
Affairs , 10.
Jha, A. K., Orav, E. J., Dobson, A., Book, R., & Epstein, A. M. (2009). Measuring Efficiency; The
asssociation of hospital costs and quality of care. Health Affairs .
Jha, A. K., Orav, E. J., Dobson, A., Book, R., & Epstein, A. (2009). Measuring Efficiency: The Association Of
Hospital Costs And Quality Of Care. Health Affairs , 10.
Keeler, E. B., Rubenstein, L. V., Kahn, K. L., Draper, D., Harrison, E. R., McGinty, M. J., et al. (1992).
Hospital Characteristics and Quality of Care. JAMA .
Kolstad, J. T., & Kowalski, A. E. (2010). The impact of an individual Health insurance mandate on hospital
and preventive care: evidence from Massachusetts. Cambridge, USA: National Bureau of Economic
Research.
Lave, J. R., & Lave, L. B. (1970). Hospital Cost Functions. The American Economic Review .
Lischko, A., & Manzolillo, K. (2010). An Interim Report Card on Massachusetts Health Care Reform: Cost-
Effective Quality. Pioneer Institute Public Policy Research .
Long, S. K., & Stockley, K. (2010). Sustaining Health Reform in a Recession: An Update on Massachusetts
as of Fall 2009. Health Affairs , 29 (6), 1234.
Lu, J., & Hsiao, W. (2003). Does universal health insurance make health care unaffordable? Lessons from
Taiwan. Health Affairs , 77.
MacDorman, M. F., & Mathews, T. (2008). Recent trends in infant mortality in the United States. NCHS
Data Brief , 1-8.
Massachusetts Division of Health Care Finance and Policy. (2010). Study of the reserves, endowments,
and surpluses of hopsitals in Massachusetts. Boston: Massachusetts Division of health Care Finance and
Policy.
Miltenberger, M., & Poftak, S. (2009). Massachusetts Healthcare Reform: A Framework for Evaluation.
Pioneer Institute Public Policy Research .
Mobilization for Health Care for All. (2009). Nine Americans jailed this morning when they tried to
confront senator joe liberman for accepting insurance compnay money. Retrieved 9 16, 2010, from
http://www.commondreams.org/newswire/2009/11/05-10
OECD. (2010). OECD Health Data 2010: How Does the United Kindom Compare. Paris: Organisation for
Economic Co-operation and Development.
Plagnet, M.-A., & Waddle, R. (2001). Referee report to Health care payment systems: cost and quality
incentives. Toulouse, France: Université des Sciences Sociales.

75
Roehr, B. (2008). Health Care in US ranks lowest among developed countries. British Medical Journal ,
889.
Seifert, R., & Swoboda, P. (2009). Shared Responsiblity -- Government, business, and individuals: who
pays what for health reform? Worcester: Blue Cross Blue Shield of Massachusetts Foundation.
Shepard, D., Kodgkin, D., & Anthony, Y. (1998). Analysis of Hopsital Costs. World Health Organization.
Siegrist, R., & Kane, N. M. (2003). Exploring the Relationship Between Inpatient Hospital Costs and
Quality of Care. American Journal of Managed Care .
Sloan, F. A., Picone, G. A., Jr., D. H., & Chou, S.-Y. (2001). Hospital ownership and cost and quality of
care: is there a dime's worth of difference? Health Economics .
State Data Center. (2009). Retrieved October 28, 2010, from The Commonwealth Fund:
http://www.commonwealthfund.org/Maps-and-Data/State-Data-Center/State-Scorecard.aspx
Steinbrook, R. (2008). health care reform in Massachusetts -- expanding coverage, escalating costs. New
England Journal of Medicine , 2757.
Steinbrrok, R. (2006). Health Care reform in Massachusetts -- A work in Progress. New England Journal
of Medicine , 2095.
Tanner, M. (2006). No Miracle in Massachusetts: Why Governor Romney's Health Care Reform Won't
Work. Cato Institute Briefing Paper Series .
The Henry J. Kaiser Family Foundation. (2009, March). Trends in Health Care Costs and Spending.
Retrieved February 10, 2011, from www.kff.org: http://www.kff.org/insurance/upload/7692_02.pdf
Waldman, B. (2010). Massachusetts Health Care Reform. Health and Human Rights , 1.
Wilson, J. F. (2008). Massachusetts Health Care reform is a poineer effect, but complications remain.
Annals of Internal Medicine , 489.

76
Appendix
Appendix A: Additional Information about the Properties of the Reform
Another key aspect of the reform movement is the “shared responsibility” of employers.
These laws were created in the hopes that the government would be able to decrease the amount
of funding spent on health care and that employers of businesses would be able to contribute to
this cost. In the 2006 legislation, employers were held more accountable for the coverage of their
employees and were at risk for penalty if they did not abide by the new laws. Although, most
state residents were already covered through their employer, the new mandates stated that all
employers of eleven or more full-time employees must offer an affordable and decent insurance
plan (Fisher Wilson 2008). Employers were required to either have 25% of their employers
covered by their plan or to contribute to 33% of the cost of their premium (Fisher Wilson 2008).
The alternative is a charge of $295 per employee each year (Mass. Act Chp. 58, sec. 47, 2006).
They can also be charged if their employees use more than $50,000 from a safety net fund during
a number of visits, known as the “free rider surcharge” (Fisher Wilson 2008). Although these
new laws could end up putting quite a burden on owners of small businesses, a survey of 1,056
employers of Massachusetts in 2007 revealed that 75% did feel responsible for offering their
employees coverage and 70% supported the reform laws (Fisher Wilson 2008).
The Commonwealth Health Insurance Connector is a government-run organization that is
not only in charge of Commonwealth Care and Choice, but also provides information about
health insurance options to those who need it, such as those who are not covered by their
employer and not able to receive Medicaid (Waldman 2009). Essentially, the Connector provides
residents with the help they need to ensure that they can purchase an affordable plan with the
benefits they need (Waldman 2009)

77
Appendix B: CMS Defined Name for CMS Hospital and Health Care Complexes
hosp_xxxx_RPT.csv
Column Name Column Type
RPT_REC_NUM NUMBER NOT NULL
PRVDR_CTRL_TYPE_CD CHAR(2) NULL
PRVDR_NUM CHAR(6) NOT NULL
NPI NUMBER NULL
RPT_STUS_CD CHAR(1) NOT NULL
FY_BGN_DT DATE NULL
FY_END_DT DATE NULL
PROC_DT DATE NULL
INITL_RPT_SW CHAR(1) NULL
LAST_RPT_SW CHAR(1) NULL
TRNSMTL_NUM CHAR(2) NULL
FI_NUM CHAR(2) NULL
ADR_VNDR_CD CHAR(1) NULL
FI_CREAT_DT DATE NULL
UTIL_CD CHAR(1) NULL
NPR_DT DATE NULL
SPEC_IND CHAR(1) NULL
FI_RCPT_DT DATE NULL
Hosp_xxxx_ALPHA.csv
Column Name Column Type
RPT_REC_NUM NUMBER NOT NULL
WKSHT_CD CHAR(7) NOT NULL
LINE_NUM CHAR(5) NOT NULL
ALPHNMRC_ITM_TXT CHAR(4) NOT NULL
Hosp_xxxx_NMRC.csv
Column Name Column Type
RPT_REC_NUM NUMBER NOT NULL
WKSHT_CD CHAR(7) NOT NULL
LINE_NUM CHAR(5) NOT NULL
ITM_VAL_NUM NUMBER NOT NULL

78
Appendix C: SQL Query for the Hospital Cost Data In this example, we use the data of the Fiscal Year 2009 as the sample.
Number of beds
SELECT Sheet1.[Hosptial Provider ID], Hosp_2009_NMRC_new.WKSHT_CD,
Hosp_2009_NMRC_new.LINE_NUM, Hosp_2009_NMRC_new.CLMN_NUM,
Hosp_2009_NMRC_new.ITM_VAL_NUM
FROM Hosp_2009_NMRC_new INNER JOIN (Sheet1 INNER JOIN Hosp_2009_RPT_new ON
Sheet1.[Hosptial Provider ID] = Hosp_2009_RPT_new.PRVDR_NUM) ON
Hosp_2009_NMRC_new.RPT_REC_NUM = Hosp_2009_RPT_new.RPT_REC_NUM
WHERE (((Hosp_2009_NMRC_new.WKSHT_CD)="S300001") AND
((Hosp_2009_NMRC_new.LINE_NUM)='01200') AND ((Hosp_2009_NMRC_new.CLMN_NUM)='0100'));
If the hospital is teaching hospital?
SELECT Sheet1.[Hosptial Provider ID], Hosp_2009_ALPHA.WKSHT_CD, Hosp_2009_ALPHA.LINE_NUM,
Hosp_2009_ALPHA.CLMN_NUM, Hosp_2009_ALPHA.ALPHNMRC_ITM_TXT
FROM Hosp_2009_ALPHA INNER JOIN (Sheet1 INNER JOIN Hosp_2009_RPT_new ON Sheet1.[Hosptial
Provider ID] = Hosp_2009_RPT_new.PRVDR_NUM) ON Hosp_2009_ALPHA.RPT_REC_NUM =
Hosp_2009_RPT_new.RPT_REC_NUM
WHERE (((Hosp_2009_ALPHA.WKSHT_CD)='s200000') AND ((Hosp_2009_ALPHA.LINE_NUM)='02500')
AND ((Hosp_2009_ALPHA.CLMN_NUM)='0100'));
Total operation cost
SELECT Sheet1.[Hosptial Provider ID], Hosp_2009_NMRC_new.WKSHT_CD,
Hosp_2009_NMRC_new.LINE_NUM, Hosp_2009_NMRC_new.CLMN_NUM,
Hosp_2009_NMRC_new.ITM_VAL_NUM
FROM Hosp_2009_NMRC_new INNER JOIN (Sheet1 INNER JOIN Hosp_2009_RPT_new ON
Sheet1.[Hosptial Provider ID] = Hosp_2009_RPT_new.PRVDR_NUM) ON
Hosp_2009_NMRC_new.RPT_REC_NUM = Hosp_2009_RPT_new.RPT_REC_NUM
WHERE (((Hosp_2009_NMRC_new.WKSHT_CD)="G200000") AND
((Hosp_2009_NMRC_new.LINE_NUM)='04000') AND ((Hosp_2009_NMRC_new.CLMN_NUM)='0200'));
Operation room salary

79
SELECT Sheet1.[Hosptial Provider ID], Hosp_2009_NMRC_new.WKSHT_CD,
Hosp_2009_NMRC_new.LINE_NUM, Hosp_2009_NMRC_new.CLMN_NUM,
Hosp_2009_NMRC_new.ITM_VAL_NUM
FROM Hosp_2009_NMRC_new INNER JOIN (Sheet1 INNER JOIN Hosp_2009_RPT_new ON
Sheet1.[Hosptial Provider ID] = Hosp_2009_RPT_new.PRVDR_NUM) ON
Hosp_2009_NMRC_new.RPT_REC_NUM = Hosp_2009_RPT_new.RPT_REC_NUM
WHERE (((Hosp_2009_NMRC_new.WKSHT_CD)='A000000') AND
((Hosp_2009_NMRC_new.LINE_NUM)='03700') AND ((Hosp_2009_NMRC_new.CLMN_NUM)='0100'));
Radiology room salary
SELECT Sheet1.[Hosptial Provider ID], Hosp_2009_NMRC_new.WKSHT_CD,
Hosp_2009_NMRC_new.LINE_NUM, Hosp_2009_NMRC_new.CLMN_NUM,
Hosp_2009_NMRC_new.ITM_VAL_NUM
FROM Hosp_2009_NMRC_new INNER JOIN (Sheet1 INNER JOIN Hosp_2009_RPT_new ON
Sheet1.[Hosptial Provider ID] = Hosp_2009_RPT_new.PRVDR_NUM) ON
Hosp_2009_NMRC_new.RPT_REC_NUM = Hosp_2009_RPT_new.RPT_REC_NUM
WHERE (((Hosp_2009_NMRC_new.WKSHT_CD)='A000000') AND
((Hosp_2009_NMRC_new.LINE_NUM)='04200') AND ((Hosp_2009_NMRC_new.CLMN_NUM)='0100'));
Respiratory Therapy Salary
SELECT Sheet1.[Hosptial Provider ID], Hosp_2009_NMRC_new.WKSHT_CD,
Hosp_2009_NMRC_new.LINE_NUM, Hosp_2009_NMRC_new.CLMN_NUM,
Hosp_2009_NMRC_new.ITM_VAL_NUM
FROM Hosp_2009_NMRC_new INNER JOIN (Sheet1 INNER JOIN Hosp_2009_RPT_new ON
Sheet1.[Hosptial Provider ID] = Hosp_2009_RPT_new.PRVDR_NUM) ON
Hosp_2009_NMRC_new.RPT_REC_NUM = Hosp_2009_RPT_new.RPT_REC_NUM
WHERE (((Hosp_2009_NMRC_new.WKSHT_CD)='A000000') AND
((Hosp_2009_NMRC_new.LINE_NUM)='04900') AND ((Hosp_2009_NMRC_new.CLMN_NUM)='0100'));
Physical therapy Salary
SELECT Sheet1.[Hosptial Provider ID], Hosp_2009_NMRC_new.WKSHT_CD,
Hosp_2009_NMRC_new.LINE_NUM, Hosp_2009_NMRC_new.CLMN_NUM,
Hosp_2009_NMRC_new.ITM_VAL_NUM
FROM Hosp_2009_NMRC_new INNER JOIN (Sheet1 INNER JOIN Hosp_2009_RPT_new ON
Sheet1.[Hosptial Provider ID] = Hosp_2009_RPT_new.PRVDR_NUM) ON
Hosp_2009_NMRC_new.RPT_REC_NUM = Hosp_2009_RPT_new.RPT_REC_NUM

80
WHERE (((Hosp_2009_NMRC_new.WKSHT_CD)='A000000') AND
((Hosp_2009_NMRC_new.LINE_NUM)='05000') AND ((Hosp_2009_NMRC_new.CLMN_NUM)='0100'));
Electrocardiology Salary
SELECT Sheet1.[Hosptial Provider ID], Hosp_2009_NMRC_new.WKSHT_CD,
Hosp_2009_NMRC_new.LINE_NUM, Hosp_2009_NMRC_new.CLMN_NUM,
Hosp_2009_NMRC_new.ITM_VAL_NUM
FROM Hosp_2009_NMRC_new INNER JOIN (Sheet1 INNER JOIN Hosp_2009_RPT_new ON
Sheet1.[Hosptial Provider ID] = Hosp_2009_RPT_new.PRVDR_NUM) ON
Hosp_2009_NMRC_new.RPT_REC_NUM = Hosp_2009_RPT_new.RPT_REC_NUM
WHERE (((Hosp_2009_NMRC_new.WKSHT_CD)='A000000') AND
((Hosp_2009_NMRC_new.LINE_NUM)='05300') AND ((Hosp_2009_NMRC_new.CLMN_NUM)='0100'));
Emergency room salary
SELECT Sheet1.[Hosptial Provider ID], Hosp_2009_NMRC_new.WKSHT_CD,
Hosp_2009_NMRC_new.LINE_NUM, Hosp_2009_NMRC_new.CLMN_NUM,
Hosp_2009_NMRC_new.ITM_VAL_NUM
FROM Hosp_2009_NMRC_new INNER JOIN (Sheet1 INNER JOIN Hosp_2009_RPT_new ON
Sheet1.[Hosptial Provider ID] = Hosp_2009_RPT_new.PRVDR_NUM) ON
Hosp_2009_NMRC_new.RPT_REC_NUM = Hosp_2009_RPT_new.RPT_REC_NUM
WHERE (((Hosp_2009_NMRC_new.WKSHT_CD)='A000000') AND
((Hosp_2009_NMRC_new.LINE_NUM)='06100') AND ((Hosp_2009_NMRC_new.CLMN_NUM)='0100'));

81
Appendix D: Hospital List
Provider Number Hospital Name City State Hospital Type Hospital Owner Emergency Service
070001 HOSPITAL OF ST RAPHAEL NEW HAVEN CT Acute Care Hospitals Voluntary non-profit - Other Yes
070002 ST FRANCIS HOSPITAL & MEDICAL CENTER HARTFORD CT Acute Care Hospitals Voluntary non-profit - Church Yes
070003 DAY KIMBALL HOSPITAL PUTNAM CT Acute Care Hospitals Voluntary non-profit - Other Yes
070004 SHARON HOSPITAL SHARON CT Acute Care Hospitals Proprietary Yes
070005 WATERBURY HOSPITAL WATERBURY CT Acute Care Hospitals Voluntary non-profit - Private Yes
070006 STAMFORD HOSPITAL STAMFORD CT Acute Care Hospitals Voluntary non-profit - Private Yes
070007 LAWRENCE & MEMORIAL HOSPITAL NEW LONDON CT Acute Care Hospitals Government - Hospital District or Authority Yes
070008 JOHNSON MEMORIAL HOSPITAL STAFFORD SPRINGS CT Acute Care Hospitals Voluntary non-profit - Other Yes
070010 BRIDGEPORT HOSPITAL BRIDGEPORT CT Acute Care Hospitals Voluntary non-profit - Private Yes
070011 CHARLOTTE HUNGERFORD HOSPITAL TORRINGTON CT Acute Care Hospitals Government - Federal Yes
070012 ROCKVILLE GENERAL HOSPITAL ROCKVILLE CT Acute Care Hospitals Voluntary non-profit - Other Yes
070015 NEW MILFORD HOSPITAL NEW MILFORD CT Acute Care Hospitals Voluntary non-profit - Private Yes
070016 ST MARYS HOSPITAL WATERBURY CT Acute Care Hospitals Voluntary non-profit - Church Yes
070017 MIDSTATE MEDICAL CENTER MERIDEN CT Acute Care Hospitals Voluntary non-profit - Private Yes
070018 GREENWICH HOSPITAL ASSOCIATION GREENWICH CT Acute Care Hospitals Voluntary non-profit - Private Yes
070019 MILFORD HOSPITAL, INC MILFORD CT Acute Care Hospitals Government - Federal Yes
070020 MIDDLESEX HOSPITAL MIDDLETOWN CT Acute Care Hospitals Voluntary non-profit - Private Yes
070021 WINDHAM COMM MEM HOSP & HATCH HOSP WILLIMANTIC CT Acute Care Hospitals Voluntary non-profit - Other Yes
070022 YALE-NEW HAVEN HOSPITAL NEW HAVEN CT Acute Care Hospitals Voluntary non-profit - Private Yes
070024 WILLIAM W BACKUS HOSPITAL NORWICH CT Acute Care Hospitals Voluntary non-profit - Other Yes
070025 HARTFORD HOSPITAL HARTFORD CT Acute Care Hospitals Voluntary non-profit - Private Yes
070027 MANCHESTER MEMORIAL HOSPITAL MANCHESTER CT Acute Care Hospitals Voluntary non-profit - Private Yes
070028 ST VINCENT'S MEDICAL CENTER BRIDGEPORT CT Acute Care Hospitals Voluntary non-profit - Church Yes
070029 BRISTOL HOSPITAL BRISTOL CT Acute Care Hospitals Voluntary non-profit - Private Yes
070031 GRIFFIN HOSPITAL DERBY CT Acute Care Hospitals Voluntary non-profit - Other Yes
070033 DANBURY HOSPITAL DANBURY CT Acute Care Hospitals Voluntary non-profit - Private Yes
070034 NORWALK HOSPITAL ASSOCIATION NORWALK CT Acute Care Hospitals Voluntary non-profit - Other Yes
070035 HOSPITAL OF CENTRAL CONNECTICUT, THE NEW BRITAIN CT Acute Care Hospitals Voluntary non-profit - Other Yes
070036 JOHN DEMPSEY HOSPITAL FARMINGTON CT Acute Care Hospitals Government - Local Yes
070039 MASONIC HOME AND HOSPITAL WALLINGFORD CT Acute Care Hospitals Voluntary non-profit - Other No
220001 HEALTHALLIANCE HOSPITALS, INC FITCHBURG MA Acute Care Hospitals Voluntary non-profit - Other Yes
220002 MOUNT AUBURN HOSPITAL CAMBRIDGE MA Acute Care Hospitals Voluntary non-profit - Private Yes
220008 STURDY MEMORIAL HOSPITAL ATTLEBORO MA Acute Care Hospitals Voluntary non-profit - Other Yes
220010 LAWRENCE GENERAL HOSPITAL LAWRENCE MA Acute Care Hospitals Voluntary non-profit - Private Yes
220011 CAMBRIDGE HEALTH ALLIANCE CAMBRIDGE MA Acute Care Hospitals Government - Local Yes
220012 CAPE COD HOSPITAL HYANNIS MA Acute Care Hospitals Voluntary non-profit - Private Yes
220015 COOLEY DICKINSON HOSPITAL INC,THE NORTHAMPTON MA Acute Care Hospitals Voluntary non-profit - Other Yes
220016 BAYSTATE FRANKLIN MEDICAL CENTER GREENFIELD MA Acute Care Hospitals Voluntary non-profit - Other Yes
220017 CARITAS CARNEY HOSPITAL INC BOSTON MA Acute Care Hospitals Voluntary non-profit - Church Yes
220019 HARRINGTON MEMORIAL HOSPITAL SOUTHBRIDGE MA Acute Care Hospitals Voluntary non-profit - Private Yes

82
220020 ST ANNE'S HOSPITAL CORPORATION FALL RIVER MA Acute Care Hospitals Voluntary non-profit - Church Yes
220024 HOLYOKE MEDICAL CENTER HOLYOKE MA Acute Care Hospitals Voluntary non-profit - Private Yes
220029 ANNA JAQUES HOSPITAL NEWBURYPORT MA Acute Care Hospitals Voluntary non-profit - Private Yes
220030 WING MEMORIAL HOSPITAL AND MEDICAL CENTER PALMER MA Acute Care Hospitals Voluntary non-profit - Other Yes
220031 BOSTON MEDICAL CENTER CORPORATION BOSTON MA Acute Care Hospitals Voluntary non-profit - Private Yes
220033 BEVERLY HOSPITAL CORPORATION BEVERLY MA Acute Care Hospitals Voluntary non-profit - Private Yes
220035 NORTH SHORE MEDICAL CENTER SALEM MA Acute Care Hospitals Voluntary non-profit - Private Yes
220036 CARITAS ST ELIZABETH'S MEDICAL CENTER BRIGHTON MA Acute Care Hospitals Voluntary non-profit - Church Yes
220046 BERKSHIRE MEDICAL CENTER INC PITTSFIELD MA Acute Care Hospitals Voluntary non-profit - Other Yes
220049 MARLBOROUGH HOSPITAL MARLBOROUGH MA Acute Care Hospitals Voluntary non-profit - Private Yes
220050 BAYSTATE MARY LANE HOSPITAL WARE MA Acute Care Hospitals Voluntary non-profit - Private Yes
220051 NORTH ADAMS REGIONAL HOSPITAL NORTH ADAMS MA Acute Care Hospitals Voluntary non-profit - Private Yes
220052 BROCKTON HOSPITAL BROCKTON MA Acute Care Hospitals Voluntary non-profit - Other Yes
220058 CLINTON HOSPITAL ASSOCIATION CLINTON MA Acute Care Hospitals Voluntary non-profit - Other Yes
220060 JORDAN HOSPITAL INC PLYMOUTH MA Acute Care Hospitals Voluntary non-profit - Private Yes
220062 ADCARE HOSPITAL OF WORCESTER INC WORCESTER MA Acute Care Hospitals Government - State No
220063 LOWELL GENERAL HOSPITAL LOWELL MA Acute Care Hospitals Voluntary non-profit - Private Yes
220065 NOBLE HOSPITAL WESTFIELD MA Acute Care Hospitals Voluntary non-profit - Other Yes
220066 MERCY MEDICAL CENTER SPRINGFIELD MA Acute Care Hospitals Voluntary non-profit - Private Yes
220067 QUINCY MEDICAL CENTER QUINCY MA Acute Care Hospitals Voluntary non-profit - Private Yes
220070 HALLMARK HEALTH SYSTEM MELROSE MA Acute Care Hospitals Voluntary non-profit - Private Yes
220071 MASSACHUSETTS GENERAL HOSPITAL BOSTON MA Acute Care Hospitals Voluntary non-profit - Other Yes
220073 MORTON HOSPITAL & MEDICAL CENTER TAUNTON MA Acute Care Hospitals Voluntary non-profit - Private Yes
220074 SOUTHCOAST HOSPITAL GROUP, INC FALL RIVER MA Acute Care Hospitals Voluntary non-profit - Private Yes
220075 MASSACHUSETTS EYE AND EAR INFIRMARY BOSTON MA Acute Care Hospitals Voluntary non-profit - Private Yes
220077 BAYSTATE MEDICAL CENTER SPRINGFIELD MA Acute Care Hospitals Voluntary non-profit - Private Yes
220080 CARITAS HOLY FAMILY HOSPITAL AND MEDICAL CENTER METHUEN MA Acute Care Hospitals Voluntary non-profit - Church Yes
220082 SAINTS MEMORIAL MEDICAL CENTER INC LOWELL MA Acute Care Hospitals Voluntary non-profit - Church Yes
220083 BETH ISRAEL DEACONESS HOSPITAL - NEEDHAM NEEDHAM MA Acute Care Hospitals Government - Local Yes
220084 EMERSON HOSPITAL W CONCORD MA Acute Care Hospitals Voluntary non-profit - Private Yes
220086 BETH ISRAEL DEACONESS MEDICAL CENTER BOSTON MA Acute Care Hospitals Voluntary non-profit - Private Yes
220088 NEW ENGLAND BAPTIST HOSPITAL BOSTON MA Acute Care Hospitals Voluntary non-profit - Private No
220090 MILFORD REGIONAL MEDICAL CENTER MILFORD MA Acute Care Hospitals Voluntary non-profit - Other Yes
220095 HEYWOOD HOSPITAL GARDNER MA Acute Care Hospitals Voluntary non-profit - Private Yes
220098 NASHOBA VALLEY MEDICAL CENTER AYER MA Acute Care Hospitals Voluntary non-profit - Private Yes
220100 SOUTH SHORE HOSPITAL SOUTH WEYMOUTH MA Acute Care Hospitals Voluntary non-profit - Private Yes
220101 NEWTON-WELLESLEY HOSPITAL NEWTON MA Acute Care Hospitals Voluntary non-profit - Other Yes
220105 WINCHESTER HOSPITAL WINCHESTER MA Acute Care Hospitals Voluntary non-profit - Other Yes
220108 MILTON HOSPITAL INC MILTON MA Acute Care Hospitals Voluntary non-profit - Private Yes
220110 BRIGHAM AND WOMEN'S HOSPTIAL BOSTON MA Acute Care Hospitals Voluntary non-profit - Private Yes
220111 CARITAS GOOD SAMARITAN MEDICAL CENTER BROCKTON MA Acute Care Hospitals Voluntary non-profit - Other Yes
220116 TUFTS-NEW ENGLAND MEDICAL CENTER BOSTON MA Acute Care Hospitals Voluntary non-profit - Private Yes
220119 FAULKNER HOSPITAL BOSTON MA Acute Care Hospitals Voluntary non-profit - Private Yes
220126 CARITAS NORWOOD HOSPITAL, INC NORWOOD MA Acute Care Hospitals Voluntary non-profit - Other Yes

83
220135 FALMOUTH HOSPITAL FALMOUTH MA Acute Care Hospitals Voluntary non-profit - Private Yes
220162 DANA-FARBER CANCER INSTITUTE BOSTON MA Acute Care Hospitals Voluntary non-profit - Private No
220163 UMASS MEMORIAL MEDICAL CENTER INC WORCESTER MA Acute Care Hospitals Voluntary non-profit - Private Yes
220171 LAHEY CLINIC HOSPITAL BURLINGTON MA Acute Care Hospitals Voluntary non-profit - Other Yes
220174 MERRIMACK VALLEY HOSPITAL HAVERHILL MA Acute Care Hospitals Proprietary Yes
220175 METROWEST MEDICAL CENTER FRAMINGHAM MA Acute Care Hospitals Voluntary non-profit - Private Yes
220176 ST VINCENT HOSPITAL WORCESTER MA Acute Care Hospitals Voluntary non-profit - Private Yes
520002 ST MICHAELS HSPTL STEVENS POINT WI Acute Care Hospitals Voluntary non-profit - Church Yes
520004 FRANCISCAN SKEMP LA CROSSE HSPTL LA CROSSE WI Acute Care Hospitals Voluntary non-profit - Church Yes
520008 WAUKESHA MEMORIAL HOSPITAL WAUKESHA WI Acute Care Hospitals Voluntary non-profit - Private Yes
520009 ST ELIZABETH HSPTL APPLETON WI Acute Care Hospitals Voluntary non-profit - Church Yes
520011 LAKEVIEW MED CTR RICE LAKE WI Acute Care Hospitals Voluntary non-profit - Private Yes
520013 SACRED HEART HSPTL EAU CLAIRE WI Acute Care Hospitals Voluntary non-profit - Church Yes
520017 ST JOSEPHS HSPTL CHIPPEWA FALLS WI Acute Care Hospitals Voluntary non-profit - Church Yes
520019 ST MARYS HOSPITAL RHINELANDER WI Acute Care Hospitals Voluntary non-profit - Church Yes
520021 UNITED HSPTL SYS KENOSHA WI Acute Care Hospitals Voluntary non-profit - Private Yes
520027 COLUMBIA ST MARYS OZAUKEE CAMPUS MEQUON WI Acute Care Hospitals Voluntary non-profit - Church Yes
520028 MONROE CLINIC MONROE WI Acute Care Hospitals Voluntary non-profit - Church Yes
520030 ASPIRUS WAUSAU HOSPITAL WAUSAU WI Acute Care Hospitals Proprietary Yes
520033 RIVERVIEW HSPTL ASSOC WISCONSIN RAPIDS WI Acute Care Hospitals Voluntary non-profit - Private Yes
520034 AURORA MED CTR MANITOWOC CTY TWO RIVERS WI Acute Care Hospitals Voluntary non-profit - Private Yes
520035 AURORA SHEBOYGAN MEM MED CTR SHEBOYGAN WI Acute Care Hospitals Voluntary non-profit - Private Yes
520037 ST JOSEPHS HSPTL MARSHFIELD WI Acute Care Hospitals Voluntary non-profit - Church Yes
520038 AURORA MED CENTER-WASHINGTON COUNTY HARTFORD WI Acute Care Hospitals Voluntary non-profit - Private Yes
520041 DIVINE SAVIOR HLTHCARE PORTAGE WI Acute Care Hospitals Voluntary non-profit - Church Yes
520044 ST NICHOLAS HOSPITAL SHEBOYGAN WI Acute Care Hospitals Voluntary non-profit - Church Yes
520045 THEDA CLARK MED CTR NEENAH WI Acute Care Hospitals Voluntary non-profit - Private Yes
520048 MERCY MED CTR OF OSHKOSH OSHKOSH WI Acute Care Hospitals Voluntary non-profit - Church Yes
520049 BELLIN MEMORIAL HSPTL GREEN BAY WI Acute Care Hospitals Voluntary non-profit - Church Yes
520051 COLUMBIA ST MARYS HSPTL MILW (COL & MILW CAMPUS) MILWAUKEE WI Acute Care Hospitals Voluntary non-profit - Church Yes
520057 ST CLARE HSPTL HLTH SVCS BARABOO WI Acute Care Hospitals Voluntary non-profit - Church Yes
520059 AURORA MEMORIAL HSPTL BURLINGTON BURLINGTON WI Acute Care Hospitals Voluntary non-profit - Private Yes
520062 OCONOMOWOC MEM HSPTL OCONOMOWOC WI Acute Care Hospitals Voluntary non-profit - Private Yes
520063 ST JOSEPHS COM HSPTL WEST BEND WEST BEND WI Acute Care Hospitals Voluntary non-profit - Private Yes
520066 MERCY HLTH SYS CORP JANESVILLE WI Acute Care Hospitals Voluntary non-profit - Private Yes
520070 LUTHER HOSPITAL MAYO HEALTH SYSTEM EAU CLAIRE WI Acute Care Hospitals Voluntary non-profit - Other Yes
520071 FORT HEALTHCARE FORT ATKINSON WI Acute Care Hospitals Voluntary non-profit - Private Yes
520075 ST VINCENT HSPTL GREEN BAY WI Acute Care Hospitals Voluntary non-profit - Church Yes
520076 BEAVER DAM COM HSPTL BEAVER DAM WI Acute Care Hospitals Voluntary non-profit - Private Yes
520078 WHEATON FRANCISCAN HEALTHCARE- ST FRANCIS MILWAUKEE WI Acute Care Hospitals Voluntary non-profit - Church Yes
520083 ST MARY'S HOSPITAL MADISON WI Acute Care Hospitals Voluntary non-profit - Other Yes
520087 GUNDERSEN LUTH MED CTR LA CROSSE WI Acute Care Hospitals Voluntary non-profit - Private Yes
520088 ST AGNES HSPTL FOND DU LAC WI Acute Care Hospitals Voluntary non-profit - Church Yes
520089 MERITER HSPTL MADISON WI Acute Care Hospitals Voluntary non-profit - Private Yes

84
520091 HOWARD YOUNG MED CTR WOODRUFF WI Acute Care Hospitals Voluntary non-profit - Church Yes
520095 SAUK PRAIRIE MEM HSPTL PRAIRIE DU SAC WI Acute Care Hospitals Voluntary non-profit - Private Yes
520096 WHEATON FRANCISCAN HEALTHCARE- ALL SAINTS RACINE WI Acute Care Hospitals Voluntary non-profit - Church Yes
520097 ST MARYS HSPTL MED CTR GREEN BAY WI Acute Care Hospitals Voluntary non-profit - Other Yes
520098 UW HEALTH UW HOSPITALS AND CLINICS MADISON WI Acute Care Hospitals Government - Hospital District or Authority Yes
520100 BELOIT MEM HSPTL BELOIT WI Acute Care Hospitals Voluntary non-profit - Private Yes
520102 AURORA LAKELAND MED CTR ELKHORN WI Acute Care Hospitals Voluntary non-profit - Private Yes
520103 COMMUNITY MEM HSPTL MENOMONEE FALLS WI Acute Care Hospitals Voluntary non-profit - Private Yes
520107 HOLY FAMILY MEMORIAL MANITOWOC WI Acute Care Hospitals Voluntary non-profit - Other Yes
520109 HESS MEM HSPTL MAUSTON WI Acute Care Hospitals Proprietary Yes
520113 BAY AREA MED CTR MARINETTE WI Acute Care Hospitals Voluntary non-profit - Private Yes
520116 WATERTOWN MEM HSPTL WATERTOWN WI Acute Care Hospitals Voluntary non-profit - Private Yes
520136 WHEATON FRANCISCAN HEALTHCARE- ST JOSEPH MILWAUKEE WI Acute Care Hospitals Voluntary non-profit - Church Yes
520138 AURORA ST LUKES MED CTR MILWAUKEE WI Acute Care Hospitals Voluntary non-profit - Private Yes
520139 WEST ALLIS MEM HSPTL WEST ALLIS WI Acute Care Hospitals Voluntary non-profit - Private Yes
520160 APPLETON MED CTR APPLETON WI Acute Care Hospitals Voluntary non-profit - Other Yes
520170 WHEATON FRANCISCAN HEALTHCARE- ELMBROOK MEMORIAL BROOKFIELD WI Acute Care Hospitals Voluntary non-profit - Church Yes
520177 FROEDTERT MEM LUTHERAN HSPTL MILWAUKEE WI Acute Care Hospitals Voluntary non-profit - Private Yes
520189 AURORA MED CTR KENOSHA KENOSHA WI Acute Care Hospitals Voluntary non-profit - Private Yes
520193 AURORA BAYCARE MED CTR GREEN BAY WI Acute Care Hospitals Government - State Yes
520194 ORTHOPAEDIC HSPTL OF WI GLENDALE WI Acute Care Hospitals Proprietary No
520195 COLUMBIA CENTER MEQUON WI Acute Care Hospitals Voluntary non-profit - Private No
520196 OAK LEAF SURGCL HSPTL EAU CLAIRE WI Acute Care Hospitals Proprietary No
520198 AURORA MED CTR OSHKOSH OSHKOSH WI Acute Care Hospitals Voluntary non-profit - Private Yes
520199 WISCONSIN HEART HSPTL WAUWATOSA WI Acute Care Hospitals Proprietary Yes

85
Appendix E: Regression Tables
Table E1: Cost Model (Total Cost) R^2 Value
Table E2: Results of Variables in Cost (Total Cost) Model

86
Table E3: Cost Model (Operating Room Salary) R^2 Value
Table E4: Results of Variables in Cost (Operating Room Salary) Model

87
Table E5: Cost Model (Radiology Room Salary) R^2 Value
Table E6: Results of Variables in Cost (Radiology Room Salary) Model

88
Table E7: Cost Model (Respiratory Room Salary) R^2 Value
Table E8: Results of Variables in Cost (Respiratory Room Salary) Model

89
Table E9: Cost Model (Physical Therapy Department Salary) R^2 Value
Table E10: Results of Variables in Cost (Physical Therapy Department Salary) Model

90
Table E11: Cost Model (Electrocardiology Room Salary) R^2 Value
Table E12: Results of Variables in Cost (Electrocardiology Room Salary) Model

91
Table E13: Cost Model (Emergency Room Salary) R^2 Value
Table E14: Results of Variables in Cost (Emergency Room Salary) Model

92
Table E15: Quality Model (Heart Attack) R^2 Value
Table E16: Results of Variables in Quality (Heart Attack) Model

93
Table E17: Quality Model (Heart Failure) R^2 Value
Table E18: Results of Variables in Quality (Heart Failure) Model

94
Table E19: Quality Model (Pneumonia-Receiving Smoking Cessation Advice) R^2 Value
Table E20: Results of Variables in Quality (Pneumonia-Receiving Smoking Cessation Advice)
Model

95
Table E21: Quality Model (Pneumonia-Receiving the Most Appropriate Antibiotic) R^2 Value
Table E22: Results of Variables in Quality (Pneumonia-Receiving the Most Appropriate
Antibiotic) Model
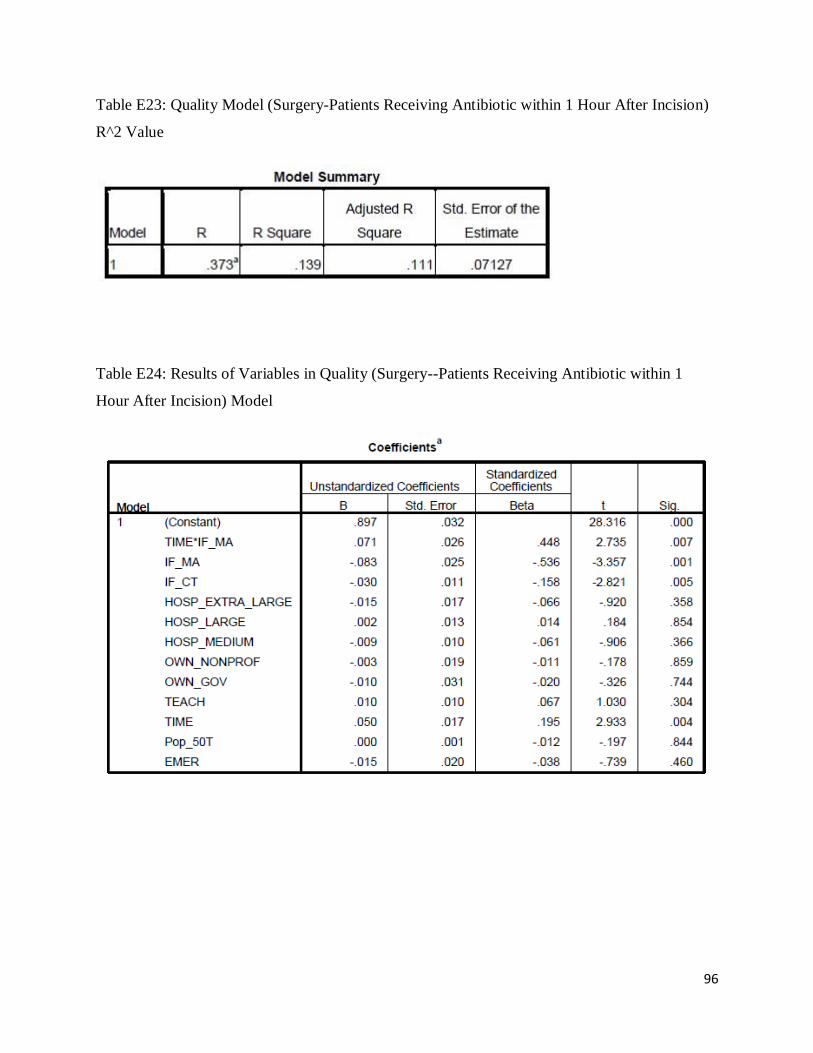
96
Table E23: Quality Model (Surgery-Patients Receiving Antibiotic within 1 Hour After Incision)
R^2 Value
Table E24: Results of Variables in Quality (Surgery--Patients Receiving Antibiotic within 1
Hour After Incision) Model

97
Table E25: Quality Model (Surgery-Patients Stopping Antibiotic within 24 Hour After Surgery)
R^2 Value
Table E26: Results of Variables in Quality (Surgery-Patients Stopping Antibiotic within 24 Hour
After Surgery) Model

98
Appendix F: Indicators Abbreviation
TIME: If the data is collected after the reform? 1 – Yes 0 - No
IF_MA: If the hospital is in MA? 1 – Yes 0 - No
IF_CT: If the hospital is in CT? 1 – Yes 0 - No
IF_WI: If the hospital is in WI? 1 – Yes 0 - No
HOSP_EXTRA_LARGE: If the hospital is extra large? 1 – Yes 0 - No
HOSP_LARGE: If the hospital is large? 1 – Yes 0 - No
HOSP_MEDIUM: If the hospital is medium? 1 – Yes 0 - No
HOSP_SMALL: If the hospital is medium? 1 – Yes 0 - No
OWN_GOV: if the hospital is governmental hospital? 1 – Yes 0 – No
OWN_NONPROF: If the hospital is nonprofit hospital? 1 – Yes 0 – No
OWN_PROP: If the hospital is proprietary hospital? 1 – Yes 0 – No
EMER: If the hospital provides emergency service? 1 – Yes 0 - No
TEACH: If the hospital is teaching hospital? 1 – Yes 0 - No
Pop_50T: Town population in fifty thousand where the hospital is located
TOTAL_COST: total operation cost in dollars
TOTAL_COST_MIL: total operation cost in million dollars
OP_ROOM: operation room salary in dollar
OP_ROOM_MIL: operation room salary in million dollars
RADIO_ROOM: radiology room salary in dollar
RADIO_ROOM_MIL: radiology room salary in million dollar
RES_THE: Respiratory Therapy Salary in dollar

99
RES_THE_MIL: Respiratory Therapy Salary in million dollar
PHY_THE: Physical therapy Salary in dollar
PHY_THE_MIL: Physical therapy Salary in million dollars
ELEC: electrocardiology Salary in dollar
ELEC_MIL: electrocardiology Salary in million dollars
EMER_SAL: emergency room salary in dollar
EMER_SAL_MIL: emergency room salary in million dollars
HA: Heart Attack Patients Given ACE Inhibitor or ARB for Left Ventricular Systolic
Dysfunction (LVSD)
HF: Heart Failure Patients Given Smoking Cessation Advice/Counseling
P_ADV: Pneumonia Patients Given Smoking Cessation Advice/Counseling
P_ANTI: Pneumonia Patients Given the Most Appropriate Initial Antibiotic(s)
S1: Surgery Patients Who Received Preventative Antibiotic(s) One Hour Before Incision
S24: Surgery Patients Whose Preventative Antibiotic(s) are Stopped Within 24 hours After
Surgery

100
Appendix G: Graphs of Trends of Dependent Variables in Massachusetts,
Connecticut and Wisconsin
Figure G1: Inflation Adjusted Hospital Total Operating Cost (Million Dollars) from Fiscal Year
2005 to 2009 in Massachusetts, Connecticut and Wisconsin

101
Figure G2: Inflation Adjusted Hospital Operating Room Salaries (Million Dollars) from Fiscal
Year 2005 to 2009 in Massachusetts, Connecticut and Wisconsin

102
Figure G3: Inflation Adjusted Hospital Radiology Room Salaries (Million Dollars) from Fiscal
Year 2005 to 2009 in Massachusetts, Connecticut and Wisconsin

103
Figure G4: Inflation Adjusted Hospital Respiratory Room Salaries (Million Dollars) from Fiscal
Year 2005 to 2009 in Massachusetts, Connecticut and Wisconsin

104
Figure G5: Inflation Adjusted Hospital Physical Therapy Salaries (Million Dollars) from Fiscal
Year 2005 to 2009 in Massachusetts, Connecticut and Wisconsin

105
Figure G6: Inflation Adjusted Hospital Electrocardiology Room Salaries (Million Dollars) from
Fiscal Year 2005 to 2009 in Massachusetts, Connecticut and Wisconsin

106
Figure G7: Inflation Adjusted Hospital Emergency Room Salaries (Million Dollars) from Fiscal
Year 2005 to 2009 in Massachusetts, Connecticut and Wisconsin

107
Figure G8: Heart Attack Patients Given ACE Inhibitor or ARB for Left Ventricular Systolic
Dysfunction (LVSD) (100%) from Fiscal Year 2005 to 2009 in Massachusetts, Connecticut and
Wisconsin

108
Figure G9: Heart Failure Patients Given Smoking Cessation Advice / Counseling (100%) from
Fiscal Year 2005 to 2009 in Massachusetts, Connecticut and Wisconsin

109
Figure G10: Pneumonia Patients Given Smoking Cessation Advice / Counseling (100%) from Fiscal
Year 2005 to 2009 in Massachusetts, Connecticut and Wisconsin

110
Figure G11: Pneumonia Patients Given the Most Appropriate Initial Antibiotic(s) (100%) from
Fiscal Year 2005 to 2009 in Massachusetts, Connecticut and Wisconsin

111
Figure G12: Surgery Patients Who Received Preventative Antibiotic(s) One Hour Before Incision
(100%) from Fiscal Year 2005 to 2009 in Massachusetts, Connecticut and Wisconsin

112
Figure G13: Surgery Patients Whose Preventative Antibiotic(s) are Stopped Within 24 Hours After
Surgery (100%) from Fiscal Year 2005 to 2009 in Massachusetts, Connecticut and Wisconsin