the impacts of phosphorus deficiency on the photosynthetic
TRANSCRIPT

The Impacts of Phosphorus Deficiency on thePhotosynthetic Electron Transport Chain1[OPEN]
Andreas Carstensen,a Andrei Herdean,b Sidsel Birkelund Schmidt ,a Anurag Sharma,a Cornelia Spetea,b
Mathias Pribil,a and Søren Husteda,2
aCopenhagen Plant Science Centre, Department of Plant and Environmental Sciences, Faculty of Science,University of Copenhagen, 1871 Frederiksberg C, DenmarkbDepartment of Biological and Environmental Sciences, University of Gothenburg, Gothenburg 405 30, Sweden
ORCID IDs: 0000-0001-5029-7015 (A.C.); 0000-0003-2143-0213 (A.H.); 0000-0002-4193-4454 (S.B.S.); 0000-0001-5345-8830 (A.S.);0000-0001-7609-0290 (C.S.); 0000-0002-9174-9548 (M.P.); 0000-0003-2020-1902 (S.H.).
Phosphorus (P) is an essential macronutrient, and P deficiency limits plant productivity. Recent work showed that P deficiencyaffects electron transport to photosystem I (PSI), but the underlying mechanisms are unknown. Here, we present acomprehensive biological model describing how P deficiency disrupts the photosynthetic machinery and the electrontransport chain through a series of sequential events in barley (Hordeum vulgare). P deficiency reduces the orthophosphateconcentration in the chloroplast stroma to levels that inhibit ATP synthase activity. Consequently, protons accumulate in thethylakoids and cause lumen acidification, which inhibits linear electron flow. Limited plastoquinol oxidation retards electrontransport to the cytochrome b6 f complex, yet the electron transfer rate of PSI is increased under steady-state growth light and islimited under high-light conditions. Under P deficiency, the enhanced electron flow through PSI increases the levels of NADPH,whereas ATP production remains restricted and, hence, reduces CO2 fixation. In parallel, lumen acidification activates theenergy-dependent quenching component of the nonphotochemical quenching mechanism and prevents the overexcitation ofphotosystem II and damage to the leaf tissue. Consequently, plants can be severely affected by P deficiency for weeks withoutdisplaying any visual leaf symptoms. All of the processes in the photosynthetic machinery influenced by P deficiency appear tobe fully reversible and can be restored in less than 60 min after resupply of orthophosphate to the leaf tissue.
Phosphorus (P) is an essential heteroelement incompounds such as ATP, NADPH, nucleic acids, sugarphosphates, and phospholipids, all of which play im-portant roles in photosynthesis (Hammond and White,2008). Consequently, even marginal P deficiency has amajor impact on plant growth and development. It hasbeen estimated that 30% of the world’s arable soils aredeficient in P and require P fertilization to improveyields (MacDonald et al., 2011). However, phosphaterock, the source of mineral P fertilizers, is a finite nat-ural resource, and known reserves are projected to last
less than a few hundred years at current rates of con-sumption (Cordell et al., 2009; Gilbert, 2009; Walanet al., 2014; Baker et al., 2015). This makes P a strategicnatural resource similar to oil, as a few countries controlmost known reserves. Currently, some parts of theworld vastly overuse P fertilization, which causes eu-trophication of lakes and coastal waters, whereas lim-ited access to P fertilizer causes crop yield reductionselsewhere (Baker et al., 2015). P fertilizer is rapidlyimmobilized in the soil due to chemical fixation andmicrobial immobilization; therefore, excessive P appli-cation often is required to ensure ample P availability toplants. As a result, less than 20% of P fertilizer added tosoils is typically taken up by the crop (Cordell andWhite, 2015). This obviously low P use efficiency isunsustainable.
Orthophosphate (Pi) is a major regulator of carbonmetabolism in plants, and P deficiency influences thebalance between the synthesis and catabolism of carbonmetabolites. Low Pi levels switch the carbon flow tostarch accumulation and reduce CO2 assimilation(Heldt et al., 1977). Plants have evolved several re-sponses to balance and stabilize the fluctuating Pi levelsthat occur at the tissue level in natural environments,such as (1) altering root morphology and initiatingmycorrhizal symbiosis to improve soil exploration forP; (2) activating exudation processes in the rhizosphereto mobilize Pi from the soil; (3) inducing Pi transporter
1 This work was supported by the University of Copenhagen andInnovation Fund Denmark (Future Cropping). A.H. was the recipientof a postdoctoral fellowship from the Foundation Olle Engkvist By-ggmästare, and A.S. would like to thank Carlsbergfondet for support.
2 Address correspondence to [email protected] author responsible for distribution of materials integral to the
findings presented in this article in accordance with the policy de-scribed in the Instructions for Authors (www.plantphysiol.org) is:Søren Husted ([email protected]).
A.C., A.H., A.S., C.S., M.P., and S.H. designed the experiments;A.C. and A.H. performed the fluorescence measurements; A.C. andS.B.S. performed the enzyme assays, including the immunoblotanalyses; A.S. performed the transmission electron microscopy; allauthors participated in data interpretation; A.C. and S.H. drafted thearticle, and all authors participated in completing the final version.
[OPEN] Articles can be viewed without a subscription.www.plantphysiol.org/cgi/doi/10.1104/pp.17.01624
Plant Physiology�, May 2018, Vol. 177, pp. 271–284, www.plantphysiol.org � 2018 American Society of Plant Biologists. All Rights Reserved. 271 www.plantphysiol.orgon May 7, 2018 - Published by Downloaded from
Copyright © 2018 American Society of Plant Biologists. All rights reserved.

proteins and regulating Pi uptake kinetics; and (4)remobilizing Pi in source organs to meet the require-ments of the developing sink tissue (Ramaekers et al.,2010). These responses are supported by homeostaticprocesses at the cellular level, in which Pi levels arestabilized by mobilization between storage pools invacuoles and other organelles such as chloroplastswhere the photosynthetic machinery is located (Zhanget al., 2014).
Homeostatic Pi levels in chloroplasts are controlledby a range of different Pi transporters, which are locatedin the chloroplast inner envelope or in the thylakoidmembrane (Młodzi�nska and Zboi�nska, 2016). Threeclasses of chloroplast Pi transporters have been clonedand characterized: the PHT2, PHT4, and plastidic Pitranslocators. The high-affinity Pi transporter PHT4;1(Km, 400 mM) has been localized in the stroma-exposedregions of the thylakoid membrane and mediates Pitransport from the thylakoid lumen to the stroma (Guoet al., 2008; Pavón et al., 2008; Yin et al., 2015). A studyof Arabidopsis (Arabidopsis thaliana) knockout mutantsshowed that the absence of PHT4;1 resulted in amarked decrease in ATP synthase activity; it was as-sumed that PHT4;1 operates in close proximity to ATPsynthase in the thylakoid membrane to maintain suffi-cient Pi levels for ATP synthesis (Karlsson et al., 2015). Itwas proposed that an altered supply of Pi in the stromareduced the ATP levels and, thereby, reduced CO2 as-similation, but no changes in the photosynthetic ma-chinery composition or electron transport activity wereobserved (Karlsson et al., 2015). P starvation immedi-ately affects CO2 assimilation but does not appear toterminate it, as P-deficient plants typically remain greenand do not develop leaf chlorosis. Specifically, P defi-ciency is believed to affect CO2 assimilation by reducingthe ATP-dependent regeneration of ribulose-1,5-bisphos-phate in the Calvin cycle (Rao and Terry, 1995; Yan et al.,2015), whereas its effects on the amounts and carboxyla-tion activity of Rubisco are less clear (Rychter and Rao,2005; Reich et al., 2009; Muneer and Jeong, 2015).
We recently showed that even marginal P defi-ciency has a marked effect on electron transport
between PSII and PSI (Frydenvang et al., 2015). Ananalysis of chlorophyll a fluorescence (OJIP) tran-sients indicated that the I-step in the electron trans-port chain was markedly affected by P deficiency andthat the change in the fluorescence transient curva-ture could be used to quantify the bioactive pool of Piin plants. However, the targets of P deficiency withinthe thylakoids upstream of ATP synthase remainlargely unknown despite decades of research. Theobjective of this study was to develop a comprehen-sive biological model of how photosynthesis is af-fected by P deficiency under physiologically relevantconditions.
RESULTS
Plant Growth under P Deficiency
Multiple sets of barley plants (Hordeum vulgare‘Quench’) were hydroponically cultivated using threedifferent treatments: (1) the control treatment, in whichplants were treated with a sufficient nutrient supplythroughout the experiment; (2) the P-deficient treatment,in which plants were treated with all nutrients as in thecontrol treatment but with a restricted (low) P concen-tration; and (3) the P-resupply treatment, in whichP-deficient plants were supplemented with P concentra-tions similar to those used in the control treatment at 21 or25 d after planting (DAP). The plant material was har-vested at 28 DAP. P deficiency was observed to reduceplant tillering and biomass, whereas it increased an-thocyanin accumulation in stems (SupplementalFig. S1). The three different treatments resulted in leaftissue P concentrations ranging from less than1,000 mg P g21 dry weight for P deficiency (treatment2) to more than 4,000 mg P g21 dry weight in theyoungest fully expanded leaves (YFELs) for the con-trol (treatment 1) and P resupply (treatment 3; Fig. 1).We confirmed that the plants had no nutrient defi-ciencies other than P (Supplemental Table S1). Despitethe large range of leaf P concentrations, no visualdifferences between leaves were observed.
Figure 1. Leaf P concentrations with corresponding photographs of the youngest fully expanded barley leaves. Control,P-deficient, and P-resupplied barley plants were cultivated in hydroponics. P was resupplied to the nutrient solution 21 DAP, andeach photograph was taken before harvest 7 d later (28 DAP). The P concentrations are mean values in leaf dry matter6 SE (n = 4,each with four technical replicates), and different letters represent statistically significant changes (P , 0.05) using one-wayANOVA and Tukey’s multiple comparison test. DW, Dry weight.
272 Plant Physiol. Vol. 177, 2018
Carstensen et al.
www.plantphysiol.orgon May 7, 2018 - Published by Downloaded from Copyright © 2018 American Society of Plant Biologists. All rights reserved.

Chlorophyll a Fluorescence Measurements RevealedP Deficiency
Chlorophyll a fluorescence transients (OJIP tran-sients) from the three different treatments revealed adepletion of the I-step for the P-deficient plants (Fig.2A). Before P resupply at 21 DAP in treatment 3, plantssubjected to control and P-deficient treatments wereeasily differentiated when focusing on the I-step. Sevendays after P resupply to P-deficient plants (28 DAP), theI-step returned to control conditions, and the flat pla-teau resembling the I-step was even more distinct thanthat observed for the control plants (Fig. 2A, inset). Todemonstrate that P deficiency in plants is highly re-versible and that disruptions in electron transport canbe recovered rapidly, we infiltrated P-deficient leafsegments with a Pi-containing solution by immersionfor 60 min. The I-step of the OJIP transients inP-deficient plants was highly reversible and displayed aresponse to P infiltration into leaves in less than 1 h (Fig.2B). The quantum efficiency of PSII (Fv/Fm) was unableto discriminate between the treatments because alltransients reached values close to the theoretical maxi-mum of 0.83. The fluorescence quenching kinetics afterreaching the maximum fluorescence (Fig. 2A, P-step)was much faster for the P-deficient plants than for thecontrol and P-resupplied plants. The slopes of the flu-orescence quenching curves between 2 and 10 s were20.035 6 0.001, 20.066 6 0.002, and 20.04 6 0.002for the control, P-deficient, and P-resupplied plants,respectively. These results indicated that fluorescencequenching in plants resupplied with P did not differsignificantly from that of control plants. Therefore,changes in both the I-step and the fluorescencequenching kinetics appear to be highly valuable fordiagnosing P deficiency.
Inhibition of Electron Transport to PSI Depletes the I-Stepin the Fluorescence Transient
Chemical inhibitors are commonly used to study elec-tron flow in photosynthesis. We used three different in-hibitors to manipulate electron transfer in the YFELsof control plants (Fig. 3A). Leaves infiltrated with 3-(3,4–dichlorophenyl)-1,1-dimethylurea (DCMU) exhibi-ted chlorophyll a fluorescence transients that lacked boththe J- and I-steps (Fig. 3A). DCMU displaces the quinoneacceptor QB from its binding site, thereby blocking anyfurther electron transfer downstream of PSII by prevent-ing QA
2 reoxidation (Duysens and Sweers, 1963). Leavesinfiltrated with dibromothymoquinone (DBMIB) exhibi-ted transients that lacked the I-step (Fig. 3A), similar tothose of P-deficient plants (Fig. 2A). DBMIB is an artificialquinone that tightly binds to the cytochrome (Cyt) b6 fcomplex, thereby preventing plastoquinol (PQH2) reox-idation (Schansker et al., 2005) and preventing electrontransport from PQH2 to PSI. Leaves infiltrated withmethyl viologen (MV) exhibited distinct transients thatlacked the I-step (Fig. 3A). When illuminating leaves that
have been dark adapted for more than 10 min, there is atransient restriction in electron flow in PSI because ferre-doxin-NADP+ reductase (FNR) is inactivated. This tran-sient block is thought to be important for the developmentof the I-step kinetics. MV is an effective electron acceptorthat strongly competes with ferredoxin for electrons fromthe FeS clusters in PSI, thereby bypassing the transientblock imposed by FNR during dark adaption (Schanskeret al., 2005). All infiltrations with chemical inhibitors werecompared with leaves infiltrated with Milli-Q water as acontrol.
To further demonstrate that fluorescence transientsof P-deficient plants lack the I-step due to the inhibitionof electron transport to PSI, OJIP transients wereobtained from two Arabidopsis PSI mutants, psad1-1 and psae1-3, which have pronounced reductions in the
Figure 2. OJIP transients recorded from the youngest, fully expandedbarley leaves. A, Main plot. Transients were recorded just before Presupply at 21 DAP. The inset shows transients recorded 7 d after Presupply at 28 DAP. The slope of the quenching curve was calculatedbetween the two dashed vertical lines (between 2 and 10 s). B, Tran-sients recorded for P-deficient leaves immersed in Milli-Q water (Pdeficient) or P solution (P resupply) for 60 min. All transients were av-eraged (A, n = 5; B, n = 4, eachwith more than four technical replicates)and doubled normalized between F0 and Fm. A.U., Arbitrary units.
Plant Physiol. Vol. 177, 2018 273
Phosphorus Deficiency and Photosynthetic Machinery
www.plantphysiol.orgon May 7, 2018 - Published by Downloaded from Copyright © 2018 American Society of Plant Biologists. All rights reserved.

levels of the PSI subunits PsaD1 and PsaE1, respec-tively. These two mutants have markedly impairedphotosynthetic electron flow (Ihnatowicz et al., 2004,2007). The transients of both mutants essentially lackedthe I-step, which is present in wild-type plants (Fig. 3B),which supported the results obtained from experimentswith the DCMU, DBMIB, and MV inhibitors (Fig. 3A).
P Deficiency Suppresses the Production of ATP andIncreases the Production of NADPH
NADP+ is the final substrate for the production ofNADPH, and NADPH and ATP are the main productsof light-dependent reactions in photosynthesis. TheNADP+ concentration was reduced significantly in
P-deficient barley plants compared with those in con-trol and P-resupply plants (Fig. 4A). At 3 d after Presupply (28 DAP) to P-deficient plants, the NADP+
concentrationwas restored to that in control plants. Theopposite trend was present for NADPH, with theNADPH concentration being significantly higher inP-deficient plants than in control and P-resuppliedplants (Fig. 4B). As for the NADP+ concentration, thesame trend was observed for the ATP concentrationin isolated thylakoids, although the ATP level inP-resupplied plants was lower than that in controlplants (Fig. 4C). The Pi concentration at the whole-leaflevel was reduced severely in the P-deficient plants (Fig.4D). The total Pi concentration in chloroplasts isolatedafter either a dark or light period (Fig. 4, E and F, re-spectively) was significantly lower in the P-deficientplants; however, the relative change was lower than thatobserved at the whole-leaf level. The starch content wassignificantly higher in P-deficient plants than in controland P-resupplied plants (Fig. 4G). These differences instarch contents were confirmed visually using transmis-sion electron micrographs of chloroplasts from control,P-deficient, and P-resupplied plants, whereas no strikingdifferences in chloroplast or thylakoid structure wereobserved (Supplemental Fig. S2).
We further investigated the P-mediated changes in keyphotosynthetic proteins by performing immunoblot anal-ysis on thylakoids isolated from 28-d-old YFELs usingantibodies against FNR, ferredoxin (FDX1), PsaA, PsaF,Cyt f, D1, andCP43.Visual inspection andquantificationofthe protein blots confirmed that the different P treatmentsdid not affect the photosynthetic machinery at the proteinlevel (Supplemental Fig. S3; Supplemental Table S2).
A severe reduction in stromal P concentration in-duced by Man infiltration (Takizawa et al., 2008) or bythe absence of the chloroplast-localized Pi transporterPHT4;1 (Karlsson et al., 2015) reduced proton fluxthrough ATP synthase and subsequently induced lu-men acidification. To determine if this also occurs inplants subjected to P deficiency at physiologically rel-evant concentrations, we analyzed the magnitude andpartitioning of the proton motive force (pmf) that drivesATP synthase. The results showed that P-deficientplants had a reduced ATP synthase activity (Fig. 5A),which is in agreement with the observed reduced ATPconcentrations (Fig. 4C). However, 7 d after P resupply(at 28 DAP), ATP synthase activity was fully restored tocontrol levels. Changes in pmf, which reflect pH dif-ferences across the thylakoid membrane (DpH) anddifferences in the electrical potential (DC), were sig-nificantly affected by P deficiency (Fig. 5B). The pmf inP-deficient plants was essentially determined exclu-sively by DpH (94%), which most probably indicatesa highly acidified lumen, whereas the control andP-resupplied plants had pmf values reflecting a bal-anced distribution between DpH and DC (Fig. 5B).Since pmf size and its components were determinedfrom light-dark measurements of the electrochromicband shift (ECS) signal, the pmf size may have beenunderestimated because the ECS dark relaxation is
Figure 3. OJIP transients recorded from barley leaves infiltrated withelectron inhibitors or from Arabidopsis PSI mutants. A, Effects ofDCMU, DBMIB, and MV inhibitors on OJIP transients in the YFELs of28-d-old healthy barley plants (control) cultivated in hydroponics. B,OJIP transients from 6-week-old Arabidopsis mutants psad1-1 andpsae1-3 and the corresponding wild type (WT) cultivated in soil. Thetransients were averaged (A, n = 4; B, n = 5, each with four technicalreplicates) and double normalized between F0 and Fm.
274 Plant Physiol. Vol. 177, 2018
Carstensen et al.
www.plantphysiol.orgon May 7, 2018 - Published by Downloaded from Copyright © 2018 American Society of Plant Biologists. All rights reserved.

dependent on the free energy for ATP formation,which, in turn, depends on the [ATP]/[ADP]*[Pi] ratioin the chloroplast stroma. However, lumen acidificationwas further supported by analyzing the extendedchlorophyll a fluorescence transients (the full OJI-PSMTcurve; Supplemental Fig. S4). At low saturating actiniclight intensity (1,000 mmol photons m22 s21), a distinctdisappearance of the S-M phase was observed forP-deficient plants, which was associated previouslywith lumen acidification and attenuation of the electronflow from PSII to PSI (Goltsev et al., 2016).Lumen acidification is an immediate signal that
triggers the feedback regulation of light capture via theenergy-dependent quenching (qE) component, beingthe largest and most rapidly induced component ofnonphotochemical quenching (NPQ; Müller et al.,2001). The NPQ measurements for the three treatmentsagain revealed that P-deficient plants differed fromcontrol and P-resupplied plants (Supplemental Fig. S5).NPQ was increased sharply immediately after theonset of illumination in P-deficient plants and washigher than that for control and P-resupplied plants
throughout the entire periodof illumination (SupplementalFig. S5A). Furthermore, NPQ relaxation in the darkwas slower for P-deficient plants and associatedwith a reduction in PSII quantum yield (SupplementalFig. S5B).
We also directly quantified qE in growth light and atincreasing light intensities, which confirmed that thiscomponent of NPQ is substantially higher in P-deficientplants across all light intensities (Fig. 6A). Moreover,the electron transfer rate through PSII [ETR(II)] waslower across all light intensities in P-deficient plants(Fig. 6B), whereas the electron transfer rate through PSI[ETR(I)] was higher in growth light and lower withincreasing light intensities compared with the controlplants (Fig. 6C). Further measurements under steady-state growth light conditions revealed that PSIIquantum yield, linear electron flow, and the fraction ofopen reaction centers were reduced significantly(Table I). In agreement with the standard NPQ and qEmeasurements (Fig. 6A; Supplemental Fig. S5), NPQt(Tietz et al., 2017) under steady-state growth lightconditions was 10-fold higher in P-deficient plants(Table I). No differences in ETR(I), ETR(II), or statetransition (Supplemental Table S3) were observed inlow light (60 mmol photons m22 s21).
To examine if lumen acidification leads to impairedPQH2 oxidation at the Cyt b6 f complex, we measuredthe redox state of the PQ pool using OJIP transients(Tóth et al., 2007; Table II). The fraction of reducedPQH2 was increased significantly for the P-deficientplants relative to the control and P-resupplied plants,indicating a slower oxidation of PQH2 at the Cytb6 f complex.
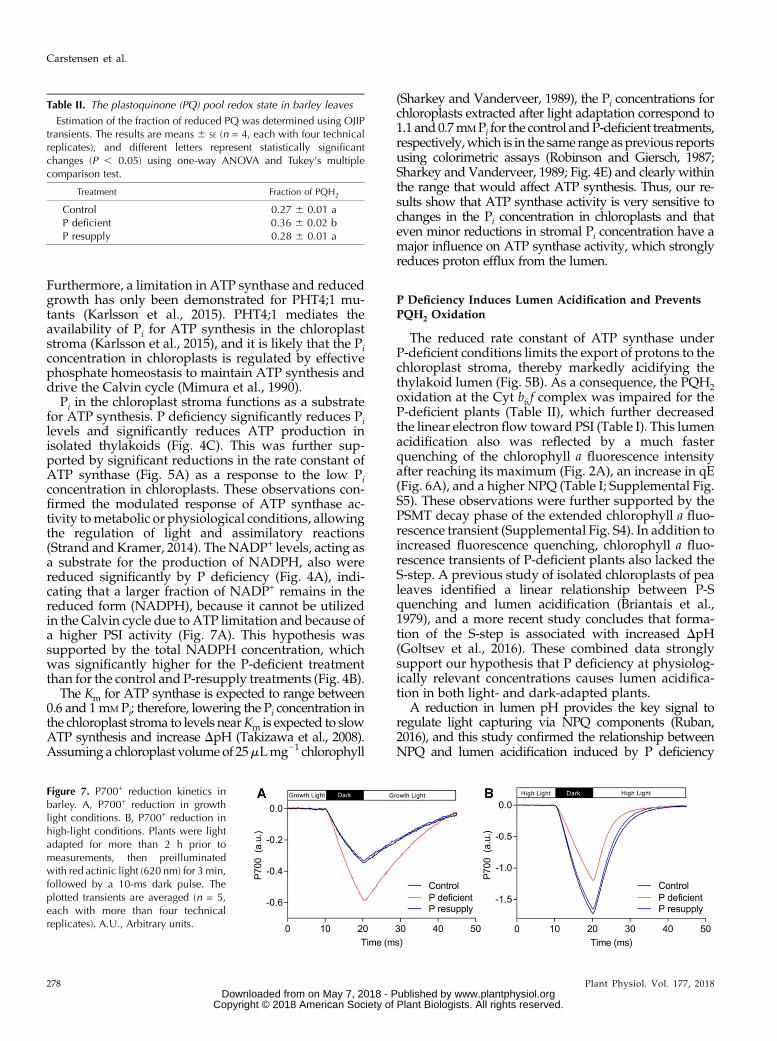
Finally, to confirm that an impaired PQH2 oxidationat the Cyt b6 f complex essentially restricts the flow ofelectrons to PSI (Schlodder and Meyer, 1987), we eval-uated P700+ reduction kinetics (Fig. 7). P700+ reductionwas markedly higher in P-deficient plants than incontrol and P-resupplied plants in growth light condi-tions (Fig. 7A), but clearly not under high-light (2,200mmol photons m22 s21) conditions (Fig. 7B). This resultconfirms that the electron flow to PSI is severely re-duced in P-deficient plants under increasing light in-tensity (Fig. 6, B and C).
DISCUSSION
Latent P deficiency without any observable leafsymptoms was successfully induced with leaf P con-centrations as low as 850 mg P g21 dry weight (Reuterand Robinson, 1997), and chloroplast Pi concentrationswere measured between 20 and 40 nmol mg21 chloro-phyll depending on whether plants were light or darkadapted prior to extraction, respectively (Figs. 1 and 4,E and F; Supplemental Fig. S1). This result was funda-mentally different from those of previous studies,which induced P-deficient-like conditions by infiltrat-ing leaf segments with Man to strip the entire leaf Pipool by irreversible phosphorylation (Takizawa et al.,
Figure 4. Concentrations of NADP+, NADPH, ATP, Pi (PO432), and
starch in the youngest, fully expanded barley leaves. A, Concentrationsof NADP+ in leaf tissue. B, Concentrations of NADPH in leaf tissue. C,Concentrations of ATP in light-exposed thylakoids. D, Concentrations ofPO
4
32 in leaf tissue. E, Concentrations of PO432 in chloroplasts isolated
after a 10-h dark period. F, Concentrations of PO432 in chloroplasts
isolated after a 4-h light period. G, Concentrations of starch in leaf tis-sue. The results are means 6 SE (n = 4, each with more than fourtechnical replicates), and different letters represent statistically signifi-cant changes (P , 0.05) using one-way ANOVA and Tukey’s multiplecomparison test. FW, Fresh weight.
Plant Physiol. Vol. 177, 2018 275
Phosphorus Deficiency and Photosynthetic Machinery
www.plantphysiol.orgon May 7, 2018 - Published by Downloaded from Copyright © 2018 American Society of Plant Biologists. All rights reserved.

2008) or used knockout mutants of the Arabidopsisthylakoid membrane Pi transporter PHT4;1 (Karlssonet al., 2015). Unlike previous publications, we quanti-fied the Pi concentration of isolated chloroplasts fromP-deficient plants. Such quantification is not trivial, andthe values obtained may not exactly reflect the truein vivo values, since some loss of Pi during the extrac-tion process is unavoidable. However, we found it en-couraging that Pi concentrations from both light- anddark-adapted chloroplasts showed the same trendrelative to the control, P-deficient, and P-resuppliedtreatments. This provides confidence that the analyticalprocedure used here is able to reflect the dynamics ofchloroplast Pi when plants were exposed to the treat-ments.
The results presented here indicate that the biologicalmechanisms reflected by the I-step were achieved byadjusting the P availability in the nutrient solution toobtain physiologically relevant P deficiency responsesat the whole-plant level. The establishment of latentP-deficient plants successfully induced a series of fullyreversible, but marked, disturbances in the electronflow to PSI and the synthesis of ATP and NADPH. Thisexperimental design allowed us to study how thephotosynthetic machinery adapts to long-term P star-vation and how rapidly it responds to P resupply andallowed us to construct a biological model summariz-ing the cascade of events resulting from P deficiency.
P Deficiency Affects Electron Transport beyond PQH2
P deficiency can be detected based on depletion of theI-step from the fast OJIP region of the chlorophyll a fluo-rescence transient (Fig. 2A). In fact, the response is sosensitive to the leaf tissue P concentration that it can beused to accurately predict bioavailable P in bothmonocotsand dicots (Frydenvang et al., 2015). Several hypotheseshave been proposed to explain the biological mechanismsunderlying the polyphasic OJIP fluorescence curve.However, despite the general agreement that theO-J phasereflects the light-driven accumulation of QA
2 (also knownas the QA model; Strasser and Govindjee, 1992), the
explanation for the J-I-P phase is still speculative andcontroversial. The predominant theoretical interpreta-tions of the J-I-P phase include fluorescence quenching bythe oxidized PQ pool (Lavorel and Etienne, 1977), light-driven accumulation of Q
B
2 and QB22 (Strasser and
Govindjee, 1992), reduction of QB and PQ by PSII(Srivastava et al., 1995), direct contributions from PSIfluorescence (Franck et al., 2002), and PSI oxidation(Schansker et al., 2005). It has been suggested that thedifference in Dc could modulate the I-P phase and that itlargely influences the fluorescence yield of the J-I-P phase(Vredenberg, 2004; Antal et al., 2011).
The results presented here indicate that the biologicalmechanisms reflected by the I-step, which is highlyresponsive to changes in the leaf tissue P concentration,originate from restricted downstream PQH2 oxidation.Measurements of the PQ pool redox state confirmed anincreased fraction of reduced PQH2 in P-deficient plants(Table II). The I-step disappeared when leaves wereinfiltrated with DBMIB to inhibit PQH2 oxidation at theCyt b6 f complex, and similar transients were obtainedwhen bypassing the transient FNR block using MV(Fig. 3A). Comparable observations were reported in aprevious study (Schansker et al., 2005) that infiltratedpea (Pisum sativum) leaves with DBMIB and MV. Theauthors stated that a distinct I-P phase required electrontransfer beyond the Cyt b6 f complex (blocked byDBMIB) and a transient block at the acceptor side of PSI(bypassed by MV). We note that, besides the inhibitionof PQH2 oxidation at the QO-binding site of the Cyt b6 fcomplex, DBMIB also might quench chlorophyll ex-cited states of the PSII antenna and act as a PSII electronacceptor, thereby decreasing the reduction of the PQpool (Belatik et al., 2013). However, with the clear dif-ferences between infiltration with DCMU and DBMIB(Fig. 3A) and because no effects were observed on thequantum yield efficiency (data not shown), we areconvinced that DBMIB specifically inhibited PQH2 ox-idation under the conditions given in this infiltrationstudy. The two Arabidopsis PSI mutants, psad1-1 andpsae1-3, also display severely reduced I-steps, whichmay reflect the pronounced reductions in the PSI
Figure 5. ATP synthase activity and pmf partitioning in barley. A, Relative thylakoid proton conductivity, which reflects theactivity of ATP synthase. B, Relative pmf partitioning in control, P-deficient, and P-resupplied barley plants. Values aremeans6 SE
(n = 5, each with more than four technical replicates), and different letters represent statistically significant changes (P , 0.05)using one-way ANOVA and Tukey’s multiple comparison test. Greek letters indicate statistical differences in DpH, and Romanletters indicate differences in DC.
276 Plant Physiol. Vol. 177, 2018
Carstensen et al.
www.plantphysiol.orgon May 7, 2018 - Published by Downloaded from Copyright © 2018 American Society of Plant Biologists. All rights reserved.

subunits PsaD1 and PsaE1, respectively, that markedlyimpair photosynthetic electron flow (Ihnatowicz et al.,2004, 2007; Fig. 3B).These combined results indicate that the inflection at
the I-step remains intact when transient equilibrium isattained between PSII-mediated reduction of the PQpool and its oxidation by the Cyt b6 f complex via elec-tron flow to PSI. The further rise to reach maximumfluorescence at the P-step is achieved when PSI electronacceptors are completely reduced due to a transientblock caused by temporarily inactivated FNR, which isinduced by the dark adaptation performed before themeasurements (Stirbet and Govindjee, 2012). Conse-quently, reduced inflection at the I-step (and eventuallyelimination of the I-step) reflects slower electron flow toPSI electron acceptors (Stirbet et al., 2014). This wasconfirmed by analysis of the P700+ reduction rate insimilarly dark-adapted plants, which was markedlyslower for P-deficient plants than for control plants(Supplemental Fig. S6). Previous work showed that therate-limiting step in electron transport between the twophotosystems is determined by PQH2 oxidation at theCyt b6 f complex (Tikhonov, 2014). Electron flow to PSIis reduced when the PQH2 oxidation rate decreases,which reduces the inflection at the I-step.Analysis of steady-state P700+ reduction rates re-
vealed a higher rate of P700+ reduction in P-deficientplants at growth light conditions (Fig. 7A), suggestingthat P deficiency up-regulates electron transfer rates inPSI under continuous growth light (Fig. 6C), while PSII
is down-regulated (Table I; Fig. 6B). Since linear electronflow was down-regulated in growth light (Table I) andgiven that electron transfer rates in PSI reflect the sumof linear (originating from PSII) and cyclic electronflow, the results suggest that cyclic electron flow isup-regulated at steady-state growth light conditions inP-deficient plants. Electron transfer rates of PSI remainedsimilar to those of the control in low light (SupplementalFig. S7; Supplemental Table S3) but became highlydown-regulated in high light (Figs. 6C and 7B), whenlumenal pH is expected to significantly acidify.
P Deficiency Alters ATP and NADPH Synthesis
In contrast to the highly dynamic Pi levels observedat the leaf tissue level, we observed strong homeostaticregulation of the chloroplast Pi pool (Fig. 4, D–F). Pdeficiency resulted in a marked 4-fold decrease in leaftissue Pi, whereas Pi in isolated chloroplasts was re-duced by only approximately 20% to 40% dependingon whether plants were dark or light adapted prior toextraction, respectively. These results suggest thatvacuoles contain a storage pool of nonmetabolic Piunder adequate P conditions, whereas most of the Pi issequestered in the metabolic pool in chloroplasts underP-deficient conditions (Lauer et al., 1989). Three Pitransporter families are localized in the chloroplast tosupply Pi in the stroma, where PHT4;1 is the onlytransporter localized in the thylakoid membrane.
Figure 6. The qE and electron transfer rates at different light intensities in barley. Light-adapted barley plants were exposed toincreasing light intensities (red actinic light with a wavelength of 620 nm), starting at growth light. A, The qE component of NPQ.B, ETR(II). C, ETR(I). Values aremeans6 SE (n= 4–5, eachwithmore than four technical replicates). PAR, Photosynthetically activeradiation.
Table I. Photosynthetic parameters measured under steady-state growth light conditions
The plants were light adapted in growth light (300 mmol photons m22 s21) for a minimum of 8 h and measured afterward using the Leaf Pho-tosynthesis MultispeQ V1.0 protocol with the MultispeQ from PhotosynQ. The results are means 6 SE (n = 4–5, each with more than four technicalreplicates), and different letters represent statistically significant changes (P , 0.05) using one-way ANOVA and Tukey’s multiple comparison test.ɸ(II), PSII quantum yield; ɸ(NPQ), NPQ quantum yield; LEF, linear electron flow; qP, fraction of open reaction centers; NPQt, NPQ estimationwithout dark adaptation; ɸ(NO), fraction of energy absorbed by PSII that is lost to unregulated processes.
Treatment ɸ(II) ɸ(NO) ɸ(NPQ) LEF qP NPQt
Control 0.53 6 0.01 a 0.31 6 0.01 a 0.16 6 0.01 a 79.48 6 3.66 a 0.69 6 0.02 a 0.54 6 0.02 aP deficient 0.30 6 0.02 b 0.13 6 0.01 b 0.57 6 0.03 b 45.22 6 4.29 b 0.60 6 0.02 b 5.11 6 0.69 bP resupply 0.47 6 0.02 a 0.33 6 0.02 a 0.19 6 0.01 a 77.39 6 3.09 a 0.63 6 0.03 a,b 0.60 6 0.03 a
Plant Physiol. Vol. 177, 2018 277
Phosphorus Deficiency and Photosynthetic Machinery
www.plantphysiol.orgon May 7, 2018 - Published by Downloaded from Copyright © 2018 American Society of Plant Biologists. All rights reserved.
Furthermore, a limitation in ATP synthase and reducedgrowth has only been demonstrated for PHT4;1 mu-tants (Karlsson et al., 2015). PHT4;1 mediates theavailability of Pi for ATP synthesis in the chloroplaststroma (Karlsson et al., 2015), and it is likely that the Piconcentration in chloroplasts is regulated by effectivephosphate homeostasis to maintain ATP synthesis anddrive the Calvin cycle (Mimura et al., 1990).
Pi in the chloroplast stroma functions as a substratefor ATP synthesis. P deficiency significantly reduces Pilevels and significantly reduces ATP production inisolated thylakoids (Fig. 4C). This was further sup-ported by significant reductions in the rate constant ofATP synthase (Fig. 5A) as a response to the low Piconcentration in chloroplasts. These observations con-firmed the modulated response of ATP synthase ac-tivity tometabolic or physiological conditions, allowingthe regulation of light and assimilatory reactions(Strand and Kramer, 2014). The NADP+ levels, acting asa substrate for the production of NADPH, also werereduced significantly by P deficiency (Fig. 4A), indi-cating that a larger fraction of NADP+ remains in thereduced form (NADPH), because it cannot be utilizedin the Calvin cycle due to ATP limitation and because ofa higher PSI activity (Fig. 7A). This hypothesis wassupported by the total NADPH concentration, whichwas significantly higher for the P-deficient treatmentthan for the control and P-resupply treatments (Fig. 4B).
The Km for ATP synthase is expected to range between0.6 and 1mM Pi; therefore, lowering the Pi concentration inthe chloroplast stroma to levels nearKm is expected to slowATP synthesis and increase DpH (Takizawa et al., 2008).Assuming a chloroplast volume of 25mLmg21 chlorophyll
(Sharkey and Vanderveer, 1989), the Pi concentrations forchloroplasts extracted after light adaptation correspond to1.1 and 0.7mMPi for the control andP-deficient treatments,respectively,which is in the same range as previous reportsusing colorimetric assays (Robinson and Giersch, 1987;Sharkey and Vanderveer, 1989; Fig. 4E) and clearly withinthe range that would affect ATP synthesis. Thus, our re-sults show that ATP synthase activity is very sensitive tochanges in the Pi concentration in chloroplasts and thateven minor reductions in stromal Pi concentration have amajor influence on ATP synthase activity, which stronglyreduces proton efflux from the lumen.
P Deficiency Induces Lumen Acidification and PreventsPQH2 Oxidation
The reduced rate constant of ATP synthase underP-deficient conditions limits the export of protons to thechloroplast stroma, thereby markedly acidifying thethylakoid lumen (Fig. 5B). As a consequence, the PQH2oxidation at the Cyt b6 f complex was impaired for theP-deficient plants (Table II), which further decreasedthe linear electron flow toward PSI (Table I). This lumenacidification also was reflected by a much fasterquenching of the chlorophyll a fluorescence intensityafter reaching its maximum (Fig. 2A), an increase in qE(Fig. 6A), and a higher NPQ (Table I; Supplemental Fig.S5). These observations were further supported by thePSMT decay phase of the extended chlorophyll a fluo-rescence transient (Supplemental Fig. S4). In addition toincreased fluorescence quenching, chlorophyll a fluo-rescence transients of P-deficient plants also lacked theS-step. A previous study of isolated chloroplasts of pealeaves identified a linear relationship between P-Squenching and lumen acidification (Briantais et al.,1979), and a more recent study concludes that forma-tion of the S-step is associated with increased DpH(Goltsev et al., 2016). These combined data stronglysupport our hypothesis that P deficiency at physiolog-ically relevant concentrations causes lumen acidifica-tion in both light- and dark-adapted plants.
A reduction in lumen pH provides the key signal toregulate light capturing via NPQ components (Ruban,2016), and this study confirmed the relationship betweenNPQ and lumen acidification induced by P deficiency
Table II. The plastoquinone (PQ) pool redox state in barley leaves
Estimation of the fraction of reduced PQ was determined using OJIPtransients. The results are means 6 SE (n = 4, each with four technicalreplicates), and different letters represent statistically significantchanges (P , 0.05) using one-way ANOVA and Tukey’s multiplecomparison test.
Treatment Fraction of PQH2
Control 0.27 6 0.01 aP deficient 0.36 6 0.02 bP resupply 0.28 6 0.01 a
Figure 7. P700+ reduction kinetics inbarley. A, P700+ reduction in growthlight conditions. B, P700+ reduction inhigh-light conditions. Plants were lightadapted for more than 2 h prior tomeasurements, then preilluminatedwith red actinic light (620 nm) for 3 min,followed by a 10-ms dark pulse. Theplotted transients are averaged (n = 5,each with more than four technicalreplicates). A.U., Arbitrary units.
278 Plant Physiol. Vol. 177, 2018
Carstensen et al.
www.plantphysiol.orgon May 7, 2018 - Published by Downloaded from Copyright © 2018 American Society of Plant Biologists. All rights reserved.

(Table I; Supplemental Fig. S5). These adaptive mecha-nisms enhance the dissipation of excess energy capturedby the light-harvesting antenna to protect the photosyn-thetic apparatus (Stirbet and Govindjee, 2011). Theoxygen-evolving complex of PSII is particularly affectedby lumen acidification (Schlodder and Meyer, 1987). ThePSII quantum yield determined from chlorophyll a fluo-rescence transients of dark-adapted leaves was not af-fected by P deficiency (Fig. 2A). However, to determinethe influence ofDpHonPSII quantumyield andETR(II) inlight, we also performed measurements on light-adaptedleaves (Table I; Fig. 6B). Here, it is clearly evident that thePSII quantum yield is reduced markedly by P deficiencybut recovers after a subsequent dark-adaption period,which highlights the highly reversible response to P defi-ciency in plants.
CONCLUSION
The reversible nature of the disruptions in photo-synthesis caused by P deficiency allows us to build acomprehensive biological model summarizing the ef-fects of P deficiency on photosynthesis (Fig. 8). P is thesubstrate for ATP synthesis in the chloroplast stroma.When the Pi substrate is lacking due to low P avail-ability (Figs. 1 and 4, D–F), ATP synthase activity de-creases (Fig. 5A), which reduces ATP production in thestroma andCO2fixation (Figs. 4C and 8B, steps 1 and 2).Reduced ATP synthase activity reduces the flow ofprotons from the thylakoid lumen to the chloroplaststroma, which causes lumen acidification (Figs. 5B and8B, step 3). Lumen acidification triggers energy dissi-pation via NPQ (Table I; Supplemental Fig. S5), wherethemajor andmost rapid component (qE) is responsible
Figure 8. Photosynthetic regulation in re-sponse to P deficiency at growth lightconditions. A, Photosynthetic electronflow under P-sufficient conditions. B,Feedback mechanisms responsible for re-duced electron flow from PSII to PSI underP-deficient conditions. See text for furtherexplanation of the cascade of eventshighlighted in steps 1 to 7. OEC, Oxygen-evolving complex.
Plant Physiol. Vol. 177, 2018 279
Phosphorus Deficiency and Photosynthetic Machinery
www.plantphysiol.orgon May 7, 2018 - Published by Downloaded from Copyright © 2018 American Society of Plant Biologists. All rights reserved.

for the efficient quenching of fluorescence (Figs. 2A and6A; Supplemental Fig. S4) and reduces the PSII quan-tum yield (Table I; Figs. 6B and 8B, step 4; SupplementalFig. S5). Acidification of the thylakoid lumenwas foundto decelerate PQH2 oxidation at the Cyt b6 f complex(Table II; Fig. 8B, step 5) and is likely to represent abottleneck in overall electron transport from PSII to PSI(Tikhonov, 2013; Strand and Kramer, 2014). This causesprotonation of the donor side of Cyt b6 f and reducesthe probability of PQH2 oxidation, ultimately reducingthe linear electron flow to PSI (Tikhonov, 2014; Table I;Fig. 6B). Finally, P700+ reduction is either decreasedunder high light (2,200 mmol photons m22 s21; Fig. 7B)or increased in steady-state growth light (300 mmolphotons m22 s21; Figs. 7A and 8B, step 6), which ulti-mately increases the NADPH levels (Figs. 4, A and B,and 8B, step 7). Thus, depletion of the I-step phasefrom the OJIP region of the chlorophyll a fluorescencetransient under P deficiency is likely to reflect a re-stricted PQH2 oxidation due to the proton backlogcaused by lumen acidification.
MATERIALS AND METHODS
Plant Cultivation and Sampling
Barley (Hordeum vulgare ‘Quench’) plants were cultivated in hydroponics asdescribed previously (Frydenvang et al., 2015). Barley seeds were pregerminated invermiculite in a greenhouse with minimum day/night temperatures of 18°C/15°Cand a day/night cycle of 16 h/8 h (minimum 300 mmol photons m22 s21 light in-tensity).After 7d, four seedlingswereplaced in a lid, transferred to a 4-Lhydroponiccontainer, and kept at the same climatic conditions throughout the whole experi-ment. Control plants were supplied with a nutrient solution containing 200 mM
KH2PO4, 200 mM K2SO4, 300 mM MgSO4$7H2O, 100 mM NaCl, 300 mM
Mg(NO3)2$6H2O, 900 mM Ca(NO3)2$4H2O, 600 mM KNO3, 50 mM Fe(III)-EDTA-Na,2 mMH3BO3, 0.8 mM Na2MoO4$2H2O, 0.7 mM ZnCl2, 1 mMMnCl2$4H2O, and 0.8 mM
CuSO4$5H2O. The P-deficient plants were supplied with the same nutrient solutionas stated above, but with only 9 mM KH2PO4, throughout the growth period. Allnutrients were prepared in Milli-Q water (Milli-Q Element; Millipore). The nutrientsolutions were changed weekly and aerated using steel medical syringes, and thepH of the solution was maintained at 6 6 0.3 using ultrapure HCl.
Four containers holding a total of 16 plants received the full nutrient solutionthroughout the experiment (control), and eight containers holding a total of32 plants received the P-deficient solution. After either 21 or 25 DAP, fourP-deficient containers holding a total of 16 plants were resupplied with P cor-responding to the control level (200 mM KH2PO4) and the remaining four con-tainers continued to receive the P-deficient solution. All plants were harvestedat 28 DAP, either 3 or 7 d after P resupply. Each treatment included four hy-droponic pots containing four barley plants each (i.e. 16 plants for each treat-ment). All plants were kept in a dark room the night before harvest, exposed to1 h of light, and then harvested. One YFEL from each plant was dried and usedfor elemental analysis, one YFEL was used directly to determine the NADP+
concentration, and one YFEL was harvested after 8 h of growth conditions forstarch determination. The remaining YFELs were harvested 1 h after the onsetof light, quickly frozen in liquid nitrogen, and subsequently used to isolatethylakoid membranes. An identical treatment of plants was used entirely forisolating chloroplasts. Chlorophyll a fluorescence was measured before Presupply at 21 DAP and before harvest at 28 DAP, when pulse amplitudemodulation measurements also were performed. All analyses were performedwith a minimum of four biological replicates.
Arabidopsis Mutants
Seeds of Arabidopsis (Arabidopsis thaliana) mutants psad1-1 (Ihnatowiczet al., 2004) and psae1-3 (Ihnatowicz et al., 2007) and the wild type were sowndirectly in pots (5.5 cm diameter) containing prewetted Pindstrup Substrate No.
2 (Pindstrup Mosebrug) in a climate chamber with minimum day/night tem-peratures of 23°C/18°C and a day/night cycle of 8 h/16 h (150 mmol photonsm22 s21 light intensity). The pots were sealed during the first 7 d to increasehumidity and were watered when needed. Chlorophyll a fluorescence tran-sients were measured after 6 weeks of growth.
Chlorophyll a Fluorescence, P700, and ECS
Chlorophyll a fluorescence transients (OJIP transients) were obtained fromYFELs using a Handy PEA chlorophyll fluorometer (Hansatech Instruments).The YFEL midsection was dark adapted for at least 25 min before measure-ments, which were obtained using Hansatech leaf clips, and a short nonactiniclight flash was applied to the leaf to adjust the detector gain. Each leaf samplewas illuminated with continuous saturating actinic light (3,000 mmol photonsm22 s21) from three LEDs, and the fluorescence transients were recorded usinga PIN photodiode. The fluorescence signal was measured for either 2 or 10 s. Tomeasure the slow PSMT phase, the incident light was 1,000mmol photonsm22 s21
and the fluorescence transient was measured for 30 s. All transients were doublenormalized between F0 and Fm to give the relative variable fluorescence at time tas follows: V(t) = [Fluorescence (t) 2 F0]/(Fm 2 F0).
ECS, pulse amplitude-modulated chlorophyll a fluorescence, and P700 mea-surements were carried out using a Walz Dual-PAM 100 equipped with P515/535, DUAL-DB, and DUAL-E emitter-detector modules. The rate constant of ATPsynthase (gH
+ s21) and pmf partitioning (DC and DpH) was determined on plantsthat were dark adapted for a minimum of 1 h followed by 1 min of illuminationwith actinic red light of 339 mmol photons m22 s21. The g
H
+ parameter was cal-culated as 1/decay time constant, which was derived from single exponentialfittings of the ECSdecay signal during an 80-ms dark pulse (Cruz et al., 2005) after1 min of illumination. pmf (ECST) partitioning to DC (ECSSS) and DpH (ECSINV)was calculated froma 60-s dark interval relaxation kinetics of the ECS signal (Cruzet al., 2001). ECST was calculated as the difference between the ECS signal in lightand the minimum value of the ECS signal after the light was turned off. Calcu-lation of ECSSS and ECSINVwas performed using either the steady-state timepointof the ECS signal in darkness or the time point before the ECS signal decays againdue to changes in pigment composition. For calculation of the results presented inFigure 5B, see Supplemental Figure S8. Before each ECS measurement, a satu-rating 50-ms flash of 200,000 mmol photons m22 s21 was applied to determine theECS50ms; subsequently, the ECS50ms amplitude was used to normalize the darkinterval relaxation kinetics ECS signal before calculation of pmf size and parti-tioning values. Therefore, DDA550-515 represents the normalized ECS signal toECS50ms. NPQ and PSII quantum yield were measured using plants that had beendark adapted for 30min, illuminatedwithhigh light (1,700mmol photonsm22 s21)for 5 min, and then held for 4 min of dark relaxation. qE was calculated as thedifference between NPQ after 3 min of illumination and NPQ after 5 min ofsubsequent dark adaptation. P700 oxidation-reduction kinetics were recordedon plants that had been dark adapted for a minimum of 1 h, illuminatedwith far-red light for 30 s, and then saturated with a pulse of actinic red light(20,000 mmol photons m22 s21) for 1 s. ETR(I) was calculated as nP700 s21
according to Strand et al. (2017) by fitting a linear function on the initial decayof the P700 signal upon applying a dark pulse. nP700 s21 was determinedon leaves preilluminated with actinic red light (620 nm; Figs. 6C and 7;Supplemental Fig. S7) or actinic red light and far-red light (730 nm;Supplemental Fig. S7). State transition was carried out according to Lundeet al. (2000) at 60 mmol photons m22 s21; the qS parameter was calculatedaccording to Damkjaer et al. (2009).
Leaf Infiltration with P and Chemical Electron Inhibitors
The YFELs of 28-d-old P-deficient barley plants were cut into 5-cm sectionsand immersed in 1 M KH2PO4 containing 0.2 mL L21 Tween 20 for 1 h. Then, theleaf sections were removed from the immersion solution and gently wiped toremove excess moisture, placed in a zip bag, and dark adapted for 25 min. As acontrol, leaves from the same plant treatment were immersed in Milli-Q watercontaining 0.2 mL L21 Tween 20.
YFELs of 28-d-old control barley plants were infiltrated with 200 mM
DCMU, 900 mM DBMIB, or 200 mM MV as described previously (Schanskeret al., 2005). DCMU and DBMIB were solubilized in 1% (v/v) ethanol. Theleaves were cut into 3-cm sections and immersed in the respective solutionsfor 3 h. Subsequently, the sections were placed in zip bags and darkadapted for 25 min before recording chlorophyll a fluorescence. Controlleaves were treated in the same way without adding the chemical electroninhibitors.
280 Plant Physiol. Vol. 177, 2018
Carstensen et al.
www.plantphysiol.orgon May 7, 2018 - Published by Downloaded from Copyright © 2018 American Society of Plant Biologists. All rights reserved.

NADP+ and NADPH Assays
The NADP+ concentration was determined as described previously (Quevaland Noctor, 2007), and every step was performed at 4°C. A total of 100 mg offresh YFELs from each replicated treatment was harvested at 28 DAP andrapidly frozen in liquid nitrogen. Then, 1 mL of ice-cold 0.2 N HCl was added toa mortar with quartz sand, and the plant material was thoroughly ground andcentrifuged at 16,000g for 10 min at 4°C. A 0.2-mL aliquot of the supernatantwas incubated in boiling water for 1 min and then rapidly cooled. The aliquotwas neutralized by adding 20 mL of 0.2 M NaH2PO4 (pH 5.6), followed bystepwise addition of 0.2 M NaOH to reach a final pH of between 5 and 6. Then,30mL of the neutralized supernatant was introduced to a 96-well plate, inwhicheach well contained 0.1 mL of 0.1 M HEPES (pH 7.5) and 2 mM EDTA, 20 mL of1.2 mM dichlorophenolindophenol, 10 mL of 20 mM phenazine methosulfate,10 mL of 10 mM Glc-6-P, and 30 mL of Milli-Q water. NADP+ concentrationsranging from 0 to 100 pmol were used as standards. The reactionwas started byadding 10 mL of Glc-6-P dehydrogenase (200 units mL21), the plate was swirledrapidly and placed on an EON microplate spectrophotometer (BioTek Instru-ments), and the A600 was measured every 23 s for 5 min. The rates during thefirst 2 min were used to determine the final NADP+ concentration according tothe relevant standards and blank correction.
The NADPH concentration was determined using the NADP/NADPHQuantification Kit (Sigma-Aldrich; catalog no. MAK038) following the protocolfrom the manufacturer. An EON microplate spectrophotometer (BioTek In-struments) was used to measure the A450 after 2 h of incubation.
Isolation of Thylakoid Membranes
All extractions were performed at 4°C under dim-green light conditions tomaintain thylakoid integrity. Frozen YFELs were homogenized in 200 mL of buffersolution containing 0.4 M Suc, 10 mM NaCl, 5 mM MgCl2, 20 mM Tricine (pH 7.9),10mM L-ascorbate, and 10mMNaF using a laboratory blender (Waring Laboratory;LB20E). The homogenate was filtered through a double layer of Miracloth (poresize, 22–25mm). The extracts were centrifuged for 10min at 6,000g, the supernatantwas discarded, and the pellet was resuspended in 5mM Tricine (pH 7.9) and 10mM
NaF. The washed thylakoids were pelleted by centrifugation for 10 min at 11,200gand resuspended in a storage solution containing 0.4 M Suc, 10 mM NaCl, 5 mM
MgCl2, 20 mM Tricine (pH 7.9), 10 mM NaF, and 20% (v/v) glycerol. The sampleswere immediately frozen in liquid nitrogen and stored at 280°C.
Determination of Protein and Chlorophyll Contents inThylakoid Membranes
The protein content in the isolated thylakoid membranes was determinedusing the Pierce BCA Protein Assay Kit (Thermo Fisher Scientific), and an EONmicroplate spectrophotometer (BioTek Instruments) was used to measure theA562. To determine the chlorophyll concentration, 5 mL of the isolated thylakoidmembranewas diluted in 995mL of ice-cold 80% (v/v) acetone, incubated on icefor 15 min, and centrifuged for 2 min at 10,000g in a tabletop microcentrifuge(Eppendorf Minispin Plus) to pellet proteins. The absorbance at 647 and 664 nmwas measured using a Genesys 10S UV-VIS spectrophotometer (Thermo FisherScientific), and the total chlorophyll concentration (mg mL21) was calculated as(17.763A647) + (7.343A664) multiplied by the dilution factor (Porra et al., 1989).
Chloroplast Isolation
Plantswere eitherdarkadapted for 10hor light adapted atgrowth conditionsfor 4 h prior to isolation. All extractionswere performed at 4°C under dim-greenlight conditions. All YFELs from each replicate were cut into 3- to 4-cm sections,placed in a blender containing 200 mL of ice-cold HS buffer (50 mM HEPES and330 mM sorbitol, adjusted to pH 8 with KOH pellets), and rapidly blended withthree quick bursts. The homogenate was filtered through a double layer ofMiracloth (pore size, 22–25 mm) and centrifuged at 3,300g for 2 min in a swingrotor (Heraeus Megafuge 16R; Thermo Fisher Scientific) with slow accelerationand without brakes for deceleration. The supernatant was carefully discarded,and the tubes were rolled on ice to loosen the pellets. Then, 1 mL of HS bufferwas added, and the suspension was layered onto a precooled Percoll padcontaining 2 mL of 53HS buffer, 3.5 mL of Percoll, and 4.5 mL of Milli-Q waterand centrifuged at 1,400g for 8 min in a swing rotor. The green middle layer(containing thylakoids and broken chloroplasts) and the Percoll were removedcarefully, leaving the pelleted intact chloroplasts. The pellet was suspended in
10 mL of HS buffer and centrifuged at 3,000g for 2 min in a swing rotor. Thesupernatant was discarded, and the pellet was suspended in 700 mL of HSbuffer and stored at 280°C until use.
Determination of Chlorophyll Content inIsolated Chloroplasts
Thechlorophyll concentration in the isolated chloroplastswasdeterminedbyadding 10mL of chloroplasts to 990mL of ice-cold 80% (v/v) acetone, mixing thesolution, and centrifuging for 30 s at 10,000g in a tabletop microcentrifuge(EppendorfMinispin Plus) to pellet the proteins. TheA652 wasmeasured using aGenesys 10S UV-VIS spectrophotometer (Thermo Fisher Scientific). The chlo-rophyll concentration (mg mL21) was determined using the following equation:A652 3 5.6 (Robinson and Mant, 2002).
Determination of the PQ Pool Redox State
Anoninvasive assay of the PQ pool redox state was performed following theprotocol from Tóth et al. (2007). To obtain fully reduced PQ pools, OJIP tran-sients were measured at saturating actinic light (3,000 mmol photons m22 s21) asdescribed above. To obtain fully oxidized PQ pools, leaves were preilluminatedwith far-red light (200 mmol photons m22 s21) for 10 s, and a second OJIPtransient was measured immediately after. From the first OJIP transient, the FJ(fluorescence intensity after 3-ms J-step) and Fm values were extracted, whereasthe FJ-ox (representing the fully oxidized PQpool at 3ms) was extracted from thefar-red light treatment. The fraction of reduced PQ was calculated using thefollowing equation: (FJ 2 FJ-ox)/(Fm 2 FJ-ox), where 0 and 1 represent a fullyoxidized and a fully reduced PQ pool, respectively.
ATP Assay
ATP concentrations were determined in thylakoid membranes as describedpreviously (Grennan and Ort, 2011). A thylakoid membrane aliquot containing20 mg of chlorophyll was resuspended in 1 mL of buffer containing 500 mM
Tricine-NaOH (pH 8), 500 mM NaCl, 5 mM MgCl2, 0.05 mM phenazine metho-sulfate, 2 mM K2HPO4 (pH 7), 1 mM ADP (ATP free), and 0.1 mM diadenosinepentaphosphate. The reaction was carried out with incident light at 300 mmolm22 s21 for 2 min at room temperature. Then, the light was switched off and thereaction was stopped by adding trichloroacetic acid to a final volume of 0.5%(w/v). The samples were centrifuged at 11,200g for 5 min at room temperature.The supernatant was assayed for ATP concentration by measuring chemilu-minescence using a ChemiDoc Touch Imaging System (Bio-Rad). A 100-mLaliquot of the supernatant was added to a 96-well plate, and 100 mL of a secondbuffer containing 25 mM Tris acetate (pH 7.75), 2 mM EDTA, 50 mM DTT,0.02 mM D-luciferin, 1.5 mg mL21 BSA, 20 mM magnesium acetate, and 0.3 mgmL21 luciferase was quickly added to each well. The chemiluminescence wasmeasured during a 20-min period, and the signal was integrated using ImageLab software (version 5.2.1; Bio-Rad). The same reaction mix was used to de-termine ATP standards dissolved in 25 mM Tris acetate (pH 7.75).
Pi Quantification
Pi was quantified by HPLC as described previously (Hawkesford et al.,2013). A total of 100 mg of dried YFEL material was added to 1.5 mL of Milli-Qwater and heated in a heating block at 80°C for 4 h with frequent shaking. Toquantify Pi in isolated chloroplasts, a chloroplast preparation containing 20 mgof chlorophyll in 200 mL of HS buffer was heated directly in a heating block at80°C for 4 h. The samples were allowed to cool and then centrifuged at roomtemperature at 13,000g for 20 min. The supernatant was transferred to a 2-mLEppendorf tube and placed at220°C overnight. After thawing, the sample wascentrifuged as before, and the supernatant was filtered using a 0.22-mm cen-trifuge tube filter (Spin-X; Costar) at 2,000g for 20 min. This sample was injectedonto the HPLC column.
The samples were analyzed on the HPLC Dionex ICS-2100 Anion (ThermoFisher Scientific) column using the Dionex AS-AP autosampler, Dionex EGC IIIKOH eluent generator, AERS 2-mm suppressor, and DS6 heated conductivitycell. Anions were separated on a Dionex IonPac AS11-HC RFIC analyticalcolumn (23 250 mm)with a Dionex IonPac AG11-HC RFIC guard (23 50mm)column in front, with 0.38 mL min21 isocratic flow of 25 mM hydroxide for15 min. The suppressor was set to 24 mA, and 25 mL was injected per sample.
Plant Physiol. Vol. 177, 2018 281
Phosphorus Deficiency and Photosynthetic Machinery
www.plantphysiol.orgon May 7, 2018 - Published by Downloaded from Copyright © 2018 American Society of Plant Biologists. All rights reserved.

The standard curve was generated with five concentrations of Dionex Com-bined Seven Anion Standard I (Thermo Fisher Scientific) from 0.15 to 2 mg L21
in HS buffer. Chromeleon 7.2 SR4 software was used for instrument control anddata processing.
Starch Quantification
The starch concentrationwasdetermined asdescribedpreviously (Smith andZeeman, 2006). Frozen YFELs were ground to a fine powder, 5 mL of 80% (v/v)ethanolwas added, and the samplewas placed in a boilingwater bath for 3min.The sampleswere centrifuged at 3,000g for 10min at room temperature, and thesupernatant was discarded. The ethanol extraction was repeated another twotimes, and the ethanol was allowed to evaporate from the final pellet. The pelletwas transferred to a mortar, homogenized to a smooth consistency, andtransferred to a Falcon tube along with 5 mL of Milli-Q water that was used towash the mortar. Then, 0.5 mL of the homogenate was added to each of fourEppendorf tubes and heated at 100°C for 10 min. The samples were allowed toreach room temperature, and then 0.5 mL of 200 mM sodium acetate (pH 5.5)was added. In another tube, 6 units of a-amyloglucosidase and 0.5 units ofa-amylasewere dissolved in buffer containing 0.05mMTris base, 0.15mMNaCl,and 0.1% Tween 20 (pH adjusted to 7.6 using HCl); 1.2 mL of this enzymepreparation was added to two of the prepared Eppendorf tubes. The other twoEppendorf tubes were used as controls, which received 1.2mL of buffer withoutthe enzymes. The samples were incubated at 37°C for 4 h and centrifuged at10,000g for 5 min at room temperature. The supernatant was assayed for Glcusing a Glucose (HK) Assay Kit (Sigma-Aldrich). The assay reagents weremixed, and the reactions were incubated for 15 min at room temperature beforemeasuring the A340 using a Genesys 10S UV-VIS spectrophotometer (ThermoFisher Scientific).
Immunoblot Analysis
Thylakoid samples (containing 5 mg of protein) were subjected to SDS-PAGE using 12% Criterion TGX Stain-Free precast gels (Bio-Rad) and Tris/Gly/SDS running buffer (Bio-Rad) at a constant voltage of 250 V for 30 min.The proteins were then transferred to a 0.2-mm PVDF membrane using theTrans-Blot Turbo Transfer System (Bio-Rad) according to the manufacturer’sinstructions. Subsequently, the membrane was blocked for 1 h in 5% (w/v)skimmed milk in PBS-T buffer and incubated overnight in the primary anti-body. All primary antibodies (FNR, FDX1, PsaA, PsaF, Cyt f, D1, and CP43)were obtained from Agrisera. The blot was washed three times for 5 min inPBS-T buffer and then incubated with a swine anti-rabbit horseradishperoxidase-conjugated secondary antibody (1:5,000 dilution in PBS-T; Pierce)for 1 h. The blot was washed three times for 5 min in PBS-T buffer, and thesecondary antibody was detected using Clarity Western ECL chemilumi-nescent substrate (Bio-Rad) and the ChemiDoc Touch Imaging System (Bio-Rad). The protein bands were detected and quantified using Image Labsoftware (version 5.2.1; Bio-Rad).
Transmission Electron Microscopy
The YFELs from three replicated treatments in both dark and light conditionswere used for transmission electron microscopy analysis. Leaf discs (122 mm2)were fixed in Karnovsky’s solution (4% [v/v] paraformaldehyde, 5% [v/v] glu-taraldehyde, and 0.1M sodium cacodylate buffer, pH 7.3) for 4 h andwashed threetimes with buffer (0.1 M sodium cacodylate buffer, pH 7.3). Samples were post-fixed with 1% [v/v] OsO4 overnight at 4°C. The samples were washed twice withbuffer and water and subsequently dehydrated with a graded acetone series. Theleaf samples were embedded in Spurr’s low-viscosity resin. Ultrathin sections of60 nmwere cut with a diamond knife using a Leica EM-UC7 ultramicrotome andmounted on Pioloform-coated copper grids. The samples were contrasted with1% [v/v] uranyl acetate and lead citrate and viewed using a Philips CM100transmission electron microscope at an acceleration voltage of 80 kV. The imageswere captured using a high-resolution Morada digital camera system.
Elemental Analyses
Leaf element concentrations were determined using inductively coupledplasma-optical emission spectroscopy (5100;Agilent Technologies) equippedwithaMeinhardnebulizer anda cyclonic spray chamber.TheYFELswereovendriedat
50°C until complete dryness and digested with ultrapure acids (70% [v/v] HNO3and 30% [v/v]H2O2) at 240°C and 200 bars for 15min in a pressurizedmicrowaveoven (Ultrawave; Milestone). Certified reference material (NIST1515, apple[Malus ssp.] leaf; National Institute of Standards and Technology)was included toevaluate data quality. Data were processed using Agilent ICP Expert software.
Data Analyses
Statistical analysis was performed using GraphPad Prism 6.0 for Windows.Each mean was compared using one-way ANOVA with Tukey’s multiplecomparison test. Samples were considered as significantly different at P, 0.05.
Supplemental Data
The following supplemental materials are available.
Supplemental Figure S1.Appearance of barley plants cultivated in hydroponics.
Supplemental Figure S2. Transmission electron microscopy of barley leaves.
Supplemental Figure S3. Immunoblot analysis of photosynthetic proteinsin barley leaves.
Supplemental Figure S4. OJIPSMT transients of the youngest, fully ex-panded leaves of barley plants.
Supplemental Figure S5. NPQ and PSII quantum yield in barley leaves.
Supplemental Figure S6. P700+ reduction kinetics in barley plants.
Supplemental Figure S7. P700+ reduction kinetics in barley under lowlight.
Supplemental Figure S8. Examples of analysis of raw data leading to thedata presented in Figure 5B.
Supplemental Table S1. Element concentrations in the YFELs.
Supplemental Table S2. Quantification of immunoblots of thylakoid pro-tein extracts.
Supplemental Table S3. State transition parameters and electron transferrates in low light.
ACKNOWLEDGMENTS
We thank Lena Byrgesen and Thomas H. Hansen for assistance with theinductively coupled plasma-optical emission spectroscopy analyses and BirgitAndersen for assistance with the HPLC measurements. Transmission electronmicroscopy was performed at the Center of Advanced Bioimaging, Universityof Copenhagen.
Received November 11, 2017; accepted February 25, 2018; published March 14,2018.
LITERATURE CITED
Antal TK, Osipov V, Matorin DN, Rubin AB (2011) Membrane potential isinvolved in regulation of photosynthetic reactions in the marine diatomThalassiosira weissflogii. J Photochem Photobiol B 102: 169–173
Baker A, Ceasar SA, Palmer AJ, Paterson JB, Qi W, Muench SP, Baldwin SA(2015) Replace, reuse, recycle: improving the sustainable use of phosphorusby plants. J Exp Bot 66: 3523–3540
Belatik A, Joly D, Hotchandani S, Carpentier R (2013) Re-evaluation of theside effects of cytochrome b6f inhibitor dibromothymoquinone onphotosystem II excitation and electron transfer. Photosynth Res 117:489–496
Briantais JM, Vernotte C, Picaud M, Krause GH (1979) A quantitativestudy of the slow decline of chlorophyll a fluorescence in isolatedchloroplasts. Biochim Biophys Acta 548: 128–138
Cordell D, Drangert JO, White S (2009) The story of phosphorus: globalfood security and food for thought. Glob Environ Change 19: 292–305
Cordell D, White S (2015) Tracking phosphorus security: indicators of phos-phorus vulnerability in the global food system. Food Secur 7: 337–350
Cruz JA, Avenson TJ, Kanazawa A, Takizawa K, Edwards GE, Kramer DM(2005) Plasticity in light reactions of photosynthesis for energy productionand photoprotection. J Exp Bot 56: 395–406
282 Plant Physiol. Vol. 177, 2018
Carstensen et al.
www.plantphysiol.orgon May 7, 2018 - Published by Downloaded from Copyright © 2018 American Society of Plant Biologists. All rights reserved.

Cruz JA, Sacksteder CA, Kanazawa A, Kramer DM (2001) Contribution ofelectric field (Δc) to steady-state transthylakoid proton motive force(pmf) in vitro and in vivo: control of pmf parsing into Δc and ΔpH byionic strength. Biochemistry 40: 1226–1237
Damkjaer JT, Kereïche S, Johnson MP, Kovacs L, Kiss AZ, Boekema EJ,Ruban AV, Horton P, Jansson S (2009) The photosystem II light-harvesting protein Lhcb3 affects the macrostructure of photosys-tem II and the rate of state transitions in Arabidopsis. Plant Cell 21:3245–3256
Duysens LNM, Sweers HE (1963) Mechanism of two photochemical reac-tions in algae as studied by means of fluorescence. In Studies on Mi-croalgae and Photosynthetic Bacteria. University of Tokyo Press, Tokyo,pp 353–372
Franck F, Juneau P, Popovic R (2002) Resolution of the photosystem I andphotosystem II contributions to chlorophyll fluorescence of intact leavesat room temperature. Biochim Biophys Acta 1556: 239–246
Frydenvang J, van Maarschalkerweerd M, Carstensen A, Mundus S,Schmidt SB, Pedas PR, Laursen KH, Schjoerring JK, Husted S (2015)Sensitive detection of phosphorus deficiency in plants using chlorophylla fluorescence. Plant Physiol 169: 353–361
Gilbert N (2009) The disappearing nutrient. Nature 461: 716–718Goltsev VN, Kalaji HM, Paunov M, Bąba W, Horaczek T, Mojski J,
Kociel H, Allakhverdiev SI (2016) Variable chlorophyll fluorescenceand its use for assessing physiological condition of plant photosyntheticapparatus. Russ J Plant Physiol 63: 869–893
Grennan AK, Ort DR (2011) Measurement of chloroplast ATP synthesisactivity in Arabidopsis. In PR Jarvis, ed, Chloroplast Research in Ara-bidopsis, Vol II. Humana Press, Totowa, NJ, pp 343–355
Guo B, Jin Y, Wussler C, Blancaflor EB, Motes CM, Versaw WK (2008)Functional analysis of the Arabidopsis PHT4 family of intracellularphosphate transporters. New Phytol 177: 889–898
Hammond JP, White PJ (2008) Sucrose transport in the phloem: integratingroot responses to phosphorus starvation. J Exp Bot 59: 93–109
Hawkesford M, Parmar S, Buchner P (2013) Mineral composition analysis:measuring anion uptake and anion concentrations in plant tissues. InJM Walker, ed, Plant Mineral Nutrition. Humana Press, York, UK, pp 109–119
Heldt HW, Chon CJ, Maronde D, Herold A, Stankovic ZS, Walker DA,Kraminer A, Kirk MR, Heber U (1977) Role of orthophosphate andother factors in the regulation of starch formation in leaves and isolatedchloroplasts. Plant Physiol 59: 1146–1155
Ihnatowicz A, Pesaresi P, Leister D (2007) The E subunit of photosystem Iis not essential for linear electron flow and photoautotrophic growth inArabidopsis thaliana. Planta 226: 889–895
Ihnatowicz A, Pesaresi P, Varotto C, Richly E, Schneider A, Jahns P,Salamini F, Leister D (2004) Mutants for photosystem I subunit D ofArabidopsis thaliana: effects on photosynthesis, photosystem I stabilityand expression of nuclear genes for chloroplast functions. Plant J 37:839–852
Karlsson PM, Herdean A, Adolfsson L, Beebo A, Nziengui H, Irigoyen S,Ünnep R, Zsiros O, Garab G, Aronsson H, et al (2015) The Arabidopsisthylakoid transporter PHT4;1 influences phosphate availability for ATPsynthesis and plant growth. Plant J 84: 99–110
Lauer MJ, Pallardy SG, Blevins DG, Randall DD (1989) Whole leaf carbonexchange characteristics of phosphate deficient soybeans (Glycine maxL.). Plant Physiol 91: 848–854
Lavorel J, Etienne AL (1977) In vivo chlorophyll fluorescence. In J Barber,ed, Primary Processes of Photosynthesis. Elsevier, Amsterdam, pp 203–268
Lunde C, Jensen PE, Haldrup A, Knoetzel J, Scheller HV (2000) The PSI-Hsubunit of photosystem I is essential for state transitions in plant pho-tosynthesis. Nature 408: 613–615
MacDonald GK, Bennett EM, Potter PA, Ramankutty N (2011) Agronomicphosphorus imbalances across the world’s croplands. Proc Natl Acad SciUSA 108: 3086–3091
Mimura T, Dietz KJ, Kaiser W, Schramm MJ, Kaiser G, Heber U (1990)Phosphate transport across biomembranes and cytosolic phosphatehomeostasis in barley leaves. Planta 180: 139–146
Młodzi�nska E, Zboi�nska M (2016) Phosphate uptake and allocation: a closerlook at Arabidopsis thaliana L. and Oryza sativa L. Front Plant Sci 7: 1198
Müller P, Li XP, Niyogi KK (2001) Non-photochemical quenching: a re-sponse to excess light energy. Plant Physiol 125: 1558–1566
Muneer S, Jeong BR (2015) Proteomic analysis provides new insights inphosphorus homeostasis subjected to Pi (inorganic phosphate) starva-tion in tomato plants (Solanum lycopersicum L.). PLoS ONE 10: e0134103
Pavón LR, Lundh F, Lundin B, Mishra A, Persson BL, Spetea C (2008) Ara-bidopsis ANTR1 is a thylakoid Na+-dependent phosphate transporter:functional characterization in Escherichia coli. J Biol Chem 283: 13520–13527
Porra RJ, Thompson WA, Kriedemann PE (1989) Determination of accu-rate extinction coefficients and simultaneous equations for assayingchlorophylls a and b extracted with four different solvents: verificationof the concentration of chlorophyll standards by atomic absorptionspectroscopy. Biochim Biophys Acta 975: 384–394
Queval G, Noctor G (2007) A plate reader method for the measurement ofNAD, NADP, glutathione, and ascorbate in tissue extracts: applicationto redox profiling during Arabidopsis rosette development. Anal Bio-chem 363: 58–69
Ramaekers L, Remans R, Rao IM, Blair MW, Vanderleyden J (2010)Strategies for improving phosphorus acquisition efficiency of cropplants. Field Crops Res 117: 169–176
Rao IM, Terry N (1995) Leaf phosphate status, photosynthesis, and carbonpartitioning in sugar beet. IV. Changes with time following increased supplyof phosphate to low-phosphate plants. Plant Physiol 107: 1313–1321
Reich PB, Oleksyn J, Wright IJ (2009) Leaf phosphorus influences thephotosynthesis-nitrogen relation: a cross-biome analysis of 314 species.Oecologia 160: 207–212
Reuter DJ, Robinson JB (1997) Plant Analysis: An Interpretation Manual,Ed 2. CSIRO Publishing, Collingwood, Australia
Robinson C, Mant A (2002) Molecular Plant Biology: A Practical Approach.Oxford University Press, Oxford
Robinson SP, Giersch C (1987) Inorganic phosphate concentration in thestroma of isolated chloroplasts and its influence on photosynthesis. AustJ Plant Physiol 14: 451–462
Ruban AV (2016) Nonphotochemical chlorophyll fluorescence quenching:mechanism and effectiveness in protecting plants from photodamage.Plant Physiol 170: 1903–1916
Rychter AM, Rao IM (2005) Role of phosphorus in photosynthetic carbonmetabolism. In M Pessarakli, ed, Handbook of Photosynthesis, Ed 2.CRC Press, Boca Raton, FL, pp 123–148
Schansker G, Tóth SZ, Strasser RJ (2005) Methylviologen and di-bromothymoquinone treatments of pea leaves reveal the role of photosystemI in the Chl a fluorescence rise OJIP. Biochim Biophys Acta 1706: 250–261
Schlodder E, Meyer B (1987) pH dependence of oxygen evolution and reductionkinetics of photooxidized chlorophyll aII (P-680) in photosystem II particlesfrom Synechococcus sp. Biochim Biophys Acta 890: 23–31
Sharkey TD, Vanderveer PJ (1989) Stromal phosphate concentration is lowduring feedback limited photosynthesis. Plant Physiol 91: 679–684
Smith AM, Zeeman SC (2006) Quantification of starch in plant tissues. NatProtoc 1: 1342–1345
Srivastava A, Strasser RJ, Govindjee (1995) Polyphasic rise of chlorophylla fluorescence in herbicide-resistant D1 mutants of Chlamydomonas re-inardtii. Photosynth Res 43: 131–141
Stirbet A, Govindjee (2011) On the relation between the Kautsky effect(chlorophyll a fluorescence induction) and photosystem II: basics andapplications of the OJIP fluorescence transient. J Photochem Photobiol B104: 236–257
Stirbet A, Govindjee (2012) Chlorophyll a fluorescence induction: a per-sonal perspective of the thermal phase, the J-I-P rise. Photosynth Res113: 15–61
Stirbet A, Riznichenko GY, Rubin AB, Govindjee (2014) Modeling chlo-rophyll a fluorescence transient: relation to photosynthesis. Biochemis-try (Mosc) 79: 291–323
Strand DD, Fisher N, Kramer DM (2017) The higher plant plastid NAD(P)H dehydrogenase-like complex (NDH) is a high efficiency proton pumpthat increases ATP production by cyclic electron flow. J Biol Chem 292:11850–11860
Strand DD, Kramer DM (2014) Control of non-photochemical excitonquenching by the proton circuit of photosynthesis. In B Demmig-Adams,G Garab, W Adams, Govindjee, eds, Non-photochemical Quenching andEnergy Dissipation in Plants, Algae and Cyanobacteria. Springer, Dor-drecht, The Netherlands, pp 387–408
Strasser RJ, Govindjee (1992) The Fo and the O-J-I-P fluorescence rise inhigher plants and algae. In JH Argyroudi-Akoyunoglou, ed, Regulationof Chloroplast Biogenesis. Springer, Boston, pp 423–426
Takizawa K, Kanazawa A, Kramer DM (2008) Depletion of stromal P(i)induces high ‘energy-dependent’ antenna exciton quenching (q(E)) bydecreasing proton conductivity at CF(O)-CF(1) ATP synthase. Plant CellEnviron 31: 235–243
Plant Physiol. Vol. 177, 2018 283
Phosphorus Deficiency and Photosynthetic Machinery
www.plantphysiol.orgon May 7, 2018 - Published by Downloaded from Copyright © 2018 American Society of Plant Biologists. All rights reserved.

Tietz S, Hall CC, Cruz JA, Kramer DM (2017) NPQ(T): a chlorophyllfluorescence parameter for rapid estimation and imaging of non-photochemical quenching of excitons in photosystem-II-associated an-tenna complexes. Plant Cell Environ 40: 1243–1255
Tikhonov AN (2013) pH-dependent regulation of electron transport andATP synthesis in chloroplasts. Photosynth Res 116: 511–534
Tikhonov AN (2014) The cytochrome b6f complex at the crossroad of photo-synthetic electron transport pathways. Plant Physiol Biochem 81: 163–183
Tóth SZ, Schansker G, Strasser RJ (2007) A non-invasive assay of theplastoquinone pool redox state based on the OJIP-transient. PhotosynthRes 93: 193–203
Vredenberg WJ (2004) System analysis and photoelectrochemical controlof chlorophyll fluorescence in terms of trapping models of photosys-tem II: a challenging view. In GC Papageorgiou, Govindjee, eds,
Chlorophyll a Fluorescence. Springer, Dordrecht, The Netherlands, pp133–172
Walan P, Davidsson S, Johansson S, Höök M (2014) Phosphate rockproduction and depletion: regional disaggregated modeling and globalimplications. Resour Conserv Recycling 93: 178–187
Yan N, Zhang YL, Xue HM, Zhang XH, Wang ZD, Shi LY, Guo DP (2015)Changes in plant growth and photosynthetic performance of Zizanialatifolia exposed to different phosphorus concentrations under hydro-ponic condition. Photosynthetica 53: 630–635
Yin L, Vener AV, Spetea C (2015) The membrane proteome of stromathylakoids from Arabidopsis thaliana studied by successive in-solutionand in-gel digestion. Physiol Plant 154: 433–446
Zhang K, Liu H, Tao P, Chen H (2014) Comparative proteomic analysesprovide new insights into low phosphorus stress responses in maizeleaves. PLoS ONE 9: e98215
284 Plant Physiol. Vol. 177, 2018
Carstensen et al.
www.plantphysiol.orgon May 7, 2018 - Published by Downloaded from Copyright © 2018 American Society of Plant Biologists. All rights reserved.