the impact of wind power on european natural gas markets · the impact of wind power on european...
TRANSCRIPT

The Impact of Wind Power
on European Natural Gas Markets
InternatIonal energy agency
Irene Vos
WO R K I N G PA PE R
January
2012


The Impact of Wind Power
on European Natural Gas Markets
InternatIonal energy agency
Irene Vos
WO R K I N G PA PE R
The views expressed in this working paper are those of the author and do not necessarily reflect the views or policy
of the International Energy Agency (IEA) Secretariat or of its individual member countries. This paper is a work
in progress, designed to elicit comments and further debate; thus, comments are welcome, at: [email protected]
January
2012

INTERNATIONAL ENERGY AGENCY
The International Energy Agency (IEA), an autonomous agency, was established in November 1974. Its primary mandate was – and is – two-fold: to promote energy security amongst its member countries through collective response to physical disruptions in oil supply, and provide authoritative
research and analysis on ways to ensure reliable, affordable and clean energy for its 28 member countries and beyond. The IEA carries out a comprehensive programme of energy co-operation among its member countries, each of which is obliged to hold oil stocks equivalent to 90 days of its net imports. The Agency’s aims include the following objectives:
n Secure member countries’ access to reliable and ample supplies of all forms of energy; in particular, through maintaining effective emergency response capabilities in case of oil supply disruptions.
n Promote sustainable energy policies that spur economic growth and environmental protection in a global context – particularly in terms of reducing greenhouse-gas emissions that contribute to climate change.
n Improve transparency of international markets through collection and analysis of energy data.
n Support global collaboration on energy technology to secure future energy supplies and mitigate their environmental impact, including through improved energy
efficiency and development and deployment of low-carbon technologies.
n Find solutions to global energy challenges through engagement and dialogue with non-member countries, industry, international
organisations and other stakeholders. IEA member countries:
Australia Austria
Belgium Canada
Czech RepublicDenmark
Finland France
GermanyGreece
HungaryIreland
ItalyJapan
Korea (Republic of)LuxembourgNetherlandsNew Zealand NorwayPolandPortugalSlovak RepublicSpainSwedenSwitzerland
TurkeyUnited Kingdom
United States
The European Commission also participates in
the work of the IEA.
Please note that this publication is subject to specific restrictions that limit its use and distribution.
The terms and conditions are available online at www.iea.org/about/copyright.asp
© OECD/IEA, 2012International Energy Agency
9 rue de la Fédération 75739 Paris Cedex 15, France
www.iea.org

© OECD/IEA 2012 The Impact of Wind Power on European Natural Gas Markets
Page | 3
Acknowledgements The author of this document, Irene Vos, gas analyst in the Gas, Coal and Power Division of the International Energy Agency (IEA), would like to thank all the contributors and reviewers for their input and comments.
Particular thanks are extended to Anne‐Sophie Corbeau for her guidance throughout the writing of this paper and to Alexander Antonyuk and Moritz Paulus for their useful feedback during the writing process. The author is also indebted to Robert Arnot, Hugo Chandler, Carlos Gasco, Laszlo Varro, Didier Houssin and Doug Cooke for their careful review and useful comments, and to Gerard Martinus for the earlier work done together on this topic. Special thanks go to Janet Pape and Marilyn Smith for editing, and to Angela Gosmann, Corinne Hayworth and Bertrand Sadin for the design.

The Impact of Wind Power on European Natural Gas Markets ©OECD/IEA 2012
Page | 4
Table of Contents Acknowledgements .......................................................................................................................... 3
Executive summary .......................................................................................................................... 7
Introduction ...................................................................................................................................... 9
Background: wind power on the rise ............................................................................................. 10
Wind in the world .................................................................................................................... 10
Europe .............................................................................................................................. 11
North America .................................................................................................................. 12
Asia ................................................................................................................................... 13
Future wind generation capacity: WEO 2010 .......................................................................... 14
Expected development of wind capacity: Europe ........................................................... 16
Wind as a source of electricity ................................................................................................ 17
Supply‐driven ................................................................................................................... 17
Capacity factor ................................................................................................................. 19
Variability and the effect of geographic diversification ................................................... 19
Ramping speeds ............................................................................................................... 21
Predictability .................................................................................................................... 21
Managing variability: supply‐side response .................................................................................. 23
The European generation mix ................................................................................................. 23
Delivering flexibility: technical capabilities ............................................................................. 25
Start‐up time .................................................................................................................... 25
Start‐up costs ................................................................................................................... 26
Ramping rate .................................................................................................................... 27
Minimum stable generation ............................................................................................ 27
Delivering flexibility: costs ....................................................................................................... 28
Short‐term marginal costs ............................................................................................... 29
Levelised costs of electricity ............................................................................................ 30
How wind output affects electricity demand ................................................................................ 33
Residual demand characteristics ............................................................................................. 34
Load duration curve ......................................................................................................... 34
Fuel flexibility ................................................................................................................... 36
Demand spread ................................................................................................................ 37
Predictability .................................................................................................................... 38
Variability ......................................................................................................................... 39
Ramping ........................................................................................................................... 39

© OECD/IEA 2012 The Impact of Wind Power on European Natural Gas Markets
Page | 5
The effect of wind power on gas markets ..................................................................................... 41
Interaction between wind output and gas demand ................................................................ 41
Gas markets ............................................................................................................................. 42
Gas becomes more attractive in the power sector ......................................................... 43
The capacity factor of gas‐fired capacity falls .................................................................. 43
Impact on gas demand varies; utilisation of transport capacity drops ........................... 44
Variability in gas demand does not significantly change ................................................. 44
Demand spread increases, while predictability of demand drops .................................. 44
Natural gas spot prices become more variable ............................................................... 45
Gas increases the effect of geographical diversification ................................................. 46
Abbreviations and acronyms ......................................................................................................... 47
References ...................................................................................................................................... 48
List of Figures
Figure 1 World installed wind capacity: total and newly installed ............................................. 11 Figure 2 Total installed wind capacity end 2010 and 2010 installed capacity per region .......... 11 Figure 3 EU27 Net increases in installed generating capacity per fuel, 2000‐10 ........................ 12 Figure 4 Total capacity and wind capacity per country, December 2008 ................................... 12 Figure 5 Wind power capacity per country ................................................................................. 13 Figure 6 United States installed wind capacity per state, end 2009 ........................................... 13 Figure 7 Total installed wind capacity end 2010 and 2010 installed capacity per country ........ 14 Figure 8 Wind generation and wind market share: world (WEO 2010) ...................................... 15 Figure 9 Wind market share in total electricity produced per region (WEO 2010) .................... 16 Figure 10 Production curve, Vestas V90 ....................................................................................... 18 Figure 11 German hourly electricity demand vs. hourly wind production ................................... 18 Figure 12 Output of wind turbine located at de Kooi, the Netherlands (3 MW)
on 3 November 2009 ..................................................................................................... 19 Figure 13 Output of a single turbine (3 MW) vs. average Dutch wind production per turbine ... 20 Figure 14 Variability of German wind output over 1 hour and 24 hours, 2007 ............................ 21 Figure 15 Market share per fuel in EU27 generation capacity and total generation, 2008 ......... 24 Figure 16 Share per fuel in total conventional thermal generation, 2008 ................................... 24 Figure 17 Merit order: stylised representation ............................................................................. 30 Figure 18 Development of LCOE as a function of the capacity factor .......................................... 31 Figure 19 LCOE on the basis of 2005‐10 average fuel costs .......................................................... 31 Figure 20 LDC of demand and residual demand in Germany, 2007 ............................................. 34 Figure 21 LDC of demand and residual demand in Denmark, 2008 ............................................. 35 Figure 22 The effect of wind on full capacity hours in Germany, 2007 ........................................ 35 Figure 23 Capacity factor of demand and residual demand in Denmark, 2008 ........................... 36 Figure 24 Variability and spread in residual demand .................................................................... 37 Figure 25 Belgian hourly gas demand vs. hourly wind production ............................................... 42 Figure 26 LDC of demand filled by natural gas‐fired capacity in Denmark, 2006 ......................... 43

The Impact of Wind Power on European Natural Gas Markets ©OECD/IEA 2012
Page | 6
List of Tables
Table 1 Wind targets as published in the National Renewable Action Plans (EU27) ................ 17 Table 2 Capacity factor of wind in Germany, 2002‐09 .............................................................. 19 Table 3 Variability of hourly German wind production, 2006‐09 .............................................. 20 Table 4 Technical/economical indications of power flexibility .................................................. 25 Table 5 Start‐up time per technology ........................................................................................ 26 Table 6 Comparison of relative start‐up fuel costs per technology ........................................... 26 Table 7 Ramp rate per technology ............................................................................................. 27 Table 8 Minimum stable generation per technology ................................................................ 28 Table 9 Relative flexibility of generation units summarised per generation fuel ...................... 28 Table 10 Characteristics of German and Danish wind production, 2005‐09 ............................... 34

© OECD/IEA 2012 The Impact of Wind Power on European Natural Gas Markets
Page | 7
Executive summary This working paper discusses how an increasing wind market share changes the characteristics of the electricity demand that needs to be filled by generation capacity other than wind, the so‐called residual demand. It discusses whether, and how the demand for fuel in the power sector changes due to an increasing wind market share, and whether, as a result, wind affects energy markets other than the electricity market.
This paper focuses on one fuel; natural gas, which is often identified as one of the generation fuels best suited to support an increasing wind market share, thanks to its relatively clean burning properties and its flexibility in generation. It also focuses on the effects of an increasing share of wind power in Europe (EU27), which currently is − and is expected to remain − the region with the highest wind market share in the world (IEA, 2010a).
Wind power has distinctive characteristics. Firstly, its output can vary greatly and within short periods of time. Secondly, its output cannot be completely controlled or predicted. Consequently, an increasing wind market share puts pressure on electricity systems and increases the need for system flexibility. Tools that can deliver flexibility include energy storage, demand‐side response, increasing interconnection and supply‐side response (i.e. other forms of generation capacity which can be ramped up or down in response to changing demand). Much of the flexibility in electricity systems is currently delivered by supply‐side response; this instrument is likely to play an important role in supporting an increasing wind market share.
A comparison of the three generation fuels with the largest shares in European power generation − coal, nuclear and natural gas − shows that generation units running on these fuels all have the technical capabilities to act as supply‐side response instruments. They can all vary their output in response to changes in power demand. Its short start‐up times, high ramp rates and low start‐up costs make natural gas the best‐suited technology to support fast changes in power demand. While both coal‐ and nuclear‐fired technologies can vary their output, their long start‐up times, lower ramp rates and high start‐up costs make them less attractive to employ as running reserve and less suitable to respond to fast demand changes.
An analysis of the effect of an increasing wind market share on residual demand shows that wind significantly alters the load duration curve (LDC) of residual demand, changing not only its size but also its slope. Comparing the LDC of demand and residual demand shows how wind strongly decreases the average capacity factor of residual demand; the share of capacity running at high capacity factors (70% to 100%) decreases, while the amount of capacity running at low capacity factors (0% to 30%) increases strongly. A decreasing capacity factor can have a significant impact on the relative profitability of investments in different types of generation capacity. As the capacity factor decreases, the levelised costs of electricity (LCOE) of generation technologies with high investment costs, such as coal‐ and especially nuclear‐fired capacity, increase faster than those of technologies with lower investment costs, such as gas‐fired capacity.
Natural gas technologies seem to be best suited to support wind power in the future, due to their relatively low investment costs and technical capabilities to deliver flexibility. This makes it likely that, as the market share of wind increases, the role of natural gas as a flexible fuel supporting wind output increases. As a result, wind will also have a growing impact on natural gas demand in the power sector.
An analysis of the effect of an increasing wind market share on residual power demand patterns shows that wind does indeed affect residual power demand, albeit to a limited degree. As there is no significant correlation between wind output and electricity demand, an increasing wind market share neither amplifies nor dampens existing power demand patterns and does not
The Impact of Wind Power on European Natural Gas Markets ©OECD/IEA 2012
Page | 8
strongly increase demand variability or the size of demand changes. The variability of residual demand increases only when variations in wind become larger than the existing variation in demand. Exactly at which market share this happens differs by country and depends on both national wind output and electricity demand patterns.
An increasing wind market share increases the spread in residual power demand – that is, the difference between minimum and maximum demand observed in a time period (hourly, daily or annually). A higher spread in residual demand leads to a larger spread in the amount of fuel needed to fill this demand. The effect of an increasing demand spread is enhanced by the limited predictability of wind compared to demand, especially on the longer term (year‐ahead). As natural gas is often contracted significantly in advance, a higher demand spread and decreasing demand predictability increase the need for flexibility in gas supplies.
A growing wind output also changes the way in which existing flexibility instruments are used; natural gas storage facilities are currently mostly used single‐cycle – i.e. switching from injecting to sending out or vice versa twice per year – and have a relatively predictable output pattern. A higher wind market share changes this pattern, with storages having to become multi‐cycle. It also increases the required send‐out capacity due to the increasing spread in fuel demand.
A higher demand spread and a decreasing demand predictability do not have to be problematic in gas markets as natural gas systems have several instruments available that can supply both short‐ and long term flexibility. For the system as a whole, additional flexibility in production or imports – for example, increasing the flexibility in import contracts or increasing the access to more flexible supply sources (such as liquefied natural gas (LNG)) – and increasing natural gas storage capacity, can deliver additional fuel flexibility.
For individual generators, the spot market can deliver a significant amount of supply flexibility. Liquid spot markets offer individual generators the opportunity to buy or sell volumes in situations of shortage or oversupply. Most trade on spot markets is currently done on a year‐, month‐ or day‐ahead basis. As significant errors in wind output predictions occur even on an hour‐ahead basis, the importance of short‐term (within‐day) trade significantly increases. Trading on such limited time scale is not yet possible on all European spot markets.
Even though the effects of an increasing wind market share on gas markets are relatively limited and there are several tools available within natural gas systems that can support an increased demand spread and unpredictability, natural gas should not be seen as a inexpensive or easy way to support a higher wind market share. An increasing wind market share strongly decreases the capacity factor of gas‐fired generation capacity, thereby increasing the levelised costs of electricity (LCOE) of electricity production by gas‐fired generation technologies. The diminished capacity factor also leads to a decreased utilisation rate of transport capacity bringing gas to gas‐fired generation plants, leading to higher transport costs.
Finally, the additional flexibility required to cover the higher demand spread is likely to be needed only a very small fraction of the time, making instruments such as natural gas storage or LNG regasification capacity relatively expensive sources of flexibility.

© OECD/IEA 2012 The Impact of Wind Power on European Natural Gas Markets
Page | 9
Introduction Concerns about climate change, air quality issues and security of supply have led to renewed interest in less carbon‐intensive and more sustainable energy sources. As a result, in the past ten years, the amount of wind capacity installed around the globe increased more than sevenfold, and there are no signs that this growth is slowing down. In fact, the past two years (2009 and 2010) saw the largest growth in installed wind capacity ever.
Much has been written about the effect the increasing share of wind power capacity will have on electricity networks. Wind is a highly irregular generator of electricity; its output can neither be fully controlled nor predicted. Numerous studies have concluded that as the market share of wind increases, there will be a greater need for flexible instruments that can support its irregular character.
This working paper discusses how an increasing wind market share changes the characteristics of the demand that needs to be filled by generation capacity other than wind, the so‐called “residual demand”. It discusses how wind changes the demand for fuel in the power sector and as a result, whether an increasing wind market share affects markets other than the electricity market. The paper does not address exactly what is needed to support a high wind market share,1 but will look at its effects on a more general scale.
The paper focuses on natural gas. Natural gas‐fired generation capacity is often mentioned as one of the generation technologies that will play an important role in supporting a growing wind market share, due to its relatively clean burning properties and production flexibility. Little has been written about how a growing wind market share might affect the usage of natural gas in the power market and consequently its possible effect on natural gas markets.
Section 2 gives some background on the development of the amount of installed wind capacity. It shows that, although China has the highest share in new installed capacity, Europe, especially West‐Europe, is currently the region with by far the highest wind market share. The section also discusses the characteristics of wind as an electricity generator.
Section 3 explores the possible role of coal, nuclear power and natural gas in supporting wind. It describes the technical capabilities of different generation technologies to deliver flexibility to the electricity system and how costs determine which instrument will be used in what manner, both now and in the future.
Section 4 explains how an increasing wind market share will influence the demand for natural gas in the power sector. To understand how wind influences fuel demand in the power sector, it is essential to understand how wind changes power demand patterns. The section compares the characteristics of demand and residual demand (which is defined as demand minus wind, the part of demand which will have to be filled with all other forms of generation capacity but wind). Section 5 analyses how changes in electricity and fuel demand affect total gas demand and thus gas markets. Where necessary, a distinction will be made between different levels of wind penetration.
The study is based on a combination of literature review and analysis of actual wind patterns and demand data. The demand and wind data of two European member states form the basis of this data analysis: Germany (wind market share around 7%) and Denmark (wind market share around 19%).
1 A reader interested in this type of question might want to look at some of the IEA publications that discuss the integration of renewables in power systems, especially the work which is currently done with the GIVAR (The Grid Integration of Variable Renewables) model (IEA, 2011a).

The Impact of Wind Power on European Natural Gas Markets ©OECD/IEA 2012
Page | 10
Background: wind power on the rise
The popularity of wind power has historically fluctuated in tandem with fossil fuel prices. When fuel prices fell after the Second World War, interest in wind turbines waned. Worldwide interest in wind turbine generators increased again when oil prices rose in the 1970s.
In the past decade, the use of wind‐powered generating capacity has demonstrated its fastest growth ever. Increasing concerns about security of energy supply and fossil fuel depletion – but especially growing concerns about CO2 emissions and climate change – have boosted interest in more sustainable, less carbon‐intensive energy sources.
Wind turbines are one of the most economical forms of renewable energy generation; they can be built almost everywhere and relatively quickly due to their short construction time. These characteristics put wind on the front line of renewable energy policies.
This section discusses both the rapid deployment of wind technologies in the past decade and the expectations for wind power deployment in the future. It ends with a short discussion of the characteristics of wind as a source for generating electricity.
Wind in the world
In the past ten years, the total amount of wind power installed worldwide has increased more than sevenfold, from 24 GW in 2001 to almost 197 GW in 2010 (WWEA, 2011). In 2010, despite the economic crisis, 37.6 GW of new wind capacity came on line, a growth surpassed only by the 38.3 GW capacity increase in 2009 (WWEA, 2011) (Figure 1).
Key points
In the past ten years, the total amount of wind power installed has increased more than sevenfold, from 24 GW in 2001 to almost 197 GW in 2010. There are no signs this growth is slowing down, as in 2010, an additional 37.6 GW of wind capacity was installed. In the IEA World Energy Outlook 2010 New Policies Scenario, the global amount of installed wind capacity is expected to increase by more than 400% in the period up to 2035.
Europe (EU27) has the highest share of wind power in total electricity generation, with a share of 4.5% in 2009. In the same year, the market share of wind was 1.9% in the United States and 0.7% in China.
If all EU27 member countries reach the targets put forward in their National Renewable Action Plans, installed wind capacity will increase by 150% in the coming ten years, from 84 GW in 2010 to 209 GW in 2020. This would increase the EU27 market share of wind in total electricity generation from the current 5.3% to around 13% (in a normal wind year).
Wind is an electricity‐generating source with a relatively low capacity factor and high variability. Factors that affect its merits include its wide variability in production, fast production changes and limited predictability. Geographical diversification dampens both the variability of wind and the speed of wind output changes, while also improving wind output predictability. But even in a large, diverse portfolio, the variability of wind production is significant.

© OECD/IEA 2012 The Impact of Wind Power on European Natural Gas Markets
Page | 11
Figure 1 World installed wind capacity: total and newly installed
Source: WWEA, 2011.
Almost 45% of all installed wind capacity is located in Europe, which showed the largest absolute growth in installed capacity until 2007 (Figure 2). Since then, Europe has been surpassed by Asia, which in 2010 was world leader based on added capacity, accounting for 55% of all wind turbines installed that year.
Figure 2 Total installed wind capacity end 2010 and 2010 installed capacity per region
Source: WWEA, 2011.
Europe
By the end of 2010, Europe (EU27) had 84 GW of installed wind capacity; in 2010, more than 9 GW of capacity came on line. Between 2000 and 2010, wind showed the second‐largest absolute growth in installed capacity of all energy technologies, behind natural gas. Between 2007 and 2009, wind was the absolute fastest‐growing type of generation capacity, accounting for 39% of total new capacity installed in Europe (EWEA, 2010). The share of wind in total installed power capacity in Europe was 9.6% in 2010. In a normal wind year,2 this capacity would generate 5.3% of total European electricity demand.
2 20‐year running average wind year.
0
50
100
150
200
250
2001 2002 2003 2004 2005 2006 2007 2008 2009 2010
GW
World total installed capacity
New installed capacity
Total capacity
Europe
Latin America
Africa
Asia
North America
Australia Pacific
2010 new installed capacity

The Impact of Wind Power on European Natural Gas Markets ©OECD/IEA 2012
Page | 12
Figure 3 EU27 Net increases in installed generating capacity per fuel, 2000‐10
* includes geothermal, waste and heat.
Note: PV = photovoltaic.
The amount of wind capacity installed in Europe is not equally distributed among member states. Germany and Spain have the largest share in total installed capacity, while Denmark has the highest share of wind in its total installed generation capacity (25%).
Figure 4 Total capacity and wind capacity per country, December 2008
Source: Eurostat data.
North America
The United States was the country with the largest amount of installed wind capacity in the world until 2009, but it lost this position to China in 2010 (GWEC, 2010, measured December, 2009). In 2010 the United States installed 5.6 GW of new wind‐powered capacity, bringing total installed capacity to 40 GW (WWEA, 2011).
118,18
74,59
30,03
3,38 2,98 1,60
‐7,60 ‐9,50 ‐12,68‐20
0
20
40
60
80
100
120
140
Gas Wind PV Hydro Biomass Other* Nuclear Coal Fuel oil
GW
0
20
40
60
80
100
120
140
160
GW
Net installed capacity
Net installed wind capacity
© OECD/IEA 2012 The Impact of Wind Power on European Natural Gas Markets
Page | 13
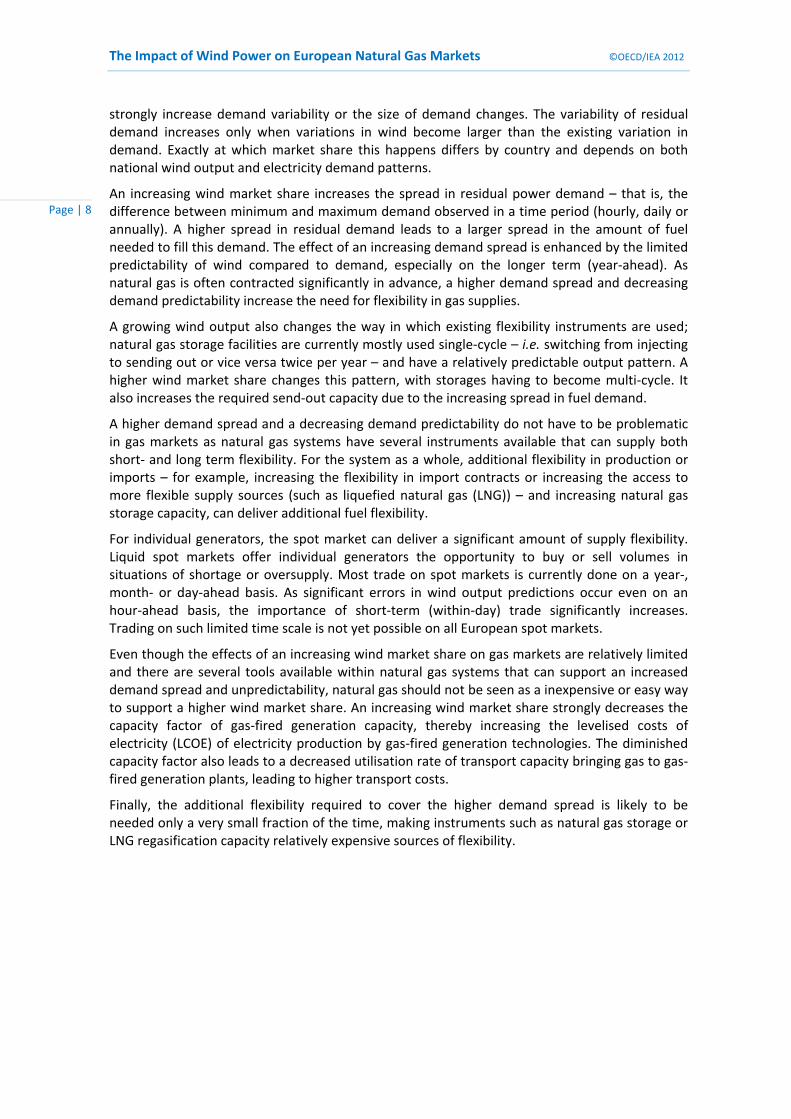
Figure 5 Wind power capacity per country
Source: GWEC, 2011.
As in Europe, wind power is one of the fastest‐growing sources of electricity generating capacity in the United States, second only to natural gas. In 2009, 39% of all newly installed generation capacity was wind capacity (AWEA, 2010a).
The share of wind power in the United States (as in Europe) varies greatly across states. While the state of Texas has the largest amount of installed capacity, the share of wind power in total electricity production is highest in Iowa (14% in 2008) (AWEA, 2010b).
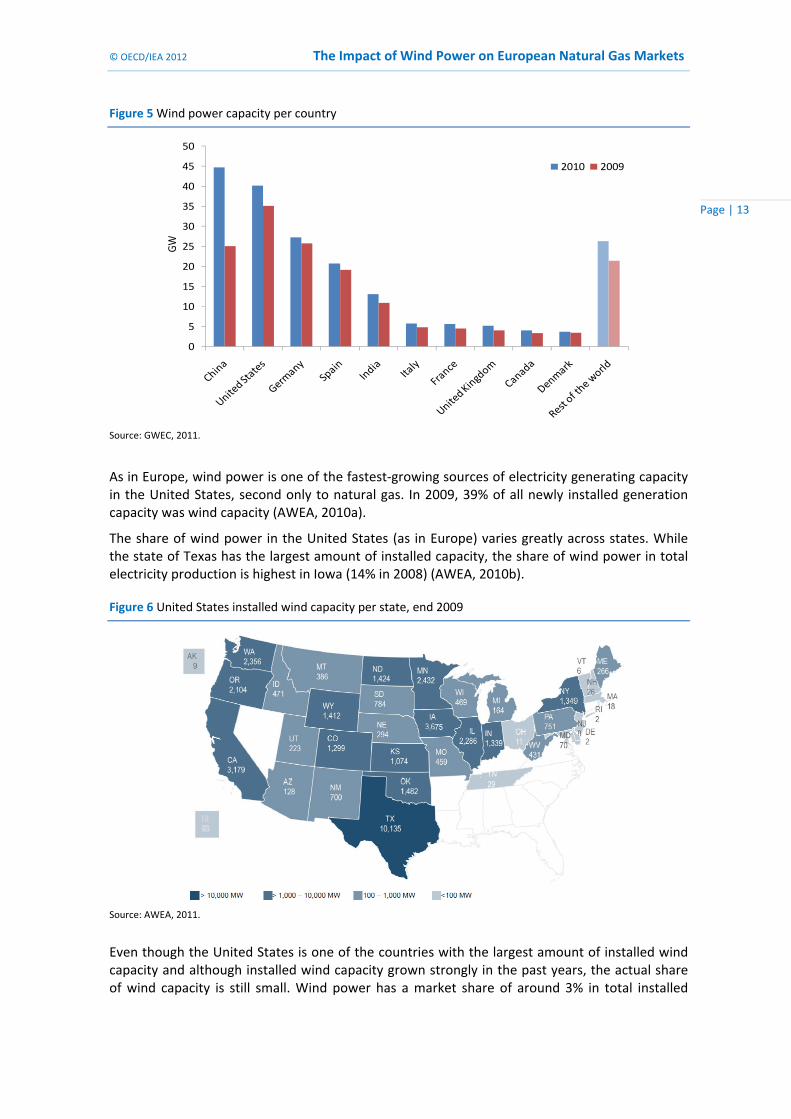
Figure 6 United States installed wind capacity per state, end 2009
Source: AWEA, 2011.
Even though the United States is one of the countries with the largest amount of installed wind capacity and although installed wind capacity grown strongly in the past years, the actual share of wind capacity is still small. Wind power has a market share of around 3% in total installed
0
5
10
15
20
25
30
35
40
45
50
GW
2010 2009

The Impact of Wind Power on European Natural Gas Markets ©OECD/IEA 2012
Page | 14
generation capacity.3 In 2009, only 1.9% of all electricity generated in the United States was produced with wind (EIA, 2010).
Asia
Asia accounts for 31% of global installed wind capacity. Within Asia, only three countries have a significant amount of installed capacity: China is home to 73% of all Asian wind capacity, India to 21% and Japan to 4%. In 2010, China became the country with the largest amount of installed wind capacity, surpassing both Germany and the United States.
It must be added that China still faces major challenges with connecting built wind turbines to the grid. According to the China Electricity Council, of the 44 GW of the total capacity installed end 2010, only 31 GW was actually feeding electricity into the national grid (WWEA, 2011).
China also had the largest share in installed capacity in Asia in 2010. Almost 90% of all wind capacity that came on line in Asia in 2010 was installed in China, while India had a 9% share in new capacity. China installed 19.6 GW of new wind capacity in 2010.
Figure 7 Total installed wind capacity end 2010 and 2010 installed capacity per country
Source: GWEC, 2011.
In 2009, China had an estimated total installed electricity generating capacity of 874 GW and its wind market share on the basis of installed capacity was around 2%. The market share of wind power in total electricity production was only 0.7% (Cheung, 2011). This shows that even though wind capacity is growing very rapidly in China, the market share of wind power still is very small compared to Europe.
Future wind generation capacity: WEO 2010
The use of renewable energy is projected to expand rapidly towards 2035. The rates of growth will strongly depend on the existence of government policies aimed at reducing greenhouse‐gas (GHG) emissions and energy supply diversification. 3 EIA data.
44.7
13.0
2.30.5 0.4 0.0 0.3
19.6
2.10.2 0.1 0.0 0.0 0.3
0
5
10
15
20
25
30
35
40
45
50
GW
Total installed capacity
2010 New installed capacity

© OECD/IEA 2012 The Impact of Wind Power on European Natural Gas Markets
Page | 15
The IEA World Energy Outlook 2010 (WEO 2010) gives energy projections for three scenarios up to 2035 (IEA, 2010a). The central scenario is the New Policies Scenario, which takes into account the policy commitments and plans aimed at tackling either environmental or energy security concerns that have been announced by countries around the world.
A second scenario is the Current Policies Scenario, which assumes no change in policies as of mid‐2010. The third scenario, the 450 Scenario, sets out an energy pathway consistent with the goal agreed at the UN climate meeting (Copenhagen, December 2009) to limit the increase in global temperature to 2⁰C.
In all three scenarios, the use of wind power increases significantly, in both absolute and relative terms in relation to other fuels (Figure 8). The largest growth is expected in the 450 Scenario, while in the Current Policies Scenario, growth is lowest. But even in this scenario, the total amount of installed wind power increases by almost 300% between 2010 and 2035.
Figure 8 Wind generation and wind market share: world (WEO 2010)
Source: IEA, 2010a.
The use of wind power will increase in all regions. Figure 9 shows the expected market share per world region and per scenario, based on electricity produced. In all scenarios, Europe remains the region with the highest wind market share, which increases in the period up to 2035 to 16% in the Current Policies Scenario and to 23% in the 450 Scenario.
As Europe currently has the highest wind market share and, in all WEO 2010 scenarios, is expected to remain the region with the highest wind market share, the remainder of this working paper will focus on the effects of an increasing wind market share on European gas markets.
0%
2%
4%
6%
8%
10%
12%
14%
0
1
2
3
4
5
2008 2020 2030 2035
Market share
Produ
ction (PWh)
Current Policies New Policies 450 Scenario
Current Policies ‐Market share New Policies ‐Market share 450 Scenario ‐Market share

The Impact of Wind Power on European Natural Gas Markets ©OECD/IEA 2012
Page | 16
Figure 9 Wind market share in total electricity produced per region (WEO 2010)
Source: IEA, 2010a.
Expected development of wind capacity: Europe
The European Union has committed itself to ambitious CO2 reduction and renewable energy targets. The 20‐20‐20 scheme aims for a CO2 reduction of 20%
4 and a 20% market share of renewables in total primary energy consumption, both by 2020. Wind power will play an important role in reaching these goals.
Table 1 shows the wind targets formulated by the EU27 member states in their National Renewable Energy Action Plans.5 Article 4 of the Renewable Energy Directive requires European member states to submit an action plan that describes how the individual countries will reach renewable and CO2 emission targets.
If the formulated targets are met, the total amount of wind capacity installed in the EU27 countries increases by 150%, from 84 GW to 209 GW, between 2010 and 2020.
Based on the expected total electricity generation in the WEO 2010 New Policies Scenario, the market share of wind in total electricity generation would increase from the current 5.3% to around 13% (in a normal wind year), which is between the current German and Danish wind power market share. The market share of wind in total installed capacity would increase from the current 9.6% to around 22% (EWEA, 2010).
Taking into consideration the uncertainty as to whether these targets will indeed be reached, they nevertheless show the ambition of European Union countries to significantly increase their installed wind capacity.
4 Below 1990 emission levels.
5 European Commission Energy, Transparency Platform.
0%
5%
10%
15%
20%
25%
2008 Current Policies ‐ 2035 New Policies ‐ 2035 450 Scenario ‐ 2035
Wind market share (%)
World
United States
European Union
Asia ‐ Pacific

© OECD/IEA 2012 The Impact of Wind Power on European Natural Gas Markets
Page | 17
Table 1 Wind targets as published in the National Renewable Action Plans (EU27)
Country Installed capacity
end 2010 (MW)
Formulated wind target (MW)
Onshore Offshore Total
Austria 1 011 2 578 2 578
Belgium 911 4 320 4 320
Bulgaria 375 1 256 1 256
Cyprus 82 300 300
Czech Republic 215 743 743
Denmark 3 752 1 621 1 339 3 960
Estonia 149 974 563 1 537
Finland 197 2 500 2 500
France 5 660 19 000 6 000 25 000
Germany 27 214 35 750 10 000 45 750
Greece 1 208 6 250 6 250
Hungary 295 750 750
Ireland 1 428 4 094 555 4 649
Italy 5 797 12 000 680 12 680
Latvia 31 236 180 416
Lithuania 154 500 500
Luxembourg 42 131 131
Malta - 14 95 109
Netherlands 2 237 6 000 5 200 11 200
Poland 1 107 3 030 3 030
Portugal 3 898 6 800 75 6 875
Romania 462 4 000 4 000
Slovakia 3 350 350
Slovenia 0.03 106 106
Spain 20 676 35 000 3 000 38 000
Sweden 2 163 4 365 182 4 547
United Kingdom 5 204 14 890 12 990 27 880
Total 84 271 168 558 40 859 209 417
Source: http://ec.europa.eu/energy/renewables/transparency_platform/action_plan_en.htm
Wind as a source of electricity
Supply‐driven
Wind has a number of characteristics that make it different from, for example, natural gas‐ or nuclear‐fired generating capacity. Most forms of electricity generation are demand driven: i.e. a power plant produces electricity when there is a demand for its output. With wind, this is not always possible. Wind turbines commonly deliver electricity at wind speeds between 2.5 m/s and 25 m/s.6 Figure 10 shows a linear representation of a Vestas V90 wind turbine with a maximum production capacity of 3 MW.
6 Mentioned wind speeds will vary between different types of wind turbines.

The Impact of Wind Power on European Natural Gas Markets ©OECD/IEA 2012
Page | 18
Figure 10 Production curve, Vestas V90
Source: Vestas.
The possible output of a wind turbine is determined by actual wind speeds. While wind turbines can be turned off in situations of oversupply, they cannot be turned on when the wind is nonexistent or insufficient. This makes wind a largely supply‐driven source of electricity production. Other supply‐driven electricity sources are run‐of‐the‐river hydro and photovoltaic (PV). This characteristic is further enhanced by some of the renewable support programmes currently in place, which treat renewables as a preferred source of electricity, avoiding wind being turned off, even in situations of oversupply.
Figure 11 German hourly electricity demand vs. hourly wind production
Data: 1 April 2006 to 31 May 2006.
Sources: Tennet, Hertz 50, Amprion, ENBW and ENTSO‐E data.
0
10
20
30
40
50
60
70
80
0 2 4 6 8 10 12 14 16
Hourly dem
and (G
W)
Hourly wind production (GW)
Trend line
0
0.5
1
1.5
2
2.5
3
3.5
0 5 10 15 20 25 30
MW
Windspeed (m/s)
Vestas V90, production curve

© OECD/IEA 2012 The Impact of Wind Power on European Natural Gas Markets
Page | 19
An analysis of German hourly wind output and power demand data shows that the two are unrelated. There is no positive or negative correlation between wind and power demand, again showing that wind is not demand driven, but purely a supply‐driven energy source.
Capacity factor
In situations of too little or too much wind, a wind turbine does not produce any electricity or produces below its maximum output level. This makes wind output strongly intermittent; a new installed wind turbine located onshore will likely have a capacity factor of between 21% and 41%; an offshore turbine will have a capacity factor of between 34% and 43% (IEA, 2010b).
An analysis of the capacity factor of the German national wind turbine portfolio shows capacity factors of between 16% and 21% for the period 2002‐09, an average capacity factor significantly lower than the range mentioned above. A possible reason for the low capacity factor in Germany is the higher average age of the installed capacity, as older turbines often have lower production efficiency and produce at narrower wind speeds.
Table 2 Capacity factor of wind in Germany, 2002‐09
2002 2003 2004 2005 2006 2007 2008 2009
Production (GWh) 15 856 18 859 25 509 27 229 30 710 39 713 40 574 37 809
Production capacity (MW)* 10 377 13 305 15 619 17 528 19 525 21 434 23 075 24 840
Capacity factor 17% 16% 19% 18% 18% 21% 20% 17%
*Production capacity is average of start of the year capacity and end of the year capacity.
Source: IEA and EWEA data.
Variability and the effect of geographic diversification
Changes in wind speed can lead to significant and fast changes in wind output. When increasing wind speeds lead to a situation in which a turbine needs to be shut down to prevent damage, wind output of this turbine will drop quickly from maximum to zero. By comparison, increasing wind speeds can lead to rapid increases in wind output.
Figure 12 Output of wind turbine located at de Kooi, the Netherlands (3 MW) on 3 November 2009
Source: KNMI data.
‐
0.5
1.0
1.5
2.0
2.5
3.0
3.5
0:00 3:00 6:00 9:00 12:00 15:00 18:00 21:00
MWh
Output
Maximum output

The Impact of Wind Power on European Natural Gas Markets ©OECD/IEA 2012
Page | 20
The output of a single windmill can vary between maximum and zero in a short time period (Figure 12). Of course, a national wind portfolio often consists of a large number of wind turbines placed at different locations. This geographical diversification has two effects on wind production. Firstly, changes in wind speed (due to, for example, the arrival of a storm front) will not affect all wind turbines at the same time, making changes in wind production more fluid.
Secondly, different geographical locations experience different wind conditions, which may be limited or not correlated, depending on the distance between the locations (Roques, Hiroux and Saguan, 2009). Geographic diversification reduces the chance that multiple wind parks will have the same output pattern, thus reducing the variation in total wind output.
Figure 13 Output of a single turbine (3 MW) vs. average Dutch wind production per turbine
Data: 1 July 2007 to 7 July 2007.
Source: KNMI data.
However, this does not mean that a portfolio with a large geographical diversification will not show any variation. Over a four‐year period, the hourly output from the German wind portfolio varied between 0.2% and 85.5% of maximum output.
Table 3 Variability of hourly German wind production, 2006‐09
2006 2007 2008 2009
Installed capacity* 19 525 MW 21 434 MW 23 075 MW 24 840 MW
Min production (hour) 35 MWh 133 MWh 134 MWh 81 MWh
Max production (hour) 15 878 MWh 18 322 MWh 19 185 MWh 20 671 MWh
Spread 0.2%-81% 0.6%-85.5% 0.5%-83.1% 0.3%-83.2%
*Installed capacity is average of start of the year capacity and end of the year capacity.
Sources: Tennet, Hertz 50, Amprion, ENBW and EWEA data.
This hourly variation does not even out over longer periods of time; wind output varies widely between months and even years. Between 2002 and 2009, the capacity factor of wind production in Germany varied between 16% and 21% (BUNR, 2010).
‐
0.5
1.0
1.5
2.0
2.5
3.0
3.5
0:00 01 July 2007
0:00 02 July 2007
0:00 03 July 2007
0:0004 July 2007
0:0005 July 2007
0:0006 July 2007
0:00 07 July 2007
MWh
Single windmill (De Kooy)
Average Netherlands

© OECD/IEA 2012 The Impact of Wind Power on European Natural Gas Markets
Page | 21
Ramping speeds
Another variable is ramping speed, which is the speed at which wind output changes. Although the ramping speed is also tempered by geographic diversification, even a large, diversified portfolio shows significant ramping speeds. An analysis of German wind output in 2007 shows that the largest hourly change in output was 2 587 MWh, amounting to 13.3% of total production capacity. The largest daily change was a drop in wind output of 13 675 MWh, which equalled 70% of total production capacity.
Figure 14 Variability of German wind output over 1 hour and 24 hours, 2007
Sources: Tennet, Hertz 50, Amprion and ENBW Data.
Predictability
A last characteristic of wind is its limited predictability, which plays an important role in the integration of wind power, both for long‐term and short‐term planning of the deployment of other forms of generation capacity.
As mentioned before, wind output can vary greatly between months or years. On this timescale wind is not predictable, making it is impossible to exactly predict how much electricity a wind farm or total wind portfolio will produce in the coming year or even the coming month.
On shorter terms – day‐ahead or an hour‐ahead – wind forecasts play an important role in the management of an electricity system. As most conventional power plants have a significant start‐up time, an accurate wind prediction is crucial in determining which generating units need to be started up or can be shut down. How well wind output can be predicted determines the amount of running reserves that needs to be available within the system.
Predictions of wind production rely almost entirely on meteorological forecasts for local wind speeds, which reflect weather systems passing the area. Regardless of the forecasting method used, the forecast error for a single wind farm is between 10% and 20% of the installed wind power capacity at a forecast horizon of 48 hours. Geographical diversification brings the error down to around 18% of mean production. The prediction error decreases as the prediction period shortens; at 1 hour‐ahead, the prediction error drops to around 4% to 5% of mean production (Torre Rodriquez, 2009).
‐15 000
‐10 000
‐5 000
0
5 000
10 000
15 000
1 1 001 2 001 3 001 4 001
MW
Max delta 24 hours
Max delta 1 hour
Max delta 1 hour
Max delta 24 hours
13 675
12 488
2 587
2 457 Hours

The Impact of Wind Power on European Natural Gas Markets ©OECD/IEA 2012
Page | 22
Interestingly, weather forecasts are often capable of predicting that a change in wind speeds and thus in wind output will be taking place, but can only limitedly predict exactly when this change will take place, creating large errors in hourly wind predictions.

© OECD/IEA 2012 The Impact of Wind Power on European Natural Gas Markets
Page | 23
Managing variability: supply‐side response
The intermittent character of wind requires additional flexibility in electricity system design and operation. Several tools can provide this flexibility, including: energy storage, demand‐side response, increasing electricity interconnection capacity and trade, and supply‐side response.
This last tool, supply‐side response, consists of generation units that can increase or decrease their output in reaction to demand changes, currently supplies a significant part of the flexibility in electricity systems and will play an important role in supporting a growing wind market share. This section discusses the technical capabilities of different generation technologies to deliver flexibility and how costs determine which technologies are used.
The European generation mix
A total of around 840 GW of electricity generating capacity is installed within the EU27 (Eurostat, 2010). Of this, 55% is conventional thermal generation capacity (i.e. heat‐driven generation technologies, such as coal‐ and gas‐fired power plants), these units deliver around 58% of the total amount of electricity generated. Other forms of electricity generation with a significant market share are nuclear power, hydro power (both run‐of‐the‐river and pumped storage) and wind power (Figure 15).
Fuels with the highest market share in conventional thermal generation are natural gas and coal (both hard coal and lignite) (Figure 16).
Key points
Several tools exist that can deliver flexibility to electricity systems and support an increasing wind power market share, notably, energy storage, demand‐side response, supply‐side response and increased interconnection between or among countries. Currently, supply‐side response delivers a large part of the flexibility in electricity systems and it will remain an important source of flexibility in the future.
Natural gas‐, coal and nuclear‐fired generation units all have the technical capabilities to vary their output in response to changes in power demand. Of these, natural gas‐fired technologies are best suited to respond to fast demand changes, due to their high ramping capabilities as well as short start‐up times and lower start‐up costs.
Marginal costs will determine which technology will, within its technological limits, respond to changes in demand. Due to its low marginal costs, nuclear power will usually produce as much as possible at base‐load.
Levelised costs of electricity (LCOE) will, for a large part, determine investments in new generation capacity. Due to their relatively high investment costs, coal‐fired and especially nuclear‐powered generation capacity have a relatively high LCOE at low capacity factors compared to gas‐fired technologies.
Low investment costs and flexible technical capabilities make natural gas‐fired generation technologies very attractive for investments in generation capacity aimed at supporting a higher wind market share. It seems likely that the role of natural gas in supporting wind will increase in the future.

The Impact of Wind Power on European Natural Gas Markets ©OECD/IEA 2012
Page | 24
Figure 15 Market share per fuel in EU27 generation capacity and total generation, 2008
Source: Eurostat, 2010.
Figure 16 Share per fuel in total conventional thermal generation, 2008
Source: Eurostat, 2010.
This section discusses nuclear power, coal and natural gas, the fuels that have a significant market share in the European energy mix and therefore have enough installed capacity to play a significant role in supporting wind power.
The fourth fuel with a significant market share is hydro. Hydro instruments such as pumped storage and reservoirs can deliver a highly flexible electricity supply at relatively low costs, but depend on the availability of suitable topographical locations. Because hydro power needs a significant altitude difference, suitable locations are often far away from suitable wind locations. Moreover, most of the available locations within Europe have already been developed.7
A second disadvantage of hydro storage is its large environmental impact. Environmental concerns will make it difficult to develop the remaining available locations. The possibilities to expand hydro storage capacity in Europe may therefore be limited to upgrading existing installations (Geschler, 2010). The third type of hydropower, run‐of‐the‐river, is seen as must‐run generation capacity. Run‐of‐the‐river hydro does not store the water, but runs on the continuous river flow. As with wind, it is more a supply‐driven production technology.
7 It is estimated that about 75% of the global potential for hydropower is already developed in Europe (EC, 2008).
57.8%
27.8%
10.7%3.5%
0.2%Electricity produced
54.6%
15.9%
17.0%
4.8% 7.7%
0.1%
Installed capacity
Conventional thermal
Nuclear
Hydro
Pumped storage
Wind
Geothermal
27.9%
18.4%
5.4%
39.8%
1.7%
5.5%
1.2% Hard coal
Lignite and peat
Petroleum products
Natural gas
Derived gases
Biomass
Industrial wastes

© OECD/IEA 2012 The Impact of Wind Power on European Natural Gas Markets
Page | 25
Delivering flexibility: technical capabilities
Supply flexibility, the extent to which a generating unit can vary its output in response to changes in demand, depends not only on the fuel and generating cycle used, but also on the age of the unit, its size and its design specifications. Every generating unit is different and can deliver a different amount of supply flexibility. This section discusses the capabilities of coal‐, gas‐ and nuclear‐fired technologies, on the basis of general design assumptions.8 A more extensive analysis of the flexibility of different regional and national electricity systems has been carried out within the IEA’s Grid Integration of Variable Renewables (GIVAR) project (IEA, 2011a).
A distinction will be made between two different gas‐fired technologies, the open cycle gas turbine (OCGT) and the combined cycle gas turbine (CCGT). An OCGT consists of a gas turbine powered by hot exhaust gases, which are then vented. In a CCGT, the gas turbine is combined with a boiler system; the exhaust gases are not vented but used to produce steam. Nuclear‐ and coal‐fired units are boiler systems in which the generated heat is used to turn water into high pressure and temperature steam, which then is used to run steam turbines (Vuorinen, 2008).
Several technical and economical measurements exist for power plant flexibility (Chalmers, 2010). This working paper will use a selection of these measures to give an indication of how flexible different types of power generators can be used (Table 4).
Table 4 Technical/economical indications of power flexibility
Technical measure of plant flexibility Relevance
Start-up time (cold start/hot start) The amount of time it takes to bring a generator from an offline condition to the point that it is generating electricity at its minimum output level.
Start-up costs The amount of money (primarily for fuel, but also for labour) required to bring a unit from a cold condition to the point that it is generating electricity at its minimum stable generation.
Ramp rate (up/down) The speed (in MW/minute) with which a generator can move from one output level to another.
Minimum stable generation (MSG) The lowest capacity at which a generator can be operated without any significant technical difficulty.
Source: Chalmers, 2010.
Start‐up time
The start‐up time is the amount of time it takes a power plant to go from no electricity production to producing at its minimum stable generation (MSG). A low start‐up time is an advantage in a system with a highly variable demand, as power plants can be shut down in periods of low demand and electricity prices, but can be started up again quickly when demand increases and prices rise.
The start‐up time of a boiler depends on the amount of time it has been standing still (down time); systems need to be heated up gradually to prevent thermal stress damage. Starts are usually categorised as cold, warm or hot starts, depending on the amount of time that has passed since shutdown. A hot start is a start after only a short shutdown (<8 hours), whereas a cold start is a start after a longer shutdown (>48 hours) (Gostling, 2002).
8 The figures mentioned in this section should not be seen as representative for all generating units and are more indicative of the differences between fuels.

The Impact of Wind Power on European Natural Gas Markets ©OECD/IEA 2012
Page | 26
Table 5 Start‐up time per technology
Technology Hot start Cold start Relative
flexibility**
Natural gas OGCT 10-40 minutes 10-40 minutes
++ CCGT 10-40 minutes* 10-40 minutes*
Coal Boiler 40-60 minutes 1-10 hours -
Nuclear Boiler 60-120 minutes 13-24 hours --
* After this period a CCGT only has its turbine capacity available.
**The symbols show the relative flexibility of the different technologies; the ++ shows the most flexible technology, the ‐‐ shows the least flexible unit.
The time it takes to start up a boiler depends on both its size and thermal stress limits. From a hot start, it may take a boiler 40 to 60 minutes to come to a temperature at which it can start producing electricity (Kehlhofer et al., 2009). With a cold start, start‐up time lies between 1 and 10 hours, depending on the boiler size and its thermal stress limits (Vourinen, 2008).
The time it takes a gas turbine to start up is largely independent of its standstill time. A gas turbine must be brought up to speed9 before it can handle the high‐pressure hot exhausts on which it normally runs. To start up a turbine an independent power source is used, which might be steam, electricity or diesel (Boyce, 2002). Gas turbines can start up fairly quickly, producing electricity within 10 to 30 minutes, depending on the size of the installation.
A CCGT works with a combination of a gas and a steam turbine, but both do not have to be running to produce electricity. A CCGT can produce electricity within 10 to 30 minutes, when its gas turbine is running. During the period it takes to warm up the boiler system, it has access to only around two‐thirds of its generating capacity (Biven, 2002).
Start‐up costs
Starting up a generator costs money: a boiler has to be heated to the temperature at which it can start producing electricity again and a gas turbine must be brought up to speed. Both these processes create fuel and labour costs. The largest part of the start‐up costs are the fuel costs.
A comparison of systems (Table 6) shows that boiler systems consume significantly more fuel in the start‐up period than turbine systems (Meibom et al,. 2007); start‐up costs of an OCGT are therefore significantly lower than those of a coal‐fired or nuclear powered plant or a CCGT.
Table 6 Comparison of relative start‐up fuel costs per technology
Technology Relative flexibility
Natural gas OCGT ++
CCGT +
Coal Boiler --
Nuclear Boiler --
Comparing a CCGT and a coal‐fired system (which both use boilers) is more complex as fuel costs of a start‐up depend on the age of the installation and the size of the boiler. A CCGT with the same generating capacity as a coal‐fired plant will have a smaller boiler;10 fuel costs of a CCGT
9 Around 3 000 RPM.
10 Part of its capacity is delivered by the gas turbine.

© OECD/IEA 2012 The Impact of Wind Power on European Natural Gas Markets
Page | 27
therefore are lower per MW of generation capacity than those of a coal‐ or nuclear‐fired power plant (Meibom, 2007).
In addition to start‐up costs, power plants incur cycling costs due to starting and stopping. In a cycling process, boilers and turbines go through large changes in pressure and temperature, which cause damage to the power plant over time. As a result, cycling costs include higher maintenance costs and decreasing life expectancy of plant parts. Cycling costs are hard to calculate and are often underestimated by the power industries (Lefton and Besuner, 2001).
Ramping rate
Both start‐up times and start‐up costs will determine which generators can (and will) be turned on or off when residual demand increases or decreases. Since most generating units can produce at variable output levels, it is not always necessary to turn a unit on or off. The ramp rate (MW/minute) shows how fast a generator can change its output (Table 7). A high ramp rate enables a generator to follow rapid changes in demand.
Table 7 Ramp rate per technology
Technology Ramp rate
(% of total capacity/minute) Relative flexibility
Natural gas OCGT 20%-30% ++
CCGT 5%-10% +
Coal Boiler 1%-5% -
Nuclear Boiler 1%-5% -
The speed with which a generator can ramp depends on the age of the installation; older installations often have a lower ramp rate than new ones (Ihle, 2003). Older installations were often built as base‐load plants and are not designed to quickly increase or reduce output.
A boiler system has a relatively high thermal inertia; the temperature in a boiler system changes slowly when the amount of fuel input is changed. The temperature in the boiler determines the amount of heat, which in turn determines steam flow to the turbine and thus electricity production. In a gas turbine, electricity production is determined by the amount of exhaust gasses fed into the turbine system, which depends on the amount of natural gas burned (Saravanamutto, Rogers and Cohen, 2009).
The link between the amount of fuel input and the amount of electricity produced is much more direct and less hindered by thermal inertia in a gas turbine system than in a boiler system. This means gas turbine systems have a significantly higher ramp rate than boiler systems. A CCGT is a combination of a gas turbine and boiler system, making it less flexible than an OCGT system, but more flexible than coal or nuclear power plants (Vuorinen, 2008).
Minimum stable generation
The minimum stable generation (MSG) output is the lowest amount of electricity a generator can produce without the installation becoming unstable. The advantage of a low MSG is that a power plant has a large, flexible production range. Because starting and stopping a generator costs both time and money, it is sometimes preferable to run at MSG instead of stopping an installation, even though efficiency at MSG is lower. Generators can often operate at loads lower than the stated MSG, but at these very low loads incomplete combustions can significantly increase emissions, often to levels higher than those allowed by regulation.

The Impact of Wind Power on European Natural Gas Markets ©OECD/IEA 2012
Page | 28
MSG is considered to be the load at which the unit can safely operate without the input of a supplementary support fuel becoming necessary and without breaking any emission regulations. Research shows that MSG can vary greatly between different generating units. Coal‐fired plants have a MSG of around 50% (Northwest Power Planning Council, 2002), although for a new plant MSG might be as low as 40% (Linnenberg, Oexmann and Kather, 2009) (Table 8).
Table 8 Minimum stable generation per technology
Technology Minimum stable generation (MSG) Relative flexibility
Natural gas OCGT 25%-30% ++
CCGT 40% +
Coal Boiler 40%-50% -
Nuclear Boiler 50%-60% --
A CCGT has a MSG of around 40% when running in CCGT mode. In open cycle mode, i.e. when not using the exhaust gasses to also produce electricity, MSG is significantly lower at around 25% to 30%. An OCGT can have a MSG as low as 25% to 30% of its turbine capacity (Vuorinen, 2008).
Nuclear power plants do not have the problem that emissions rise at low load production. There is little information available about the MSG of nuclear power plants. One study suggests that new design nuclear power plants might be capable of producing at 25% of capacity (Cox, 2010), but most studies assume that MSG of a nuclear power plant will lie between 50% and 60% of maximum output (Vuorinen, 2008).
All three of the generation technologies analysed in this section have the capacity to change their output in response to changes in either demand or in wind output (Table 9). Natural gas, both OCGT and CCGT, with its relatively low start‐up times, start‐up costs, high ramp rates and large production range, seems to be well positioned to respond to fast changes in demand due to fluctuations in wind output. Still, all three technologies have the technical capabilities to respond to more long‐term fluctuations in wind output.
Within these technical capabilities, which units actually respond to demand changes strongly depends on the cost of generation. For existing generation capacity, marginal costs determine what units are utilised; the levelised costs of electricity largely determine investments in generation capacity.
Table 9 Relative flexibility of generation units summarised per generation fuel
Relative flexibility Natural gas Coal Nuclear
OCGT CCGT Boiler Boiler
Start-up time ++ ++ - --
Start-up costs ++ + - --
Ramp rate ++ + - -
Minimum stable generation ++ + - --
Delivering flexibility: costs
As indicated above, all three of the technologies discussed have the capacity to respond to changes in demand. Within the boundaries of technical capabilities, costs determine which units actually are used in a flexible manner.

© OECD/IEA 2012 The Impact of Wind Power on European Natural Gas Markets
Page | 29
Short‐term marginal costs determine which of the units already installed will produce electricity and which are shut or ramped down. By contrast, the levelised costs of electricity (LCOE)11 largely determine which type of power plant will be built to fill future residual demand.
This section discusses the position of gas on both the short term (based on marginal costs) and on the long term (based on the LCOE). It uses data from the 2010 edition of the IEA publication Projected Costs of Generating Electricity (IEA, 2010b).
Short‐term marginal costs
In liberalised electricity markets, where different electricity producers compete, short‐term marginal costs of production determine which power generating units produce electricity, barring other production limitations or market disruptions.
The marginal cost of production is the change in total generation costs that arises when the quantity of power produced changes by one unit; in other words, the cost of producing one more unit. Producers are interested in minimising their costs and will increase production of the unit with the lowest marginal costs. When demand decreases, a producer – within the technical limitations of the portfolio of generating units – will decrease production of the unit with the highest marginal costs, again minimising costs per unit.
The marginal costs of the first unit of production are equal to the start‐up costs of the unit. After start‐up, the marginal costs of production are determined by the costs of the fuel used, the efficiency with which this fuel is transformed into electricity and, in countries where CO2 has a price, the price of CO2 emissions and the emissions per unit electricity produced.
The types of electricity generation capacity available in an electricity system can be ranked in a merit order that shows all types in ascending order of their short‐term marginal costs. At the bottom of the merit order are must‐run units such as run‐of‐the‐river hydro, wind and cogeneration,12 units that have zero or even negative marginal costs. Low in the merit order are the units whose marginal costs are very low as they have low fuel and CO2 emission costs, for example nuclear power plants.
In the top range of the merit order are the fossil fuel‐fired power plants: coal, natural gas and oil. Fossil fuel‐fired power plants have both significantly higher fuel costs than renewable or nuclear installations and, in Europe at least, face CO2 emission costs. Ranking of the different fuels within the merit order depends on the actual fuel and CO2 prices; due to its lower efficiency, OCGT units can almost always be found at the high end. The merit order of a particular country depends on its installed generation capacity, the actual fuel prices of the different fossil fuels, the CO2 price and its interconnection with other countries.
Demand determines which generating units will run and which will not; all units under the demand line will produce electricity, those above will not. A change in residual demand will shift the demand curve up or down. Which fuel responds to this change in demand depends both the on merit order and on where the demand curve meets the merit curve.
Only in extreme situations or in countries with a very high market share of nuclear power are there times when nuclear becomes the generator with the highest marginal costs and will nuclear‐fired units respond to changes in residual demand. Marginal cost theory dictates that, in most cases, the fossil fuel‐fired generation units flex in response to changes in demand. Whether this will be coal‐ or natural gas‐fired units depends not only on the generation mix, but also on the actual fuel prices and CO2 price.
11 Levelised cost of generation is the lifetime discounted cost of an asset expressed in cost per unit of power produced. 12 Cogeneration refers to the production of combined heat and power (CHP).

The Impact of Wind Power on European Natural Gas Markets ©OECD/IEA 2012
Page | 30
Figure 17 Merit order: stylised representation
Levelised costs of electricity
Many factors together determine the type of generation capacity an electricity producer invests in. While security of supply, portfolio diversification and public image all play a role, the most important factor is the economic return of the investment. A producer tries to minimise long‐term marginal costs, or levelised costs of electricity (LCOE).
The LCOE is a function of fixed costs, such as construction and investment costs (i.e. costs that are not influenced by the amount of electricity a generator will produce) and variable costs (such as fuel and CO2 costs) that may vary in relation to the number of units produced.
The expected capacity factor is important in calculating LCOE as it determines the expected total amount of electricity produced. The impact of the capacity factor on the LCOE varies per technology as it is highly dependent on the share of fixed costs within the total costs (IEA, 2007). Nuclear power has very high fixed costs, but low fuel costs and no CO2 costs; thus, it has relatively low variable costs. A natural gas‐fired unit has relatively low fixed costs but high variable costs, due to high fuel costs and CO2 costs.
When the capacity factor decreases, the higher fixed costs of a nuclear power plant cause its LCOE to increase faster than that of a gas‐fired unit. Coal‐fired power plants have lower investment costs and higher fuel costs than a nuclear power station, but higher investment costs and (on average) lower fuel costs than a gas‐fired power plant. Figure 18 shows how the LCOE of the different fuels might develop as the capacity factor decreases.
The capacity factor at which a certain fuel becomes less costly than another strongly depends on the expected fuel costs, CO2 costs and the exact investment costs. On the basis of the five‐year average fuel and CO2 prices (2005‐10),
13 nuclear power has the lowest production costs at a 100% capacity factor and natural gas has the highest. At 95%, coal becomes the lowest‐cost fuel in which to invest; but at 85% capacity factor, natural gas becomes less costly than either coal‐fired or nuclear power.
13 Markers used: natural gas – NBP, Coal – NWE marker and CO2 – Point Carbon.

© OECD/IEA 2012 The Impact of Wind Power on European Natural Gas Markets
Page | 31
Figure 18 Development of LCOE as a function of the capacity factor
Source: IEA (2010b) and IEA analysis.
Because of lower investment costs for gas‐fired units, their production costs do not increase as rapidly as those of coal or nuclear power when the capacity factor drops. The relatively low investment costs make natural gas an economically attractive fuel for delivering flexibility to the system, running at a relatively low capacity factor.
Figure 19 LCOE on the basis of 2005‐10 average fuel costs
Sources: IEA, 2010b and IEA analysis.
0
20
40
60
80
100
120
140
100 90 80 70 60 50
Production costs USD
/MWh
Load factor
Nuclear
Gas
Coal
0
20
40
60
80
100
120
140
100 90 80 70 60 50
Production costs USD
/MWh
Load factor
Nuclear
Gas
Coal

The Impact of Wind Power on European Natural Gas Markets ©OECD/IEA 2012
Page | 32
On the basis of both technical capabilities and costs, natural gas‐fired generation technologies seem to be the best suited of the three studied technologies to supply flexibility. All three studied generation types have the capacity to vary their output, but due to their low start‐up costs, rapid start‐up time and high ramp rate, natural gas technologies are well positioned to follow fast changes in wind output or to be used as running reserve. More long‐term demand changes can also be supported with both coal‐ and nuclear‐powered generation technologies.
For generation capacity already installed, marginal costs will determine (within the technical limits of the technology) which fuel will respond to changes in demand. Because of its low marginal costs, nuclear power will be producing mostly at base‐load, delivering flexibility only in extreme situations or in energy systems with a high nuclear market share. As their marginal costs strongly depend on actual fuel and CO2 prices, it is difficult to determine exactly how existing coal‐ and gas‐fired generation units will interact in response to changes in wind.
Due to its relatively low production costs at low capacity factors and good technical capabilities to deliver flexibility, natural gas is the most attractive technology for future investments in generation capacity aimed at supporting a higher wind market share. This makes it likely that the role of natural gas in supporting wind will increase in the future. As a result, wind will also have a growing impact on natural gas demand in the power sector.

© OECD/IEA 2012 The Impact of Wind Power on European Natural Gas Markets
Page | 33
How wind output affects electricity demand
Section 2 discussed how many European countries want to significantly increase the share of renewables in their energy mix. The different National Renewable Action Plans indicate that wind will play an important role in achieving this. As a result, the market share of wind in European electricity generation would increase significantly.
To evaluate how an increasing wind market share changes the way in which other forms of generating capacity will be operated, it is important to understand how wind power changes the electricity demand patterns that these forms of generating capacity need to fill. This section discusses the impact of wind output by comparing power demand patterns with patterns of residual demand, i.e. the demand that needs to be filled with all other forms of generating capacity but wind. A preferred dispatch of wind output is assumed.
Envisaging that the effect of wind on demand patterns might change as wind’s market share increases, the analysis has been made using hourly wind and demand data from both Germany (2006‐09) and Denmark (2005‐09).
Denmark is a relatively small country, with relatively homogenous geographical characteristics. This limits the effects of geographical diversification within the country and thus increases the variability of Danish total wind output. The effects of wind might be different in a larger country with a comparable wind market share but where wind farms are more geographically dispersed.
Key points
The exact impact of wind on residual electricity demand can differ among countries, depending on both the characteristics of wind output and electricity demand.
An increasing wind market share changes not only the height of the demand load duration curve (LDC), but also its slope. The amount of generation capacity that runs at a high capacity factor (70% to 100%) decreases, while the amount of capacity running at a low capacity factor (0% to 30%) strongly increases.
Although variability is often mentioned as one of the main challenges associated with wind integration, the actual effect of wind on residual demand is relatively limited; as wind and electricity demand are not correlated, wind does not amplify existing demand patterns.
At a 7% market share, wind power increases the residual demand spread, (i.e. the difference between minimum and maximum residual demand) and decreases demand predictability. The variability of demand does not significantly increase. At a 19% wind market share, the variability of power demand does increase, while the residual demand spread increases further.
As changes in wind output and in electricity demand are not correlated, an increasing wind market share does not significantly change the ramping speeds of residual demand. Only at a high market share (19%) does wind cause faster changes in residual demand.

The Impact of Wind Power on European Natural Gas Markets ©OECD/IEA 2012
Page | 34
Table 10 Characteristics of German and Danish wind production, 2005‐09
2005 2006 2007 2008 2009
Germany
Installed capacity (MW)* 18 428 20 622 22 247 23 903 25 777
Wind production (GWh) 27 229 30 710 39 713 40 574 37 809
Total demand (GWh) 576 999 580 204 581 880 578 821 548 374
Market share wind 4.7% 5.3% 6.8% 7.0% 6.9%
Denmark
Installed capacity (MW)* 3 122 3 136 3 125 3 180 3 465
Wind production (GWh) 6 615 6 105 7 173 6 980 6 715
Total demand (GWh) 35 457 35 977 36 114 36 102 34 609
Market share wind 18.7% 17.0% 19.9% 19.3% 19.4%
*Installed capacity is the capacity installed at the end of the year.
Source: IEA and EWEA data.
Residual demand characteristics
Load duration curve
One way of assessing the impact of wind power is to compare the LDC of demand and residual demand. The LDC shows the actual hourly demand in a descending order and gives a good indication of the amount of generation capacity that is expected to run at different capacity factors.
Figure 20 LDC of demand and residual demand in Germany, 2007
Source: IEA analysis.
Wind significantly changes the LDC, not only bringing down the maximum demand and the level of base‐load demand, but also significantly changing its slope. In the Danish system with its higher market share of wind, this effect is more pronounced.
0
10
20
30
40
50
60
70
80
90
1 1 001 2 001 3 001 4 001 5 001 6 001 7 001 8 001
Dem
and (GW)
Hours
Demand
Residual demand
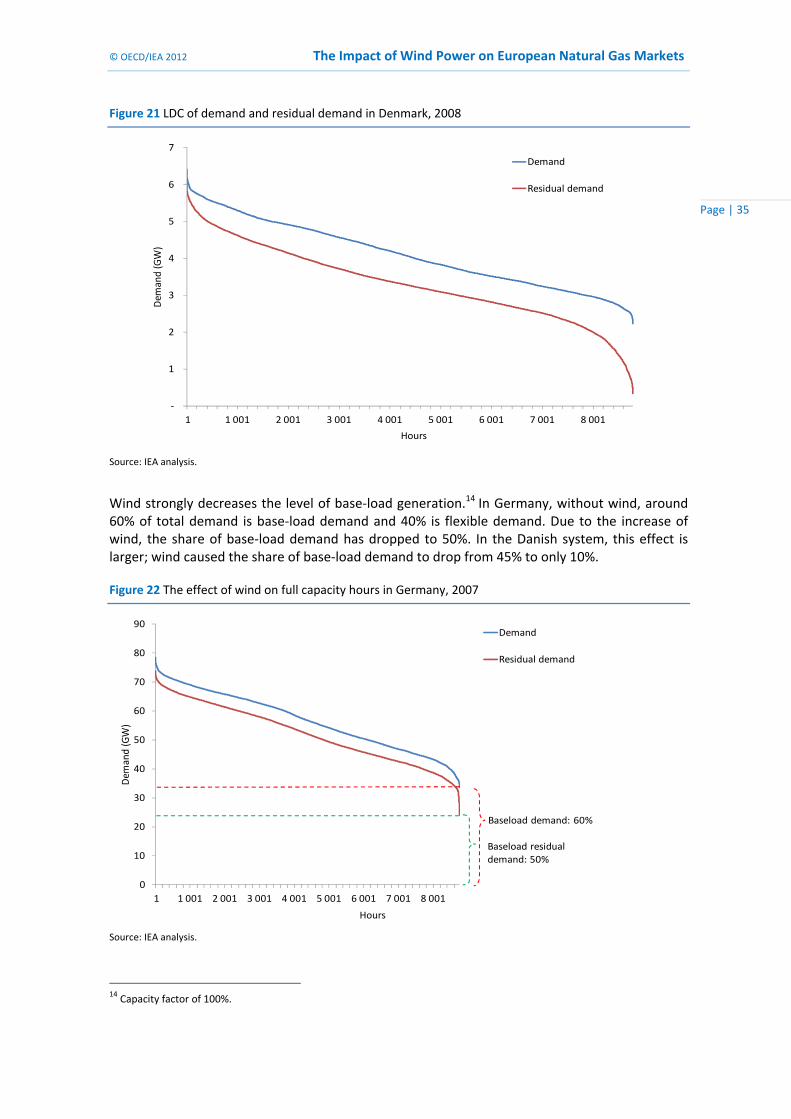
© OECD/IEA 2012 The Impact of Wind Power on European Natural Gas Markets
Page | 35
Figure 21 LDC of demand and residual demand in Denmark, 2008
Source: IEA analysis.
Wind strongly decreases the level of base‐load generation.14 In Germany, without wind, around 60% of total demand is base‐load demand and 40% is flexible demand. Due to the increase of wind, the share of base‐load demand has dropped to 50%. In the Danish system, this effect is larger; wind caused the share of base‐load demand to drop from 45% to only 10%.
Figure 22 The effect of wind on full capacity hours in Germany, 2007
Source: IEA analysis.
14 Capacity factor of 100%.
‐
1
2
3
4
5
6
7
1 1 001 2 001 3 001 4 001 5 001 6 001 7 001 8 001
Dem
and (GW)
Hours
Demand
Residual demand
0
10
20
30
40
50
60
70
80
90
1 1 001 2 001 3 001 4 001 5 001 6 001 7 001 8 001
Dem
and (GW)
Hours
Demand
Residual demand
Baseload demand: 60%
Baseload residual demand: 50%

The Impact of Wind Power on European Natural Gas Markets ©OECD/IEA 2012
Page | 36
While the amount of base‐load capacity strongly decreases due to an increasing wind production, the maximum observed demand only slightly decreases. Due to its irregular character, wind has a limited effect on the maximum demand, indicating that wind needs to be supported by other fuels. In the Danish system, base‐load drops 86%, while maximum residual demand decreases by only 5%.
Wind also changes the slope of the LDC; in the Danish system, wind greatly decreases the share of total capacity running at a high capacity factor (70% to 100%), while the share of capacity running at a low capacity factor (0% to 30%) increases. In particular, capacity running at a very low load factor (0% to 10%) increases almost 50%.
Figure 23 Capacity factor of demand and residual demand in Denmark, 2008
Source: IEA analysis.
Fuel flexibility
Variability is often mentioned as one of the main challenges when integrating a large amount of wind capacity in an electricity system. A distinction can be made between two types of variability.
The first is the spread between the minimum and maximum values within a group of values – the extreme low and high. This refers to the difference between the maximum and minimum hourly, daily or annual wind production. A high spread in residual demand creates a higher spread in the amount of fuel needed to fill this demand. As fuel, especially natural gas, is often contracted in advance, an increasing demand spread increases the need for flexibility in natural gas supplies.
The second type of variability is how dispersed a group of values is within a group or a specific period of time. Standard deviation is one measure used to quantify this variability.15 As the variability of residual electricity demand increases the amount of fuel required to fill this demand also fluctuates more. As natural gas often is bought as a flat delivery, or with a limited contractual flexibility, this type of variability also increases the need for supply flexibility.
15 The standard deviation is a measure of the dispersion of a set of data. It is the square root of the average squared
differences from the average of the dataset.
0%
10%
20%
30%
40%
50%
60%
70%
80%
90%
100%
Full load
90% ‐100%
80% ‐90%
70% ‐80%
60% ‐70%
50% ‐60%
40% ‐50%
30% ‐40%
20% ‐30%
10% ‐20%
0% ‐10%
% of total dem
and
Capacity factor
Demand
Residual demand
Demand ‐ cumulative
Residual demand ‐ cumulative

© OECD/IEA 2012 The Impact of Wind Power on European Natural Gas Markets
Page | 37
The flexibility of natural gas flows can be increased in several ways: increased flexibility in production or supply or via storage capacity (using short‐term or long‐term storage and line‐pack). To assess the effect of wind on the need for fuel flexibility, the amount of storage capacity (working volume) needed to cover the effects of an increasing wind market share is calculated.
The calculations assume a 50% capacity utilisation factor for gas‐fired generation capacity. A distinction is made between short‐term storage (which covers within‐day demand variation and day‐ahead demand spread) and long‐term storage (which covers both seasonal variations and year‐ahead demand spread).
Figure 24 Variability and spread in residual demand
Demand spread
As wind output varies widely from one hour to another (the German system showed a spread in hourly wind output of between 35 MWh and 20 671 MWh), wind can significantly increase the spread of residual demand.
Demand itself is also variable; the observed spread between minimum and maximum hourly demand is around 100% of average demand, the lowest observed value being 50% below average demand and the highest 50% above. The spread around daily demand is 60% on average, in both Germany and Denmark. The spread between minimum and maximum hourly wind production is significantly larger, at 400% of average production.
In theory, wind could strongly increase the spread of residual demand when low demand coincides with a period of high wind output, or when high demand coincides with a low wind output. Based on observed demand and residual demand figures, the actual increase in the spread is limited; in reality, the hours of extreme wind production did not coincide with the hours of extreme demand. The observed spread in daily German residual demand was only 7% higher than that of demand, creating an additional day‐ahead demand spread of 55 GWh and a short‐term gas storage need of 10.6 million cubic metres (mcm).
Even at higher wind market shares, the same conclusion can be drawn. In the Danish system, the theoretical spread in daily residual demand is more than double the spread of demand. In reality, the
30 000
35 000
40 000
45 000
50 000
55 000
60 000
65 000
70 000
75 000Demand Average demand
Spread
Variation
Variation

The Impact of Wind Power on European Natural Gas Markets ©OECD/IEA 2012
Page | 38
observed spread in residual demand is only 40% higher than in demand. The additional day‐ahead demand spread in the Danish system can be covered by 6.2 mcm of short‐term storage capacity.
On an annual basis, the spread between minimum and maximum annual demand between 1990 and 2009 was 15% of average demand in both Germany and Denmark. In the same period, the capacity factor of wind production varied between 10.8% and 21% in Germany (BUNR, 2010) and between 16% and 26% in Denmark (ENS data).
In theory, this spread could increase the between‐year spread in residual demand by 25% in Germany and 50% in Denmark. The observed between‐year spread in residual demand was only 5% higher in Germany, creating a long‐term storage demand of around 800 mcm. In Denmark, a 8% higher spread in residual demand requires 90 mcm of long‐term storage. To compare, at the beginning of 2010, Germany had a total storage capacity of 20.5 billion cubic metres (bcm), while Denmark had a total storage capacity of 1 bcm (Cedigaz, 2010).
A higher demand spread not only increases the need for storage capacity, but also increases the required send‐out and injection capacity. A higher delta between average and maximum demand and between average and minimum demand create the need for a higher required maximum flow from the storage and the maximum flow into the storage.
Clearly, as the market share of wind increases, the spread between possible minimum and maximum demand grows. Although the theoretical increase in the spread is very large, the actual observed increase in the spread is limited. It is important to realise that more extreme situations can occur. The above calculated spread does not take into account the relative predictability of demand and wind production. A high predictability strongly decreases the possible demand spread.
Predictability
Electricity demand can be predicted fairly accurately, both on a short‐ and long‐term basis. There is a great deal of experience with predicting electricity demand, which has relatively regular diurnal and seasonal patterns. The average error margins in day‐ahead load forecasting are between 1.5% and 3% of peak‐load (Holtinnen, 2004).
The predictability of demand decreases as the predictions are made more in advance, especially in countries where the weather strongly influences electricity demand (for example, where electricity is used for heating or cooling).
To date, little has been written on predictability of electricity demand on a more long‐term basis. A comparison of the EIA electricity demand projects, as published in the EIA Annual Energy Outlook between 1999 and 2009 (EIA, 1999‐09) and realised electricity demand, shows an average year‐ahead prediction error of 2.3%, the largest prediction error being 3.4%.16
Electricity demand is shown to be relatively predictable. Long‐term predictions of wind output are less reliable; as previously mentioned, the predictability of wind on a year‐ahead basis is practically zero. Accounting for the predictability of demand, at a 7% market share, wind doubles the year‐ahead demand spread, thus doubling the need for long‐term fuel flexibility in the power market. At a 19% market share, the need for long‐term flexibility more than triples.
On a day‐ahead basis the predictability of wind increases; the error margin of the prediction decreases to about 15% of average production (Torre Rodriquez, M. de la, 2009). This error margin is still larger than the day‐ahead prediction error in demand, and thus the need for additional day‐ahead fuel flexibility increases further.
16 Excluding the extreme error seen in the 2008 prediction.

© OECD/IEA 2012 The Impact of Wind Power on European Natural Gas Markets
Page | 39
Variability
The second type of variability is how dispersed a group of values is within a group or period of time. One of the measures used to quantify this kind of variability is the standard deviation. This type of variability also creates a need for flexibility. Natural gas is often contracted as a flat delivery; flexibility instruments are needed to change a flat supply into the variable daily and hourly demand.
As mentioned before, power demand is not correlated with wind output. Because of this, adding wind‐powered generating capacity to an electricity system, even though wind is relatively variable, does not automatically mean that the variability of residual demand exceed that of the underlying demand for electricity.
As wind and demand are not correlated, the chance that in a certain time period the two elements amplify each other, leading to situations of extremely high or low residual demand (high demand coinciding with low wind, or vice versa) is just as high as the chance that they will dampen each other, leading to a more average residual demand. An analysis of wind and demand data in Germany shows that the variability of residual demand is indeed not significantly higher than that of demand; the standard deviation of residual demand is only 0.37% higher. As the variability of demand is not higher, there is no additional need for flexible supplies or storage volumes, neither short‐term nor long‐term.
Analysis of the required flows in and out of the storage shows that, although the amount of storage required does not change, the way in which the storage is used does change. Most long‐term storages are single‐cycle, with a strong seasonal pattern; they are filled in summer and emptied in winter, switching from injecting to sending out (or vice versa) only twice per year. An increasing wind market share changes this pattern, with storages cycles having to occur several times during a year.
As the market share of wind increases, the spread in wind output becomes higher than the spread in demand. Variability increases only at these higher market shares. In the Danish system, the standard deviation of residual demand is 15% higher than that of demand. At this market share (19%), wind does increase the need for storage, even though the increase is not very large. Within the Danish system, the increase in the reviewed five years was 20% at the most.
Ramping
Ramping rates show how fast changes in demand, both up and down, can be. A higher ramping rate means the electricity system needs to be able to cope with larger short‐term demand changes, increasing not the need for flexible capacity but for fast, flexible capacity. The section on the technical capabilities of different fossil‐fuel generation technologies shows why a high ramping rate is difficult to counteract with other generation units; the speed at which operators of generation units can adjust output is limited and ramping up a non‐producing unit takes even more time.
Although the theoretically possible maximum ramp of demand increases as wind market share increases, the observed maximum change in hourly residual demand in Germany did not exceed the maximum ramp in demand. In Germany in 2008, the largest observed change in demand between hours was 15 527 MWh; the largest observed change in residual demand observed was 15 447 MWh. In Denmark, the maximum ramping rate of residual demand was 15% higher than that of demand. This is most likely caused by absolute ramping rates of wind exceeding those of demand.

The Impact of Wind Power on European Natural Gas Markets ©OECD/IEA 2012
Page | 40
A higher ramping speed does not immediately change the way in which other generation types are deployed. When demand changes can be well predicted, any type of generating capacity can be turned on or off in time to respond to demand changes. Here again, the limited predictability of wind changes the picture. As mentioned, even at an hour in advance, the error margin of wind is still 4% to 5% of average production (the actual error can be significantly larger).
The limited predictability of wind, not the fast changes of wind output, creates an increased need for running reserves. As changes can be both upward and downward, running reserves need to include generating capacity currently running and capable of ramping down quickly, as well as generating capacity not running or running below maximum output that can be ramped up quickly.
As previously discussed, all three of the researched generation technologies have the technical capabilities to be used as running reserve, although its lower start‐up costs and higher ramp rates do make natural gas more suitable to be used as running reserve than coal and nuclear.

© OECD/IEA 2012 The Impact of Wind Power on European Natural Gas Markets
Page | 41
The effect of wind power on gas markets
The previous section discussed how adding wind power to an electricity system changes the characteristics of residual electricity demand and fuel demand in the power sector. Earlier sections discussed how costs and technical capabilities of the different supply‐side response instruments determine which instruments will be used and how they will be used to fill this residual demand.
This section combines the conclusions of the previous three sections to determine the possible effects of an increasing wind market share on natural gas markets. The assumption is made that, in the European electricity system, natural gas is the marginal fuel and will supply a large part of the required flexible electricity supply. Both nuclear‐ and coal‐fired generation capacities will run as much base‐load as possible.
This assumption slightly exaggerates the role of natural gas in supporting wind, as other instruments such as coal, hydro storage and interconnection will also play a role, but it clearly shows the challenges the natural gas market might face.
Interaction between wind output and gas demand
The ways in which an increasing wind market share – and the resulting changes in gas demand in the power sector – affect gas markets depends on the interaction between the demand for natural gas in the power sector and gas demand in other sectors. Much of the total variability in gas demand reflects gas demand in the residential and commercial sectors, and is caused by variations in demand for heating in response to changes in temperature.
Key points
In systems without a significant wind market share, there is no correlation between gas demand and wind output, indicating that an increasing wind market share does not amplify or weaken existing natural gas demand patterns.
As the wind market share increases, the capacity factor of natural gas‐fired generation capacity drops significantly, leading to higher costs of electricity generated and higher transport costs.
An increasing wind market share increases the spread in both short‐ and long‐term gas demand and decreases demand predictability, creating a need for additional gas supply flexibility, both short and long term.
An increasing wind market share changes the utilisation of existing sources of natural gas flexibility. The utilisation of storage capacity will go from single‐cycle to multi‐cycle. The increasing demand spread also increases the required send‐out and injection capacity.
An increasing demand spread and decreasing predictability do not have to create natural gas supply problems, as there are several possibilities to increase the flexibility of natural gas supply: additional import and production flexibility; long‐ and short‐term storage capacity; and LNG import capacity.
The spot market can play an important role in delivering flexibility to individual generators, although an improvement of the products offered on the spot markets is necessary, especially very short‐term products (i.e. within‐day trade).

The Impact of Wind Power on European Natural Gas Markets ©OECD/IEA 2012
Page | 42
A correlation between wind output and gas demand in other sectors could change the conclusions drawn earlier as wind would then enhance or weaken existing demand patterns. To rule out any possible correlations between natural gas demand and wind output, which could alter the results, an analysis of wind output and gas demand has been done on Belgian wind and gas data from 2010 and 2011. Belgium was chosen for this analysis because it has a very limited wind market share; in countries with a significant wind market share (such as Germany and Denmark), wind already influences total gas demand, thereby confusing the results.
In this period, Belgium had a wind market share in total electricity production of less than 1%. A comparison of the Belgian gas demand and wind production shows that there is neither a significant positive nor a negative correlation between wind output and gas demand.
Figure 25 Belgian hourly gas demand vs. hourly wind production
Data: 1 January 2011 to 31 January 2011.
Sources: Elia & Fluxys data.
As there is no correlation between wind output and gas demand, an increasing wind market share neither amplifies nor weakens existing gas demand patterns; the conclusions that were drawn for the effect of wind on natural gas demand in the power sector can also be drawn for total gas demand.
Gas markets
Based on data analysis of the actual interaction between wind turbine production, electricity demand and gas demand in several countries, it is clear that the effect of wind output on both electricity and gas demand can vary, depending on, for example, the position of gas in the energy mix and the variability of both electricity and gas demand. Nonetheless, some general conclusions can be drawn about the effect of wind on natural gas markets.
0
10 000
20 000
30 000
40 000
50 000
60 000
0 200 400 600 800 1 000 1 200 1 400
Gas dem
and (M
Wh)
Wind production (KWh)
Trend line

© OECD/IEA 2012 The Impact of Wind Power on European Natural Gas Markets
Page | 43
Gas becomes more attractive in the power sector
As the market share of wind increases, natural gas‐fired capacity becomes relatively more attractive to invest in compared to both coal‐fired capacity and nuclear‐fired capacity. Adding wind output to the system significantly decreases the average capacity factor of residual demand, especially the share of capacity running at very low capacity factors (0% to 10%) increases significantly.
At lower capacity factors, generation capacity with relatively low investment costs becomes more attractive. As natural gas‐fired capacity has relatively low investment costs compared to both coal‐ and nuclear‐fired capacity, adding wind to the system makes gas fired capacity more attractive; both CCGT systems and, for demand with a very low capacity factor, OCGT systems.
The capacity factor of gas‐fired capacity falls
An increase in wind market share strongly decreases the capacity factor at which gas‐fired capacity runs. Figure 26 shows the LDC of the Danish demand and residual demand, based on the assumptions that natural gas is the marginal fuel and does not have a position in the base‐load.17 While it seems that little changes due to wind, there are actually two distinct differences.
Figure 26 LDC of demand filled by natural gas‐fired capacity in Denmark, 2006
Source: IEA analysis.
First, the maximum demand that needs to be covered increases. In Denmark, this increase is more than 20% and in Germany, it is around 10%. Based on the assumptions made, this would mean additional gas‐fired generation capacity is necessary. In markets where natural gas has a significant position in the base‐load, the building of additional gas‐fired generation capacity might not be necessary, as natural gas, as the marginal fuel, loses its position in the base‐load.
The additional capacity will run at a very low capacity factor, running on average less than 1% of all hours. Due to the low capacity factor of added capacity, the average capacity factor of gas‐
17 The assumption is made that natural gas covers all demand with a capacity factor of 85% and lower.
0.0
0.5
1.0
1.5
2.0
2.5
3.0
3.5
4.0
1 1 001 2 001 3 001 4 001 5 001 6 001 7 001
GW
Hours
Demand
Residual demand

The Impact of Wind Power on European Natural Gas Markets ©OECD/IEA 2012
Page | 44
fired generation strongly decreases. This effect is further enhanced in situations where natural gas still has a significant market share in the base‐load.
As the capacity factor of generation capacity decreases, the LCOE increases (see Section 3). In most markets, these additional generation costs (due to a decreasing capacity factor) are not paid by the market, as the price of electricity is mainly determined by the marginal costs of production and not by the LCOE. Even though natural gas has relatively low investment costs compared to other fuels, at a high wind market penetration, the average capacity factor of gas‐fired generation capacity drops strongly. This could make even investments in natural gas economically unattractive.
Impact on gas demand varies; utilisation of transport capacity drops
The impact of wind output on natural gas demand depends on the position of gas in the generation mix. An increasing wind market share pushes wind out of the base‐load, while the demand for flexible generation to accommodate the variability of wind output increases. When natural gas has a significant position in the base‐load, this negative effect of wind on gas demand dominates and gas demand decreases. In situations where gas does not have a position in the base‐load, the positive effect might dominate, pushing up gas demand.
The utilisation of transport capacity bringing natural gas to gas‐fired plants decreases, together with the capacity factor of the gas‐fired generating capacity. As the demand spread increases, so does the spread in the amount of transport capacity needed. Consequently, generators will need to book transport capacity that will at times not be needed. The transport costs of natural gas will increase per MWh of electricity produced.
Variability in gas demand does not significantly change
Variability in natural gas demand is mainly caused by variations in temperature. An analysis of Belgian natural gas demand and wind output showed that in systems with no wind or only a very small wind market share, there is no correlation between natural gas demand and wind output.
As a result, the conclusions that were drawn for the effect of wind on natural gas demand in the power sector can also be drawn for total gas demand. The effect of an increasing wind market share on the variability of natural gas demand is limited. The standard deviation of hourly demand does not significantly increase as wind market share rises, so based on variability there is no need for additional storage volume.
An increasing wind market share does significantly change the way in which storages are utilised, moving from single‐cycle to multi‐cycle, with storages having to switch from injecting to sending out several times a year. Furthermore, due to an increasing spread between minimum and maximum demand, the maximum required injection and send‐out capacity also increase.
Demand spread increases, while predictability of demand drops
Even though the variability of demand does not significantly increase due to a growing wind market share, the demand for flexible natural gas supplies does increase. What increases is the demand spread and the limited predictability of wind reduces the overall predictability of gas demand.
Even though the increase in the demand spread is smaller than expected, based on the theoretical spread increase, the year‐ahead demand spread, taking predictability into account, still almost doubles at a 9% market share and more than triples at a 19% market share, this is mainly caused by the limited predictability of wind production. The increase in the day‐ahead

© OECD/IEA 2012 The Impact of Wind Power on European Natural Gas Markets
Page | 45
demand spread is smaller, as wind becomes more predictable at a shorter time frame. Also, although the actual observed increase in the demand spread was limited, more extreme situations can occur and systems must be able to handle them, further increasing the need for additional flexibility.
An increase in the demand spread creates a need for additional fuel flexibility, both on a short term (day‐ahead) and on a long‐term (year‐ahead) basis. Several instruments are available within the gas market that can deliver additional flexibility. For a system as a whole, additional long‐ and short‐term flexibility can be supplied via more flexibility in imports, import contracts or in production. However, as the production flexibility of indigenous European fields is currently limited and declining, this instrument has limitations. Contract flexibility could be an expansion of the spread between both the daily and yearly minimum and maximum take volumes, which would enable importers to import more or less in response to low or high wind production.
Additional flexibility in imports can be delivered by LNG import terminals, which often have spare capacity.18 The global LNG market currently shows significant amounts of both spot cargos and cargos that can be rerouted. LNG spot cargos or the rerouting of cargos could be a flexible source of supply in periods when wind output is low. As it often takes several days between the acquisition and delivery of an LNG cargo, buying LNG spot cargos is not a tool that delivers short‐term flexibility, although LNG terminals often also have a significant amount of short‐term storage capacity and a high send‐out capacity, which can be seen as short‐term flexibility.
Another option is to increase available storage volumes. Within Europe there are significant possibilities to increase storage capacity, but both the costs of storage and the development time of new storage volumes are significant. Again, as with the additional generation capacity required due to an increasing wind market share, the utilisation rate of the additionally required storage volumes is very limited. In Germany, the additional short‐term flexibility required due to a higher demand spread was used only around 20 times per year, making the costs of additional flexibility delivered by new storage capacity relatively high.
For electricity generators, additional fuel flexibility can also be created by increasing contract flexibility or access to storage capacity. Another instrument that can deliver flexibility to individual generators is a liquid spot market, in which generators can sell surplus volumes or buy additional volumes. The spot market seems a logical instrument for generators to acquire additional flexibility, as many (especially smaller) generators have no or limited access to storage or LNG capacity, also considering the high costs of expanding storage volumes or LNG capacity.
Currently, the largest part of trading on the spot market is done on a day‐ahead basis or with an even longer time horizon (e.g. month‐ahead or year‐ahead). Due to the short‐term unpredictability of wind, generators often know only at the last moment what their exact fuel demand will be. An increasing wind market share will therefore create a need for traded products with a very short time horizon; the within‐day trade. The liquidity of within‐day trading currently remains limited on European spot markets; also not all European markets currently trade within‐day products.
Natural gas spot prices become more variable
As the market share of wind increases, the demand for natural gas in the power market becomes more unpredictable and shows a larger spread. The spot market is one of the instruments that can help individual generators to balance their portfolio. As the market share of wind increases, wind output will exert greater influence on the demand and supply for natural gas on the spot market.
18 European LNG regasification capacity had an utilisation rate of around 50% in 2010 (IEA, 2011b).
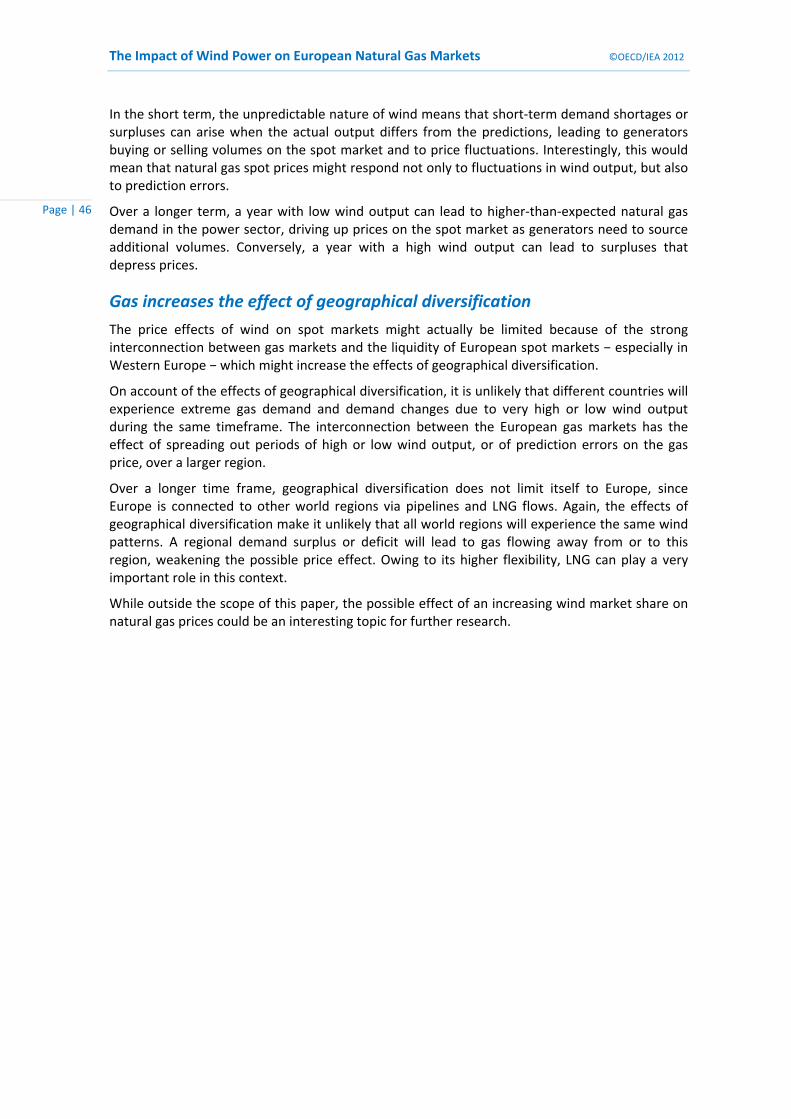
The Impact of Wind Power on European Natural Gas Markets ©OECD/IEA 2012
Page | 46
In the short term, the unpredictable nature of wind means that short‐term demand shortages or surpluses can arise when the actual output differs from the predictions, leading to generators buying or selling volumes on the spot market and to price fluctuations. Interestingly, this would mean that natural gas spot prices might respond not only to fluctuations in wind output, but also to prediction errors.
Over a longer term, a year with low wind output can lead to higher‐than‐expected natural gas demand in the power sector, driving up prices on the spot market as generators need to source additional volumes. Conversely, a year with a high wind output can lead to surpluses that depress prices.
Gas increases the effect of geographical diversification
The price effects of wind on spot markets might actually be limited because of the strong interconnection between gas markets and the liquidity of European spot markets − especially in Western Europe − which might increase the effects of geographical diversification.
On account of the effects of geographical diversification, it is unlikely that different countries will experience extreme gas demand and demand changes due to very high or low wind output during the same timeframe. The interconnection between the European gas markets has the effect of spreading out periods of high or low wind output, or of prediction errors on the gas price, over a larger region.
Over a longer time frame, geographical diversification does not limit itself to Europe, since Europe is connected to other world regions via pipelines and LNG flows. Again, the effects of geographical diversification make it unlikely that all world regions will experience the same wind patterns. A regional demand surplus or deficit will lead to gas flowing away from or to this region, weakening the possible price effect. Owing to its higher flexibility, LNG can play a very important role in this context.
While outside the scope of this paper, the possible effect of an increasing wind market share on natural gas prices could be an interesting topic for further research.

© OECD/IEA 2012 The Impact of Wind Power on European Natural Gas Markets
Page | 47
Abbreviations and acronyms AWEA American Wind Energy Association bcm billion cubic meter CCGT combined cycle gas turbine CHP combined heat and power EC European Commission EIA Energy Intelligence Agency EWEA European Wind Energy Association IEA International Energy Agency LCOE levelised costs of electricity LDC load duration curve LNG liquefied natural gas mcm million cubic meter MSG minimum stable generation m/s meter per second OCGT open cycle gas turbine PV photovoltaic WEO World Energy Outlook (IEA publication) WWEA World Wind Energy Association

The Impact of Wind Power on European Natural Gas Markets ©OECD/IEA 2012
Page | 48
References 50Hertz, www.50hertz‐transmission.net/en/151.htm, accessed August 2011.
Aprion, www.amprion.net/windenergieeinspeisung#, accessed August 2011.
AWEA (American Wind Energy Association) (2010a), U.S. Wind Industry Annual Market Report, year ending 2009, AWEA, Washington, DC.
AWEA (2010b), Market update: record 2009 leads to slow start in 2010, Press Release AWEA, Washington, DC.
AWEA (2011), U.S. wind industry first quarter 2011; market report April 2011, AWEA Data Services, Washington, DC.
Bivens, R. (2002), Startup and Shutdown NOx Emissions from Combined‐cycle Combustion Turbine Units, RMB Consulting & Research Inc, Raleigh, North Carolina.
Boyce, M. P. (2002), Handbook for Cogeneration and Combined Cycle Power Plants, The American Society of Mechanical Engineers, New York.
BUNR (Bundesministerium für Umwelt, Naturschutz und Reaktorsicherheit)(2010), Erneuerbare Energien in Zahlen (Renewable energy in numbers), BUNR, Berlin.
Cedigaz (2010), Underground Gas Storage in the World; 2010 edition, Cedigaz, Paris.
Chalmers, H. (2010), Flexible Operation of Coal‐fired Power Plants with CO2 Capture, IEA Clean Coal Centre, Paris.
Cheung, K. (2011), Integration of Renewables: status and challenges in China, IEA Working Paper, OECD/IEA, Paris.
Cox, J. (2010), “Implications of intermittency”, Modern power systems, January 2010, Global Trade Media, London.
EIA (Energy Intelligence Agency) (2009), Annual Energy Outlook 1999 to 2009, EIA, Washington, DC.
EIA (2010), Energy in brief – How much of our electricity is generated from renewable sources? EIA, Washington. www.eia.doe.gov/energy_in_brief/renewable_energy.cfm, accessed August 2011.
EIA, www.eia.gov/cneaf/electricity/epa/epat1p2.html, accessed August 2011.
Elia, www.elia.be/repository/pages/465892cca4e349af8abb76414fa54f13.aspx, accessed August 2011
ENS (Danish Energy Agency), www.ens.dk/en‐US/Sider/forside.aspx, accessed August 2011.
European Commission energy transparency platform, European Commission, Brussels. http://ec.europa.eu/energy/renewables/transparency_platform/action_plan_en.htm, accessed August 2011.
EC (European Commission) (2008), Report of the SETIS workshop on electricity storage in stationary applications, European Commission, Brussels. http://ec.europa.eu/energy/technology/set_plan/doc/setis_stationary.pdf, accessed August 2011.
Eurostat (2008), Energy Yearly Statistics 2008, European Commission, Luxembourg.

© OECD/IEA 2012 The Impact of Wind Power on European Natural Gas Markets
Page | 49
Eurostat Statistical Database, http://epp.eurostat.ec.europa.eu/portal/page/portal/eurostat/home/, accessed August 2011.
ENBW, www.enbw‐transportnetze.de/kennzahlen/erneuerbare‐energien/, accessed August 2011.
ENTSO‐E, www.entsoe.eu/resources/data‐portal/consumption/, accessed August 2010.
EWEA (European Wind Energy Association) (2010), Wind in Power: 2010 European Statistics, EWEA Annual Wind Statistics, Brussels.
EWEA, www.ewea.org/index.php?id=1665, accessed August 2011.
Fluxys, http://data.fluxys.com, accessed August 2011.
Geschler, T. (2010), Survey of energy storage options in Europe, London Research International, London.
Gostling, J. (2002),”Two shifting of power plant: damage to power plant due to cycling – A brief overview”, OMMI, Vol. 1, No. 1, European Technology Development, London.
GWEC (Global Wind Energy Council) (2010), Global wind 2009 report, GWEC, Brussels.
GWEC (2011), Global wind 2010 report, GWEC, Brussels.
Holtinnen, H. (2004), The Impact of Large‐scale Wind Power Production on the Nordic Electricity System. VVT publication 554, Finland.
Ihle, J. (2003), Coal ‐ Wind Integration: strange bedfellows may provide a new supply option. The PR&C Renewable Power Service, London.
IEA (International Energy Agency) (2007), Tackling Investment Challenges in Power Generation in IEA Countries, OECD/IEA Paris.
IEA (2010a), World Energy Outlook 2010, 2010 OECD/IEA, Paris.
IEA (2010b), Projected Costs of Generating Electricity; 2010 edition, OECD/IEA Paris.
IEA (2011a), Harnessing Variable Renewables: a guide to a balancing challenge, 2011, OECD/IEA Paris.
IEA (2011b), Medium‐term Oil & Gas Markets; 2011 edition, OECD/IEA Paris.
Kehlhofer, R., R. Bachmann, H. Nielsen and J. Warner (2009), Combined‐cycle Gas & Steam Turbine Power Plants. 3rd edition, Penwell Corp, Tulsa, OK.
KNMI, www.knmi.nl/klimatologie/onderzoeksgegevens/potentiele_wind/, accessed August 2011.
Lefton, S. and P. Besuner (2001), Power Plant Cycling Operations and Unbundling their Effect on Plant Heat Rate. APTECH, California.
Linnenberg S., J. Oexmann and A. Kather (2009), Design considerations of post‐combustion CO2 capture process during part load operation of coal‐fired power plants, presentation at 12th International Post Combustion Capture Network Meeting, Regina, Canada, 30th September 2009. www.co2captureandstorage.info/networks/cap12pdf/4‐1.pdf, accessed August 2011.
Meibom, P., R. Barth, H. Brand, B. Hasche, D. Swider, H. Ravn and C. Weber (2007), Final report for all island grid study work‐stream 2(b): wind variability management studies. Risø National Laboratory, Roskilde.

The Impact of Wind Power on European Natural Gas Markets ©OECD/IEA 2012
Page | 50
Northwest Power Planning Council (2002), New Resource Characterization for the Fifth Power Plan, Natural Gas Combined‐cycle Gas Turbine Power Plants, Northwest Power Planning Council, Portland.
Torre Rodriquez, M. de la (2009), RES integration in the Spanish electricity system, presentation given at York University, November 19, 2009, www.canrea.ca/site/wp‐content/uploads/2010/02/re‐integration‐in‐the‐spanish‐electrical‐system‐york‐u‐toronto‐nov‐09.pdf, accessed August 2011.
Roques, F., C. Hiroux and M. Saguan (2009), Optimal wind power deployment in Europe – a portfolio approach, EPRG Working Paper, Cambridge.
Saravanamutto, H., G. Rogers and H. Cohen (2009), Gas Turbine Theory; sixth edition. Pearson Education Limited, Essex.
Tennet TSO GmbH www.tennettso.de/pages/tennettso_en/Transparency/Publications/Network_figures/Overview/index.htm, accessed August 2011.
Vestas, www.vestas.com/en/wind‐power‐plants/procurement/turbine‐overview/v90‐3.0‐mw.aspx#/vestas‐univers, accessed August 2011.
Vuorinen, A. (2008), Fundamentals of power plants, Presentation. www.optimalpowersystems.com/stuff/fundamentals_of_power_plants.pdf, Accessed August 2011.
WWEA (World Wind Energy Association) (2011), World Wind Energy Report 2010, WWEA, Bonn.

International Energy Agency • 9 rue de la Fédération • 75739 Paris Cedex 15, France
Buy IEA publications online:
www.iea.org/books
PDF versions available at 20% discount
Books published before January 2011
- except statistics publications -
are freely available in pdf
Onlinebookshop
Tel: +33 (0)1 40 57 66 90
E-mail: [email protected]

InternatIonal energy agency
9 rue de la FédératIon 75739 ParIs cedex 15
www.iea.org