the impact of user centered design on student motivation
TRANSCRIPT

Purdue UniversityPurdue e-Pubs
Open Access Theses Theses and Dissertations
Summer 2014
The impact of user centered design on studentmotivationCraig T. LockerPurdue University
Follow this and additional works at: https://docs.lib.purdue.edu/open_access_theses
Part of the Curriculum and Instruction Commons, Educational Assessment, Evaluation, andResearch Commons, Elementary and Middle and Secondary Education Administration Commons,and the Science and Mathematics Education Commons
This document has been made available through Purdue e-Pubs, a service of the Purdue University Libraries. Please contact [email protected] foradditional information.
Recommended CitationLocker, Craig T., "The impact of user centered design on student motivation" (2014). Open Access Theses. 648.https://docs.lib.purdue.edu/open_access_theses/648

Graduate School ETD Form 9 (Revised 01/14)
PURDUE UNIVERSITY GRADUATE SCHOOL
Thesis/Dissertation Acceptance
This is to certify that the thesis/dissertation prepared
By
Entitled
For the degree of
Is approved by the final examining committee:
To the best of my knowledge and as understood by the student in the Thesis/Dissertation Agreement.Publication Delay, and Certification/Disclaimer (Graduate School Form 32), this thesis/dissertationadheres to the provisions of Purdue University’s “Policy on Integrity in Research” and the use of copyrighted material.
Approved by Major Professor(s): ____________________________________
____________________________________
Approved by:
Head of the Department Graduate Program Date
Craig T. Locker
The Impact of User Centered Design on Student Motivation
Master of Science
Dr. Nathan Mentzer
Dr. Jenny Daugherty
Dr. Todd Kelley
Dr. Nathan Mentzer
Ragu Athinarayanan 7/28/14


THE IMPACT OF USER CENTERED DESIGN ON STUDENT MOTIVATION
A Thesis
Submitted to the Faculty
of
Purdue University
Craig T. Locker
In Partial Fulfillment of the
Requirements for the Degree
of
Master of Science
August 2014
Purdue University
West Lafayette, Indiana

ii
ACKNOWLEDGEMENTS
I first and foremost want to thank God for everything he has done in my life,
without Him none of this would have been possible. I want to thank my amazing
wife that kept me focused and motivated to finish as well as my parents and
family for pushing me towards graduate school. A tremendous thank you goes to
Dr. Mentzer; this thesis would never have come to fruition without your guidance
and mentoring. I will be forever grateful for all of the support, knowledge, and
time you have invested in me. I also would like to thank Drs. Todd Kelley and
Jenny Daugherty. Thank you both for guiding my work and challenging me to do
my best. I also want thank Shawn Farrington and the rest of the ETTE cohort. I
appreciate all of the help and feedback the ETTE cohort has given me through
this process. Finally, I want to thank Purdue University, the tools and resources
put in place by the faculty and staff are second to none. Boiler Up!

iii
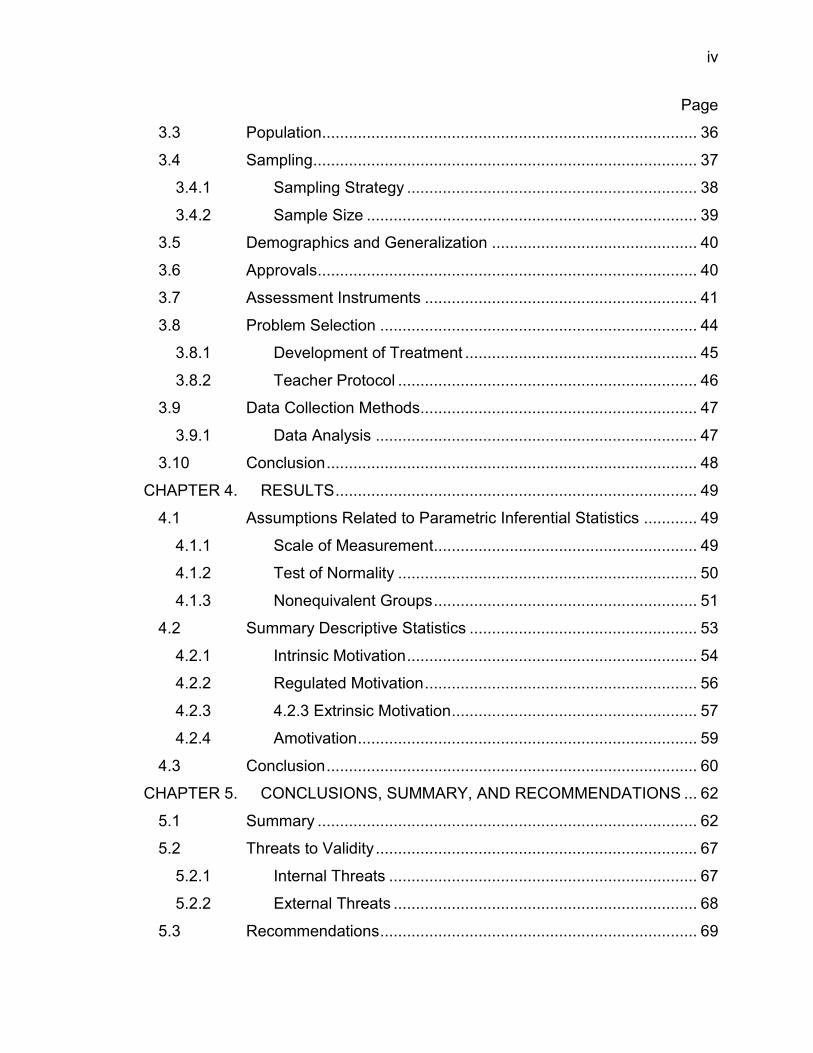
TABLE OF CONTENTS
Page
LIST OF TABLES ................................................................................................. vi
LIST OF FIGURES .............................................................................................. vii
ABSTRACT ........................................................................................................ viii
CHAPTER 1. INTRODUCTION ........................................................................ 1
1.1 Statement of the Problem .............................................................. 1
1.2 Research Question ........................................................................ 5
1.3 Scope ............................................................................................ 5
1.4 Significance of the Problem ........................................................... 6
1.5 Definitions .................................................................................... 10
1.6 Assumptions ................................................................................ 11
1.7 Limitations ................................................................................... 12
1.8 Delimitations ................................................................................ 12
1.9 Conclusions ................................................................................. 12
CHAPTER 2. LITERATURE REVIEW ............................................................ 14
2.1 Critical Shortage of Students in the T&E of STEM ...................... 14
2.2 Factors Influencing Enrollment/Interest ....................................... 16
2.2.1 Student Motivation ................................................................. 17
2.2.2 Conceptual Framework ......................................................... 18
2.3 User-Centered Design Defined .................................................... 22
2.4 User Centered Design Process ................................................... 23
2.5 Rationale and Foundation for User Centered Design .................. 25
2.6 User Centered Design and HCD as a Potential Key to Motivation30
2.7 Conclusion ................................................................................... 33
CHAPTER 3. METHODOLOGY ..................................................................... 35
3.1 Research Methodology ................................................................ 35
3.2 Hypothesis ................................................................................... 36
iv
Page
3.3 Population .................................................................................... 36
3.4 Sampling ...................................................................................... 37
3.4.1 Sampling Strategy ................................................................. 38
3.4.2 Sample Size .......................................................................... 39
3.5 Demographics and Generalization .............................................. 40
3.6 Approvals ..................................................................................... 40
3.7 Assessment Instruments ............................................................. 41
3.8 Problem Selection ....................................................................... 44
3.8.1 Development of Treatment .................................................... 45
3.8.2 Teacher Protocol ................................................................... 46
3.9 Data Collection Methods.............................................................. 47
3.9.1 Data Analysis ........................................................................ 47
3.10 Conclusion ................................................................................... 48
CHAPTER 4. RESULTS ................................................................................. 49
4.1 Assumptions Related to Parametric Inferential Statistics ............ 49
4.1.1 Scale of Measurement ........................................................... 49
4.1.2 Test of Normality ................................................................... 50
4.1.3 Nonequivalent Groups ........................................................... 51
4.2 Summary Descriptive Statistics ................................................... 53
4.2.1 Intrinsic Motivation ................................................................. 54
4.2.2 Regulated Motivation ............................................................. 56
4.2.3 4.2.3 Extrinsic Motivation ....................................................... 57
4.2.4 Amotivation ............................................................................ 59
4.3 Conclusion ................................................................................... 60
CHAPTER 5. CONCLUSIONS, SUMMARY, AND RECOMMENDATIONS ... 62
5.1 Summary ..................................................................................... 62
5.2 Threats to Validity ........................................................................ 67
5.2.1 Internal Threats ..................................................................... 67
5.2.2 External Threats .................................................................... 68
5.3 Recommendations ....................................................................... 69

v
Page
5.3.1 Teacher Understanding ......................................................... 69
5.3.2 UCD Implementation ............................................................. 69
5.3.3 Curriculum Development ....................................................... 70
5.4 Recommendations for Future Research ...................................... 71
5.5 Conclusion ................................................................................... 73
REFERENCES ................................................................................................... 74
APPENDICES
Appendix A Pretest and Posttest Survey Instruments ..................................... 79
Appendix B Material for Consent and Assent .................................................. 82
Appendix C Teacher Instruction and Materials ................................................ 86
Appendix D UCD Power Point ......................................................................... 91
Appendix E Treatment Problem Statement ..................................................... 94
vi
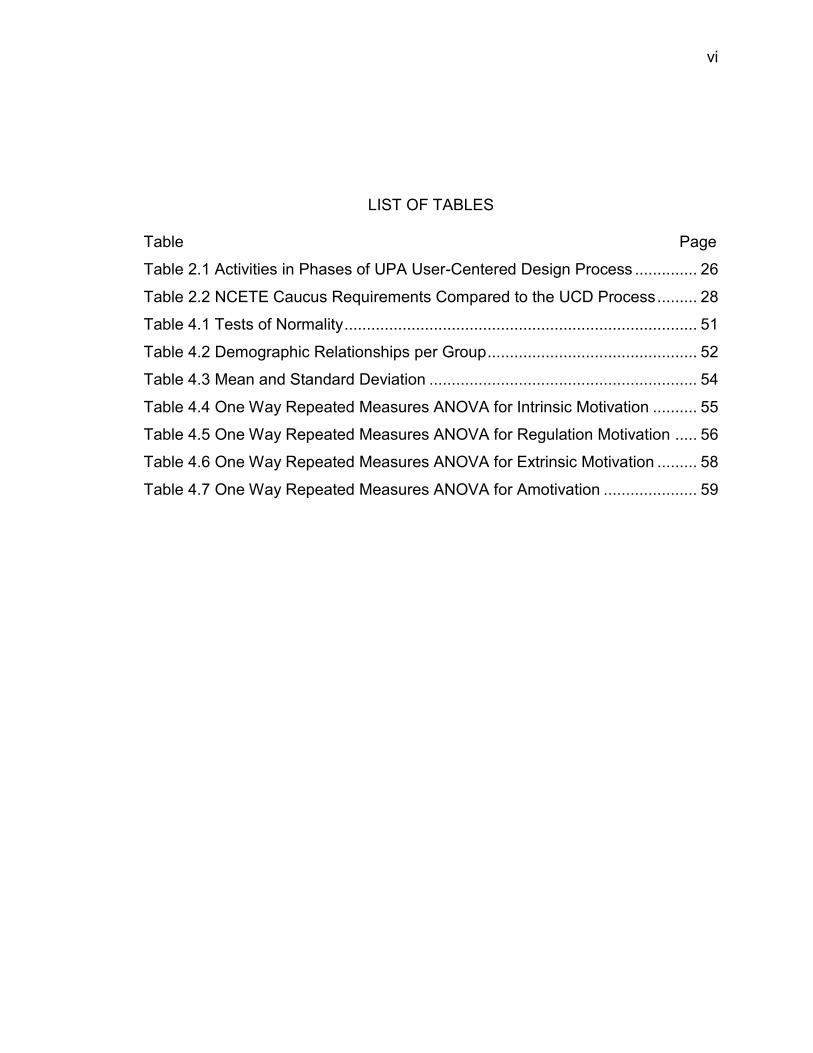
LIST OF TABLES
Table Page
Table 2.1 Activities in Phases of UPA User-Centered Design Process .............. 26
Table 2.2 NCETE Caucus Requirements Compared to the UCD Process ......... 28
Table 4.1 Tests of Normality ............................................................................... 51
Table 4.2 Demographic Relationships per Group ............................................... 52
Table 4.3 Mean and Standard Deviation ............................................................ 54
Table 4.4 One Way Repeated Measures ANOVA for Intrinsic Motivation .......... 55
Table 4.5 One Way Repeated Measures ANOVA for Regulation Motivation ..... 56
Table 4.6 One Way Repeated Measures ANOVA for Extrinsic Motivation ......... 58
Table 4.7 One Way Repeated Measures ANOVA for Amotivation ..................... 59

vii
LIST OF FIGURES
Figure Page
Figure 2.1 ISO-13407 HCD Activities Throughout a Development Life-Cycle .... 24
Figure 4.1 Pre and Posttest Difference in Intrinsic Motivation ............................ 56
Figure 4.2 Pre and Posttest Difference in Regulation Motivation........................ 57
Figure 4.3 Pre and Posttest Difference in Extrinsic Motivation ........................... 59
Figure 4.4 Pre and Posttest Difference in Regulation Motivation........................ 60

viii
ABSTRACT
Locker, Craig T. M.S., Purdue University, August 2014.The Impact of User Centered Design on Student Motivation. Major Professor: Nathan Mentzer.
There is a current push for STEM education within the U.S.; however
current studies show that students’ interest to pursue STEM fields is decreasing
as they progress through high school. This lose in interest has shown to have a
strong tie to students’ perceived levels of motivation towards the subject. The
question that this studied set out to answer was if user centered design (UCD)
would affect students perceived level of motivation. For this study a treatment of
UCD was compared to a traditional high school engineering design curriculum,
with the goal to identify if UCD would have a positive effect on the students
perceived level of motivation. 59 9th grade high school students from an urban
Midwestern city were selected to participate. Students were given a pre and
posttest to determine their levels of motivation before and after the comparison or
treatment. Analysis showed that students perceived level of intrinsic and extrinsic
motivation significantly went up in the treatment group. The study concluded that
due to the ease of implementation and low cost of deployment that UCD should
be introduced into high school design challenges that focus on developing a
solution for an external stakeholder.

1
CHAPTER 1. INTRODUCTION
This introduction will be an overview description of the problem, the
research question, and the scope of this study. This introduction also describes
what will be included in the research and what will be excluded. Along with
defining the problem, several technical terms will be defined.
1.1 Statement of the Problem
In the United States, nearly 28% of first year high school students,
approximately one million students, reported an interest in STEM-related fields.
However, over the course of high school almost 60% of those students lose their
interest in STEM-related fields (Munce & Fraser, 2013, p. 4). Although there is a
small rise, in the number of students interested in STEM fields, the number of
students is still not increasing at the rate at which many expected, especially with
the increased attention and funding in this area (National Science Board, 2012).
Increasing the number of students interested in STEM-related fields and
maintaining their interest is considered a vital piece to the US economy and an
area of commitment identified by President Barrack Obama. During a speech in
2009 at the National Academies of Science, President Barack Obama said:
Reaffirming and strengthening America’s role as the world’s engine of
scientific discovery and technological innovation is essential to meeting
the challenges of this century. That’s why I am committed to making the

2
improvement of STEM (Science, Technology, Engineering, and
Mathematics) education over the next decade a national priority.
Although there is clearly a desire on many levels to increase the number
of students going into STEM-related majors and fields and there is early interest
of the students, there still much work to be done between increasing the initial
interest and graduating students from the programs.
An important aspect of what happens between fostering an early interest
in STEM fields and graduating students is cultivating student motivation. As
Terrel H. Bell, former Secretary of Education stated, “There are three things to
remember about education. The first one is motivation. The second one is
motivation. The third one is motivation.” Arguably, motivation plays a vital role in
students’ level of engagement and interest. Edward Deci (1992) calls interest “a
powerful motivator” (p. 43). Deci further acknowledges other motivational factors
that can affect student’s behavior, such as ego-involvement, social comparison,
and habit. However, he stated that it is nearly impossible to discuss student
motivation without mentioning student interest in the subject of the class (Deci,
1992). Deci’s assertion is important, particularly as the assertions relate to high
school technology and engineering courses, which are almost exclusively
elective courses. Students choose to take these elective courses which suggest
they are interested in the course subject and activities to some degree (Taylor &
Parsons, 2011). The connection between interest and motivation is an important
one and forces researchers to look for a solution or solutions to the problem of
decreasing interest in the STEM fields. One potential solution is through a
curriculum treatment geared toward increasing motivation and interest.

3
In this study, the focus is on the T and E (Technology and Engineering) of
STEM. These areas are considered the two underserved areas of STEM, as they
have not received the same focus as math and science, but have high potential
to more appropriately showcase the real world of research and technology
development (National Research Council, 2009). The STEM workforce is in need
of more qualified workers which is a driving force behind the current focus on
STEM education and subsequently STEM motivation (Munce & Fraser, 2013).
The push for STEM education has primarily fallen on math and science, yet the
U.S. is seeing the largest need of employment in the engineering and technology
sectors (Munce & Fraser, 2013). As of a 2013 report, the manufacturing sector
faces a large shortage of employees with STEM skills. Specifically there are over
600,000 manufacturing jobs that are currently going unfilled in contrast to the
overall economic hiring condition (Munce & Fraser, 2013). Further the report
estimates that by 2018, the bulk of STEM jobs will be in computing at 71%
followed by traditional engineering at 16% (Munce & Fraser, 2013). Taken
together, nearly 87% of STEM careers will primarily fall in the engineering and
technology sectors. However, the U.S. gives far less attention to these areas.
The National Research Council (2009) stated in their report on engineering in K-
12 education that “the role of either technology education or engineering
education has rarely been mentioned in these concerns, the STEM acronym is
more often used as short hand for science and mathematics education” (p. 12).
It is evident that the U.S. currently has a need for technology and
engineering skills in the workforce. While there has been success in fostering

4
interest of U.S. American first year high school students in STEM careers, by the
time they leave high school approximately 60% of those students are
uninterested (Munce & Fraser, 2013). This phenomenon demands an answer to
the question: what is happening in the classroom between students first years of
high school to the point of graduation and how can the trend be addressed?
As previously discussed, the link between motivation and interest is likely
an important aspect to explore when assessing what happens to students’
interest in STEM fields between their first year of high school and gradation.
Literature on motivation suggests that having students tackle relevant and
engaging problems increases their motivation (Taylor & Parsons, 2011).
Therefore, the objective of this thesis was to investigate to what extent students
were motivated as a result of an engineering design problem that was situated in
a relevant and engaging context. Students in a nationally recognized curriculum,
Project Lead the Way, were chosen as curriculum the engages students in
design problems A treatment was developed to investigate the impacts of
changing the design approach from traditional to socially beneficial. Specifically,
students in the treatment group worked through the user-centered design (UCD)
process. UCD is defined by Usability.gov, a division of the U.S. Department of
Health and Human Services, as “an approach to designing a product or service
(e.g. user interface design), in which the end user is placed in the center of the
process” (“User-centered design”, n.d. para 11). UCD makes explicit the social
implications and connections with the user. This shift in focus to user centered
design in high schools, as opposed to more traditional design thinking methods,

5
could potentially be the connection needed to help motivate high school students
to pursue a degree or career in the STEM fields.
1.2 Research Question
What effect does user-centered design have on the high school
technology and engineering design students’ perceived level of motivation as
compared to traditional design approaches?
1.3 Scope
The focus of the study was to investigate if there was an increase in
motivation levels of high school students in an urban Midwestern city as students
tackled a design challenge that focused on the user. All high school student
participants were in their first high school engineering and technology course.
The course selected was the Introduction to Engineering Design (IED) from
Project Lead the Way (PLTW). The IED course was chosen based on the order
of the classes offered from PLTW; IED is the first class the students will complete
in a sequence. The selection of first course was important because research has
shown students become less interested in STEM fields as they continue through
high school (Munce & Fraser, 2013). PLTW was chosen because it represents
the one of largest STEM curriculum with currently 5000 plus schools in all 50
states (Project Lead the Way, 2014). PLTW courses align with the Standards for
Technological Literacy (International Technology Engineering Education
Association (ITEEA), 2007).

6
1.4 Significance of the Problem
The U.S. has a current need for engineering and technologically skilled
employees. As well, President Obama is committed to working on growing STEM
education. However, research currently shows that student lose interest in the
STEM fields as they progress through high school (Munce & Fraser, 2013).
Research also points toward the notion that the U.S. has overlooked the area
that represents the largest job markets and degrees obtained in STEM, the
Technology and Engineering areas. This is highlighted by the Committee on
Standards for K-12 Engineering Education (2010) which stated,
The first formal K–12 engineering programs in the United States emerged
in the early 1990s. Since that time, the committee estimates that no more
than 6 million K–12 students have had any kind of formal engineering
education. By contrast, the estimated enrollment in 2008 for grades pre-
K–12 for U.S. public and private schools was nearly 56 million. (p. 153)
Breaking down that data begins to highlight the gravity of the problem. Twenty
years of enrollment, totaling 6 million students, is approximately 300,000
students a year. Now compare that to the total number of 56 million students in
the U.S.. Therefore only 1 out of 186 students in K-12 education will have had
any interaction with technology or engineering curriculum by the time they
graduate. Another dimension to the issue was highlighted by Ioannis Miaoulis,
founding director of the National Center for Technological Literacy (2010), who
stated, “Until now, school curricula have focused more on the natural world, not
the technological one. But it is the technological, or human-made, world that
facilitates 98% of our daily experience." Further he concluded, "technological

7
literacy is basic literacy." Taken together, there is a strong argument that the U.S.
needs more students motivated to enroll in technology classes, without which,
schools will be graduating students who may not be literate for the world they live
in.
As stated earlier, students are becoming less interested in STEM careers
as they go through high school. This is increasingly troublesome when the
number of students enrolled is already at a drastically lower level compared to
other subjects. To address what may be at the root of these low enrollment
numbers, Waugh (2011) researched several factors that may influence student’s
participation in any course. Waugh’s research was a meta-analysis of several
case studies, experimental analyses, and surveys looking for a trend of factors
that affect student’s decision to enroll in a course. These factors impacted:
enrollment in elective courses, the perceptions of the course, the perspective of
the job markets, and the effectiveness of the teacher. The first two factors can be
linked to student interest which has been tied directly to motivation (Deci, 1992).
The third factor dealing with the job market also can be linked to motivation in
that there is a current need for STEM employees and as Waugh (2011) stated
students value classes that can ultimately lead to a job. The last factor
concerning the effectiveness of the teacher is beyond the scope of this study.
However the first three factors as shown above can heavily influence and
motivate students; therefore, motivation is an important element to increase
student enrollment and potentially retention.

8
The potential impact of this study is that increasing the motivation of
students may increase retention of students in STEM courses, particularly T and
E, throughout high school. This might ultimately have a positive impact on the
number of graduates pursing STEM careers. While these potential impacts refer
to what might happen with the addition of a treatment to the current curriculum, it
then is important to understand what is currently being taught in the areas of
technology and engineering and why a treatment is necessary. One of the main
curricula in STEM education within the United States is Project Lead the Way
(PLTW, 2014). Project Lead the Way (PLTW) curriculum is currently distributed
in all 50 states and in over 5,000 schools. The first course students interact with
in the PLTW high school curriculum is the Introduction to Engineering Design
(IED) (PLTW, 2014). The researcher reviewed the IED 2012 – 2013 curriculum
and noted that it focused on a series of design problems using a traditional and
widely accepted design methodology. However the curriculum did not emphasize
a user centered design approach. In most design problems, the students were
expected to design projects for themselves rather than socially beneficial design
contexts. This critical course also plays a role in the potential retention of
students because it is the first course in a STEM sequence offered by many
schools nationally. As stated in the report by Munce and Fraser (2013), students
initially, be it 9th grade or when they start high school, show interest in STEM
disciplines, but lose interest as they progress through high school. Since IED is
the first course, it is imperative that the experience foster student interest in
STEM career pathways.

9
The researcher reviewed the Standards for Technological Literacy,
updated by ITEEA (2007). The review focused on locating language in any
standard that mentioned elements of socially beneficial design such as external
stakeholders, users, or phrasing that stated students were designing for
someone else. Upon completion of the review, it appears that the Standards did
not emphasize a socially beneficial focus to design approaches. The focus in the
Standards is very important, because these standards guide several curriculum
developers in what they emphasize, including Project Lead the Way (PLTW,
2014). This alignment between the standards’ emphasis (non-socially beneficial)
and PLTW (also non-socially beneficial) is troubling considering many
companies, both private and public, have already made a shift in the design
process to include socially beneficial (UCD) elements (Zoltowski, 2010).
Specifically, this socially beneficial practice is referred to as user centered design
(UCD). UCD is an approach to design that grounds the process in information
about the people who will use the product, process, design. UCD processes
focus on users through the planning, design and development of a product (UPA,
2013). While there is not a large UCD focus present in schools, many
companies have been incorporating these UCD processes. The UCD process
has been linked to increased productivity, higher quality designs and products,
reduced errors, reduced training and continuing support costs, improved
customer acceptance to new designs and products, increased user satisfaction,
and reduced development cost (Damodaran, 1996; Maquire, 2001; Zoltowski,
2010). An important role for secondary schools is to prepare students either for

10
higher education or direct entry into the workforce; however, if the standards that
influence curriculum developers do not include the processes that many real-
world companies are using and seeing benefits with, then students do not get the
real world engagement that has been linked to motivation (Waugh, 2011).
The significance of this problem rests on indentifying a treatment that can
aid in reversing the trend of students who lose interest in STEM as they progress
through high school. The proximal impact of this study is potentially identifying a
curricular approach that engages students early in their high school coursework
through increased motivation. The distal impact is the potential for increased in
enrollment in STEM fields and better preparation of the U.S. workforce with
highly skilled STEM employees. Currently, no research studies have focused on
the impacts of UCD in the high school setting and/or UCD’s potential role in
improved motivation (Damodaran, 1996; Maquire, 2001; Zoltowski, 2010; Adler,
2013). If UCD improves student motivation and therefore can cause an upward
shift in retention in science, technology, engineering and mathematic (STEM)
fields, it is important that research is conducted to investigate this potential
phenomenon so that curriculum developers and educators may leverage this
increase in student motivation.
1.5 Definitions
K-12 Engineering Design - The systematic and creative application of scientific
and mathematical principles to practical ends such as the design,
manufacture, and operation of efficient and economical structures,
machines, processes, and systems (ITEEA, 2007).

11
Technological literacy – The ability to use, manage, understand, and assess
technology (ITEEA, 2007).
Technological literacy standard – A written statement that specifies the
knowledge (what students should know) and process (what students
should be able to do) students should possess in order to be
technologically literate (ITEEA, 2007).
User-Centered Design (UCD) is an approach to design that grounds the process
in information about the people who will use the product. UCD processes
focus on users through the planning, design and development of a product
(UPA, 2013).
1.6 Assumptions
The assumptions that are associated with this research include the
following:
The treatment and comparison group students will have
experienced the same Introduction to Engineering curriculum
provided by Project Lead the Way.
Students will put full effort into their design projects regardless if
they are in the comparison or the treatment group.
The students involved in this study will answer truthfully on the
survey.
The survey mechanism is properly designed to elicit the natural
student motivation without bias from the survey.

12
1.7 Limitations
The limitations that are associated with this research include the following:
The study will be limited by the cooperation of the participants and
their availability.
The students may not be answering truthfully or take the time to
consider all answer choices within the survey
Students may converse with students from the other class and
learn of the study and include elements from the treatment group to
the comparison group.
1.8 Delimitations
The delimitations that are associated with this research include the
following:
The participants will be limited to Indiana high school students who
are willing to participate.
This study is not designed to test across different schools or
teachers, but to compare two classes taught by the same teacher.
1.9 Conclusions
Research has shown that only a small percentage of high school students
will choose to experience any education in the areas of technology and
engineering and of the students who are interested in STEM, approximately 60%
of those students will lose interest by the time they graduate high school (Munce
& Fraser, 2013). Currently the U.S. is making a huge push for a better STEM

13
workforce that is predominately focused on technology and engineering. This
study will examine the effect of user centered design on student motivation in the
areas of technology and engineering with the potential outcome of higher
enrollment in STEM in the future and thus building a better STEM workforce.

14
CHAPTER 2. LITERATURE REVIEW
The task of this literature review was to examine several “logical
assertions” of information with the intention of creating a map to how one section
connects to another. Specifically this review will connect the data showing the
U.S.’s current lack of enrollment in high school engineering and technology
programs with the elements that may explain why this is, and finally a framework
that has proven to improve student motivation. The ultimate impact of this work
may be identifying a method of teaching Technology and Engineering at the high
school level that motivates students to pursue further education and a STEM
career pathway.
2.1 Critical Shortage of Students in the T&E of STEM
Engineering and technology education enrollment in high school is difficult
to determine. Some states require classes at the high school level, while others
only require a single class during their middle school program. Because of this, it
is impossible to know exactly how many students have been involved in
engineering and technology related classes or projects (Committee on Standards
for K-12 Engineering Education, 2010). However, the data that has been
presented shows there is a vast void in enrollment for engineering/technology
programs compared to total school enrollment (Committee on Standards for K-12
Engineering Education, 2010). Another way to illustrate the deficiency of
engineering and technology program enrollment in middle and high school is to

15
look at how many teachers are involved in these fields. According to the
Committee on Standards for K-12 Engineering Education (2010), the best way
that this is recorded is through training and professional development for these
curricula. This committee estimated that around 18,000 teachers are trained
and/or practicing teaching engineering and technology related course-work. The
study continued by comparing engineering and technology related numbers to
other fields of teachers: “By comparison, U.S. public and private middle and high
schools employ roughly 276,000 mathematics teachers, 247,000 science
teachers, and 25,000 to 35,000 technology education teachers” (p. 153). The
actual number of students receiving instruction is further impacted by typically
smaller class sizes. These low numbers of students receiving an education in
these areas may have a negative effect on the economy considering the push for
more STEM fields, specifically in the engineering and technology areas. To
spotlight this, the U.S. Department of Commerce (2013) reported:
The growth in STEM jobs was three times as fast as growth in non-STEM
jobs over the last 10 years. STEM jobs are expected to grow by 17
percent during the 2008-2018 period versus 9.8 percent growth for non-
STEM jobs. As a nation, we are not graduating nearly enough STEM
majors to meet this need. (para. 2)
Echoing a similar sentiment, Mathematical Sciences Education Board of the
National Research Council, concluded:
...we must draw substantially greater numbers of participants from
traditionally underrepresented groups. If we are to flood the market with
increasing and more diverse groups of capable young people who are
innovation problem solvers, successful in science, engineering, and

16
engineering technology, we must expose a larger number of students to
career options in engineering. (Reynolds et al, 2009, p. 9)
Clear trends emerge from looking at the multiple sources of data. Of the small
number of students interested in STEM in their first year, there are fewer
students who take engineering and technology courses versus the mathematics
and science and many of them will become disinterested (approximately 60%) by
the time they graduate high school. Further, fewer resources are allocated to
engineering and technology course than other courses as evident by the training
and credentials of U.S. teachers (Committee on Standards for K-12 Engineering
Education, 2010).
2.2 Factors Influencing Enrollment/Interest
The previous section highlighted that students begin to lose interest in
STEM as they progress through high school (Munce & Fraser, 2013). Another
important question related to that phenomenon is: what are the factors that
influence students to enroll in classes and continue to be interested in them?
Waugh (2011) stated that what influences high school students to take electives
can be broken down into three major categories; academic considerations,
personal considerations, and outside sources of information to consider. The
author provided further detail of each category and explained the different levels
of importance. Waugh’s research has found that students’ level of motivation is
directly related to their choice of courses; with the most important factors being
perceived level of engagement, interest in the topic, and how beneficial it will be
17
to their future. Therefore, if students do not feel a course meets those criteria
than they won’t be as motivated to enroll or participate in the class.
2.2.1 Student Motivation
The American Psychological Association (APA) (2002) defined motivation
as “the process of starting, directing, and maintaining physical and psychological
activities; includes mechanisms involved in preferences for one activity over
another and the vigor and persistence of responses” (p.12). In the academic
sense, motivation has been defined as “a person’s desire (as reflected in
approach, persistence, and level of interest) regarding academic subjects when
competence is judged against a standard of performance or excellence”
(McGrew, 2011, para. 3). Research on student motivation is diverse and does
not narrow in on one simple factor, but generally suggests that students are
impacted by a mixture of intrinsic and extrinsic motivators (Hadriana, Ismail &
Mahdum, 2013). Clinkenbeard (2012) went into detail specifically about these
two aspects:
Motivation is often divided into two contrasting types: intrinsic and extrinsic
(Schunk et al., 2008). People who are highly intrinsically motivated to
learn are interested, curious, and usually focused on the task. People who
are extrinsically motivated are interested in the outcomes of learning
(grades, prizes, etc.) more than the task itself. Most of us are motivated by
a combination of intrinsic and extrinsic reasons that may vary according to
the task. Although intrinsic and extrinsic motivation can change in
individuals depending on context, they have often been investigated as
personal characteristics. (p. 624)

18
Students can experience these two types of motivations in a range of ways, but
literature indicates that students can be affected in both of these types of
motivation.
2.2.2 Conceptual Framework
With motivation, specifically in the realm of education, defined, next was a
conceptual or theoretical framework of what elements were needed for the
potential treatment. The research focused on discovering the principle elements
needed in a curriculum or learning environment that had been linked to
increasing interest and motivation. Two models were identified that began to
layout the necessary components that the treatment curriculum must exhibit.
The first was the TARGET model, which incorporates both intrinsic and
extrinsic motivation (Clinkenbeard, 2012). Brophy (2004) described the TARGET
method, which was developed by Carole Ames and Joyce Epstein, as the “most
comprehensive” (p. 102) intervention in goal theory to develop motivation.
Brophy provided further evidence of “good results” (p.103) from implementation
of the TARGET model. One specific study assessed the overall success by
comparing students in 36 TARGET classrooms verse 30 comparison
classrooms. Brophy stated:
Students in the TARGET classroom maintained their self-reported
perceptions of competence, attitudes toward the classes, intrinsic
motivation, and use of desirable learning strategies, whereas students in
the comparison classrooms showed deterioration on all of these measures
as the semester progressed. (p. 103)

19
Brophy concluded that the TARGET model is more of a framework and less of a
step by step procedure; it is flexible and should be adapted to each classroom
setting to help build students’ motivation. Clinkenbeard (2012) explained in
further detail: “the model addresses six classroom practices that have been
shown (through a strong research base) to affect student motivation and that are
substantially under the control of individual teachers” (p. 624).
The six practices Clinkenbeard (2012) stated affect motivation are task,
authority, recognition, grouping, evaluation, and time. Task suggests that all
students should be challenged. Moreover there should be a range of tasks for the
students to complete and all of which should be presented with the same level of
excitement so that students do not avoid what they deem as unnecessary
sections of the process. The hardest aspect of this element comes down to how
a teacher challenges all of their students.
Authority comes in the form of autonomy; students need to feel that they
are guiding not only what they are doing, but the outcome of their projects. If
students continually follow directions of a teacher, they will eventually lose
motivation. Students do best with authorities that, at some point during the
project, allow the students to dictate the direction a project is going
(Clinkenbeard, 2012).
Recognition, incorporates extrinsic motivators, but done well can develop
intrinsic motivation within the students. Giving praise to students for performing
the best is a common practice, but Clinkenbeard (2012) suggested within the

20
TARGET model to instead give praise for “improvement, learning, and mastery of
new material, not for performing the best on work” (p. 627). This shift in praise
can help the students develop an intra-personal focus and evaluate their
progress against themselves instead of peers, which can increase intrinsic
motivation.
Grouping should be done to allow students to work in varied student
groups. Student groups should also be changed up consistently to improve
overall interaction and also to develop a communal sense of the whole class.
Students are also motivated by working in groups with students of similar interest
and achievement level.
Evaluation increases student motivation when it is standards based and
students understand what they are being scored against, for example, by using a
rubric. Also students excel more when they are competing against themselves
instead of other classmates. This once again promotes improvement and places
students in a situation where they are striving for a mastery level.
Time primarily pertains to providing students with enough time to complete
the project and that allows and gives them support for their own growth and
learning, to a point where they feel they have mastered the subject.
While the TARGET method defines specific elements that can motivate
students, it is equally important to also look at teaching methodologies for the
framework of the treatment. According to Baeten, Dochy, and Struyven, CBL is
an appropriate methodology for teaching problem based learning and motivating
21
students. CBL has been directly tied to motivating students is the teaching
method of case-based learning (CBL), the roots of which are in problem-based
learning and centering the problems in real life situations (Baeten, Dochy, &
Struyven, 2013). Specifically Baeten, Dochy, and Struyven (2012) stated:
CBL is characterized by four features usually associated with
constructivist or student-centered teaching methods, that is, (1) an active
involvement of students in order to construct knowledge for themselves by
selecting, interpreting, and applying information in order to solve
assignments; (2) the teacher is a facilitator of learning rather than a
transmitter of knowledge; (3) use of authentic assignments; and (4)
learning in cooperation with fellow students. (p. 487)
Baeten, Dochy and Struyven developed a quasi-experimental research study to
test the effectiveness of different learning styles. They sampled 26 teachers and
over 1000 students, specifically 307 students in the CBL portion. The study
divided the sample into four groups and each was given a different learning style.
Once completed all students were assessed with the same survey instrument.
The analysis of the results showed that the CBL learners had an increased level
of autonomous motivation (Baeten, Dochy, & Struyven, 2013). However, an
important finding of the study was that a mix of CBL with traditional methods
increased student motivation, while an environment that solely used CBL actually
reduced motivation. This led the researchers to conclude that the best
environment for motivation was a blended approach of CBL with traditional
lecture based instruction. Taken together, the findings suggest that students still
need structure even when they want to control their own learning (Baeten,
Dochy, & Struyven, 2013). The TARGET model and CBL offer methods of how to

22
motivate students and lay out a framework for motivating students, which in the
foundation for the treatment implemented in this study.
2.3 User-Centered Design Defined
While some elements of the TARGET model and CBL can be found within
the Project Lead the Way Introduction to Engineering Design curriculum
currently, they may be strengthened by a focus on improving the human
condition, which is central to user centered design. The integration of TARGET,
CBL and UCD could potentially bridge the gap of more motivating problems. As
stated above in the problem statement, Usability.gov, a division of the U.S.
Department of Health and Human Services, defines UCD as “an approach to
designing a product or service (e.g. user interface design), in which the end user
is placed in the center of the process” (User centered design, n.d., para. 11).
UCD has also been referred to as Human Centered Design (HCD) (Henry
and Thorp, 2004). Although some scholars do consider them different, it is
important for this study to understand how UCD and HCD relate to each other.
“Although user centered and human-centered design approaches are similar,
user-centered design focuses on the end-user of the product, whereas human-
centered design considers the stakeholder more broadly than the stereotypical
user” (Zoltowski, 2010, p. 13). However in many articles, the two are used
synonymously (Henry & Thorp, 2004, Zoltowski, 2010). For the scope of this
study, the differences in the terminology are insignificant and thus the term UCD
will be solely used. To continue to understand this process, IDEO (2010), a
leading design firm and advocate for design thinking, defined HCD as:

23
A process and a set of techniques used to create new solutions for the
world. Solutions include products, services, environments, organizations,
and modes of interaction. The reason this process is called “human-
centered” is because it starts with the people we are designing for. The
HCD process begins by examining the needs, dreams, and behaviors of
the people we want to affect with our solutions. We seek to listen to and
understand what they want. We call this the Desirability lens. We view the
world through this lens throughout the design process. Once we have
identified a range of what is Desirable, we begin to view our solutions
through the lenses of Feasibility and Viability. We carefully bring in these
lenses during the later phases of the process. (p. 5)
2.4 User Centered Design Process
The processes of user-centered design are very similar, specifically with
having the user, stakeholder or human at the center of the process. One of the
two most accepted processes is the one published by the International
Organization of Standards (ISO). Their focus on human-centered design is
guided by the standard ISO 9241-210. This standard has gained support and is
now being considered by many as the definition in UCD and HCD literature
(Jokela et al., 2003). This standard has helped put a definitive meaning to UCD
as well as the principle components needed to define a process as UCD. Travis
(2011) explained the six principles as follows:
The design is based upon an explicit understanding of users, tasks and
environments.
Users are involved throughout design and development.
The design is driven and refined by user-centered evaluation.
The process is iterative.
24
The design addresses the whole user experience.
The design team includes multidisciplinary skills and perspectives
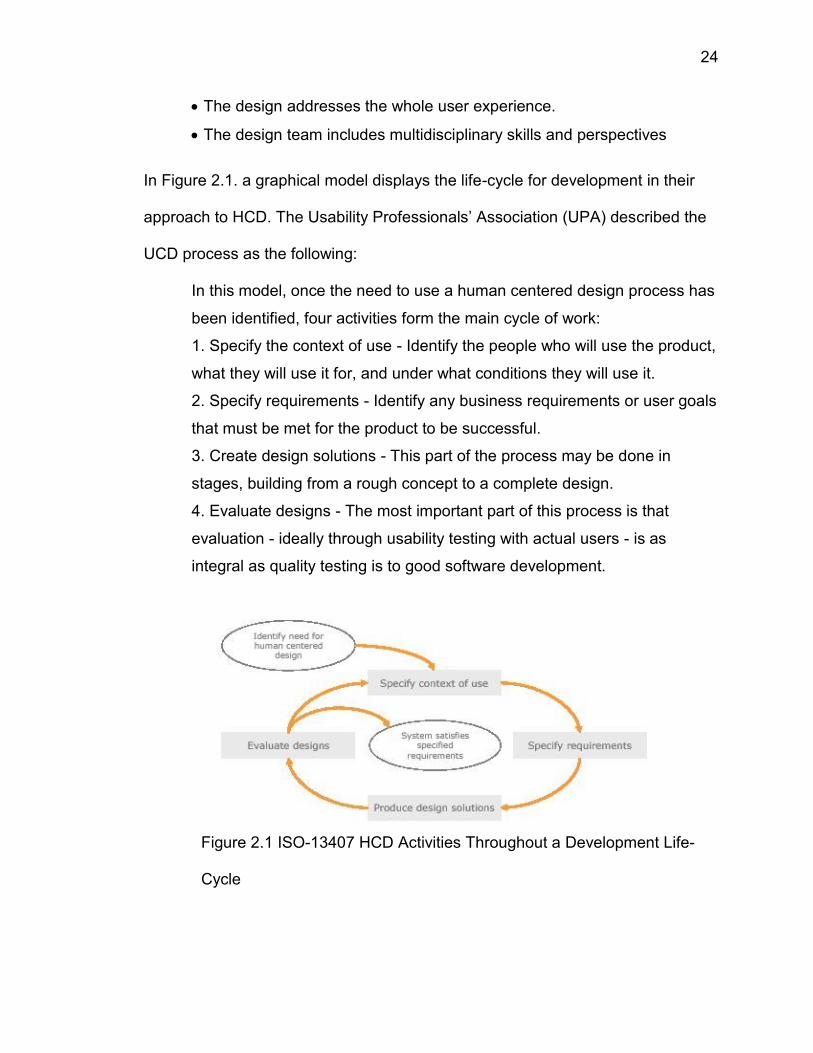
In Figure 2.1. a graphical model displays the life-cycle for development in their
approach to HCD. The Usability Professionals’ Association (UPA) described the
UCD process as the following:
In this model, once the need to use a human centered design process has
been identified, four activities form the main cycle of work:
1. Specify the context of use - Identify the people who will use the product,
what they will use it for, and under what conditions they will use it.
2. Specify requirements - Identify any business requirements or user goals
that must be met for the product to be successful.
3. Create design solutions - This part of the process may be done in
stages, building from a rough concept to a complete design.
4. Evaluate designs - The most important part of this process is that
evaluation - ideally through usability testing with actual users - is as
integral as quality testing is to good software development.
Figure 2.1 ISO-13407 HCD Activities Throughout a Development Life-
Cycle
25
While the ISO standard has several elements that UCD have come to be
known for, however for purposes of developing a pedagogical approach
appropriate for freshmen design education, an additional model of UCD provides
clarification in the four phases that the ISO standard lays out. The UPA model is
included to give such insight into specific details of UCD and help to explain the
reasoning behind its links with motivation. The second model of UCD is the one
outlined by the UPA. Their model is structured in four phases: Analysis, Design,
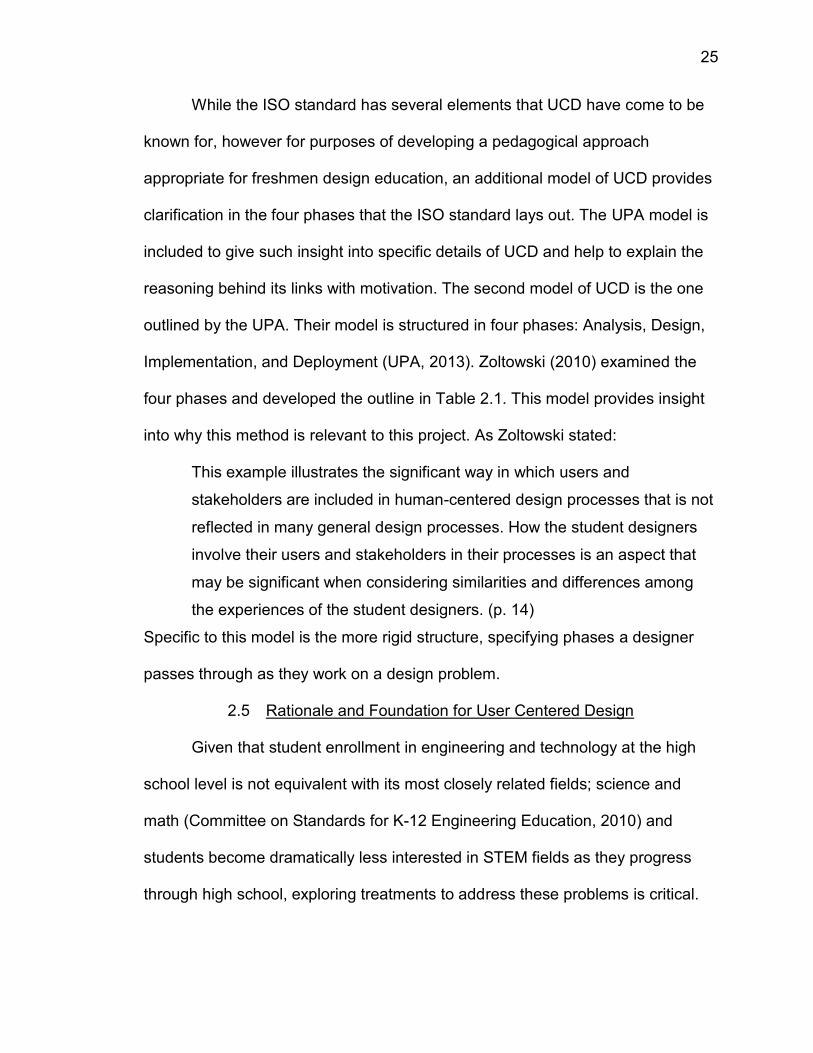
Implementation, and Deployment (UPA, 2013). Zoltowski (2010) examined the
four phases and developed the outline in Table 2.1. This model provides insight
into why this method is relevant to this project. As Zoltowski stated:
This example illustrates the significant way in which users and
stakeholders are included in human-centered design processes that is not
reflected in many general design processes. How the student designers
involve their users and stakeholders in their processes is an aspect that
may be significant when considering similarities and differences among
the experiences of the student designers. (p. 14)
Specific to this model is the more rigid structure, specifying phases a designer
passes through as they work on a design problem.
2.5 Rationale and Foundation for User Centered Design
Given that student enrollment in engineering and technology at the high
school level is not equivalent with its most closely related fields; science and
math (Committee on Standards for K-12 Engineering Education, 2010) and
students become dramatically less interested in STEM fields as they progress
through high school, exploring treatments to address these problems is critical.
26
Table 2.1 Activities in Phases of UPA User-Centered Design Process
Analysis Phase Design Phase Implementation Phase
Deployment Phase
- Meet with key stakeholders to set vision - Include usability tasks in the project plan - Assemble a multidisciplinary team to ensure complete expertise - Develop usability goals and objectives Conduct field studies - Look at competitive products - Create user profiles - Develop a task analysis - Document user scenarios - Document user performance requirements
- Begin to brainstorm design concepts and metaphors - Develop screen flow and navigation model - Do walkthroughs of design concepts - Begin design with paper and pencil - Create low-fidelity prototypes - Conduct usability testing on low-fidelity prototypes - Create high-fidelity detailed design - Do usability testing again - Document standards and guidelines - Create a design Specification
- Do ongoing heuristic evaluations - Work closely with delivery team as design is implemented - Conduct usability testing as soon as possible
- Use surveys to get user feedback - Conduct field studies to get info about actual use - Check objectives using usability testing
Note. From “Students' ways of experiencing human-centered design,” by C.
Zoltowski, 2010, ProQuest Dissertations and Theses, p. 17. Reprinted with
permission.
In this study, student motivation is the focus because engineering and
technology classes are primarily electives and the nature of selecting an elective
course is, in part, based on student motivation. Researchers have demonstrated
an important link between perception and motivation (Waugh, 2011). Currently,
students’ perceive engineering and technology to not be a “helping profession”

27
which could potentially lead to less interest and motivation to pursue coursework
in engineering and technology (National Research Council, 2008). If simple
change in approach to the curriculum could make the design problems more
relevant and engaging than the current approach, the perception could shift to
where students saw what they were doing as a way to make a difference in
people’s lives, which could potential increase interest and in turn motivation.
The rationale for selecting UCD is a necessary component of this literature
review. The first step was establishing the conceptual framework. UCD was
identified as a logical approach based on the TARGET model and CBL.
However, prior to implementation, it was essential that the approach be aligned
with what the leaders in the engineering and technology education community
find to be essential components of design problems that foster better
engagement and interest. At the National Center for Engineering and Technology
Education (NCETE) 2011 caucus, researchers, educators, and professionals laid
out 19 points to develop relevant and authentic problems. The idea of the caucus
was not centered on UCD; However many of the points align with the ideas of
UCD as shown in Table 2.2. This alignment shows potentially how similar the
elements of designing a relevant problem are to that of the UCD principles. In the
report Householder (2011) summarized the main points from Julia Ross on “the
requirements for a good engineering design challenge” (p. 2). In Table 2.2 those
points are compared to the steps of the UCD process. This comparison coupled
with the conceptual framework provides a strong rationale of why UCD was used
and may potentially affect student motivation.

28
Table 2.2 NCETE Caucus Requirements Compared to the UCD Process
Caucus Requirement Relationship to UCD
Source/Rationale
Esse
nti
al
Alig
ned
Co
nfl
ict
The challenge needs to be as wide-open as possible at first X IDEO (2010, p. 34)
It should be related to the real world. Framing the problem is very important; make the connection explicit
X Dali ( 2006, p. 3)
Pick challenges from areas that affect a teenager‘s life X The stakeholder is suggested to select a problem that affects their life.
There has to be more than one way to do it. It must be open-ended enough that there are several ways to do it successfully
X Every real world answer can be solved in a multitude of ways; there is no prescribed right answer.
Try really hard not to limit students to a ―”box of supplies” – giving students the – “stuff” to work with is an artificial constraint
X IDEO (2010) UCD is about drawing out constraints from real people with real problems
Use everyday stuff (materials) insofar as possible. Think of choices; walk around the house and the lab first before you go shopping
X IDEO (2010) Use what is available to the students, materials, stakeholders, equipment, etc.
Try to get the students to sketch out possibilities. X IDEO (2010) Prototyping is encouraged
A good design challenge makes it possible to think about the math at several different levels. Help the students see that math is something that gets used – a tool at our disposal.
There should be specific indicators of success in order to judge the quality of the solutions”
X Usability testing from the stakeholders indicates success
More efficiency is better. X UPA (2010)
Have costs been controlled? Is this the least expensive acceptable solution
X UPA (2010)
Unnecessary instrumentation is resisted by students
Solutions should be functional, but ― “amenable to bragging rights”
X Travis (2011) & UPA (2013)
Teachers need the opportunity to build prototypes as part of their professional development
Teachers have a difficult time relinquishing control as students work on design challenges
X Students lead the work within the design challenges
Fewer, broader, deeper design challenges are better than many, narrow, and shallow ones
X IDEO (2010)
Challenges may be longer than a few weeks.
Failure is important. Allow time to fail then recover and try again in order to build more success.
X Travis (2011)
Establish clear minimum criteria for meeting the design challenge.
X UPA (2013)

29
The process used to make the comparison was completed by the
researcher. The 19 requirement for a good engineering design challenge were
compared to phases in the UCD process. The comparison was broken down into
three categories: essential, aligned, and conflicting. The comparison primarily
came down to the objective of the step or process and its fit within the 19
required points. If UCD aligned with the requirement of a good engineering
design problem in that it was essential to the process it was marked as such. If
the step in the process and the requirement highlighted the same steps, but were
not phrased or positioned exactly then they were marked as aligned. Finally the
last comparison was that of which the requirements and the UCD process
conflicted with each other, in that they stated opposite points or measures. All
comparisons looked for scholarly validation or literature to support the alignment.
Of the 19 requirements, 7 were essential elements to the UCD process
and nine appeared to align with the elements present in UCD. The remaining
three do not fit within the scope of UCD. It should be noted that these three are
not conflicting with ideas of UCD, but rather are more general than the elements
of UCD. Upon completion of the review the researcher concluded that UCD
appears to align closely with what the NCETE defines as a design challenge and
what it should look like. This comparison provides strong rationale why the UCD
process can be the foundation of which to carry out what experts in the field
believe are important aspects of any design problem.

30
2.6 User Centered Design and HCD as a Potential Key to Motivation
Rationale to why UCD makes sense with engineering design problems
begins to highlight how UCD can be effective in the classroom, but does not give
any evidence as to why it will work to motivate students. Linking motivational
models and strategies with UCD is a fundamental component to this study. As
previously addressed, the TARGET method is a method to help students
increase motivation (Clinkenbeard, 2012). Clinkenbeard (2012) developed the
model from several empirical studies. The TARGET method provides a useful
framework to explore how UCD may help to motivate students. TARGET stands
for task, authority, recognition, grouping, evaluation and time (Clinkenbeard,
2012).
Task aligns with UCD in that it is introducing new problems to the student,
by introducing a new problem each student will be challenged based on the new
information given from the user. Every student will experience a different set of
challenges and tasks for their specific user. For example, according to IDEO
(2010), a worldwide leading design firm from Palo Alto California, the UCD
method challenges the students to understand the exact needs and wants of
their user and doing so the student will have to strive harder to meet those
needs.
Authority is described as the autonomous feeling students have over their
learning and the outcomes of that (Clinkenbeard, 2012). Students working all
with the same user or separate users can approach the problem in a different

31
manner and ultimately can have completely different solutions for the same
problem. This aligns with letting the students guide their own work (IDEO, 2010).
Recognition in regards to giving the students praise is directly situated
with extrinsic motivation and can apply to most educational models and
processes (Brophy, 2004). While UCD does not specifically state extrinsic
motivation, it also not conflict with this idea. Recognition can also be in
recognizing the improvement of skills to the point of mastery. This shift to have
students focus on improvement also aligns with UCD in that the process is
iterative and that students will constantly be revisiting their own design and
seeking to improve their ideas (IDEO, 2010; Travis, 2011; UPA, 2013). The
iterative process can open several opportunities for extrinsic motivation with the
teacher praising the advancement of the design, but more importantly the
iterative process can potentially motivate the student intrinsically to strive for the
best design that the student is capable of at that time.
Grouping is one of the strongest links in motivation and UCD. Both UCD
models, ISO’s and UPA’s, are outlined in section 2.5 involve grouping and not
just for the sake of team work. Specifically the UPA (2013) recommended
practicing design thinkers to, “assemble a multidisciplinary team to ensure
complete expertise” (para 5). ISO also recommends that, “the design team
includes multidisciplinary skills and perspectives (Travis, 2011, About ISO 9421-
210).

32
Evaluation may be seen as grading or growth measurement. In the aspect
of grading, UCD does not outline a specific measure for how students should be
graded. However, the focus is more on the process of solving the needs and
wants of a real life user’s problem. As students progress through the project they
will see growth in how they are meeting the user’s needs. Also the evaluations of
the students’ own work is an important element. The students should be working
to improve their own designs with the user being an evaluator as they attempt to
better meet their needs (UPA, 2013).
Time, in this context, means allowing students enough time to complete
the project and provides them support for their own growth and learning
(Clinkenbeard, 2012). UCD aligns with this definition of time. IDEO (2010) clearly
addresses time as an important aspect of UCD; they recommend deadlines, but
recommend flexible deadlines that may shift to accommodate the progress of the
students. IDEO outlines four different models of time, a short one being a week
to long term activities with no specific time-frame, but instead working on the
project until implementation (IDEO, 2010).
In addition to the TARGET method, case-based learning (CBL) is an
important motivation methodology taken from education literature that fits well
into UCD. Case-based learning (CBL) is frequently used in the field of
Technology and Engineering education and has four main elements:
(1) an active involvement of students in order to construct knowledge for
themselves by selecting, interpreting, and applying information in order to
solve assignments; (2) the teacher is a facilitator of learning rather than a

33
transmitter of knowledge; (3) use of authentic assignments; and (4)
learning in cooperation with fellow students (Baeten, Dochy, & Struyven,
2013, p. 487)
The first element requires an involvement from the student to guide what they
learn, which is analogous to UCD and requires students to guide what they learn
as well. Students are responsible for conducting the research to understand the
user’s needs. From there, students apply that knowledge to their solutions
(IDEO, 2010; Travis, 2011; UPA, 2013). The next element within the CBL
methodology states that the teacher should facilitate, not lecture. This fits well
with UCD as first students must be taught the principles of UCD but then once
the students are working on their problem they are leading their own discussion
while the teacher is there as a guide. The third element is the use of authentic
assignments. UCD is built on authentic, real world problems that need real
solutions. Lastly, the fourth element is working in cooperation with others or in
groups. Group work is integral to CBL, the TARGET method, and UCD (IDEO,
2010; Travis, 2011; UPA, 2013).
2.7 Conclusion
The goal of finding “logical assertions” that connected motivation and UCD
yielded a chain of results. The purpose of that chain was to explore an underlying
mechanism to improve interest in STEM fields through high school. Different
methods and approaches for fostering motivation have been reviewed in this
chapter. Research has demonstrated that the TARGET and CBL principles are
anchors that provided elements of motivation in the classroom; these principles

34
readily align and can be implemented by incorporating the UCD process in the
classroom. Taken together, these practices highlight research that supports the
students need for relevant and engaging learning that most importantly positions
engineering and technology as a helping profession. While several studies
(Damodaran, 1996; Maquire, 2001; Zoltowski, 2010) have shown the benefits of
UCD in the workplace, no research was discovered that has empirically
documented the impact of UCD practices on motivation at the high school level.

35
CHAPTER 3. METHODOLOGY
With this chapter, the goal was to outline the framework for how this quasi-
experimental study was conducted. Specifically this researcher set out to
uncover if a treatment of user-centered design (UCD) would have an effect on
the perceived levels of motivation in high school students in an engineering and
technology classroom. The students were split into two groups; comparison and
treatment. Each student took a pre and post survey to determine their levels of
motivation. Once completed, students’ scores were compared to determine if any
difference was made by the treatment. This chapter provides sufficient detail for
future researchers to duplicate testing procedures and build upon this work.
3.1 Research Methodology
For this study, the focus was on measuring high school students’ level of
motivation with a treatment to the current design problem. The treatment group
received the same design problem as the comparison group, but the design
prompt included the UCD process and asked specific questions regarding the
UCD process. The design problem used was an existing lesson in the Project
Lead the Way curriculum implemented by the teacher in this study. More details
on the problem selection are identified below. Two groups (treatment, made up of
two IED sections and comparison, made up of three IED sections) of students
received either the treatment design problem or the comparison design problem.

36
Before and after the completion of the design problems, the students were
surveyed using the situational motivation scale or SIMS. Pretests were compared
to post tests to identify changes of time and how those changes might differ
across groups. The specific pretest used within this study was a proxy pretest.
Shadish, Cook, & Campbell ( 2002) stated, “Sometimes when it is not possible to
collect pretest information on the outcome variable, retrospective pretest ask
respondents to recall their pretest status; or proxy pretest can be gathered on a
variable that is correlated with the outcome" (p. 158). Proxy pretest can be
identified by either an archived or retrospective proxy pretest. For the purpose of
this study a retrospective proxy pretest was used. The pretest asked the students
to synthesize past design activities within the IED course and rate their overall
motivation. The students did complete the pretest before the introduction of either
the comparison and treatment activities. Posttest used the same instrument as
the pretest, but was specific to the design problem students just finished; results
were compared to identify differences between control and treatment conditions.
3.2 Hypothesis
Ho: The UCD process will not have any effect on the students perceived
level of motivation.
Hα: The UCD process will have a positive effect on the students perceived
level of motivation.
3.3 Population
The population used for this study consisted of Midwestern urban high
school students enrolled in Project Lead the Way’s (PLTW) Introduction to

37
Engineering Design course (IED).All students partaking in the course were 9th
grade students. The research group contained a diverse range of ethnicities and
was predominately male (78%).
3.4 Sampling
Once 9th grade students were identified as the appropriate age group, it
was then important to look at which school to use. Project Lead the Way is
prevalent nationally and especially in near the researcher’s institution.
Introduction to Engineering Design is the 9th grade course in the PLTW
sequence. Similar to the process of choosing the PLTW IED curriculum, the
school needed to meet certain criteria. Sampling criteria is an important factor as
it helps guide the choice of the sample (Landreneau & Creek, 2008). The criteria
was developed had to meet the parameters of: (a) teachers with teaching
experience, (b) accessibility to the researcher, (c) sufficient school size, (d)
multiple sections of IED, and (e) willing to implement the research study.
First the teacher(s) needed to have experience in the teaching of IED and
be considered proficient. To judge proficiency, the researcher used the
qualification that Indiana’s Department of Education uses to determine if a
teacher is proficient. This is signified by the instructor having their proficient
practitioner license; this five year license is issued to teachers who have finished
their Indiana Mentoring and Assessment Program (IMAP), during the two year
period of their initial practitioner’s license.
Next was the accessibility for the researcher. A 90 mile radius was
established as a distance to for a school to be potentially included. The distance

38
was based on travel time as the researcher had to travel to deliver all forms,
instructions, and set protocols with instructors face to face.
A sufficient school size was determined based on the need to find a
school that could meet the sample size. Specifically the school needed to have
more than 52 students to meet the sample size requirements for the planned
analyses, with the knowledge that not all students would volunteer or return the
forms. The sample size of 52 will be covered in more detail in the sampling size
section.
The school also needed to have a minimum of two IED sections taught by
the same teacher. Having the same teacher teach both classes was intended to
reduce error, control confounding variables, and minimize the number of
differences between the control and treatment groups.
The last requirement was the approval of the school. Although the
negative effects to the study were minimal, a school could decide to not
participate; or a school that had other research happening concurrently may
decide not to participate.
3.4.1 Sampling Strategy
For the approach of sampling, the school selected had five sections of IED
available for the study; the classes were randomly assigned into the two groups,
treatment and comparison. Then all students were informed of the study, but
were not told if they were in the treatment or comparison group or even that two
different groups existed in the study. The students were all given a packet

39
containing an introduction letter, student assent and parental consent forms (all
forms can be found in the Appendix B). After the briefing, the students who had
returned their consent and assent forms completed the situational motivation
scale (SIMS).
3.4.2 Sample Size
Five different classes with a minimum of 15 students per class gave a
minimum of 75 students potentially participating in the study. The minimum
sample size was chosen based on the goal of detecting a medium effect size,
which is considered appropriate in educational research (Hattie, 2012).
Specifically Hattie breaks down the effect sizes into three categories, high,
medium, and low. In each of these sections he provides different effect sizes for
specific types of educational research and intervention. This study aligned most
closely with direct instruction (d=0.59) and the integrated curricular program
(d=0.39). The average of these two values was chosen by the research which
was an effect size of approximately d=0.50.To detect such an effect size with a
one-tailed t-test and a significance of 0.05, 26 participants per group or 52 total
participants were needed (Aron, Aron, & Coups, 2009). Although the control and
treatment group were not equal size due to scheduling issues, the relevant
importance of this is small due to the within-subjects nature of the analysis which
compares each participants’ pretest score to their post-test score. The final
sample was 59 participants which were considered a robust enough sample to
detect medium effect sizes.

40
3.5 Demographics and Generalization
After the school was selected, its population demographics were collected
to help determine generalizability to other high schools. The school that
participated in the study had over 1,000 students in the 9th grade class of 2013-
14 and is situated in a city of less than one million residents according to the
2010 US Census Data. The city is considered by US Census as metropolitan
area and largely an urban area. The racial demographics of the school were
White – 39.2%, Hispanic -34.5%, Black – 19.4%, Multiracial – 6.2%, and Asian –
0.7%. Using a school in a larger metropolitan area is thought to be an added
strength of the study as researcher hoped it will provide better generalization to
other schools in the U.S. as well as schools with a diverse student body. All
participants in the study were 9th grade students who were participating in an
elective course (i.e., Introduction to Engineering Design). The course was
specifically a problem based learning environment that used both individual and
team work to teach the main principles.
With the information collected the population this study can generalize to
would be teachers who teach PLTW’s IED class. The class should mainly consist
of 9th grade students. The class would also have a diverse ethnic makeup and is
situated in an urban Midwestern city. The class was predominately male.
3.6 Approvals
Approval for the study was procured on multiple levels to assure safety of
the participants. First, was the approval of the Internal Review Board (IRB). The
human subjects desired for this study (minors) require that IRB be aware of all

41
elements; specifically dealing with anonymity, volunteerism, and withdraw. All
IRB approval had to be done before the study. Second, was the approval of the
school and the teacher. The school needed to know the intentions of the study
and any possible repercussions. The teacher approval was also crucial
considering he or she would be changing their intended curriculum in their class.
Lastly, the consent of the students’ (participants) legal guardians and the assent
of the students were needed as all students were under the age of 18. If students
and/or their legal guardians did not consent or assent to the study they were still
allowed to participate in the class and coursework but they were part of data
collection.
3.7 Assessment Instruments
The assessment instrument included for this study is the Situational
Motivation Scale (SIMS; Guay et al., 2000). The SIMS is a 16-item measure. The
SIMS measures situational or state motivation toward a chosen activity. This
self-report measure assesses four subscales: (a) intrinsic motivation, (b)
identified regulation, (c) external regulation, and (d) amotivation. The
measurement scale uses 4 questions each to determine the perceived level of
motivation within the four variables; intrinsic, indentified or regulated, extrinsic,
and amotivation. These four variables scores are added up individually and can
be used to report the student’s level of motivation within those categories. Each
question is scored on a 7-point Likert scale with 1 representing “corresponds not
at all” and 7 representing “corresponds exactly” to the stem question: “Why are
42
you currently engaged in this activity?” The four variables that were measured
were explained by Guay, Vallerand, and Blanchard (2000) as:
Intrinsically motivated behaviors are those that are engaged in for their
own sake. In other words, for the pleasure and satisfaction derived from
performing them.
Identified regulation occurs when a behavior is valued and perceived as
being chosen by oneself.
External regulation (Extrinsic) occurs when behavior is regulated by
rewards or in order to avoid negative consequence.
Amotivation, when amotivated, individuals experience a lack of
contingency between their behaviors and outcomes. Their behaviors are
neither intrinsically nor extrinsically motivated. Amotivated behaviors are
the least self-determined because there is no sense of purpose and no
expectations of reward or possibility of changing the course of events.
Amotivation can thus be seen as similar to learned helplessness where
the individual experiences feelings of incompetence and expectancies of
uncontrollability. (p. 177)
For the purpose of this study four variables will be assessed. Intrinsic and
external regulation (extrinsic) motivation may be the most impactful as they are
believed to be most directly linked to the problem of enrollment and retention
related to student lack of interest (Clinkenbeard, 2012). In section 2.2.1, research
showed that student’s motivation regarding education typically falls into two
categories, intrinsic and extrinsic; therefore it makes the most sense to focus on
these results (Clinkenbeard, 2012).
The motivation measure used had to be validated and shown to be
reliable in the education setting. According to Guay, Vallerand, and Blanchard

43
(2000), they set out to validate the measure of self reporting motivation,
specifically they stated:
The construct validity of the scale (SIMS) is also supported by correlations
with other constructs as postulated by current theories (in self reported
motivation). Moreover, the SIMS is responsive to the experimental
induction as evidence by data gathered through a laboratory study. In
sum, SIMS represents a brief and versatile self-reporting measure of
situational motivation. (p. 175)
The SIMS was chosen to measure motivation and the efficacy of the treatment in
potentially impacting motivation. The SIMS has shown success in research in
evaluating extrinsic motivation, intrinsic motivation, and amotivation levels (Guay
et al., 2000). As well, SIMS has shown success in several different educational
disciplines, specifically physical education and Spanish education in secondary
education. However based on the initial works of Guay, Vallerand, and
Blanchard, SIMS has been validated and shown reliability in a range of academic
activities (2000). In one specific study with a sample of 397 males and 509
females, the Cronbach’s alpha values for the subscales were deemed adequate
(intrinsic motivation = .93; identified regulation = .81; external regulation = .75;
amotivation= .78). In the results of the study, Guay, Vallerand, and Blanchard
(2000) state, “the correlation among the SIMS subscales and some motivational
determinants and outcomes supported the self-determination continuum
described previously, which provided some support for the construct validity of
the scale” (p. 16).
44
3.8 Problem Selection
As stated in previous sections students in the IED curriculum were chosen
because they are in the first class within the PLTW high school technology and
engineering class sequence. This first interaction students have with STEM fields
is important if the U.S. want to reverse the trend of decreasing interest in STEM
fields as student progress through high school (Munce and Fraser, 2013). Once
IED was chosen the next constraint was that the problem needed to fall within
the scaffolding of the curriculum and needed to be during the spring semester of
the course, when the research would be conducted. The researcher went
through every lesson in the IED curriculum with the purpose of identifying if any
outside stakeholders (a critical element of socially beneficial projects, specific to
UCD methods) were mentioned or if there was a specific point where the focus of
the project was not on the student. In the curriculum there are 10 units that
comprise approximately 60 activities. Of these activities, a majority did not clearly
address the user or a stakeholder. After looking through several design
challenges, the researcher decided to use the design project in Unit 9. This
activity best fit the criteria for selecting a specific project for the purposes. The
criteria was timing of implementation (must be in the 2nd half of the spring
semester, openness of the problem (needed to be an open ended problem that
could be altered to included UCD), and inclusion of the original objectives and
learning outcomes (It was important not to alter the experience or the education
the students would receive), once these were addressed, the researcher
communicated to the problem to be used with the teacher. The teacher approved

45
of the activity and was then informed of the additional protocol. The original
activity has the students design a storage compartment with the focus being on
high school students. The change for the treatment group was a shift in who they
were designing for; specifically students were to design for a stakeholder of their
choosing, with the intention of them identifying someone in need. Another
change is the inclusion of the UCD methods from the International Organization
for Standardization’s (ISO) and Usability Professionals' Association’s (UPA),
listed in chapter 2. Another important element was that the design team activity
allowed for the main content, objectives, and learning outcomes to stay the
same. The final consideration for choosing this activity was how little intrusion or
changing of the class environment would occur. This was a vital key as the
research did not want to disrupt the current learning environment.
3.8.1 Development of Treatment
The development of the treatment was conducted by the researcher and
modified and validated by a HCD expert practitioner, Dr. Carla Zoltowski. Dr.
Zoltowski is the Engineering Projects in Community Service (EPICS) co-director
at Purdue University; she teaches and employs the UCD process within her
classes and focused her dissertation on the experiences of students within the
UCD process. With Dr. Zoltowski’s assistance, the design problem was
developed from the original design brief by PLTW. The design brief was altered
to include a more open ended problem, as well as the process of UCD from
International Organization for Standardization’s (ISO) and Usability Professionals'
Association’s (UPA), listed in chapter 2. All wording and phrases, along with the

46
specific steps were then reviewed and modified by Dr. Zoltowski. At the
conclusion of the review, Dr. Zoltowski reported a high consistency between the
design brief and the UCD method. In addition to the design brief was a
PowerPoint to teach students the basics of UCD. The PowerPoint was used as a
way to control fidelity of the implementation of the UCD material, as UCD was a
new concept to the teacher as well as the students. The PowerPoint was
adapted from Dr. Zoltowski’s PowerPoint used to teach college students the
fundamentals of UCD. The changes were primarily in the language used as the
language in the original document was geared towards first year university-level
engineering students and not first year high school students. The specific
material covered the overall process and highlighted what is expected of the
students through each phase. The PowerPoint was also reviewed by Dr.
Zoltowski and deemed appropriate to teach the essential elements of UCD.
3.8.2 Teacher Protocol
Although the treatment problem had been validated, it was important to
increase the fidelity of the treatment, especially with the introduction of teacher
who delivered both the comparison and treatment conditions. To reduce the
chance of error, teacher protocols were developed for the introduction and
implementation portion of the study. The protocols gave clear instruction with
timing, potential questions, and even exact phrasing at specific sections. Protocol
instructions can be found in the Appendix C. As well as the written protocol the
researcher met with the teacher to give an overview of the study, walk through all
protocol documents, and answer any questions about the study. Additionally, the

47
teacher had direct communication with the researcher in the event of any
questions regarding the study.
3.9 Data Collection Methods
The collection of data was done after the completion of the two design
problems and the pre and posttest. All data was collected in the spring semester
of 2014. The SIMS, described in the previous section, was issued using a paper
based method. The survey was expected to take the students 5 to 10 minutes;
however no average time was documented. The SIMS was administered during
the class time. Along with the pre and post SIMS, students also filled out
demographic information. The demographic questions were:
1. Are you male or female?
2. Are you a freshman, sophomore, junior or senior?
3. Would you identify yourself as a (n) (Circle) a. American Indian or
Alaska Native b. Asian c. Black or African American d. Hispanic or Latino
e. Native Hawaiian or other Pacific Islander f. White g. More than one race
h. Other or unknown.
Once the SIMS was finished all data was secured and paired by matching
students name on the pre and post test. The information containing student
names was then removed. Once paired and de-identified, all paper based data
were transferred to a digital medium by the researcher.
3.9.1 Data Analysis
Each student participating was provided with a paper based copy of the
SIMS twice; once for pretest and once for the posttest. These scores were hand

48
entered into a Microsoft Excel spreadsheet and then further analyzed using
Statistical Package for the Social Sciences (SPSS) version 22. The scores were
compared pre and post to yield difference (delta) over time. These differences
between the control and treatment were then analyzed using a repeated
measures analysis. If significance was detected, a post hoc paired sample t-test
was run.
3.10 Conclusion
Overall this quasi-experimental study set out to compare a control group,
the PLTW’s current IED curriculum, to the treatment group, an application of
UCD principles to the PLTW curriculum. Data were collected using a pretest-
posttest from nonequivalent groups and compared with 2-sample t-test. The
purpose of this study was to identify potential impacts of user centered design
philosophy on student motivation. The significance of this study is that a small
change in existing approach may have significant impacts on student motivation
and therefore participation in STEM education.

49
CHAPTER 4. RESULTS
This section provides the results of the data analysis for the quasi-
experimental pretest and posttest non-equivalent groups study. The collection of
student pre and posttest surveys from a comparison and treatment group were
used in a quasi-experimental study to determine if students level of motivation
was changed due to the treatment of user centered design. The analysis was
completed with Statistical Package for the Social Sciences (SPSS) version 22.
4.1 Assumptions Related to Parametric Inferential Statistics
In parametric inferential statistics comparing two groups, there are
assumptions that must be met. These assumptions were an interval or ratio scale
of measurement, normally distributed data, and population variance or equal
groups. Each assumption will be addressed in the following sections.
4.1.1 Scale of Measurement
For this assumption, the dependent variable must be a continuous
number. Likert scales can be used for nominal, ordinal, or continuous values
based upon the design of the scale. There is much controversy over the idea of
using Likert scales as continuous values (Allen and Seaman, 2007). However,
steps can be taken to strengthen the case as to why Likert scales can be used in
parametric statistics. More specifically, the number of scale can be used. With
this research study, the scale used was a seven point Likert scale. The seven

50
points allows for greater range within the value. As well, the scale should be
attempting to measure the same or similar variables. Within the SIMS scale, the
four variables being measured all pertain to motivation (Grace-Martin, 2008).
4.1.2 Test of Normality
The next assumption dealt with testing the groups for normality, this is
particularly important when conducting a quasi-experimental study with non-
equivalent groups. Testing of normality was done across both comparison and
treatment groups and broken down into the four measureable dependent
variables, as discussed in 3.7 Assessment Instrument. The four variables
included intrinsic, regulated, extrinsic, and amotivation. Each variable was
measured in both the pre and posttest, resulting in 16 different subscale
statistical tests. Each variable was measured by four questions on a seven point
Likert scale; this structure produced a range of scores from 4-28.
The test of normality was tested using the Shapiro-Wilk test (Shaprio and
Wilk, 1965). This analysis was selected due to its strong relationship with power,
or the ability to detect a meaningful result (Ghasemi and Zahediasl, 2012). The
test of normality showed that 5 of the 16 subscales were significantly different
from the normal distribution as can be seen in Table 4.1. Normal distribution was
evident if the values were greater than 0.05. This value was appropriate as it is
typical of educational studies (Hattie, 2012). In particular, the comparison group
Post Intrinsic, Pre Regulation, and Post Amotivation all were not normally
distributed, while in the treatment only Pre and Post Amotivation were not
normally distributed.

51
Table 4.1 Tests of Normality
Group Measure Shapiro-Wilk
Statistic df Sig.
Comparison PRE Intrinsic .955 31 .208
POST Intrinsic .923 31 .028*
PRE Regulation .923 31 .028*
POST Regulation .941 31 .087
PRE Extrinsic .948 31 .137
POST Extrinsic .956 31 .227
PRE Amotivation .937 31 .068
POST Amotivation .924 31 .031*
Treatment PRE Intrinsic .957 28 .294
POST Intrinsic .954 28 .242
PRE Regulation .952 28 .221
POST Regulation .931 28 .066
PRE Extrinsic .945 28 .146
POST Extrinsic .929 28 .058
PRE Amotivation .886 28 .005*
POST Amotivation .840 28 .001*
Note * - significant deviation from normal distribution.
According to Ghasemi and Zahediasl (2012), “with large enough sample
sizes (>30 or 40), the violation of the normality assumption should not cause
major problems” (2012 p.1). Thus, with most data being normally distributed and
the sample size of 59, violations of the assumption of normality are minimally
impactful and allowed for parametric statistics to be run and reported.
4.1.3 Nonequivalent Groups
The last assumption assumes that the groups are similar before the
treatment is introduced. This is important to consider in a quasi-experimental
study that uses nonequivalent groups. According to Shadish, Cook, and

52
Campbell (2002), to help control internal validity the researcher should design a
study that results in similar division of groups. As well, the study should
incorporate a pretest to help establish how similar or different the groups are
(Shadish, Cook, & Campbell, 2002). The pretest will be covered more in more
detail below.
For this study the way in which groups were compared was based on
grade level of the student (9th – 12th), race/ethnicity (American Indian or Alaska
Native, Asian, Black or African American, Native Hawaiian or other Pacific
Islander, White, More than one race, or Other or Unknown) and sex (Male or
Female). Upon viewing the data, the 59 students in both comparison and
treatment group were 9th grade students of which all were taught by the same
teacher. Both groups were predominately male, 74% in comparison and 82% in
the treatment. Race/ethnicity identification was diverse across the two groups
and is reported in Table 4.2.
Table 4.2 Demographic Relationships per Group
Demographic Variable
Group
Comparison n (%)
Treatment n (%)
Total Study n (%)
Gender Male 23 (74.20%) 23 (82.10%) 46 (77.97%) Female 8 (25.80%) 5 (17.90%) 13 (22.03%)
Ethnicity
Black or African American
13 (41.90%) 7 (25.00%) 20 (33.90%)
Hispanic
7 (22.60%)
4 (14.30%)
11 (18.64%)
White 10 (32.30%) 13 (46.40%) 23 (38.99%) More than one race
1 (3.20%)
4 (14.30%)
5 (8.47%)

53
The other measure to confirm the assumption of similar groups and to
reduce the threat to internal validity of nonequivalent groups was the introduction
of a pretest. The pretest was used to determine how similar the groups were
before the treatment was introduced (Shadish, Cook, & Campbell, 2002). The
pretest summary descriptive statistics are shown in Table 4.2. The combination
of the demographic data and the pretest allowed the researcher to decrease the
risk of threats to the internal validity. However, with a quasi-experimental study it
is impossible to completely reduce group bias, but the stronger and more
elaborate the pretest and grouping characteristics are, the less threats can be
assumed (Shadish, Cook, & Campbell, 2002).
4.2 Summary Descriptive Statistics
All assumptions for parametric statistics were either met or addressed.
Summary statistics are presented in Table 4.3 as mean and standard deviation
values of the scales which ranged from 4.0 – 28.0.
Once mean and standard deviation were run, one way repeated measures
ANOVA were conducted to compare the effect of user centered design (UCD) on
students perceived level of intrinsic motivation, regulated motivation, extrinsic
motivation, and amotivation. When using repeated measure ANOVAs Mauchly's
Test of Sphericity is used to check sphericity of the data. However with the setup
of this study, Mauchly’s Test of sphericity is always met for designs with only two
levels within a repeated measures test (Field, 2008). Effect sizes are reported as
partial eta square and, as suggested by Cohen (1973), where 0.01 is a small
effect size, 0.06 is medium, and 0.14 is large.
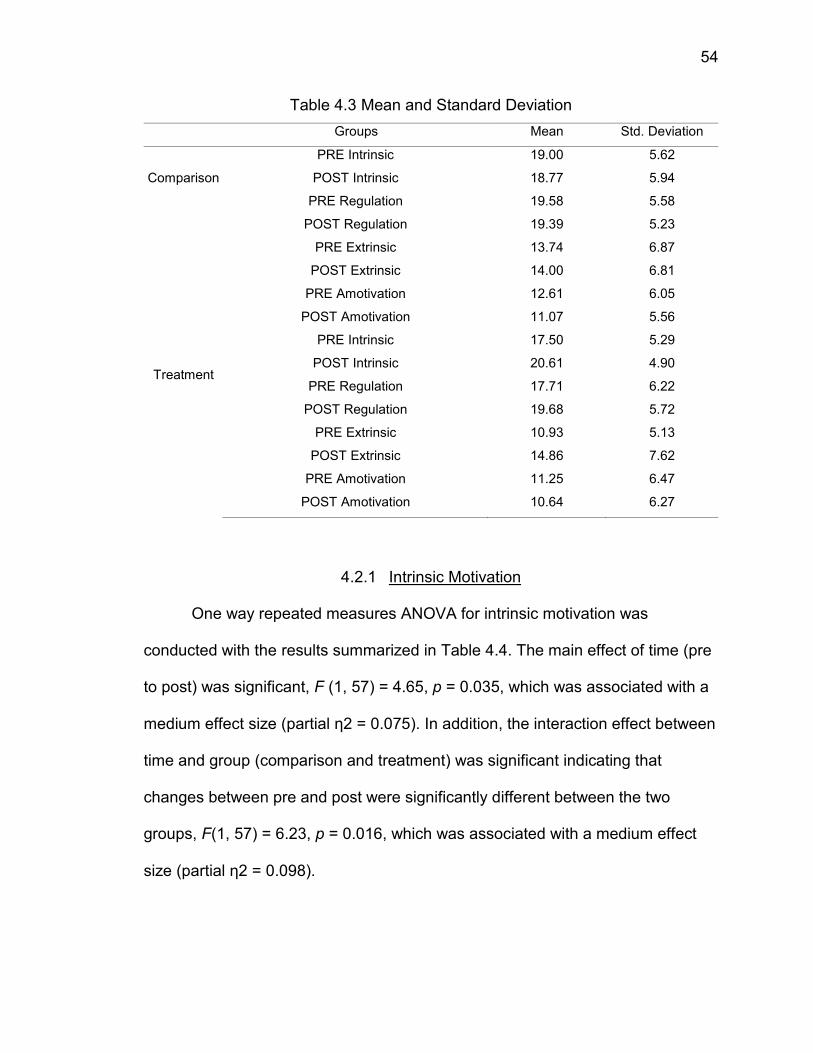
54
Table 4.3 Mean and Standard Deviation
Groups Mean Std. Deviation
Comparison
PRE Intrinsic 19.00 5.62
POST Intrinsic 18.77 5.94
PRE Regulation 19.58 5.58
POST Regulation 19.39 5.23
PRE Extrinsic 13.74 6.87
POST Extrinsic 14.00 6.81
PRE Amotivation 12.61 6.05
POST Amotivation 11.07 5.56
Treatment
PRE Intrinsic 17.50 5.29
POST Intrinsic 20.61 4.90
PRE Regulation 17.71 6.22
POST Regulation 19.68 5.72
PRE Extrinsic 10.93 5.13
POST Extrinsic 14.86 7.62
PRE Amotivation 11.25 6.47
POST Amotivation 10.64 6.27
4.2.1 Intrinsic Motivation
One way repeated measures ANOVA for intrinsic motivation was
conducted with the results summarized in Table 4.4. The main effect of time (pre
to post) was significant, F (1, 57) = 4.65, p = 0.035, which was associated with a
medium effect size (partial η2 = 0.075). In addition, the interaction effect between
time and group (comparison and treatment) was significant indicating that
changes between pre and post were significantly different between the two
groups, F(1, 57) = 6.23, p = 0.016, which was associated with a medium effect
size (partial η2 = 0.098).

55
Table 4.4 One Way Repeated Measures ANOVA for Intrinsic Motivation
Source Test Type III Sum of Squares
df Mean Square
F Sig
Time (Pre Post) Sphericity Assumed 61.07 1 61.070 4.65 0.035*
Time * Group Sphericity Assumed 81.71 1 81.71 6.23 0.016*
Error Time Sphericity Assumed 748.05 57 13.12
* Significant the p<0.05
A paired samples t-test was used for a post hoc comparison to identify
how the groups differed between pre and post. To control for family-wise error, a
Bonferroni-Holm correction factor was implemented to adjust the significance
value from 0.050 to 0.025 (0.05/2 = 0.025). Paired samples t-test indicated that
the comparison group did not differ significantly in intrinsic motivation scores
between the pretest (M = 19.0, SD = 5.62) and the posttest (M = 18.77,
SD=5.94); t (30) =.22, p = 0.830. However, the treatment group showed
significant increases in intrinsic motivation scores from the pretest (M = 17.500,
SD = 5.218) to the post test (M = 20.61, SD = 4.90); t (27) = -3.86, p = 0.001.
This relationship is shown in Figure 4.1.

56
Figure 4.1 Pre and Posttest Difference in Intrinsic Motivation
4.2.2 Regulated Motivation
One way repeated measures ANOVA for intrinsic motivation was
conducted with results summarized in Table 4.5. The main effect of time was not
significant, F (1, 57) 1.59, p = 0.213. The interaction effect between time and
group was not significant F (1, 57) 1.59, p = 0.130. This relationship can be found
in Figure 4.2.
Table 4.5 One Way Repeated Measures ANOVA for Regulation Motivation
Source Test Type III Sum of Squares
df Mean Square
F Sig
Time (Pre Post) Sphericity Assumed 23.07 1 23.07 1.59 .213
Time * Group Sphericity Assumed 34.25 1 34.25 2.36 0.130
Error Time Sphericity Assumed 827.90 57 14.53
* Significant the P<0.05
Comparison
Treatment
4
9
14
19
24
Pretest Posttest
SIM
S R
esp
on
ses
fo
r In
trin
sic

57
Figure 4.2 Pre and Posttest Difference in Regulation Motivation
4.2.3 4.2.3 Extrinsic Motivation
One way repeated measures ANOVA for intrinsic motivation was
conducted with results summarized in Table 4.6. The main effect of time (pre to
post) was significant, F (1, 57) = 5.00, p = 0.029, which was associated with a
medium effect size (partial η2 = 0.081). However, the interaction effect between
time and group (comparison and treatment) was not significant F (1, 57) = 3.85, p
= 0.055.
Comparison
Treatment
4
9
14
19
24
Pretest Posttest
SIM
S R
esp
on
ses
for
Reg
ual
atio
n

58
Table 4.6 One Way Repeated Measures ANOVA for Extrinsic Motivation
Source Test Type III Sum of Squares
df Mean Square
F Sig
Time (Pre Post) Sphericity Assumed 128.93 1 128.93 5.00 .029*
Time * Group Sphericity Assumed 99.10 1 99.10 3.85 0.055
Error Time Sphericity Assumed 1468.90 57 25.77
* Significant the p < 0.05
A paired samples t-test was used for a post hoc comparison to identify if
the groups differed between pre and post for the main effect of time. To control
for family-wise error, a Bonferroni-Holm correction factor was implemented to
adjust the significance value from 0.050 to 0.025 (0.05/2 = 0.025). Paired
samples t-test indicated that the comparison group did not differ significantly in
extrinsic motivation scores between the pretest (M = 13.74, SD = 6.87) and the
posttest (M = 14.00, SD = 6.81); t (30) = -0.24, p = 0.813. However, the treatment
group showed significant increases in extrinsic motivation scores from the pretest
(M = 17.50, SD = 5.22) to the post test (M = 14.86, SD = 7.62); t (27) = 0.50, p =
0.018. This relationship is shown in Figure 4.3.

59
Figure 4.3 Pre and Posttest Difference in Extrinsic Motivation
4.2.4 Amotivation
One way repeated measures ANOVA for intrinsic motivation was
conducted with results summarized in Table 4.7. The main effect of time was not
significant, F (1, 57) =1.75, p = 0.192. The interaction effect between time and
group was not significant F (1, 57) 6.52, p = 0.566. This relationship can be found
in Figure 4.4.
Table 4.7 One Way Repeated Measures ANOVA for Amotivation
Source Test Type III Sum of Squares
df Mean Square
F Sig
Time (Pre Post) Sphericity Assumed 34.18 1 34.18 1.75 .192
Time * Group Sphericity Assumed 6.52 1 34.25 6.52 0.566
Error Time Sphericity Assumed 1115.18 57 19.57
* Significant the P<0.05
Comparison
Treatment
4
9
14
19
24
Pre test Post Test
SIM
S R
esp
on
ses
for
Extr
insu
c
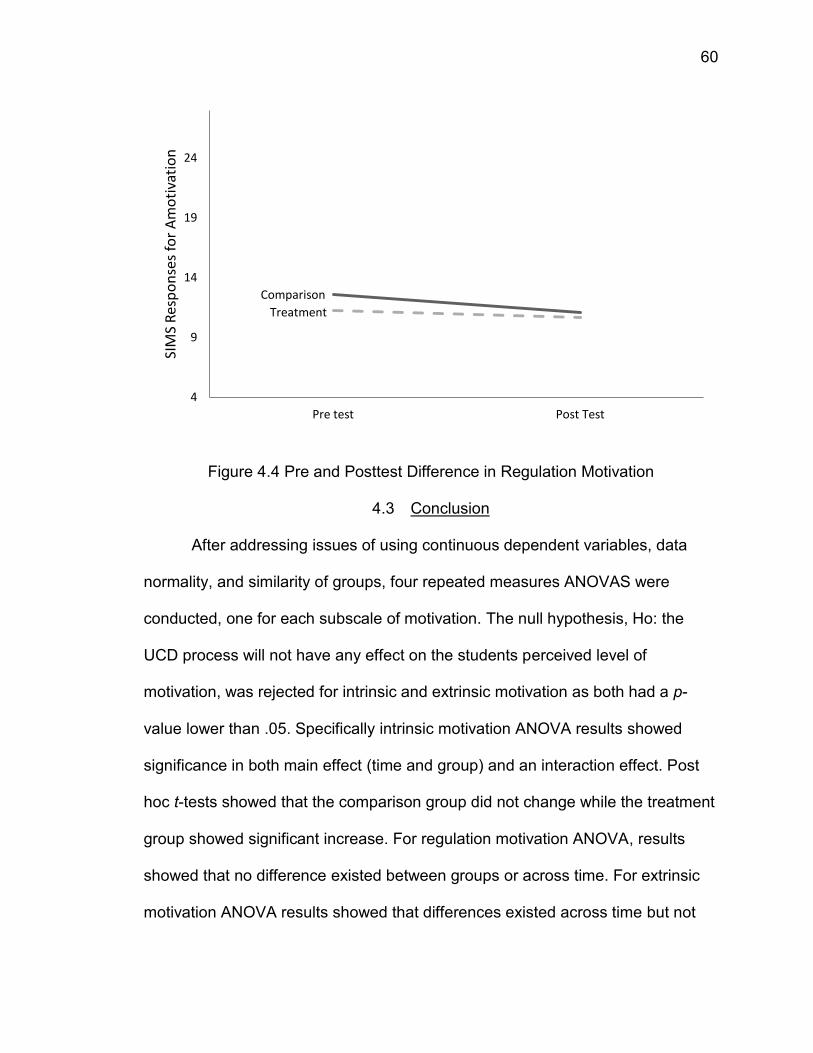
60
Figure 4.4 Pre and Posttest Difference in Regulation Motivation
4.3 Conclusion
After addressing issues of using continuous dependent variables, data
normality, and similarity of groups, four repeated measures ANOVAS were
conducted, one for each subscale of motivation. The null hypothesis, Ho: the
UCD process will not have any effect on the students perceived level of
motivation, was rejected for intrinsic and extrinsic motivation as both had a p-
value lower than .05. Specifically intrinsic motivation ANOVA results showed
significance in both main effect (time and group) and an interaction effect. Post
hoc t-tests showed that the comparison group did not change while the treatment
group showed significant increase. For regulation motivation ANOVA, results
showed that no difference existed between groups or across time. For extrinsic
motivation ANOVA results showed that differences existed across time but not
Comparison
Treatment
4
9
14
19
24
Pre test Post Test
SIM
S R
esp
on
ses
for
Am
oti
vati
on

61
between groups. Post hoc t-tests showed that the comparison group did not
change while the treatment group showed a significant increase. For amotivation
ANOVA results showed that no difference existed between groups or across
time.

62
CHAPTER 5. CONCLUSIONS, SUMMARY, AND RECOMMENDATIONS
The U.S. must retain more students in the STEM disciplines, in particular
the engineering and technology sectors, where the largest job shortages
currently exist (Munce & Fraser, 2013). However, of the students interested in
STEM disciplines their first year of high school, 60% lose interest by graduation.
To understand student’s loss of interest, we must also understand their
motivation towards the subject, as interest and motivation have been consistently
linked in past research (Deci, 1992). This study set out to examine if a treatment
of user centered design could motivate engineering and technology students
more than the traditional curricula currently in place. Current curriculums engage
students in design challenges, but these design challenges are typically not user
centered. The treatment group received a slightly modified design problem that
followed the user centered design (UCD) process rather than the traditional
approach to design. This research study indicated that a user centered design
approach to design has significant impacts on motivation, by elevating levels of
intrinsic and extrinsic motivation.
5.1 Summary
Fifty-nine 9th grade high school students participated in this study. Of the
59, 31 were in the comparison group and 28 were in the treatment group.
Students participated in pre and posttests. The pretest also collected

63
demographic information. Demographic information was collected for two main
reasons. The first was to identify how similar the comparison and treatment
groups were. The demographics showed that the groups were similar to each
other and to the national average of demographics. By having a similar
representation to the national average generalization of results increased. The
second was to examine potential trends that could be found in the data regarding
ethnicity and sex. While this study had a balance of male and female students
and of ethnic/race, the sample size did not permit statistical inferences about
subsets of the sample based on demographic data.
After meeting assumptions to conduct the relevant analyses, the research
question was addressed. The research question for this study was: What effect
does user-centered design have on the high school technology and engineering
design students perceived level of motivation as compared to traditional design
approaches?. The participants perceived level of motivation were broken down
into four subsets; intrinsic, regulation, extrinsic, and amotivation. The SIMS was
the appropriate instrumentation in that it collects students’ responses in all four
categories. In this study, intrinsic motivations were believed to be the most
important (Clinkenbeard, 2012) because intrinsic motivation is most directly
related to the problem of enrollment as discovered in the literature review.
According to Clinkenbeard (2012), in order see a large change in students’
perceived level of motivation, the change needs to occur at the intrinsic level,
more so than in the extrinsic level. Although there is still much to be learned
64
about the role of regulation motivation and the amotivation; conclusions about all
four constructs will be outlined below.
First, the data analysis showed that intrinsic motivation saw a significant
increase in the treatment group as compared to the comparison group. The
students average rating was approximately three points higher on the posttest
(delta = 3.11, scale was 4.0 - 28.0 points). This contrasted with the comparison
group’s data as there was not a significant change from pre- to posttest (delta = -
0.27 points). The delta of approximately three points is difficult to quantify with
regards to the affect it will have on outcomes like student’s grade, engagement,
or other factors. One way to contextualize this increase is to consider a
percentage of increase in reported motivation. With the range of 24, a 3 point
gain is a 12.5% gain in intrinsic motivation; this means that it effectively could
move the average student from one point to the next on the SIMS instrument, in
the positive direction. As well, all results from the post hoc paired samples t-test
had medium effect sizes. Particularly with the treatment of UCD, there is a 95%
confidence interval that student’s perceived levels of intrinsic and extrinsic
motivation will increase.
The increased intrinsic and extrinsic motivation levels are a powerful
discovery when considering the transition to UCD. As discussed in the literature
review, UCD is a process in working through design challenges. This process
can be incorporated in a multitude of current design challenges and problems in
existing curriculum. Design problems are a common learning experience for
students and transitioning them to an UCD approach is not about changing the

65
problem, but about changing the method of working through the problem. This is
significant because of the importance of low cost interventions within school
systems. The UCD process can easily be adapted to most design challenges,
specifically the ones that use or could potentially use external stakeholders. This
means a low cost of implementation may have significant benefits in enrollment
by increasing student motivation.
The transition to UCD only takes minor revisions to the documentation,
specifically making the problem more open-ended, with the students seeking out
external stakeholders. An example can be found in Appendix E., which shows
the comparison problem and then the revisions for the treatment to consider the
process UCD. Once students have concentrated on a specific problem and have
found the stakeholders affected by the problem, the students begin to gain
information about the constraints and criteria from observations, interviews, and
data collection directly from the stakeholders. After the students have developed
the constraints and criteria, they must begin designing, creating, and testing. All
of these phases must incorporate the user, be it through formal usability testing
or in gathering feedback for revisions. While this may sound as a complete
overhaul, in reality it is a small shift in the focus of the problem statement and
some structure of the UCD process built into the deliverables for the student.
Based on the results of this study, teachers who can successfully revise their
pedagogy to include UCD may expect to see that theirs students have a higher
level of perceived intrinsic motivation.
66
The other aspect of motivation that changed significantly as a result of the
intervention was extrinsic motivation. Similar to the intrinsic comparison and
treatment, the comparison started slightly higher, but did not change significantly
(delta = .26), while the treatment group saw a significant increase (delta = 3.93).
The result of a higher extrinsic value in the treatment group indicates the
students felt more external motivation to participate in the activity. This may have
been due to the Hawthorne effect, also referred to as the observer effect, but that
seems unlikely considering only the treatment group saw an increase. UCD does
advocate the use and evaluation of external stakeholders and therefore it may be
that the students eternalized those evaluations as more extrinsic motivation to
complete the work. While at the surface level it appears as if higher extrinsic
motivation could be good, it may also increase the pressure the student feels
from the activity in a negative way (Ryan & Deci, 2000). If students are new to
the process and do not fully understand the process or have the skills needed to
complete the design problem, an extra stakeholder (someone other than the
teacher) may negatively impact the students experience with the course and
result in the students losing interest.
Regulation motivation was another of the four motivation constructs
measured, however unlike intrinsic and extrinsic, regulation did not see a
statistically significant increase in the treatment compared to the comparison
group. Regulation is when someone values a certain aspect and feels autonomy
over it. A non-significant effect of regulation motivation may have resulted from
the students still feeling some external pressure to complete the task in a specific
67
way regardless of how much autonomy they may actually have. This could be
due to the common practice of teachers telling students what to do instead of
guiding them or allowing them to pick their own problems.
The last measure was amotivation which did not see a significant
difference between groups. Amotivation deals the behaviors and attitudes toward
learning, specifically the lack of those behaviors or attitudes, similar to apathy.
This measure had one of the largest standard deviations among the group, which
could potentially be credited to the young age of the students and how new the
subject was to the students as they might not have had a behavior or attitude
toward the subject.
5.2 Threats to Validity
The internal and externals threats to validity that may potentially have
affected the outcome will be looked at in more depth in the following sections.
Although efforts were made to minimize threats to validity, such as establishing a
clear teaching protocol and using a diverse sample, there are still limitations to
address.
5.2.1 Internal Threats
Two major internal threats to validity that may have directly affected the
research were diffusion and mortality. Diffusion may have resulted from students
of the different sections (i.e., comparison groups vs. treatment groups)
discussing the projects they were working on. For example, if students in the
comparison group discuss the project with those in the treatment they may have
transferred knowledge or lead the students to complete the activity in a different

68
way. In addition, mortality may have affected the final outcomes of the study.
Five students completed the pretest and were assigned groups (comparison or
treatment) but did not complete the posttest. Given the small sample size, a loss
of five participants translates to a nearly 10% attrition rate. However, it is
important to note that this number is typical of the make-up of the school’s urban,
densely packed school district area as it is likely that when a family or student
moves they will also be moving from school to school, thus creating a higher than
average transient population. All students who did not complete the pre and the
posttest were not included in the study.
5.2.2 External Threats
External threats that may reduce generalizability of the results are
interaction effects of selection biases. The research conducted was developed
as a quasi-experimental study and in doing so the participants were not randomly
selected, but rather the school had to meet certain characteristics for inclusion
and then the existing sections themselves were selected for comparison or
treatment groups. In doing so, demographics and pretest data were collected to
ensure similar groups. However, despite the efforts to ensure similarity of the
groups, participants may have had different aptitude levels or generally different
knowledge bases. As well, there may have been a scheduling conflict resulting in
certain students in one group rather than the other. However, as the teacher
divided the groups they attempted to ensure the groups would have similar make
up in both achievement level and size.

69
5.3 Recommendations
From pre to posttest, the comparison group did not change significantly in
measured levels of motivation. However, the treatment group showed significant
increases in intrinsic and extrinsic motivation levels. With this knowledge, the
researcher has recommendations in the following areas; teacher understanding,
UCD implementation, curriculum development and future research.
5.3.1 Teacher Understanding
Within teacher understanding, the recommendation is that teachers are
educated on the UCD process. UCD has begun to become a popular practice
amongst designers and business people alike, with that training material has
become more and more abundant (Damodaran, 1996; Maquire, 2001; Zoltowski,
2010). Companies like IDEO have even gone as far as giving away free material
in teaching the practice of UCD. If teachers hope to incorporate UCD
successfully, they need to fully understand what UCD is before they begin to
teach it. These materials are freely and widely available. Below are web links to
Stanford’s D. School and their Bootleg Bootcamp document and to IDEO’s HCD
tool kit.
http://www.ideo.com/images/uploads/hcd_toolkit/IDEO_HCD_ToolKit.pdf
http://dschool.stanford.edu/wp-
content/uploads/2011/03/BootcampBootleg2010v2SLIM.pdf
5.3.2 UCD Implementation
Based on the findings of this study, user centered design should be
implemented into design challenges and problems in engineering and technology
classrooms. Teachers should begin to teach students the UCD process and

70
include the UCD process as much as possible or feasible. For example,
problems that do not clearly address an external stakeholder still could very likely
have constraints and criteria that have to be met. By implementing the UCD
process into students’ everyday design decisions they will become accustom to
asking questions and understanding what is actually expected of them.
5.3.3 Curriculum Development
As teachers and curriculum writers plan their units and lessons it is
important to stay current with cutting-edge research. As such, it is important that
as curriculum develops it reflects the surroundings of industry. User centered
design (UCD) is a growing trend that more businesses are using to increase the
overall experience of products (Damodaran, 1996; Maquire, 2001; Zoltowski,
2010). Given that UCD is both becoming the standard in real-world settings and
it is supported in the by this study as useful in increasing student motivation,
technology and engineering curriculum should incorporate the basics of the UCD.
Further, curricula should scaffold the UCD process for students of different ages
and knowledge levels, so that all students can explore the benefits of UCD. In
pursuit of these changes, training for curriculum developers that consist of
adapting existing lessons to use UCD is vital and necessary. For the trainings to
be effective, exercises should allow teachers the opportunity to have their
curriculum and or lessons evaluated by UCD practitioners or experts. The
researcher believes this to be true specifically in the beginning of incorporating
UCD as the concepts may be very unfamiliar and it is important that quality and
correct curriculum that teaches UCD is developed. By providing such support it

71
can offset the different knowledge levels and abilities of the teachers to adapt a
curriculum
5.4 Recommendations for Future Research
User centered design is a process and research should continue to guide
how it is implemented. The scope of this thesis was to see how a treatment of
UCD affected urban Midwestern student’s level of motivation. Based on the
results of this study, five recommendations are made.
1. Replicate the study on a larger scale with more than one school. With
a sample size of 59 participants, the ability to detect medium effects
sizes was present but the ability to investigate how the intervention
may affect students differently based on cultural background, sex, or
year in school was absent. Additionally, gathering data from multiple
schools will allow for a better understanding of the generalization of the
interventions.
2. Replace a single proxy pretest with several pretests. While a single
proxy pretest provides more strength then no pretest, it would be more
rigorous to provide several pretests. A potential method would be to
have a pretest after each design activity in the IED class. By
implementing the SIMS repeatedly leading up to the UCD experience it
would allow for to the comparisons between pre and post to be
stronger.
3. Compare the intervention created in this study to other engineering
and technology curriculum. For this study only Project Lead the Way

72
(PLTW) was used. While PLTW is a well-recognized curriculum
developer for STEM educational materials, it is not the only curriculum
implemented in schools. Thus, to better understand the utility of this
study’s intervention it should be compared to other curricula.
4. Repeat the study and develop a method to judge the quality of the
solution. Although motivation is critical to increasing student interest in
STEM disciplines, this study did not assess the quality of student
solutions or student learning which are also of critical interest to
teachers and school administrators. Thus, collecting the students’
solutions and developing a way to judge the quality could further
explain impacts of user center design as a pedagogy. While increasing
motivation was statistically and practically significant, if students also
produced higher quality of work, it would further motivate teachers to
transition to UCD into their classrooms.
5. Collect data from the teachers as well. While increasing intrinsic
motivation in the students is very powerful, it would also be important
to see the effect the study had on the instructor. Instructor investment,
interest, and motivation have an important effect on students and
investing whether instructors become more motivated because of the
external stakeholders is also important. Further, if instructors are
affected, what is the effect and how does it relate to the students? The
collected information could be designed as a qualitative study with
several teachers opinions collected and reviewed.

73
6. Develop a method to assess the extent to which extrinsic motivation
may have been tied to the use of external stakeholders. As some
researchers have demonstrated, extrinsic motivation can have a
negative effect on intrinsic motivation and can be fostered by shifting
the focus from engaging in material for oneself to engaging in material
for others. As such, it is important to explore more thoroughly if the
inclusion of the external stakeholder added extra pressure for the
students to do well or if the stakeholder variable increases extrinsic
motivation. For example, it would be helpful to determine if students
had staff or faculty as their stakeholders what effects would arise that
do not when students have other students as their stakeholders.
5.5 Conclusion
To conclude, the research has shown that students who were in the
treatment group saw a rise in intrinsic and extrinsic motivation from pre to
posttest. This study considered multiple potential threats to validity, both intrinsic
and extrinsic, and the impacts they might have had on the data. Once all data
were completed and reported, to the findings were synthesized and related to
specific recommendations that can be utilized by teachers, curriculum
developers, and researchers. As well as recommendations from the study, future
recommendations for research were also provided to spur more studies within
the field of user centered design and student motivation, as research, specifically
in technology, must continue to stay current to have a real impact on society.
REFERENCES

74
REFERENCES
Adler, Natalia. (2013). Introducing human centered design into policy-making in
Nicaragua. Retrieved from http://unicef.org.ni/prensa/131/
Allen I.E., & Seaman C.A. (2007). Likert scales and data analyses. Quality
Progress, 64-65.
Aron, A., Aron, E. N., & Coups, E. J. (2009). Statistics for psychology (5th ed.).
Upper Saddle River, NJ: Pearson Prentice Hall.
Baeten, M., Dochy, F., & Struyven, K. (2013). The effects of different learning
environments on students’ motivation for learning and their achievement.
British Journal of Educational Psychology, 83; 484–501. doi:
10.1111/j.2044-8279.2012.02076.x
Brophy, J. E. (2004). Motivating Students to Learn, Lawrence Erlbaum
Associates.
Clinkenbeard, P. R. (2012). Motivation and gifted students: Implications of theory
and research. Psychology In The Schools, 49(7), 622-630.
doi:10.1002/pits.21628
Cohen, J. (1973). Eta-squared and partial eta-squared in communication
science. Human Communication Research, 28, 473-490.
Committee on Standards for K-12 Engineering Education. (2010). Standards for
K-12 engineering education, Washington, DC: National Academies Press.
Dali, S., N. (2006). Index: 2007 Magazine: User-centered design &
innovation, INDEX.
Damodaran, L. (1996). User involvement in the system design process – a
practical guide for users. Behavior & Information Technology, 15, 363-
377.

75
Deci, E. (1992). The relation of interest to the motivation of behavior: a self-
determination theory perspective. In Renninger, K. A., Hidi, S., Krapp, A.
(1992). The role of interest in learning and development. (p. 43 – 70)
Hillsdale, NJ: Erlbaum.
DOEd (U.S. Department of Education). (2008). National Center for Education
Statistics. Digest of Education Statistics, 2007 (NCES 2008-022), Table 3.
Field, A. (2008). Repeated measures ANOVA using SPSS. C8057 Research
Methods in Psychology, Retrieved from
http://www.pc.rhul.ac.uk/staff/J.Larsson/teaching/pdfs/repeatedmeasures.
Ghasemi A, Zahediasl, S. (2012). Normality tests for statistical analysis: a guide
for non-statisticians. International Journal of Endocrinology & Metabolism,
10, 486–489. doi: 10.5812/ijem.3505
Grace-Martin, K. (2008). Can likert scale data ever be continuous? Retrieved
from http://www.theanalysisfactor.com/can-likert-scale-data-ever-be-
continuous/
Guay, F., Vallerand, R. J., & Blanchard, C. (2000). On the assessment of
situational intrinsic and extrinsic motivation: The Situational Motivation
Scale (SIMS). Motivation and Emotion, 24, 175–213.
Hadriana, Ismail, M., & Mahdum. (2013). The relationship between motivations
and self-learning and the English language achievement in secondary
high school Students. Asian Social Science, 9(12), 36-43.
doi:10.5539/ass.v9n12p36
Hattie, J., (2012). Visible learning for teachers, maximising impact on learning.
Routledge, Oxford: UK.
Householder, D. L., (2011). Engineering design challenges in high school STEM
courses a compilation of invited position papers. Publications. Paper 167.
Householder, D. L., & Hailey, C. E. (2012). Incorporating engineering design
challenges into STEM courses. Publications. Paper 166.

76
IDEO (2010). Human-Centered Design Toolkit 2nd Edition. Retrieved from
http://www.ideo.com/images/uploads/work/casestudies/
pdfs/IDEO_HCD_ToolKit_Complete_for_Download.pdf. Accessed
3/28/2010.
International Technology Engineering Education Association (ITEEA). (2007).
Standards for technological literacy: Content for the study of technology.
Reston, VA: Author.
Jokela, T., Liviari, N., Matero, J., & Karukka, M. (2003). The standard of user-
centered design and the standard definition of usability: Analyzing ISO
13407 against ISO 9241-11. Proceedings of the Latin American
conference on Human-computer interaction. Rio de Janeiro, Brazil, ACM:
53-60.
Landreneau, K. J. & Creek, W. (2008). Sampling strategies. Retrieved on 12
August 2009 from www.natco1.org/research/files/SamplingStrategies.pdf
Maguire, M. (2001). Methods to support human-centered design. International
Journal of Human-Computer Studies, 55 (3), 587-634.
McGrew, K. (2011). Beyond IQ series # 7: Academic motivation defined and
learning implications. IQ’s corner. Retrieved from
http://www.iqscorner.com/2011/08/beyond-iq-series-7-academic-
motivation.html
Miaoulis, Ioannis. (2010). NCTL STEM speech. Retrieved from
http://www.youtube.com/watch?v=4B-g1_6QCWU
Motivation. (2002). Glossary of psychological terms. American Psychological
Association. Retrieved from
http://www.apa.org/research/action/glossary.aspx
Munce, R., & Fraser, E. (2013). Where are the STEM students? The Alliance for
Science & Technology Research in America. Retrieved from
www.stemconnector.org.
National Research Council. (2009) Engineering in K-12 Education:
Understanding the Status and Improving the Prospects. Washington, DC:
The National Academies Press

77
National Research Council. (2008). Changing the Conversation: Messages for
Improving Public Understanding of Engineering, The National Academies
Press.
National Science Board. (2012). Science and engineering indicators 2012.
Arlington, VA: National Science Foundation.
Obama, Barrack. (2009). President Obama launches "educate to innovate"
campaign for excellence in science, technology, engineering & math
(STEM) education. Retrieved from http://www.whitehouse.gov/the-press-
office/president-obama-launches-educate-innovate-campaign-excellence-
science-technology-en
Project Lead the Way. (2014). About us. Retrieved from
https://www.pltw.org/about-pltw
Reynolds, B., Mehalik, M. M., Lovell, M. R., & Schunn, C. D. (2009). Increasing
student awareness of and interest in engineering as a career option
through design-based learning. International Journal of Engineering
Education, 25(1), 788–798.
Ryan, R. M., & Deci, E. L. (2000). When rewards compete with nature: The
undermining of intrinsic motivation and self-regulation. In C. Sansone & J.
M. Harackiewicz (Eds.), Intrinsic and extrinsic motivation: The search for
optimal motivation and performance (pp. 13-54). New York: Academic
Press.
Schunk, D. H., Pintrich, P. R., & Meece, M. L. (2008). Motivation in education:
Theory, research, and applications (3rd ed.). Upper Saddle River, NJ:
Pearson.
Shapiro, S.S. & Wilk, M.B. (1965). An analysis of variance test for normality
(complete samples), Biometrika 52, 591-611.
Standage, M., Treasure, D.C., Duda, J.L., Prusak, K.A. (2003) Validity, reliability,
and invariance of the Situational Motivation Scale (SIMS) across diverse
physical activity contexts. Journal of Sport & Exercise Psychology, 25
(2003), pp. 19–43

78
Taylor, L. & Parsons, J. (2011). Improving student engagement. Current Issues
in Education, 14(1). Retrieved from http://cie.asu.edu/
Travis, D. (2011). ISO 13407 is dead. Long live ISO 9241-210! Retrieved from
http://www.userfocus.co.uk/articles/iso-13407-is-dead.html
Usability Professionals’ Association (UPA). (2013). What is user-centered
design? Retrieved from
http://www.usabilityprofessionals.org/usability_resources/about_usability/w
hat_is_ucd.html
User centered design. (n.d.). The research-based web design & usability
guidelines. Retrieved from http://www.usability.gov/what-and-why/glossary
Waugh, Hilary. (2011). The Factors that influence a student's decision for course
enrollment. Retrieved from http://voices.yahoo.com/the-factors-influence-
students-decision-for-8258751.html?cat=4
Zoltowski, C. B. (2010). Students' ways of experiencing human-centered design.
(Doctoral Dissertation). ProQuest Dissertations and Thesis Database.
(UMI No. 3413917).
Zoltowski, C. B., Oakes, W. C., & Cardella, M. E. (2012). Students' ways of
experiencing human-centered design. Journal of Engineering Education,
101(1), 28-59.

APPENDICES

79
Appendix A Pretest and Posttest Survey Instruments
The Situational Motivation Scale (SIMS)
Directions: Read each item carefully. Using the scale below, please circle
the number that best describes the reason why you are currently engaged
in this class. Answer each item according to the following scale: 1:
corresponds not all; 2: corresponds a very little; 3: corresponds a little; 4:
corresponds moderately; 5: corresponds enough; 6: corresponds a lot; 7:
corresponds exactly.
Why are you are currently engaged in the activities of this class?

80
Demographic Data
1. Are you male or female?
2. Are you a freshman, sophomore, junior or senior?
3. Would you identify yourself as a(n) (Circle)
a. American Indian or Alaska Native b. Asian c. Black or African American d. Hispanic or Latino e. Native Hawaiian or other Pacific Islander f. White g. More than one race h. Other or unknown

81
The Situational Motivation Scale (SIMS)
Directions: Read each item carefully. Using the scale below, please circle the
number that best describes the reason why you are currently engaged in this
activity. Answer each item according to the following scale: 1: corresponds not
all; 2: corresponds a very little; 3: corresponds a little; 4: corresponds moderately;
5: corresponds enough; 6: corresponds a lot; 7: corresponds exactly.

82
Appendix B Material for Consent and Assent
Letter to Parents
Greetings Parents or Guardians,
My name is Craig Locker and I am a graduate student researcher at Purdue University
working along with Professor Dr. Nathan Mentzer. We are investigating students’ levels
of motivation as they work through different design problems in their Introduction to
Engineering class.
Your child is learning about the engineering design process in class and this study may
help researchers determine if teaching the user centered process effects motivation.
Your child would normally be completing the design projects in their class and with this
study the students will be focusing on different users instead of designing products for
themselves. The students will be taking a pre and post survey to measure how motivated
they are before the project, based off the course as a whole, and then again once the
project is complete. All student information will be confidential.
Participation is voluntary and you or your child may decide to stop participating at any
time. Consent is a two step process. Your consent may be provided with the included
“Parental Consent Form”. As well your child has received a “Student Assent Form”
(included in packet) for them to sign. Please keep a copy of the parental consent form for
your records. (The white copy)
The teacher has set up a drop-off box; please put the signed consent and assent forms
there for the researchers to pick up.
Feel free to contact either of us with questions at anytime:
Craig Locker
(765) 490-7546
Dr. Nathan Mentzer
(765) 494-0298
(765) 496-2700 (fax)

83

84

85

86
Appendix C Teacher Instruction and Materials
Teacher Protocol for Introductions
Before anything is started
Thursday (April 24th, 2014) – If possible
Pass out Pre-Survey and demographics sheet (Light blue)
o Inform students that this is to help identify what type of activities we do in this class.
Remind them to take their time and answer all questions as honest as they can and to
the best of their abilities.
TEACHER NOTE - The first survey is asking the students to rate how motivated
they were for the already completed design activities done within the IED class –
expected time – 5 minutes.
Pass out all forms to the students
o Rationale for packet
Read the following to the student
“These packets contain information that allows us and researchers at Purdue to
take a look at the work we are doing in this class, it is extremely important that
you and your parents fill out these papers and return them within the next week.
“
Try to get the students excited about having the work they do potentially impact
tens of thousands of students
o Each student will be passed out a packet. The parent letter explains all information to
the parent and student.
The packet consist of a
Parent Letter (Yellow and is for them to keep)
Assent form for the student to fill out (Yellow and needs returned)
Consent form for the parent to fill out (Yellow and needs returned) –
These two are stabled together
Copy of consent form for the parent to keep (white)
o Make sure to continually remind the students to turn in the packets. The students
should not directly return to packets to you but to a drop box, with a location of your
choosing.
87
The introduction to the lesson
Friday (April 25th, 2014)
Before you introduce the final project, present the User Centered Design PowerPoint. Notes
and protocol are included with it. The notes do not need to be read as a script, but more of
general talking points
o After the introduction to UCD, perform your normal introduction to final design
projects. When ready design briefs have been printed for the control and the
treatment group.
The control will not change at all; conduct the project as you normally
would
The treatment group has a more rigorous design brief with more
deliverables, if students struggle understanding all elements, do your best
to explain what is expected, if they continue to get hung up on specific
elements, allow them to skip that specific step.
These students are doing the same Locker Organizer design project
with the only tweak being that they have to identify a user and then
complete the four phases of the UCD process, which are outlined on
the Design Brief, most of these activities are the same as in the
original, but stated and more direct.
The point of the treatment project is primarily that they identify a user, other them
themselves and they use them as a source of input, feedback, and evaluation, if
those elements are met then the students successfully went through the UCD
process.
The completion of to the lesson
Approx. Friday (May 23rd, 2014)

88
Pass out Post-Survey sheet (green)
o Inform students that this is to help identify if this activity was exciting or not to them.
Remind them to take their time and answer all questions as honest as they can and to
the best of their abilities.
TEACHER NOTE - The second survey is asking the students to rate how
motivated they are for this specific project – expected time – 5 minutes.

89
Teacher Protocol for Presentation
Slide #1
o Straightforward, slide has an agenda and then goals of students. As always try and excite the
students about this new concept
Slide #2
o Why design is important, this shouldn’t be a hard sell to students in an introduction to
engineering design class, but stress how important what they are doing is. Design is a very
challenging process.
Feel free to elaborate here, but they idea is to set up how important design is and then
introduce this process that helps aid in designing, specifically for the user
Slide #3
o This slide gives an overview of what UCD is in very simple terms. The biggest concept is that they
select real users and involve them through the whole process. This is an extremely important
element. The students will not be dealing with hypothetical problems
Slide #4
o 4 Basic principles of UCD, once again just trying to prime the pump for what we want them to
remember, the bottom example of things can always be improved can be changed for what
might suite your class better
Slide #5
o This is the process that the students should hopefully come to know.
This process is similar to the Engineering Design Process that is taught in PLTW, but
gives more structure to the beginning phase of really identifying the stakeholder.
If students question why they are learning both, a potential answer would be
to tell them both are used in industry and several use a mix of both processes.
o The process is color coded with the next few slides. The first three circles are all in the same
phase, but are separated as that once you identify your stakeholder you rarely change that
aspect.
Slide #6-9
o Gives common task in the middle and then breaks down what is expected of them before they
move onto the next task. These are the same items on the design brief.
Slide #10-12
o This slide is to have them begin to think about what type of mindset they should be in. This
worked well for Jr./Sr. but may not be appropriate for freshmen, let me know if this needs
changed.
o The idea is that designers require certain elements to be successful and you need to have the
right mindset to design.
The biggies are the empathy for the user
Communicate through sketches
Be clear in what you are trying to do
Importance of prototyping
Slide #13
o Wrapping up the short introduction

90
Try to rally them around the idea of real problems need real solutions and transition
into the locker organizer problem and how students have real issues with them and we
want you to fix them and potentially have your ideas implemented!

91
Appendix D UCD Power Point

92

93

94
Appendix E Treatment Problem Statement
Project 9.3a(vi) Virtual Design Briefs (Locker Organizer) Client: School Administration Target Consumer: __________________________ Designer: __________________________ Problem Statement: Each student has a different experience with their locker, for
example consider how a locker would be organized for students in specific extracurricular activities (athletics, band, and or drama). How a locker would be organized for a left-handed student versus a right-handed student. Consider the interactions and organization for students with disabilities? Each one of these stakeholders will have different needs and it is up to your design team to figure those needs and meet them. Take into account that the school does have a minimal budget.
Design Statement: Design a high school locker organization system for a
specific user of your choosing. Use the User Centered Design process to walk through the analysis, design, implementation, and deployment phases. Remember once you have selected your stakeholder they should be included in all four phases of the process. Your group should document all steps of the UCD process in your engineer’s notebook and develop prototypes to conduct evaluations.
Steps to complete: Analysis Phase
Develop list of potential locker organization problems o Each member should individually come up with 3
different problems with locker organization o Group should decide on one problem and identify main
stakeholders of that problem
Meet with key stakeholders and develop user needs, constraints, and criteria
o Document all information gathered from meeting Constraints are items that cannot be changed
95
Ex. The location of the lockers cannot change
Criteria are items that are more of guidelines
Ex. The solution cannot cost a lot of money
Develop usability goals and objectives of team o Goals of the team are different than the needs of the
stakeholders. Consider what the group is attempting to solve and the goals that the group have for themselves
Conduct field studies (Observations and Interviews) o A team should have both observations and
interviews. Observations could consist of watching the
current interaction the stakeholder has with a locker or simply documenting all of the items stored within a number of lockers
Interviews should consist of several planned questions that will benefit the group as the attempt to solve the problem
Design Phase
Begin to brainstorm design concepts o The group should be able to develop a minimum of 10
different concepts
Create low-tech prototypes (Cardboard locker concept) o Select the three best designs and develop different
cardboard concepts Photograph and insert in engineer’s
notebook
Conduct usability testing on low-tech prototype o Have a minimum of two stakeholders interact with
prototype
Gather feedback to revise design o Take feedback and make improvements on the
best design. o How does this design meet the constraints and
criteria established above (document alignment)
Create highly detailed design on Inventor o Should be completely dimensioned and developed
to the point someone can build from your designs. Implementation Phase
Show fully finished design concept to stakeholders. o Document all comments
Continue usability testing (evaluations) o Take feedback and make adjustments to final
design
Implementation could be an iterative process (repeats over and over)
Deployment Phase

96
Develop survey to give to students o Survey should address to see if the final design
solves the issue of the stakeholder Survey a minimum of five students
At this point all students can be surveyed
Check goals and objectives laid out by the team o Evaluate teams success through written
reflection o Reevaluate how close your team met the
constraints and criteria established at the beginning of the project.