the impact of trade liberalization on productivity within
TRANSCRIPT

The Impact of Trade Liberalization on Productivity Within and
Across Industries: Theory and Evidence
Josh Ederington
University of Kentucky
Phillip McCalman
University of California-Santa Cruz∗
July 2007
Abstract
Numerous studies have investigated the link between trade policy and firm productivity. De-
spite justifying firm level analysis on the basis of considerable heterogeneity between firms within
narrowly defined industries, these studies typically constrain all firms to have the same expected
response to changes in trade policy. In this paper we develop a theoretical model that accounts
for the existence of firm level heterogeneity within industries and predicts that the equilibrium
response to changes in trade policy will also be heterogeneous in terms of both sign and size. The
variation in firm level reaction is shown to be determined by both firm and industry characteris-
tics and therefore the equilibrium response to trade policy is predicted to vary not only within
industries but also across industries. These results allow us to use both sources of variation in
the data. We examine these predictions on a firm level data set for the Colombian manufacturing
sector in the 1980’s and find strong support for them.
Key Words: tariffs, technology diffusion, productivity.
JEL Classifications: F10, F12, F13, F14.
∗Ederington: 335 Gatton Building, Department of Economics, University of Kentucky, Lexington, KY 40506 (email:
[email protected]); McCalman: Department of Economics, University of California, 1156 High Street, Santa Cruz,
CA 95064 (email: [email protected]).
1

1 Introduction
A common question in discussions of trade reform is what impact, if any, trade policy has on firm and
industry productivity. Throughout the 1960’s and 1970’s, many developing countries erected trade
barriers in the hope of expanding the industrial sectors of their economy. The standard rationale
behind such policy was that firms would feel better able to invest in new infrastructure and advanced
production techniques if guaranteed protection from foreign competition. Thus, trade barriers were
seen as a necessary component in developing infant industries. This policy of economic development
through protectionism has largely been supplanted by an emerging conventional wisdom that greater
openness to foreign competition induces productivity gains. The idea behind the new strategy is that
domestic firms will be forced to adopt new technologies and cut costs in order to compete with foreign
firms. Thus, the reduction of domestic trade barriers is now seen as necessary in providing impetus
for domestic firms to modernize. In this paper, we analyze, both theoretically and empirically, the
link between trade policy and firm productivity.
Not surprisingly, there is a voluminous empirical literature on the question of whether the liberal-
ization of domestic trade barriers improves firm productivity performance.1 However, this empirical
evidence is relatively mixed. Some studies suggest that the typical firm improves its productivity
performance in response to lower tariffs (see for example Krishna and Mitra (1998), Pavcnik (2002),
Muendler (2004), Amiti and Konings (2005) and Fernandes (2006)). Other studies find the opposite,
that a firms productivity performance is improved by tariff protection (Konings and Vandenbussche
(2004)). Finally, some studies find that a reduction in domestic tariffs has no significant impact on
firm level productivity (Trefler (2004)).2 In a sense, the contradictory results of previous empirical
literature are not that surprising as the mechanism through which trade actually impacts firm pro-
ductivity is not formalized, and thus, there is no a priori reason to expect any particular relation.3
One obvious means by which trade impacts firm productivity is by affecting the decisions of firms to
invest in new production techniques and adopt new technologies. However, even in the theoretical
technology adoption literature, the impact of trade on firm productivity is ambiguous. This is nicely
demonstrated in Rodrik (1992) which shows that standard arguments for how trade barriers might
impact firm productivity are misleading or incomplete.4
In this paper we develop a model of endogenous technology adoption by profit maximizing firms1Imports are not the only mechanism through which global competition impacts productivity. See Javorcik (2004)
for an analysis of FDI and productivity.2Also see Baggs, Head, and Ries (2002), Bustos (2006) and Conway (2006) for other studies of plant-level data
and the impact of trade liberalization. Syverson (2004) also finds results that are contrary to the existing theoretical
models.3Indeed the relatively atheoretic approach in the empirical literature stems from the lack of any clear predictions
from the theoretical literature. Tybout (2002) provides a succinct summary of the empirical view of the theoretical
literature. As we note below the previous theoretical literature has concentrated almost exclusively on representative
firm models, leaving no scope for any within industry heterogeneity in response to trade barriers.4Also see Miyagiwa and Ohno (1995) in which the impact of trade protection on technology adoption depends
crucially on the precise characteristics of the trade barriers.
2

within a small, open economy. Our framework includes two key features missing from previous
models. First, our model allows for differences between firms within industries, and in contrast to
other models these differences are not imposed exogenously but derived endogenously. In particular,
differences between ex ante identical firms are derived as the equilibrium outcome of a technology
adoption process, where diffusion arises in equilibrium (i.e. firms adopt at different dates).5 Sec-
ond, unlike previous models of technology adoption we allow the number of firms to be determined
endogenously.6 Together these elements generate a framework where firms make profit maximizing
decisions regarding their technology, yet ex ante identical firms end up behaving differently in equi-
librium. In this framework we ask what are the implications of a change in trade policy. The main
conclusion is that the equilibrium response to a change in trade policy is heterogeneous: both across
firms and across industries.
However, the richness of the equilibrium response should not be interpreted to mean that almost
anything can happen. Instead the model provides insight into the conditions where trade barriers
are likely to raise productivity growth and when the opposite is likely to occur. More specifically,
we find that, holding the number of domestic firms constant, a tariff has a positive impact on firm
productivity (this result is due primarily to the scale effect where a tariff results in larger sales
for domestic firms). However, the increased domestic profits created by a tariff induces entry by
domestic firms, which reduces the incentive for each individual firm to adopt the productivity-
improving innovation. Thus, the positive direct effect of trade protection is countered by a negative
indirect effect. The dynamic tension between the direct and indirect effects has two important
implications.
First, we show that this indirect effect is weaker at the beginning of the diffusion process and
stronger at the end of the diffusion process, resulting in trade barriers having a positive impact on
productivity for those firms who adopt new technologies most readily, and a negative impact on
productivity for the late-adopting firms. Moreover, the implication of this result is that the impact
of trade policy differs across firms in the same industry. These differences are not just qualitative;
some firms grow faster while others grow slower (i.e. the derivatives have different signs).
Second, given this heterogeneity in response to a tariff, it is natural to ask what happens to
the majority of firms within an industry. We show that the indirect effect is stronger in industries
with certain characteristics: low entry costs, high trade barriers, large domestic markets and a small
technology gap between firms. The implication of this result is that the impact of a given trade
policy on firm productivity is heterogeneous across industries, with the behavior of a typical firm
(say the median firm) within an industry conditional on the characteristics of that industry (i.e.
the impact of a change in tariffs interacts with industry characteristics). The consequences of this
finding for the previous literature are two fold. First, the model predicts that the impact on the
mean firm within an industry is ambiguous. Therefore it is not surprising that previous studies found
mixed results as they all focused on the average impact of reductions in trade barriers. Second, by5See Yeaple (2005) for a static model of trade and technology choice.6Both Rodrik (1992) and Miyagiwa and Ohno (1995) are primarily concerned with a single import competing firm.
3

not controlling for the interactions between industry characteristics and tariff changes, the previous
studies have not allowed for the diversity of response that is possible across industries, generating a
potentially important source of bias.
To pursue these issues we look for evidence of such variation in productivity when trade barriers
change by investigating the experience of Colombian manufacturing firms in the 1980’s.7 This was
a period of widespread trade liberalization in Colombia, with the average tariff falling from a peak
of 45 percent in 1984 to 21 percent in 1991. Moreover, the initial tariff rates and the subsequent
changes in tariffs varied widely across industries, providing a rich setting for the investigation of
the impact of trade policy on firm level productivity. Using firm level productivity measures and
a number of industry level characteristics that the theory predicts should be important for how
trade policy impacts an industry, we look for firm/industry heterogeneity in the tariff response, by
including interaction terms in standard productivity growth regressions.
We find evidence of firm/industry heterogeneity that is consistent with our theoretical predic-
tions. In particular, comparing the behavior of the median firm across industries, it is found that
the direct effect of higher tariffs is to increase productivity growth of the median firm. However, the
total effect includes the indirect effects of tariff changes that interact with industry characteristics.
Consistent with the theoretical model, industries that have lower barriers to entry, a smaller tech-
nology gap, larger domestic markets and higher initial tariffs tend to experience lower productivity
growth when tariffs increase. Not only are these interaction terms statistically significant, but they
also represent economically meaningful magnitudes. Furthermore, these findings are robust across
a number of specifications.
We also find evidence that tariff changes have a differential impact on productivity growth rates
of firms within industries. Specifically, firms that would be predicted to have high productivity
growth over the period investigated (the early adopters), had this growth further enhanced by an
increase in tariffs. In contrast, firms that would be predicted to have low productivity growth
(the late adopters), tended to have their performance further undermined by a tariff. It is worth
reiterating that these results relate to firms in the same narrowly defined industry and are consistent
with the theoretical model that relates the diffusion of technology to changes in trade policy. These
results, together with the theoretical model, suggest that the mixed empirical findings of the previous
literature arise from misspecified models, and that the relationship between productivity and trade
policy is more nuanced than previously considered, both within and across industries.
Section 2 of the paper provides a model of firm decisions to adopt productivity-enhancing tech-
nologies under monopolistic competition. In Section 3 we use this model to generate predictions
on how tariff changes impact firm technology decisions and hence productivity growth. Finally, in
Sections 4 and 5, we use the Colombian trade liberalization to investigate potential heterogeneity in
the marginal impact of tariff changes on productivity growth.7For studies on Colombia over a similar time period see Goldberg and Pavcnik (2005), Brooks (2006) and Fernandes
(2006).
4

2 Model
To consider how trade barriers impact firm productivity, we must first develop a model of what
determines a firms decision to invest in a productivity-enhancing technology. In this section we
present such a model of endogenous technology adoption. The adoption decision of firms follows
the standard setup as presented in Reinganum (1981), with the exception that this framework is
integrated into a model of monopolistic competition with endogenous entry. By considering adoption
in a setting of monopolistic competition we are following Gotz (1999) and Ederington and McCalman
(2006). However, both of these papers use CES preferences while we employ a quadratic utility
function since it features a demand system with variable elasticities of demand.8
2.1 Preferences and Consumption Decisions
We assume that the economy has two sectors: one sector consists of a numeraire good, x0, while the
other sector is characterized by differentiated products. The following utility function defines the
preferences of a representative consumer:
U = x0(t) + C(t) (1)
where x0(t) is consumption of the numeraire good in time t and C(t) represents an index of con-
sumption of the differentiated goods. We assume a quadratic specification for this consumption
index which reflects a taste for variety
C(t) = α
∫ n(t)
0y(i, t)di− 1
2
∫ n(t)
0(y(i, t))2di− 1
2(∫ n(t)
0y(i, t)di)2
where y(i, t) represents consumption of brand i at time t and n(t) represents the number of varieties
available at time t. Since the instantaneous utility is quasi-linear demand for good i at time t is:
y(i, t) = A(t)− p(i, t) (2)
where p(i, t) is the price of good i in time t and A(t) = α+n(t)p(t)(1+n(t)) is the choke price and p(t) is the
average price in the industry. If we treat these as individual demands, market demand follows from
multiplying individual demands by population. For simplicity we normalize population size to unity.
2.2 Technology
In order to facilitate the analysis the production side of the economy is kept as simple as possible.
We assume that all goods are produced using constant returns to scale technologies and a single
factor of production, labor. Thus, production of any good (or brand) requires a certain amount
of labor per unit of output. As is standard, we assume that production of the numeraire good is
defined by l = x0 which ensures that the equilibrium wage is equal to unity.8For models that emphasizes trade and technology in a strategic setting see Bagwell and Staiger (1992), Miyagiwa
and Ohno (1995) and Crowley (2006).
5

In order to produce in the differentiated goods sector we assume that firms must pay a sunk entry
fee of F . Once this fee has been paid, a variety of the differentiated good can be produced using
either of two types of technology. A low-productivity technology is always available to any firm upon
entering the industry. The constant marginal cost of production for a low-tech firm is denoted by c.
A high-productivity technology is also available at time t = 0, but requires an additional fee of k(t)
where k(0) = ∞, k(∞) = k, k′ < 0 and k′′ > 0.9 With this adoption cost function, earlier adoption
is more expensive; however, the decreasing cost of technology adoption implies that eventually all
firms that remain in the industry will adopt the high-tech process. The marginal cost of production
using the high-productivity technology is assumed to be zero. Therefore, c is an index of the size of
the technological innovation.
The general aim of the model is to analyze the impact of trade barriers on the industrial evolution
of an industry within a small, open country which faces a technology gap in competing with more
productive foreign firms. To further simplify the model, assume that the number of foreign firms
is fixed and that they are all high-tech. In contrast, domestic firms are, initially, all low-tech (i.e.,
they face a technology gap relative to their foreign rivals that they can close by adopting the hi-tech
methods). For simplicity it is assumed that domestic firms don’t export. In this model, domestic
firms have four choices to make: when to enter, what price to charge, when to adopt the new
technology, and whether (and when) to exit. Since the pricing decision is central to all of the other
decisions through its impact on profits, this is where we begin our characterization of firm behavior.
2.3 Prices and Profits
The model admits heterogeneity in terms of the technology of domestic firms. The goal is to derive
these technological positions endogenously. However, to start with we assume that some fraction, q,
of the domestic firms are hi-tech. Given the linear demands and constant marginal cost, the optimal
prices of domestic and foreign firms (taking p as given) are:
pi =α + np
2(1 + n)+
ci
2
p∗ =α + np
2(1 + n)+
b
2
where b represents the specific tariff applied by the domestic government and (*) indicates the price
of a foreign variety. The average price is:
p = pH +θ(1− q)c
2+
(1− θ)b2
⇒ A =α + np
n + 1=
2α + cnh(1− q) + bnf
2 + n(3)
9These are standard assumptions in the technology diffusion literature, see for example Reinganum (1981) and
Fudenberg and Tirole (1985). The only difference is that we assume k(t) is bounded from below to rule out the
possibility of entry occurring after all the initial entrants have adopted. Note that in these papers the possibility of
entry is not considered.
6

where θ represents the fraction of firms that are domestic and n = nh + nf ; nh and nf are the
number of domestic and foreign firms, respectively.
Using the optimal prices, we can derive the value functions for per period variable profits:
πi =(α+np
1+n − ci)2
4=
(A− ci)2
4
Since cL = c and cH = 0, hi-tech firms make larger per-period profits. Thus, the basic payoff to
adopting a productivity-enhancing technology is that it results in lower marginal costs of production,
and thus higher per-period profits in equilibrium. However, since A is declining in q, the pay-off to
adoption is also declining in q.
2.4 Technological Progress
The next decision we consider is that of technology adoption. For the moment we take the number
of firms as given (and constant), and we return to this issue below. The equilibrium distribution of
technology at any point in time, q(t), is determined by the firms’ selection of their optimal adoption
dates. Taking this distribution as given, a firm chooses the adoption date, T , to maximize the
discounted value of total profits:10
Π =∫ T
0e−rtπL(q(t))dt +
∫ ∞
Te−rtπH(q(t))dt−K(T )− F
where K(T ) = e−rT k(T ). These profits depend on both the firm’s own adoption date, T , and the
adoption decisions of rival firms (which is summarized by the distribution function q(t)). Differen-
tiating with respect to T yields the first-order condition:
πH − πL = −K ′erT (4)
The above first-order condition demonstrates the trade-off faced by firms in the choice of when
to adopt. The left-hand side is the lost profits from waiting one more period to adopt the high-
productivity technology while the right-hand side is the gain from the decrease in adoption costs from
delaying adoption another period. Substituting the profit differential into this first-order condition
gives:
(2A− c)c4
= −K ′erT
A =−2K ′erT
c+
c
2(5)
Not surprisingly this tells us that the choke price is decreasing over time. This also tells us that
when the first order conditions hold, profits (either πL or πH) are independent of n, b and α.
Returning to the evaluation of the first order condition, note in particular that it holds for all
firms that have yet to adopt. However, if all such firms adopted at once this first order condition10The program is for a firm that enters at t = 0 and never exits. Later we will show that this is optimal in equilibrium
under our assumptions.
7
would not hold, with most firms instead preferring to adopt at other dates in the future (since
adoption en masse would drive the LHS below the RHS). This implies that the first order condition
doesn’t just hold at one point in time but over an interval, with a firm indifferent over which date
in this interval it adopts (i.e. an early adoption date confers a greater increase in profits but is
associated with a higher opportunity cost, while a later date involves a lower profit differential but
also a lower opportunity cost of waiting.) By combining (3) and (5), the distribution function that
describes the optimal adoption dates is derived as:
q∗(t) =
0 for t ∈ [0, TL)12 + (2α−c)
cnh+ (2b−c)nf
2cnh+ 2(2+n)K′ert
c2nhfor t ∈ [TL, TH ]
1 for t ∈ (TH ,∞)
The above distribution function describes the process of technological progress for domestic firms.
Given initially high adoption costs, all domestic firms are low-tech until TL. At TL the first domestic
firm adopts the high-productivity technology and, as adoption costs fall, more domestic firms adopt
the new technology, leading to a gradual diffusion of the new technology through the industry for
periods TL ≤ t ≤ TH (where the fraction of firms that have adopted at any point in time is given by
q∗(t)). Finally, all firms will have adopted the new technology by period TH .
To close the model we assume entry occurs until the present value of profits are zero. These
profits can be split into three periods, π0, when all local firms are low-tech, ΠA, profits during the
adoption process and π1, profits when everyone is hi-tech. We use δ0 and δ1 to denote the discount
factors associated with the initial and subsequent steady states. This zero profit condition implicitly
defines the number of firms (varieties):11, 12
11The zero profit condition is written for the last firm to adopt. To see that it is immaterial which adoption date
we choose for the zero profit condition, consider the value function for the first and last adopters:
δ0π0 +
∫ TH
TL
πH(q)e−rtdt + δ1π1 −K(TL) = F
δ0π0 +
∫ TH
TL
πL(q)e−rtdt + δ1π1 −K(TH) = F
The difference between these two equations is:∫ TH
TL
(πH(q)− πL(q))e−rtdt = K(TH)−K(TL)
which must hold in equilibrium due to (4).12Note that this zero profit condition also implies that there will be no exit. To see this note that the following
conditions hold in equilibrium:
δ0π0 + ΠA + δ1π1 −K(TH) = F
δ0π0 + ΠA + δ1πL1 < F
where πL1 are the variable profits from operating in an environment where all other firms are high-tech. If πL
1 =0, then
firms potentially have an incentive to exit. However, if πL1 =0, then the above equilibrium conditions imply:
δ1π1 > K(TH)
8
Π = δ0π0 +∫ TH
TL
πL(q)e−rtdt + δ1π1 −K(TH)− F
⇒ δ0(A0 − c)2
4+
∫ TH
TL
(A(q(t))− c)2
4e−rtdt +
δ1A21
4−K(TH)− F = 0
where A0 = 2(α−c)+nf (b−c)n+2 , A1 = 2α+nf b
n+2 and A(q(t)) is defined by (5).
A straightforward application of the envelope theorem verifies that equilibrium profits are de-
clining in nh. This ensures a unique equilibrium. Given that entry occurs until the present value
of profits is equal to zero, this zero-profit condition along with q(t)∗ (defined by 6) characterizes an
equilibrium in a small open economy.
3 Technology Gaps and Trade Policy
Having setup a benchmark model of productivity-enhancing technology adoption, we can now move
on to the question of the relationship between trade policy and productivity. In this section, we
analyze a central concern in the policy literature: how the presence of trade barriers impacts the
productivity of firms within a small, open economy which faces a technology gap in competing with
more productive foreign firms.
To build intuition start by considering the equilibrium rate of diffusion given by (6). Taking the
number of domestic (nh) and foreign (nf ) firms as given, it follows immediately that lower trade
barriers decrease the speed of adoption (and thus reduce firm productivity). This negative impact
(which we refer to as the direct effect) is due primarily to the scale effect as lower protection decreases
the market share of domestic firms, and thus decreases their incentive to invest in productivity-
enhancing technology. However, this analysis is incomplete as it fails to account for the fact that
a reduction in trade barriers also tends to decrease profits for domestic firms, thus deterring the
entry of domestic firms into the market. This reduction in the number of domestic firms results in
faster adoption (what we refer to as the indirect effect) and an increase in firm productivity. Thus, a
trade liberalization episode is not equivalent to a simple increase in competition. Rather, it reflects a
substitution away from domestic competition and toward foreign competition (i.e., a tension between
direct and indirect effects). In the following sections we consider the combined direct and indirect
effects of a change in tariffs on the adoption decisions of domestic firms.
As mentioned, our interest is in the effects of a trade liberalization episode on subsequent tech-
nology adoption by domestic firms. Thus, consider the case where trade liberalization occurs at
⇒ F >
∫ TH
0
πL(q)e−rtdt
Consequently, no firm enters at t = 0 with the intention to exit, since they wouldn’t be able to cover their entry cost.
For a proof that all entry must occur at t = 0, see Ederington and McCalman (2006).
9

some period TA ∈ [0, TL), so that the discounted value of total profits for a firm are:
Π =∫ T A
0e−rtπL(q(t), b)dt +
∫ T
T Ae−rtπL(q(t), b, )dt
∫ ∞
Te−rtπH(q(t), b)dt−K(T )− F
Of interest is the comparative statics of a change in b (holding initial tariffs, b, constant). As
discussed in Ederington and McCalman (2006), the timing of the trade liberalization episode, TA,
will affect the strength of the indirect effect; intuitively, the later the trade agreement occurs, the
less impact trade liberalization will have on the discounted value of total profits and thus the smaller
the affect on n.13 However, the heterogeneous response to tariffs in our model is due to the tension
between the positive direct and negative indirect effects of a tariff increase. Since this tension is
independent of the timing of the trade liberalization episode, for expositional clarity the proofs and
derivations in the following sections consider the case where TA = 0.
3.1 Firm-level Heterogeneity in Tariff Response
To gain insight into the relative intensity of the direct and indirect effects, assume that both domestic
and foreign firms are in the market, and consider a small tariff change, db, that has firms from both
countries continuing to operate after the change. To work out the impact of an increase in trade
barriers, we totally differentiate the zero profit condition.
dΠ = δ0dπ0 + dΠA + δ1dπ1 = 0
The first order conditions for adoption ensure that dΠA = 0, with the implication δ0dπ0 = −δ1dπ1.
This implies that the impact of a tariff on per-period profits at various times is given by:
dπ0
db=
(A0 − c)2(2 + n)
(nf −
dnh
db(A0 − c)
)=
δ1A1(A0 − c)nf
2(2 + n)
(A1 − (A0 − c)
δ0(A0 − c)2 + δ1A21
)> 0
dπ1
db=
A1
2(2 + n)
(nf −
dnh
dbA1
)=
δ0A1(A0 − c)nf
2(2 + n)
((A0 − c)−A1
δ0(A0 − c)2 + δ1A21
)< 0
The increase in per-period profits in the initial periods implies that TL decreases while the
decrease in final per-period profits implies that TH increases. Thus, the process of adoption starts
earlier but takes longer in response to a tariff increase. The intuition for this result relates to the
change in the intensity of competition implied by technology adoption and how this interacts with
a larger number of domestic firms. While a tariff induces more firms to enter the market, this entry
isn’t sufficient to offset the increase in demand for domestic products generated by a tariff when13It should be noted that, given our assumption that firms are rational and forward-looking, adjustments in the
number of firms will occur at time zero, even when the trade liberalization episode occurs later.
10

all domestic firms are low tech. As these low tech firms experience an increase in demand from a
tariff, they are induced to start adopting earlier. However, as the now more numerous domestic
firms start adopting the superior technology, the intensity of competition increases to such an extent
that the last firm to adopt has their marginal benefit from adoption lowered by the tariff. Since a
tariff induces more entry, eventually this generates more high-tech domestic firms, with the impact
of the greater number of high-tech domestic firms most apparent at the end of the adoption process.
In short, while the positive direct effect is constant through time (since b and nf are constant), the
negative indirect effect increases through time as q increases. Consequently, our framework predicts
that tariffs will have a heterogeneous impact on firms within an industry:
PROPOSITION 1 A tariff will speed up the adoption date of early adopters and delay the adoption
date of late adopters.
That is, within industries, the model predicts that the impact of a tariff change will not be
uniform across firms. Instead firms that have the apparent advantage of relatively high productivity
growth see this advantage further enhanced by a tariff, while those that appear to lag the technology
frontier the most will find their relative productivity growth further disadvantaged by a tariff.14
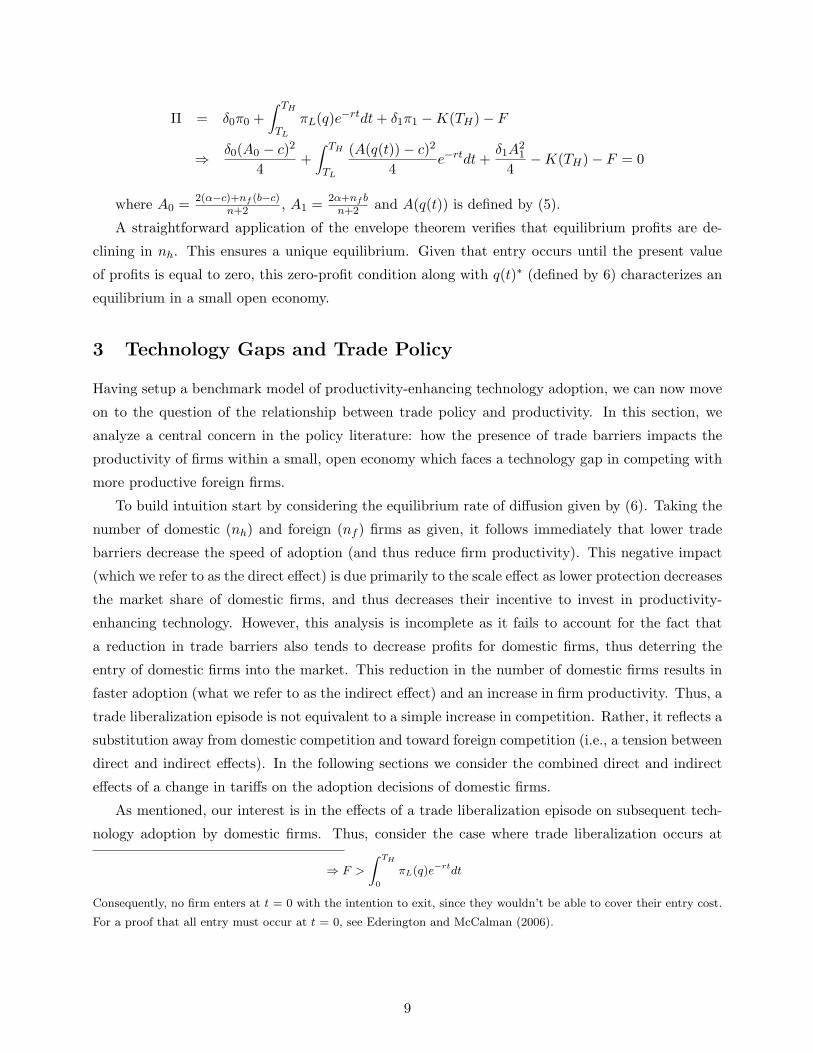
This result is illustrated in Figure 1. The bold line represents the distribution of adoption dates
prior to the imposition of a tariff on the industry (i.e., no one adopts, q = 0 until TL when adoption
begins and q increases until TH when everyone has adopted and q = 1). As can be seen in Figure 1,
the imposition of a tariff has the effect of speeding up the date of initial adoption (TL) and delaying
the date of final adoption (TH), and thus extending the overall time of diffusion. However, as can
be seen from Figure 1, the heterogeneity in tariff response across firms within an industry suggests
that the average response to a tariff (i.e., whether a tariff increases or decreases productivity growth
of the typical firm) is not clear cut. That is, whether a tariff speeds-up or delays adoption by the
average firm (i.e., the firm adopting at the average adoption date) depends upon the point around
which the distribution function rotates, which may not be the same for all industries. Thus, in the
following section, we investigate how the impact of a tariff change on productivity growth of the
median firm is likely to vary across industries.
3.2 Industry-level Heterogeneity in Tariff Response
If some firms are induced to adopt earlier by a tariff, while others adopt later a natural question is
what happens to the typical or average firm? Does a tariff tend to raise or lower their productivity
performance? As discussed in the introduction, empirical evidence on this question is mixed. Given
that the same estimation techniques are employed in the empirical literature (and indeed one author14Note that this result is relatively robust and holds for all non-prohibitive tariffs and it also holds when the number
of foreign firms is assumed to be reduced by a change in the tariff (dnf < 0).
11

t
q
1
TL TH
0
Figure 1: Impact of a tariff increase within an industry
appears on both sides of the evidence), what is it that distinguishes the situations where tariffs raise
the productivity of the average firm, from those where it lowers productivity? To provide insight
into this question, we characterize the behavior of the firm with the median adoption date.
The firm with the median adoption date, Tm is implicitly defined by:
12
=12
+(2α− c))
cnh+
(2b− c)nf
2cnh+
2(2 + n)K ′erTm
c2nh(6)
⇒ −K ′erTm =(2(2α− c) + (2b− c)nf )c
4(2 + n)
=(A1 + A0 − c)c
4
Since the LHS is declining in Tm, the median adoption date is negatively related to the value of the
RHS. The behavior of the RHS with respect to a tariff change is given by:
c
4(2 + n)
(2nf −
dnh
db(A1 + A0 − c)
)(7)
Calculation of dnhdb reveals.
dnh
db=
(δ0(A0 − c) + δ1A1
δ0(A0 − c)2 + δ1A21
)nf
12

Substitution gives:
⇒ cnf
4(2 + n)
(1− (δ0 + δ1)(A0 − c)A1
δ0(A0 − c)2 + δ1A21
)This is negative (median adoption date increases) if:
δ0(A0 − c)2 + δ1A21 < (δ0 + δ1)(A0 − c)A1
⇒ (A0 − c−A1)(δ0(A0 − c)− δ1A1) < 0
Since (A0 − c−A1) is negative, the median adoption date will increase if the following condition is
met:
⇒ Ao − c
A1>
δ1
δ0(8)
⇒ 1− (2 + nf )c(2α + bnf )
>e−rTH
(1− e−rTL)
To evaluate this condition assume that it holds with equality, and then ask if a parameter change
makes this condition more or less likely to hold. Note that the factors that influence whether or
not this condition holds can be broken up into two broad groups. This division is based on the
observation that all of the elements of the LHS are exogenous parameters (b, c, α) while the RHS is
a function of two endogenous variables (TL and TH). Inspection of the list of exogenous parameters
that influence the LHS reveals that one is missing, the size of entry costs (F ). The characterization
of the relationship between this factor and the productivity of the median firm is relatively straight
forward. Simple calculations show that decreases in F tend to increase both TL and TH , which
reduces the RHS. Consequently, industries that are relatively easy to enter are more likely to suffer
a decline in the productivity of the median firm in response to a tariff. A similarly direct result
holds for c. A smaller technology gap, clearly raises the LHS. It also decreases the RHS, since more
firms are induced to enter, delaying both the start and the end of the adoption process. So an
increase in the tariff is more likely to lower the productivity of the median firm if the technology
gap is relatively small.
Characterization of the impact of the other parameters (b, α) is slightly more involved. Note
that the above condition holds if:
(Ao − c)2
A21
≥ δ1
δ0(9)
Re-arranging implies:
δ0π0 ≥ δ1π1 (10)
From the Envelope Theorem we know:
δ0dπ0
db> 0 δ1
dπ1
db< 0
δ0dπ0
dα> 0 δ1
dπ1
dα< 0
13

Therefore, already high tariffs are likely to decrease the productivity of the median firm if they
are increased any further. Similarly industries with a relatively large market (α), will also tend
to experience slower productivity growth for the median firm in response to a tariff. Thus, the
predictions of this section can be summarized as follows:
PROPOSITION 2 A tariff increase is more likely to delay productivity-enhancing technology
adoption by the median firm in industry i if:
1. barriers to entry are relatively low (lower F ),
2. the productivity improvement from technology adoption is small (lower c),
3. tariffs are already relatively high (higher b),
4. the domestic market is relatively large (higher α).
t
q
1
TL TH
0
1/2
weak indirect effect
strong indirect effect
Figure 2: What happens to productivity for the majority of firms?
Note that the model predicts that the impact of a tariff change on the productivity of the
median firm will not be uniform across industries. The intuition for this result derives from the
conflict between the positive direct effect of trade barriers and the negative indirect effect and is
illustrated in Figure 2. Specifically, in those industries where the indirect effect is relatively strong,
a tariff increase is more likely to delay technology adoption by the median firm. For example, in
14

industries where barriers to entry are relatively low, an increase in protection results in a relatively
large increase in the number of firms. Thus, the indirect effect of a tariff change in such an industry
is relatively strong, and, as can be seen in Figure 2, one is more likely to observe protection having a
negative impact on the adoption decisions (and hence productivity) of the median firm. In contrast,
industries where the indirect effect is relatively weak (high barriers to entry, large productivity gaps,
low tariffs and small domestic markets) will observe a positive correlation between trade protection
and productivity growth of a typical firm.
4 Colombian Trade Policy and Data Description
The model of the previous sections suggests a great deal of heterogeneity in the marginal impact
of a tariff on the incentives of a firm to modernize and adopt new technologies. To investigate
this heterogeneity, we focus on the case of Colombia. Like many developing countries, Colombia
followed a policy of import substitution in the 1950’s and 1960’s. In the late 1970’s this policy
was reconsidered as Colombia sought entry into the GATT. Despite attaining membership in 1981,
Colombian tariffs on manufactured goods were relatively high with the average tariff on manufactured
goods around 50 percent in 1984. However from this relatively high level of protection Colombia
systematically lowered its trade barriers through the 1980’s and 1990’s with an aim of creating a
relatively uniform structure of protection that was comparable to those in developed countries. This
change in trade policy provides variation not just in the level of protection but also the structure
of protection across industries, making Colombia a particularly appealing setting in which to study
the relationship between trade policy and productivity growth.15
Central to our analysis is the measurement of productivity. We follow Trefler (2004) and use
labor productivity.16 For our purposes labor productivity has a number of advantages over other
measures of productivity, most notably TFP. In particular, the theoretical framework developed
above emphasizes changes in technology that enhance labor productivity, making it a natural choice
to focus on. Also if technological differences are an important source of heterogeneity among firms,
the standard approach to measuring TFP, which relies on the estimation of a common industry level
production function, tends to ignore these sources of structural difference.17 Finally, by focusing on15For an overview of the evolution of trade policy in Colombia see Goldberg and Pavcnik (2005) and Fernandes
(2006). While political economy issues can arise in the determination of trade policy (see for example Matschke and
Sherlund (2006)), Fernandes (2006) establishes that trade policy is exogenous at the plant level in Colombia.16While our methodology is common in the literature, it is not without its shortcomings. See Katayama, Lu, and
Tybout (2006) for a recent critique.17Note also that since TFP is unobservable a number of assumptions need to be imposed to identify an unbiased
estimator of it. A common approach in the literature is to follow Levinsohn and Petrin (2003) or Olley and Pakes
(1996) and assume that TFP follows an exogenous Markov process. Clearly this assumption is inconsistent with the
notion that a firm can take an action to change the evolution of its productivity.
15

the median response, which implies the use of quantile regression techniques, we put less emphasis on
the precise measurement of productivity and more on the location of firms within the productivity
distribution, with this ranking likely to be robust to different approaches to measuring productivity
(see Levinsohn and Petrin (2003)). The definition of labor productivity we employ is real value
added relative to the number of production workers.18 As a measure of productivity growth we
follow Trefler (2004) and consider long differences, with 1984 as our base year since in corresponds
to the high point of average protection, and our end year is 1991, the final year of data that is
available to us. Over this period, data is available for all manufacturing firms with at least 10
employees. For measures of trade liberalization, we employ ad-valorem tariff levels and effective
rates of protection that are available at the 4 digit ISIC level. Note that we follow Fernandes (2006)
and lag the tariff data one year relative to the productivity data to mitigate issues associated with
the revenue based measure of productivity.19
The previous empirical approach to analyzing the link between trade policy and productivity is to
regress changes in firm-level productivity on changes in trade barriers, typically controlling for some
industry and/or firm characteristics. The usual hypothesis is that productivity is negatively related
to tariffs, with inference based on an estimate of the average productivity impact of a change in trade
policy across all firms in the sample. That is, a single coefficient is used to identify the marginal
impact of a tariff across both firms and industries. This methodology tends to be motivated by a
belief that competition increases productivity, though no formal models are developed to support
this hypothesis. In contrast, we have shown that a plausible model of technology adoption by
profit-maximizing firms suggests that the marginal impact is unlikely to be either uniform in size
or sign. Thus, in the following sections we augment the previous empirical literature by using our
theoretical framework as a guide to investigate the marginal response of productivity to tariffs along
two dimensions: within-industry variation and across-industry variation. It is worth emphasizing
that we are only looking to see if there is evidence consistent with our predictions and not testing
our model. In doing so we are stressing the need to allow for a relatively rich set of responses to a
policy change rather than implying that ours is the only model that can generate a heterogeneous
response.18We would like to thank Mark Roberts for making the Colombian manufacturing census data available to us. For a
complete description of all the variables used in our estimation, see the data appendix. For a description of this data
set see Roberts (1996).19The 4 digit ISIC tariff data is from Departamento Nacional de Planeacion and the matching trade data is from
Departamento Administrativo Nacional de Estadistica. We would like to thank Jorge Garcia-Gracia at the World
Bank for making this data available.
16

5 Within-Industry Variation
In this section we consider whether the marginal impact of trade liberalization varies across firms
within an industry. Note that Proposition 1 suggests that the impact of trade liberalization will not
be uniform, instead firms that have the apparent advantage of relatively high productivity growth see
this advantage further enhanced by a tariff, while those that appear to lag the technology frontier the
most will find their relative productivity growth further disadvantaged by a tariff. Therefore the first
step must be to determine which firm characteristics are associated with high productivity growth
(early adoption) within an industry.20 Here we follow an empirical strategy based on the previous
literature (see Trefler (2004)), and regress firm characteristics on productivity growth. Therefore,
productivity growth (from 1984 to 1991) for firm j in industry i, ∆prji , is given by:
∆prji = γi + βxXj + εj
where γi are 4 digit fixed effects and Xj are firm characteristics such as size, age, technology rank
and exporter status.
Table 1 reports the determinants of firm level productivity growth. The first column is a relatively
standard firm level productivity growth equation, where the determinants of growth are: size, age,
technology rank and exporter status (along with 4 digit fixed effects). All firm characteristics are
taken from the Colombian manufacturing census. The size of the firm is the log of employment.
The age of the firm is the log of the number of years since start-up. The technology rank is the
difference between labor productivity for the plant and average labor productivity scaled by the
standard deviation in labor productivity within the (4-digit ISIC) industry. Finally, exporter status
is a dummy variable that takes the value of one if the plant is an exporter in 1984. The results
suggest that larger firms, exporting firms and younger firms tend to have the highest productivity
growth rates within industries. The only potentially surprising result is that productivity growth is
negatively correlated with high initial productivity. However, this result is consistent with a story
where firms already on the technology frontier have fewer options for further productivity growth,
generating mean reversion between firms within an industry.
The second column addresses the issue of selection of plants into the sample, since a growth
rate can only be calculated for firms that survive until 1991. This column reports results for the
standard Heckman selection methodology. The first stage probit includes all of the variables from
the first column along with an exclusion restriction. In this case, the share of office equipment in
total capital in 1984 forms a plausible restriction since this variable is unlikely to be directly related
to the growth in productivity (since it is not part of the capital used in production), but is likely
to be associated with a greater likelihood of exit. The greater likelihood of exit follows from the20Within the model, firms are indifferent about their exact location in the productivity distribution. Thus, the
model provides no guidance about which firms will be the early adopters of new technologies, and which firms will be
late adopters. Our approach is to identify these characteristics empirically.
17

notion that firms with a greater share of capital tied up in unproductive assets are less likely to
survive a negative shock. The results from a probit estimation are consistent with this conjecture,
with the coefficient on office equipment negative and significant at the 5 percent level (see column
9, Table A.1). Returning to column 2 of Table 1, it is notable that the coefficient on the control
for the selection probability, λ, is positive and significant. The positive λ implies that the shocks
that influence survival are positively correlated with the shocks that generate productivity growth,
a result that squares with expectations. With the exception of size, all of the remaining coefficients
are relatively unaffected by the selection process. Furthermore, the standard errors are only slightly
higher, with inference still concluding that all variables are statistically significant.
With the firm characteristics that determine productivity growth in hand we now revisit Propo-
sition 1 which suggests potential heterogeneity in tariff response across firms within an industry.
The intuition behind Proposition 1 suggests that if a characteristic contributes to high productivity
growth, then when it is interacted with changes in trade barriers, productivity growth should be
further enhanced (i.e. the interaction term should be have the same sign as the characteristic alone):
∆prji = γi + βxXj + βx∗bX
j∆bi + εj
• If βx > 0 then βx∗b > 0
• If βx < 0 then βx∗b < 0
where ∆prji , is once again productivity growth for firm j in industry i, γi are 4 digit fixed effects
and Xj are firm characteristics: size, age, technology rank and exporter status. Finally, ∆bi is the
change in tariff barriers over the time period (lagged one year) for industry i.
Note that the above specification allows the marginal impact of a trade barrier to vary across
firms within the industry. Specifically, it predicts that an increase in tariff barriers should result in
larger firms, exporting firms and younger firms having higher productivity growth (i.e., have greater
incentives to adopt new technologies) relative to other firms in the industry. Note that, since the
estimated model includes four digit fixed effects, only firm level characteristics and their interactions
can be included (i.e. tariff changes cannot be included separately).
The third column of Table 1 reports the results of the firm level productivity growth estimates
when tariff change interaction terms are included for all of the firm level characteristics. All the
interaction terms have the same sign as the growth generating characteristics when entered alone.
This matches the prediction that firms with the potential for higher productivity growth benefit from
a tariff, while those with low growth potential are hurt (remember that this is within an industry).
Furthermore, the interaction terms on age and exporter status are statistically significant. Thus,
the results suggest that larger firms, exporting firms and younger firms are more likely to receive
any of the productivity benefits from tariffs. Column 4 confirms that these results are not altered
when accounting for selection.21 Furthermore, the signs and significance of these interactions terms21The first stage regression is the same one used in column 2. For the purposes of consistently, whenever an equation
includes a control for the selection effect in Tables 1 or 2, the equation from column 9 of Table A.1 is used.
18

are relatively robust to the time period considered, the use of lagged tariffs or effective rates of
protection and which interaction terms are included (see Table A.1 in the appendix).
To gain insight into the economic significance of the interaction terms consider a high growth
firm which is one standard deviation above the mean in terms of size, and one standard deviation
below the mean in terms of age. Such a firm is predicted to have productivity grow by 0.4 of a
percent per annum faster relative to the mean in the presence of a 20 percent tariff increase. Given
the symmetry of the estimates, a low growth firm one standard deviation below the mean in terms of
size, and one standard deviation above the mean in terms of age would have productivity grow 0.4 of
a percent slower, generating almost a one percentage point differential. This implies relatively large
differences across firms within the same industry. Overall, table 1 provides evidence that within
industries firms have a differential response to tariffs that is both statistically and economically
significant, with the heterogeneity consistent with the predictions of Proposition 1.
6 Across Industry Variation
While Proposition 1 predicts heterogeneity in the tariff response across firms within an industry,
Proposition 2 suggests the presence of heterogeneity in tariff response across industries. In particular
it says that whether or not the majority of firms in an industry improve their productivity perfor-
mance when a tariff is applied depends on the characteristics of the industry (i.e. the impact of a
given tariff change varies across industries; so the tariff change should be interacted with industry
characteristics). Thus, in this section we investigate whether the marginal impact of trade liberaliza-
tion on the productivity growth of the median firm is conditional on industry-level characteristics.
In this respect, our theory provides some guidance as Proposition 2 suggest some explicit industry
characteristics that should be related to the strength of the indirect effect and thus the marginal
impact of a tariff change. To measure these characteristics, we follow convention as closely as
possible. Barriers to entry (Fi) are measured as the negative of the average annual entry rate in a
four digit industry (a lower entry rate is associated with higher barriers to entry).22 The technology
gap (ci) is defined as the difference between the productivity of the most productive firm and the
least productive firm scaled by the productivity of the least productive firm within an industry.
Relative market size (αi) is measured as the expenditure on an industry relative to spending on all
manufacturing. All of these measures are drawn from the Colombian census of manufactures and
use data from 1984 or earlier. Thus, the empirical model is:
∆prji = γi + β0∆bi + β1Fi∆bi + β2ci∆bi + β3bi∆bi + β4αi∆bi + βxXj + βzZi + εj (11)
where ∆prji , is once again productivity growth for firm j in industry i, γi are 2 digit fixed effects,
Xj are firm characteristics and Zi are industry characteristics. Finally, ∆bi is the change in tariff22Annual entry rates are calculated for the period 1977-82, and then averaged. Over this period, all firms are
reported in the dataset without a 10 employee cut-off.
19

barriers over the time period (lagged one year) for industry i.
The key predictions of Proposition 2 are, first, that a tariff increase is more likely to encourage
adoption by the median firm in industries where barriers to entry (Fi) are high (i.e., β1 > 0).
Second, that the median firm’s response to a tariff increase is likely to be positive in industries with
larger technology gaps (ci) and lower tariffs (i.e., β2 > 0 and β3 < 0). Finally, the model predicts
that tariffs increase productivity growth of the majority of firms in industries where the size of the
domestic market (αi) is smaller (i.e., β4 < 0).
Before we explore potential heterogeneity in the marginal productivity impact of a tariff change,
we benchmark our methodology. The first column of Table 2 reports the results from the standard
approach using ordinary least squares techniques, controlling for firm characteristics and two digit
industry fixed effects. In line with the results from Fernandes (2006), who also investigates the
impact of trade liberalization in Colombia on firm productivity, the first column reports that firms
in industries that experienced larger tariff reductions had greater mean productivity growth. To
gain insight into what might be driving this response and also move the estimation technique closer
to one suitable for exploring our theoretical predictions (since these relate to the median rather
than the mean), the second column reports the results from a median regression with the same
specification as column 1 otherwise. Now we see that tariff reductions are associated with lower
productivity growth. While the difference in sign is not likely to be significant, it does have two
immediate implications. First it underscores the importance of heterogeneity in the data, with
different methodologies producing different results. Second, it also cautions that outliers are likely
to have played an important and under appreciated role in the results of previous studies. Since there
is a large degree of heterogeneity in the data, concerns are naturally raised about a specification that
assumes the marginal effect is the same for all firms both within and across industries. Indeed, there
is no reason to expect a uniform marginal response, and our theoretical analysis provides strong
reasons to expect the existence of non-linearities in the correlation between tariff changes and firm
productivity growth. We now augment the standard empirical specification by considering these
possibilities.
To investigate how the response of the median firm varies across industries we include the in-
teraction terms in the specification as suggested by equation (11).23 The results are presented in
column 3 of Table 2. To standardize the interpretation of the estimated coefficients, all of the in-
dustry characteristics have been centered at zero. In this case, the impact of a tariff change on the
median firm in an industry with average sample characteristics is given by the tariff change term
alone. By centering the data in this way, we see that the median firm in the average industry is pre-
dicted to have lower productivity growth due to trade liberalization. However, the model developed
above does not predict a uniform response to tariff changes, so focusing on the predicted outcome
for the average industry is unlikely to provide any general insights. Instead the model predicts that23In addition to including industry characteristics (size, barriers to entry, initial tariffs and technology gap) in the
interaction terms, we also include these industry characteristics as separate, linear terms in the estimation.
20
industry characteristics will be important in determining whether the majority of firms within an
industry respond to tariff changes by raising or lowering their productivity growth. This places
primary importance on the signs and significance of the interaction terms. In this respect all the
coefficients on the interaction terms in column 3 have the predicted signs (that a tariff decrease is
more likely to encourage productivity improvements in industries with low barriers to entry, small
technology gaps, high tariffs and large domestic market size). Moreover, all four interaction terms
are statistically significant.
However, one concern might be that the results are biased due to the presence of the sample
selection issue discussed previously. Given the use of quantile regression, the standard Heckman
correction doesn’t apply. In this case we follow the methodology set out in Buchinsky (1998). This
involves approximating the unknown correction term in the second stage by a polynomial expansion
of a first stage index.24 From the results reported in column 4, it is clear that the parameter estimates
are relatively unaffected by the inclusion of a control function for sample selection. To provide a
more familiar benchmark, column 5 reports results from mean regression while column 6 reports the
results from the standard Heckman correction. Reassuringly, all the coefficients have the predicted
signs and three of the four interaction terms are statistically significant. Once again, there is little
difference between the coefficients and the standard errors in the corrected and uncorrected models,
suggesting that sample selection is not driving the results. Furthermore, the signs and significance
of these interactions terms are relatively robust to the time period considered, the use of lagged
tariffs or effective rates of protection and which interaction terms are included (see table A.2 in the
appendix for details). These results confirm the presence of significant heterogeneity in the median
tariff response, with such variation being consistent with the predictions of our model of endogenous
technology adoption.
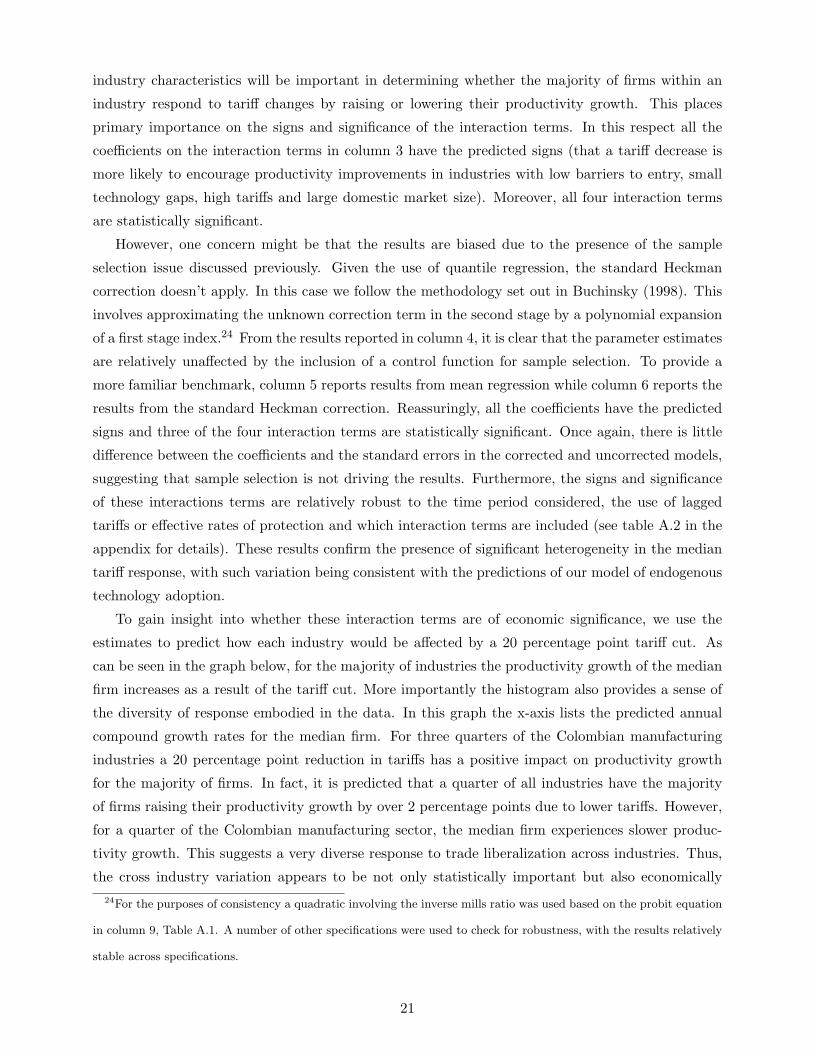
To gain insight into whether these interaction terms are of economic significance, we use the
estimates to predict how each industry would be affected by a 20 percentage point tariff cut. As
can be seen in the graph below, for the majority of industries the productivity growth of the median
firm increases as a result of the tariff cut. More importantly the histogram also provides a sense of
the diversity of response embodied in the data. In this graph the x-axis lists the predicted annual
compound growth rates for the median firm. For three quarters of the Colombian manufacturing
industries a 20 percentage point reduction in tariffs has a positive impact on productivity growth
for the majority of firms. In fact, it is predicted that a quarter of all industries have the majority
of firms raising their productivity growth by over 2 percentage points due to lower tariffs. However,
for a quarter of the Colombian manufacturing sector, the median firm experiences slower produc-
tivity growth. This suggests a very diverse response to trade liberalization across industries. Thus,
the cross industry variation appears to be not only statistically important but also economically24For the purposes of consistency a quadratic involving the inverse mills ratio was used based on the probit equation
in column 9, Table A.1. A number of other specifications were used to check for robustness, with the results relatively
stable across specifications.
21

important as well.
05
1015
2025
Per
cent
-1 0 1 2 3 4Productivity Growth
20% Tariff cut and Median Productivity Growth
While the histogram gives a sense of the diversity of behavior across industries in relation to
the median, the theoretical model can also be used to characterize other parts of the distribution,
generating further predictions to be investigated. In particular, it is straight forward to show that
Proposition 2 generalizes to other quantiles of the productivity distribution. Therefore, the interac-
tion terms are predicted to have the same sign regardless of which quantile is considered. To assess
this prediction, the seventh and eighth columns of Table 2 report results of the first and third quartile
regressions. In line with the theory all the interaction terms have the predicted signs. Furthermore,
for both the first and third quartiles the interaction terms involving barriers to entry, technology
gaps and industry size are statistically significant. Given the lack of structure imposed on the data
by the quantile regression technique, the relative success of these ancillary theoretical predictions
offers solid support for the robustness of the mechanism outlined in our theoretical model. Overall
the estimates in these tables show that the factors that the theory predicts should be important for
determining variation in response to tariff changes across industries, are in fact important in the
data.
7 Conclusion
A central issue in the trade policy literature is the relationship between trade policy and firm
productivity. An older view assumed that tariffs would allow domestic firms to capture a larger
market share, thereby encouraging domestic firms to invest in better technology. However, more
recently emphasis has been placed on the productivity enhancing effects of foreign competition
22

as it drives out inefficient domestic firms and prompts the surviving firms to modernize. While
determining which view is correct is essentially an empirical question, the mixed results in the
existing literature suggest that a simple empirical strategy is not sufficient to identify the underlying
mechanisms. In this paper we developed a model that captures an essential feature of the data; firms,
even within narrowly defined industries, have very different characteristics, including productivity.
This observation suggests that firms within the same industry may react very differently to changes in
trade policy, making it difficult to identify the behavior of a ‘typical’ firm without an understanding
of the source of the firm heterogeneity. By developing a theoretical model that provides insight into
this heterogeneity we are able to characterize the differential response to tariffs not only by firms
within industries but also by firms across industries.
To investigate these predictions we examine the Colombian experience with trade liberalization
since the mid 1980’s. Not only did Colombia undertake a substantial program of unilateral trade
liberalization that resulted in a large fall in the average tariff on industrial goods, but the structure
of protection was also dramatically altered. In this setting we found that trade liberalization tended
to raise the productivity of the typical firm in industries with low barriers to entry, small technology
gaps, large markets and also large initial levels of protection. By including these industry charac-
teristics we are able to provide a more nuanced view of how industries are likely to vary in their
response to trade liberalization. However, we also found evidence that firms within industries also
had a differential response to tariff changes, not just in terms of magnitude of response but in terms
of whether it improved or undermined a firms productivity performance. Specifically we found that
larger firms, younger firms and exporting firms (i.e., firms with high rankings in the productivity
distribution) tend to grow faster as tariffs are raised. Finally, we show that such variation across
firms and across industries is consistent with a our model of endogenous technology adoption. Thus,
the results of this paper (both theoretical and empirical) highlight the fact that the relationship be-
tween tariffs and productivity is not likely to be a simple one and will vary not only across industries
but also within industries.
23

A Data
All firm data are taken from a plant-level dataset produced from the Colombian Manufacturing cen-
sus by DANE (National Statistical Institute) for the years 1977 through 1991. From 1983 the census
covers industrial production for plants with greater than 10 employees. Our empirics concentrate
on plants which were operating in both 1984 and 1991. For a thorough description of this dataset
see Roberts (1996).
A.1 Firm Characteristics
Productivity Growth: the compound rate of change in labor productivity from 1984 to 1991. Labor
productivity is measured as real-value added for the plant divided by the number of production
workers (total employment minus owners and management staff).
Size: the log of employment. This characteristic is centered at zero by subtracting out the average
size of the plants within the sample.
Age: the log of the number of years since the start up of the plant to the year 1984. This characteristic
is centered at zero by subtracting out the average age of the plants within the sample.
Technology Rank : the difference between labor productivity for the plant and average labor pro-
ductivity in the (4-digit ISIC) industry. This difference is scaled by the standard deviation of labor
productivity within the industry.
Exporter Status: a dummy variable that takes the value of one if the plant exported in 1984.
A.2 Industry Characteristics
Tariff : ad-valorem tariff at the 4-digit ISIC level. Provided by Jorge Garcia at the World Bank.
The tariff change for a 4-digit industry is simply the difference between 1990 and 1983 ad-valorem
tariffs.
Entry Costs: the negative of the average annual entry rate within a 4-digit ISIC industry over the
period 1977-82. This characteristic is centered at zero by subtracting out the average entry rates of
all industries within the sample.
Technology Gap: the difference between the maximum and minimum labor productivities of plants
within a 4-digit ISIC industry in 1984. This difference is scaled by the productivity of the least
productive plant within the industry.
Industry Size: the ratio of total domestic sales for a 4-digit ISIC industry in 1984 to total domestic
sales for all industries in the sample. Total domestic sales are found by summing sales for all plants
at the 4-digit ISIC level and then adding in total imports for the industry (import data is provided
by Jorge Garcia at the World Bank). This characteristic is centered at zero by subtracting out the
average industry size of all industries within the sample.
24

Reference
Amiti, M. and Konings, J. (2005). Trade liberalization, intermediate inputs, and productivity:
evidence from indonesia. IMF Working Papers, 5/146.
Baggs, J., Head, K., and Ries, J. (2002). Free trade, firm heterogeneity and canadian productivity.
manuscript.
Bagwell, K. and Staiger, R. W. (1992). The sensitivity of strategic and corrective r&d policy in
battles for monopoly. International Economic Review, 33, 795–816.
Brooks, E. (2006). Why don’t firms export more? product quality and colombian plants. Journal
of Development Economics, 80, 160–178.
Buchinsky, M. (1998). The dynamics of change in the female wage distribution in the usa: a quantile
regression approach. Journal of Applied Econometrics, 13, 1–30.
Bustos, P. (2006). Rising wage inequality in the argentinean manufacturing sector: the impact of
trade and foreign investment on technology and skill upgrading. Working paper, UPF.
Conway, P. (2006). Downsizing, layoffs and plant closure: the impacts of import price pressure and
technological improvements on us textile producers. Working paper, UNC.
Crowley, M. A. (2006). Do safeguard tariffs and antidumping duties open or close technology gaps?.
Journal of International Economics, 68, 469–484.
Ederington, J. and McCalman, P. (2006). Endogenous firm heterogeneity and the dynamics of trade
liberalization. manuscript.
Fernandes, A. (2006). Trade policy, trade volumes and plant-level productivity in colombian manu-
facturing industries. Journal of International Economics.
Fudenberg, D. and Tirole, J. (1985). Preemption and rent equalization in the adoption of new
technology. Review of Economic Studies, 52, 383–401.
Goldberg, P. and Pavcnik, N. (2005). Trade, wages, and the political economy of trade protection:
evidence from the colombian trade reforms. Journal of International Economics, 66, 75–105.
Gotz, G. (1999). Monopolistic competition and the diffusion of new technology. Rand Journal of
Economics, 30, 679–693.
Javorcik, B. (2004). Does foreign direct investment increase the productivity of domestic firms? in
search of spillovers through backward linkages. American Economic Review, 94, 605–627.
Katayama, H., Lu, S., and Tybout, J. (2006). Firm-level productivity studies: illusions and a
solution. Working paper.
25

Konings, J. and Vandenbussche, H. (2004). Antidumping protection and productivity growth of
domestic firms. CEPR Discussion Papers 4620.
Krishna, P. and Mitra, D. (1998). Trade liberalization, market discipline and productivity growth:
new evidence from india. Journal of Development Economics, 56 (2), 447–462.
Levinsohn, J. and Petrin, A. (2003). Estimating production functions using inputs to control for
unobservables. Review of Economic Studies, 70, 317–342.
Matschke, X. and Sherlund, S. (2006). Do labor issues matter in the determination of u.s. trade
policy? an empirical reevaluation. American Economic Review, 96, 405–421.
Miyagiwa, K. and Ohno, Y. (1995). Closing the technology gap under protection. American Eco-
nomic Review, 85, 755–770.
Muendler, M.-A. (2004). Trade, technology, and productivity: a study of brazilian manufacturers,
1986-1998. University of California at San Diego, Economics Working Paper Series, 2004-06.
Olley, S. and Pakes, A. (1996). The dynamics of productivity in the telecommunications equipment
industry. Econometrica, 64, 1263–1297.
Pavcnik, N. (2002). Trade liberalization, exit, and productivity improvements: evidence from chilean
plants. Review of Economic Studies, 69, 245–276.
Reinganum, J. (1981). On the diffusion of new technology: a game theoretic approach. Review of
Economic Studies, 48, 395–405.
Roberts, M. J. (1996). Colombia, 1977-85: producer turnover, margins, and trade exposure. In
Roberts, M. J. and Tybout, J. R. (Eds.), Industrial Evolution in Developing Countries: Micro
Patterns of Turnover, Productivity, and Market Structure, pp. 227–259. OUP.
Rodrik, D. (1992). Closing technology gaps: does trade liberalization really help?. In Helleiner, G.
(Ed.), Trade Policy, Industrialization and Development: New Perspectives. Claredon Press.
Syverson, C. (2004). Product substitutability and productivity dispersion. Review of Economics
and Statistics, 86, 534–550.
Trefler, D. (2004). The long and short of the canada-u.s. free trade agreement. American Economic
Review, 94, 870–895.
Tybout, J. R. (2002). Plant and firm-level evidence on new trade theories. In Harrigan, J. (Ed.),
Handbook of International Economics. Basil Blackwell.
Yeaple, S. (2005). A simple model of firm heterogeneity, international trade, and wages. Journal of
International Economics, 65, 1–20.
26

Table 1 Impact of Tariffs on Firm Productivity Growth – Within Industry Variation
Colombian Manufacturing Sector, 1984-1991
(1) (2) (3) (4) OLS Heckman OLS Heckman Size 1.87*** 3.05*** 2.00*** 3.17*** (0.22) (0.68) (0.29) (0.70) Size*ΔTariff 0.01 0.01 (0.01) (0.01) Tech Rank -2.72*** -2.39*** -2.80*** -2.48*** (0.19) (0.27) (0.27) (0.33) Tech Rank*ΔTariff -0.004 -0.01 (0.01) (0.01) Age -0.77*** -0.62** -1.08*** -0.95*** (0.23) (0.26) (0.32) (0.33) Age*ΔTariff -0.02* -0.02* (0.01) (0.01) Exporter in 1984 2.49*** 2.16*** 3.59*** 3.30*** (0.63) (0.68) (0.85) (0.90) Exporter*ΔTariff 0.08* 0.08** (0.04) (0.04) 4 Digit Effects Yes Yes Yes Yes λ 6.57* 6.90* (3.58) (3.73) R-squared 0.13 0.14 Observations 3388 3382 3388 3382 Standard errors in parentheses * significant at 10%; ** significant at 5%; *** significant at 1% Tariffs and tariff changes are lagged one period.

Table 2 Impact of Tariffs on Firm Productivity Growth – Across Industry Variation
Colombian Manufacturing Sector, 1984-1991
(1) (2) (3) (4) (5) (6) (7) (8) OLS Median Median Med/Selection OLS Heckman 1st Quartile 3rd Quartile ΔTariff -0.01 0.01 0.20*** 0.18** 0.11 0.10 0.24*** 0.06 (0.02) (0.02) (0.07) (0.08) (0.09) (0.09) (0.09) (0.10) Entry*ΔTariff 0.8*** 0.6* 1.0*** 1.0*** 1.0*** 0.7* (0.3) (0.3) (0.4) (0.4) (0.4) (0.4) Gap*ΔTariff 0.01*** 0.01*** 0.005* 0.005* 0.008*** 0.008** (0.002) (0.002) (0.002) (0.002) (0.003) (0.004) Ind. Size*ΔTariff -4.6*** -4.7*** -2.8** -2.8** -5.6*** -4.3*** (1.1) (1.2) (1.3) (1.4) (1.3) (1.6) Tariff*ΔTariff -0.001** -0.001** -0.0002 -0.0002 -0.0002 -0.0005 (0.000) (0.001) (0.001) (0.001) (0.0006) (0.0007) Linear terms Yes Yes Yes Yes Yes Yes Observations 3388 3388 3388 3382 3388 3382 3382 3382 R-squared 0.09 0.10 Pseudo R-sq 0.05 0.07
Standard errors in parentheses * significant at 10%; ** significant at 5%; *** significant at 1% All estimated equations include 2 digit effects and firm level characteristics: size, age, exporter status, technology rank. Entry, Gap, Ind. Size and Tariff have all been centered at zero. Tariffs and tariff changes are lagged one period.

Table A.1
Impact of Tariffs on Firm Productivity Growth – Within Industry Variation Colombian Manufacturing Sector, Robustness and Sensitivity Analysis
(1) (2) (3) (4) (5) (6) (7) (8) (9) Size 3.19*** 3.25*** 3.92*** 4.00*** 3.05*** 3.07*** 3.16*** 2.98*** 0.38*** (0.71) (0.71) (0.79) (0.71) (0.68) (0.69) (0.69) (0.68) (0.02) Size*ΔTariff 0.003 0.001 0.005 0.003 0.004 (0.008) (0.005) (0.01) (0.02) (0.011) Tech Rank -2.517*** -2.505*** -3.89*** -2.84*** -2.41*** -2.42*** -2.37*** -2.41*** 0.12*** (0.388) (0.304) (0.41) (0.34) (0.27) (0.31) (0.27) (0.27) (0.02) Tech Rank*ΔTar -0.003 -0.004 -0.03*** -0.016 -0.002 (0.007) (0.004) (0.01) (0.016) (0.01) Age -1.14*** -0.808*** -0.50 -0.92*** -0.62** -0.62** -0.87*** -0.60** 0.04* (0.41) (0.298) (0.46) (0.34) (0.25) (0.25) (0.32) (0.25) (0.02) Age*ΔTariff -0.01* -0.01* -0.002 0.010 -0.015 (0.005) (0.005) (0.011) (0.02) (0.01) Exporter 3.27*** 3.170*** 1.64 2.39** 2.17*** 2.15*** 2.12*** 3.16*** 0.05 (0.90) (0.793) (1.19) (0.95) (0.68) (0.68) (0.69) (0.87) (0.08) Exporter*ΔTariff 0.08* 0.04** 0.022 0.01 0.07* (0.04) (0.02) (0.03) (0.06) (0.04) Office Equip -0.33** (0.15) Observations 3382 3297 3915 3593 3382 3382 3382 3382 5565
Standard errors in parentheses: * significant at 10%; ** significant at 5%; *** significant at 1% Size, tech rank and Age have all been centered at zero. All estimated equations included 4 digit fixed effects and correct for selection. (1) Contemporaneous tariffs are used rather lagged tariffs. (2) Effective rates of protection are used in place of tariffs. (3) Data covers period 1985 to 1991. (4) Data covers period 1984 to 1990. (5) - (8) Interaction terms considered individually. (10) Selection equation used in Tables 1 and 2.

Table A.2 Impact of Tariffs on Firm Productivity Growth – Across Industry Variation
Colombian Manufacturing Sector, Robustness and Sensitivity Analysis
(1) (2) (3) (4) (5) (6) (7) (8) ΔTariff 0.01 0.10*** 0.22*** 0.48*** 0.24*** -0.09** -0.01 0.02 (0.06) (0.03) (0.07) (0.09) (0.06) (0.04) (0.03) (0.05) Entry*ΔTariff 0.7*** 0.5*** 0.9*** 1.8*** 1.3*** (0.2) (0.2) (0.3) (0.4) (0.2) Gap*ΔTariff 0.005*** 0.004*** 0.22 0.16*** 0.002 (0.001) (0.001) (0.33) (0.03) (0.002) Ind. Size*ΔTar -2.2*** -1.6*** -4.0*** -11.7*** -4.0*** (0.8) (0.6) (1.0) (1.7) (0.8) Tariff*ΔTariff -0.0002 -0.0001** -0.0008* -0.0007 -0.001*** (0.0003) (0.0001) (0.0004) (0.0008) (0.000) Linear terms Yes Yes Yes Yes Yes Yes Yes Yes Observations 3379 3294 3946 3629 3415 3382 3382 3382 Standard errors in parentheses * significant at 10%; ** significant at 5%; *** significant at 1% All estimated equations include 2 digit effects and firm level characteristics: size, age, exporter status, technology rank. Entry, Gap, Ind. Size and Tariff have all been centered at zero. All equations include a control function to correct for selection. (1) Contemporaneous tariffs are used rather lagged tariffs. (2) Effective rates of protection are used in place of tariffs. (3) Data covers period 1985 to 1991. (4) Data covers period 1984 to 1990. (5) - (8) Interaction terms considered individually.