the impact of the basel iii capital & liquidity ... · 1 the impact of the basel iii capital...
TRANSCRIPT

1
The impact of the Basel III capital &
liquidity requirements:
Balance Sheet Optimization
Business Mathematics and Informatics
Internship Report
Supervisor Ernst & Young Supervisor VU
Jϋrgens Kroon Prof. dr. A. W. van der Vaart
Prof. dr. Michael Schröder
Author:
Jau Men Liang

2

3
Preface
This internship report was written as a part of the Business Mathematics and Informatics master program
at the Vrije Universiteit in Amsterdam. The goal of this report is to encompass the following program
components: Business, Mathematics and Informatics in practice at an external business, industry or
research facility. The present report contains the results of my internship done at “Ernst & Young,
Financial Services and Risk” in Amsterdam.
In this report we analyze the impact of the new Basel III accord on the balance sheet. More specifically,
we optimize the net income of the credit portfolio by credit allocation and analyze the impact on the banks
core business.
I would like to thank Jϋrgens Kroon for introducing me to the subject “The impact of the Basel III capital
& Liquidity requirements: Balance Sheet Optimization” and giving me the opportunity to undertake an
internship at Ernst & Young. Furthermore, I would like to thank Aad van der Vaart and Michael Schröder
for supervising my Internship.

4
Table of Contents
Preface
Management Summary 6
Introduction 7
1 Introduction of Basel Accord 8 1.1 Basel I 8
1.1.1 Tier Capital 9 1.1.2 Shortcoming of Basel I 9
1.2 Basel II 9 1.2.1 Credit Risk Capital Requirements 11 1.2.2 Off Balance Sheet Exposure 13 1.2.3 Market Risk Capital Requirements 14 1.2.4 Operational Risk Capital Requirements 17
1.3 Basel III 18 1.3.1 Regulatory capital ratio 18 1.3.2 Common equity Tier 1 (CET1) 20 1.3.3 Additional Tier 1 capital 20 1.3.4 Tier 2 capital 20
1.4 Deductible assets 21
2 Trading book 22 2.1 LCR 22
2.1.1 Characteristics of high quality liquid assets 23 2.1.2 Definition of high quality liquid assets 24 2.1.3 Net cash outflows 25
2.2 NSFR 27 2.2.1 Available amount of stable funding 27 2.2.2 Required amount of stable funding 28
3 Basel III: Theoretical adjustment cost 30 Savings rate VS Inflation 30
4 Methodology: Balance Sheet Optimization Model 33 4.1 Notations and Formulas 35
4.1.1 Credit Income 35 4.1.2 Expenses 38 4.1.3 Expenses 41 4.1.4 Constrains 43
4.2 Basel III Constraints 45 4.2.1 Capital constraints 45

5
4.2.2 Liquidity Coverage Ratio 46 4.2.3 Net Stable Funding Ratio 48
4.3 Linear Programming Optimization 50 4.3.1 Capital & Ratio 51
5 Scenarios 52 5.1 Scenario 1 (Effects of the NSFR and LCR on the BS) 52 5.2 Scenario 2 (Stress Testing) 55 5.3 Scenario 3 (Stress Testing with Unexpected Loss) 57
6 Conclusion 58 6.1 SNS Bank 58 6.2 All Banks 58
7 References 63

6
Management Summary
On September 12, 2010, the Basel Committee for banking Supervision endorsed the Basel III accord. The
new regulations aspire to make the banking system safer by redressing many of the flaws that became
visible in the crisis. Improving the quality and depth of capital and renewing the focus on liquidity
management is intended to improve their underlying risk management capabilities. Basel III is primarily
focused on capital and funding. It specifies new capital target ratios, defined as a core Tier 1, Tier 1, Tier 2
and Total Tier. Basel III also sets new standards for short-term funding (Liquidity Coverage Ratio) and
long-term funding (Net Stable Funding Ratio).
This endorsement represents a critical step in the process to strengthen the capital rules which banks are
required to operate. The probability and severity of a crisis in the banking sector will then be reduced and
enhance the global financial stability. These capital reforms will also have a high impact on the business
model, business strategies and balance sheet. These impacts will be analyzed during the internship by
optimizing the balance sheet according to the preferred return rate and risk appetite of shareholders.
Linear programming will be used to optimize the balance sheet according to a waterfall structure.
The input data that are used for the analysis are acquired from SNS Bank. We will implement divers
scenarios to analyze the effects of the new Basel III accord on the balance sheet. More specifically, we
will analyze the impact of the Tier, LCR and NSFR ratio. We will also stress test the balance sheet by
increasing the RWA of the credit portfolio which represents a depreciation of credit rating by the rating
agencies. This event occurred in the recent financial crisis, especially for the government bonds which
assumed to be riskless
The new Basel III accord will have a significant impact on the banks core business. Especially the
strengthened qualification of Tier capital and NSFR. The cost of increasing capital and ratio may lead
banks to raise the lending rates and reduce lending. This will have a significant impact on the growth of
the BS and net income during the transition period of Basel III.
We estimate that a 50 percent dividend payout ratio and nominal annual BS growth of 3 percent through
2019, the minimal capital requirements can be meet without attracting additional funding or capital. In a
more stressful scenario, a 30 percent dividend payout ratio will be sufficient.
The LCR ratio introduced by Basel III is not an obstacle on the banks core business when they satisfy the
new Tier Capital constrains. The build-up minimal Basel III capital requirements are enough to
comprehend the short/term liquidity requirements (LCR).
The NSFR will have significant impact on the banks core business. Within the banking business, banks
prefer loans with long-horizon and financing it with short-horizon to obtain a higher return rate on loans
and a lower financing expense rate. The NSFR will lower the maturity gap and force the banks to allocate
more investment with lower maturity and return rate or attract deposits with maturity longer than 1 year.
Basel III accord will result in a more capitalized balance sheet and should at least in principle become
safer and therefore, the cost of funding could decrease as a consequence of higher capital levels. The
depreciation of net income in the transition period will then be compensated. Overall, it‟s likely that banks
will be able to offset Basel III impact on profitability on the long run.
7
Introduction
The global financial crisis which started in 2008, has a devastating impact all over the globe. It started
with the defaults of subprime mortgages which was the first of many domino pieces that falls. Many
financial institution and countries didn‟t anticipate for such a scenario, which resulted in higher
leveraging, greed, risk appetite and lower capital to counter such an event. As a result, the institutions
didn‟t have enough capital to comprehend their risk exposure. For this reason, many institutions came in
financial distress or even default. To prevent further escalation, the government had to step in to prevent
the default of systematic institution by capital injection and guarantees. The public were accusing the
institutions for inappropriate risk appetite and blaming the government for the lack of regulations and
supervision. The recent financial crisis calls for more enhanced regulations to comprehend the flaws that
became visible in the crisis.
On September 12, 2010, the Basel Committee for banking Supervision endorsed the Basel III accord. The
new regulations aspire to make the banking system safer by redressing many of the flaws that became
visible in the crisis. Improving the quality and depth of capital and renewing the focus on liquidity
management is intended to improve their underlying risk management capabilities. Basel III is primarily
focused on capital and funding. It specifies new capital target ratios, defined as a core Tier 1, Tier 1, Tier 2
and Total Tier. Basel III also sets new standards for short-term funding (Liquidity Coverage Ratio) and
long-term funding (Net Stable Funding Ratio).
This endorsement represents a critical step in the process to strengthen the capital rules which banks are
required to operate. The probability and severity of a crisis in the banking sector will then be reduced and
enhance the global financial stability. These capital reforms will also have a high impact on the business
model, business strategies and balance sheet. These impacts will be analyzed during the internship by
optimizing the balance sheet according to the preferred return rate and risk appetite of shareholders.
In chapter 1 we will introduce the capital evolution of the Basel accord in the past decades, and in the
second chapter we will introduce the 2 new trading book ratio‟s LCR and NSFR. The theoretical
adjustment cost of the new Basel III accord will be discussed in chapter 3. In chapter 4 we will introduce
the methodology of the balance sheet optimization tool, which is used to analyze the effect of Basel III
accord on the balance sheet. The data obtained from SNS Bank will be used to analyze the effects of the
LCR and NSFR on the balance sheet and implement divers scenario to stress test the current balance sheet.
The results and findings are presented in chapter 5 and finally we will conclude our findings in chapter 6.
8
1 Introduction of Basel Accord
The equity capitals of the banks are used to absorb unpredicted losses and reduce the probability of
insolvency. The capital is used to maintain the stability of the financial system. The costs of reserving
such capital are relatively high due to the demanded return rate of stakeholders. Beside the preferences of
the stakeholders, they also have to be subject to the national regulations. Each country has their own
national capital requirement and risk weight criteria for the assets, which lead to different cost of capital
for the banks. To comprehend fair competition across borders, International accord and regulations are
born. These accords are also known as the Basel I, II and III accord and will be discussed in the following
paragraph.
1.1 Basel I
The first international accord founded in 1988 by the Basel committee. It took many years before the first
accord was founded due to the international political disagreement, different accounting standards and
lack of necessity within the financial market for such an accord. The need for an international united
regulation standard was a burden to the financial institutions, which will lead to increase in interest yield
and slow down national economic growth. In return, the financial market will gain a more stable financial
market by reducing the risk appetite of financial institutions and a fair competition across borders. The
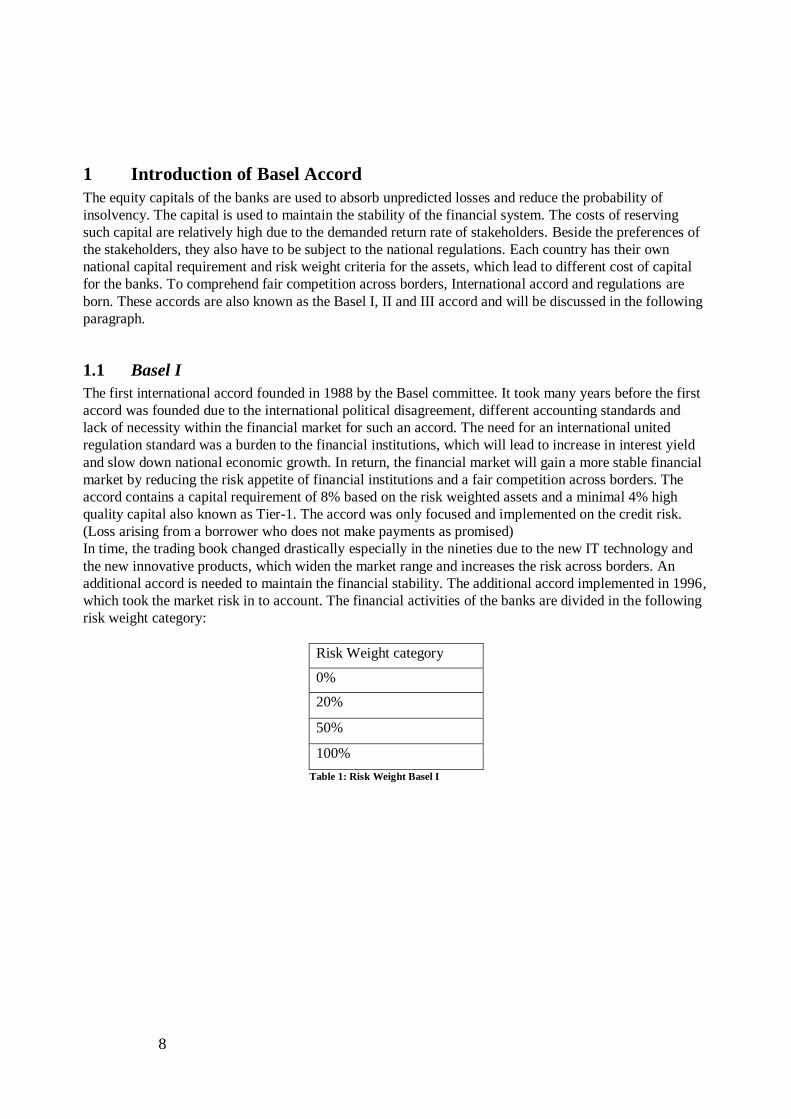
accord contains a capital requirement of 8% based on the risk weighted assets and a minimal 4% high
quality capital also known as Tier-1. The accord was only focused and implemented on the credit risk.
(Loss arising from a borrower who does not make payments as promised)
In time, the trading book changed drastically especially in the nineties due to the new IT technology and
the new innovative products, which widen the market range and increases the risk across borders. An
additional accord is needed to maintain the financial stability. The additional accord implemented in 1996,
which took the market risk in to account. The financial activities of the banks are divided in the following
risk weight category:
Risk Weight category
0%
20%
50%
100%
Table 1: Risk Weight Basel I

9
1.1.1 Tier Capital
The Tier capital is the available capital that can be used to compensate certain risk exposure/loss within
the financial institution. It will be use to indicate the degree of risk appetite and default probability across
international financial accounting standards. The Basel I accord contains 3 types of Tier capital described
below.
Tier 1: Core capital
The objective of Tier1 capital is to ensure the existence of the financial institution on a going concern
basis and to limit the risk of a shortfall of the creditors. The objective of Tier 1 capital is not to focus on
insolvency.
Tier 2: Supplementary capital
The objective of Tier 2 capital is to absorb losses on a “gone concern” basis. Tier 2 capital is intended to
improve the position of the depositors in case of the insolvency of the bank.
Tier 3: Short-term subordinated debt covering market risk
The objective of Tier 3 capital is to use short-term subordinated debt to meet the capital requirements
related to market risk.
1.1.2 Shortcoming of Basel I
The main shortcoming of Basel I was the lack of diversification among credit risk. The range of 100%
category Risk Weighted Regulatory Capital was too wide for the credit risk, which resulted to a higher
risk appetite. Banks will choose a higher risk investment within the same range of 100% category Risk
Weighted Regulatory Capital to optimize the return on equity. This shortcoming resulted to an increase in
the vulnerability of the bank balance sheet and is in contrary to the main goal of the Basel Accord. To
comprehend this effect, the enhanced Basel II was introduced
1.2 Basel II
Basel II accord is introduced in 2004 due to the shortcoming of Basel I. While the original accord focused
on credit risk and market risk, the new Accord expands the treatment of these risks to include a specific
operational risk component in the bank‟s capital ratio. The specific objectives of the Basel II accord
include the following:
- Promote safety and soundness of the financial system
- Enhance competitive equality
- Create capital adequacy assessments and approaches that are appropriate to the degree of risk
involved in a bank‟s positions and activities
- Focus on internationally active banks while allowing the principles to flexible enough to have
application to a wide variety of banking operations.
- Encourage continuous improvement in a bank‟s international risk assessment capabilities
- Ensure that risk is a primary emphasis in supervisory practice.

10
The framework of Basel II Accord introduced the three pillars shown below to acquire the objective
mentioned above.
Pillar I: Minimum Capital Requirement
Banks should maintain a minimum level of capital to cover the following risk
- Credit Risk, (risk that a borrower might not honor his contractual obligations)
- Market Risk, (risk of adverse price movements)
- Operational risk, (risk of loss resulting from inadequate internal processes or external effects)
Pillar II: Supervisory Review
Banks should asses the adequacy of their capital relative to their risk, and supervisors should review and
take corrective action if problems occur
Pillar III: Market Discipline
Risk should asses adequately disclosed in order to allow market participants to asses a bank‟s risk profile
and the adequacy of its capital. Greater disclosure will increase the discipline in the marketplace, leading
to greater financial stability.
The Basel II framework provides 2 approaches to calculate the capital charge for the given risk. The
standardized approach is a simplified method, which can be easy implemented, and the advanced approach
may provide a lower risk charge. Despites the more complex structure of this approach, there are many
positive effects on reputation and perception by stakeholders. More sophisticated and advanced risk
management will send out a clear message of solid and sound risk management to shareholders, clients,
rating agencies and the market. This reassurance is extremely important and gives comfort to stakeholders,
especially in times of economic turbulence and uncertainty.
Pillar I
•Minimal Capital Requirement
Pillar II
• Supervisory Review Process
Pillar III
•Market Discipline

11
1.2.1 Credit Risk Capital Requirements
The Basel II introduced 3 methods to calculate the credit risk capital requirements. The standardized
approach is the easiest to implement without individual credit risk assessment, which result to unnecessary
higher capital requirements. While the more complex (advanced) Internal Rating Based approach will give
a more accurate risk assessment and may lower capital requirements which the financial institution prefer.
The methods will be presented further below.
Standardized Approaches (SA)
The standardized approach for calculating the risk weights is based on external credit rating assessments.
The independent external risk assessments in the calculations of risk weights, will give issuers the
incentive to seek those externally generated risk assessments. If no external weighting is applied to a
certain risk exposure, the SA mandates a risk weighting of 100%. In addition, loans considered past due
are required to be weighted at 150% to reflect their greater risk profile, unless the bank has already set
aside provisions for that loan.
The risk weights for individual credit-risk assets can be found in Figure 2.
Risk Weight on Credit Risk Assets
Credit quality steps AAA to
AA-
A+ to A- BBB+ to BBB- BB+ to B- Below B- Unrated
Central governments
and central banks
0 20 50 100 100 150
Regional and local
governments agencies
20 50 100 100 100 150
Financial undertakings
(maturity > 3 months)
20 50 50 100 100 150
Financial undertakings
(maturity < 3 months)
20 20 20 50 50 150
Enterprises 20 50 100 100 150 150
Table 2: Risk Weight Basel II

12
Internal Rating Based (IRB)
The IRB approaches for calculating the risk weights are an attempt to recognize an individual bank‟s risk
profile in the calculation of capital requirements. The IRB approaches use a bank‟s own internal estimates
of creditworthiness to determine the risk weightings in the capital calculation. The IRB approaches are a
significant feature of the Basel II Accord, as they are an attempt to allow more customized/ accurate risk
profiles. This approach can be beneficial for banks since it has the potential to reduce the capital
requirement because a bank‟s own estimates of risk may be lower than those calculated using the
standardized approach.
There are three issues to address in the IRB framework:
- Risk components, which are risk parameter estimates, either developed internally or taken from
supervisory estimates.
- Risk weight functions, which take the risk components and translate them in to risk weighted
assets.
- Minimum requirements, which are standards that must be met before a banks is eligible to use
an IRB approach
The IRB approach will have a heavy reliance on supervisory estimates, due to the fact that only the
probability of default (PD) is estimated by the bank.
Advanced IRB
The advanced IRB approach is almost identical to the normal IRB approach. The advanced approach
allows banks to estimate not only PD, but also loss given default (LGD), exposure at default (EAD), and
effective maturity (M). Both approaches acquire the bank to use the risk weight functions to derive capital
requirements.
Risk weighted assets
The IRB methods of calculating risk weighted assets rely on four key quantitative inputs:
- Probability of Default (PD)
- Loss Given Default (LGD)
- Exposure at Default (EAD)
- Maturity (M)
This method allows the bank to use internal measures of credit exposure to rate specific borrower default.
A PD is generated to represent a long-run average PD for all borrowers in similar risk classes.
Unfortunately, PD does not fully incorporate the risk exposure to the bank. Recovery rates also play a role
in measuring the bank‟s exposure and are incorporate in to an LGD measure for the credit. The exposure
to a particular borrower also plays a role and is incorporate in to the EAD estimate.

13
1.2.2 Off Balance Sheet Exposure
Off-balance-sheet items under the standardized approach will be converted into credit exposure
equivalents through the use of credit conversion factors (CCF).
The framework takes account of the credit risk on off-balance-sheet exposures by applying credit conversion factors to the different types of off-balance-sheet instrument or transaction. With the exception
of foreign exchange and interest rate related contingencies, the credit conversion factors are set out in the
table below:
Credit Conversion Factor
1. Direct credit substitutes, e.g. general guarantees of indebtedness and
acceptances (including endorsements with the character of acceptances) 100%
2. Sale and repurchase agreements and asset sales with recourse, where the
credit risk remains with the bank 100%
3. Forward asset purchases, forward forward deposits and partly-paid shares
and securities,1 which represent commitments with certain drawdown 100%
4. Certain transaction-related contingent items (e.g. performance bonds, bid
bonds, warranties and standby letters of credit related to particular
transactions) 50%
5. Note issuance facilities and revolving underwriting facilities 50%
6. Other commitments (e.g. formal standby facilities and credit lines) with
an original maturity of over one year 50%
7. Short-term self-liquidating trade-related contingencies (such as
documentary credits collateralised by the underlying shipments) 20%
8. Similar commitments with an original maturity of up to one year, or
which can be unconditionally cancelled at any time 0%
Table 3: Credit Conversion Factor

14
1.2.3 Market Risk Capital Requirements
Market risk is the risk exposure to the fluctuation within the market value of an investment portfolio or
trading portfolio. Given the fact that the portfolio holder doesn‟t know what its market value is a week
from today, additional capital requirement is necessary to comprehend such risk. The market risk capital
requirements can be calculated by the methods provided by the Basel II framework and will be explained
further below.
1.2.3.1Specification of Market Risk Factors
Interest rates
A set of risk factors corresponding to interest rates in each currency in which the bank has interest
rates exposure.
Risk measurement system
The yield curve should be modeled using generally accepted approaches and must incorporate
separate risk factors to capture spread risk
Exchange rates
Institution risk factors corresponding to the individual foreign currencies in which the bank‟s
positions are denominated is necessary.
Equity prices
A set of risk factors corresponding to each of the equity markets in which the bank holds significant
positions.
Commodity prices
A set of risk factors corresponding to each of the commodity markets in which the bank holds
significant positions.
1.2.3.2Standardized Method
The standardized method is a simplified method that ignores the diversification the market risk factors.
The bank‟s total risk charge can be found by summing the capital charge of all market risks factors. The
formula is given below.
Total Market Risk Capital requirement
n
i
iRWA0
%8*

15
1.2.3.3Internal Model Approach (IMA)
The IMA approach allows a bank to use its own management systems to determine its market risk capital
charge. Banks are motivated to use the internal models approach since it may produce a lower capital
charge than the standardized method. However, in order to use this approach banks must satisfy certain
requirements set forth by regulators. These requirements include:
- Internal oversight
- Back testing of outputs
- Stress testing
- Setting exposure limits
Figure 1: Internal Model Approach
When all these requirements are satisfied, market risk charge can be computed in two ways:
- Current VAR is higher than the previous day‟s VAR.
- The average VAR over the last 60 business days adjusted by a multiplicative factor subject to a
floor of 3. The multiplication factor will be set by supervisory authorities on the basis of their
assessment of the quality of the bank‟s risk management system.
Inputs
- Horizon of 10 Trading days
- 99% confidence level
- Observation period (at least 1 year historical data)
SRCVaRVaRMaxMRC tdayst ),( 160
ti
i
i
IMA
t SRCVaRVaRkMaxMRC
),60
1( 1
60
1
1
SRC = Specific Risk Charge

16
Back testing
If VAR is continually underestimated, a penalty factor „plus factor‟ will be added to this multiplier (k).
Table 4: Back testing penalty factor
)3(*,60,60 kVaRMRC tdaystday
Stress Testing
To identify events or influences that could greatly impact bank‟s key component, stress testing will be
computed to address these events. Both quantitative and qualitative nature should be institutioned.
Stress Scenario
The need to cover a range of factors that can create extraordinary losses or gains in trading portfolios. The
stress test should be reviewed periodically by senior management and should be reflected in the policies
and limits set by management and the board of directors

17
1.2.4 Operational Risk Capital Requirements
The operational risk is the risk that arises during the operation of the institution. This includes employee
errors, system failures, natural disasters, fraud or other criminality and reputation. Basel II allows bank to
base operational risk capital requirements on their own internal models. This has resulted considerable
independent research into methods for measuring operational risk. The methods that are available to
calculate capital charge are presented below.
1.2.4.1Standardized approach
The bank‟s total risk charge can be found by summing the capital charge of operational business line. The
capital charge can be found by business line multiplied with the given beta factor provided by the Basel II.
The Beta factors are presented below.
Business Line Bèta Factor
Institution Finance 18%
Trading and Sales 18%
Payment and Settlement 18%
Agency Services 15%
Commercial Banking 15%
Asset Management 12%
Retail Brokerage 12%
Retail Banking 12%
Table 5: Operational Risk Beta Factor
n
i
iiBLine0
*
1.2.4.2Advanced Measurement Approach (AMA)
The advanced measurement approach uses the loss distribution to calculate the operational risk charge.
The loss distribution of the bank over a one-year period will be implemented to determine the operational
risk capital charge with an given confidence level of 99.9%.
This approach has a number of advantages for quantifying operational risk:
- Loss estimates are based on the unique characteristics of the institution.
- Estimates are based on sound mathematical and statistical principles.
- Loss estimates change over time, reflecting changes in the operations and risk management of
the institutions.
However, there are also few disadvantages:
- The approach requires large amounts of operational data, which are sometimes not available.
- Operational data is usually not available at the lower levels of a business line to produce a true
bottom-up model.
- Only direct losses are included.
- Difficult to measure the dependant nature of operational risk data.

18
1.3 Basel III
Basel II accord is introduced in 2010 due to the shortcoming of Basel I and II. The new Accord expands
the treatment of capital qualification and higher capital requirement. Besides the stronger constrains on the
former Basel II capital requirements, it also introduced the short term Liquidity Coverage Ratio (LCR) and
the long term Net Stable Funding Ratio (NSFR) to maintain the bank‟s stability. The specific comparison
with Basel II accord is represented below:
1.3.1 Regulatory capital ratio
Basel III Basel II
Tier 1 Capital ratio 2013= 4.5%
2014=5.5%
2015=6%
4%
Core Tier 1 2013=2%
2014=3.5%
2015=4.5%
2%
The difference between the total capital requirement of 8% and the Tier 1 requirement can
be met with Tier 2 capital.
Basel III Basel II
Capital Conservation
Buffer
2016=0.625%
2017=1.25%
2018=1.875%
2019=2.5%
None
Table 6: Capital ratio Basel III vs Basel II
Banks will be required to hold a capital conservation buffer of 2.5% on top of Tier 1 capital to withstand
future periods of stress bringing the total common equity requirements to 7% (Table 7). The purpose of
the conservation buffer is to ensure that banks maintain a buffer of capital that can be used to absorb
losses during periods of financial and economic stress. While banks are allowed to draw on the buffer
during such periods of stress, the closer their regulatory capital ratios approach the minimum requirement,
the greater the constraints on earnings distributions.

19
Table 7: Basel III requirements

20
1.3.2 Common equity Tier 1 (CET1)
The common equity tier 1 capital consist of the sum of the following elements:
- Common shares issued by the bank
- Stock surplus resulting from the issue of instruments included CET 1
- Retained earnings
- Accumulated other comprehensive income and other disclosed reserves
Phased out elements and capped at 10% of the bank‟s Common equity and 15% of the CET1.
- Deferred tax assets
- Mortgage Service Rights
- Significant investment in the common shares of unconsolidated financial institution
1.3.3 Additional Tier 1 capital
The additional Tier 1 Capital consist of the sum of the following elements:
- Instruments issued by the bank that meet the criteria for inclusion in additional tier 1 capital
(not included in common equity tier 1)
- Stock surplus resulting from the issue of instruments included in additional tier 1 capital.
- Instruments issued by consolidated subsidiaries of the bank (Not included in CET1)
Capital instruments that do not meet the criteria for inclusion in CET1 will be excluded from CET1 as of 1
January 2013. However, instruments meeting the following three conditions will be phased out 10%
annually over the horizon:
- Issued by a non-joint stock company
- Treated as equity under the prevailing accounting standard
- Received unlimited recognition as part of Tier 1 capital under current national banking law
1.3.4 Tier 2 capital
The objective of Tier 2 is to provide loss absorption on a gone-concern basis. Based on this objective, the
Tier 2 capital consist of the sum of the following elements
- Undisclosed Reserves
- Hybrid instruments (phase out)
- Revaluation Reserves
- General Provisions
- Subordinated Term Debt

21
1.4 Deductible assets
The financial crisis showed that many assets that are subjected to Basel II Tier capital did not absorb
losses as expected, which resulted in a number of distressed banks being rescued through government‟s
capital injection. To prevent such event to happen again, the guidelines introduced by the Basel III require
banks to ensure that their additional Tier 1 and Tier 2 capital are valid to absorb losses during distress. By
deducting certain assets, a more reliable Tier capital will surface. The following assets should be deducted
from the Tier capital according to the Basel III framework.
Deferred tax assets
Deferred tax (future income taxes) is an accounting concept, which results from a future tax liability or
asset, resulting from temporary differences or timing differences between the accounting value of assets
and liabilities and their value for tax purposes.
DTAs can be classified as follows:
- DTAs resulting from deductible temporary differences
- DTAs resulting from the carry forward of unused tax losses
o Transferrable DTAs resulting from tax loss carry forwards are an important driver for
the value of a financial institution and may increase the purchase price in case of a sale
of the business. The purchaser may use these DTAs for its own tax purposes and is
therefore ready to pay a higher purchase price. In a stress situation, the financial
institution may dispose of an affiliated company and in that way generate cash from the
DTAs even in a stress situation.
Intangible assets/goodwill
Created as part of a purchase price allocation whereas DTA reflect actual assets which are realized for full
value in cash and may only depend on the cycle of business plan
Mortgage servicing rights (MSRs)
A mortgage servicing right is a contractual agreement where the right, or rights, to service an existing
mortgage are sold by the original lender to another party who specializes in the various functions of
servicing mortgages
Financials (Hybrids)
Hybrid securities are a combination of two types of securities, debt and equity. Hybrid securities pay a
predictable fixed or floating rate of return or dividend until a certain date, at which point the holder has a
number of options including converting the securities into the underlying share. This instrument is treated
as equity in the perspective of depositors. Prior the financial crisis, many banks issued hybrid capital as a
cost-effective way to increase their Tier capital. The financial crisis showed that this instrument was not
loss absorbing in time of distress, which resulted to rescue operation by the government through capital
injection. According to the Basel III framework, such financial hybrids needs to be deducted during the
upcoming years from the Tier Capital to provide a more reliable Tier capital.

22
2 Trading book
The Trading book is the portfolio of large financial institutions that contains credit instruments with
trading intent held by the institution. The buying and selling of such instruments are recorded in the
trading book. The trading book positions are more vulnerable to short-term changes in their value and
therefore warrant a capital charge against liquidity/market risk.
The Basel proposals will require two separate requirements to be met:
- The liquidity Coverage Ratio (LCR) is designed to establish a minimum level of high-quality
liquid resources sufficient to meet an acute stress lasting for a month
- The Net Stable Funding Ratio (NSFR) is designed to influence the structure of funding by
creating incentives for banks to fund non-readily saleable assets with stable funding
The new regulatory rules for liquidity will have important operational and strategic implications for bank
management. After an observation period beginning in 2011, the LCR will be introduced on 1 January
2015. The NSFR will move to a minimum standard by 1 January 2018. We will describe the two separate
requirements in detail in the next paragraph.
2.1 LCR
The liquidity coverage ratio identifies the amount of unencumbered, high quality liquid assets that an
institution holds, which can be used to offset the net cash outflows it would encounter under an acute
short-term stress scenario specified by supervisors. The specified scenario entails both institution-specific
and systemic shocks built upon actual circumstances experienced in the global financial crisis. This
scenario entails
- The Run-off of a proportion of retail deposits
- Downgrade of the institution‟s credit rating
- Loss of unsecured Wholesale funding
- Increase in market volatilities that impact the quality of collateral or potential future exposure of
derivative positions
- Increase in secured funding haircuts
- Increase in derivative collateral and non-contractual off-balance sheet exposure, including
committed credit and liquidity facilities
The objective of LCR is to ensure that a bank maintains an adequate level of unencumbered, high quality
assets that can be converted into cash to meet its liquidity needs for a 30-day time horizon under an acute
liquidity stress scenario specified by supervisors.
The stock of high quality liquid assets should enable the bank to survive until day 30 of the proposed
stress scenario. The net cumulative cash outflows for 30 days in to the future are used to determine the
23
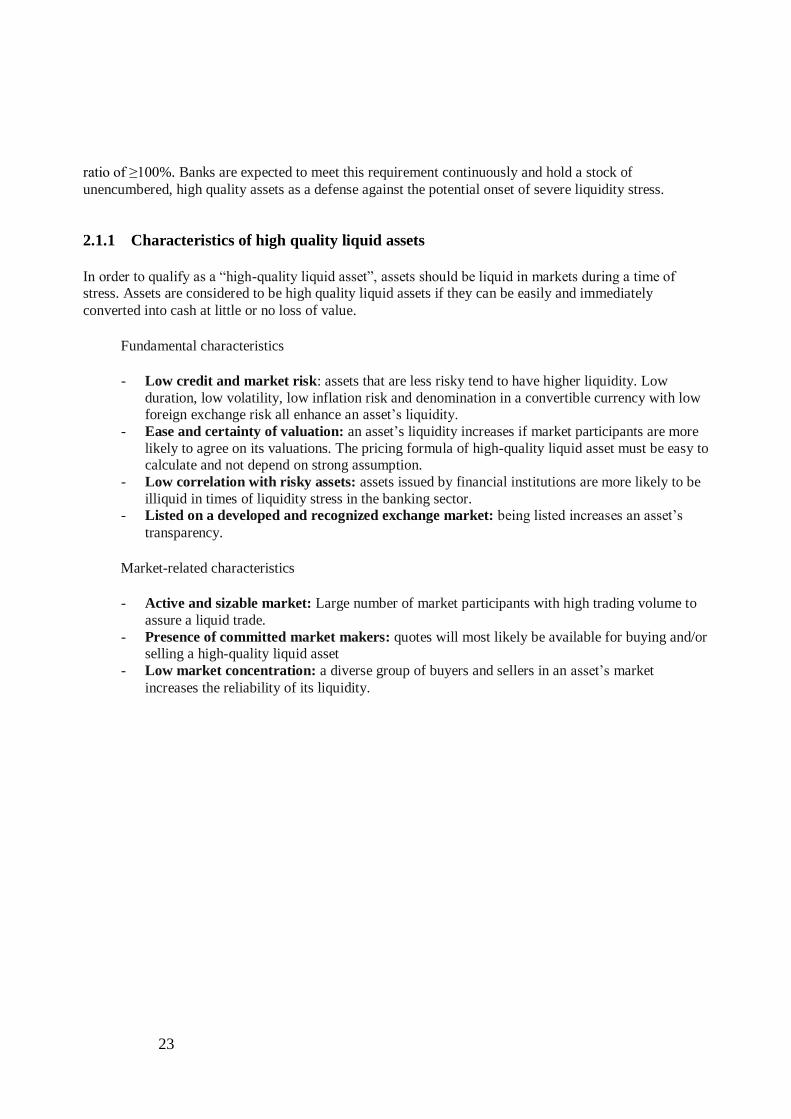
ratio of ≥100%. Banks are expected to meet this requirement continuously and hold a stock of
unencumbered, high quality assets as a defense against the potential onset of severe liquidity stress.
2.1.1 Characteristics of high quality liquid assets
In order to qualify as a “high-quality liquid asset”, assets should be liquid in markets during a time of stress. Assets are considered to be high quality liquid assets if they can be easily and immediately
converted into cash at little or no loss of value.
Fundamental characteristics
- Low credit and market risk: assets that are less risky tend to have higher liquidity. Low
duration, low volatility, low inflation risk and denomination in a convertible currency with low foreign exchange risk all enhance an asset‟s liquidity.
- Ease and certainty of valuation: an asset‟s liquidity increases if market participants are more
likely to agree on its valuations. The pricing formula of high-quality liquid asset must be easy to calculate and not depend on strong assumption.
- Low correlation with risky assets: assets issued by financial institutions are more likely to be
illiquid in times of liquidity stress in the banking sector. - Listed on a developed and recognized exchange market: being listed increases an asset‟s
transparency.
Market-related characteristics
- Active and sizable market: Large number of market participants with high trading volume to
assure a liquid trade.
- Presence of committed market makers: quotes will most likely be available for buying and/or selling a high-quality liquid asset
- Low market concentration: a diverse group of buyers and sellers in an asset‟s market
increases the reliability of its liquidity.

24
2.1.2 Definition of high quality liquid assets
The high-quality liquid assets should comprise assets with the characteristics outlined above. This section
describes the type of assets that meet these characteristics and can therefore be included. We can divide
these assets in to two categories:
- Level 1, assets can be included without limit
- Level 2, assets can only comprise up to 40% of the stock
Level 1 assets are held at market value and are not subject to a haircut under the LCR. The following
assets are included as level 1
o Cash
o Central bank reserve o Marketable securities claims guaranteed by sovereigns, central bank, non central
government public sector entities, the bank for international settlements, the International Monetary Fund, or the European Commission.
o Non-0% risk-weighted sovereigns or central bank debt securities
Level 2 assets can be included in the stock of liquid assets, subject to the requirement that they comprise
no more than 40% of the overall stock after haircuts have been applied. It also includes cash or other level
1 assets generated by secured funding transactions maturing within 30 days. The following assets are
included as level 2 with a minimum 15% haircut applied to the current market value held in stock.
- Marketable securities claims guaranteed by sovereigns, central bank, non central government
public sector entities or multilateral development banks that satisfy all of the following
conditions
o Assigned a 20% risk weight under the Basel II Standardized Approach for credit risk
o Traded in large, deep and active repo or cash markets characterized by a low level of
concentration
o Reliable source of liquidity in the markets (maximum 10% fluctuations in haircuts of
the price over 30-day period of liquidity stress scenario)
o Not an obligation of a financial institution or any of its affiliated entities.
- Institution bonds and covered bonds that satisfy all of the following conditions:
o Not issued by financial institution or any of its affiliated entities
o Not issued by the bank itself or any of its affiliated entities
o Assets have a credit rating from a recognized external credit assessment institution
(ECAI) of at least AA- or are internally rated as having a probability of default (PD)
corresponding to a credit rating of at least AA-.
o Traded in large, deep and active repo or cash markets characterized by a low level of
concentration
o Reliable source of liquidity in the markets (maximum 10% fluctuations in haircuts of
the price over 30-day period of liquidity stress scenario)

25
2.1.3 Net cash outflows
Net cash outflows are defined as cumulative expected cash outflows minus cumulative expected cash
inflows arising in the specified stress scenario in the time period under consideration. This is the net
cumulative liquidity mismatch position under the stress scenario measured at the test horizon.
Cumulative expected cash outflows are calculated by multiplying outstanding balances of various
categories or types of liabilities by assumed percentages that are expected to roll-off, and by multiplying
specified draw-down amounts to various off-balance sheet commitments. Cumulative expected cash inflows are calculated by multiplying amounts receivable by a percentage that reflects expected inflow
under the stress scenario. The cash outflow and inflow that are subjected to the Basel III framework are
described below.
Cash outflow
The cash outflow can be divided in to 2 categories, namely the deposit run-off and the unsecured
wholesale run-off, which results to a direct short term liquidity problem and default.
The Deposits run-off
Stable deposits (5% or higher)
- Deposits that are fully covered by an effective deposit insurance scheme or by public
guarantee that provides equivalent protection.
Less stable deposits (10% or higher)
- Foreign currency deposits
- Deposits that are not covered by an effective deposit insurance scheme or sovereign
deposit guarantee, high-value deposits from sophisticated or high net worth individuals,
deposits that can be withdrawn quickly.
Retail fixed-term deposits (0%, excluded)
- The maturity of fixed or time deposits with a residual maturity or withdrawal notice
period of greater than 30 days will be excluded from the LCR.

26
Unsecured wholesale funding run-off
Unsecured wholesale funding is defined as those liabilities and general obligations that are raised from
non-natural persons and are not collateralized by legal rights to specifically designated assets owned by
the borrowing institution in the case of bankruptcy, insolvency, liquidation or resolution.
Small business customers (5%, 10% and higher)
- Unsecured wholesale funding provided by small business customers is treated the same
way as retail deposits and distinguished between “stable funding‟‟ and “unstable
funding”. The stable funding will receive a minimum %5 run-off factor and less stable
funding categories receiving minimum run-off factors of 10%.
Operational relationships (25%)
- Qualifying portions of deposits and other extensions of funds from wholesale customers
with specific operational relationship. Financial and non-financial customers are included
in this treatment. These funds may receive a 25% run-off factor if the customer has an
established operational relationship with the bank upon which it has a substantive
dependency.
Non-financial institution and sovereigns, central bank and public sector entities (75%)
- This category comprises all deposits and other extensions of unsecured funding from
non-financial institution customers. Funds from multilateral development banks would
also be include in this category. The run-off factor for these funds is 75%.
Unsecured wholesale funding provided by other legal entity customers (100%)
- This category comprises all deposits and other funding from other institutions (bank,
securities firm, insurance companies etc.), Fiduciaries ,1 beneficiaries,
2 conduits and
special purpose vehicles. The run-off factor for these funds is 100%.
1 Legal entity that is authorized to manage assets on behalf of a third party such as hedge funds, pension funds and other collective investment
vehicle
2 Legal entity that receives, or may become eligible to receive, benefits under a will, insurance policy, retirement plan, annuity, trust, or other
contract.

27
2.2 NSFR
The NSFR requires a minimum amount of stable sources of funding at a bank relative to the liquidity
profiles of the assets, as well as the potential for contingent liquidity needs arising from off-balance sheet
commitments, over a one-year horizon. The NSFR aims to limit over-reliance on short-term wholesale
funding during times of credit crunch.
2.2.1 Available amount of stable funding
Available Stable Funding (ASF) is defined as the total amount of an institution‟s components of Available
Stable Funding. The available stable funding is the sum of the types of liabilities the bank has to finance
the assets. These liabilities will be multiplied by the appropriate ASF factor given in the table below to
obtain the total available stable funding.
The objective of the ASF is to ensure stable funding on an ongoing, viable entity basis, over one year in an
extended firm-specific stress scenario where a bank encounters, and investors and customers become
aware of:
- A significant decline in profitability or solvency arising from heighted credit risk, market risk,
or operational risk and other risk exposures.
- A potential downgrade in a debt, counterparty credit or deposit rating.
- A material event that calls the reputation or credit quality of the institution into question.
The extended borrowing from central bank lending facilities outside regular open market operations are
not considered in this ratio, in order not to create a reliance on the central bank as a source of funding.
ASF Factor Components of ASF Category
100% The total amount of capital, including both Tier 1 and Tier 2
The total amount of any preferred stock not included in Tier 2 that has an effective
remaining maturity of one year or greater taking into account any explicit or embedded
options that would reduce the expected maturity to less than one year.
The total amount of secured and unsecured borrowings and liabilities (including term
deposits) with effective remaining maturities of one year or greater excluding any
instruments with explicit or embedded options that would reduce the expected maturity
to less than one year.
90% “Stable” non-maturity deposits and/or term deposits with residual maturities of less than
one year provided by retail customers and small business customers.
80% “Less stable” non-maturity deposits with residual maturities of less than one year
provided by retail and small business customers.
50% Unsecured wholesale funding, non-maturity deposits and/or term deposits with residual
maturity of less than one year, provided by non-financial institution, sovereigns, central
bank, multilateral development bank and PSEs.
0% All other liabilities and equity categories not included in the above categories
Table 8: Available Stable funding Factor

28
2.2.2 Required amount of stable funding
The required stable funding is the sum of the types of asset exposures the bank has multiplied by the
appropriate RSF factor given in the table below. The objective is to identify the required funding to
operate on an ongoing base given the exposure.
RSF Factor Components of RSF Category
0% Cash immediately available to meet obligations, not currently encumbered as collateral
and not held for planned us.
Unencumbered short-term unsecured instruments and transactions with outstanding
maturities of less than one year.
Unencumbered securities with stated remaining maturities of less than one year with no
embedded options that would increase the expected maturity to more than one year.
Unencumbered loans to financial entities with effective remaining maturities of less than
one year that are not renewable and for which the lender has an irrevocable right to call.
5% Unencumbered marketable securities with residual maturities of one year or greater
representing claims on or claims guaranteed by sovereigns, central banks, BIS, IMF, EC,
non-central government PSEs or multilateral development banks that are assigned a 0%
risk-weight under the Basel II standardized approach, provided that active repo or sale-
markets exist for these securities.
20% Unencumbered institution bonds or covered bonds rated AA- or higher with residual
maturities of one year or greater.
Unencumbered marketable securities with residual maturities of one year or greater
representing claims on or claims guaranteed by sovereigns, central banks, non-central
government PSEs that are assigned a 20% risk-weight under the Basel II standardized
approach.
50% Unencumbered gold
Unencumbered equity securities, not issued by financial institutions or their affiliates,
listed on a recognized exchange and included in a large cap market index.
Unencumbered loans to non-financial institution clients, sovereigns, central banks, and
PSEs having a remaining maturity of less than one year.
Unencumbered institution bonds and covered bonds that satisfy all of the following
conditions:
- Central bank eligibility for intraday liquidity needs and overnight liquidity shortage in
relevant jurisdictions
- Not issued by financial institutions or their affiliates

29
- Not issued by the respective firm itself or its affiliates
- Low credit risk: assets have a credit assessment by a recognized ECAI of A+ to A-, or
do not have a credit assessment by a recognized ECAI and are internally rated as
having a PD corresponding to a credit assessment of A+ to A-.
- Traded in large, deep and active markets characterized by a low level of concentration.
65% Unencumbered residential mortgages of any maturity that would qualify for the 35% or
lower risk weight under Basel II Standardized Approach for credit risk.
Other unencumbered loans, excluding loans to financial institutions, with a remaining
maturity of one year or greater, that would qualify for the 35% or lower risk weight under
Basel II Standardized Approach for credit risk.
85% Unencumbered loans to retail customers and small business customers having a remaining
maturity of less than one year
100% All other assets not included in the above categories
Table 9: Required Stable funding Factor

30
3 Basel III: Theoretical adjustment cost
Based on the Bank of International Settlement study, by 2019 the European industry will need about € 1.3
trillion of short-term liquidity, and about €2.3 trillion of long term funding. Assuming a 50 percent
retained earning payout ratio and nominal annual balance-sheet growth of 3 percent through 2019, the
short term liquidity requirements to €1.7 trillion, and long-term funding needs to about €3.4 trillion.
Closing these gaps will have a substantial impact on profitability. In this section, we will discuss the future
development of the Basel III adjustment cost.
Financing cost
Banks claims that a higher capital will results to an higher financing cost due to the fact that liabilities are
less expensive than capital. The return on equity will be lower when capital increases. This claim is only
correct in the ideal world with no taxes, transaction cost and symmetric information. In reality, such ideal
world doesn‟t exist. Increase in capital doesn‟t necessary result to increase in financing cost.
Generic tax advantage
In reality, banks have to pay tax over its assets. When leveraging the assets, a tax advantage can be
obtained. The tax advantage over the interest of the liabilities can have a significant impact on the interest
cost, profit, strategy and risk appetite of the shareholders. A higher leverage will obtain a higher tax
advantage and therefore a lower capital is preferred. The new Basel III capital ratios will prevent over-
leveraging and such tax advantage would be reduced.
Government guarantees
A higher capital will also take less advantage of the government protection scheme. A bank with lower
probability of default will take less advantage of the government guarantees. The financial shocks will
then be absorbed by their capital buffer, and the risk will then be transferred to the shareholders of the
bank while the banks with high probability of default will then be absorbed by the government guarantees.
Cost of higher capital requirement/funding cost
With more capital, banks should at least in principle become safer and therefore, the cost of funding could
decrease as a consequence of higher capital levels. The OECD study shows that a -1.4% drop in required
return on bank equity would be enough to offset the impact on the overall bank funding cost of 1%
increase in bank capital. Considering the actual Basel III capital requirements, their impact on bank
funding costs could be neutralized by a fall in the required return on equity. The funding cost would then
be reduced as banks become better capitalized by acquiring a higher credit rating.
Savings rate VS Inflation
The inflation in the Netherlands has increased even in the crisis time. This increase is the results of higher
food, electricity and oil prizes. When we compare the inflation rate with the savings rate, we can see that
the inflation increases with 0.4 % and the savings rate with 0.2%. The gap between these two will results
to lower consuming power due to relative decrease in wealth.

31
Short-term economic impact of Basel III regulations
The magnitude of the short-term economic impact of Basel III is subjected to many uncertain factors.
Basel III is expected to generate substantial benefits by reducing the frequency and intensity of banking
crisis. To comprehend the new regulations, the cost of increasing capital ratios may lead banks to raise
their lending rates and reduce lending. The effect of such scenario will have a significant impact on the
economic growth (Figure 2). We can divide the impact in 2 Channels. The first channel, which is referred
as the „Trade Flow Channel,‟ acts through lower economic activity and lower import activity that depends
on trade income elasticity. The second channel, which is referred as „financial flows channel,‟ acts through
higher interest rates and the decline in bank flows from advanced economies that depend on interest rate
differentials and global risk. Both channels will have a significant impact on the economy by lower
consumption, investment and export.
Figure 2: Trade Flow Channel

32
Securitization
Banks all over the globe are continuously searching for additional stable financial sources to increase the
solvability and capital reserve. The most common used method to gain additional funding is securitization.
This method has been criticized during the last financial crisis due to the lack of transparency and
regulations. Besides all these critics, Securitization is still a useful method to gain financial funding,
balance sheet reconstruction and loan supply.
Financial funding/Capital reconstruction
By Securitization, retail and consumers loans will be bundled in one pool to convert it in a tradable asset.
Such asset can be used as collateral to gain liquid loan to meet the short-term financial obligation or sell it
to investors to increase the capital reserve. The increase in financial funding is not the only benefit that
comes in par. By selling the bundle of loans, the loans will be removed from the trading book, which leads
to a lower RWA and required capital.
Loan supply
By reducing the burden/risk on the trading book, the banks can then increase the loan supply and make a
profit out of the mortgage fee. The increase in loan supply will also lead to higher consumption and
economic growth.
Market share
We can see in Figure 3 that the Netherlands has a high securitization market share of 31% within Europe.
This can be explained through the Dutch national mortgage guarantee scheme, which results in a low
probability of default and a high credit rating. The Dutch mortgages are then assumed to be less risky in
comparison to other countries. This high market share can have a significant impact on financial market
when a lower credit rating of the country is obtained. The dependencies on the countries are then not well
distributed. As a result, a sudden increase on RWA is plausible.
Figure 3: Securitization Market Share Europe

33
4 Methodology: Balance Sheet Optimization Model
The purpose of this model is to give an insight of the effects of Basel III accord on the bank‟s balance
sheets return rate, risk appetite, stability and to support the strategy decisioning process within the banking
organization.
Linear programming will be used to optimize the balance sheet according to a waterfall structure. We will
estimate the annual balance sheet growth rate and optimize/allocate this growth over the financial post to
obtain the maximum ROE given the Basel III constrains.
The model contains the following components:
o A time component to phase in the capital and liquidity requirements.
o Input:
Annual growth in % for each sub balance post.
(Credit risk, market risk en operational risk)
Annual savings growth in %
Annual Liabilities growth rate in %
The credit allocation constrains per sub balance post (min-max)
Credit exposure by risk-weight
Credit exposure by maturity
Risk free rate by maturity
Spread rate by maturity
The risk appetite of investors (Tier1 Ratio)
The current balance/asset allocation
o Optimize:
Maximize Net Credit income
Constrains
Liquidity Coverage Ratio (LCR) > 100%
Net Stable Funding Ratio (NSFR) >100%
Phase out Unqualified Capital (10 year)
Implementation of Institution Bank Tax
Dynamic constrains
Minimum Core Tier 1 Capital
Minimum Common Equity Capital Ratio
Minimum Total Capital Ratio >8%
Capital Conservation Buffer
Asset to Liabilities ratio

34
o Output All 6 Solvability ratio
Common Equity Ratio & Capital
Tier 1 Ratio & Capital
Tier 2 Ratio & Capital
Total Tier Ratio & Capital
Liquidity Coverage Ratio
Net Stable Funding Ratio
Asset to Liabilities Ratio
Credit Exposure Allocation by Risk-Weight
Credit Exposure Allocation by Maturity
Income Rate by maturity Liabilities allocation by maturity
Optimal ROE
o The opportunity to change relevant parameters.
o Waterfall structure will be used to optimize the Balance Sheet annually according to the Basel III constrains.
The optimization model has been implemented in Excel (VBA). Before you can use this tool, the user has
to change the following settings within Excel.
- Activate the function „Solver‟ in excel (Excel options Add-Ins GoSolver-add in)
- Activate Solver VBA references in excel (alt+F11ToolsReferencesSolver)
The tool will work properly when these two requirements are satisfied. Due to the volatile financial
markets, the user has the possibility to change the input parameter manually each year to their preferences
or market circumstances to acquire a more accurate result.

35
4.1 Notations and Formulas
The mathematical methodology that is used in the optimization process can be divided in the following
section:
- Credit Income, the maximum total credit income by credit exposure allocation
- Credit Expense, the minimum total credit expense by liabilities exposure allocation
- Regulatory constrains, the Basel III regulations
The model will maximize the total net credit income by obtaining the optimal credit exposure allocation
and liabilities allocation while subjected to the Basel III constrains. The notations and formulas that are
used will be described in this section.
4.1.1 Credit Income
Total credit income
The total credit income is obtained by summing the income from the risky credit exposure and the
commission and management fee of the neutral derivatives exposure.
D
i j
ij IaTCI (3.1)
Net Income
The total expenses and tax deducted from total credit income.
)1(*)( TaxTETCI (3.2)
Income rate on Derivatives (Commission and Management Fee)
As a market maker, the banks hold a neutral position in derivatives by hedging the asset derivatives
with the liabilities derivatives. The income on derivatives is taken from the commission and
management fee. )(* ,2,7
5
1
jj
j
DD fdfeeI (3.3)
Return on Equity
The net income divided by the total asset minus total liabilities. Return on equity measures a
corporation‟s profitability by revealing how much profit a company generates with the money
shareholders invested.
i j
ij
n j
nj df
TaxTETCIROE
)1(*)( (3.4)

36
Credit exposure Income
The credit income represents the return rate on the credit exposure given the maturity and credit
exposure class.
ijaA
Other
ionIRBSecuritzat
Equity
IRBtail
SAtail
Corporate
nsInstitutio
Sovereign
i_Re
_Re
years
yearsyear
yearmonths
monthsmonth
month
j
5
51
13
31
1
jijijij mica ** (3.5)
Credit Exposure Allocation
The optimal credit exposure allocation divided in maturity and credit exposure class.
ijcC
Other
ionIRBSecuritzat
Equity
IRBtail
SAtail
Corporate
nsInstitutio
Sovereign
i_Re
_Re
years
yearsyear
yearmonths
monthsmonth
month
j
5
51
13
31
1
(3.6)
Credit Asset Allocation
The credit exposure can be divided in 6 assets category presented below.
jnfF ,
EquavalentCash
sOtherAsset
LABcedBanksLoansAdvan
LACrscedCustomeLoansAdvan
sDerivative
sInvestment
n
&
)(
)(
years
yearsyear
yearmonths
monthsmonth
month
j
5
51
13
31
1
(3.7)

37
Effective maturity
The effective maturity for the given interest rate.
jmM
years
yearsyear
yearmonths
monthsmonth
month
j
5
51
13
31
1
(3.8)
Income rate
The income rate of the banking book and trading book is calculated by summing up the standard
risk-free rate and the spread rate by risk weight for the given credit exposure. This will results in an
even distribution of income rate across the subjected risk exposure.
ijiI k
k
ik
ik
jij Serw
erwri *
Standard rate
The risk-free return rate of the credit exposure with 0% RW.
jrR
years
yearsyear
yearmonths
monthsmonth
month
j
5
51
13
31
1
(3.9)
Spread rate
Additional income rate given the risk weight.
ksS
075.0
05.0
04.0
03.0
02.0
01.0
0
S
%150
%100
%75
%50
%35
%20
%0
k
(3.10)

38
Credit Exposure by Risk Weight
The credit exposure divided by the risk weight.
ikerwERW
Other
ionIRBSecuritzat
Equity
IRBtail
SAtail
Corporate
nsInstitutio
Sovereign
i_Re
_Re
%150
%100
%75
%50
%35
%20
%0
k
(3.11)
4.1.2 Expenses
Total expenses
The total expenses are all the expenses that took place on a going concern basis of the bank year and
are obtained by summing the operational expenses, other expenses and credit expenses.
CreditOtherOperatinal BBBTE (3.12)
Operational expense
The operational expenses included salaries of its operating staff and in the allowance that has to be
made for the amount of capital required to sustain such operations.
lOperationaB
Other expense
The other expenses are all other cost which is not included in operational expense such as the cost
incurred as a result of contribution to the deposit guarantee system (default of DSB), expenses made
from provision on an offer to compensate investors for losses incurred on foreign investment funds.
OtherB

39
Credit exposure Income
The credit income represents the return rate on the credit exposure given the maturity and credit
exposure class.
(3.5)
Credit Exposure Allocation
The optimal credit exposure allocation divided in maturity and credit exposure class.
(3.6)
Credit Asset Allocation
The credit exposure can be divided in 6 assets category presented below.
(3.7)
ijaA
Other
ionIRBSecuritzat
Equity
IRBtail
SAtail
Corporate
nsInstitutio
Sovereign
i_Re
_Re
years
yearsyear
yearmonths
monthsmonth
month
j
5
51
13
31
1
jijijij mica **
ijcC
Other
ionIRBSecuritzat
Equity
IRBtail
SAtail
Corporate
nsInstitutio
Sovereign
i_Re
_Re
years
yearsyear
yearmonths
monthsmonth
month
j
5
51
13
31
1
jnfF ,
EquavalentCash
sOtherAsset
LABcedBanksLoansAdvan
LACrscedCustomeLoansAdvan
sDerivative
sInvestment
n
&
)(
)(
years
yearsyear
yearmonths
monthsmonth
month
j
5
51
13
31
1

40
Effective maturity
The effective maturity for the given interest rate.
(3.8)
Income rate
The income rate of the banking book and trading book is calculated by summing up the standard
risk-free rate and the spread rate by risk weight for the given credit exposure. This will result in an
even distribution of income rate across the subjected risk exposure.
Standard rate
The risk-free return rate of the credit exposure with 0% RW.
(3.9)
Spread rate
Additional income rate given the risk weight.
(3.10)
jmM
years
yearsyear
yearmonths
monthsmonth
month
j
5
51
13
31
1
ijiI k
k
ik
ik
jij Serw
erwri *
jrR
years
yearsyear
yearmonths
monthsmonth
month
j
5
51
13
31
1
ksS
075.0
05.0
04.0
03.0
02.0
01.0
0
S
%150
%100
%75
%50
%35
%20
%0
k

41
Credit Exposure by Risk Weight
The credit exposure divided by the risk weight.
(3.11)
4.1.3 Expenses
Total expenses
The total expenses are all the expenses that took place on a going concern basis of the bank year and
are obtained by summing the operational expenses, other expenses and credit expenses.
(3.12)
Operational expenses
The operational expenses include salaries of its operating staff and in the allowance that has to be
made for the amount of capital required to sustain such operations.
Other expense
The other expenses are all other costs which are not included in the operational expenses such as the
cost incurred as a result of contribution to the deposit guarantee system (default of DSB), expenses
made from provision on an offer to compensate investors for losses incurred on foreign investment
funds.
ikerwERW
Other
ionIRBSecuritzat
Equity
IRBtail
SAtail
Corporate
nsInstitutio
Sovereign
i_Re
_Re
%150
%100
%75
%50
%35
%20
%0
k
CreditOtherOperatinal BBBTE
lOperationaB
OtherB

42
Credit Expense
The credit expenses are the interest expenses of the liabilities that are used to finance the credit
assets. This interest expenses are divided in credit exposure class and maturity .
(3.13)
Credit Expense Allocation (Liabilities)
The optimal credit expenses allocation with liabilities class and maturity while subjected to
the Basel III constrains.
(3.14)
Credit Expense rate
The expense rate of the liabilities, which are used to finance the assets with liabilities class and
maturity .
(3.15)
i j
ijCredit bB
sDerivative
SubDebtcatesionCertifiParticipat
litiesOtherLiabi
tsBanksOtherAmoun
icatesDebtCertif
stsCustomerOtherAmoun
Savings
i
&
years
yearsyear
yearmonths
monthsmonth
month
j
5
51
13
31
1
jijijij medb **
i j
ijdD
sDerivative
SubDebtcatesionCertifiParticipat
litiesOtherLiabi
tsBanksOtherAmoun
icatesDebtCertif
stsCustomerOtherAmoun
Savings
i
&
years
yearsyear
yearmonths
monthsmonth
month
j
5
51
13
31
1
i
j
ijeE
sDerivative
SubDebtcatesionCertifiParticipat
litiesOtherLiabi
tsBanksOtherAmoun
icatesDebtCertif
stsCustomerOtherAmoun
Savings
i
&
years
yearsyear
yearmonths
monthsmonth
month
j
5
51
13
31
1

43
4.1.4 Constrains
Asset to liability ratio by maturity j
The asset to liability ratio represents the maturity gap between the Assets and the Liabilities. When
this ratio is close to 1, it represents a low liquidity risk due to a low maturity gap and a higher
liquidity risk when such ratio increases.
(3.16)
Common Equity Tier 1 Ratio (CET1)
The objective of Common Equity Tier 1 ratio is to ensure that there is enough high liquid capital to
ensure the existence of the financial institution on a going concern basis and to limit the risk of
shortfall of the creditors.
(3.17)
Tier 1 Ratio
The objective of Tier1 capital ratio is to ensure the existence of the financial institution on a going
concern basis and to limit the risk of a shortfall of the creditors. The objective of Tier 1 capital is
not to focus on insolvency.
(3.18)
Tier 2 Ratio
The objective of the Tier 2 capital ratio is to absorb losses on a “gone concern” basis. Tier 2 capital
is intended to improve the position of the depositors in case of the insolvency of the bank.
(3.19)
7
1
6
1
i
ij
n
nj
j
d
f
AL
8
1
5
1
1
i j
ijRWA
tyCommonEquiCET
8
1
5
1
11
i j
ijRWA
TierT
8
1
5
1
22
i j
ijRWA
TierT

44
Total Tier Ratio
The total tier ratio indicates the available assets to counter the risk exposure. The higher the ratio,
the healthier the bank is.
(3.20)
Total Annual Credit Exposure Growth
= Average Gross domestic Product growth [2%]
= Average Inflation [1%])
= Re-invested amount from profit (3.21)
The gross domestic product growth represents the total market value of all financial goods and
services produced in a country in a given year. By adding this with the national inflation, we have a
reliable estimation of the BS growth rate, which is then not subjected to loss on inflation and
competition.
The remaining profit after dividend payment can be divided in reserve and re-investment. The
reserve can be used to increase the available capital while the re-investment increases the credit
investment to acquire a higher return on the upcoming year.
Total Liabilities growth
The growth rate of the liabilities depends on the GDP rate and the average inflation to prevent
devaluation in time. The growth rate is identical to the standard growth rate of the assets to prevent
over leveraging.
(3.22)
Derivatives growth rate
The growth rate of derivatives is identical to the growth rate of the assets and liabilities.
(3.23)
Total annual savings growth rate
8
1
5
1
21
i j
ijRWA
TierTierTotalTier
InvestmenttttCredit ofitINGDPG Pr11,
tGDP
tIN
InvestmentofitPr
)1(*,1, tttsLiabilitietsLiabilitie INGDPGG
)1(*,1, tttDtD INGDPII
45
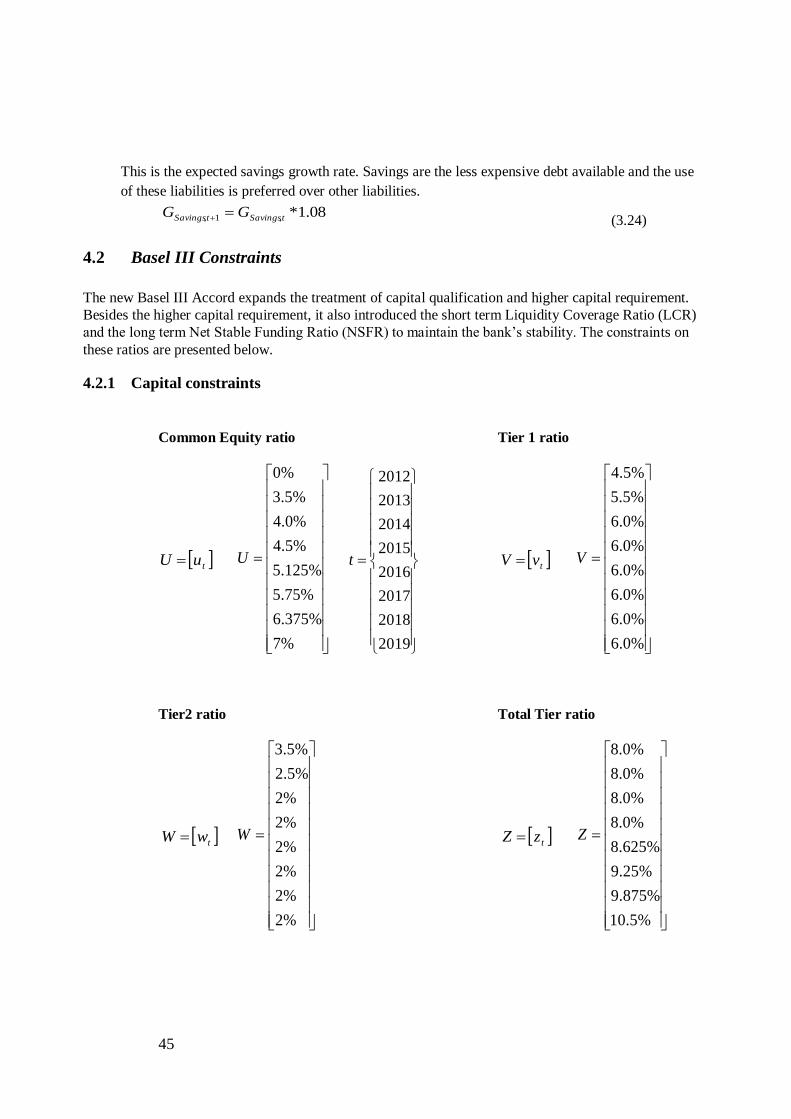
This is the expected savings growth rate. Savings are the less expensive debt available and the use
of these liabilities is preferred over other liabilities.
(3.24)
4.2 Basel III Constraints
The new Basel III Accord expands the treatment of capital qualification and higher capital requirement.
Besides the higher capital requirement, it also introduced the short term Liquidity Coverage Ratio (LCR)
and the long term Net Stable Funding Ratio (NSFR) to maintain the bank‟s stability. The constraints on
these ratios are presented below.
4.2.1 Capital constraints
Common Equity ratio Tier 1 ratio
Tier2 ratio Total Tier ratio
08.1*,1, tSavingstSavings GG
tuU
%7
%375.6
%75.5
%125.5
%5.4
%0.4
%5.3
%0
U
2019
2018
2017
2016
2015
2014
2013
2012
t tvV
%0.6
%0.6
%0.6
%0.6
%0.6
%0.6
%5.5
%5.4
V
twW
%2
%2
%2
%2
%2
%2
%5.2
%5.3
W tzZ
%5.10
%875.9
%25.9
%625.8
%0.8
%0.8
%0.8
%0.8
Z

46
4.2.2 Liquidity Coverage Ratio
The objective of LCR is to ensure that a bank maintains an adequate level of unencumbered, high quality
assets that can be converted into cash to meet its liquidity needs for a 30-day time horizon under an acute
liquidity stress scenario specified by supervisors. The stock of high quality liquid assets should enable the
bank to survive until day 30 of the proposed stress scenario. The net cumulative cash outflows for 30 days
into the future are used to determine the ratio of ≥100%. Banks are expected to meet this requirement
continuously and hold a stock of unencumbered, high quality assets as a defense against the potential
onset of severe liquidity stress. The formula to calculate the LCR is described below.
High Quality Liquid Assets
In order to qualify as a “high-quality liquid asset”, assets should be liquid in markets during a
time of stress. Assets are considered to be high quality liquid assets if they can be easily and
immediately converted into cash at little or no loss of value. The qualifying assets are divided in
level 1 assets with a 0% risk weight and level 2 assets with 20%-35% risk weight which is
subjected to a haircut.
Level 1
Cash = Cash
Central Bank Reserve = Reserve
Marketable Securities =
Level 2
Marketable Securities =
Institution & Covered Bond =
%100_
CICO
tsLiquidAsseyHighQualitLCR
k
kerw
erwc
,1
%0,1
1,1 *
hCCFcerw
erwc
k
k
1*** %401,7
,1
%20,1
1,1
herw
erwerwc
k
k
1**
,1
%35,3%20,3
1,3

47
Net Cash Outflow
Net cash outflows are defined as cumulative expected cash outflows minus cumulative expected cash
inflows arising in the specified stress scenario in the time period under consideration. This is the net
cumulative liquidity mismatch position under the stress scenario measured at the test horizon.
Cash Outflow (CO)
Stable Deposits =
Lest stable =
Small Business Customer =
Operational Relations =
Non-Financial Entities =
Unsecured Wholesale =
Cash Inflow (CI)
Investments =
Derivatives =
LAC =
LAB =
Other Assets =
Cap on total cash inflow
To prevent that the banks finance their LCR solely with cash inflow, a cap of 25 % on the Cash outflow
will be implemented when the cash inflow is higher than the cash outflow.
05.0** %751j
j DGSd
1.0*)1(* %751 j
j DGSd
075.0*1,2e
25.0*1,61,4 ee
75.0*1,3e
1*1,7e
111,1 ** PDInflowF
221,2 ** PDInflowF
331,3 ** PDInflowF
441,4 ** PDInflowF
551,5 ** PDInflowF
25.0*),(,25.0 COCICO
CO
CICOIf
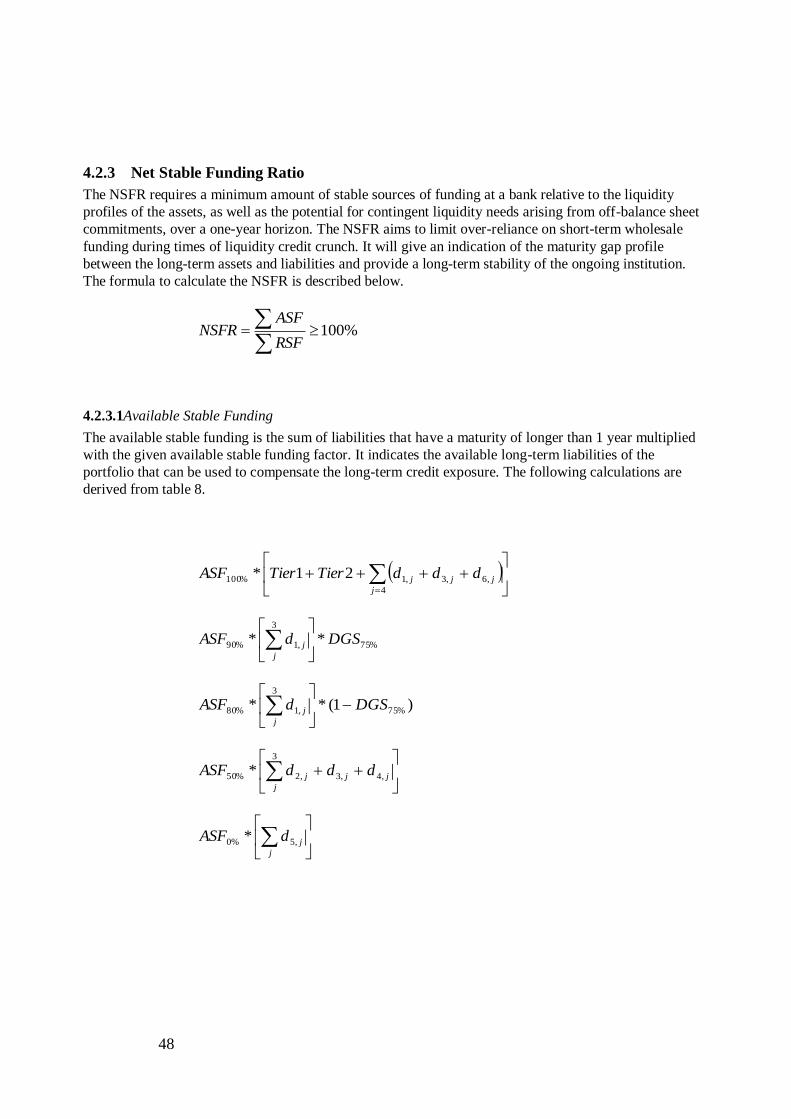
48
4.2.3 Net Stable Funding Ratio
The NSFR requires a minimum amount of stable sources of funding at a bank relative to the liquidity
profiles of the assets, as well as the potential for contingent liquidity needs arising from off-balance sheet
commitments, over a one-year horizon. The NSFR aims to limit over-reliance on short-term wholesale
funding during times of liquidity credit crunch. It will give an indication of the maturity gap profile
between the long-term assets and liabilities and provide a long-term stability of the ongoing institution.
The formula to calculate the NSFR is described below.
4.2.3.1Available Stable Funding
The available stable funding is the sum of liabilities that have a maturity of longer than 1 year multiplied
with the given available stable funding factor. It indicates the available long-term liabilities of the
portfolio that can be used to compensate the long-term credit exposure. The following calculations are
derived from table 8.
%100
RSF
ASFNSFR
4
,6,3,1%100 21*j
jjj dddTierTierASF
%75
3
,1%90 ** DGSdASFj
j
)1(** %75
3
,1%80 DGSdASFj
j
3
,4,3,2%50 *j
jjj dddASF
j
jdASF ,5%0 *

49
4.2.3.2Required Stable Funding
The required stable funding is the sum of credit assets that have a maturity of longer than 1 year multiplied
with the given Required Stable Funding factor. It indicates the long term exposure of the portfolio which
needs to be compensated with the available stable funding to provide a low maturity gap profile. The
following calculations are derived from table 9.
k
kerw
erwccRSF
,1
1,1
5,14,1%5 **
k
k
k
k erw
erwcc
erw
erwccRSF
,3
2,3
5,34,3
,1
2,1
5,14,1%20 ***
3
,7
3
,3,1%50 *j j
j
j
jj cccRSF
3 3
,5,4
,3
3,3
5,34,3%65 **j j
jj
k
k
ccerw
erwccRSF
4 4
,5
,5
3
,5
,4
,4
3
,4
%85 ***k k
k
j
j
j
j
k
j
j
j
j
erwc
c
erwc
c
RSF
j
j
j
j
j
j cccRSF ,8,6,2%100 *

50
4.3 Linear Programming Optimization
The optimization model has been implemented in Excel (VBA). Before you can use this tool, the user has
to change the following settings within Excel.
- Activate the function „Solver‟ in excel (Excel options Add-Ins GoSolver-add in)
- Activate Solver VBA references in excel (alt+F11ToolsReferencesSolver)
The tool will work properly when these 2 requirements are satisfied. Due to the fluctuations within the
financial markets, the user has the option to change the input parameter manually each year to their
preferences or market circumstances to acquire a more accurate result.
Maximize
(Total Net income)
Decision Variable
, , (Credit exposure & Liabilities allocation)
Constraints
,(Minimum Credit allocation constrains)
,(Maximum Credit allocation constrains)
,(Minimum Liabilities allocation constrains)
,(Maximum Liabilities allocation constrains)
(Asset liability ratio constrains)
(Savings growth constrains)
(Credit assets growth constrains)
(Credit liabilities growth constrains)
D
i j
jijijjijij Imedmca
8
1
5
1
ijc ijd 81 i 51 j
ijij cc min 81 i 51 j
ijij cc max 81 i 51 j
ijij dd min 81 i 51 j
ijij dd max 81 i 51 j
ij
i ij
ijdf
d
fmin
8
1
51 j
savings
j
t
j
j
j gdd *5
1
1
,1
5
1
,1
8
1
5
1
18
1
5
1
*i
assets
j
t
ij
i j
ij gdd
8
1
5
1
18
1
5
1
*i
liabilites
j
t
ij
i j
ij gff

51
(Common Equity Capital ratio constrains)
(Tier 1 Capital ratio constrains)
(Tier 2 Capital ratio constrains)
(Total Tier Capital ratio constrains)
(Asset to Liabilities ratio constrains)
(LCR ratio constrains)
(NSFR ratio constrains)
4.3.1 Capital & Ratio
Capital
Common Equity = Shareholders Equity + Retained Earnings
Tier 1 Capital = Core Tier 1 Capital + Other qualifying Tier 1 Capital
Securities
Tier 2 Capital = Undisclosed Reserves + Revaluation + Reserves +
General Provisions + Subordinated Term Debt
Total Capital = Tier1 Capital + Tier 2 Capital
Solvency Capital ratio
Core Tier 1 ratio = Core Tier 1 Capital / Risk Weighted Assets
Tier 1 ratio = Tier 1 Capital / Risk Weighted Assets
Total Capital ratio = Total Capital / Risk Weighted Assets
Asset to liabilities ratio= Asset / Liabilities
tt uCET 1
tt vT 1
tt wT 2
tt zTotalTier
jtjt qAL ,,
%100LCR
%100NSFR
52
5 Scenarios
In this chapter we will implement divers scenarios to analyze the effects of the new Basel III accord on the
BS. First we will analyze the impact of the LCR and NSFR ratio on the BS by changing the minimal LCR
and NSFR requirements. Second, we will stress test the BS by increasing the RWA of the credit portfolio,
which represents a depreciation of credit rating by the rating agencies. This event occurred in the recent
financial crisis, especially for the government bonds, which are assumed to be riskless and finally we will
implement an unexpected loss to analyze the impact of such scenario on the banking business of SNS
Bank. The input data that are used for the analysis are acquired from SNS Bank. The scenario‟s that are
used are presented below:
Scenarios 1, Effects of the NSFR and LCR on the BS
- Normal scenario subjected to all the Basel III requirements
- Normal scenario subjected to Basel III excluding NSFR and LCR
- Normal scenario subjected to Basel III + 2% annual growth on NSFR and LCR
Scenario 2, Stress testing
- Transfer 20% of total sovereign exposure to 20% RW + 20% increase in other credit RWA +
2% annual growth on NSFR and LCR
- Transfer 30% of total sovereign exposure to 20% RW + 30% increase in other credit RWA +
2% annual growth on NSFR and LCR
- Transfer 40% of total sovereign exposure to 20% RW + 40% increase in other credit RWA +
2% annual growth on NSFR and LCR
Scenario 3, Stress testing unexpected loss
- Transfer 40% of total sovereign exposure to 20% RW + 40% increase in other credit RWA +
2% annual growth on NSFR and LCR + 600 million unexpected loss
5.1 Scenario 1 (Effects of the NSFR and LCR on the BS)
We will compare three different scenarios to analyze the effects of the LCR and NSFR on the BS. First we
will implement a normal scenario subjected to all the Basel III requirements. Secondly, we will increase
the minimal requirements of the two ratios and finally we will exclude the two ratios.
All the scenarios use the following input parameters to analyze the Basel III effect on the balance sheet.
It‟s a scenario based on the normal circumstances of the financial market without downgrade of credit
exposure by rating agencies or other unexpected events.
- Annual credit risk exposure growth of 3% + reinvested profit (50% retained earnings)
- Annual Liabilities growth rate identical to Asset growth rate
- Annual Savings growth rate 8%
- Annual growth rate of 3% on the RWA of market risk, operational risk and other risk.
- Annual growth rate of 3% on operational expense
- Dividend Pay-Out ratio 50%
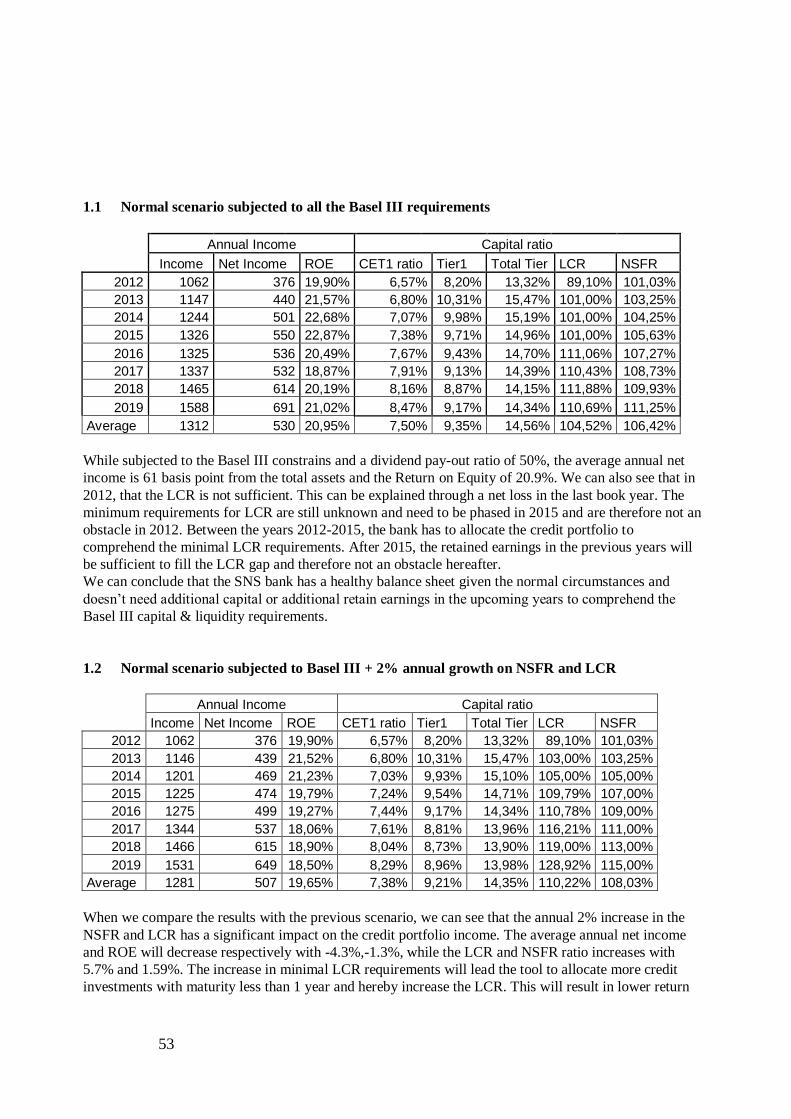
53
1.1 Normal scenario subjected to all the Basel III requirements
Annual Income Capital ratio
Income Net Income ROE CET1 ratio Tier1 Total Tier LCR NSFR
2012 1062 376 19,90% 6,57% 8,20% 13,32% 89,10% 101,03%
2013 1147 440 21,57% 6,80% 10,31% 15,47% 101,00% 103,25%
2014 1244 501 22,68% 7,07% 9,98% 15,19% 101,00% 104,25%
2015 1326 550 22,87% 7,38% 9,71% 14,96% 101,00% 105,63%
2016 1325 536 20,49% 7,67% 9,43% 14,70% 111,06% 107,27%
2017 1337 532 18,87% 7,91% 9,13% 14,39% 110,43% 108,73%
2018 1465 614 20,19% 8,16% 8,87% 14,15% 111,88% 109,93%
2019 1588 691 21,02% 8,47% 9,17% 14,34% 110,69% 111,25%
Average 1312 530 20,95% 7,50% 9,35% 14,56% 104,52% 106,42%
While subjected to the Basel III constrains and a dividend pay-out ratio of 50%, the average annual net
income is 61 basis point from the total assets and the Return on Equity of 20.9%. We can also see that in
2012, that the LCR is not sufficient. This can be explained through a net loss in the last book year. The
minimum requirements for LCR are still unknown and need to be phased in 2015 and are therefore not an
obstacle in 2012. Between the years 2012-2015, the bank has to allocate the credit portfolio to
comprehend the minimal LCR requirements. After 2015, the retained earnings in the previous years will
be sufficient to fill the LCR gap and therefore not an obstacle hereafter.
We can conclude that the SNS bank has a healthy balance sheet given the normal circumstances and
doesn‟t need additional capital or additional retain earnings in the upcoming years to comprehend the
Basel III capital & liquidity requirements.
1.2 Normal scenario subjected to Basel III + 2% annual growth on NSFR and LCR
Annual Income Capital ratio
Income Net Income ROE CET1 ratio Tier1 Total Tier LCR NSFR
2012 1062 376 19,90% 6,57% 8,20% 13,32% 89,10% 101,03%
2013 1146 439 21,52% 6,80% 10,31% 15,47% 103,00% 103,25%
2014 1201 469 21,23% 7,03% 9,93% 15,10% 105,00% 105,00%
2015 1225 474 19,79% 7,24% 9,54% 14,71% 109,79% 107,00%
2016 1275 499 19,27% 7,44% 9,17% 14,34% 110,78% 109,00%
2017 1344 537 18,06% 7,61% 8,81% 13,96% 116,21% 111,00%
2018 1466 615 18,90% 8,04% 8,73% 13,90% 119,00% 113,00%
2019 1531 649 18,50% 8,29% 8,96% 13,98% 128,92% 115,00%
Average 1281 507 19,65% 7,38% 9,21% 14,35% 110,22% 108,03%
When we compare the results with the previous scenario, we can see that the annual 2% increase in the
NSFR and LCR has a significant impact on the credit portfolio income. The average annual net income
and ROE will decrease respectively with -4.3%,-1.3%, while the LCR and NSFR ratio increases with
5.7% and 1.59%. The increase in minimal LCR requirements will lead the tool to allocate more credit
investments with maturity less than 1 year and hereby increase the LCR. This will result in lower return

54
rate on the credit portfolio due to an investment with low maturity. Despite the lower total return rate of -
4.3%, the bank obtains a more liquid position and a higher credit worthiness. We can conclude that the
SNS bank doesn‟t need additional capital or additional retain earnings in the upcoming years to
comprehend the Basel III capital & liquidity requirements.
1.3 Normal scenario subjected to Basel III excluding NSFR and LCR
Annual Income Capital ratio
Income Net Income ROE CET1 ratio Tier1 Total Tier LCR NSFR
2012 1162 452 23,97% 6,86% 8,55% 13,90% 55,78% 98,59%
2013 1259 523 25,43% 7,13% 10,79% 16,14% 46,15% 100,46%
2014 1358 585 26,05% 7,51% 10,54% 15,95% 39,80% 101,34%
2015 1473 658 26,72% 7,91% 10,34% 15,80% 35,10% 102,30%
2016 1561 712 26,29% 8,35% 10,19% 15,70% 36,36% 103,05%
2017 1664 774 24,94% 8,78% 10,06% 15,59% 38,85% 103,87%
2018 1796 859 25,29% 9,25% 10,00% 15,56% 42,00% 104,94%
2019 1908 928 24,94% 9,76% 10,49% 15,91% 44,39% 106,31%
Average 1523 687 25,46% 8,19% 10,12% 15,57% 42,30% 102,61%
We will exclude the minimal requirements of the NSFR and LCR ratio to analyze the effects on the BS.
On average, the net income and ROE increases respectively with 29.5%, 4.61%, while the LCR decrease
with 13.5% compared with the scenario 1.1. The NSFR and all capital tier ratios remains sufficient while
the LCR has a gap of 58.7%. The LCR will have a high impact on the BS of SNS.
Conclusion (scenario 1)
We can conclude that under normal circumstances and a dividend payout ratio of 50%, the SNS bank has
sufficient potential to comprehend the new Basel III requirements and doesn‟t need to attract additional
funding or capital. The new requirements do have a significant impact on the net income and credit
portfolio allocation. Especially the LCR requirements, the SNS bank has a LCR gap of 45% in 2011. This
can be explained through a net loss of 300 million on the last book year and a distribution of 24.5% in
deposits with maturity less than 1 year.
According to the NSFR Basel III accord, stable deposits with deposit guarantee scheme acquire an ASF
factor of 90% and less stable deposits without deposit guarantee scheme an ASF factor of 80%. The total
available funding for the NSFR can primarily funded by the deposits with maturity higher than 1 year. The
NSFR is therefore not an obstacle for SNS due to the distribution of 75.5% in deposits with maturity
higher than 1 year.
As a result of the analysis, I would advise the SNS bank to attract more deposits with maturity less than 1
year to comprehend the LCR gap. (Deposits remain the cheapest funding)

55
5.2 Scenario 2 (Stress Testing)
During the financial crisis, many government bonds and other financial instruments obtained a lower
credit rating by the rating agencies, which resulted to a higher risk weight on the given instrument. By
implementing divers scenario on the BS optimization model, we will analyze the effects of the increase in
RW on the BS.
Due to the fact that 98% of Sovereign investment has an credit rating worthy of 0% risk weight, we will
transfer X % of total sovereign investment in to the category 20% risk weight to model an scenario where
the credit rating of government bonds depreciates. This scenario resembles the Greek financial crisis,
which occurred recently. The depreciation of a government credit rating will have a significant impact on
all other credit exposure. To analyze the effect of such event, we will also increase the RWA of other
credit exposure linearly with X %, and stress test the capital and liquidity risk on the balance sheet. The
results are presented below:
Transfer 20% of total sovereign exposure to 20% RW + 20% increase in other credit RWA + 2%
annual growth on NSFR and LCR
Annual Income Capital ratio
Income Net Income ROE CET1 ratio Tier1 Total Tier LCR NSFR
2012 1062 376 19,90% 5,52% 6,88% 11,18% 89,10% 101,03%
2013 1146 439 21,52% 5,71% 8,66% 12,99% 103,00% 103,25%
2014 1201 469 21,23% 5,90% 8,34% 12,68% 105,00% 105,00%
2015 1225 474 19,79% 6,08% 8,00% 12,34% 109,79% 107,00%
2016 1275 499 19,27% 6,24% 7,70% 12,04% 110,78% 109,00%
2017 1344 537 18,06% 6,39% 7,40% 11,72% 116,21% 111,00%
2018 1466 615 18,90% 6,75% 7,34% 11,68% 119,00% 113,00%
2019 1531 649 18,50% 7,04% 7,61% 11,82% 126,14% 115,00%
Average 1281 507 19,65% 6,21% 7,74% 12,06% 109,88% 108,03%
By transferring 20% of the sovereign investment to the category 20% RW, we will have an increase of
sovereign RWA of 20 times. When we compare the results with scenario 1.2, the capital ratios will be
reduced due to higher total RWA. Despite the higher total RWA, the tier ratio still remains sufficient and
increases steeply on the long run. On average, the CET1, Tier1, Total Tier, LCR and NSFR are reduced
respectively with -1.17%, -1.47%, 2.92%, 0.34% and 0%. The net income and ROE remains unchanged
which indicate that the credit portfolio has enough potential to comprehend this scenario and doesn‟t need
to attract additional funding or capital.

56
Transfer 30% of total sovereign exposure to 20% RW + 30% increase in other credit RWA + 2%
annual growth on NSFR and LCR
Annual Income Capital ratio
Income Net Income ROE CET1 ratio Tier1 Total Tier LCR NSFR
2012 1062 376 19,90% 5,11% 6,37% 10,35% 89,10% 101,03%
2013 1146 439 21,52% 5,29% 8,02% 12,03% 103,00% 103,25%
2014 1201 469 21,23% 5,47% 7,72% 11,74% 105,00% 105,00%
2015 1225 474 19,79% 5,62% 7,41% 11,43% 109,79% 107,00%
2016 1275 499 19,27% 5,78% 7,13% 11,14% 110,78% 109,00%
2017 1344 537 18,06% 5,92% 6,85% 10,85% 116,21% 111,00%
2018 1427 586 17,58% 6,43% 6,96% 10,97% 122,12% 113,00%
2019 1546 662 17,47% 7,17% 7,69% 11,61% 131,88% 115,10%
Average 1278 505 19,35% 5,85% 7,27% 11,27% 110,99% 108,05%
When we compare the results with scenario 1.2, the capital ratios will be reduced due to higher total
RWA. On average, the CET1, Tier1 and Total Tier are reduced respectively with -1.53%, -1.94%, -3.08%.
While the LCR and NSFR increases with 0.76% and 0.01%. The dividend payout ratio of 50% will not be
sufficient to comprehend the CET1 ratio in the year 2018. The gap in CET1 will be compensated by
decreasing the RWA of the total credit portfolio by credit allocation and lower dividend payout ratio to
40% (increase reserve). Between 2018-2019, the net income, ROE, dividend payout decreases respectively
with -3% (16 million), -0.3% and -3.3% (66 million). As a result, the total assets will be reduced with -
0.3% in the end of year 2019. Despite the lower net income and dividend payment, the SNS bank doesn‟t
need to attract additional funding or capital to comprehend the Basel III requirements.
Transfer 40% of total sovereign exposure to 20% RW + 40% increase in other credit RWA + 2%
annual growth on NSFR and LCR
Annual Income Capital ratio
Income Net Income ROE CET1 ratio Tier1 Total Tier LCR NSFR
2012 1062 376 19,90% 4,76% 5,93% 9,64% 89,10% 101,03%
2013 1146 439 21,52% 4,92% 7,47% 11,20% 103,00% 103,25%
2014 1201 469 21,23% 5,09% 7,19% 10,93% 105,00% 105,00%
2015 1225 474 19,79% 5,23% 6,90% 10,63% 109,79% 107,00%
2016 1275 499 19,27% 5,38% 6,63% 10,37% 110,78% 109,00%
2017 1330 532 18,01% 5,85% 6,72% 10,47% 114,80% 111,00%
2018 1425 586 16,86% 6,37% 6,88% 10,65% 137,93% 113,32%
2019 1514 638 17,13% 7,00% 7,53% 11,46% 136,15% 115,00%
Average 1272 502 19,21% 5,58% 6,91% 10,67% 113,32% 108,07%
When we compare the results with scenario 1.2, the capital ratios will be reduced due to higher total
RWA. On average, the CET1, Tier1 and Total Tier are reduced respectively with -1.80%, -2.30%,- 3.68%.
While the LCR and NSFR increases with 3.09% and 0.04%. The dividend payout ratio of 50% will not be
sufficient to comprehend the CET1 ratio in the year 2017. The gap in CET1 will be compensated by
decreasing the RWA of the total credit portfolio by credit allocation and lower dividend payout ratio to
40% (increase reserve). Between 2017-2019, the net income, ROE and dividend payout decreases
respectively with -9% (45 million), -0.44% and -3.6%(73.5 million). As a result, the total asset decreases

57
with -0.3%. Despite the lower net income and dividend payment, the SNS bank doesn‟t need to attract
additional funding or capital to comprehend the Basel III requirements.
Conclusion (Scenario 2)
The depreciation of the credit rating on the given credit exposure has a minimal impact on the banking
business of SNS Bank. The acquired Tier capital in 2011 is enough to compensate the increase in RWA.
Although the dividend payout ratio of 50% is not sufficient for the CET1 in the year 2017, the bank
doesn‟t need additional capital or funding to comprehend the Basel III requirements.
5.3 Scenario 3 (Stress Testing with Unexpected Loss)
This scenario represents a more severe stress scenario where unexpected loss are obtained through default
or unexpected cost. We will add unexpected loss of 600 million in our model in the year 2012. The capital
and liquidity gap that arise from sudden loss during the crisis, will result in a default or downgrade by
rating agencies. We will use this scenario to stress test the capital and liquidity risk on the balance sheet.
The results are presented below:
Transfer 40% of total sovereign exposure to 20% RW + 40% increase in other credit RWA + 2%
annual growth on NSFR and LCR + 600 million unexpected loss
Annual Income Capital ratio
Income Net Income ROE CET1 ratio Tier1 Total Tier LCR NSFR
2012 1062 -95 -5,02% 4,71% 5,88% 9,55% 89,10% 101,03%
2013 1105 409 22,18% 4,37% 6,90% 10,60% 103,00% 103,00%
2014 1123 411 20,49% 4,51% 6,58% 10,29% 107,63% 105,00%
2015 1158 424 19,58% 4,64% 6,29% 10,00% 113,02% 107,00%
2016 1198 442 17,46% 5,26% 6,50% 10,21% 122,62% 109,00%
2017 1251 469 15,10% 5,84% 6,70% 10,40% 133,63% 111,00%
2018 1356 535 15,15% 6,45% 6,94% 10,65% 139,35% 113,00%
2019 1416 566 14,31% 7,00% 7,48% 11,08% 152,66% 115,56%
Average 1208 395 14,91% 5,35% 6,66% 10,35% 120,13% 108,07%
We can see that with an unexpected loss of 600 million in 2012, will result in a negative income of -95
million. Between the years 2012-2015, a dividend payout ratio of 50% is sufficient to comprehend the
CET1. But starting from 2016, a dividend payout ratio of 30% is needed to replenish the capital buffer. On
average, the annually net income, ROE, Dividend payment will reduce respectively with -22.1%, -4.74%
and -64.4%. The LCR and NSFR increase with 9.09% and 0.04%. To compensate the capital gap, the tool
will allocate more investment with low RW, which leads to a lower return rate. As a result, total asset
growth will hereby reduced with -0.65% in 2019. This scenario has a high impact on the credit worthiness
and return rate of the credit portfolio. Despite the lower net income and dividend payment, the SNS bank
doesn‟t need to attract additional funding or capital to comprehend the Basel III requirements.

58
6 Conclusion
6.1 SNS Bank
When we compare the 3 scenarios with each other, we can see that SNS Bank has a solvent balance sheet.
Under normal circumstances (scenario1), the bank will obtain a positive annual net income while
subjected to a dividend payment of 50%. Scenario 2 increases the RWA of the credit portfolio. This
scenario represents a decrease in credit rating by rating agencies. As a result, the RWA will increase, and
the Tier ratios will decrease. The increase in RWA will be compensated by decreasing the risk of the total
credit portfolio by credit allocation and lower dividend payment. This will lead to higher Tier ratios, but
also a lower return rate, which eventually lead to a lower net income. Scenario 3 represents a more severe
financial crisis with an unexpected loss of 600 million. The results of this scenario indicate that SNS bank
remains solvent but needs to withhold the dividend payment in the year 2016-2019. All the scenarios
indicate that the LCR is well capitalized far above the minimal requirements. This indicates that the LCR
doesn‟t have added value on the financial stability. NSFR ratio is not an obstacle for SNS bank due to the
distribution of 75.5% in deposits with maturity longer than 1 year. Although all Basel III are meet, the
SNS bank should attract more deposits with maturity less than 1 year to obtain a more evenly distribution
among the deposits. The credit portfolio can than increase the investment with higher maturity, which
provides a higher return rate. In the end, SNS bank remains solvent while subjected to the Basel III
constrains and doesn‟t need to attract additional capital or funding.
6.2 All Banks
Based on the Bank of International Settlement study, by 2019 the European industry will need about € 1.3
trillion of short-term liquidity, and about €2.3 trillion of long term funding. Assuming a 50 percent
retained earning payout ratio and nominal annual balance-sheet growth of 3 percent through 2019, the
short term liquidity requirements to €1.7 trillion, and long-term funding needs to about €3.4 trillion.
Closing these gaps will have a substantial impact on the banking business.
There are a number of additional interventions that the banks should consider to mitigate the capital gap:
- Reduce capital and liquidity inefficiency from suboptimal implementation of the new rules
- Balance Sheet restructuring to improve the quality of capital and reduce capital needs arising
from Basel III requirements
- Business model adjustments to create capital and liquidity efficient business models and
products and rethink the scope and even the viability of specific business lines.
These interventions will mitigate the capital gap up to 40% in the long transition period that Basel III
provides. The significant mitigation will divers for each banks, depending on their starting position and
competitive market dynamics.

59
Tier Capital
The magnitude of the short-term economic impact of Basel III is subjected to many uncertain factors.
Basel III is expected to generate substantial benefits by reducing the frequency and intensity of banking
crises. To comprehend the new regulations, the cost of increasing capital ratios may lead banks to raise
their lending rates and reduce lending. The effect of such scenario will have a significant impact on the
economic growth. We can divide the impact in 2 Channels. The first channel, which is referred as the
„Trade Flow Channel,‟ acts through lower economic activity and lower import activity which depends on
trade income elasticity. The second channel, which is referred as „financial flows channel,‟ acts through
higher interest rates and the decline in bank flows from advanced economies, which depend on interest
rate differentials and global risk. Both channels will have a significant impact on the economic growth by
lowering consumption, investment and export/import.
LCR
The new LCR ratios introduced by Basel III are not an obstacle on the banks core business when they
satisfy the new Tier Capital constrains. The build-up minimal Basel III capital requirements are enough to
comprehend the short-term liquidity requirements (LCR). This ratio won‟t have a significant impact on the
long run when the minimal CET1 requirement has been met. Beside the build-up capital, this ratio can
also be solved in the money market by short-term funding. Although this is a more expensive way to
finance the funding, it remains a stable solution to comprehend the gap in the phase in period.
NSFR
The long-term liquidity requirements (NSFR) will have significant impact on the banking sector. Within
the banking business, banks prefer loans with long-horizon and financing it with short-horizon to obtain a
higher return rate on loans and a lower financing expense rate. The NSFR will lower the maturity gap and
increase long-term stability. This will have impact on the net income when banks don‟t have enough long
term funding. The banks are then forced to allocate more investments with lower maturity and return rate.
According to the NSFR Basel III accord, stable deposits with deposit guarantee scheme acquire an ASF
factor of 90% and less stable deposits without deposit guarantee scheme an ASF factor of 80%. The total
available funding for the NSFR can primarily funded by the deposits with maturity higher than 1 year.
Therefore banks should attract more deposits with maturity longer than 1 year. This ratio will have a
significant impact on the bank‟s core business.
Short-Term Impact
The new Basel III accord will have a significant impact on the banks core business. Especially the
strengthened qualification of Tier capital/ratio and NSFR will have a significant short-term effect. The
cost of increasing capital and ratio may lead banks to raise the lending rates and reduce lending. The
growth of the BS and net income will be affected during the transition period of Basel III.

60
Long-Term Impact
In the long horizon, banks are then more capitalized and should at least in principle become safer and
therefore, the cost of funding could decrease as a consequence of higher capital levels. The OECD study
shows that a -1.4% drop in required return on bank equity would be enough to offset the impact on the
overall bank funding cost of 1% increase in bank capital. Considering the actual Basel III capital
requirements, their impact on bank funding costs could be neutralized by a fall in the required return on
equity. The funding cost would then reduce as banks become better capitalized by acquiring a higher
credit rating. The depreciation of net income in the transition period will then be compensated. Overall,
it‟s likely that banks will be able to offset Basel III impact on profitability on the long run.

61

62

63
7 References
[1] Gavin Kretzschmar and Alexander J. McNeil (2010), “ Integrated models of capital adequacy -
Why banks are undercapitalized” , Journal of Banking & Finance 34 pg. 2838-2850
[2] Lydian Merna, Ruud H. Koning and Rober Lensink (2009).”A practical approach to validating a
PD model”, Journal of Banking & Finance 33 pg.701-708
[3] Samuel K. Alexander (2001), ”Why banks hold capital in excess of regulatory requirements: The
role of market discipline”, Journal of International Banking Regulation 6 pg. 6-9
[4] Samuel Da-Rocha Lopes and Tiago Nunes (2010), “A simulation study on the impact of correlation
between LGD and EAD on loss calculations when diffrent LGD definitions are considered”, Journal
of Banking Regulations 11 pg. 156-167
[5] Bank of International Settlement Publications (2010), “Basel III Capital Framework : A decisive
breakthrough”
[6] Bank of International Settlement Publications (2010), “Basel III: Countercyclical capital buffer
proposal”
[7] Bank of International Settlement Publications (2010), “Basel III: A global regulatory framework for
resilient banks and banking systems
[8] Bank of International Settlement Publications (2010), “Basel III: International framework for
liquidity risk measurement, standards and monitoring”
[9] Bank of International Settlement Publications (2010), “Basel III: Developments in Modeling Risk
Aggregation”
[10] Bank of International Settlement Publications (2011), “Global systemically important banks:
Assessment methodology and additional loss absorbency requirements”
[11] Morrison Foerster (2010) “The New Global Minimum Capital Standards Under Basel III
[12] Financial Services Authority (2011): “Results of the fifth Quantitative Impact Study”
[13] OECD(2011),” Macroeconomic Impact of Basel III”
[14] Standard and Poor‟s (2010), “Risk-adjusted Capital Framework for Financial Institutions”
[15] SNS bank: Pillar III 2010: Capital adequacy and risk management
[16] Kaplan Schweser, Financial Risk Management (2009), “Capital & Liquidity Risk”
[17] Alexander J. McNeil, Rudiger Frey and Paul Embrechts (2005), “Quantitative risk management”
[18] Henk Tijms (2004), “Operational Analysis”

64