the impact of tax policy on economic growth, income
TRANSCRIPT

Southern Methodist University Southern Methodist University
SMU Scholar SMU Scholar
Business Law Research Business Law
7-2006
The Impact of Tax Policy on Economic Growth, Income The Impact of Tax Policy on Economic Growth, Income
Distribution, and Allocation of Taxes Distribution, and Allocation of Taxes
Robert Lawson Southern Methodist University, [email protected]
James Gwartney Florida State University
Follow this and additional works at: https://scholar.smu.edu/business_law_research
Part of the Taxation Commons
This document is brought to you for free and open access by the Business Law at SMU Scholar. It has been accepted for inclusion in Business Law Research by an authorized administrator of SMU Scholar. For more information, please visit http://digitalrepository.smu.edu.

THE IMPACT OF TAX POLICY ON ECONOMIC GROWTH, INCOME DISTRIBUTION, AND ALLOCATION OF TAXES
James Gwartney
Professor of Economics and Gus A. Stavros Eminent Scholar Chair Florida State University
Robert Lawson
Professor of Economics and George H. Moor Chair Capital University
1
THE IMPACT OF TAX POLICY ON ECONOMIC GROWTH, INCOME DISTRIBUTION, AND ALLOCATION OF TAXES
By James Gwartney and Robert Lawson
I. INTRODUCTION
There is considerable disagreement about how taxes, especially high marginal tax
rates on those with large incomes, influence economic performance and the distribution
of income. This paper uses data on marginal tax rates since 1980 for countries that have a
personal income tax to analyze this topic. Section II uses economic theory to analyze the
linkage between marginal tax rates and economic performance and considers a number of
factors that complicate the measurement of that impact. Section III presents country data
on the top marginal tax rates imposed during 1980-2002 and illustrates the reduction in
the highest marginal rates since 1985. Section IV analyzes the impact of high marginal
tax rates on economic growth and Section V focuses on how reductions in marginal tax
rates, particularly the highest rates, influence income inequality and the share of the
personal income tax paid by various income groups. The final section summarizes the
findings of this study.
II. MARGINAL TAX RATES AND ECONOMIC PERFORMANCE
From an economic viewpoint, marginal tax rates are considered particularly
important because they affect the incentive of individuals to earn additional income. As
marginal tax rates rise, individuals get to keep less and less of their additional earnings.

2
High marginal tax rates influence economic performance in at least three major
ways. First, high marginal rates discourage work effort. As taxes reduce the amount of
additional earnings that one is permitted to keep, individuals tend to work and earn less.
People will make this adjustment in various ways. Some, for example those with a
working spouse, may drop out of the labor force. Others will respond by working fewer
hours per week. Still others will decide to take more lengthy vacations, forgo overtime
opportunities, retire earlier, or forget about pursuing that promising but risky business
venture. In some cases, high tax rates will even drive highly productive citizens to other
countries where taxes are lower. For example, when the incomes of athletes, skilled
professionals, and business entrepreneurs are not country dependent, they often re-locate
from high to low tax countries.
Second, high marginal tax rates distort price signals and encourage individuals to
substitute less-desired but tax-deductible goods for non-deductible ones that are more-
desired. Goods and services may be tax-deductible as the result of either the design of the
tax structure or because they appear as a legitimate business expense. In both cases, the
personal costs of purchasing the deductible items will be lower than both society’s cost of
supplying the items and the cost of purchasing nondeductible goods of similar price.
The higher an individual’s effective marginal tax rate, the cheaper the personal cost of the
deductible item. This incentive structure will induce persons in high-tax brackets to spend
excessively on plush offices, professional conferences held in favorite vacation spots,
business entertainment, luxury cars used for business purposes, and numerous other
deductible items. Persons in high tax brackets will often purchase such items even when
they are valued less than their production costs. Scarce resources are wasted producing

3
goods that are not valued as much as other things that could have been produced instead.
As a result, living standards will fall short of their potential.
Third, high tax rates will reduce the incentive of people to invest in both physical
and human capital. When tax rates are high, foreign investors will look for other places to
put their money, and domestic investors will look for investment projects abroad where
taxes are lower. High marginal rates will also reduce the incentive to invest in education
and skill development. After all, high tax rates mean that investors in human capital, like
their physical capital counterparts, are unable to capture a substantial share of the returns
from their investment. Furthermore, domestic investors will direct more of their
investments into hobby businesses (like collecting antiques, raising horses, or giving golf
lessons) that may not earn much money but are enjoyable and have tax-shelter
advantages. This too, will divert resources away from projects with higher rates of return
but fewer tax-avoidance benefits. Again, scarce capital will be wasted and resources
channeled away from their most productive uses.
In summary, theory indicates that high marginal tax rates will reduce the supply
of both labor and capital, and adversely affect the efficiency of resource use. These
negative side effects are likely to be particularly strong when marginal tax rates are
exceedingly high. Thus, one would expect countries with high marginal tax rates to grow
less rapidly and fail to realize their full potential. Similarly, one would expect that
increases in marginal tax rates would be negatively related with economic growth. If
marginal tax rates are already high, the impact of rate increases is likely to be particularly
destructive.

4
While theory predicts that there will be a negative relationship between marginal
tax rates and the growth rate of an economy, it also suggests several factors that will
complicate measurement of the linkage. First, there is the difference between the short
run and long run response to a change in marginal rates. To the extent that an increase in
marginal tax rates reduces the supply of labor and capital, it will tend to slow the growth
of real GDP. But, these responses will take time and the short-run response may be a
misleading indicator of what will happen in the long run. Clearly, the labor supply
response will generally be smaller in the short run than in the long run. For example,
most people who have previously trained and developed skills for a career of market
work are likely to remain in the labor force even if higher marginal tax rates substantially
reduce the return from their prior investment. Thus, the short-run labor supply response
to a change in marginal tax rates is likely to be small. This is consistent with the
empirical findings. Most studies of this topic estimate that the elasticity of labor supply is
between 0.1 and 0.2.1 This implies that higher marginal tax rates that reduced wages by
10 percent would reduce the quantity of labor supplied by between 1 percent and 2
percent.
In the long run, however, the labor supply response will be larger, perhaps
substantially larger.2 As a result of the high marginal rates, future labor force participants
have less incentive to invest and acquire the education and training required for high-
paying jobs, particularly if those jobs are stressful and difficult to perform. In contrast,
people have more incentive to prepare for jobs that are interesting and provide substantial
non pecuniary, and therefore untaxed, benefits. With time, adjustments of this type will
tend to reduce the quality and productivity of the labor force by larger and larger

5
amounts. But they are likely to take a decade or more and, as a result, a lengthy time
period will pass before the full labor supply response will be observed. Thus, when
seeking to isolate the impact of changes in marginal tax rates, it is important to analyze
their impact on growth over periods of a decade or more.
Second, GDP figures will often fail to register the negative impact of the price
distortions accompanying high marginal tax rates. GDP registers the expenditures and
costs of the goods and services produced even if that exceeds the value derived by the
consumer. If taxpayers purchase deductible items that they value less than their cost
because their personal cost is low, the full costs of such items will nonetheless be added
to GDP. For example, if a taxpayer in a 60 percent marginal tax bracket purchases a
$50,000 automobile even though he or she values the car at only $25,000, the purchase of
the car will nonetheless add $50,000 to GDP. Because GDP records the costs of
production rather than the value to the consumer, both GDP and its growth rate will
understate the adverse side effects of high marginal tax rates.
Third, the linkage between marginal tax rates and GDP growth may also be
weakened by the pattern of government expenditures. Several countries impose high
marginal tax rates in order to derive revenues that are utilized to subsidize child care
services, retirement benefits and payments to persons not working. Suppose that a
country increases its marginal tax rates in order to subsidize child care services for
working-age parents. While the higher marginal tax rates tend to reduce labor supply,
subsidies for childcare services act as an offsetting factor by making it less costly for
adults with children to engage in market work. The net effect on labor supply is likely to
be small. Further, the policy change will increase the share of childcare services provided

6
by the government (and market suppliers) relative to the share supplied within the
household sector. Because the former adds to GDP but the latter does not, the higher
taxes that subsidize and provide child care services may actually increase income as
measured by GDP.
Alternatively, suppose that taxes are increased in order to provide more generous
benefits to retirees and/or unemployed workers. The more generous retirement benefits
would encourage more workers to retire earlier and the more generous unemployment
benefits would lead to more lengthy periods of job search and higher rates of
unemployment. Both of these expenditures would tend to reduce the effective supply of
labor and thereby reinforce the impact of the higher marginal tax rates. In contrast with
the expenditures on childcare services, these expenditures would tend to amplify the
negative relationship between higher marginal tax rates and the quantity of labor
supplied. Thus, variations in the pattern of expenditures accompanying differences in
marginal tax rates will also influence both labor supply and the expected impact on the
growth rate of income as measured by real GDP.
The impact of marginal tax rates will be greatest in the highest tax brackets. It is
in the high tax brackets where changes in tax rates will exert their largest affects on both
labor supply and tax avoidance activities. Furthermore, as the Laffer curve analysis
indicates, marginal tax rates can be pushed so high that they will actually reduce the
revenues derived from the tax. Obviously, marginal tax rates above the revenue
maximum level are highly inefficient. They reduce both aggregate output and the revenue
derived by the government. But tax rates near the revenue maximum point are also
extremely inefficient. As rates are increased toward the revenue maximum point, the

7
higher tax rates will squeeze out substantial amounts of economic activity relative to the
additional revenue generated. Thus, measured in terms of lost output, these additional
revenues are very costly. Because the most severe side effects of taxes will be exerted by
the highest marginal rates, our empirical analysis will focus on these rates.
III. MARGINAL TAX RATES, 1980-2002
We have collected data for seventy-seven countries that levied a personal income
tax throughout 1980-2002.3 As Table 1 shows, there has been a dramatic change in the
top marginal tax rate levied by these countries during the last two decades. The average
top marginal tax rate in 1980 was 61.3 percent, and the parallel figure in 1985 was only
slightly lower. But, the average top rate declined to 48.5 percent in 1990 and to 40.8
percent in 1995. Thus, the average top marginal tax rate among the seventy-seven
countries declined by almost 20 percentage points between 1985 and 1995. And the trend
has continued; the average top rate receded to 37.1 percent in 2002. The median top
marginal tax rate followed a similar path.
High marginal tax rates will exert less impact on economic performance if they
apply only at extremely high levels of income. In order to consider the potential
importance of this factor, the rating matrix used in the Economic Freedom of the World
(EFW) index was used to adjust for the income level at which the top rate initially
applies.4 This matrix assigns ratings on a zero-to-ten scale based on both the top marginal
tax rate and the level of income at which it initially takes affect. Countries with the
lowest marginal tax rates are assigned the highest ratings, while countries with high top

8
marginal tax rates that take affect at low levels of income are rated the lowest. This
matrix showing the zero-to-ten ratings for the various top marginal tax rate and income
level categories is presented in Appendix Table A1. Appendix Table A2 presents both
the top marginal income tax rate and the rating for the 77 countries of our study for
various years during 1980-2002.
While many countries have reduced their top marginal rates substantially, some
countries have maintained persistently high rates throughout the 1980s and 1990s. Table
2 presents the list of 14 countries with top marginal income tax rates of 50 percent or
more throughout 1980-1995. Italy, Sweden, Belgium, Denmark, and Japan head this list
of persistently high tax countries. On average, the top marginal tax rate of these countries
exceeded 60 percent during 1980-1995.
In some countries, payroll taxes are levied either at all levels of income or at
income levels that are well above the tax bracket where the top marginal rate begins to
apply. When this is the case, the payroll tax rate will increase the top marginal rate
applicable to earnings. In some cases, the increase in the top marginal rate is substantial.
Since 1990, we have been able to calculate a top marginal tax rate that includes the
payroll tax as well as the personal income tax. These figures are included in Table A3 of
the Appendix.
Table 3 indicates countries during 1990-2000 with high and low marginal tax
rates based on the inclusion of both the personal income and payroll tax. Once the
payroll tax was integrated into the calculation, there were nine countries with top
marginal tax rates of 60 percent or more throughout the 1990-2000 period. At the other

9
end of the spectrum, there were 13 countries with top marginal rates (including the
payroll tax) of 40 percent or less throughout the 1990s.
IV. TOP MARGINAL TAX RATES AND ECONOMIC GROWTH
The dramatic changes in the highest marginal tax rates during the last two decades
provide something like a natural experiment. The top marginal rates in some countries
remained at high levels—50 percent or more—throughout the 1980s and most of the
1990s. Other countries had top marginal rates that were substantially lower in the 1990s
than the 1980s. Was there any difference in the economic performance of the two
groups? How did the growth rates of the countries that sharply reduced their top rates
compare with the growth of those that maintained high rates? This section will address
these questions.
A. Economic Growth of the High Versus Low Tax Countries: 1990s
How did the high tax countries during the 1990s perform relative to those with
low tax rates? As Table 4 shows, the nine countries with top marginal tax rates
(including the payroll tax) of 60 percent or more during the 1990s grew at an average
annual rate of 0.38 percent during 1990-2002, down from 1.35 percent during the 1980s.
Denmark's growth rate of 1.86 percent was the highest among those in the high-tax
group. Eight of the nine high tax countries, again Denmark was the exception, grew more
slowly during 1990-2002 than during the 1980s.
On the other hand, the 13 countries with a top marginal income tax rate of 40
percent or less (including the payroll tax) grew at an average annual rate of 2.08 percent

10
during 1990-2002, up from 1.58 percent during the 1980s. Thus, the average growth rate
of the low-tax group during 1990-2002 was 1.7 percentage points higher than the average
for the high tax group. Further, while the average growth rate of the high-tax countries
was approximately 1 percentage point lower in 1990-2002 than in the 1980s, the growth
rate of the low tax group was a half of a percentage point higher during the latter period.
Table 5 uses regression analysis to investigate the linkage between the level of tax
rates and growth for all of the 77 countries. The dependent variable is the growth rate of
per capita GDP during 1990-2002. Growth of per capita GDP during the 1980s is
incorporated as an independent control variable. This variable should capture many of
the important institutional and cultural factors that influence cross-country differences in
long-term growth. Put another way, factors like political stability, an even-handed legal
system, a well-educated and highly skilled labor force, and sound monetary, financial and
trade institutions that resulted in strong growth during the 1980s are also likely to exert a
positive impact on growth during the 1990s. Correspondingly, institutional and cultural
factors that resulted in weak growth during the 1980s will also tend to retard growth
during the 1990s.5 The findings are supportive of this view. The coefficient for the
growth rate during the 1980s was positive and significant in a statistical sense (t-ratios
near 7.0 in all of the regression equations).
The average of the top marginal tax rate during 1990-1995 is also incorporated as
an independent variable. In Equation 1, the marginal tax rate variable has a negative
sign.6 This indicates that after controlling for growth during the 1980s, countries with
higher top marginal tax rates during the 1990s grew less rapidly than those with lower top
rates. In Equation 2, per capita GDP at the beginning of the period (i.e. 1990) is added to

11
the model. After inclusion of the initial per capita income variable, the marginal tax rate
variable drops slightly outside of the usual acceptable range for statistical significance.
The models represented by Equations 3 and 4 are parallel to those of Equations 1
and 2 except that the EFW top tax rating, which also incorporates the income level at
which the top marginal rate applies, is used rather than the marginal tax rate itself. The
rating variable is a more refined measure, and because the higher ratings are indicative of
lower marginal tax rates (and initial application of high marginal rates at higher levels of
income), the expected sign of this variable is positive. As Equations 3 and 4 show, the
EFW marginal tax rating coefficient is positive. A one point increase in the rating
variable scale is associated with a five percentage point increase in the marginal tax rate,
holding constant the income level at which the top rate initially applies. (See Appendix,
Table A1). Thus, the 0.15 coefficient on the rating variable in Equations 3 and 4 indicates
that a ten percentage point lower top marginal tax rate is associated with approximately
three-tenths of a percentage point change in long-term growth. These findings suggest
that countries with persistently high marginal tax rates pay a price in terms of a slower
rate of long-term growth.
B. Economic Growth and Changes in Top Marginal Tax Rates.
As Table 1 shows, the average top marginal income tax rate among the 77
countries declined sharply between 1985 and 1995. This reflects the fact that many
countries made substantial reductions in their top rate during this period. Table 6 provides
a list of the countries that reduced their top marginal rate by 25 percentage points or more
between 1985 and 1995. This is a diverse list that includes countries from all regions of
the world. It includes low-income developing countries such as Tanzania, Zambia, and

12
Bangladesh as well as high-income industrial countries like New Zealand and Sweden. In
some cases, the economies of the tax cutters had high growth rates prior to 1985.
Botswana and Thailand provide examples. In other cases, like Peru, Ecuador, and Ghana,
the top rates were slashed against a backdrop of dismal economic performance.
If marginal tax rates impact growth, countries that reduce their marginal rates
should grow more rapidly than those that do not. Table 7 uses regression analysis to
investigate this issue. Once again, the dependent variable is the annual growth rate of per
capita real GDP during 1990-2002. As in Table 5, the growth rate of real GDP during the
1980s is incorporated as an independent variable in order to adjust for cross-country
differences in institutional and cultural factors that influence long-term growth. As
expected, this variable is significant and positively related to growth during 1990-2002.
In Equations 1 through 3, the change in the top marginal tax rate (measured in
percentage points) between 1985 and 1990 and between 1990 and 1995 is incorporated as
a measure of change in the top marginal tax rate. Equation 1 includes only the two
change-in-tax-rate variables along with the growth rate during the 1980’s in the model.
Equation 2 adds the per capita GDP at the beginning of the period (1990). Equation 3
adds the initial top marginal tax rate (1985). The coefficients for both of the changes in
marginal tax rate variables were negative, and the impact of the change in the top
marginal rate between 1985 and 1990 was quite similar to the impact of the change in the
top rate between 1990 and 1995. This is consistent with the view that a reduction in the
highest marginal rates will influence growth over a lengthy time period. Equation 3
indicates that, holding the other variables of the model constant, a 10 percentage point
reduction in the top marginal rate is associated with approximately a 0.5 percentage point

13
increase in long-term growth. The R-squared implies that the model represented by
Equation 3 accounts for 40 percent of the variation in the growth rate of GDP among the
77 countries during 1990-2002.
Equations 4, 5, and 6 are similar to those of Equations 1 through 3 except that the
marginal tax EFW rating is substituted for the top marginal rates in the case of both the
change variables and the initial (1985) top marginal tax rate. In the more comprehensive
model (Equation 6), a one-unit increase in the rating between 1985 and 1990 enhances
growth during the 1990s by 0.241 percentage points. A unit increase in the rating
between 1990 and 1995 is associated with a 0.304 percentage point increase in growth
during 1990-2002. This implies that a 10 percentage point reduction in marginal tax rates
increases the annual growth rate of an economy by approximately 0.5 to 0.6 percentage
points. The model represented by Equation 6 accounts for 43.7 percent of the GDP per
capita variation among the 77 countries.
These findings are consistent with the view that reductions in marginal tax rates,
particularly rates that are exceedingly high, influence the growth rate of an economy. Of
course, they are subject to the usual limitations accompanying cross-country regression
analysis, particularly bias emanating from an inability to control for other factors
influencing growth. To the extent that countries reducing their marginal rates between
1985 and 1995 were more likely to adopt other growth enhancing reforms than the non-
tax cutters, the estimates presented here will overstate the impact of the changes in the
top tax rates. But, there are also biases in the opposite direction. As we discussed above,
real GDP (and its growth rate) will fail to register several of the negative side effects
accompanying high marginal tax rates. This is particularly true of those associated with

14
price distortions and tax avoidance activities. Because the estimates presented here use
the growth figures for real GDP as a measure of the negative side effects of high marginal
rates, they will fail to capture fully the distorting effects of high marginal rates. This
factor means that the estimates presented here will understate the negative impact of the
high marginal rates.
V. MARGINAL TAX RATES, INCOME INEQUALITY, AND TAX PAYMENTS
A. Theoretical Considerations
Most tax cuts are more or less across-the-board because, from a political
viewpoint, the lower rates will have to be cut in order to make the cuts in the top brackets
politically feasible. Thus, it is important to understand that across-the-board cuts in
marginal tax rates will have different incentive effects up and down the income
distribution. Suppose that a government with progressive income tax rates ranging from
a low of 15 percent to a high of 75 percent reduced tax rates across the board by one-
third. The top tax rate would then fall from 75 percent to 50 percent. After the tax cut,
taxpayers in the highest tax bracket who earn an additional $100 would get to keep $50
rather than only $25, a 100 percent increase in the incentive to earn additional income.
Predictably, these taxpayers will have a strong incentive to earn more taxable income
after the rate reduction, and the revenues collected from them will decline by
substantially less than a third. In fact, given the huge increase in their incentive to earn,
the revenues collected from taxpayers confronting such high marginal rates may actually
increase, an outcome suggested by the Laffer Curve.

15
Meanwhile, the same 33 percent rate reduction will only cut the bottom tax rate
from 15 percent to 10 percent. In this range, the tax cut means that an additional $100 in
gross pay increases take-home pay by $90 instead of $85, a 5.9 percent increase in the
incentive to earn additional income. Because cutting the 15 percent rate to 10 percent
exerts only a small effect on the incentive to earn in the lower tax (and lower income)
brackets, the incomes of persons in these marginal tax brackets will be largely
unchanged. Thus, the taxable income base of persons in the lower tax brackets will not be
altered much by the tax cut. Therefore, in contrast with the situation in high tax brackets,
tax revenue will decline by almost the same percent as tax rates in the lowest tax
brackets.
The bottom line is that when all rates are cut by approximately the same
percentage, the increase in the incentive to earn will be greatest in the upper tax (and
income) brackets. There will be two major side effects of this change in incentive
structure. First, income inequality will increase. Predictably, the incomes of those in the
high tax brackets will expand by a larger amount than those in the lower tax brackets.
Some of this increase in income will reflect a decline in tax avoidance activities and some
of it will reflect the substitution of work for leisure. Both will show up as an increase in
the observed income of persons in the upper tax and upper income brackets.
Second, a larger share of the income tax will be paid by high-income taxpayers.
Because the tax cut will increase the incentive to earn more in high than low income
brackets, taxable income will expand more and the taxes paid will decline less in the
upper income brackets. When the top marginal rates are extremely high, taxes collected

16
from the high-income taxpayers may even increase. But even if this is not the case, a
larger share of the income tax will still be collected from those with high incomes.
B. Marginal Tax Rates and the Distribution of Income: Empirical Evidence
If our analysis is correct, even across-the-board rate reductions will lead to an
increase in income inequality. If the rate reductions are greater in the high tax brackets
than in the lower brackets, the expected increase in income inequality will be even
greater. Thus, countries that reduce their highest rates by substantial amounts should
experience increases in income inequality. Reliable data on the distribution of income
are unavailable for many of the 77 countries that comprise the central data base of this
study. Furthermore, even when income distribution data are available, there are often
serious problems with comparability across countries.7 Therefore, we are unable to use
regression analysis to undertake a detailed statistical analysis of this issue.
Comparable data are available for the United States both before and after the
major personal income tax cuts that have occurred since 1960. Data are also available for
other countries, including several that reduced their rates substantially during a 1985-
1995 period. These data can be compared with data from countries that have persistently
maintained high marginal tax rates. These comparisons will shed light on the relationship
between high marginal tax rates and income inequality.
We will begin by looking at the data for the United States. The personal income
tax is the largest single source of revenue for the federal government of the United States.
The rate structure of the income tax is progressive; taxpayers with larger incomes face
higher tax rates. However, the structure of the rates has changed substantially since 1960.
In the early 1960s, there were 24 marginal tax brackets ranging from a low of 20 percent

17
to a high of 91 percent. The Kennedy-Johnson tax cut was roughly an across the board
proportional rate reduction. The 91 percent top rate was sliced to 70 percent and the 20
percent rate was cut to 14 percent. In 1981, the first tax cut of the Reagan years reduced
the top rate from 70 percent to 50 percent and the lowest rate was cut from 14 percent to
10 percent. The second Reagan tax cut sliced the top marginal rate to approximately 30
percent beginning in 1988. The top rate was increased to 33 percent in 1991 and two
years later it was increased again to 39.6 percent, but the tax reductions during the
administration of George W. Bush rolled the top rate back to 35 percent. Thus, since the
late 1980s, Americans with the highest incomes have paid sharply lower top marginal tax
rates -- rates in the 30 to 40 percent range compared to top rates of 91 percent in the early
1960s and 70 percent prior to 1981.
What has happened to the distribution of income in the United States? Table 8
provides income distribution data for the U.S. since 1970 and distributional data after
taxes (and after taxes and transfers) since 1980. These data highlight two important
points. First, taxes and transfers reduce the degree of income inequality. In 2001, the
before-tax income share of the top quintile was approximately 14 times that of the bottom
quintile. After taxes, the ratio of the income share of the top to bottom quintile was
approximately ten.
Second, income inequality in the United States has increased and most of that
increase has taken place since 1980. Between 1970 and 1980, there was little change in
the before tax distribution of income. In fact, the income share of the bottom quintile rose
slightly (from 4.1 percent in 1970 to 4.3 percent in 1980), while the share of the top 5
percent of earners declined (from 16.6 percent to 15.8 percent) during the decade. Since

18
1980, however, the situation has been dramatically different. The income share of the
bottom quintile fell from 4.3 percent in 1980 to 3.5 percent in 2001. Over the same time
period, the income share of the top quintile of earners rose from 43.7 percent to 50.1
percent, an increase of 6.4 percentage points. Furthermore, the increase in the income
share of the top group was entirely the result of the higher incomes registered by the top 5
percent of earners. Between 1980 and 2001, the income share of the top 5 percent rose
from 15.8 percent to 22.4 percent, an increase of 6.6 percentage points. This increase
more than accounts for the larger income share of the top quintile.
The changes in the distribution of income after taxes and after taxes and transfers
followed a similar path. In both cases, the income share of the bottom quintile declined
during the 1980s and 1990s, and the share of the top quintile rose during both decades.
Again, the growth of income among the top 5 percent of earners accounted for almost all
of the increase in the after-tax income share of the top quintile. (Note: data on the income
share of the top 5 percent after taxes and transfers were unavailable.)
The increase in income inequality in the U.S. may have other contributing causes.
Other researchers have argued that increased trade openness and/or demographic
changes, particularly the increase in the number of both single-parent and duel-earner
households, have contributed to the increase in inequality.8 However, both the timing and
structure of the increase in income inequality indicate that reductions in the highest
marginal tax rates played an important role. The major increases in inequality began with
the sharp reductions in the top marginal rates during the 1980s. Moreover, almost all of
the abnormally large increases in income were registered at the very top of the income

19
distribution, precisely the place where the incentive effects of rate reductions are the
strongest.
Table 9 presents data on the share of household income derived by the top and
bottom quintiles in the 1980s and the 1990s-2000s. These figures are presented for (1)
countries with persistently low (40 percent or less) top marginal tax rates during the
1990s and (2) countries with persistently high (50 percent or more) top rates during the
1980s and 1990s.9 Many of the countries with low top marginal rates during the 1990s
reduced their top rates substantially between 1985 and 1995. Therefore, to a large degree,
the persistently low tax group is comprised of countries with substantially lower tax rates
in the late 1990s than in the early 1980s.
Two things stand out with regard to the pattern of the data in Table 9. First, the
income inequality of the countries in the persistently low tax category is greater than for
those in the persistently high tax group. In the late 1990s, the income share of the top
quintile of earners was 43 percent or more in all of the countries in the low top marginal
rate group. In contrast, the income share of the top quintile was between 35 percent and
41 percent for all of the countries in the high tax group.
Second, the general trend appears to be toward more income inequality in the low
tax countries but less inequality in countries with high top marginal rates. Income
inequality rose in five of the nine low tax countries, while the other four experienced no
significant change. In contrast, five of the nine high tax countries registered a reduction
in income inequality during the period, and there was no discernible change in three
others. An increase in income inequality was observed in only one (Belgium) of the
countries in the high tax group.

20
From our perspective, the figures for New Zealand and the United Kingdom are
particularly interesting. Among the high income industrial countries, these two countries
(along with the United States) made the largest tax cuts during the 1980s. New Zealand
reduced its top rate from 66 percent in 1985 to 33 percent in 1990. In the United
Kingdom, the top marginal rate was reduced from 83 percent in 1980 to 60 percent in
1985 and 40 percent in 1990, and the lower rate has been maintained ever since. As
Table 9 shows, the income share derived by the highest quintile of earners increased in
both countries. In New Zealand, the income share of the top quintile rose from 40.6
percent in the early 1980s to 43.8 percent in the late 1990s. In the UK, the share of the
top quintile jumped from 41.4 percent in the 1980s to 44.0 percent in the late 1990s. Like
the figures for the U.S., the income distribution data for New Zealand and the United
Kingdom indicate that substantial reductions in the highest marginal rates will lead to
rapid income growth in the upper income brackets and an increase in the observed
income inequality.
One final point about the empirical linkage between lower top tax rates and
income inequality: Comparisons of the before and after rate reductions will tend to over-
state the change in economic inequality. To some extent, the empirical data reflect the
fact that the rate reductions increase the visibility of the income of the highest earners.
High tax rates encourage tax avoidance activities that tend to conceal income, broadly
defined to include leisure, pleasurable activities, and ability to purchase many goods at a
low personal cost. For example, when tax rates are high, those confronting the high rates
take more of their "income" in the form of low-cost luxury offices and automobiles,
business related vacations in exotic places, pleasurable hobby business activities, and

21
similar benefits that conceal their true income. As lower rates make these activities less
profitable, those with high incomes shift away from such activities. As they do so, their
money income increases and their overall income becomes more visible. In turn, this
makes it look like their overall income has increased by a larger amount than is really the
case.
C. Changes in marginal tax rates and the taxes paid by those with high incomes
As we previously discussed, changes in the incentive structure indicate that a
roughly proportional reduction in tax rates will increase both income levels and the share
of taxes collected from high-income taxpayers. Because the income base will be more
responsive in the upper income brackets, the share of taxes collected from those with
high incomes may even increase if their rates are reduced more than proportionally.
Table 10 provides data related to this proposition for the United States. The share
of the personal income tax collected from those with high incomes is indicated for
various periods from 1963, when the top federal rate was 91 percent, through 1994-2001,
when the top federal rate was 39.6 percent. These data show that the share of the personal
income tax paid by high income Americans has increased substantially since 1963, and
the increase has been particularly sharp since 1980. The top 1 percent of earners paid
33.4 percent of the personal income tax during 1994-2001, up from 19.1 percent in 1980
and 18.3 percent in 1963. The top 10 percent of income recipients paid 63.7 percent of
the personal income tax during 1994-2001, compared to 49.3 percent in 1980 and 47
percent in 1963. At the same time, the share of the personal income tax paid by the
bottom half of the income recipients has steadily fallen from 10.4 percent of the total in
1963 to 7.0 percent in 1980 and just 4.3 percent during 1994-2001.10

22
How did the sharp top rate reductions of the 1980s affect the share of taxes
collected from high income taxpayers? When the top marginal rates were in the 30 to 33
percent range during 1987-1993, the share of the federal income tax collected from the
top one percent of earners rose to 26.3 percent, up from 19.1 percent in 1980 and 18.3
percent in 1963. During 1994-2001, the top one percent paid 33.4 percent of the personal
income tax even though the top marginal rate remained at less than 40 percent throughout
the period. Furthermore, the personal income taxes collected at the federal level rose to
almost nine percent of GDP during 1994-2001, higher than for any of the earlier periods.
Table 11 presents the share of income taxes collected from high income recipients
before and after major cuts in the top marginal rates for New Zealand and the United
Kingdom, the two other high-income countries that have substantially reduced their top
marginal rates. The pattern for both countries is similar to that of the United States. As
the top marginal rate in both countries was reduced from more than 60 percent in the
early 1980s to 40 percent or less during the 1990s, the share of income taxes collected
from those with high incomes increased. In New Zealand, the top five percent of earners
paid 29 percent of the personal income tax in 1998, compared to 25.1 percent in 1981.
The top one percent paid 12.8 percent of the personal income tax in 1998, up from 9.5
percent in 1981. In the United Kingdom, the shift of the tax burden toward those with
high incomes was even more dramatic. In 1999, the top 10 percent of earners paid 50
percent of the personal income tax in the UK, up from 35 percent in 1980.
Correspondingly, the share paid by the top one percent of income recipients jumped from
11 percent in 1980 to 20 percent in 1999. At the same time, the share of the income tax
paid by the bottom half of the income distribution declined substantially.
23
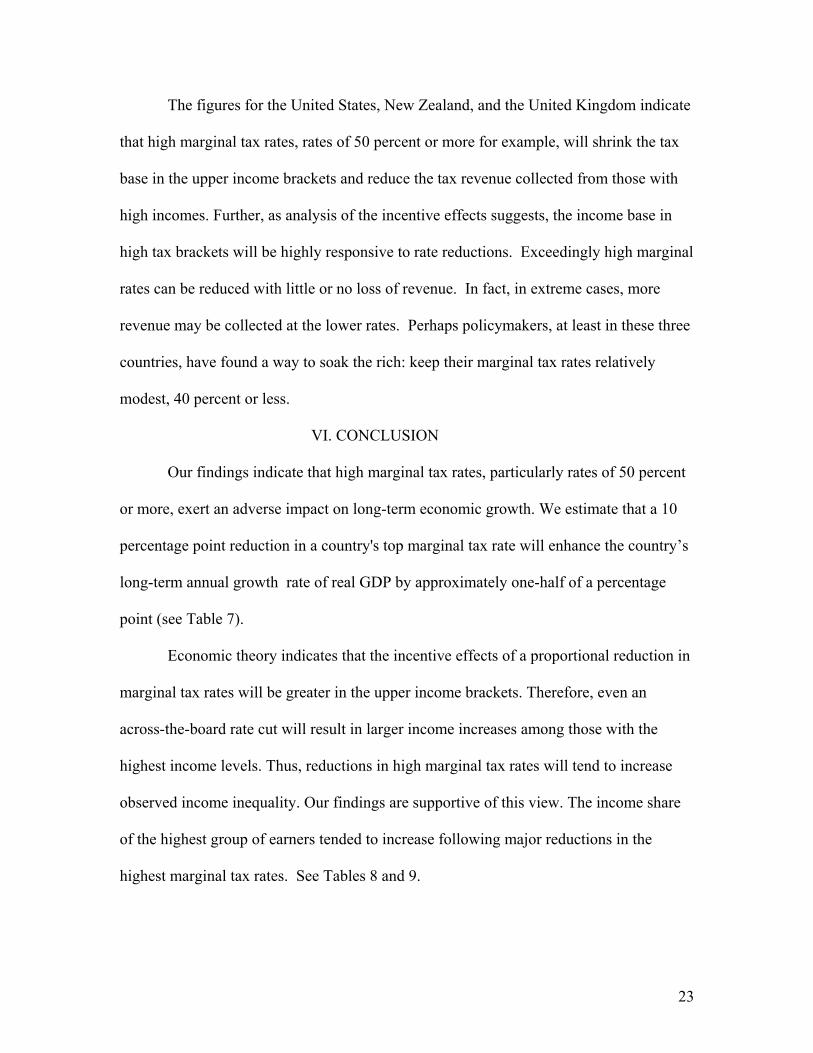
The figures for the United States, New Zealand, and the United Kingdom indicate
that high marginal tax rates, rates of 50 percent or more for example, will shrink the tax
base in the upper income brackets and reduce the tax revenue collected from those with
high incomes. Further, as analysis of the incentive effects suggests, the income base in
high tax brackets will be highly responsive to rate reductions. Exceedingly high marginal
rates can be reduced with little or no loss of revenue. In fact, in extreme cases, more
revenue may be collected at the lower rates. Perhaps policymakers, at least in these three
countries, have found a way to soak the rich: keep their marginal tax rates relatively
modest, 40 percent or less.
VI. CONCLUSION
Our findings indicate that high marginal tax rates, particularly rates of 50 percent
or more, exert an adverse impact on long-term economic growth. We estimate that a 10
percentage point reduction in a country's top marginal tax rate will enhance the country’s
long-term annual growth rate of real GDP by approximately one-half of a percentage
point (see Table 7).
Economic theory indicates that the incentive effects of a proportional reduction in
marginal tax rates will be greater in the upper income brackets. Therefore, even an
across-the-board rate cut will result in larger income increases among those with the
highest income levels. Thus, reductions in high marginal tax rates will tend to increase
observed income inequality. Our findings are supportive of this view. The income share
of the highest group of earners tended to increase following major reductions in the
highest marginal tax rates. See Tables 8 and 9.

24
However, because of the stronger incentive effects accompanying reductions in
the highest marginal rates, across the board tax reductions will tend to increase the share
of taxes paid by those with the highest incomes. The experience of the United States is
consistent with this view. Compared to the situation in 1980, when the top marginal tax
bracket was 70 percent, the share of the personal income tax paid by those with high
incomes (top five percent for example) has been substantially greater in the United States
since 1987, even though the top federal income tax rate has been less than 40 percent
throughout the latter period. The experience of New Zealand and the United Kingdom,
the other two high-income countries that dramatically reduced their highest marginal tax
rates in the 1980s, is also supportive of this view. In both cases, the share of the personal
income tax paid by those with the highest incomes increased following the lowering of
the top rates.
In brief, our findings indicate that high marginal tax rates, rates of 50 percent and
above for example, retard economic growth. Lowering these rates will increase income
inequality, but it will also increase the share of the personal income tax collected from
those with the highest incomes.

25
ENDNOTES 1 See Thomas MaCurdy, David Green, and Harry Paarsch, "Assessing Empirical Approaches for Analyzing
Taxes and Labor Supply," Journal of Human Resources 25 (Summer 1990): 415-490; Robert Triest, "The
Effects of Income Tax Deductions on Labor Supply When Deductions are Endogenous," Review of
Economics and Statistics 74 (January 1992): 91-99; and Thomas J. Kniesner and James P. Zilak, The
Effects of Recent Tax Reforms on Labor Supply, Washington D.C.: American Enterprise Institute, 1998.
2 The recent work of Edward Prescott, the 2004 Nobel Prize winner, indicates that the long-run negative
impact of higher tax rates on labor supply is substantially greater than the short-run estimates. Prescott uses
marginal tax differences between France and the United States to derive estimates for the labor supply
response over lengthy time periods. He finds that differences in marginal tax rates between France and the
United States explain nearly all of the 30 percent short-fall of labor inputs in France relative to the United
States. Prescott concludes,
I find it remarkable that virtually all of the large difference in labor supply between France and
the United States is due to differences in tax systems. I expected institutional constraints on the
operation of labor markets and the nature of the unemployment benefit system to be more
important. I was surprised that the welfare gain from reducing the intratemporal tax wedge is so
large.( p. 9)
See Edward C. Prescott, "Richard T. Ely Lecture: Prosperity and Depression." American Economic Review,
Papers and Proceedings 92, no. 2, (May 2002): 1-15.
3 The original source of the marginal tax rate data is Price Waterhouse, Individual Taxes: A Worldwide
Summary, (various issues). The top marginal tax rates reported here include rates that apply at the sub-
national level if applicable.
4 James Gwartney and Robert Lawson. Economic Freedom of the World, 2004 Annual Report (Vancouver,
BC: Fraser Institute, 2004).

26
5 Other researchers have used similar techniques in an effort to hold other things constant. For example,
when analyzing the impact of changes in the top state income tax rates on income growth, Holcombe and
Lacombe compared the growth of per capita income in counties on state borders with income growth in
adjacent counties across the state border. This border-matching technique made it possible for them to hold
constant many factors such as climate, culture, and proximity to markets that might also influence the
growth of income. Their findings indicate that over the 30 year period from 1960 to 1990, states that raised
their top income tax rates more than their neighbors had slower income growth and, on average, a 3.4
percent reduction in per capita income. See Randall G. Holcombe and Donald J. Lacombe, “The Effect of
State Income Taxation on Per Capita Income Growth” Public Finance Review 32, no. 3 (May 2004): 292-
312.
6 Unless otherwise specified, all results reported are “statistically significant” at the 90 percent level of
confidence.
7 Several factors reduce the comparability of income distribution data across countries and time periods.
Sometimes the underlying figures are based on income and in other cases they are based on consumption
expenditures. Sometimes the income figures are for households and in other cases they are for individuals.
Sometimes the figures are derived from national samples, while in other instances they only reflect figures
for urban (or rural) dwellers. Some data are after-tax and some are before tax. Thus, extreme care must be
exercised in this area.
8 For information on the linkage between trade openness and income inequality, see Gary Burtless,
“International Trade and the Rise in Earnings Inequality,” Journal of Economic Literature (June 1995):
800–816; and Symposium on “Income Inequality and Trade,” Journal of Economic Perspectives (Summer
1995).
9 All countries in these two categories for which comparable household income distribution data could be
attained are included here.

27
10 In addition to reducing the highest marginal tax rates, the tax reforms of the 1980s also increased both the
standard deduction and personal exemption allowances by substantial amounts. This means that Americans
are now able to earn more income before they face any tax liability. Like an across-the-board rate
reduction, this structural change shifts the tax liability away from those with lower incomes and toward
those with higher incomes. It completely eliminates the tax liability for many. In 2001, for example, 30
percent (approximately 40 million returns) of those filing an income tax return either had zero tax liability
or actually received funds from the IRS as the result of the Earned Income Tax Credit, a program that
provides a subsidy to the working poor. The tax share data of Table 10 reflect only tax liability; they do not
include income transfers resulting from tax credits. If these credits were included, the net taxes paid by the
bottom 50 percent of earners would be even smaller than the figures of Table 10 since 1975 when the
Earned Income Tax Credit was adopted.

Table 1: Average and Median Top Marginal Tax Rates, 1980-2002
Average MedianTax Rate Tax Rate
1980* 61.3 601985 59.2 601990 48.5 501995 40.8 402000 38.6 392002 37.1 35
* The requisite data for 1980 were not available for all 77 countries. 1980 data area based on 68 observations.
Source:Authors' calculations. See Table A2.

Table 2: Countries with Persistently High Tax Rates, 1980-1995
Countries with top marginal tax rates in excess of 50 percent in all years between 1980 and 1995ItalySwedenBelgiumDenmarkJapanCameroon NetherlandsFinlandCongo, Dem.GermanyEgyptSpainTurkeyFranceAustriaKenya
Source:Authors' calculations. See Table A2.

Table 3: Countries with Persistently High and Persistently Low Top Marginal Tax Rates in the 1990s
Countries with top marginal tax rates in excess of 60 percent (including the payroll tax) in all years between 1990 and 2000
Countries with top marginal tax rates less than 40 percent (including the payroll tax) in all years between 1990 and 2000
Austria BangladeshBelgium Costa RicaCameroon EcuadorCongo, D. R. GuatemalaDenmark Hong KongFinland IndonesiaFrance JamaicaIsrael MauritiusSweden New Zealand
PhilippinesSingaporeTrinidad/Tob.United Kingdom
Source:Authors' calculations. See Table A3.

Table 4: Growth Rates of High and Low Top Marginal Tax Rate Countries
1980-90 1990-02 1980-90 1990-02Austria 2.15% 1.79% Bangladesh 1.13% 2.99%Belgium 1.89% 1.61% Costa Rica -0.50% 2.45%Cameroon 0.41% -0.59% Ecuador -0.51% 0.34%Congo, D. R. -2.02% -7.16% Guatemala -1.61% 1.12%Denmark 1.54% 1.86% Hong Kong 5.08% 2.50%Finland 2.67% 1.53% Indonesia 4.44% 2.62%France 1.94% 1.43% Jamaica 1.36% 0.08%Israel 1.74% 1.43% Mauritius 4.89% 4.06%Sweden 1.87% 1.52% New Zealand 0.84% 1.88%Average 1.35% 0.38% Philippines -0.72% 0.86%
Singapore 4.90% 3.57%Trinidad/Tobago -1.19% 2.53%United Kingdom 2.45% 2.02%Average 1.58% 2.08%
Source:World Bank. 2004 World Development Indicators.
Real GDP Per Capita Growth Real GDP Per Capita Growth
Countries with top marginal tax rates less than 40 percent (including the payroll tax) in all years between 1990 and 2000
Countries with top marginal tax rates in excess of 60 percent (including the payroll tax) in all years between 1990 and 2000
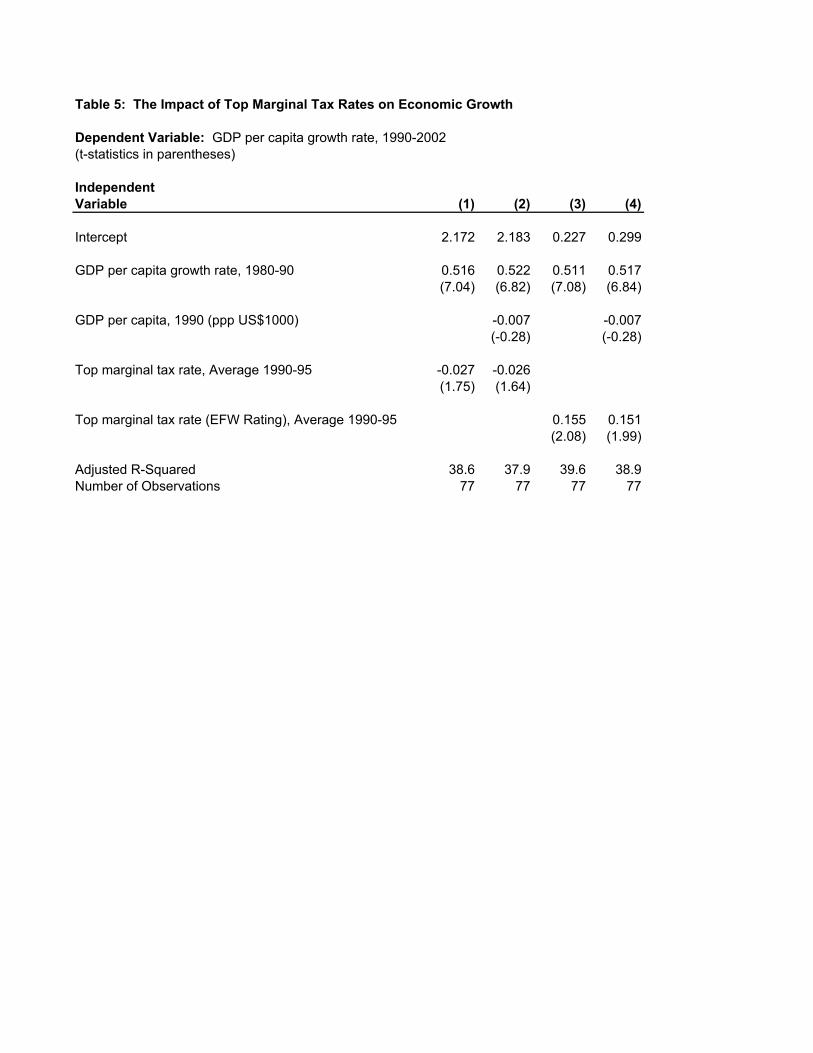
Table 5: The Impact of Top Marginal Tax Rates on Economic Growth
Dependent Variable: GDP per capita growth rate, 1990-2002(t-statistics in parentheses)
IndependentVariable (1) (2) (3) (4)
Intercept 2.172 2.183 0.227 0.299
GDP per capita growth rate, 1980-90 0.516 0.522 0.511 0.517(7.04) (6.82) (7.08) (6.84)
GDP per capita, 1990 (ppp US$1000) -0.007 -0.007(-0.28) (-0.28)
Top marginal tax rate, Average 1990-95 -0.027 -0.026(1.75) (1.64)
Top marginal tax rate (EFW Rating), Average 1990-95 0.155 0.151(2.08) (1.99)
Adjusted R-Squared 38.6 37.9 39.6 38.9Number of Observations 77 77 77 77

Table 6: Countries that Cut Top Marginal Tax Rates the Most Between 1985 and 1995
Countries Reducing Top Marginal Tax Rates by More than 25 Percentage Points between 1985 and 1995.TanzaniaDominican Rep.ZambiaMoroccoUgandaIranBangladeshPeruEcuadorJamaicaNew ZealandArgentinaMaltaParaguaySwedenPortugalThailandPanamaBotswanaBrazilCosta RicaGhanaPhilippines
Source:Authors' calculations. See Table A2.

Table 7: The Impact of Changes in Top Marginal Tax Rates on Economic Growth
Dependent Variable: GDP per capita growth rate, 1990-2002(t-statistics in parentheses)
IndependentVariable (1) (2) (3) (4) (5) (6)
Intercept 0.332 0.361 1.432 0.284 0.240 -0.350
GDP per capita growth rate, 1980-90 0.531 0.533 0.537 0.532 0.528 0.523(7.23) (6.92) (7.02) (7.48) (7.06) (7.07)
GDP per capita, 1990 (ppp US$1000) 0.003 0.008 0.005 0.014(0.12) (0.29) (0.19) (0.55)
Top marginal tax rate, 1985 -0.024(1.47)
Top marginal tax rate (EFW Rating), 1985 0.133(1.63)
Change in Top marginal tax rate from 1985 to 1990 -0.034 -0.034 -0.049(1.84) (1.83) (2.33)
Change in Top marginal tax rate from 1990 to 1995 -0.034 -0.034 -0.048(2.14) (1.98) (2.46)
Change in Top marginal tax rate (EFW Rating) from 1985 to 1990 0.177 0.177 0.241(2.03) (2.02) (2.53)
Change in Top marginal tax rate (EFW Rating) from 1990 to 1995 0.239 0.245 0.304(3.03) (2.91) (3.35)
Adjusted R-Squared 40.0 39.1 40.1 43.1 42.4 43.7Number of Observations 77 77 77 77 77 77

Table 8: The Distribution of Household Income in the United States, 1970-2001
Before Taxes
Income Share of
the Bottom Quintile
Income Share of
the Middle Three
Quintiles
Income Share of the Top Quintile
Income Share of the Top
5%1970 4.1 52.7 43.3 16.61980 4.3 52.1 43.7 15.81990 3.9 49.5 46.6 18.62001 3.5 46.3 50.1 22.4
After Taxes*1980 4.9 54.6 40.6 14.11990 4.5 52.0 43.5 16.52001 4.4 50.7 44.9 18.2
After Taxes & Transfers*1980 5.6 54.0 40.31990 5.2 51.5 43.32001 4.7 48.7 46.5
Sources:http://www.census.gov/hhes/income/histinc/h02.htmlhttp://www.census.gov/hhes/income/histinc/rdi3.htmlhttp://www.census.gov/hhes/income/histinc/rdi7.html
*Comparable data after taxes and after taxes and transfers were unavailable for 1970.

Table 9: Top Marginal Tax Rates and the Distribution of Income: Persistenltly Low Versus Persistenly High Top Marginal Tax Rates During the 1990s
Low Tax Countries During the 1990s
Top Marginal
Tax Rate,1980
Top Marginal
Tax Rate,1995
IncomeShare of the
Bottom Quintile,1980s*
IncomeShare of theTop Quintile,
1980s* Year
Income Shareof the Bottom
Quintile,1990s-2000s**
Income Shareof the Top
Quintile,1990s-2000s** Year
Is IncomeInequality
Increasing orDecreasing?*
Bangladesh 60 40 7.2 43.4 1983 9.0 44.5 2000 No ChangeCosta Rica 50 25 4.5 51.8 1983 4.2 51.5 2000 No ChangeGuatemala 40 25 2.7 62.1 1987 2.6 64.1 2000 IncreasingHong Kong 15 20 6.2 46.5 1980 5.3 50.7 1996 IncreasingIndonesia 50 30 7.3 42.3 1980 8.4 43.3 2002 No ChangeNew Zealand 62 33 6.0 40.6 1980 6.4 43.8 1997 IncreasingPhilippines 70 35 5.2 52.1 1985 5.4 52.3 2000 No ChangeSingapore 55 30 6.5 46.6 1980 5.0 49.0 1998 IncreasingUnited Kingdom 83 40 5.5 41.4 1986 6.1 44.0 1999 Increasing
High Tax Countries During the 1990sAustria 62 50 6.6 38.6 1981 8.1 38.5 1997 No ChangeBelgium 76 61 8.6 34.7 1985 8.3 37.3 1996 IncreasingDenmark 66 64 6.7 37.2 1981 8.3 35.8 1997 DecreasingFinland 68 57 6.8 36.9 1987 9.6 36.7 2000 DecreasingFrance 60 51 6.6 42.0 1984 7.2 40.2 1995 DecreasingGermany 65 57 6.8 37.4 1981 8.5 36.9 2000 DecreasingJapan 75 65 6.3 39.6 1980 10.6 35.7 1993 DecreasingNetherlands 72 60 6.1 39.8 1983 7.3 40.1 1994 No ChangeSweden 87 50 9.0 35.3 1981 9.1 36.6 2000 No Change
Sources:1980s income distribution data are from Deininger and Squire Data Set, A New Data Set Measuring Income Inequality, http://www.worldbank.org/research/growth/dddeisqu.htm1990s income distribution data are from the World Bank, World Development Indicators 2004
*The 'No Change' label indicates that the average difference between the two periods for the top and bottom quintiles was less than one percentage point.
Note: The income distribution data were unavailable for some countries.

Table 10: Marginal Tax Rates and Incomes Taxes Paid by Various Income Groups in the U.S., 1963-2001
Top Marginal Tax Rate (Federal)
Federal Income Tax
Receipts as a Share of
GDP Bottom 50% Top 10% Top 5% Top 1%1963 91 7.71 10.4 47.0 35.6 18.31980 70 8.75 7.0 49.3 36.8 19.1
1981-1986 50 8.30 7.2 50.5 38.0 20.91987-1993 30-33 7.90 5.5 56.7 44.7 26.31994-2001 39.6 8.99 4.3 63.7 52.3 33.4
Sources:Internal Revenue Service (available online at the Tax Foundation’s website: http://www.taxfoundation.org/prtopEconomic Report of the President, 2005. Table B-80
Share of Federal Income Tax Paid by

Table 11: Marginal Tax Rates and Incomes Taxes Paid by Various Income Groups in New Zealand and the United Kingdom
New ZealandTop Marginal
Tax Rate Bottom 50% Top 10% Top 5% Top 1%1981 62 12.4 38.0 25.1 9.51991 33 13.6 37.3 25.3 10.61998 39 12.2 41.3 29.0 12.8
United Kingdom1980 83 18.0 35.0 n.a. 11.01990 40 15.0 42.0 n.a. 15.01999 40 11.0 50.0 n.a. 20.0
Sources:New Zealand, Inland Revenue memo to New Zealand Business Roundtable.Adam Smith Institute
Share of Income Tax Paid By:

Table A1: Top Marginal Tax Rates, Income Thresholds, and EFW Ratings
Top Marginal Tax Rate Less than $25,000 25,000 to 50,000 50,000 to 150,000 More than $150,000
Less than 20% 10 10 10 1021 to 25 9 9 10 1026 to 30 8 8 9 931 to 35 7 7 8 936 to 40 5 6 7 841 to 45 4 5 6 746 to 50 3 4 5 551 to 55 2 3 4 456 to 60 1 2 3 361 tp 65 0 1 2 266 to 70 0 0 1 1
More than 70% 0 0 0 0
Note: Countries with higher marginal tax rates that take effect at lower income thresholds received lower ratings based on the matrix found a
Source:James Gwartney and Robert Lawson. Economic Freedom of the World, 2004 Annual Report (Vancou
Income Threshold Level (1982-84 US$)

Table A2: Top Marginal Tax Rates on Personal Income (excluding payroll taxes) and EFW Ratings, 1980-2002
Countries Tax Rate Rating Tax Rate Rating Tax Rate Rating Tax Rate Rating Tax Rate Rating Tax Rate Rating Tax Rate RatingArgentina 45 6 62 2 35 7 30 9 35 8 35 7 40.3 6.5Australia 62 2 60 2 49 3 47 4 47 3 47 3 52.0 2.8Austria 62 2 62 2 50 4 50 4 50 4 50 4 54.0 3.3Bangladesh 60 1 60 1 25 9 25 9 25 9 25 9 36.7 6.3Barbados 60 1 60 1 50 4 40 5 40 5 40 5 48.3 3.5Belgium 76 0 76 0 58 2 61 1 60 2 52 2 63.9 1.2Belize 50 4 45 4 45 5 45 5 45 5 46.0 4.6Bolivia 48 3 30 8 10 10 13 10 13 10 13 10 21.2 8.5Botswana 75 0 60 2 50 3 35 7 25 9 25 9 45.0 5.0Brazil 55 4 60 1 25 9 35 8 28 8 28 8 38.4 6.3Cameroon 60 2 60 1 66 0 69 0 65 0 64.0 0.6Canada 64 2 57 2 49 4 49 4 48 3 34 5 50.1 3.3Chile 58 2 56 2 50 4 45 6 45 5 40 5 49.0 4.0China 45 6 45 5 45 6 45 6 45 4 45.0 5.4Colombia 56 2 49 5 30 8 30 8 35 7 35 7 39.2 6.2Congo, Dem. R. 60 1 60 1 60 1 60 1 60 1 50 3 58.3 1.3Costa Rica 50 5 50 3 25 9 25 9 25 9 30 8 34.2 7.2Cote d'Ivoire 45 5 45 5 45 4 49 3 49 3 49 3 47.0 3.8Cyprus 60 1 60 1 60 1 40 5 40 5 30 8 48.3 3.5Denmark 66 0 73 0 68 0 64 1 59 2 59 1 64.8 0.7Dominican Rep. 73 0 73 0 73 0 25 9 25 9 25 9 49.0 4.5Ecuador 50 5 58 2 25 9 25 9 25 9 25 9 34.7 7.2Egypt 80 0 65 2 65 2 50 3 34 7 34 7 54.7 3.5El Salvador 60 3 48 3 60 2 30 8 30 8 30 8 43.0 5.3Fiji 53 2 50 3 50 3 35 7 34 7 32 7 42.3 4.8Finland 68 1 67 1 60 2 57 2 54 3 54 3 60.0 2.0France 60 3 65 1 53 3 51 4 54 2 53 2 56.0 2.5Germany 65 2 65 1 53 4 57 3 56 3 51 4 57.8 2.8Ghana 60 1 60 1 55 2 35 7 30 8 30 8 45.0 4.5Greece 60 3 63 1 50 4 45 5 43 5 40 5 50.1 3.8Guatemala 40 8 48 5 34 7 25 9 31 7 31 7 34.8 7.2Honduras 40 8 46 5 46 5 40 7 25 9 25 9 37.0 7.2Hong Kong 15 10 25 9 25 9 20 10 17 10 17 10 19.8 9.7Iceland 63 0 56 1 40 5 47 4 45 6 46 5 49.5 3.5India 60 1 62 0 53 2 40 5 30 8 32 7 46.2 3.8Indonesia 50 3 35 7 35 7 30 8 35 7 35 7 36.7 6.5Iran 90 0 75 0 54 4 54 2 35 8 61.6 2.8Ireland 60 1 65 0 56 1 48 3 42 5 42 5 52.2 2.5Israel 66 1 60 3 48 5 50 4 50 4 50 4 54.0 3.5Italy 72 0 81 0 66 1 67 1 51 3 47 4 64.0 1.5Jamaica 80 0 58 1 33 7 25 9 25 9 25 9 41.0 5.8Japan 75 0 70 1 65 2 65 2 50 5 50 5 62.5 2.5Kenya 65 1 65 0 50 3 50 3 32 7 30 8 48.7 3.7Malawi 45 4 50 3 50 3 35 7 38 5 38 5 42.7 4.5Malaysia 60 2 45 6 45 6 32 7 29 8 28 8 39.8 6.2Malta 65 0 65 0 65 0 35 7 35 7 35 7 50.0 3.5Mauritius 50 3 35 7 35 7 30 8 25 9 25 9 33.3 7.2Mexico 55 4 55 4 40 7 35 7 40 7 35 7 43.3 6.0Morocco 64 2 87 0 87 0 46 3 44 4 44 4 62.0 2.2Netherlands 72 0 72 0 60 3 60 2 52 3 52 2 61.3 1.7New Zealand 62 2 66 0 33 7 33 7 39 5 39 5 45.3 4.3Nigeria 70 0 55 3 55 2 35 7 25 9 25 9 44.2 5.0Norway 75 0 64 1 51 3 42 5 48 5 48 5 54.6 3.2Pakistan 55 2 60 1 50 3 45 4 35 7 35 7 46.7 4.0Panama 56 3 56 3 56 3 30 9 31 8 31 8 43.4 5.7Paraguay 30 8 30 8 0 10 0 10 0 10 12.0 9.2Peru 65 2 65 0 45 4 30 8 20 10 30 8 42.5 5.3Philippines 70 1 60 1 35 7 35 7 32 7 32 7 44.0 5.0Portugal 84 0 69 0 40 5 40 5 40 6 40 6 52.2 3.7Senegal 65 1 48 4 64 0 50 3 50 3 55.4 2.2Singapore 55 4 40 8 33 9 30 9 28 9 22 10 34.7 8.2South Africa 60 2 50 4 45 5 43 4 45 4 40 5 47.2 4.0South Korea 89 0 65 2 64 2 48 5 44 5 40 6 58.3 3.3Spain 66 1 66 1 56 3 56 2 48 4 40 5 55.3 2.7Sweden 87 0 80 0 65 0 50 3 55 2 56 3 65.4 1.3Switzerland 37 7 40 7 38 8 37 8 36 9 36 9 37.3 8.0Taiwan 60 3 60 3 50 5 40 7 40 7 40 7 48.3 5.3Tanzania 95 0 50 3 30 8 31 7 31 7 47.4 5.0Thailand 60 3 65 2 55 4 37 7 37 7 37 6 48.5 4.8Trinidad & Tob. 50 4 35 7 38 5 35 7 30 8 37.6 6.2Turkey 75 0 63 2 50 4 55 4 45 6 40 6 54.7 3.7Uganda 70 0 50 3 30 8 30 8 30 8 42.0 5.4United Kingdom 83 0 60 2 40 5 40 5 40 6 40 6 50.5 4.0United States 73 0 55 4 38 7 43 7 43 7 40 8 48.7 5.5Venezuela 45 7 45 7 45 7 34 7 35 8 34 7 39.7 7.2Zambia 70 0 80 0 75 0 35 7 30 8 30 8 53.3 3.8Zimbabwe 45 5 63 0 60 1 45 4 53 2 46 3 52.0 2.5
Average 61.3 2.2 59.2 2.4 48.5 4.2 40.8 5.6 38.6 6.1 37.1 6.2 47.3 4.5Median 60 2 60 2 50 4 40 6 39 7 35 7 48 4Number 68 68 77 77 77 77 77 77 77 77 77 77 77 77
Source:James Gwartney and Robert Lawson. Economic Freedom of the World, 2004 Annual Report (Vancouver, BC: Fraser Institute, 2004).
2000 2002 Average 1980-20001980 1985 1990 1995
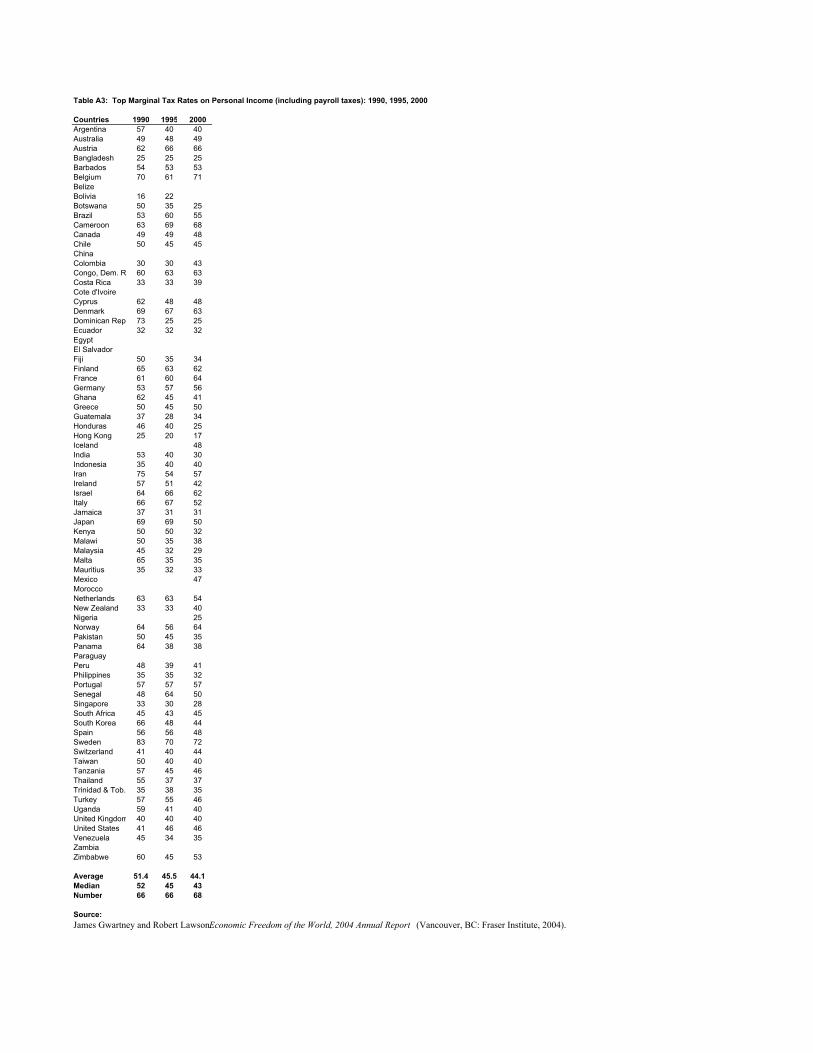
Table A3: Top Marginal Tax Rates on Personal Income (including payroll taxes): 1990, 1995, 2000
Countries 1990 1995 2000Argentina 57 40 40Australia 49 48 49Austria 62 66 66Bangladesh 25 25 25Barbados 54 53 53Belgium 70 61 71BelizeBolivia 16 22Botswana 50 35 25Brazil 53 60 55Cameroon 63 69 68Canada 49 49 48Chile 50 45 45ChinaColombia 30 30 43Congo, Dem. R 60 63 63Costa Rica 33 33 39Cote d'IvoireCyprus 62 48 48Denmark 69 67 63Dominican Rep 73 25 25Ecuador 32 32 32EgyptEl SalvadorFiji 50 35 34Finland 65 63 62France 61 60 64Germany 53 57 56Ghana 62 45 41Greece 50 45 50Guatemala 37 28 34Honduras 46 40 25Hong Kong 25 20 17Iceland 48India 53 40 30Indonesia 35 40 40Iran 75 54 57Ireland 57 51 42Israel 64 66 62Italy 66 67 52Jamaica 37 31 31Japan 69 69 50Kenya 50 50 32Malawi 50 35 38Malaysia 45 32 29Malta 65 35 35Mauritius 35 32 33Mexico 47MoroccoNetherlands 63 63 54New Zealand 33 33 40Nigeria 25Norway 64 56 64Pakistan 50 45 35Panama 64 38 38ParaguayPeru 48 39 41Philippines 35 35 32Portugal 57 57 57Senegal 48 64 50Singapore 33 30 28South Africa 45 43 45South Korea 66 48 44Spain 56 56 48Sweden 83 70 72Switzerland 41 40 44Taiwan 50 40 40Tanzania 57 45 46Thailand 55 37 37Trinidad & Tob. 35 38 35Turkey 57 55 46Uganda 59 41 40United Kingdom 40 40 40United States 41 46 46Venezuela 45 34 35ZambiaZimbabwe 60 45 53
Average 51.4 45.5 44.1Median 52 45 43Number 66 66 68
Source:James Gwartney and Robert Lawson. Economic Freedom of the World, 2004 Annual Report (Vancouver, BC: Fraser Institute, 2004).