the impact of tax knowledge and budget spending influence - iza
TRANSCRIPT
DI
SC
US
SI
ON
P
AP
ER
S
ER
IE
S
Forschungsinstitut zur Zukunft der ArbeitInstitute for the Study of Labor
The Impact of Tax Knowledge and Budget Spending Influence on Tax Compliance
IZA DP No. 7255
February 2013
Behnud M. DjawadiRené Fahr
The Impact of Tax Knowledge and Budget
Spending Influence on Tax Compliance
Behnud M. Djawadi University of Paderborn
René Fahr
University of Paderborn and IZA
Discussion Paper No. 7255 February 2013
IZA
P.O. Box 7240 53072 Bonn
Germany
Phone: +49-228-3894-0 Fax: +49-228-3894-180
E-mail: [email protected]
Any opinions expressed here are those of the author(s) and not those of IZA. Research published in this series may include views on policy, but the institute itself takes no institutional policy positions. The IZA research network is committed to the IZA Guiding Principles of Research Integrity. The Institute for the Study of Labor (IZA) in Bonn is a local and virtual international research center and a place of communication between science, politics and business. IZA is an independent nonprofit organization supported by Deutsche Post Foundation. The center is associated with the University of Bonn and offers a stimulating research environment through its international network, workshops and conferences, data service, project support, research visits and doctoral program. IZA engages in (i) original and internationally competitive research in all fields of labor economics, (ii) development of policy concepts, and (iii) dissemination of research results and concepts to the interested public. IZA Discussion Papers often represent preliminary work and are circulated to encourage discussion. Citation of such a paper should account for its provisional character. A revised version may be available directly from the author.
IZA Discussion Paper No. 7255 February 2013
ABSTRACT
The Impact of Tax Knowledge and Budget Spending Influence on Tax Compliance
We investigate the impact of trust in authorities on tax compliance within a controlled laboratory setting. Embedded in two hypothetical tax systems with high and low power of authorities respectively, we gradually increase trust in authorities in form of tax knowledge about public expenditures and by allowing taxpayers to decide on what public goods they want their tax dollars to be spend for. To clearly disentangle any effects from factors that are known to influence tax compliance from previous studies, we control for tax commitment, risk attitude, income and effort exerted to earn the income which the taxpayers report truthfully or underreport to the tax authority. Non-parametric statistical analyses as well as multivariate regressions provide clear evidence that tax compliance is higher in tax systems with low power of authorities when providing complete transparency on public expenditures and when taxpayers are given the possibility to decide on the use of their taxes. With a powerful tax authority in place which is reflected in high audit rates, compliance does not change when increasing trust in authorities. Our results have important policy implications as the mere hypothetical possibility to express preferences on budget spending influences tax compliance. JEL Classification: H26, C91 Keywords: tax evasion, tax compliance, tax knowledge, budget spending, real effort,
experimental economics Corresponding author: René Fahr Department of Management University of Paderborn Warburger Str. 100 D-33098 Paderborn Germany E-mail: [email protected]
1
1. Introduction
A legitimate interest of taxpaying citizens concerns the allocation of tax dollars to different
funds and the way the government intends to spend the budget in general. It is therefore not
surprising that Kirchler et al. (2008) claim that trust in authorities is a substantial determinant
of tax compliance which can only be enforced partly by the legitimate power of tax
authorities to audit tax files, impose and prosecute penalties on tax evaders. Empirical
evidence suggests that educating tax payers about the tax system (Vogel 1974, Song and
Yarbrough 1978, Wartick 1994), tax laws (Eriksen and Fallan 1996, Palil and Mustapha
2011) and informing them about negative effects of tax evasion (Holler et al. 2008), sanctions
and fines (Schwartz and Orleans 1967, Park and Hyun 2003) is a useful policy in order to
increase trust in authorities, conveying to significantly more tax compliance.
The present study contributes to this literature by investigating how firstly tax knowledge
about public expenditures and secondly tax payers’ influence on budget spending affects tax
compliance. Local governments seem to be well aware of the importance of tax knowledge
about public expenditures to increase trust in authorities. For instance, cities like Seattle,
Redmond and Kennewick in Washington State address these issues by clearly illustrating the
services provided by the city and the resources needed to assure accountability to the
community through easy-to-understand Budget-in-Brief reports. The German Federal
Government recently launched an interactive internet-based communication tool1 on annual
tax revenues and expenditures to make the federal budget accessible to citizens in a more
user-friendly way. Additionally, the city of Redmond (Washington State) proposes budgeting
by priorities. This process is aimed to be transparent, open and approved by council, aligning
the budget to citizen priorities with the objective to provide for services which meet the key
goals of the community. In Los Angeles (California) the annual “Major’s Budget Day” seeks
to engage residents in community building, giving them the opportunity to jointly identify
regional priorities and encourage input on a range of policy development matters. However,
these cases lack evidence of being effective to increase tax compliance.
Field studies in Switzerland report higher tax compliance and tax morale in regions where
citizens can actively vote for budget spending (Pommerehne and Weck-Hannemann 1996,
Feld and Frey 2002, Torgler 2005). Experimental literature on the concept of voice pioneered
by Alm et al. (1993) support the findings of the field studies. The authors conduct a public
good experiment with groups of 5 where each subject individually receives income and then
1 The tool can be retrieved under: "http://www.bundeshaushalt-info.de/startseite/" (in German language).
2
decides how much to provide for the underlying public good. Contributions are much higher
if subjects are able to vote for the public good that is funded by their taxes. Wahl et al. (2010)
also argue that high contribution results when the public good, for which citizens vote, is
congruent with their own preferences.
Our contribution differs from the studies described above in the following way: We set up a
purely hypothetical tax system which consists of tax items that can be found in the budget
plan of the 14 German federal ministries. From each federal ministry we incorporate the
corresponding tax item with the highest allocated budget of the fiscal year 2009. The tax
system is completely transparent as taxpayers receive information about all hypothetic public
expenditures. Taxpayers are told that the hypothetical government spends all of the collected
tax money for these items on an equal basis. We regard the transparency of the tax system as
accomplished by unraveling information about budget spending as a signal of trust to the
taxpayer. To the knowledge of the authors, this is the first study that investigates the impact of
tax knowledge regarding concrete tax expenditures on tax compliance.
In addition to that, other than examining group decision making on tax and budget issues by
different voting procedures (e.g. majority rule) to assure higher compliance (Alm et al. 1993,
Frey 1997, Alm et al. 1999, Walker et al. 2000, Feld and Tyran 2002, Tyran 2004, Wahl et al.
2010) we instead investigate how tax payers behave if they can decide individually upon
budget spending which comes closely to their own preferences. In this way, we augment the
range to express voice within the political system of a representative democracy. Specifically,
in our setting taxpayers pay their tax duty individually without prior communication or
negotiating with others, thus, no voting procedures or potential influence from other group
members are at place. We regard this fiscal exchange between government and taxpayers as
an even trust worthier relationship, as the government spends money for public goods that are
closely aligned to the individual taxpayer’s preferences. By changing the institutional
environment in a controlled way a systematic investigation about the interplay between power
of and trust in authorities can be achieved and their effect on tax compliance disentangled.
Our experimental design follows the standards in the recent literature (Boylan and Sprinkle
2001, Alm et al. 2010, Heinemann and Kocher 2010). As a measure to increase external
validity, the entire experiment is explicitly framed in a tax context and taxpayers earn their
money with real work. Further, to clearly identify the impact of trust in authorities on tax
compliance it is important to control for the individual perception of the power of and
generally the overall orientation towards tax authorities. We measure the power of authorities
by the participant’s risk attitudes as they identify the threatening effect of audit probabilities
3
and fines. By measuring the participant’s motivational posture “tax commitment” using a
scale suggested by Braithwaite (2003) we identify the individual’s moral obligation in paying
taxes in general and the overall orientation towards the tax authority. The study of Li et al.
(2011) regarding the potential influence on budget spending is closest related to ours. They
conduct an experiment to investigate the effect of donations to governmental institutions that
are designated for specific purposes. In their setting, subjects receive an endowment of 20.00$
and are free to decide on how much of this money they want to donate to a real organization
differing in type (governmental agency vs. private charity), level (national, state, local) and
fundable programs (Cancer Research, Disaster Relief, Education Enhancement, Parks and
Wildlife). The authors show that donations to private charities are significantly higher than
donations to governmental agencies; however, governmental agencies still receive on average
donations of 22% of the endowment. Hence, the results suggest that citizens are willing to
donate money to the government, especially if they can decide for which specific programs
their donation is going to be used for. Yet, this study differs from ours in important
dimensions as, firstly, donations are voluntary actions which are seen as a gift to the
corresponding recipient whereas paying taxes is a civic obligation, and secondly, decision-
makers do not face any risk in losing money if they do not donate to the agencies which is
different from tax matters, because tax authorities audit tax files with positive probability and
impose penalties and fines if taxpayers do not truthfully report their tax liability.
In the next section we introduce our hypotheses. The experimental design and procedure is
described in section 3. Our results are presented in section 4 and section 5 concludes.
2. Trust in authorities within two tax systems We regard two tax systems, one with low and one with high power of authorities. The power
of authorities is implemented by changing the audit probability to a low or a high rate. For
each tax system we gradually increase trust in authorities in form of tax knowledge about
public expenditures and taxpayer’s influence on budget spending. By doing so, we are able to
investigate the degree of trust which is necessary to have an effect on taxpayer’s behavior.
When power is low, the practice of evading taxes becomes more attractive for taxpayers as
authorities lack the resources to legitimately enforce compliance and, as such, the expected
punishment is at a minimum. However, according to Kirchler et al. (2008), a climate between
taxpayers and tax authorities which is characterized by high trust is of major importance. If
taxpayers have the impression that tax authorities align the limited resources to community
4
needs responsibly and strive to achieve community goals consistently, tax payers will
contribute their share by paying their taxes more dutifully. Especially when power is low
higher compliance can only be achieved on this voluntary basis. Our first hypothesis is
therefore:
H1: Tax compliance increases with the degree of trust in tax systems with low power
of authorities.
Many studies found support for the effect of audit probabilities on tax compliance as
suggested by the standard economic model of Allingham and Sandmo (1972) and have noted
that an increase in audit rates leads taxpayers to report their taxable income more truthfully
(see for example Spicer and Thomas 1982, Alm et al. 1992a, Alm et al. 1992b, Alm et al.
1995, Pommerehne and Weck-Hannemann 1996). Tax compliance can be legitimately
enforced by tax authorities with high power, thereby diminishing the voluntary character of
paying taxes in tax systems with low power of authorities and disposing tax payers to meet
their true tax liability. In tax systems with high power of authorities we therefore expect that
compliance is already enforced on an elevated level by high audit rates so that enhancing trust
in authorities will not result in even higher compliance, yielding:
H2: Tax compliance increases with the degree of enforcement exercised by tax
authorities (irrespective of the degree of trust in the tax system).
Further, to identify any effect of trust in form of tax knowledge and influence on budget
spending on tax compliance, it is important to disentangle those effects from 1) an overall
positive orientation of the taxpayer towards the tax authority in general and from 2) tax
compliance that is efficiently enforced by the tax authorities. An overall positive orientation
towards the tax authority for example can be rooted in the belief that the tax system is
desirable or that the tax authority has the legitimate power to impose taxes. In these cases
paying taxes is considered an inevitable citizens’ duty resulting in high compliance.
Enhancing trust in tax authorities will therefore not result in even higher compliance, as
taxable income is reported truthfully in any situation. On the contrary, if taxpayers have
doubts about the intentions of tax authorities and do not feel as if they have been treated fairly
or respectfully, an overall negative orientation towards tax authorities evolves which results in
tax avoidance or tax evasion. To control for this, we measure taxpayers’ orientation towards
5
tax authorities by the motivational posture “tax commitment” (Braithwaite 2003) and come up
with the following hypothesis:
H3: Tax compliance increases with the degree of an overall positive orientation
towards the tax authority.
Lastly, as paying taxes is a decision under risk and uncertainty the taxpayers’ attitude towards
risk is a further aspect which must be accounted for. A measure of the individual risk attitude
is used to address the question how the threat of audits and fines by the tax authority is
subjectively perceived. Referring to the traditional framework by Allingham and Sandmo
(1972), a stronger perception of this threat adds more concavity to the taxpayer’s utility
function where the expected penalty might now outweigh the expected benefits of evading
taxes, thus leading to higher tax compliance. To evaluate the perceived power of tax
authorities we measure individual risk preferences by using a lottery in a multiple price list
format as successfully employed by Holt and Laury (2002) and Goeree et al. (2003) and
investigate in our last hypothesis:
H4: Tax compliance increases with degree of risk aversion of the taxpayer.
3. Experimental Design and Procedure
Experimental Design
Our experiment follows a 2x3 design where we vary parameters along the authority’s power
and trust dimension. We construct two hypothetical tax systems, one with high power and the
other one with low power of authorities. For each of these two tax systems we gradually
increase trust in authorities by employing three different treatments.
Each treatment consists of two phases, only differing with respect to the second phase. In the
first phase subjects individually work for their income in the slider task (Gill and Prowse
2012), see Figure A1 in Appendix A. As investigated in the experimental literature, legitimate
assets produce rational behavior (Cherry et al. 2002). In the context of decisions under risk
and uncertainty, earned income aligns decisions more closely to the participants’ true
preferences compared to endowed income (van Dijk et al. 2001, Gneezy 2003). The
importance of effort and aspirations on tax evasion has also been shown in experimental
settings by Boylan and Sprinkle (2001) and Kirchler et al. (2009).
6
For each slider that is correctly positioned by dragging the button of the slider with the
computer-mouse from the starting position of 0 to the value of 50 a constant amount of the
experimental currency “Taler” is added to the subject’s current income. The working phase
lasts for 120 seconds, followed by the second phase in which subjects state what amount from
zero up to their earned income they want to declare for their tax report. In this phase we
implement the treatments as follows: in the Knowledge treatment (K) subjects are informed
about all public tax expenditures of the hypothetical tax system. Specifically, subjects see a
list of all tax items that constitute the hypothetical tax system on their computer screen and on
the written instructions (see Figure A2 in Appendix A). Further, they are told that the
hypothetical government will spend all the collected tax money equally on the hypothetical
tax items. In the next treatment (BS) subjects can actively influence the budget spending.
They receive exactly the same list of tax items but are allowed to decide on the item of
expenditure to which their taxes should be allocated. Subjects are also free to choose more
than one tax item or none of the tax items at all. The third treatment is the control treatment
(Con) where subjects only report their taxable income and do not get any information about
the tax system or the opportunity to decide on budget spending. Irrespective of the treatment,
the tax report is audited in the tax system with high power of authorities with a preannounced
probability of 0.25 and with an audit probability of 0.1 in the tax system with low power. In
both tax systems, underreporting taxable income engenders a penalty amounting to the
difference between the true and the declared income. In all treatments, the two phases are
repeated three times. As soon as all decisions in the second phase have been made, the next
period starts again with the working phase. Further, in order to avoid strategic behavior in
subsequent periods as a response to previous audit outcomes, subjects learn about whether
they have been detected in any period only after all three reports have been sent to the tax
authority. Consequently, subjects learn about their payoffs for each period at the end of the
experiment. This auditing procedure is communicated to all subjects before the start of the
experiment and is therefore common knowledge.
Experimental Procedure
The experiment was conducted in May 2011 and January 2012 at the Business and Economic
Research Laboratory (BaER-Lab) at the University of Paderborn and computerized using the
software z-Tree (Fischbacher 2007). For each of the two tax systems with high and low audit
probability we ran two sessions of the K, BS and Con treatments respectively. Subjects were
recruited by the online recruiting system ORSEE (Greiner 2004) and were only allowed to
7
participate in one session. In the tax system with low (high) audit probability 52 (56) subjects
participated in the BS treatment, whereas 54 (55) subjects participated in the K and 54 (55) in
the Con treatment respectively. After each subject was seated randomly to a computer
workplace in a cubicle, each detached from one another, all subjects received the same
introductory talk and were told not to communicate during the session. Instructions were then
distributed and time for a careful reading was granted. After that, an example was given with
numbers collected before the participants knew anything about the experiment, to make sure
that everybody understood the rules of the game. In line with existing experimental studies in
the tax literature, instructions were framed in a tax context (see for example Boylan and
Sprinkle 2001 and Alm et al 2010), using terms like tax, tax authority, tax report, tax base etc.
Prior to the first working phase subjects practiced on the 48 sliders for 120 seconds to assure
subjects are familiar with the slider task.
In the working phase, subjects earned their income by working on 48 sliders for 120 seconds
and receiving 1500 Taler for each correctly positioned slider. Then, in the second phase, any
fraction of this earned income could be declared as a tax base for the tax report. In both tax
systems we set the tax rate at 30 %. If an underreported tax file was detected, the difference
between the true value of the earned income and the income declared as the tax base was
subtracted from the subject’s earnings in this period. All rates and the audit probability were
held constant across periods and across treatments within the same tax system. The tax items
of the hypothetical tax system used in the K and BS treatment were taken from the federal
budget across the 14 federal ministries in Germany and attached to the instructions. To be
more specific, for each federal ministry, we identified the item with the highest tax
expenditure in the fiscal year 2009, and placed this item with the exact wording on our tax
list2 (see Table A1 in Appendix A). This setting has two main advantages: Firstly, items are
included that are found in reality, thus enhancing tax context, and secondly, as each federal
ministry is represented exactly once, bias towards taxes for a particular purpose is minimized.
The payoffs in each period were summed up and exchanged to Euro with a rate of 7500 Taler
per Euro. On top of this, subjects received a show-up fee of 2.50 €. After the final payoff was
displayed at the end of the experiment subjects were asked to answer a questionnaire which
was divided into two parts. Whereas in the first part, risk preferences were elicited using an
incentivized ten-paired lottery choice framework, in an unpaid second part, tax commitment
was measured with an eight item scale along with questions on the socio-economic
2 Two additional options „Other“ and „Neutral“ were available in case the subject was indifferent about the items listed.
8
background of the participants like age, gender etc. Each session lasted for about one hour
and fifteen minutes, subjects earned 13 € on average.
Although there are no payoff spill-overs between periods and feedback about the period
outcomes is given at the end of the experiment, rendering the decisions in each period of a
treatment independent of each other, the decisions of a subject might be driven by the same
motivational postures. Therefore, we treat every subject as one independent observation, thus
collecting in total 326 independent observations.
4. Results
We start by providing overall summary statistics. Then we present the results of non-
parametric tests based on individual data to investigate whether knowledge about tax
expenditures and taxpayer’s influence on budget spending has an effect on tax compliance.
For this, we compare the average compliance rate as the ratio of declared income in the tax-
reporting phase to the actual income earned in the working phase between the treatments
within each tax system. Subsequently, robustness checks will be made by relating these
results to further aspects discussed in the tax literature like the possible impact of income on
tax compliance and the level of effort subjects exert during the slider task. Lastly, regression
analysis is used to support the results.
Summary Statistics
From the 326 subjects who participated in one of the treatments the major part studied
economics and business administration. 47.24% of the subjects were male, 52.76% female.
Subjects were on average 22.57 years old (sd.dev.:5.45). The major fraction of subjects had
not filed a tax return in real life up to the point of the respective experiment. Across all
treatments and tax systems, 61 subjects truthfully reported their taxable income in each
period. 265 subjects reported at least once less taxable income and among them 18 subjects
reported zero in every period.
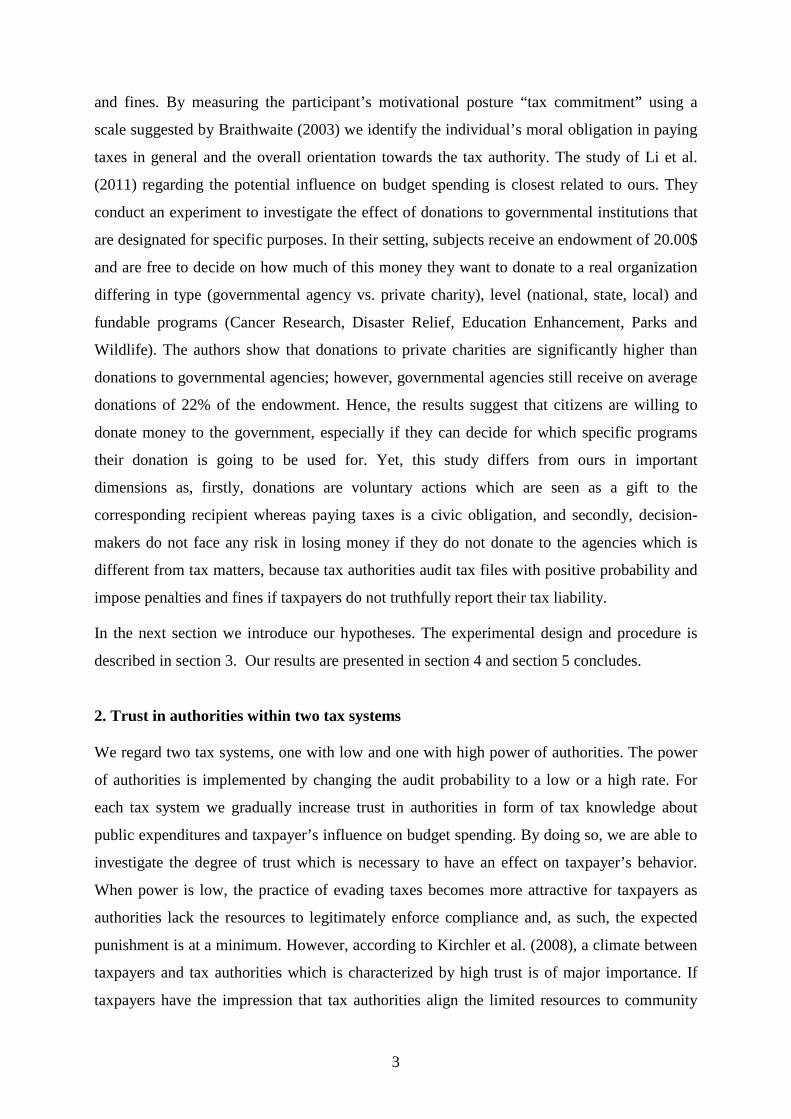
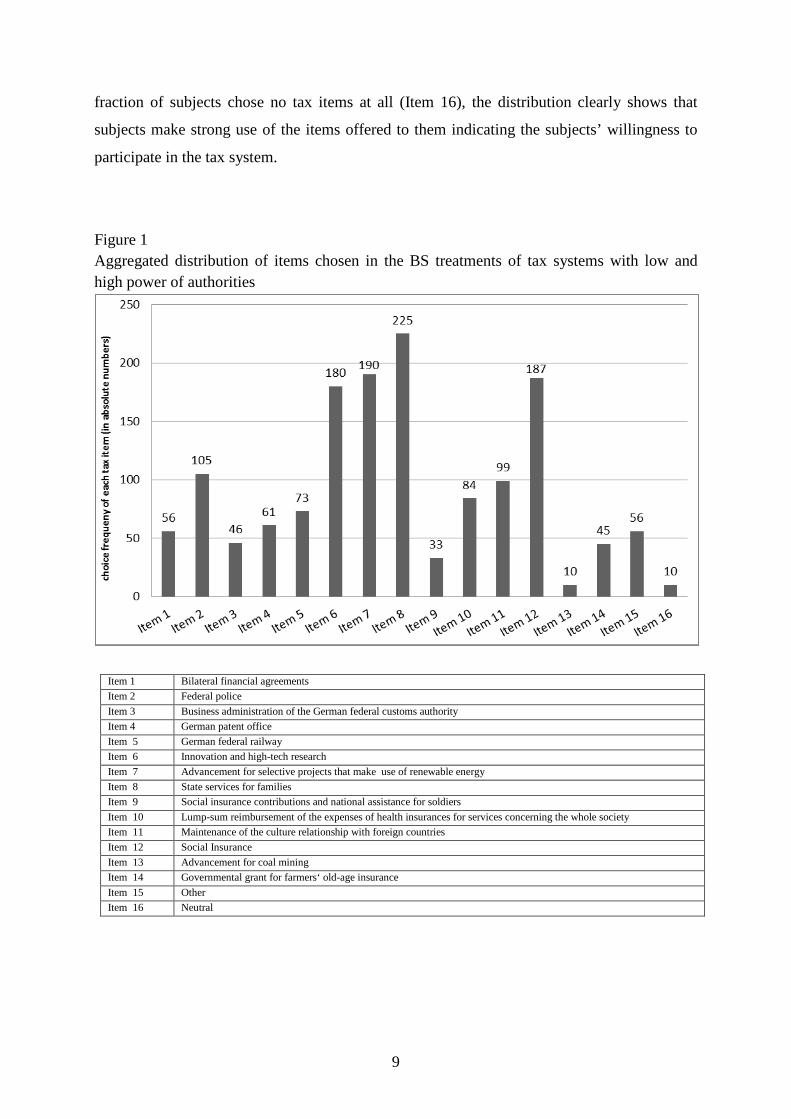
Figure 1 shows the distribution of the tax items chosen during the BS treatments of both tax
systems with high and low power of authorities. On average subjects chose in each period 4.5
tax items when reporting their taxable income. The most prominent items with a choice
frequency of well above 100 were mainly social services (Items 8 and 12), budget for
regenerative energy (Item 7) and innovation/high-tech research (Item 6). As only a very tiny
9
fraction of subjects chose no tax items at all (Item 16), the distribution clearly shows that
subjects make strong use of the items offered to them indicating the subjects’ willingness to
participate in the tax system.
Figure 1 Aggregated distribution of items chosen in the BS treatments of tax systems with low and high power of authorities
Item 1 Bilateral financial agreements Item 2 Federal police Item 3 Business administration of the German federal customs authority Item 4 German patent office Item 5 German federal railway Item 6 Innovation and high-tech research Item 7 Advancement for selective projects that make use of renewable energy Item 8 State services for families Item 9 Social insurance contributions and national assistance for soldiers Item 10 Lump-sum reimbursement of the expenses of health insurances for services concerning the whole society Item 11 Maintenance of the culture relationship with foreign countries Item 12 Social Insurance Item 13 Advancement for coal mining Item 14 Governmental grant for farmers‘ old-age insurance Item 15 Other Item 16 Neutral
10
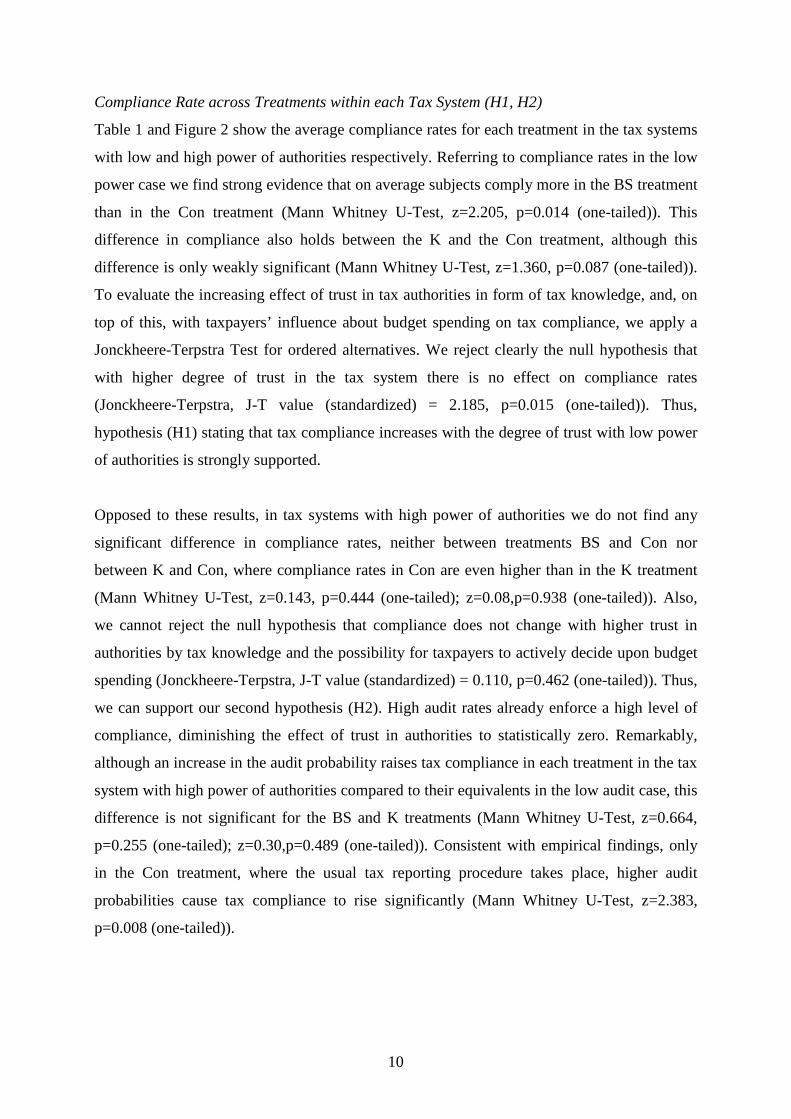
Compliance Rate across Treatments within each Tax System (H1, H2)
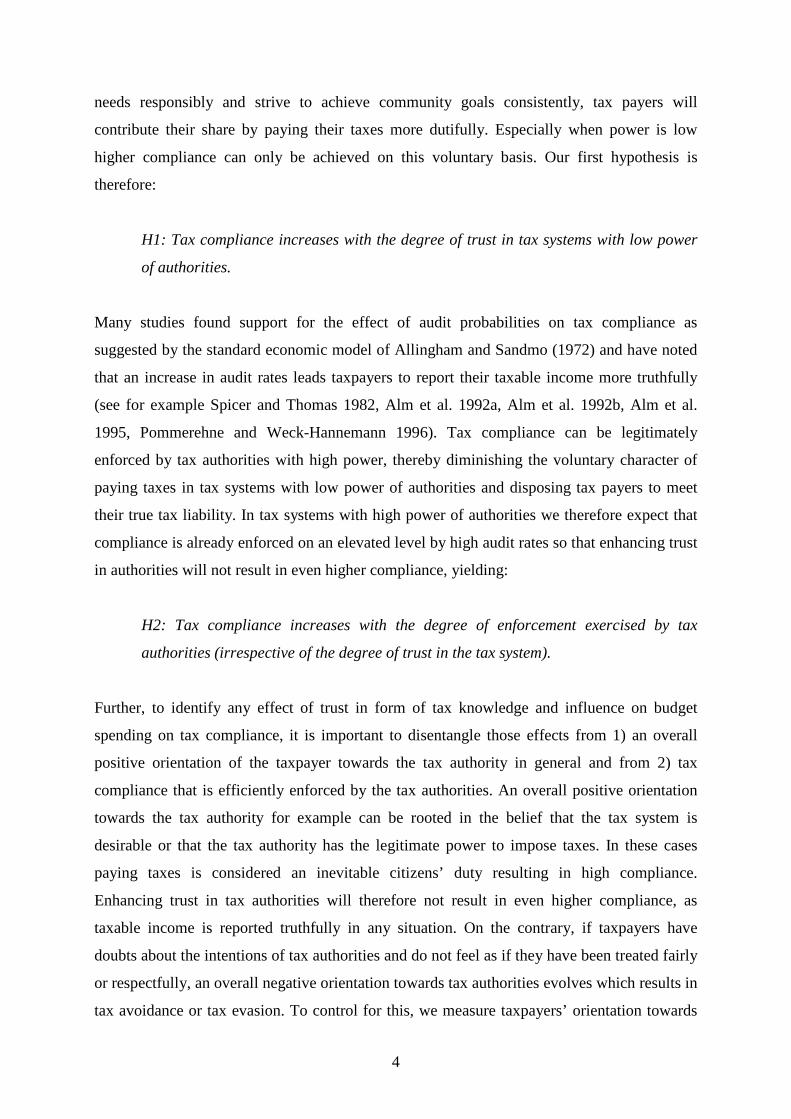
Table 1 and Figure 2 show the average compliance rates for each treatment in the tax systems
with low and high power of authorities respectively. Referring to compliance rates in the low
power case we find strong evidence that on average subjects comply more in the BS treatment
than in the Con treatment (Mann Whitney U-Test, z=2.205, p=0.014 (one-tailed)). This
difference in compliance also holds between the K and the Con treatment, although this
difference is only weakly significant (Mann Whitney U-Test, z=1.360, p=0.087 (one-tailed)).
To evaluate the increasing effect of trust in tax authorities in form of tax knowledge, and, on
top of this, with taxpayers’ influence about budget spending on tax compliance, we apply a
Jonckheere-Terpstra Test for ordered alternatives. We reject clearly the null hypothesis that
with higher degree of trust in the tax system there is no effect on compliance rates
(Jonckheere-Terpstra, J-T value (standardized) = 2.185, p=0.015 (one-tailed)). Thus,
hypothesis (H1) stating that tax compliance increases with the degree of trust with low power
of authorities is strongly supported.
Opposed to these results, in tax systems with high power of authorities we do not find any
significant difference in compliance rates, neither between treatments BS and Con nor
between K and Con, where compliance rates in Con are even higher than in the K treatment
(Mann Whitney U-Test, z=0.143, p=0.444 (one-tailed); z=0.08,p=0.938 (one-tailed)). Also,
we cannot reject the null hypothesis that compliance does not change with higher trust in
authorities by tax knowledge and the possibility for taxpayers to actively decide upon budget
spending (Jonckheere-Terpstra, J-T value (standardized) = 0.110, p=0.462 (one-tailed)). Thus,
we can support our second hypothesis (H2). High audit rates already enforce a high level of
compliance, diminishing the effect of trust in authorities to statistically zero. Remarkably,
although an increase in the audit probability raises tax compliance in each treatment in the tax
system with high power of authorities compared to their equivalents in the low audit case, this
difference is not significant for the BS and K treatments (Mann Whitney U-Test, z=0.664,
p=0.255 (one-tailed); z=0.30,p=0.489 (one-tailed)). Consistent with empirical findings, only
in the Con treatment, where the usual tax reporting procedure takes place, higher audit
probabilities cause tax compliance to rise significantly (Mann Whitney U-Test, z=2.383,
p=0.008 (one-tailed)).
11
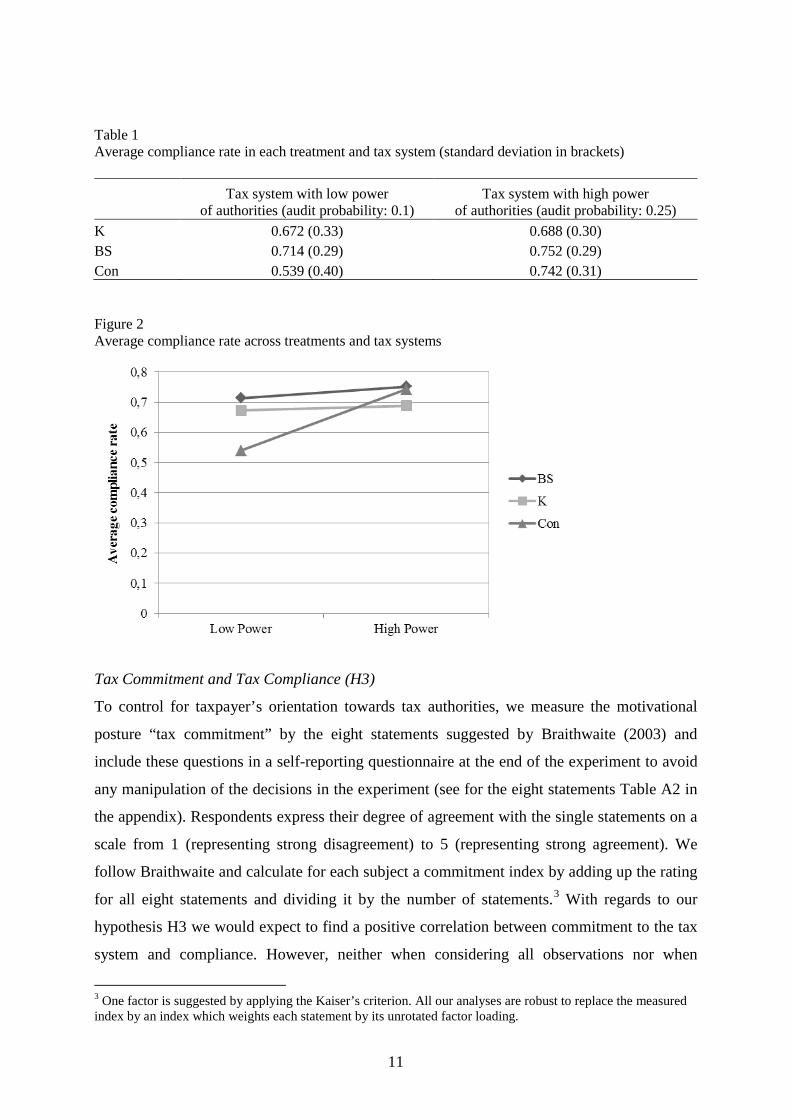
Table 1 Average compliance rate in each treatment and tax system (standard deviation in brackets)
Tax system with low power
of authorities (audit probability: 0.1) Tax system with high power
of authorities (audit probability: 0.25) K 0.672 (0.33) 0.688 (0.30) BS 0.714 (0.29) 0.752 (0.29) Con 0.539 (0.40) 0.742 (0.31)
Figure 2 Average compliance rate across treatments and tax systems
Tax Commitment and Tax Compliance (H3)
To control for taxpayer’s orientation towards tax authorities, we measure the motivational
posture “tax commitment” by the eight statements suggested by Braithwaite (2003) and
include these questions in a self-reporting questionnaire at the end of the experiment to avoid
any manipulation of the decisions in the experiment (see for the eight statements Table A2 in
the appendix). Respondents express their degree of agreement with the single statements on a
scale from 1 (representing strong disagreement) to 5 (representing strong agreement). We
follow Braithwaite and calculate for each subject a commitment index by adding up the rating
for all eight statements and dividing it by the number of statements.3 With regards to our
hypothesis H3 we would expect to find a positive correlation between commitment to the tax
system and compliance. However, neither when considering all observations nor when
3 One factor is suggested by applying the Kaiser’s criterion. All our analyses are robust to replace the measured index by an index which weights each statement by its unrotated factor loading.
12
inspecting treatments with low and high power of authorities separately, we do not find any
evidence to reject the null hypothesis of no correlation between the commitment index and tax
compliance (Spearman’s rho (overall): 0.01, p=0.41; Spearman’s rho (low tax
system):0.0978, p=0.11; Spearman’s rho (high tax system):0.007, p=0.46). Using a
Jonckheere-Terpstra Test to examine whether the commitment index is equally distributed
across all treatments within the same tax system we see that there is weak significant evidence
that the commitment index differs in the treatments framed in the tax system with high power
(Jonckheere-Terpstra, J-T value (standardized) = 1.788, p=0.074 (two-tailed)). However,
when looking at each of these treatments separately, in none of the treatments commitment is
positively related to tax compliance implying that the decision with respect to compliance is
independent of one’s orientation towards the tax authorities (Spearman’s rho (treatment BS):
0.0194, p=0.45; Spearman’s rho (treatment K): 0.11, p=0.22; Spearman’s rho (treatment
Con): 0.13, p=0.17). The treatments in the tax system with the low detection rate do not differ
significantly with regards to tax commitment (Jonckheere-Terpstra, J-T value (standardized)
= 0.475, p=0.635 (two-tailed)).
In summary, we interpret our findings in the way that the overall positive orientation towards
tax authorities measured by the motivational posture “tax commitment” does not correlate
with tax compliance, neither when we look at the overall sample nor in each single tax
system. Therefore we reject hypothesis H3 and infer that our results with respect to
compliance cannot be ascribed to the subjects’ orientation towards tax authorities.
Risk Attitude and Tax Compliance (H4)
We measure risk attitudes by using the binary lottery framework of Holt and Laury (2002). In
this design subjects decide between two lotteries A and B, as shown in Table 2. Lottery A
yields an outcome of 10 € with a probability p, and an outcome of 8 € with a probability (1-p).
Accordingly, Lottery B provides an outcome of 19.25 € with the same probability p and
0.50 € with the probability (1-p). Regarding the differences in outcomes for each of the two
lotteries we speak of lottery A as being “safer” than lottery B. The probability p increases
across the decisions in steps of 0.1 so that obtaining the higher outcome in each lottery
becomes more likely. Therefore, the expected payoffs change over the course of decisions, so
it is assumed that risk neutral agents choose lottery A exactly four times before switching
once and for all to lottery B. Similarly, switching before (after) that point indicates more risk-
seeking (more risk-averse) agents. The switching point thus defines a threshold p* where the
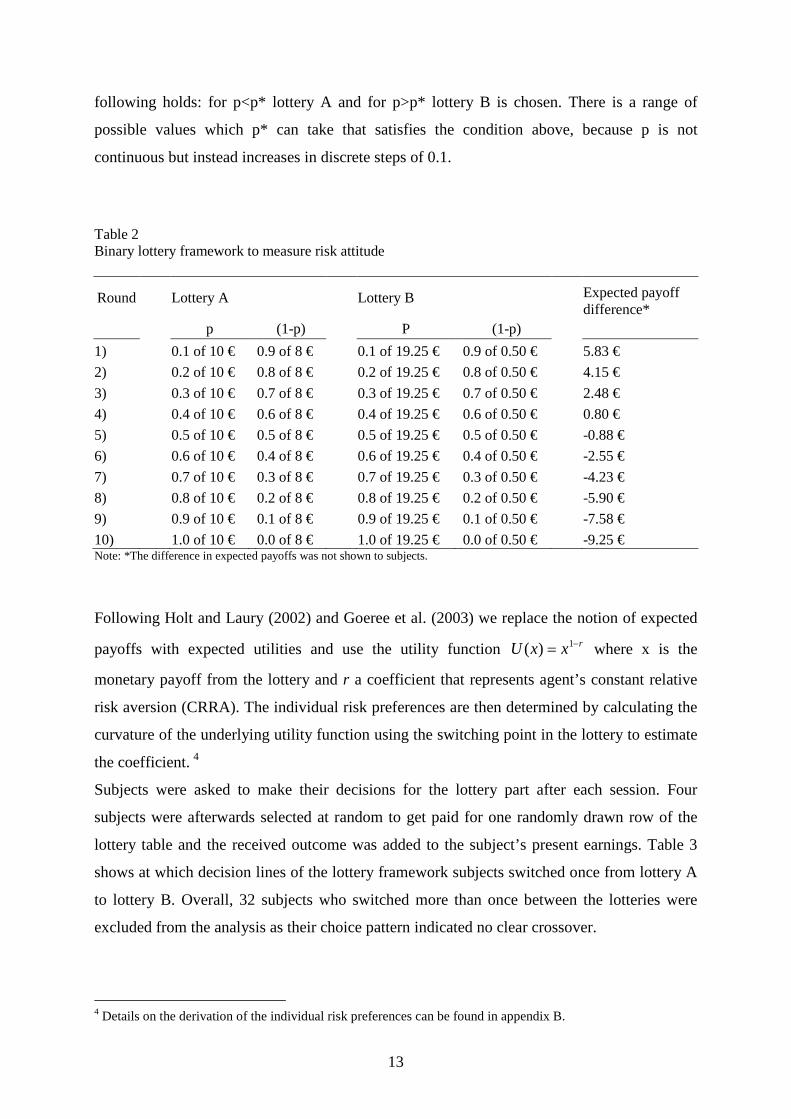
13
following holds: for p<p* lottery A and for p>p* lottery B is chosen. There is a range of
possible values which p* can take that satisfies the condition above, because p is not
continuous but instead increases in discrete steps of 0.1. Table 2 Binary lottery framework to measure risk attitude
Round Lottery A Lottery B Expected payoff difference*
p (1-p) P (1-p) 1)
0.1 of 10 €
0.9 of 8 €
0.1 of 19.25 €
0.9 of 0.50 €
5.83 €
2)
0.2 of 10 € 0.8 of 8 €
0.2 of 19.25 €
0.8 of 0.50 €
4.15 €
3)
0.3 of 10 € 0.7 of 8 €
0.3 of 19.25 €
0.7 of 0.50 €
2.48 €
4)
0.4 of 10 € 0.6 of 8 €
0.4 of 19.25 €
0.6 of 0.50 €
0.80 €
5)
0.5 of 10 € 0.5 of 8 €
0.5 of 19.25 €
0.5 of 0.50 €
-0.88 €
6)
0.6 of 10 € 0.4 of 8 €
0.6 of 19.25 €
0.4 of 0.50 €
-2.55 €
7)
0.7 of 10 € 0.3 of 8 €
0.7 of 19.25 €
0.3 of 0.50 €
-4.23 €
8)
0.8 of 10 € 0.2 of 8 €
0.8 of 19.25 €
0.2 of 0.50 €
-5.90 €
9)
0.9 of 10 € 0.1 of 8 €
0.9 of 19.25 €
0.1 of 0.50 €
-7.58 €
10) 1.0 of 10 € 0.0 of 8 € 1.0 of 19.25 € 0.0 of 0.50 € -9.25 € Note: *The difference in expected payoffs was not shown to subjects.
Following Holt and Laury (2002) and Goeree et al. (2003) we replace the notion of expected
payoffs with expected utilities and use the utility function rxxU −= 1)( where x is the
monetary payoff from the lottery and r a coefficient that represents agent’s constant relative
risk aversion (CRRA). The individual risk preferences are then determined by calculating the
curvature of the underlying utility function using the switching point in the lottery to estimate
the coefficient. 4
Subjects were asked to make their decisions for the lottery part after each session. Four
subjects were afterwards selected at random to get paid for one randomly drawn row of the
lottery table and the received outcome was added to the subject’s present earnings. Table 3
shows at which decision lines of the lottery framework subjects switched once from lottery A
to lottery B. Overall, 32 subjects who switched more than once between the lotteries were
excluded from the analysis as their choice pattern indicated no clear crossover.
4 Details on the derivation of the individual risk preferences can be found in appendix B.
14
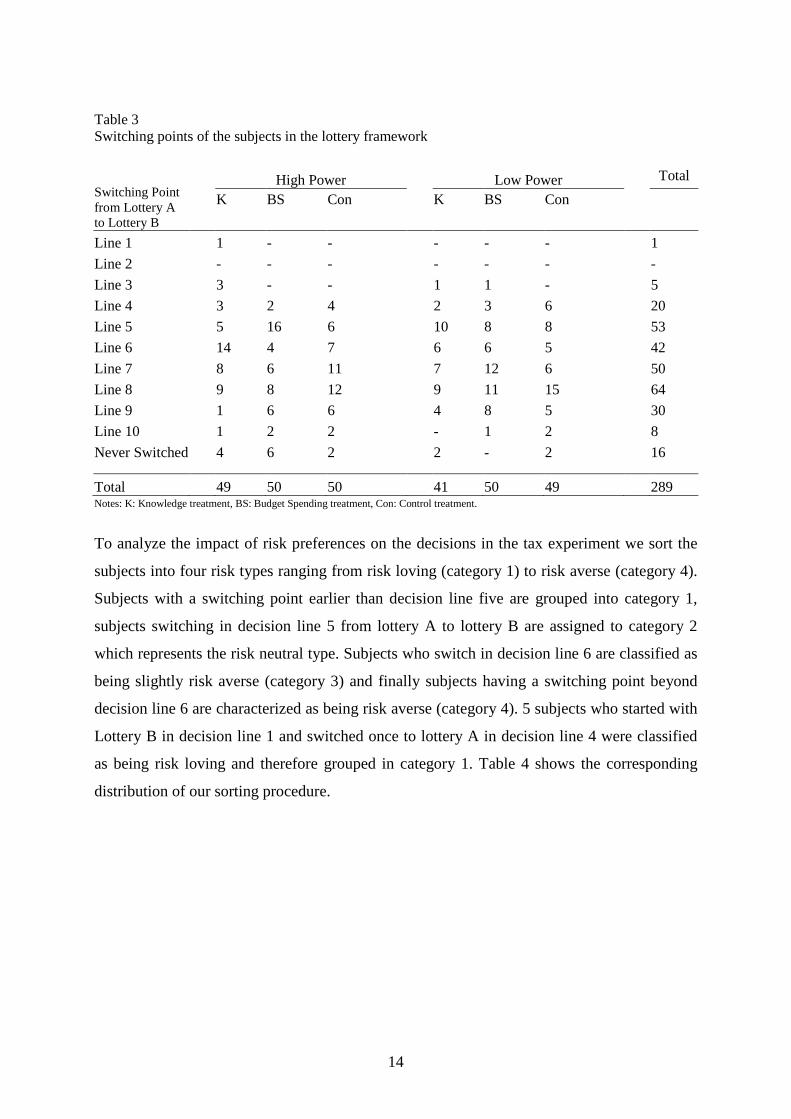
Table 3 Switching points of the subjects in the lottery framework
Switching Point from Lottery A to Lottery B
High Power
Low Power
Total
K BS Con K BS Con
Line 1
1 - -
- - -
1 Line 2
- - -
- - -
-
Line 3
3 - -
1 1 -
5 Line 4
3 2 4
2 3 6
20
Line 5
5 16 6
10 8 8
53 Line 6
14 4 7
6 6 5
42
Line 7
8 6 11
7 12 6
50 Line 8
9 8 12
9 11 15
64
Line 9
1 6 6
4 8 5
30 Line 10
1 2 2
- 1 2
8
Never Switched 4 6 2
2 - 2
16
Total 49 50 50 41 50 49 289 Notes: K: Knowledge treatment, BS: Budget Spending treatment, Con: Control treatment. To analyze the impact of risk preferences on the decisions in the tax experiment we sort the
subjects into four risk types ranging from risk loving (category 1) to risk averse (category 4).
Subjects with a switching point earlier than decision line five are grouped into category 1,
subjects switching in decision line 5 from lottery A to lottery B are assigned to category 2
which represents the risk neutral type. Subjects who switch in decision line 6 are classified as
being slightly risk averse (category 3) and finally subjects having a switching point beyond
decision line 6 are characterized as being risk averse (category 4). 5 subjects who started with
Lottery B in decision line 1 and switched once to lottery A in decision line 4 were classified
as being risk loving and therefore grouped in category 1. Table 4 shows the corresponding
distribution of our sorting procedure.
15
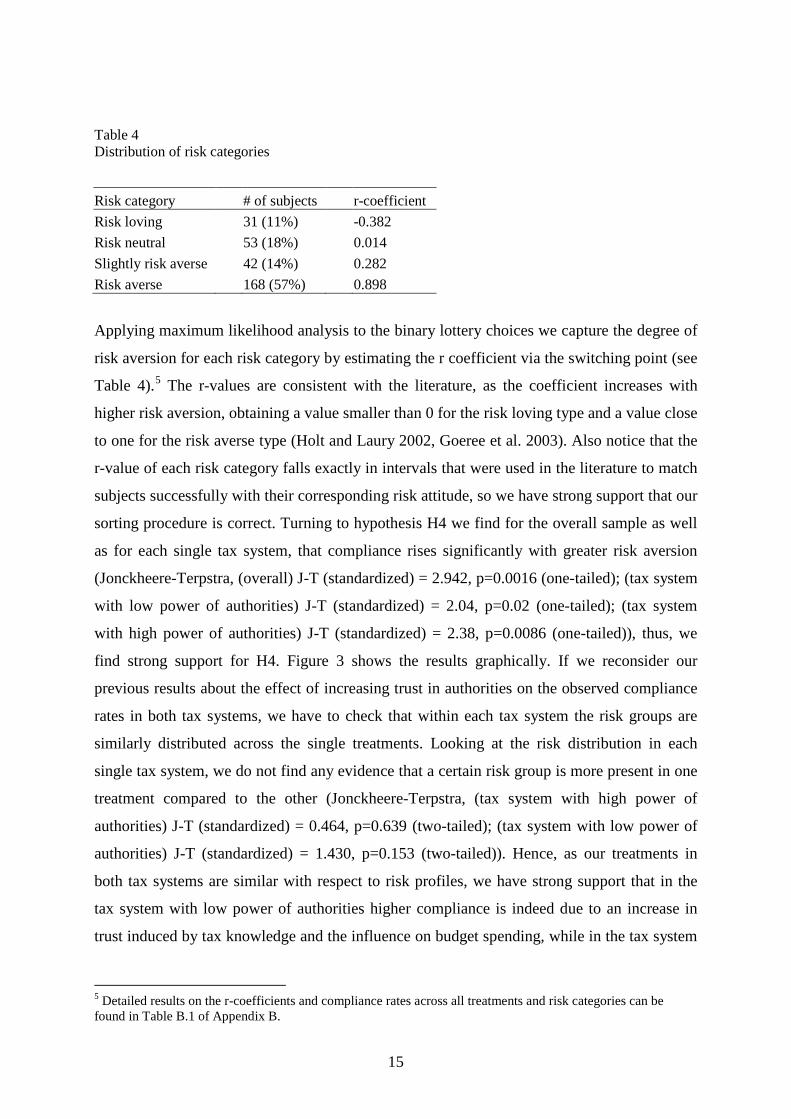
Table 4 Distribution of risk categories
Risk category # of subjects r-coefficient Risk loving
31 (11%)
-0.382
Risk neutral
53 (18%)
0.014 Slightly risk averse
42 (14%)
0.282
Risk averse 168 (57%) 0.898
Applying maximum likelihood analysis to the binary lottery choices we capture the degree of
risk aversion for each risk category by estimating the r coefficient via the switching point (see
Table 4).5 The r-values are consistent with the literature, as the coefficient increases with
higher risk aversion, obtaining a value smaller than 0 for the risk loving type and a value close
to one for the risk averse type (Holt and Laury 2002, Goeree et al. 2003). Also notice that the
r-value of each risk category falls exactly in intervals that were used in the literature to match
subjects successfully with their corresponding risk attitude, so we have strong support that our
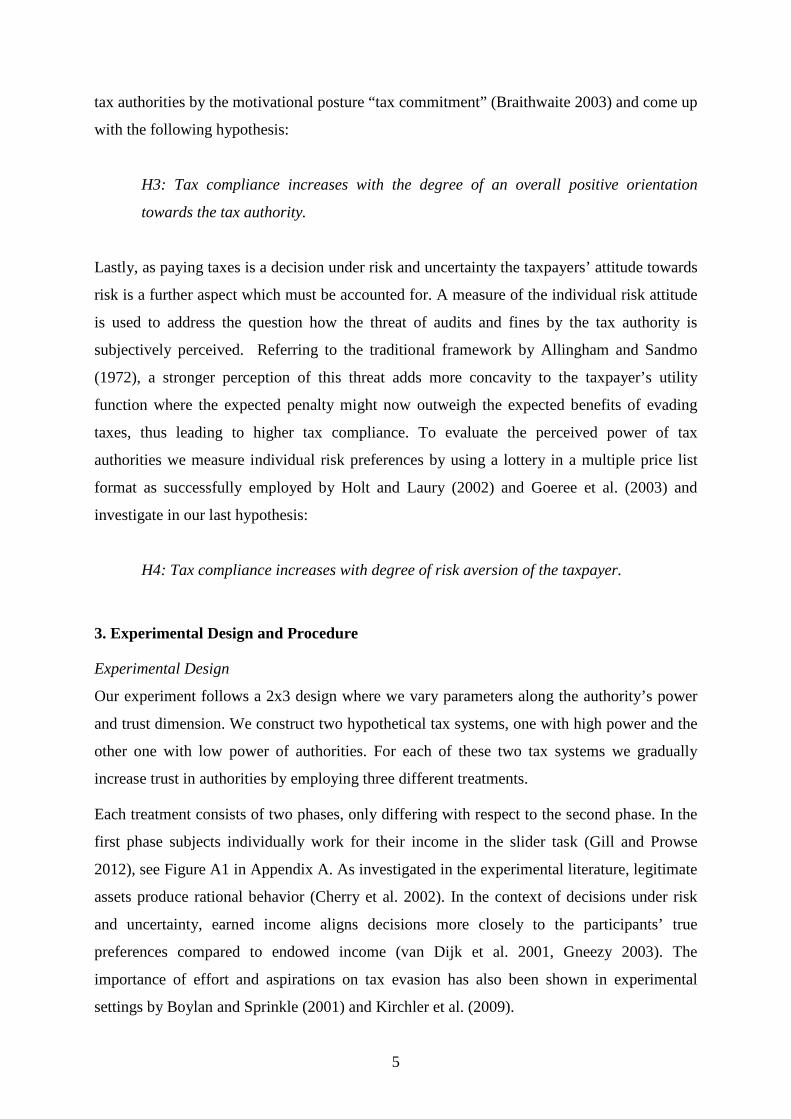
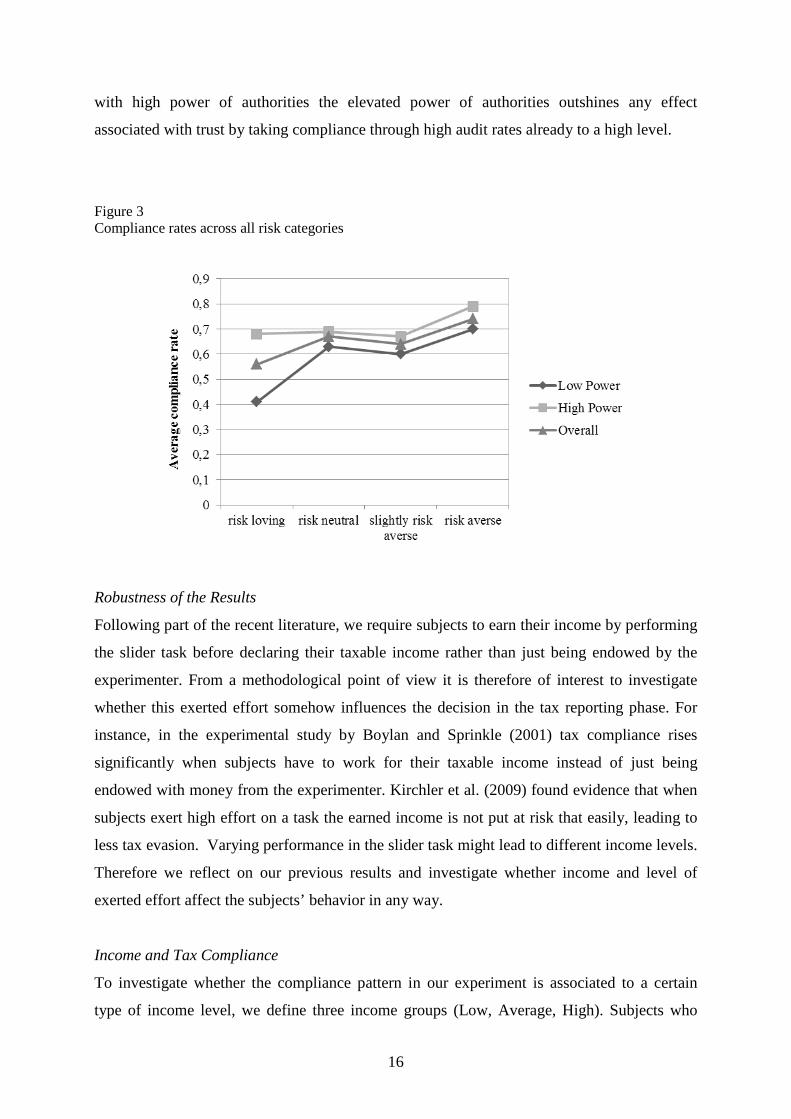
sorting procedure is correct. Turning to hypothesis H4 we find for the overall sample as well
as for each single tax system, that compliance rises significantly with greater risk aversion
(Jonckheere-Terpstra, (overall) J-T (standardized) = 2.942, p=0.0016 (one-tailed); (tax system
with low power of authorities) J-T (standardized) = 2.04, p=0.02 (one-tailed); (tax system
with high power of authorities) J-T (standardized) = 2.38, p=0.0086 (one-tailed)), thus, we
find strong support for H4. Figure 3 shows the results graphically. If we reconsider our
previous results about the effect of increasing trust in authorities on the observed compliance
rates in both tax systems, we have to check that within each tax system the risk groups are
similarly distributed across the single treatments. Looking at the risk distribution in each
single tax system, we do not find any evidence that a certain risk group is more present in one
treatment compared to the other (Jonckheere-Terpstra, (tax system with high power of
authorities) J-T (standardized) = 0.464, p=0.639 (two-tailed); (tax system with low power of
authorities) J-T (standardized) = 1.430, p=0.153 (two-tailed)). Hence, as our treatments in
both tax systems are similar with respect to risk profiles, we have strong support that in the
tax system with low power of authorities higher compliance is indeed due to an increase in
trust induced by tax knowledge and the influence on budget spending, while in the tax system
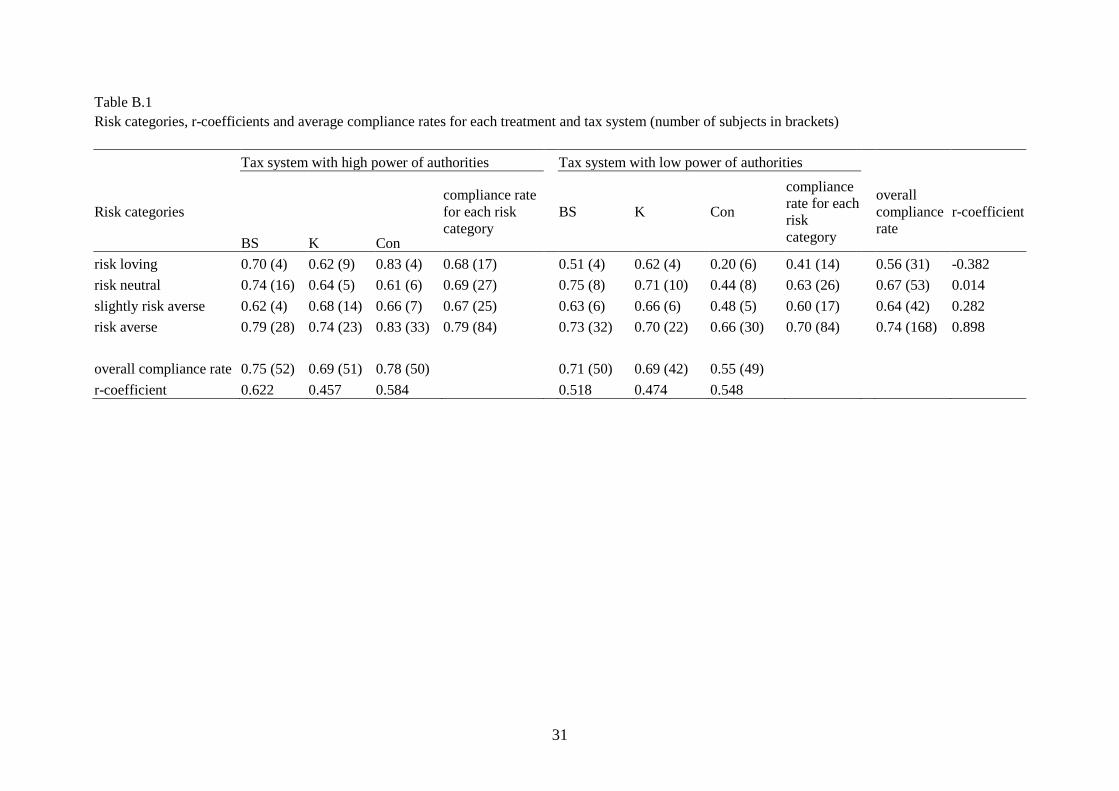
5 Detailed results on the r-coefficients and compliance rates across all treatments and risk categories can be found in Table B.1 of Appendix B.
16
with high power of authorities the elevated power of authorities outshines any effect
associated with trust by taking compliance through high audit rates already to a high level.
Figure 3 Compliance rates across all risk categories
Robustness of the Results
Following part of the recent literature, we require subjects to earn their income by performing
the slider task before declaring their taxable income rather than just being endowed by the
experimenter. From a methodological point of view it is therefore of interest to investigate
whether this exerted effort somehow influences the decision in the tax reporting phase. For
instance, in the experimental study by Boylan and Sprinkle (2001) tax compliance rises
significantly when subjects have to work for their taxable income instead of just being
endowed with money from the experimenter. Kirchler et al. (2009) found evidence that when
subjects exert high effort on a task the earned income is not put at risk that easily, leading to
less tax evasion. Varying performance in the slider task might lead to different income levels.
Therefore we reflect on our previous results and investigate whether income and level of
exerted effort affect the subjects’ behavior in any way.
Income and Tax Compliance
To investigate whether the compliance pattern in our experiment is associated to a certain
type of income level, we define three income groups (Low, Average, High). Subjects who
17
earned on average equal or less than 97,500 Taler in the slider task were assigned to the low
group, those who earned between 97,500 Taler and 114,000 were put in the average group,
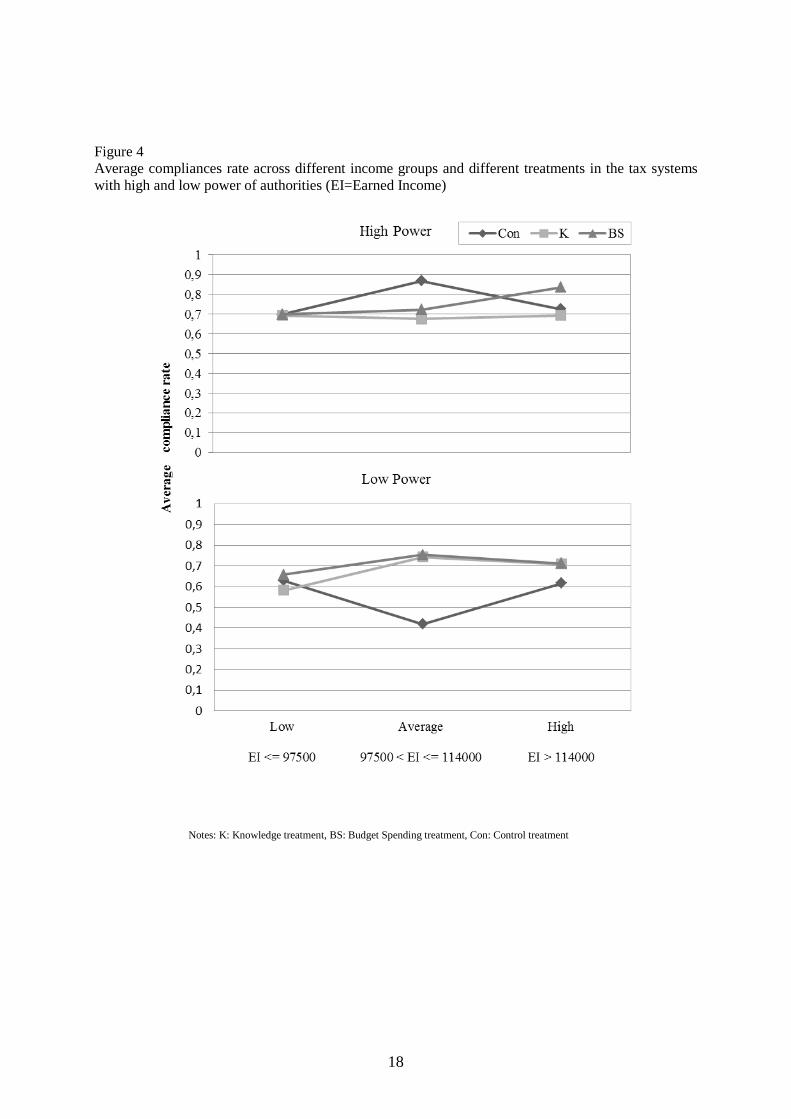
and lastly the high group consisted of subjects earning more than 114,000 Taler. Figure 4
shows the average compliance rates in the three different income groups for each treatment
and tax system. Analyzing the complete dataset across all tax systems and treatments we do
not find any evidence that income is somehow related to tax compliance (Jonckheere-
Terpstra, J-T value (standardized) = 1.000, p=0.317 (two-tailed)). This result holds also for
each tax system (Jonckheere-Terpstra, J-T value (standardized) = 0.901, p=0.367 (two-tailed);
J-T value (standardized) =0.887, p=0.375 (two-tailed)), and we find no support for a
significant relationship between income and compliance either in any of the single treatments.
Thus, we conclude that in our experiment income is not related to compliance by any means.
Exerted Effort and Tax Compliance
We test the potential impact of effort on tax compliance by using the difference in subjects’
incomes as a measure of change in exerted effort for each pair of periods. If there is a
significant increase in income from one period to the other we assume that relatively more
effort was exerted to achieve this higher income level, and, the other way around, we assume
relatively lower effort exerted if income decreased from one period to the other.
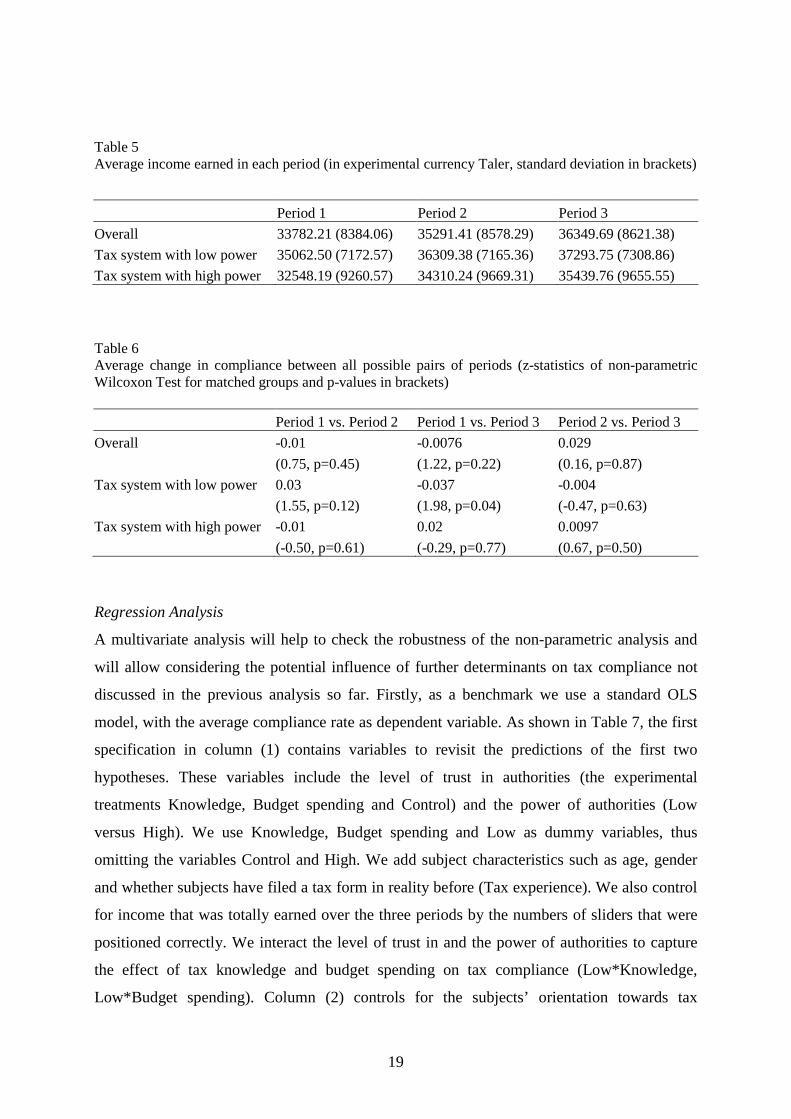
Table 5 shows the average income earned in each period overall and separated for each tax
system. When comparing all the paid periods pair-wise in the overall dataset and for each tax
system individually, we find that the level of income increases significantly from the former
to the later period indicating that relatively more effort was always exerted from the previous
to the subsequent period. However, using the non-parametric Wilcoxon-Test for matched
groups, we observe only in one case (tax system with low power of authorities, period 1 vs.
period 3) a significant change in compliance, in all other cases we do not find any support
which speaks for a relationship between effort and compliance, neither overall nor in each
single tax system (Table 6). Therefore, we can infer that, in our experiment, exerted effort on
the task and tax compliance are not related to each other.
18
Figure 4 Average compliances rate across different income groups and different treatments in the tax systems with high and low power of authorities (EI=Earned Income)
Notes: K: Knowledge treatment, BS: Budget Spending treatment, Con: Control treatment
19
Table 5 Average income earned in each period (in experimental currency Taler, standard deviation in brackets)
Period 1 Period 2 Period 3 Overall 33782.21 (8384.06) 35291.41 (8578.29) 36349.69 (8621.38) Tax system with low power 35062.50 (7172.57) 36309.38 (7165.36) 37293.75 (7308.86) Tax system with high power 32548.19 (9260.57) 34310.24 (9669.31) 35439.76 (9655.55) Table 6 Average change in compliance between all possible pairs of periods (z-statistics of non-parametric Wilcoxon Test for matched groups and p-values in brackets) Period 1 vs. Period 2 Period 1 vs. Period 3 Period 2 vs. Period 3 Overall -0.01 -0.0076 0.029
(0.75, p=0.45) (1.22, p=0.22) (0.16, p=0.87)
Tax system with low power 0.03 -0.037 -0.004
(1.55, p=0.12) (1.98, p=0.04) (-0.47, p=0.63)
Tax system with high power -0.01 0.02 0.0097 (-0.50, p=0.61) (-0.29, p=0.77) (0.67, p=0.50)
Regression Analysis
A multivariate analysis will help to check the robustness of the non-parametric analysis and
will allow considering the potential influence of further determinants on tax compliance not
discussed in the previous analysis so far. Firstly, as a benchmark we use a standard OLS
model, with the average compliance rate as dependent variable. As shown in Table 7, the first
specification in column (1) contains variables to revisit the predictions of the first two
hypotheses. These variables include the level of trust in authorities (the experimental
treatments Knowledge, Budget spending and Control) and the power of authorities (Low
versus High). We use Knowledge, Budget spending and Low as dummy variables, thus
omitting the variables Control and High. We add subject characteristics such as age, gender
and whether subjects have filed a tax form in reality before (Tax experience). We also control
for income that was totally earned over the three periods by the numbers of sliders that were
positioned correctly. We interact the level of trust in and the power of authorities to capture
the effect of tax knowledge and budget spending on tax compliance (Low*Knowledge,
Low*Budget spending). Column (2) controls for the subjects’ orientation towards tax
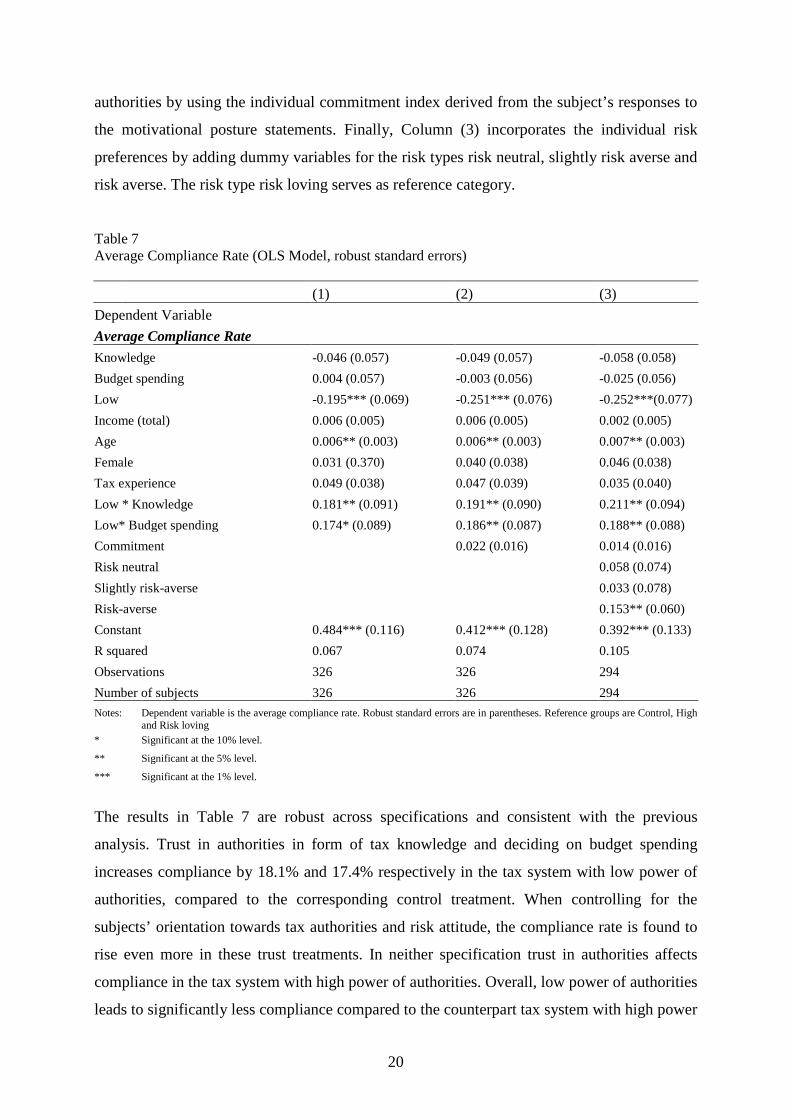
20
authorities by using the individual commitment index derived from the subject’s responses to
the motivational posture statements. Finally, Column (3) incorporates the individual risk
preferences by adding dummy variables for the risk types risk neutral, slightly risk averse and
risk averse. The risk type risk loving serves as reference category.
Table 7 Average Compliance Rate (OLS Model, robust standard errors) (1) (2) (3) Dependent Variable
Average Compliance Rate Knowledge -0.046 (0.057) -0.049 (0.057) -0.058 (0.058) Budget spending 0.004 (0.057) -0.003 (0.056) -0.025 (0.056) Low
-0.195*** (0.069) -0.251*** (0.076) -0.252***(0.077)
Income (total) 0.006 (0.005) 0.006 (0.005) 0.002 (0.005) Age
0.006** (0.003) 0.006** (0.003) 0.007** (0.003)
Female 0.031 (0.370) 0.040 (0.038) 0.046 (0.038) Tax experience 0.049 (0.038) 0.047 (0.039) 0.035 (0.040) Low * Knowledge 0.181** (0.091) 0.191** (0.090) 0.211** (0.094) Low* Budget spending 0.174* (0.089) 0.186** (0.087) 0.188** (0.088) Commitment
0.022 (0.016) 0.014 (0.016)
Risk neutral
0.058 (0.074) Slightly risk-averse
0.033 (0.078)
Risk-averse
0.153** (0.060) Constant 0.484*** (0.116) 0.412*** (0.128) 0.392*** (0.133) R squared 0.067 0.074 0.105 Observations 326 326 294 Number of subjects 326 326 294
Notes: Dependent variable is the average compliance rate. Robust standard errors are in parentheses. Reference groups are Control, High and Risk loving
* Significant at the 10% level.
** Significant at the 5% level.
*** Significant at the 1% level.
The results in Table 7 are robust across specifications and consistent with the previous
analysis. Trust in authorities in form of tax knowledge and deciding on budget spending
increases compliance by 18.1% and 17.4% respectively in the tax system with low power of
authorities, compared to the corresponding control treatment. When controlling for the
subjects’ orientation towards tax authorities and risk attitude, the compliance rate is found to
rise even more in these trust treatments. In neither specification trust in authorities affects
compliance in the tax system with high power of authorities. Overall, low power of authorities
leads to significantly less compliance compared to the counterpart tax system with high power
21
of authorities. Taking these results together we find additional support for our hypotheses H1
and H2. The subjects’ orientation towards tax authorities has no effect on compliance, but risk
attitude does influence compliance as risk-averse subjects report significantly more taxable
income than risk-loving subjects. Income, gender and tax experience do not influence
compliant behavior. Age has a positive impact on compliance in each specification, however,
the effect is rather small.
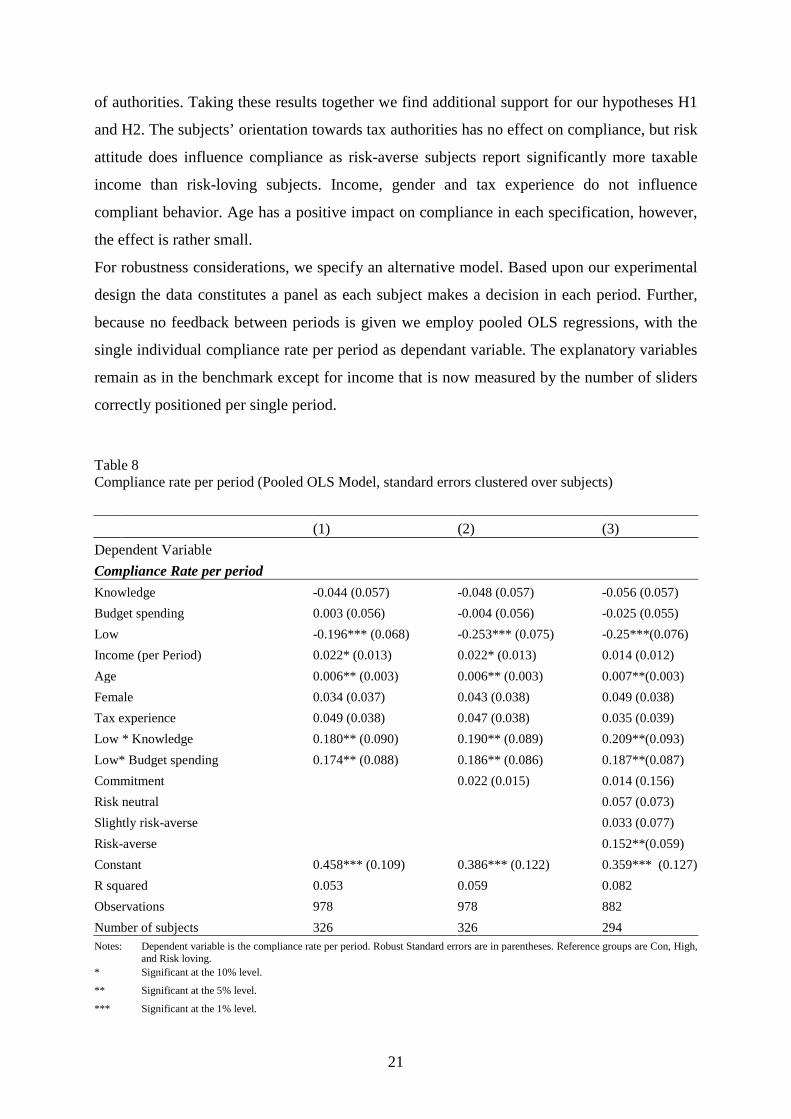
For robustness considerations, we specify an alternative model. Based upon our experimental
design the data constitutes a panel as each subject makes a decision in each period. Further,
because no feedback between periods is given we employ pooled OLS regressions, with the
single individual compliance rate per period as dependant variable. The explanatory variables
remain as in the benchmark except for income that is now measured by the number of sliders
correctly positioned per single period.
Table 8 Compliance rate per period (Pooled OLS Model, standard errors clustered over subjects)
(1) (2) (3) Dependent Variable
Compliance Rate per period Knowledge -0.044 (0.057) -0.048 (0.057) -0.056 (0.057) Budget spending 0.003 (0.056) -0.004 (0.056) -0.025 (0.055) Low
-0.196*** (0.068) -0.253*** (0.075) -0.25***(0.076)
Income (per Period) 0.022* (0.013) 0.022* (0.013) 0.014 (0.012) Age
0.006** (0.003) 0.006** (0.003) 0.007**(0.003)
Female 0.034 (0.037) 0.043 (0.038) 0.049 (0.038) Tax experience 0.049 (0.038) 0.047 (0.038) 0.035 (0.039) Low * Knowledge 0.180** (0.090) 0.190** (0.089) 0.209**(0.093) Low* Budget spending 0.174** (0.088) 0.186** (0.086) 0.187**(0.087) Commitment
0.022 (0.015) 0.014 (0.156)
Risk neutral
0.057 (0.073) Slightly risk-averse
0.033 (0.077)
Risk-averse
0.152**(0.059) Constant 0.458*** (0.109) 0.386*** (0.122) 0.359*** (0.127) R squared 0.053 0.059 0.082 Observations 978 978 882 Number of subjects 326 326 294
Notes: Dependent variable is the compliance rate per period. Robust Standard errors are in parentheses. Reference groups are Con, High, and Risk loving.
* Significant at the 10% level.
** Significant at the 5% level.
*** Significant at the 1% level.
22
As shown in Table 8 the results stay qualitatively the same compared to the benchmark and
almost do not vary in quantitative terms either. Only two exceptions can be seen. The increase
in compliance by actively influencing budget spending in the tax system with low power of
authorities is also in the first specification significant at the 5% level. The other exception
concerns the income earned in each period. In the first two specifications there is a
significantly positive effect on compliance. However, after we control for subjects’
orientation towards tax authorities along with risk attitude this statistical significance
disappears.
5. Discussion and Conclusion
In the present paper, we examine the potential impact of tax knowledge about public
expenditures and taxpayers’ influence to prioritize budget spending on tax compliance.
Embedded in two hypothetical tax systems with high and low power of authorities
respectively, we investigate in what specific tax system trust in authorities is of major
relevance. To clearly disentangle any effect from factors that are known to influence tax
compliance from previous studies, we control for tax commitment, risk attitude, income and
effort exerted on the task in the experiment. Tax compliance is higher in tax systems with low
power of authorities when providing complete transparency about public expenditures and
when taxpayers are given the possibility to decide on the use of their taxes. With a powerful
tax authority in place which is reflected in high audit rates, compliance does not change when
increasing trust in authorities. Further, we controlled for various potential determinants of tax
compliance other than trust in authorities. By measuring the overall orientation towards tax
authorities through the motivational posture “tax commitment” we made sure that observed
compliance rates are not driven by orientations which are disproportionally in favor of or
opposed to tax authorities or general attitudes towards paying taxes. We find that “tax
commitment” and tax compliance are not related to each other, and thus, do not explain our
results. As we determined the subjects’ risk attitudes as a measure of the perceived power of
authorities we found evidence that compliance increases with the degree of risk aversion.
However, all treatments in both tax systems with low and high power of authorities display
similar risk profiles so that our main results are not affected by an uneven distribution of risk,
biasing compliance in a particular direction. Factors like income or the level of effort which
was exerted to perform the task are not related to compliance in any way. Our results have
important policy implications as obviously the mere hypothetical possibility to express
23
preferences concerning budget spending influences tax compliance. Tax authorities can
provide taxpayers with information along with the annual tax declaration about the different
tax items, the volume of the federal budget and a feedback mechanism to express preferences
about the allocation of their tax dollars. This is a realizable avenue for tax authorities to
increase the transparency of the tax system and to shape budget goals by gauging how citizens
value public services. Providing information on the use of taxes for citizens through
designated websites, as in the case of the Federal budget in Germany, or collecting
information on citizens’ preferences as demonstrated by local governments in Washington
State are therefore promising ways to increase tax compliance and are in particular much
easier to implement than increasing direct democracy by letting the citizens vote on specific
tax funds.
However, the fact that the study is conducted in the laboratory with students as subjects
provides reasons for caution. As described in the analysis the major fraction of subjects had
no experience in filing a tax return and the overall size of the monetary compensation was
relatively limited compared to the annual salary of the average taxpayer. Thus, the decision to
allocate small stakes on tax items might be different from reactions of someone who regularly
works for money and receives a much higher annual income. Additionally, the tax items in
the experiment were of hypothetical nature which sets limits to generalize our findings.
Further research need to investigate the robustness of our results with different mechanisms to
reveal citizen service preferences in a more heterogeneous and diverse population. Still, our
findings mark an important starting point creating an effective way of increasing tax
compliance in controlled experiments. Trust, which has been found to be the essential
mechanism to moderate interactions in organizational and business relations in countless
studies, fuels tax compliance when governmental control is far from being perfect.
24
Acknowledgements
We are grateful to the University of Paderborn for providing funds to finance the experiments.
We thank Mark Baukmann, Tim Harrenkamp, Nico Kirwald, Christoph Rolfes and Matthias
Rüther for able research assistance in programming the experimental software and running the
sessions as well as helpful discussions when designing the experiment. We thank the seminar
participants of the International Conference “Shadow Economy - Tax Evasion and Money
Laundering” held 2011 in Münster, the “1st FAU Workshop on Tax Compliance” held 2012
in Nuremberg, the “11th Journées Louis-André Gérard-Varet” held 2012 in Marseille and the
“Economic Science Association European Conference 2012” in Cologne, in particular Thiess
Büttner, Erich Kirchler, Marco Maffezzoli, Stefan Muehlbacher and Matthias Wibral for
valuable comments.
References
Alm, J., Cherry, T., Jones, M. and McKee, M. (2010): Taxpayer Information Assistance
Services and Tax Compliance Behavior. Journal of Economic Psychology, Vol.
31(4): 577–586.
Alm, J., Jackson, B. R. and McKee, M. (1992a): Estimating the Determinants of Taxpayer
Compliance with Experimental Data. National Tax Journal, Vol. 45(1): 107–114.
Alm, J., Jackson, B. R. and McKee, M. (1993): Fiscal exchange, collective decision
institutions, and tax compliance. Journal of Economic Behavior & Organization,
Vol. 22(3): 285–303.
Alm, J., McClelland, G. H. and Schulze, W. D. (1992b): Why do people pay taxes? Journal of
Public Economics, Vol. 48(1): 21-38.
Alm, J., McClelland, G. H. and Schulze, W. D. (1999): Changing the Social Norm of Tax
Compliance by Voting. Kyklos, Vol. 52(2): 141–171.
Alm, J., Sanchez, I. and de Juan, A. (1995): Economic and noneconomic factors in tax
compliance. Kyklos, Vol. 48(1): 3-18.
Allingham, M. G. and Sandmo, A. (1972): Income Tax Evasion: A Theoretical Analysis.
Journal of Public Economics, Vol. 1: 323–338.
Boylan, S. J. and Sprinkle, G. B. (2001): Experimental evidence on the relation between tax
rates and compliance: The effect of earned vs. endowed income. The Journal of
the American Taxation Association, Vol. 23(1): 75–90.
25
Braithwaite, V. (2003): Dancing with Tax Authorities: Motivational Postures and Non-
compliant Actions. In: Taxing Democracy: Understanding Tax
Avoidance and Evasion: 15-40.
Cherry, T.L., Frykblom, P. and Shogren, J.F. (2002): Hardnose the Dicator. The American
Economic Review, Vol. 92(4): 1218-1221.
Eriksen, K. and Fallan, L. (1996): Tax knowledge and attitudes towards taxation; A report on
a quasi-experiment. Journal of Economic Psychology, Vol. 17(3): 387-402.
Feld, L. P. and Frey, B. S. (2002): Trust breeds trust: How taxpayers are treated. Economics
of Governance, Vol. 3(2): 87–99.
Feld, L. P. and Tyran, J-R. (2002): Tax Evasion and Voting: An Experimental Analysis.
Kyklos, Vol. 55(2): 197–222.
Fischbacher, U. (2007): z-Tree: Zurich Toolbox for Ready-made Economic Experiment.
Experimental Economics, Vol. 10(2): 171–178.
Frey, B. S. (1997): A Constitution for Knaves Crowds out Civic Virtues. The Economic
Journal, Vol. 107(443): 1043–1053.
Gill, D. and Prowse, V. (2012): A structural analysis of disappointment aversion in a real
effort competition. American Economic Review, 102(1): 469-503.
Gneezy, U. (2003): Do high wages lead to high profits? An experimental study of reciprocity
using real effort. Working Paper, The University of Chicago GSB, Chicago.
Goeree, J.K., Holt, C.A. and Palfrey, T.R. (2003): Risk Averse behavior in generalized
matching pennies games. Games and Economics Behavior, Vol. 45: 97-113.
Greiner, B. (2004): An Online Recruiting System for Economic Experiments. In: Kurt Kremer,
Volker Macho (Eds.): Forschung und wissenschaftliches Rechnen 2003. GWDG
Bericht 63, Goettingen: Ges. für Wiss. Datenverarbeitung, 79-93.
Heinemann, F. and Kocher, M. G. (2010): Tax Compliance Under Tax Regime Changes.
ZEW Discussion Paper No. 10-020.
Holler, M., Hoelzl, E., Kirchler, E., Leder, S. and Mannetti, L. (2008): Framing of
information on the use of public finances, regulatory fit of recipients and tax
compliance. Journal of Economic Psychology, Vol. 29(4): 597-611.
Holt, C., and Laury, S. (2002): Risk Aversion and Incentive Effects. American Economic
Review, Vol. 92(5): 1644–1655.
Kirchler, E., Hoelzl, E. and Wahl, I. (2008): Enforced versus voluntary tax compliance: The
"slippery slope" framework. Journal of Economic Psychology, Vol. 29(2): 210–
225.
26
Kirchler, E., Muehlbacher, S., Hoelzl, E. and Webley, P. (2009): Effort and Aspirations in
Tax Evasion: Experimental Evidence. Applied Psychology, Vol. 58(3): 488–507.
Li, S.X, Eckel, C.C., Grossman, P.J. and Brown, T.L. (2011): Giving to government:
Voluntary taxation in the lab. Journal of Public Economics, Vol. 95(2011): 1190-
1201.
Palil, M.R. and Mustapha, A.F. (2011): Determinants of Tax Compliance in Asia: A case of
Malaysia. European Journal of Social Sciences, Vol. 24(1): 7-32.
Park, C. G. and Hyun, J. K. (2003): Examining the determinants of tax compliance by
experimental data: A case of Korea. Journal of Policy Modeling, Vol. 25(8):
673–684.
Pommerehne, W. W. and Weck-Hannemann, H. (1996): Tax rates, tax administration and
income tax evasion in Switzerland. In: Public Choice, Vol. 88(1): 161–170.
Schwartz, R. and Orleans, S. (1967): On legal sanctions. University of Chicago Law Review,
Vol 34(2): 274-300.
Song, Y.D. and Yarbrough, T.E. (1978): Tax ethics and taxpayer attitudes: A survey.
Public Administration Review, Vol. 38(5): 442-452.
Spicer, M.W. and Thomas, J. E. (1982): Audit probabilities and tax evasion decision: an
experimental approach. Journal of Economic Psychology, Vol. 2(3): 241–245.
Torgler, B. (2005): Tax morale and direct democracy. European Journal of Political
Economy, Vol. 21(2): 525–531.
Tyran, J.-R. (2004): Voting when money and morals conflict: an experimental test of
expressive voting. Journal of Public Economics, Vol. 88(7-8): 1645–1664.
van Dijk, F., Sonnemans, J. and van Winden, F. (2001): Incentive systems in a real effort
experiment. European Economic Review, Vol. 45(1): 187-214.
Vogel, J. (1974): Taxation and public opinion in Sweden: An interpretation of recent survey
data. National Tax Journal, Vol. 27(4): 499–513.
Wahl, I., Muehlbacher S. and Kirchler, E. (2010): The impact of voting on tax payments.
Kyklos, Vol. 63(1): 144-158.
Walker, J.M., Gardner, R., Herr, A. and Ostrom, E. (2000): Collective Choice in the
commons. Experimental results on proposed allocation rules and votes. The
Economic Journal, Vol. 110(460): 212-234.
Wartick, M.L. (1994): Legislative Justification and the Perceived Fairness of Tax Law
Changes: A Referent Cognitions Theory Approach. Journal of the American
Taxation Association, Vol. 16(2): 106-123.

27
Appendix
A. Supplementary material of experiment
Table A.1 List of options used in the K and the BS treatment (items were in German and sorted alphabetically)
Table A.2 Braithwaite’s statements (2003) representing commitment to tax system
Item 1 Bilateral financial agreements
Item 2 Federal police
Item 3 Business administration of the German federal customs authority
Item 4 German patent office
Item 5 German federal railway
Item 6 Innovation and high-tech research
Item 7 Advancement for selective projects that make use of renewable energy
Item 8 State services for families
Item 9 Social insurance contributions and national assistance for soldiers
Item 10 Lump-sum reimbursement of the expenses of health insurances for services concerning the whole society
Item 11 Maintenance of the culture relationship with foreign countries
Item 12 Social Insurance
Item 13 Advancement for coal mining
Item 14 Governmental grant for farmers‘ old-age insurance
Item 15 Other
Item 16 Neutral
1. Paying tax is the right thing to do. 2. Paying tax is a responsibility that should be willingly accepted by all Australians [all Australians replaced by: the whole society]. 3. I feel a moral obligation to pay my tax. 4. Paying my tax ultimately advantages everyone. 5. I think of tax paying as helping the government do worthwhile things. 6. Overall, I pay my tax with good will. 7. I resent paying tax. 8. I accept responsibility for paying my fair share of tax.
28
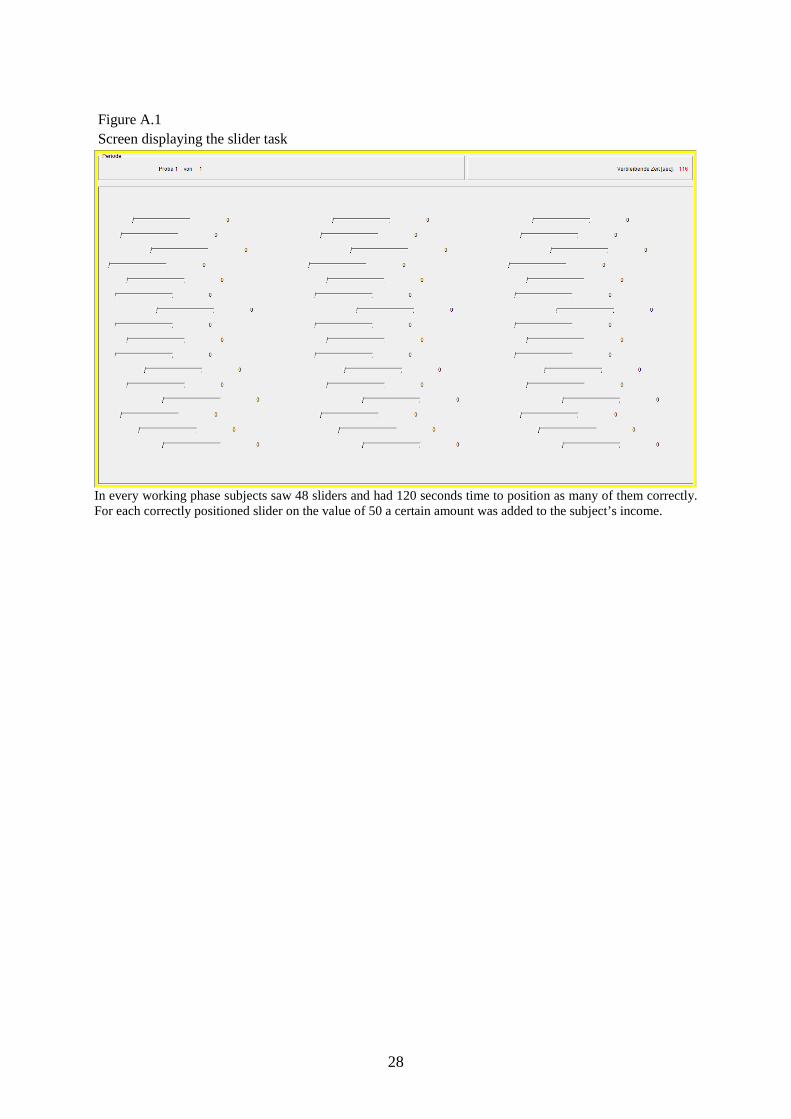
Figure A.1 Screen displaying the slider task
In every working phase subjects saw 48 sliders and had 120 seconds time to position as many of them correctly. For each correctly positioned slider on the value of 50 a certain amount was added to the subject’s income.
29
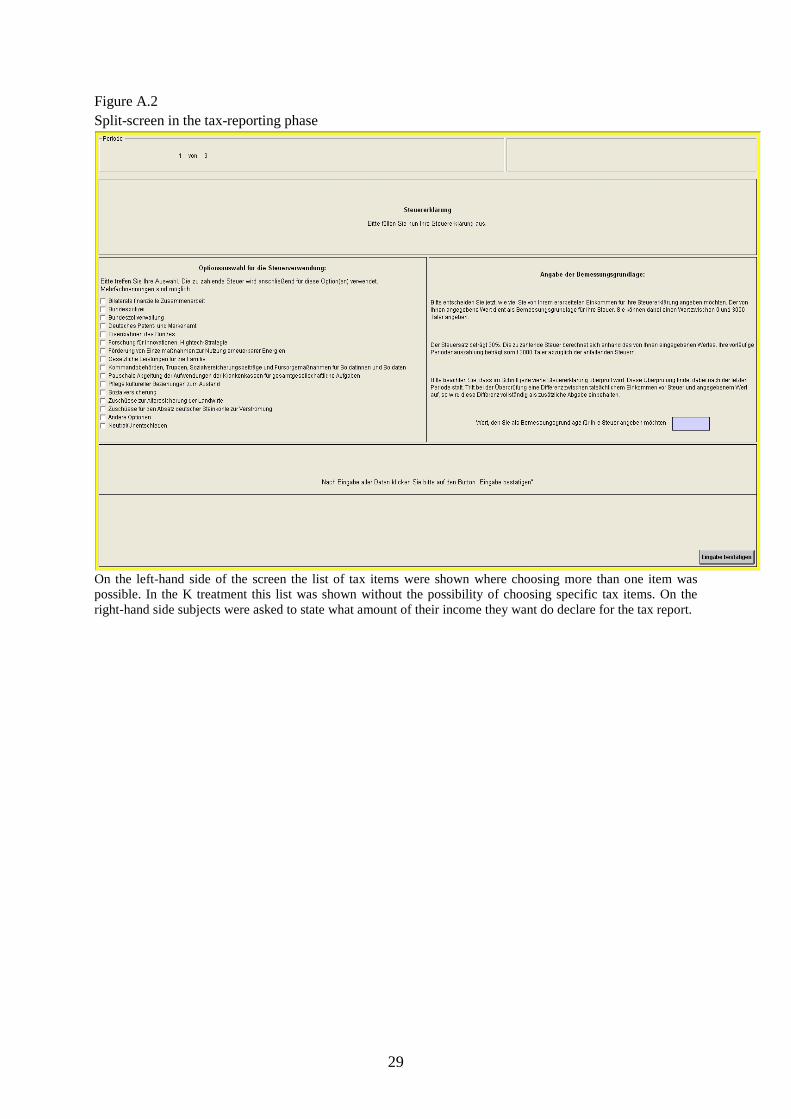
Figure A.2 Split-screen in the tax-reporting phase
On the left-hand side of the screen the list of tax items were shown where choosing more than one item was possible. In the K treatment this list was shown without the possibility of choosing specific tax items. On the right-hand side subjects were asked to state what amount of their income they want do declare for the tax report.
30
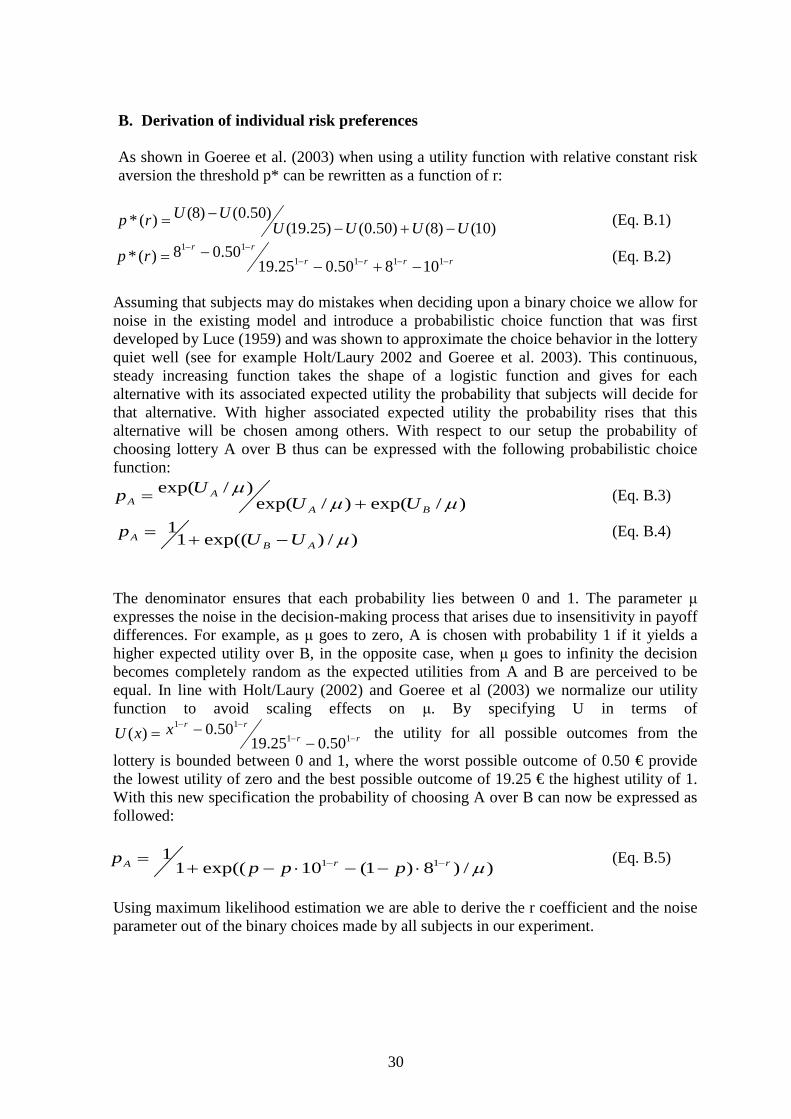
B. Derivation of individual risk preferences
As shown in Goeree et al. (2003) when using a utility function with relative constant risk aversion the threshold p* can be rewritten as a function of r:
)10()8()50.0()25.19(
)50.0()8()(* UUUUUUrp −+−
−= (Eq. B.1)
rrrrrr
rp −−−−
−−
−+−−= 1111
11
10850.025.1950.08)(* (Eq. B.2)
Assuming that subjects may do mistakes when deciding upon a binary choice we allow for noise in the existing model and introduce a probabilistic choice function that was first developed by Luce (1959) and was shown to approximate the choice behavior in the lottery quiet well (see for example Holt/Laury 2002 and Goeree et al. 2003). This continuous, steady increasing function takes the shape of a logistic function and gives for each alternative with its associated expected utility the probability that subjects will decide for that alternative. With higher associated expected utility the probability rises that this alternative will be chosen among others. With respect to our setup the probability of choosing lottery A over B thus can be expressed with the following probabilistic choice function:
)/exp()/exp()/exp(
µµµ
BA
AA UU
Up += (Eq. B.3)
)/)exp((11
µABA UUp −+= (Eq. B.4)
The denominator ensures that each probability lies between 0 and 1. The parameter μ expresses the noise in the decision-making process that arises due to insensitivity in payoff differences. For example, as μ goes to zero, A is chosen with probability 1 if it yields a higher expected utility over B, in the opposite case, when μ goes to infinity the decision becomes completely random as the expected utilities from A and B are perceived to be equal. In line with Holt/Laury (2002) and Goeree et al (2003) we normalize our utility function to avoid scaling effects on μ. By specifying U in terms of
rrrrxxU −−
−−
−−= 11
11
50.025.1950.0)( the utility for all possible outcomes from the
lottery is bounded between 0 and 1, where the worst possible outcome of 0.50 € provide the lowest utility of zero and the best possible outcome of 19.25 € the highest utility of 1. With this new specification the probability of choosing A over B can now be expressed as followed:
)/)8)1(10exp((11
11 µrrA pppp −− ⋅−−⋅−+= (Eq. B.5)
Using maximum likelihood estimation we are able to derive the r coefficient and the noise parameter out of the binary choices made by all subjects in our experiment.
31
Table B.1 Risk categories, r-coefficients and average compliance rates for each treatment and tax system (number of subjects in brackets) Tax system with high power of authorities Tax system with low power of authorities
Risk categories
BS K Con
compliance rate for each risk category
BS K Con
compliance rate for each risk category
overall compliance rate
r-coefficient
risk loving 0.70 (4) 0.62 (9) 0.83 (4) 0.68 (17)
0.51 (4) 0.62 (4) 0.20 (6) 0.41 (14)
0.56 (31) -0.382 risk neutral 0.74 (16) 0.64 (5) 0.61 (6) 0.69 (27)
0.75 (8) 0.71 (10) 0.44 (8) 0.63 (26)
0.67 (53) 0.014
slightly risk averse 0.62 (4) 0.68 (14) 0.66 (7) 0.67 (25)
0.63 (6) 0.66 (6) 0.48 (5) 0.60 (17)
0.64 (42) 0.282 risk averse 0.79 (28) 0.74 (23) 0.83 (33) 0.79 (84)
0.73 (32) 0.70 (22) 0.66 (30) 0.70 (84)
0.74 (168) 0.898
overall compliance rate 0.75 (52) 0.69 (51) 0.78 (50)
0.71 (50) 0.69 (42) 0.55 (49) r-coefficient 0.622 0.457 0.584 0.518 0.474 0.548
32
C. Instructions6 (Original instructions were in German)
• For the course of the experiment, all amounts of money will be stated in the fictitious currency “Taler”.
• The experiment consists of three periods. • Your payment is in no stage of the experiment dependent on the decisions of the other
participants. • The payoff of one period does not affect the payoff of any other period. • Before the first period starts, a test run will take place. • This test run does not influence your payoff; it should only help you to understand the
experiment. • At the end of the experiment you will be asked to fill out a questionnaire which
consists of two parts. For this you will get a short set of instructions as soon as the experiment has ended. The answers in this questionnaire do not influence your payoff which you will receive from this experiment.
• The participants act completely independently and do not interact with each other. All decisions are private and are not accessible to other participants at any stage of the experiment.
Procedure of a Period
Phase 1
• This phase lasts 120 seconds. • In this phase you must work on a task which consists of placing little sliders in the
middle, exactly on the target position 50, with the computer mouse (see illustration). The order of positioning the sliders is not relevant. Only the amount of correctly placed sliders counts.
a) Initial position b) target position • For each correctly positioned slider you will be rewarded 1500 Talers. • After the 120 seconds are over, you will be informed about the amount of correctly
placed sliders as well as the amount of Talers earned. • These Talers represent your income.
Phase 2 • There is a tax which arises in each period. You will be thus asked to fill out a tax
report in phase 2. The tax rate amounts to 30% of the declared income.
6 Please note: Sentences marked with {} belong to the K treatment and sentences marked with *{}* belong to the BS treatment only
33
• In your tax return you can decide how much of your earned income you would like to declare. This declared income is the basis of assessment for your tax payment (tax base). You can declare an amount between 0 Talers and your entire earned income.
Your income before taxes = amount of correctly positioned sliders x 1500 Talers Tax base = declared income between 0 Talers and entire earned income Paid tax = tax base x 0.3 Your income after taxes = your income before taxes – paid tax Payment of the period = your income after taxes
• *{Please imagine you have the possibility to choose the specific items for which the
taxes are then used for. There are 16 options – multiple choices are possible. • Please find the different options of use in the enclosed table. • Please assume that the paid taxes are afterwards used for this/ these option(s).}*
• {You will be informed about the specific use of your paid taxes. • Please find the different possibilities of use in the enclosed table. • Please assume that the paid taxes are only used for exactly these tax items.}
• The tax return of every [forth] tenth person will be randomly audited.
o In case your tax return is checked and your tax base does not correspond with your income before taxes, a fine will be due in form of a supplementary as well as an additional payment.
o This additional charge equates to the difference between your income before taxes and your tax base, so that in consequence the amount of not declared income will be collected/ fined.
First Case: If tax base = income before taxes => Payment of the period as above Second Case: If tax base < income before taxes Not declared income = your income before taxes – tax base Additional charge (consists of a = not declared income supplementary and an additional payment) Your income after taxes = your income after taxes – additional charge with the additional charge Payment of the period = your income after taxes with the additional charge
• Please be aware that the auditing of the tax files takes place at the end of the
experiment. You will then be informed whether or not your tax return was checked in the respective period.
34
• Consequently, you will first find out your payoffs from the three periods once the experiment has finished.
Payments:
• At the end of the experiment, your payoff will be exchanged at an exchange rate of 1 Euro per 7500 Talers. A show-up fee of 2.50 Euro is added to this amount which is then directly paid out to you in cash.
Please note:
• During the entire experiment, no form of communication is permitted. • All mobile phones must be switched off during the complete duration of the
experiment. • The decisions you make within this experiment are anonymous, i.e. none of the other
participants learns about the identity of a person who has made a specific decision. • The payments are also handled anonymously. No other participant finds out how much
money other participants have earned. • Please remain seated until the end of the experiment. You will be called forward for
your payoff through your seat number.
Good luck and thank you for your participation in this experiment!
35
Instructions Questionnaire
• The experiment is now finished.
Instructions for the questionnaire part 1:
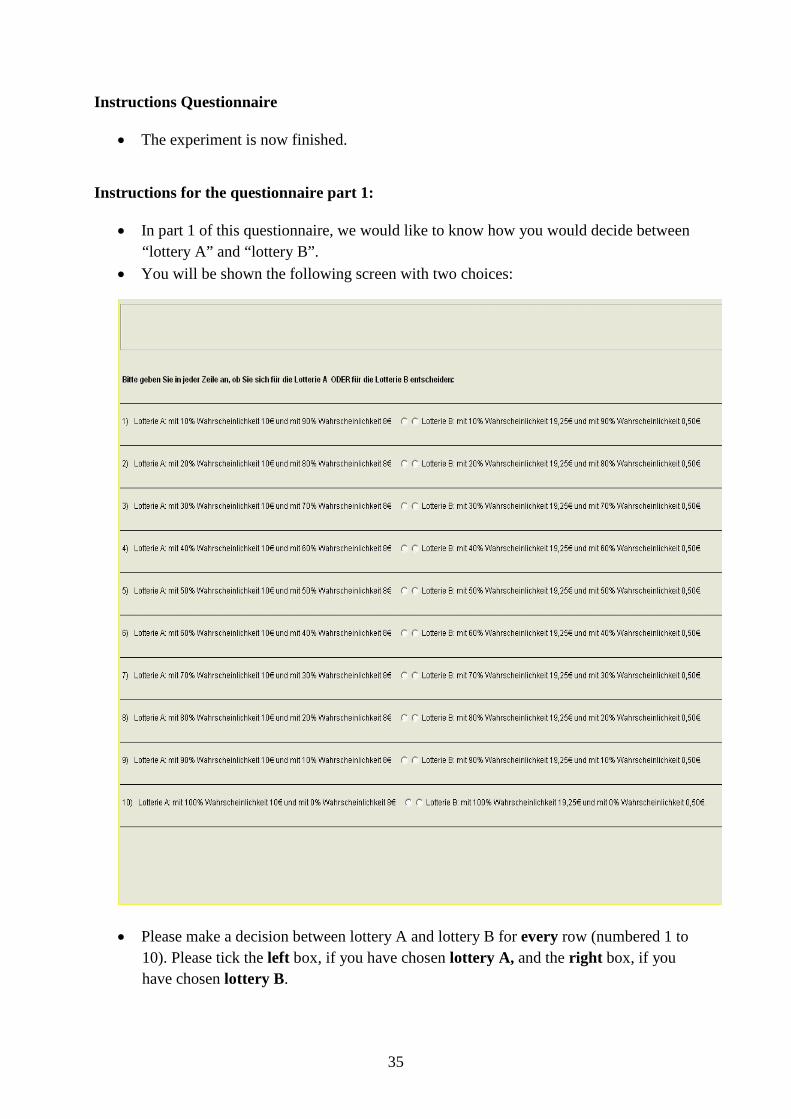
• In part 1 of this questionnaire, we would like to know how you would decide between “lottery A” and “lottery B”.
• You will be shown the following screen with two choices:
• Please make a decision between lottery A and lottery B for every row (numbered 1 to 10). Please tick the left box, if you have chosen lottery A, and the right box, if you have chosen lottery B.
36
Further opportunity to win in part 1 of the questionnaire
• In this part of the questionnaire, you once again have the chance to earn money. • Every 7th participant wins, so four participants are drawn. • Four cabin numbers are drawn out of a box. • The four participants with the drawn cabin numbers play for the additional payment
before they receive their payment from the first experiment and once they have finished the second part of this questionnaire.
• Should you be one of the four drawn participants, you will play for the additional payment using a 10-sided die.
• With your first throw of the 10-sided die, the row which then matters for the payment is determined. With your second throw, you then play the lottery you chose in the respective row. Example: Supposing you rolled a 3 with your first throw, you then play the lottery which you chose in the third row.
• If you rolled a number between 1 and 3 and o chose lottery A, you then win 10 EUR. o chose lottery B, you then win 19.25 EUR.
• If you rolled a number between 4 and 10 and
o chose lottery A, you then win 8 EUR. o chose lottery B, you then win 0.50 EUR.
The second part of this questionnaire follows, once all participants have answered the first part of the questionnaire. The answers of the second part are not relevant to payment. Please note again that the questions are analyzed anonymously and that communication is not permitted during the entire experiment. Thank you very much for your participation in this experiment!