the impact of stress tests on bank lending impact of stress tests on bank lending william bassett...
TRANSCRIPT

The Impact of Stress Tests on Bank Lending
William Bassett and Jose Berrospide
Federal Reserve BoardSeptember 7 ‐ 8, 2017
The views expressed do not necessarily reflect those of the Federal Reserve or its staff.

• Higher capital and bank stress tests improve the resilience and stability of the financial sector, but the banking industry and politicians have increasingly questioned whether they are having unintended effects on bank lending and hindering economic growth:
“Banks have too much capital...it's clear that banks can use more of their capital to finance the economy”
Jamie Dimon, Chairman and CEO, JPMorgan Chase, April 2017
“Frankly, I have so many people, friends of mine, that have nice businesses, and they can’t borrow money. They just can’t get any money because the banks just won’t let them borrow because of the rules and regulations in Dodd‐Frank”
Donald Trump, February 2017
“…the Fed’s CCAR stress test is imposing dramatically higher capital requirementson certain asset classes…[relative to] capital requirements bank would impose on themselves if risk management and credit underwriting were left to them.”
The Clearing House – White paper, January 2017
• Are stress tests having unintended effects on the supply of bank credit or changing the allocation of loan growth to households and corporations in ways that are not warranted by the lessons of the financial crisis?
Motivation

• Stress tests have become key macroprudential tool for bank supervisors and regulators worldwide.
• In the U.S., the Dodd Frank Act mandates that the Federal Reserve conduct annual stress tests of large BHCs (consolidated assets above $50 billion).
• Stress testing program has evolved since SCAP in 2009 into an annual exercise for the largest U.S. BHCs.
CCAR and DFAST
• The Federal Reserve started its Comprehensive Capital Analysis and Review (CCAR) in 2011, and conducts Dodd Frank Stress tests (DFAST) since 2013.
• CCAR is the annual evaluation of individual BHC’s capital planning processes (risk management, internal control practices, and planned capital distributions)
• CCAR includes the quantitative exercise under 3 scenarios: baseline, adverse, and severely adverse (similar to DFAST), and a qualitative assessment.
Background

• Capital distribution assumptions are different:– In DFAST: level similar to previous year– In CCAR: based on each BHC’s proposed plan
• Upon disclosure of results:– In DFAST no supervisory action follows (firms cannot “pass” or “fail”)– In CCAR: the Federal Reserve may object to the BHC’s capital plan on either
quantitative or qualitative grounds, and thus may restrict the firm’s capital distributions included in its capital plan.
• Dodd Frank Act (DFA) also mandates that BHCs conduct their own stress tests using the same supervisory scenarios and its own scenarios.
• We assess the impact of stress tests by comparing Fed and banks’ stress tests results (minimum capital ratios).
• We also use Non‐CCAR BHCs (assets between $10 and $50 billion) as “control” group. These banks are not subject to the Fed’s stress tests, but by DFA they also conduct their own stress tests and make their DFAST results public.
CCAR versus DFAST

• We evaluate the impact of stress tests on bank loan growth and lending standards by comparing Fed and BHC’s own stress tests results using 2 approaches:1. We compare CCAR and non‐CCAR Banks2. We compare loan growth among CCAR banks
• To quantify the impact of stress tests we construct a counterfactual: “what would be the level of regulatory capital in the absence of the Fed’s stress tests but assuming that banks still run their own stress tests?”
• We construct a measure of the “extra” capital that banks hold due to the supervisory stress tests. We call this the “capital gap.”
• This capital gap, by construction, is zero for non‐CCAR banks.• We study the impact of the capital gap on BHC’s loan growth and lending
standards across different loan categories.
This paper

31
60
Number of BHCs in our sample
91 BHCs
$50 billion
Number of banks
$10 billion
CCAR
Non‐CCAR

11
20
30
30
Number of BHCs in our sample
91 BHCs
$50 billion
Number of banks
$10 billion
CCAR
Non‐CCAR
$200 billion
$20 billion

11
20
30
30
Number of BHCs in our sample
91 BHCs
$50 billion
Number of banks
$200 billion
$20 billion
$10 billion
CCAR
Non‐CCAR
More comparable banks

• We use balance sheet data for all BHCs subject to CCAR/DFAST with consolidated assets greater than $10 billion (FR‐Y9C).
• We also use micro data for banks’ lending standards from the Senior Loan Officer Opinion Survey (SLOOS).
• We combine that with information from their stress tests results (publicly available) between 2013 and 2016:o Federal Reserve’s DFAST results for CCAR bankso Bank’s own stress tests results (both CCAR and non‐CCAR banks)
• The non‐CCAR BHCs are relatively large regional banks with assets between $10 billion and $50 billion.
• After cleaning the data, we use: o 288 observations for 91 BHCs (31 CCAR and 60 non‐CCAR banks)
Data

Summary statistics
BHC Variable Obs. Mean Median Std. Dev. Min. Max.CCAR Total loan growth 102 0.05 0.04 0.09 ‐0.24 0.42
CE Tier 1 Capital ratio 102 0.12 0.11 0.03 0.07 0.37Total Assets (US$ Billion) 102 503.4 158.8 691.8 55.5 2572.8Non‐performing loan ratio 102 0.02 0.02 0.01 0.00 0.07Chargeoff / Assets (percent) 102 0.43 0.28 0.45 0.00 2.00Deposit / Assets 102 0.61 0.70 0.20 0.07 0.84Liq. Assets / Assets 102 0.28 0.24 0.12 0.14 0.67ROA 102 0.01 0.01 0.01 ‐0.03 0.04
NON Total loan growth 186 0.10 0.08 0.10 ‐0.27 0.63CCAR CE Tier 1 Capital ratio 186 0.13 0.12 0.05 0.06 0.53
Total Assets (US$ Billion) 186 23.1 18.6 23.3 10.5 234.6Non‐performing loan ratio 186 0.02 0.01 0.02 0.00 0.12Chargeoff / Assets (percent) 186 0.27 0.11 0.46 ‐0.12 3.14Deposit / Assets 186 0.75 0.78 0.12 0.06 0.91Liq. Assets / Assets 186 0.27 0.23 0.13 0.02 0.60ROA 186 0.01 0.01 0.01 ‐0.02 0.16

What would regulatory capital ratios look like in the absence of DFAST/CCAR?• Assume no supervisory DFAST/CCAR stress testing exercise,
but…
• … banks still run their own stress tests exercise based on CCAR scenarios.
• What capital (e.g. CET1 ratio) would BHCs hold in absence of a more‐binding regulatory stress test?o Claims by recent commentary from Congress and banking industry: the amount their models said to hold
12
Counterfactual

13
12.0
9.48.5
0.9
0.0
2.0
4.0
6.0
8.0
10.0
12.0
14.0
Start Minimum (BHC) Minimum(Supervisory)
CET1_gap
Average drop in CET1 capital ratio in DFAST
Note:Drop in CET1 ratio (p.p.): 2.6 3.5 0.9
• “CET1 gap” can be thought of as the extra CET1 capital that this BHC has as a result of the CCAR stress tests being more stringent.
• Compute regulatory capital ratios without the gap• Note that a number of BHCs have negative capital gap: these BHCs exhibit higher stressed capital ratios in DFAST than in their own exercise.
Distribution of CET1 gap
Percentiles
5% ‐1.010% ‐0.6 Obs 10425% 0.2 Sum of Wgt. 104
50% 0.7 Mean 0.9Std. Dev. 1.2
75% 1.690% 2.495% 3.5
Distribution of CET1 gap across BHCs: 2013‐2016

14
8
9
10
11
12
13
14
2013 2014 2015 2016
Mean CET1 capital ratio (%)
Actual Counterfactual
• If banks were subject only to their own stress test results, their capital ratios could have been lower during earlier years o CET1 ratio has converged over time o Potential reasons for convergence not addressed here
CET1 ratio in the absence of CCAR: 2013‐2016

• Use panel regression specification of BHC’s annual loan growth:
Δ , =∝ ∝ . , ∝ . , ∝ ,
, where, • Xi,t‐1 are lagged bank characteristics: log of total assets, net charge‐
off/TA ratio, deposits/TA ratio, and ROA.• We include bank and time fixed effects• We argue that the Capital Gap is exogenous (e.g. learning and
convergence to Fed’s stress tests may take time). The capital gap is zero for non‐CCAR banks.
• We expect: α1>0; and α2<0 if claims by banking industry are true and the “extra capital” implied by supervisory stress tests (capital gap) is restricting loan growth.
Regression Framework

RESTRICTED FR 16
Impact of Capital Gap: CCAR and non‐CCAR banks
Vars (1) (2) (3) (1) (2) (3) (1) (2) (3)CET1 ratio 0.721** 0.297 1.082*
[0.322] [0.839] [0.593]CET1 ratio adj. (BHC) 0.718** 0.423* 0.298 0.375 1.087* 0.683
[0.320] [0.244] [0.841] [0.827] [0.597] [0.519]CET1 Gap ‐0.757 ‐0.186 0.626 0.801 3.373 3.930*
[1.023] [0.908] [1.289] [1.313] [2.308] [2.269]Size ‐0.300*** ‐0.026 ‐0.320**
[0.092] [0.177] [0.133]NPL ratio ‐0.724 ‐1.373 ‐1.746
[0.970] [1.557] [1.236]Deposit / TA 0.056 0.52 ‐1.205***
[0.253] [0.715] [0.437]ROA 0.657 ‐1.045 1.534
[1.162] [1.916] [1.737]Observations 288 288 288 288 288 288 283 283 283R‐squared 0.62 0.63 0.68 0.39 0.39 0.39 0.51 0.52 0.57
Total Loans C&I Loans CRE Loans

RESTRICTED FR 17
Impact of Capital Gap: CCAR and non‐CCAR banks
Vars (1) (2) (3) (1) (2) (3) (1) (2) (3)CET1 ratio 0.721** 0.297 1.082*
[0.322] [0.839] [0.593]CET1 ratio adj. (BHC) 0.718** 0.423* 0.298 0.375 1.087* 0.683
[0.320] [0.244] [0.841] [0.827] [0.597] [0.519]CET1 Gap ‐0.757 ‐0.186 0.626 0.801 3.373 3.930*
[1.023] [0.908] [1.289] [1.313] [2.308] [2.269]Size ‐0.300*** ‐0.026 ‐0.320**
[0.092] [0.177] [0.133]NPL ratio ‐0.724 ‐1.373 ‐1.746
[0.970] [1.557] [1.236]Deposit / TA 0.056 0.52 ‐1.205***
[0.253] [0.715] [0.437]ROA 0.657 ‐1.045 1.534
[1.162] [1.916] [1.737]Observations 288 288 288 288 288 288 283 283 283R‐squared 0.62 0.63 0.68 0.39 0.39 0.39 0.51 0.52 0.57
Total Loans C&I Loans CRE Loans

RESTRICTED FR 18
Impact of Capital Gap: CCAR and non‐CCAR banks
Vars (1) (2) (3) (1) (2) (3) (1) (2) (3)CET1 ratio 0.244 0.413 5.191***
[0.543] [1.133] [1.379]CET1 ratio adj. (BHC) 0.24 0.09 0.411 0.121 5.191*** 6.089***
[0.539] [0.566] [1.136] [1.139] [1.382] [1.431]CET1 Gap ‐1.773 ‐1.43 ‐0.385 ‐0.154 5.266** 6.269**
[2.608] [2.557] [2.963] [2.932] [2.524] [2.605]Size ‐0.128 ‐0.327* ‐0.108
[0.222] [0.185] [0.272]NPL ratio ‐2.246 ‐4.756** ‐3.705
[1.698] [2.258] [2.348]Deposit / TA ‐0.518 ‐0.851* 0.644
[0.714] [0.460] [0.728]ROA 2.166 2.392 ‐3.395
[3.261] [2.060] [2.832]Observations 284 284 284 284 284 284 286 286 286R‐squared 0.51 0.51 0.53 0.44 0.44 0.49 0.51 0.51 0.54
Small Business LoansRRE Loans Consumer Loans
• No evidence that the “capital gap” implied by DFAST stress tests is restricting lending.• BHCs with higher capital ratios lend more across different loan categories.• Negative and significant coefficient on size could partly be capturing all the other CCAR effects, plus other regulations tailored by size.

RESTRICTED FR 19
Impact of Capital Gap: CCAR and non‐CCAR banks
Vars (1) (2) (3) (1) (2) (3) (1) (2) (3)CET1 ratio 0.244 0.413 5.191***
[0.543] [1.133] [1.379]CET1 ratio adj. (BHC) 0.24 0.09 0.411 0.121 5.191*** 6.089***
[0.539] [0.566] [1.136] [1.139] [1.382] [1.431]CET1 Gap ‐1.773 ‐1.43 ‐0.385 ‐0.154 5.266** 6.269**
[2.608] [2.557] [2.963] [2.932] [2.524] [2.605]Size ‐0.128 ‐0.327* ‐0.108
[0.222] [0.185] [0.272]NPL ratio ‐2.246 ‐4.756** ‐3.705
[1.698] [2.258] [2.348]Deposit / TA ‐0.518 ‐0.851* 0.644
[0.714] [0.460] [0.728]ROA 2.166 2.392 ‐3.395
[3.261] [2.060] [2.832]Observations 284 284 284 284 284 284 286 286 286R‐squared 0.51 0.51 0.53 0.44 0.44 0.49 0.51 0.51 0.54
Small Business LoansRRE Loans Consumer Loans
• No evidence that the “capital gap” implied by DFAST stress tests is restricting lending.• BHCs with higher capital ratios lend more across different loan categories.• Negative and significant coefficient on size could partly be capturing all the other CCAR effects, plus other regulations tailored by size.
RESTRICTED FR 20
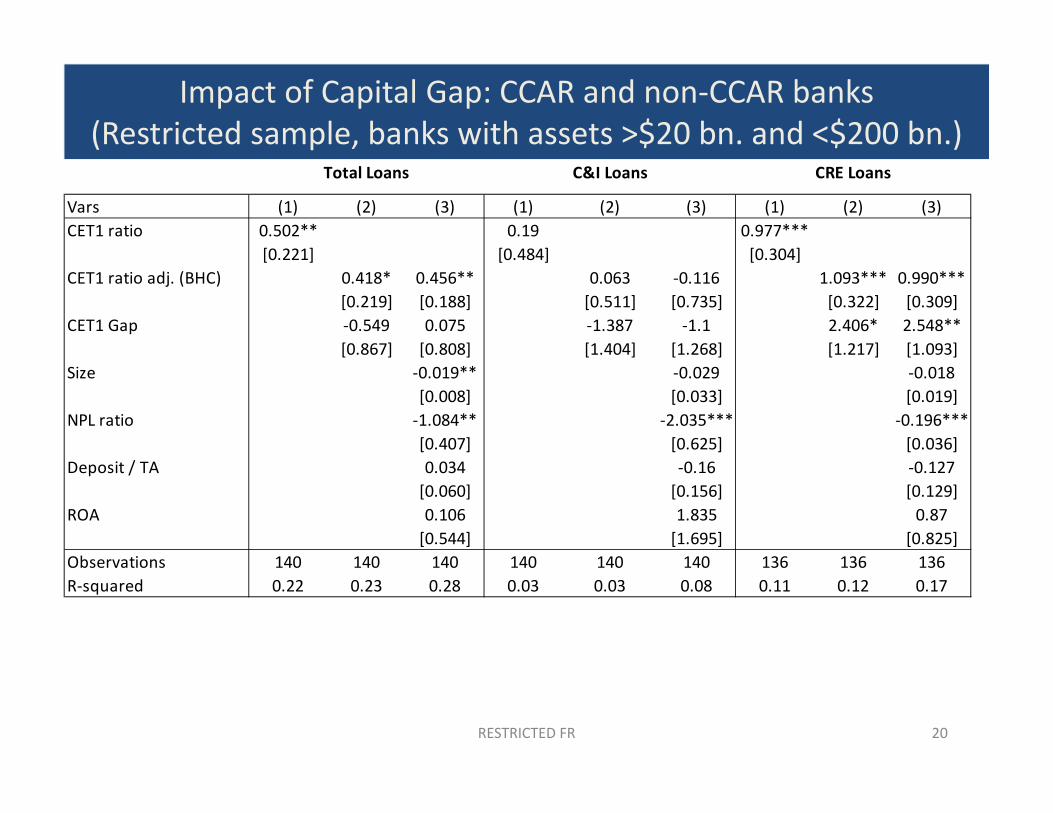
Impact of Capital Gap: CCAR and non‐CCAR banks (Restricted sample, banks with assets >$20 bn. and <$200 bn.)
Vars (1) (2) (3) (1) (2) (3) (1) (2) (3)CET1 ratio 0.502** 0.19 0.977***
[0.221] [0.484] [0.304]CET1 ratio adj. (BHC) 0.418* 0.456** 0.063 ‐0.116 1.093*** 0.990***
[0.219] [0.188] [0.511] [0.735] [0.322] [0.309]CET1 Gap ‐0.549 0.075 ‐1.387 ‐1.1 2.406* 2.548**
[0.867] [0.808] [1.404] [1.268] [1.217] [1.093]Size ‐0.019** ‐0.029 ‐0.018
[0.008] [0.033] [0.019]NPL ratio ‐1.084** ‐2.035*** ‐0.196***
[0.407] [0.625] [0.036]Deposit / TA 0.034 ‐0.16 ‐0.127
[0.060] [0.156] [0.129]ROA 0.106 1.835 0.87
[0.544] [1.695] [0.825]Observations 140 140 140 140 140 140 136 136 136R‐squared 0.22 0.23 0.28 0.03 0.03 0.08 0.11 0.12 0.17
Total Loans C&I Loans CRE Loans

RESTRICTED FR 21
Impact of Capital Gap: CCAR and non‐CCAR banks (Restricted sample, banks with assets >$20 bn. and <$200 bn.)
Vars (1) (2) (3) (1) (2) (3) (1) (2) (3)CET1 ratio 0.502** 0.19 0.977***
[0.221] [0.484] [0.304]CET1 ratio adj. (BHC) 0.418* 0.456** 0.063 ‐0.116 1.093*** 0.990***
[0.219] [0.188] [0.511] [0.735] [0.322] [0.309]CET1 Gap ‐0.549 0.075 ‐1.387 ‐1.1 2.406* 2.548**
[0.867] [0.808] [1.404] [1.268] [1.217] [1.093]Size ‐0.019** ‐0.029 ‐0.018
[0.008] [0.033] [0.019]NPL ratio ‐1.084** ‐2.035*** ‐0.196***
[0.407] [0.625] [0.036]Deposit / TA 0.034 ‐0.16 ‐0.127
[0.060] [0.156] [0.129]ROA 0.106 1.835 0.87
[0.544] [1.695] [0.825]Observations 140 140 140 140 140 140 136 136 136R‐squared 0.22 0.23 0.28 0.03 0.03 0.08 0.11 0.12 0.17
Total Loans C&I Loans CRE Loans

RESTRICTED FR 22
• No evidence that the “capital gap” implied by DFAST stress tests is restricting lending.• BHCs with higher capital ratios lend more across different loan categories.• Other variables such as non‐performing loans, size, and deposits are also important determinants of loan growth.
Vars (1) (2) (3) (1) (2) (3) (1) (2) (3)CET1 ratio 0.343 0.695 1.169
[0.381] [0.728] [1.005]CET1 ratio adj. (BHC) 0.325 0.421 0.893 0.174 1.568 1.572*
[0.387] [0.402] [0.688] [0.470] [1.010] [0.924]CET1 Gap 0.116 0.788 3.189 2.071 6.131 8.215**
[1.405] [1.460] [2.047] [1.616] [4.060] [3.964]Size ‐0.009 ‐0.023 ‐0.070*
[0.015] [0.022] [0.039]NPL ratio ‐1.129** ‐0.671 ‐2.702***
[0.485] [1.115] [0.510]Deposit / TA 0.108 ‐0.629*** 0.165
[0.077] [0.222] [0.181]ROA 2.729 0.532 0.874
[2.584] [1.443] [1.509]Observations 136 136 136 137 137 137 138 138 138R‐squared 0.06 0.06 0.12 0.06 0.07 0.27 0.03 0.05 0.13
Consumer LoansRRE Loans Small Business Loans
Impact of Capital Gap: CCAR and non‐CCAR banks (Restricted sample, banks with assets >$20 bn. and <$200 bn.)

RESTRICTED FR 23
• No evidence that the “capital gap” implied by DFAST stress tests is restricting lending.• BHCs with higher capital ratios lend more across different loan categories.• Other variables such as non‐performing loans, size, and deposits are also important determinants of loan growth.
Vars (1) (2) (3) (1) (2) (3) (1) (2) (3)CET1 ratio 0.343 0.695 1.169
[0.381] [0.728] [1.005]CET1 ratio adj. (BHC) 0.325 0.421 0.893 0.174 1.568 1.572*
[0.387] [0.402] [0.688] [0.470] [1.010] [0.924]CET1 Gap 0.116 0.788 3.189 2.071 6.131 8.215**
[1.405] [1.460] [2.047] [1.616] [4.060] [3.964]Size ‐0.009 ‐0.023 ‐0.070*
[0.015] [0.022] [0.039]NPL ratio ‐1.129** ‐0.671 ‐2.702***
[0.485] [1.115] [0.510]Deposit / TA 0.108 ‐0.629*** 0.165
[0.077] [0.222] [0.181]ROA 2.729 0.532 0.874
[2.584] [1.443] [1.509]Observations 136 136 136 137 137 137 138 138 138R‐squared 0.06 0.06 0.12 0.06 0.07 0.27 0.03 0.05 0.13
Consumer LoansRRE Loans Small Business Loans
Impact of Capital Gap: CCAR and non‐CCAR banks (Restricted sample, banks with assets >$20 bn. and <$200 bn.)

Loan growth of CCAR and non‐CCAR banks
• Our regression analysis suggests that the differences in loan growth for RRE and CRE loans between CCAR and non‐CCAR banks seem to be explained by other variables beyond higher capital requirements:
• For RRE loans: Non‐performing loans (and delinquency rates) • For CRE loans: higher loan growth grates at non‐CCAR banks are not new

RESTRICTED FR 25
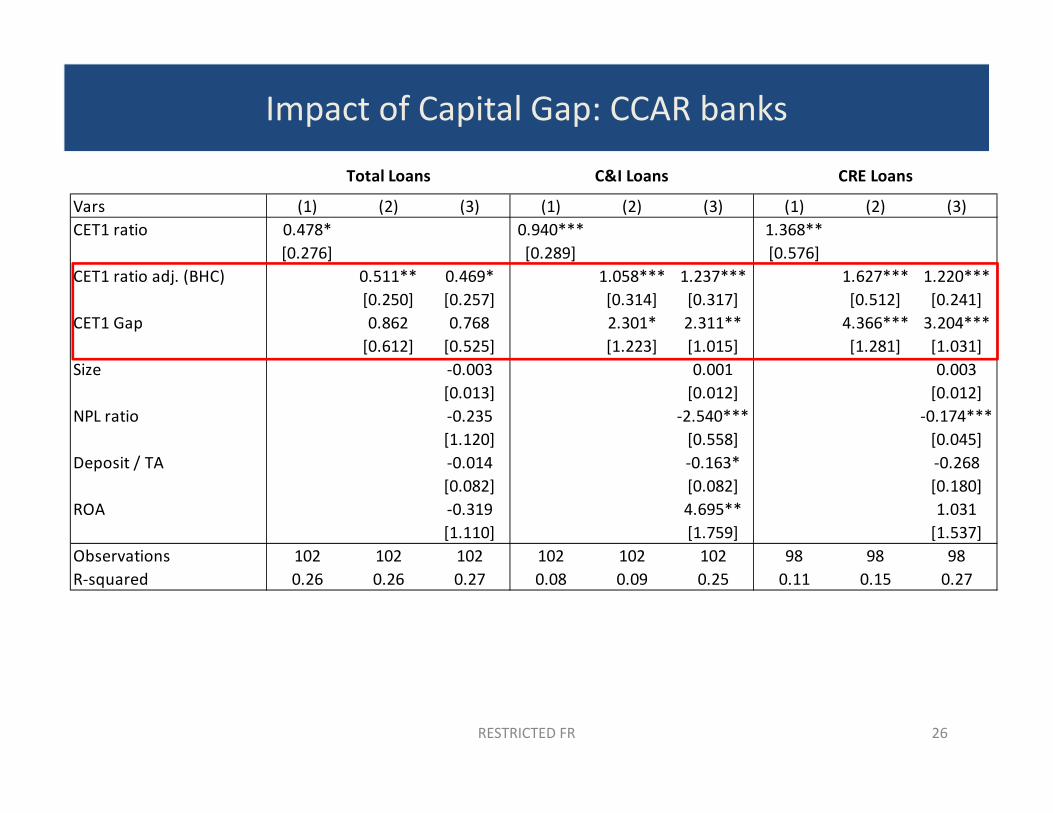
Impact of Capital Gap: CCAR banks
Vars (1) (2) (3) (1) (2) (3) (1) (2) (3)CET1 ratio 0.478* 0.940*** 1.368**
[0.276] [0.289] [0.576]CET1 ratio adj. (BHC) 0.511** 0.469* 1.058*** 1.237*** 1.627*** 1.220***
[0.250] [0.257] [0.314] [0.317] [0.512] [0.241]CET1 Gap 0.862 0.768 2.301* 2.311** 4.366*** 3.204***
[0.612] [0.525] [1.223] [1.015] [1.281] [1.031]Size ‐0.003 0.001 0.003
[0.013] [0.012] [0.012]NPL ratio ‐0.235 ‐2.540*** ‐0.174***
[1.120] [0.558] [0.045]Deposit / TA ‐0.014 ‐0.163* ‐0.268
[0.082] [0.082] [0.180]ROA ‐0.319 4.695** 1.031
[1.110] [1.759] [1.537]Observations 102 102 102 102 102 102 98 98 98R‐squared 0.26 0.26 0.27 0.08 0.09 0.25 0.11 0.15 0.27
Total Loans C&I Loans CRE Loans
RESTRICTED FR 26
Impact of Capital Gap: CCAR banks
Vars (1) (2) (3) (1) (2) (3) (1) (2) (3)CET1 ratio 0.478* 0.940*** 1.368**
[0.276] [0.289] [0.576]CET1 ratio adj. (BHC) 0.511** 0.469* 1.058*** 1.237*** 1.627*** 1.220***
[0.250] [0.257] [0.314] [0.317] [0.512] [0.241]CET1 Gap 0.862 0.768 2.301* 2.311** 4.366*** 3.204***
[0.612] [0.525] [1.223] [1.015] [1.281] [1.031]Size ‐0.003 0.001 0.003
[0.013] [0.012] [0.012]NPL ratio ‐0.235 ‐2.540*** ‐0.174***
[1.120] [0.558] [0.045]Deposit / TA ‐0.014 ‐0.163* ‐0.268
[0.082] [0.082] [0.180]ROA ‐0.319 4.695** 1.031
[1.110] [1.759] [1.537]Observations 102 102 102 102 102 102 98 98 98R‐squared 0.26 0.26 0.27 0.08 0.09 0.25 0.11 0.15 0.27
Total Loans C&I Loans CRE Loans

RESTRICTED FR 27
• No evidence that the “capital gap” implied by DFAST stress tests is restricting lending.• BHCs with higher capital ratios lend more across different loan categories.• Other variables such as non‐performing loans and deposits are also important determinants of loan growth.
Impact of Capital Gap: CCAR banks
Vars (1) (2) (3) (1) (2) (3) (1) (2) (3)CET1 ratio 0.762 0.17 1.019
[0.994] [0.508] [1.019]CET1 ratio adj. (BHC) 1.042 0.089 0.312 ‐0.361 1.517* 1.011
[1.061] [0.624] [0.477] [0.505] [0.842] [0.792]CET1 Gap 4.007 2.017 1.899 0.432 6.755** 5.833*
[3.714] [1.929] [1.215] [1.493] [2.903] [3.060]Size 0.029 0.014 ‐0.017
[0.040] [0.027] [0.017]NPL ratio ‐2.364** ‐4.165 ‐0.641
[1.034] [2.856] [1.525]Deposit / TA ‐0.351 ‐0.318*** ‐0.24
[0.215] [0.085] [0.173]ROA 1.935 2.163 ‐1.395
[2.352] [1.850] [1.889]Observations 98 98 98 99 99 99 102 102 102R‐squared 0.03 0.06 0.29 0.06 0.07 0.24 0.12 0.21 0.25
Consumer LoansSmall Business LoansRRE Loans

RESTRICTED FR 28
• No evidence that the “capital gap” implied by DFAST stress tests is restricting lending.• BHCs with higher capital ratios lend more across different loan categories.• Other variables such as non‐performing loans and deposits are also important determinants of loan growth.
Impact of Capital Gap: CCAR banks
Vars (1) (2) (3) (1) (2) (3) (1) (2) (3)CET1 ratio 0.762 0.17 1.019
[0.994] [0.508] [1.019]CET1 ratio adj. (BHC) 1.042 0.089 0.312 ‐0.361 1.517* 1.011
[1.061] [0.624] [0.477] [0.505] [0.842] [0.792]CET1 Gap 4.007 2.017 1.899 0.432 6.755** 5.833*
[3.714] [1.929] [1.215] [1.493] [2.903] [3.060]Size 0.029 0.014 ‐0.017
[0.040] [0.027] [0.017]NPL ratio ‐2.364** ‐4.165 ‐0.641
[1.034] [2.856] [1.525]Deposit / TA ‐0.351 ‐0.318*** ‐0.24
[0.215] [0.085] [0.173]ROA 1.935 2.163 ‐1.395
[2.352] [1.850] [1.889]Observations 98 98 98 99 99 99 102 102 102R‐squared 0.03 0.06 0.29 0.06 0.07 0.24 0.12 0.21 0.25
Consumer LoansSmall Business LoansRRE Loans

RESTRICTED FR 29
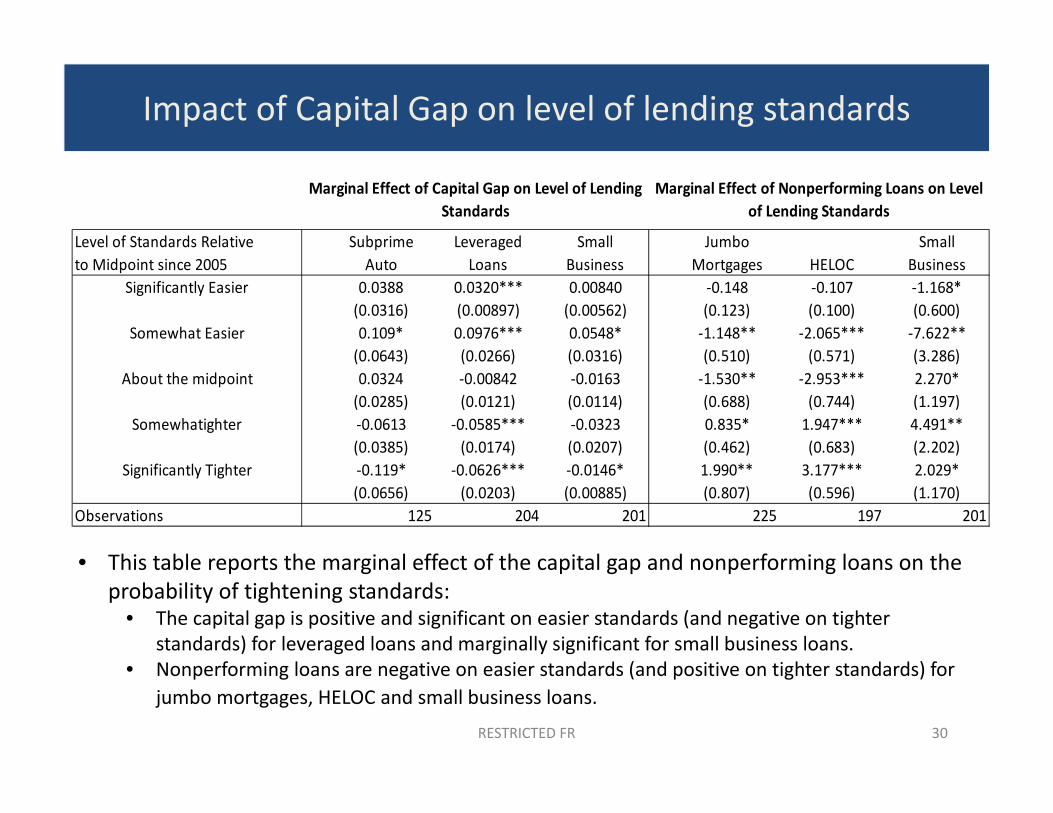
Impact of Capital Gap on level of lending standards
• Since 2010, the July edition of SLOOS includes questions for a number of loan categories about how their current lending standards compared to the tightest or easiest level since 2005.
• Responses take 1 of 7 values:
• Easiest (1), Significantly easier than the midpoint (2), Somewhat easier than the midpoint (3)
• About at the midpoint (4)
• Somewhat tighter than the midpoint (5), significantly tighter than the midpoint (6) and tightest (7).
• We combine categories (1) and (2), as well as (6) and (7), and use then 5 categories as dependent variable in a set of ordered logit regressions for 12 different loan categories including some of the categories we use in our loan growth regressions.
• We test for whether the capital gap affects the level of lending standards.
• We also use an aggregate index of lending standards and repeat the analysis to study the impact of the capital gap on the changes in standards (e.g. on the average change in the index of standards) over the year following the stress tests.
RESTRICTED FR 30
Impact of Capital Gap on level of lending standards
Level of Standards Relative Subprime Leveraged Small Jumbo Smallto Midpoint since 2005 Auto Loans Business Mortgages HELOC Business
Significantly Easier 0.0388 0.0320*** 0.00840 ‐0.148 ‐0.107 ‐1.168*(0.0316) (0.00897) (0.00562) (0.123) (0.100) (0.600)
Somewhat Easier 0.109* 0.0976*** 0.0548* ‐1.148** ‐2.065*** ‐7.622**(0.0643) (0.0266) (0.0316) (0.510) (0.571) (3.286)
About the midpoint 0.0324 ‐0.00842 ‐0.0163 ‐1.530** ‐2.953*** 2.270*(0.0285) (0.0121) (0.0114) (0.688) (0.744) (1.197)
Somewhatighter ‐0.0613 ‐0.0585*** ‐0.0323 0.835* 1.947*** 4.491**(0.0385) (0.0174) (0.0207) (0.462) (0.683) (2.202)
Significantly Tighter ‐0.119* ‐0.0626*** ‐0.0146* 1.990** 3.177*** 2.029*(0.0656) (0.0203) (0.00885) (0.807) (0.596) (1.170)
Observations 125 204 201 225 197 201
Marginal Effect of Capital Gap on Level of Lending Standards
Marginal Effect of Nonperforming Loans on Level of Lending Standards
• This table reports the marginal effect of the capital gap and nonperforming loans on the probability of tightening standards:
• The capital gap is positive and significant on easier standards (and negative on tighter standards) for leveraged loans and marginally significant for small business loans.
• Nonperforming loans are negative on easier standards (and positive on tighter standards) for jumbo mortgages, HELOC and small business loans.

RESTRICTED FR 31
• A higher capital gap is associated with a insignificant tightening in lending standards.
• Nonperforming loans are statistically significant in driving the tightening of lending standards.
Impact of Capital Gap on change of lending standards
Variables (1) (2) (3) (4)
CET1 ratio ‐0.0466[1.900]
CET1 ratio adj. (BHC) 0.0233 ‐1.029 ‐1.432[1.945] [1.960] [1.946]
CET1 Gap ‐1.720 ‐2.890 ‐2.976[2.430] [2.311] [2.330]
Non‐performing loan ratio ‐5.347** ‐4.679**[2.355] [2.312]
Demand 0.141**[0.0626]
Observations 189 189 189 189

• The difference in capital ratios between large and small banks has narrowed recently as CCAR BHCs have more than doubled their high‐quality capital ratios.
• Loan growth at non‐CCAR banks has been more robust, but differences in loan growth between CCAR and Non‐CCAR banks go beyond just the stress tests:
• Faster growth of C&I loans at non‐CCAR banks seems to be associated with greater risk taking.
• Residential RE loans at CCAR banks may be constrained by still‐elevated delinquency rates on their legacy portfolios.
• Analysis based on publicly available information suggests that banks with higher capital lend more across different loan categories.
• No robust evidence that the “capital gap” implied by supervisory stress tests is restricting lending or causing banks to tighten their lending standards.
Conclusions