the impact of step-down unit care on patient outcomes
TRANSCRIPT

The Impact of Step-Down Unit Care on Patient Outcomes
Carri W. ChanDecision, Risk, and Operations, Columbia Business School,[email protected]
Linda V. GreenDecision, Risk, and Operations, Columbia Business School,[email protected]
Lijian LuDecision, Risk, and Operations, Columbia Business School,[email protected]
Gabriel EscobarDivision of Research, Kaiser Permanente, [email protected]
Step Down Units (SDUs) were initially introduced in hospitals in order to provide an intermediate level of care for
semi-critically ill patients who are not sick enough to require intensive care but not stable enough to be treated in the
general medical/surgical ward. However, there is a lack of consensus within the medical community as to how these
units should be used as well as the impact of SDU care on patient outcomes. Using data from 10 hospitals from a single
hospital network, we use instrumental variable approachesto estimate the impact on patient outcomes of routing patients
to the SDU from the Emergency Department (ED) as well as the Intensive Care Unit (ICU). Our empirical findings
suggest that SDU care is associated with better clinical outcomes for some patients – reducing in-hospital mortality
by 6%-20%, shortening hospital length-of-stay (LOS) by 0.5-1.08 days or reducing ICU readmission rate by 4% and
hospital readmission rate by 8%. However, inappropriatelyadmitting patients to the SDU is associated with an increase
in mortality risk by 1.60% and hospital LOS by nearly a factorof 2. Our findings suggest that an SDU may be a cost-
effective way to treat patients when used as a true step down unit, i.e. for patients who are post-ICU. However, the impact
of SDU care is more nuanced if and when other patients are admitted — for some patients, SDU admission is associated
with substantial degradation of outcomes, while for others, it is associated with slightly improved outcomes.
Key words: healthcare, empirical operations management, congestion, quality of service
1. IntroductionHospitals are responsible for the largest component of national health care expenditures and are therefore
under pressure from government and private payers to becomemore cost efficient (Centers for Medicare &
Medicaid Services 2016). Intensive care units (ICUs), which provide the highest level of care, are the most
costly inpatient units to operate. The estimated annual cost of critical care in the U.S is between $121 and
$263 billion, accounting for 17.4%-39% of total hospital costs (Coopersmith et al. 2012). Step-down units
(SDUs), sometimes called transitional care or intermediate care units, have been used in many hospitals to
mitigate critical care costs without jeopardizing the quality of care. SDUs provide an intermediate level of
care for semi-critically ill patients who are not severe enough to require intensive care but not stable enough
to be treated in the general medical/surgical ward (ward). SDUs are generally less expensive to operate
than ICUs due primarily to lower nurse-to-patient ratios. While an ICU may have one nurse per one or two
1

2
patients, an SDU would typically have one nurse per three to four patients. On the other hand, SDUs are
more expensive than general wards where there are, generally, about 6 patients per nurse.
There is a lack of consensus within the medical community about the role of the SDU. Those who
advocate the use of SDUs see them as an alternative to either maintaining larger ICUs or jeopardizing
patient care due to premature, demand-driven, discharge ofpatients from ICUs to general care units. As the
name suggests, the initial role of SDUs was to serve as a transition for patients after being discharged from
the ICU. In practice, SDUs are often used to treat other patients, for example, those who might have gone
to an ICU but were blocked because the ICU was full. In general, the use of SDUs has evolved without
substantial evidence as to their benefits and what their roleshould be. Some studies argue that these units
provide a safe and cost-effective environment for semi-critical patients and can serve as a “bridge from
hospital to home” thereby improving patient outcomes and efficiency (Byrick et al. 1986, Harding 2009,
andStacy 2011). Other studies argue that SDUs should not be used as there isnot enough evidence of their
cost-effectiveness (Keenan et al. 1998andHanson et al. 1999). Despite the lack of consensus in the medical
community surrounding the use of SDUs as well as the lack of substantive evidence to their effectiveness,
many hospitals have SDUs and others are considering introducing these units. Even within a single hospital,
the use of SDUs is generally not standardized. Therefore, itis very important to understand their value
and how they can best be used. This paper examines whether or not SDUs are associated with improved
operational and/or clinical outcomes. As SDUs are much lessexpensive to operate than ICUs, improvements
associated with SDU care may enable reductions in hospital operating costs without sacrificing patient
outcomes. Given the increasing pressures for hospitals to reduce costs, such insights can be very valuable
to hospital administrators.
To the best of our knowledge, our work is the first to conduct a multi-hospital study to empirically
examine the role of an SDU for patients who are discharged from the ICU as well as those who are admitted
from the Emergency Department (ED). Our analyses are based on recent data from Kaiser Permanente
Northern California, an integrated health care delivery system serving 3.6 million members that operates 21
hospitals, some of which do and some of which do not have SDUs.The cohort and type of data we employ
have been described in previous studies (seeEscobar et al.(2013), Kim et al. (2015) among others). Our
data source is based on nearly 170,000 hospitalizations in atotal of 10 hospitals over a course of one and
half years. Each of the 10 hospitals in our study has an ICU andSDU, though the number of beds in each
of the units varies across hospitals.
There are a number of challenges which arise when trying to understand the impact of SDU care on
patient outcomes. One challenge is that there are limited studies regarding its efficacy and, more specifically,
which patients can be appropriately admitted to the the SDU (Nasraway et al. 1998). While there is some
evidence that some ICU patients who are at low risk of needinglife support could be given less intensive
care in an SDU with no impact on outcomes (e.g.Zimmerman et al.(1995)), there is also evidence that

3
some critical care patients who are treated in SDUs or general wards instead of the ICU are worse off (e.g.
Simchen et al.(2004)). As such, it seems that there are patients who may benefit from being cared for in
an SDU rather than in a general ward, while others who are treated in an SDU rather than an ICU may
suffer adverse consequences. An important empirical challenge is to be able to classify patients in order
to accurately assess the impact of SDU admission on patient outcomes. To that end, we initially segregate
patients who are candidates for SDU care into two broad groups: those who are discharged from the ICU
and those who are admitted to an inpatient unit from the ED. Taking a data-driven approach, we then stratify
patients from the ED into high and low severity groups.
In developing an understanding of SDUs, we face an importantestimation challenge. The SDU admission
decision may be affected by health factors which are known tothe physician at the time of the decision,
but are unobservable in the data. For instance, a patient’s physical appearance (i.e. whether he/she appears
ashen or pale) may provide evidence of early shock. Thus, a physician may determine that, despite relatively
stable vital signs and lab scores, a patient who is pale and sweating will benefit from SDU care relative
to being sent to the general medical ward. But because the patient is more critical than the average ward
patient, he/she is also more likely to have worse outcomes. Similarly, it may be more appropriate to admit
a patient to the ICU if he is cognitively impaired and not lucid. Thus, patients who are admitted to the SDU
instead of the ICU may be healthier by unobservable measures. Ignoring this potential endogeneity could
result in biased estimates. To address this challenge, we utilize an instrumental variable approach to identify
the desired effects.
Our empirical findings suggest that SDU care is associated with substantial improvements in various
patient outcomes for patients discharged from the ICU as well as low severity patients being admitted from
the ED. In particular, for patients in our study cohort who comply with our instrumental variable, we find
that SDU admission is associated with an average reduction in the likelihood of in-hospital death of 1.6% to
6%, remaining hospital length-of-stay (LOS) by .5 to 1.08 days, the likelihood of ICU readmission (for ICU
patients) by 4%, and the likelihood of hospital readmissionby up to 8%. While these findings are supportive
of SDU care, we find that SDU admission is associated with worse outcomes for high severity patients
coming from the ED: mortality risk, readmission risk and LOSare much higher for patients admitted to the
SDU versus the ICU. Our results suggest that when SDUs are used as originally intended, as intermediary
units for post-ICU care, they may result in improved outcomes relative to ward care. However, if hospital
administrators wish to expand the use of SDUs beyond post-ICU care, it is important to be able to classify
which patients should or should not be treated in the SDU.
The rest of the paper is organized as follows. We conclude this section with a brief summary of related
papers in the literature. In Section2, we introduce our study setting and describe our data, including the two
patient cohorts we study. In Section3, we describe our econometric model for our first cohort of patients–
those being discharged from the ICU. Section4 describes how we partition patients who are admitted from

4
the ED into high and low severity patients and then discussesthe econometric model we use for these
patients. Our main results are presented in Section5. Section6 provides directions concluding remarks as
well as discussions for future research.
1.1. Literature Review
Our work is related to existing literature in both the medical and operations management communities.
First, our work contributes to the medical literature aboutthe role of SDUs. We note that while there have
been studies on the SDU, the amount of attention SDUs have garnered is far less than has been expended on
studying other care units, such as the ICU, general medical ward, emergency department, etc. On one hand,
some studies argue that SDUs are a cost-effective approach to treat patients by providing a safe and less
expensive environment for patients who are not quite sick enough to require treatment in the ICU, but not
quite stable enough to be treated in the ward. Without an SDU,most of these patients end up being cared for
in the ICU.Byrick et al.(1986) suggests that the use of the SDU could alleviate ICU congestion by reducing
ICU length-of-stay (LOS) without increasing mortality rates. This reduction is possible because patients do
not have to reach as high a level of stability to be dischargedto an SDU rather than to a general medical-
surgical ward. Other studies that have shown the cost-effectiveness of an SDU includeHarding (2009),
Stacy(2011), andTosteson et al.(1996). On the other hand, a survey of studies on SDUs raises doubts
about these benefits and argues that there is not enough evidence of cost-effectiveness (Keenan et al. 1998).
The majority of these studies are conducted exclusively within a single hospital, whereas our study utilizes
data from 10 different hospitals. Additionally, rather than conducting a before-and-after study, which may
be limited by the inability to control for temporal changes such as staffing changes or closures of nearby
hospitals, we utilize an instrumental variable approach toidentify the impact of different care pathways
(going to the SDU versus ward following ICU discharge as wellas going to the SDU versus ward or ICU
upon hospital admission from the ED). Our multi-center study provides compelling evidence that there are
some patients for whom SDU care is associated with improved clinical outcomes, while there are others for
whom SDU care is associated with worse clinical outcomes. Assuch, our results suggest that it would be of
value for the medical community to focus more attention on developing an understanding of which patients
would or would not benefit from SDU care at hospitals of varying patient mix and resource availability.
Our work is also related to a growing body of literature in theoperations management community regard-
ing ICU care. There are a number of papers, includingSuter et al.(1994), Azoulay et al.(2001), Shmueli
et al.(2003), Escher et al.(2004), Simchen et al.(2004) andKim et al. (2015), which examine the impact
of ICU admission decisions on patient outcomes. While we also look at the admission to ICU versus SDU
versus ward decision, we take a data-driven approach to classifying patients into those who may or may
not benefit from SDU care (i.e., low versus high severity patients). Additionally, a major focus of our work
is the bed transfer decision upon ICU discharge, which was not considered in these prior works.Kc and

5
Terwiesch(2012) also examines the ICU discharge process; however, the focus is onearlydischarges from
the ICU due to demand pressures. This work examines the impact of the type of unit a patient is transferred
to following ICU discharge.
We also consider the admission of patients from the ED. Thereare a number of papers which utilize
stochastic modeling and queueing approaches to study the EDto inpatient unit transfers (e.g.Mandelbaum
et al. (2012), Shi et al.(2014), Huang et al.(2015)). Stowell et al.(2013), Kuntz et al.(2016) take an
empirical approach to explore the impact of admitting patients to various hospital units on patient outcomes.
They find that ‘off-placement’ can degrade patient outcomes. In all of these works, the focus is on admitting
patients to different unitswithin the same level of care. In contrast, our work empirically examines the
impact of admitting patients todifferent levels of care.
Our estimation model is most related to that considered inKim et al. (2015). Like Kim et al. (2015)
and Kc and Terwiesch(2012), among others, we utilize an instrumental variable which is based on an
operational measure–congestion in an inpatient unit. While the general methodology is similar, the question
we are considering is wholly different. The aforementionedworks focus on the ICU, while our focus is
on the SDU. From an operational standpoint, it is of value to develop an understanding of how the use of
the units with lower resource requirements than the ICU may be used to treat moderately severe patients.
Additionally, from the viewpoint of clinicians and hospital administrators, these units are fundamentally
different in their use and role. Because they serve as the site of intermediate care between the ICU and the
ward, there is risk of adverse consequences in admitting a patient to the SDU who actually needs ICU care,
as well as admitting patients who would do just as well on the ward. As such, we first take a data-driven
approach to help identify higher and lower severity patients before estimating the impact of SDU care on
patient outcomes.
2. Setting and Data
We utilize patient data from 10 hospitals from Kaiser Permanente Northern California1, containing 165,948
hospitalizations over a course of one and a half years. We note that even within the Kaiser Permanente
Northern California system, there is no consensus on how to use SDUs. Thus, some hospitals have SDUs,
while others do not.
Our data contains operational and patient level information. Operational level information includes every
unit to which a patient is admitted during his hospital stay along with the date and time of admission
and discharge for each unit. Our objective in this work is to understand the impact of SDU care. Table1
summarizes the distribution of where patients come from immediately preceding their SDU visit. Over 78%
1 This project was approved by the Kaiser Permanente NorthernCalifornia Institutional Review Board for the Protection of HumanSubjects, which has jurisdiction over all study hospitals,and the XXX (redacted for double-bline review) Institutional ReviewBoard for the Protection of Human Subjects.

6
of patients in the SDU come from the ED or ICU. As such, our analysis will focus on these two patient
cohorts. Specifically, we will focus on how transfer to the SDU impacts patients who are admitted to an
inpatient unit from the ED as well as patients who are discharged from the ICU to lower levels of care.
Figure1 depicts these two transfer decisions that will be the heart of our empirical investigation.
Table 1 Distribution of Units Preceding the SDU
Unit Preceding SDU PercentageED 60.93%ICU 17.11%Ward 13.88%
Post-Anesthesia Recovery Unit (PAR) 4.25%Operating Room (OR) 3.58%
Other/Unknown 0.25%
Figure 1 Types of Admission Decisions
ICU
SDU
Ward
ED
Transfer from
the ED
Disch
arge fro
m th
e ICU
For each inpatient unit in each hospital, we use these patient flow data to derive hourly occupancy levels
and we define its capacity as the maximum occupancy level overthe time horizon. Table2 summarizes the
capacity for each of the different levels of inpatient care in each hospital. While each level of care may have
further divisions based on specific services, e.g. medical versus surgical ICU, clinicians and administrators
at the study hospitals indicate that it is widely accepted practice at their hospitals to consider the boundaries
as somewhat fluid in the sense that if a medical service patient requires ICU care, but there are no medical
ICU beds available, he will likely be cared for in the surgical ICU. We observe substantial heterogeneity
across these hospitals; the SDU capacity varies from 11 to 32beds and the the number of ICU beds in a
given hospital ranges from one half to twice the number in theSDU.
Our dataset also contains information about patient characteristics such as age, gender, admitting diagno-
sis and three different severity scores. One score is based on lab results taken 72 hours preceding hospital
admission and the second is based on comorbidities, such as diabetes, that may complicate patient recovery.
These severity scores are assigned at hospital admission and are not updated during the hospital stay (more

7
Table 2 Capacity of Various Inpatient Units
Hosp ICU SDU Ward1 11 24 612 11 25 763 16 14 774 16 19 765 16 24 786 23 19 1247 24 20 1458 26 27 1109 31 11 18810 32 32 100
details on these scores can be found inEscobar et al.(2008, 2013)). The third severity score is the simplified
acute physiology score 3 (SAPS3), which is a common severityscore used exclusively for ICU patients
(see, e.g,Strand and Flaatte(2008), Mbongo et al.(2009), Christensen et al.(2011)).
2.1. Data Selection
Since we study two different transfer decisions (from the EDand from the ICU), we form two separate
patient cohorts: an ED Cohort and an ICU Cohort. Our data selection process is depicted in Figure2.
Because we use the patient flow data to determine the occupancy level (and capacity) for each unit, we
first restrict both of our cohorts to the 12 months in the center of the 1.5 year time period in order to avoid
censored estimates. A patient’s admission category is defined as a combination of whether or not they were
admitted through the ED, and whether they were admitted to a medical or surgical service resulting in 4
categories: ED-medical, ED-surgical, non-ED-medical, ornon-ED-surgical. We primarily focus on patients
who are admitted via the ED to a medical service for two major reasons. First, this group is the largest,
consisting of about 60% of the patients treated in these hospitals, and is similar to the cohort considered in
Kim et al. (2015). Second, the care pathways of surgical patients tend to be fairly standardized, especially
for non-ED-surgical patients, which is the larger of the twosurgical groups. In contrast, the care pathways
of ED-medical patients are more variable. It is this variability we will leverage in our identification strategy
(see Sections3 and4).
2.1.1. ED Cohort Over 60% of SDU patients are admitted from the ED. For these patients, we consider
the ED to inpatient unit admission decision. The three possible units a patient can be admitted to are the
ICU, the SDU, or the Ward. We exclude the less than 5% of ED-medical patients who go directly to the
Operating Room (OR) or Post-Anesthesia Recovery unit (PAR)from the ED.
2.1.2. ICU Cohort Many SDUs are designed as true ‘step-down units’, where patients can only be
admitted following ICU discharges (e.g.Eachempati et al.(2004)). Moreover, the ICU is the second most
frequent unit from which SDU patients are transferred. Thus, our second cohort considers patients dis-
charged from the ICU to either the SDU or ward. To form the ICU Cohort, we consider patients who are

8
Figure 2 Data Selection
Total hospitalizations:
165,948*
Admitted during the 1-year
period: 130,698
Admitted as ED-Medical:
77,418
Admitted to
ICU/SDU/Ward after
1st ED: 74,085**
Out-of-hospital or non-
ICU/SDU/Ward units:
3,333 (4.30%)
Admitted as Surgical or non-
ED patients: 53,280
(40.77%)
Admitted outside the study
period: 35,250 (21.24%)
Admitted to ICU at
least once: 14,996
Admitted to
Ward/SDU after
1st ICU : 11,058**
Never admitted to ICU:
62,422 (80.63%)
Out of hospital or non
Ward/SDU units :
3,938(26.26%)
* to determine capacity and occupancy
** patient cohorts used in our econometric model
ICU Cohort
ED Cohort
admitted to the ICU at least once during their hospital stay.For each patient, we focus on the initial ICU
admission within each hospitalization. We exclude patients who die in the ICU or are discharged directly
home from the ICU, since there is no decision about whether toroute these patients to the SDU or ward
following ICU discharge.
Table3 provides some summary statistics of these two cohorts.
Table 3 Summary Statistics of Patient Demographics
ED Cohort ICU CohortVariable mean std min max mean std min maxAge 67.68 17.53 18 111 68.13 15.91 18 105Male 0.47 0.50 0 1 0.55 0.50 0 1LAPS2 74.70 37.35 0 272 75.13 49.10 0 262COPS2 46.18 44.21 0 290 46.63 44.61 0 267ED LOS (hrs) 1.46 2.20 0.02 118.68 1.57 2.73 0.02 118.68ICU LOS (hrs) N/A 61.87 84.75 0.02 2279.17LOS before ICU (hrs) N/A 32.99 108.88 0 4877.58

9
2.2. Patient Outcomes
We consider four patient outcomes: (1) in-hospital death (Mortality), (2) remaining hospital length-of-stay
(HospRemLOS), (3) hospital readmission (HospReadm), and (4) ICU readmission (ICUReadm) for
ICU patients.
The outcomeHospRemLOS is defined as the remaining time spent in the hospital following the transfer
decision. Thus, for patients in the ED Cohort, this will be their total inpatient LOS; for patients in the ICU
Cohort, this will be the remaining time spent in the hospitalfollowing ICU discharge.
HospReadm2w is defined as hospital readmission within two weeks after leaving hospital (e.g., see
Doran et al.(2013) andOuanes et al.(2012) which use these durations). In calculating hospital readmission
rates, we exclude patients with in-hospital death. We also do robustness checks for different time windows
for hospital readmission.
Following Brown et al.(2013) which aims to define reasonable time windows for ICU readmission, we
considerICUReadm2d (ICUReadm5d) which indicate ICU readmission within two (five) days following
ICU discharge. This measure is studied only for the ICU Cohort. We also do robustness checks for different
time windows for ICU readmission.
Table4 summarizes these patient outcomes for the two cohorts.
Table 4 Summary Statistics of Patient Outcomes: Mean (Numbe r of observations or standard deviation for
continuous variables)
ED Cohort ICU CohortICU SDU Ward SDU Ward
Outcome mean (N/std) mean (N/std) mean (N/std)mean (N/std) mean (N/std)Mortality 0.12 (8,630) 0.04 (14,832) 0.03 (50,623)0.06 (3,832) 0.07 (7,226)
HospRemLOS (days) 6.67 (11.51) 4.23 (5.89) 4.05 (5.79) 7.24 (14.76) 5.13 (10.91)HospReadm - 2 weeks0.12 (7,629) 0.11 (14,269) 0.10 (49,206)0.14 (3,585) 0.13 (6,685)ICUReadm - 2 days N/A 0.04 (3,832) 0.05 (7,226)ICUReadm - 5 days N/A 0.08 (3,832) 0.06 (7,226)
3. Discharge from the ICU
We begin by explicitly stating our fundamental research question for the ICU cohort: Following ICU dis-
charge, is SDU care associated with better patient outcomesthan those for patients receiving ward care and,
if so, what is the magnitude of the improvement?
3.1. Econometric Challenge: Endogeneity
Our objective is to utilize retrospective patient data to determine if ICU patients who are transferred to the
SDU have better outcomes than those transferred to the ward.Because we are using retrospective data,
an estimation challenge arises due to the fact that the routing decision following ICU discharge is likely

10
correlated with patient outcomes. To highlight this challenge, we start with the following reduced form
model for hospital LOS:
log(HospRemLOSi) = βXi+ γADMITSDUi + νh(i) + ǫi (1)
whereXi is a vector of control variables including patient characteristics (e.g. age) and seasonal factors
(e.g, admission time of day),ADMITSDUi is an indicator variable that equals 1 if patienti is transferred
directly to the SDU following ICU discharge,h(i) is the hospital where patienti is treated,νh(i) is the
hospital fixed effect andǫi denotes the error term. (see Table13 in AppendixA for more details on control
variables). While we include controls for patient severity, unobservable patient severity measures may be
correlated with bothHospRemLOS andADMITSDU . That is, sicker patients are more likely to be
transferred to the SDU than the ward, but are also more likelyto have bad outcomes. As such, our estimates
for γ may be biased and we may erroneously conclude that going to the SDU hurts patients. To overcome
this potential endogeneity bias, we utilize an identification strategy using Instrumental Variables (IVs).
3.2. Instrumental Variable
A valid instrument should be 1) correlated with the endogenous variable,ADMITSDUi, and 2) unrelated
to the unobservable factors captured inǫi which affect patient outcomes. We propose to use congestionin
the SDU one hour before the ICU discharge as an IV. In particular, we defineSDUBusyi as an indica-
tor variable that equals one when the number of available beds in the SDU one hour prior to patienti’s
discharge from the ICU is less than or equal to two, and zero otherwise2. On average, about 11% patients
are discharged from the ICU when the SDU is busy (SDUBusy = 1), though this varies quite a bit across
hospitals (see Table14).
When controlling for various patient characteristics in a Probit regression model, we also find at the 0.1%
significance level that when the SDU is busy, patients are less likely to go to the SDU. In particular, we
estimate that, on average, 21.14% percent of patients are routed to the SDU ifSDUBusy = 1 and this
percentage increases to 35.91% ifSDUBusy = 0. Namely, a congested SDU is predicted to result in a
47% reduction in the likelihood of the SDU admission. Hence,condition 1 is satisfied.
We now consider Condition 2 and consider whetherSDUBusyi is uncorrelated with unobservable fac-
tors in patient outcomes captured inǫi. Since we cannot examine unobservable measures, we use patient
severity,SAPS3, as a proxy for those unobservable factors. In particular, we perform a two-sample
Kolmogorov-Smirnov test (seeGibbons and Chakraborti 2011for details) to test the hypothesis that the
2 We also do robustness checks in AppendixA by considering different specifications ofSDUBusyi: (1) different cutoffs at one,two, three, four available beds; (2) dummy variables using occupancy level with cutoffs at80th (or 85th, 90th, 95th) percentile,i.e.,SDUBusyi = 1 if occupancy level is larger than the cutoff percentile and zero otherwise; (3) congestion represented by acontinuous piecewise linear spline variable with knots at the80th (or 85th, 90th, 95th) percentile; and (4) these measures 2 hours(instead of 1) prior to ICU discharge.

11
distribution of SAPS3 for patients who are discharged from ICU whenSDUBusy = 1 is not statistically
different to that whenSDUBusy = 0. The p-value for the combined Kolmogorov-Smirnov test is 0.136.
Thus, we can not reject the null hypothesis and believe that patients who are discharged from the ICU when
SDUBusy= 1 are statistically similar to patients who are discharged from the ICU whenSDUBusy= 0.
For completeness, we also check this for the LAPS2 score, which is assigned at the time of hospital admis-
sion. The p-value of the combined Kolmogorov-Smirnov test is 0.334.
Kc and Terwiesch 2012demonstrates that ICU congestion could result in early discharge, which could, in
turn, affect the routing decision of ICU patients. While ICUcongestion has been used as an IV in a number
of hospital studies (e.g.Kc and Terwiesch 2012, Kim et al. 2015), we find that ICU congestion is not a
valid IV. This is because the impact of ICU congestion does not exhibit a consistent effect on ICU routing,
i.e., a congested ICU could result in both a higher and a lowerpercentage of patients being admitted to the
SDU depending on a patient’s severity score. Moreover, we find that the ICU congestion is correlated with
a patient’s SAPS3 and LAPS2 score.
We also considered using a number of additional instrumental variables. Specifically, we considered a
measure of the average severity of other patients in the ICU,a measure of how the discharged patient
compares to the severity of other patients in the ICU, and a measure of severity for the most recently
discharged ICU patient. We find that all of these measures arecorrelated with the SAPS3 and LAPS2 scores,
suggesting they may also be correlated with unobservable measures of severity, thereby invalidating these
variables as potential instruments.
3.3. Econometric Model
3.3.1. Continuous outcome modelsWe now present our estimation model for our continuous out-
come,HospRemLOS. Since the ICU to SDU routing decision,ADMITSDUi, is a binary variable, we
model the ICU discharge decision via a latent variable model.
ADMITSDU∗
i= Xiθ+αSDUBusyi +ωh(i) + ξi,
ADMITSDUi = 1{ADMITSDU∗
i> 0} ,
log(HospRemLOSi) = Xiβ+ γ ·ADMITSDUi + δ ·AvgOccV isitedi + νh(i) + εi, (2)
whereADMITSDU∗
iis a latent variable which represents the propensity towards SDU admission;Xi
is a vector of control variables for patient information;ωh(i) is the hospital fixed effect; and,ξi represents
unobservable factors that affect the routing at ICU discharge. For the outcome equation,νh(i) is the hospital
fixed effect; andεi captures unobservable factors that affect patient outcomes.
We also control for the daily average occupancy level, denoted asAvgOccV isitedi, patienti experiences
for all impatient units s/he is admitted toafter leaving the ICU and before leaving hospital. AppendixA
provides robustness checks for different specifications ofAvgOccV isitedi, as well as with this control
12
excluded. We include such a measure asKc and Terwiesch(2012) shows that patient outcomes are affected
by congestion;Kim et al. (2015) provides additional discussion.
The error terms(ξi, εi) in (2) may be correlated to model the endogeneity between the routing decision
at ICU discharge and the patient outcome. We assume that(ξi, εi) follows a Standard Bivariate Normal
distribution with correlation coefficientρ. This model can be jointly estimated using a treatment effect
model via via Full Maximum Likelihood Estimation (FLME) (Greene 2012). A likelihood ratio test of null
ρ= 0 can be used to test the presence of endogeneity.
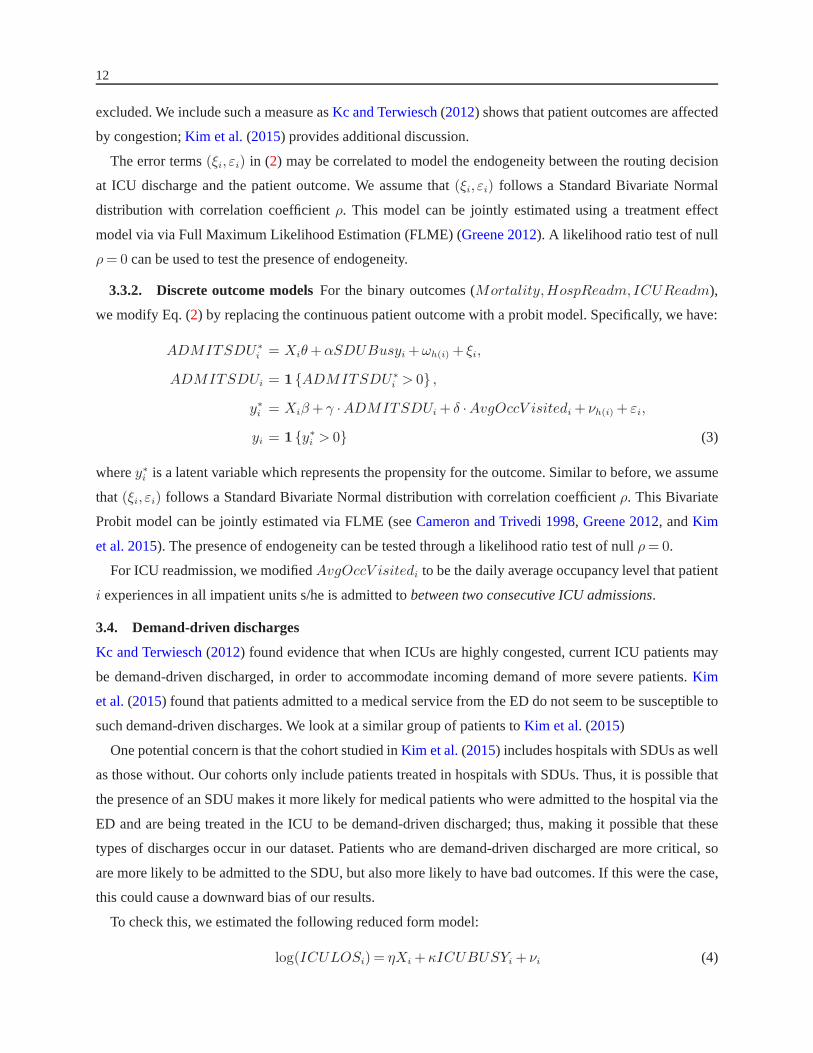
3.3.2. Discrete outcome modelsFor the binary outcomes (Mortality,HospReadm,ICUReadm),
we modify Eq. (2) by replacing the continuous patient outcome with a probit model. Specifically, we have:
ADMITSDU∗
i= Xiθ+αSDUBusyi +ωh(i) + ξi,
ADMITSDUi = 1{ADMITSDU∗
i> 0} ,
y∗i= Xiβ+ γ ·ADMITSDUi + δ ·AvgOccV isitedi + νh(i) + εi,
yi = 1{y∗i> 0} (3)
wherey∗i
is a latent variable which represents the propensity for theoutcome. Similar to before, we assume
that (ξi, εi) follows a Standard Bivariate Normal distribution with correlation coefficientρ. This Bivariate
Probit model can be jointly estimated via FLME (seeCameron and Trivedi 1998, Greene 2012, andKim
et al. 2015). The presence of endogeneity can be tested through a likelihood ratio test of nullρ= 0.
For ICU readmission, we modifiedAvgOccV isitedi to be the daily average occupancy level that patient
i experiences in all impatient units s/he is admitted tobetween two consecutive ICU admissions.
3.4. Demand-driven discharges
Kc and Terwiesch(2012) found evidence that when ICUs are highly congested, current ICU patients may
be demand-driven discharged, in order to accommodate incoming demand of more severe patients.Kim
et al.(2015) found that patients admitted to a medical service from the ED do not seem to be susceptible to
such demand-driven discharges. We look at a similar group ofpatients toKim et al. (2015)
One potential concern is that the cohort studied inKim et al.(2015) includes hospitals with SDUs as well
as those without. Our cohorts only include patients treatedin hospitals with SDUs. Thus, it is possible that
the presence of an SDU makes it more likely for medical patients who were admitted to the hospital via the
ED and are being treated in the ICU to be demand-driven discharged; thus, making it possible that these
types of discharges occur in our dataset. Patients who are demand-driven discharged are more critical, so
are more likely to be admitted to the SDU, but also more likelyto have bad outcomes. If this were the case,
this could cause a downward bias of our results.
To check this, we estimated the following reduced form model:
log(ICULOSi) = ηXi +κICUBUSYi + νi (4)

13
to explore whether ICU LOS is reduced when the ICU is busy. We estimateκ to be−0.05 with standard
error0.04. Thus, consistent withKeenan et al.(1998) andKim et al. (2015), we do not find evidence that
patients are demand-driven discharged. To dig a little deeper, we examined whether the SDU congestion
had an impact on whether patients are demand-driven discharged. To do this, we enhance our regression
model to include a measure of SDU congestion:
log(ICULOSi) = ηXi +κICUBUSYi +φSDUBUSYi +ψ (ICUBUSYi ×SDUBUSYi)+ νi (5)
In particular, we would expect demand-driven discharges tobe most common when the ICU is busy and
the SDU is not. Table5 summarizes these results. We find that none of the coefficients are statistically
significant. Thus, we do not find any evidence suggesting thatdemand-driven discharges impact our ICU
cohort.
Table 5 Demand-driven discharges: Effect of ICUBusy and SDUBusy on ICU LOS
Parameter Estimate (SE) ICU Busy SDU Busy # Observationsκ -0.057 (0.040) 1 0 855φ -0.039 (0.039) 0 1 1,056ψ -0.034 (0.096) 1 1 136Note.Standard error in parentheses.+(p < 10%),∗ (p < 5%),∗∗ (p < 1%),∗∗∗ (p < 0.1%).
4. Admission to Inpatient Unit
In this section, we study the routing decision regarding theED Cohort. We aim to empirically estimate
how SDU admission immediately following transfer from the ED affects patient outcomes, comparing to
ED patients who are transferred to the ICU or ward. Here, a similar estimation challenge arises. Routing
decisions are associated with patient severity and, thus, with patient outcomes.
Kim et al. (2015) examined this problem in the context of admitting patientsto the ICU from the ED.
In that paper, the goal was to estimate the impact of admitting a patient to the highest level of car, i.e. the
ICU versus elsewhere. In contrast, our objective is to understand the impact of admitting patients to an
intermediary level of care, the SDU. In contrast to the ICU case, it is possible that the impact of SDU care
could be positive, neutral or even negative. For instance, high severity patients who should be admitted to
the ICU, but are instead admitted to the SDU may experience worse outcomes as a result. On the other
hand, SDU care may have no impact or even benefit low severity patients who would traditionally be cared
for in the ward. There are limited objective standards for who should be treated in the ICU (seeTask Force
of the American College of Critical Care Medicine, Society of Critical Care Medicine(1999) andKim et al.
(2015)), let alone for the SDU (Nasraway et al. 1998). Thus, such categorizations of patients are likely to
be highly varied across different physicians. As such, we take a data-driven approach to stratifying patients
by severity.

14
4.1. Severity Categorization
In order to estimate the impact of SDU care for patients admitted from the ED, we categorize patients based
on their severity and study each severity group separately.Specifically, we aim to identify a ‘low severity’
cohort, for which the decision is to admit patients to eitherthe ward or SDU, and a ‘high severity’ cohort
for which the decision is to admit to either the SDU or ICU. Certainly, it seems reasonable to expect the
decision to admit a patient to the SDU will have a different impact on the low versus high severity patients.
We begin by considering how patient level characteristics influence whether a patient is admitted to the
ICU, SDU or ward from the ED. Specifically, we estimate an Ordered Probit regression model using only
patient characteristics.
Txi =
Ward, if Tx∗
i6 t1
SDU, if t1 <Tx∗
i6 t2
ICU, if t2 <Tx∗
i
and Tx∗
i=X ′
iθ+ ξi, (6)
whereX ′
iis a vector of control variables for patient characteristics andξi represents unobservable factors.
We use the observed latent variableTx∗
i= X ′
iθ to define each patient’s severity. Intuitively,Tx
∗
iis a
linear transformation of patient characteristics into a single continuous variable which can be interpreted as
a measure for the desired amount of care for the patient. The larger the value ofTx∗
, the more likely the
patient will be routed to higher level units, e.g., the ICU; the lower the value, the more likely a patient will
be routed to the ward.
We differentiate high-severity patients from low-severity patients with thresholds. In theory,t1 and t2
from (6) partition theTx∗
ispace into patients who will be routed to the Ward, SDU, and ICU, so that
patients withTx∗
i≤ t1 could be classified as low-severity patients and patients with Tx∗
i> t2 could be
classified as high-severity patients. However, because we do not observeξi, we are only able to observe an
estimateT x∗
i, instead ofTx∗
i. Thus, some patients withTx
∗
i≤ t1 will be routed to the SDU, or even the
ICU. Similarly, patients withT x∗
i> t2 may be routed to the SDU or ward. Increasingt2 will increase the
proportion of patients withTx∗
i> t2 who are routed to the ICU and simultaneously decrease the proportion
who are routed to the ward. Similarly, decreasingt1 will increase the proportion of patients withTx∗
i≤ t1
being admitted to the ward and decrease the proportion beingadmitted to the ICU. Of course, this also
comes at the cost of reducing the number of patients which satisfy these two criteria. Thus, we define the
cutoffs to balance increasing the proportion of patients inthe high (low) severity group who are routed to
the ICU (ward) versus maintaining large enough patient cohorts to allow for meaningful statistical analysis.
We use a data-driven approach and find that setting thresholds as the95th and60th percentiles achieve this
delicate balance. In AppendixA, we run robustness checks using different thresholds.
We expect that when the SDU is congested, patients will be less likely to be admitted (e.g. see Section3).
Thus, we examine where patients are admitted when the SDU is busy, defined as done in Section3. Figure3
shows the proportion of patients admitted to each unit, while Table6 summarizes these results. Note that the

15
ICU and SDU congestion have a correlation coefficient of 0.08, so the busyness of the ICU does not factor
substantially into these results. Specifically, we ran t-tests comparing the proportion of patients admitted to
each level of inpatient unit when the SDU is busy versus not busy. As we can see, when the SDU is busy,
low severity patients will be rerouted to the ward (p < 0.001), rather than the ICU (p= 0.327). Conversely,
when the SDU is busy, high severity patients tend to be rerouted to the ICU (p= 0.002), rather than the ward
(p= 0.212). These results are suggestive that these severity categorizations are reasonable for our purposes.
0%
10%
20%
30%
40%
50%
60%
70%
80%
90%
100%
SDUBusy = 0 SDUBusy = 1
To Ward To SDU To ICU
(a) High-severity Patients
0%
10%
20%
30%
40%
50%
60%
70%
80%
90%
100%
SDUBusy = 0 SDUBusy = 1
To Ward To SDU To ICU
(b) Medium-severity Patients
0%
10%
20%
30%
40%
50%
60%
70%
80%
90%
100%
SDUBusy = 0 SDUBusy = 1
To Ward To SDU To ICU
(c) Low-severity Patients
Figure 3 Proportions of ED patients who are routed to the ICU, SDU, and ward when SDUBusy = 1 vs
SDUBusy = 0.
Table 6 Proportions of ED patients who are routed to the ICU, S DU, and ward when SDUBusy = 1 vs
SDUBusy = 0 and results of t-tests which compare the difference in routi ng proportions.
SDUBusy = 0 SDUBusy = 1 p-value of t-testICU SDU Ward ICU SDU Ward ICU SDU Ward
Low Severity 4.62% 15.97% 79.14% 4.94% 5.23% 89.93% 0.327 < 0.001 < 0.001Medium Severity 16.90% 31.05% 52.04% 21.84% 12.64% 65.51% 0.013 < 0.001 0.001High Severity 53.60% 22.39% 24.01% 63.38% 10.06% 26.56% 0.002 < 0.001 0.212
Remark 1 In theory, one could also consider a ‘medium severity’ group. One of the challenges in trying to
measure the impact of SDU care is that it may benefit some patients, while harming others. The challenge
is classifying patients into groups such that the impact of SDU care is consistent within the cohort, so that
one can attempt to use statistical approaches for causal inference. This is particularly challenging for a
medium severity group. We see that when the SDU busy, patients may be sent to the ICU or Ward, making it
difficult to assess whether SDU is beneficial or harmful. As such, we leave the exploration of these types of
patients for future research.

16
As summarized in Table7, for the high severity group, 54.9% are admitted to the ICU, 20.76% to the
SDU, and 24.35% to the ward. For low severity patients 4.65%,14.73% and 80.62% are admitted to the
ICU, SDU, and ward, respectively. We can see that even with our classifications, some high (low) severity
patients will still be admitted to the ward (ICU). In order tofocus on the impact of SDU admissions on
patient outcomes, we exclude high (low) severity patients who are routed to the ward (SDU). Tables8 and
9 report summary statistics of patient demographics and outcomes for each severity group.
Table 7 Routing Statistics of High-severity and Low-severi ty Patients
High-Severity Patients Low-Severity PatientsUnit following the ED Frequency PercentageFrequency Percentage
ICU 2,034 54.90 2,067 4.65SDU 769 20.76 6,549 14.73Ward 902 24.35 35,836 80.62
Table 8 Summary Statistics of Patient Demographics for ED Co hort by severity classification
Low Severity High SeverityVariable mean std min max mean std min maxAge 67.48 18.57 18 107 70.36 14.74 18 102Male 0.43 0.49 0 1 0.57 0.50 0 1LAPS2 59.48 26.89 0 158 155.57 31.85 16 272COPS2 41.96 41.21 0 10 285 64.13 53.64 0 278ED LOS (hrs) 1.38 1.99 0.02 62.73 1.66 2.92 0.02 113.50
Table 9 Summary Statistics of Patient Outcomes for ED Cohort by severity classification: Mean (Number of
observations or standard deviation for continuous variabl es)
Low Severity High SeveritySDU Ward SDU ICU
Outcome mean (N/std) mean (N/std) mean (N/std) mean (N/std)Mortality 0.02 (6,549) 0.02 (35,836) 0.17 (769) 0.27 (2,034)
HospRemLOS (days) 3.97 (5.85) 3.95 (5.21) 6.68 (10.54) 9.35 (14.22)HospReadm - 2 weeks0.10 (6,431) 0.10 (35,258) 0.17 (636) 0.16 (1,483)
4.2. IV Justification
We are again faced with the econometric challenge of endogeneity bias. Our econometric model is very
similar to that of (2) and (3). The main difference is that for low (high) severity patients,ADMITSDUi
is equal to 1 if the patient is admitted to the SDU and 0 if to theward (ICU). Detailed descriptions of the
covariates are shown in Table13 in the Appendix. Similarly, we also control forAvgOccV isitedi, i.e., the
daily average occupancy level patienti experiences for all impatient units s/he is admitted toafter leaving
the ED and before leaving hospital.

17
Similar to our models for the ICU Cohort, we consider usingSDUBusyi as an instrumental variable.
Additionally, we consider usingICUBusyi as an instrument asKim et al. (2015) found that it is a good
instrument when studying patients who are or are not admitted to the ICU, which is similar to our High
severity group. Specifically, we defineSDUBusyi (ICUBusyi) as an indicator variable that equals one
when the number of available beds in the SDU (ICU) one hour prior to patienti’s transfer from the ED is
less than or equal to two, and zero otherwise3. On average, the proportions of patients who are transferred
from the ED when the SDU is busy and the ICU is busy are approximately 12% and 6%, respectively.
As discussed previously, in order for a variable to be a validinstrument, it has to be 1) correlated with
the endogenous variable,ADMITSDUi, and 2) unrelated to the unobservable factors which affect patient
outcomes. As seen in Table6, when the SDU is busy, patients are less likely to be admittedto the SDU.
However, we find that ICU congestion does not appear to have a monotonic effect on SDU admission for
low severity patients. Specifically, we observe that when wepartition the low severity patients into deciles
of Tx∗
i, ICU congestion increases the percentage of SDU admissionsfor some patients, while it has no
effect or evendecreasesthe percentage of SDU admissions for other patients. Therefore, we conclude that
ICUBusyi is not a valid instrument for low severity patients. We see these effects more concretely when
we analyze a Probit regression model, which controls for various patient characteristics and operational con-
trols. We find with 0.1% significance level that SDU congestion reduces the likelihood of SDU admission
for both low and high severity patients, and that ICU congestion increases the chance of SDU admission
for only high severity patients. The impact of ICU congestion for low-severity patients is not statistically
significant.
We next examine whether our instruments are correlated withobservable measures of severity. We again
perform a two-sample Kolmogorov-Smirnov test to test the hypothesis that the distribution of LAPS2
is not statistically different whenSDUBusy = 1 (ICUBusy = 1) from that whenSDUBusy = 0
(ICUBusy =0). For low severity patients, the p-value for the Kolmogorov-Smirnov test is 0.135, thus, we
conclude that patients who leave the ED whenSDUBusy=1 are statistically similar to those who leave the
ED whenSDUBusy= 0. For high severity patients, the p-values are 0.141 and 0.358 for SDUBusy and
ICUBusy, respectively. Therefore, our models for low severity patients useSDUBusyi as an instrument,
while bothSDUBusyi andICUBusyi are used in the models for high severity patients.
4.2.1. Additional Instruments Apart from the congestion in the ICU and the SDU, we also consider
other potential behavioral IVs discussed inKim et al. (2015). The first factor isRecentDischargeSDU
i,
which accounts for the number of all SDU discharges in the 3-hr window before patient is admission to
3 We also do robustness checks in AppendixA by considering different specifications ofSDUBusyi andICUBusyi: (1) differentcutoffs at one, two, three, four available beds; (2) dummy variables using occupancy level with cutoffs at80th (or 85th, 90th,95th) percentile, i.e.,SDUBusyi(ICUBusyi) = 1 if occupancy level is larger than the cutoff percentile and zero otherwise; (3)congestion represented by a continuous piecewise linear spline variable with knots at the80th (or 85th, 90th, 95th) percentile; and(4) these measures 2 hours (instead of 1) prior to ICU discharge.

18
the first inpatient unit. The second behavioral factor,RecentAdmissionSDU
i, accounts for the number
of SDU admissions in the 3-hr window before patient is admission to the first inpatient unit. To define
RecentDischargeSDU
iandRecentAdmissionSDU
i, we normalize the number of discharges or admis-
sions by the SDU capacity of each hospital. The third factor,LastAdmitSeveritySDU
i, measures the
severity of the last patient admitted to the SDU from the ED. We also considerRecentDischargeICU
i,
RecentAdmissionICU
i, LastAdmitSeverityICU
i, which are defined the same way but instead involve
the ICU. Most of these variables demonstrate a heterogenousimpact on the SDU admission decision; for
instance, amongst low severity patients,RecentAdmissionSDU
iwill increase the likelihood of SDU admis-
sion, while it will decrease likelihood for other patients.We find that onlyRecentAdmissionICU
iis a valid
instrument and is valid only for high-severity patients. However, we do not include this as a third IV for
high-severity patients in our main specifications because the results are similar.
5. ResultsWe now present our main results for the three different groups of patients we study. We find that the effect
of SDU admission varies substantially across these different patient types.
5.1. ICU Cohort
We start by exploring the impact of SDU care on patients beingdischarged from the ICU. Because we
jointly estimate the SDU admission decision and patient outcomes, using FMLE, the impact ofSDUBusyi
may vary slightly for different outcomes. That said, we observe that the differences are very minor. For
illustrative purposes, we note that the coefficient for the impact ofSDUBusyi in the Mortality model is
−0.5110 with standard error0.0503 and p-value< 0.1%.
As we are primarily interested in estimating the causal effects of SDU admission on patient outcomes,
we report only the coefficient of SDU admission on the patientoutcomes, i.e.,γ in (2) and (3).
Table 10 Effect of SDU Admission Following ICU discharge ( γ) on Patient Outcomes
With IV Without IV
Outcome γ (SE)Predicted Outcome
ρ (SE)Test
γ (SE)PSDU PWard ρ=0
Mortality -0.60∗∗ (0.22) 3.96% 10.26% 0.26+ (0.14) 0.07 -0.18∗∗∗ (0.05)log(HospRemLOS) -0.35∗∗∗ (0.10) 2.48 3.56 0.44∗∗∗ (0.05) 0.00 0.38∗∗∗ (0.02)
ICUReadm2d -0.51∗∗ (0.20) 2.34% 6.62% 0.32∗ (0.12) 0.02 0.01 (0.05)ICUReadm5d -0.51∗∗ (0.18) 3.93% 10.10% 0.36∗∗ (0.11) 0.05 0.09∗ (0.04)HospReadm2w -0.43∗ (0.21) 8.66% 17.08% 0.21+ (0.12) 0.09 0.05 (0.04)
Note.Standard error in parentheses.+(p < 10%),∗ (p < 5%),∗∗ (p < 1%),∗∗∗ (p < 0.1%).Predicted outcome:PSDU - Average predicted outcome if all patients could be routed to the SDU
andPWard if no SDU and everyone is rerouted to Ward.PredictedHospRemLOS (days) is shown instead oflog(HospRemLOS)
Table 10 summarizes the relationship between SDU admission right after ICU discharge and patient
outcomes. The sign of SDU admission is negative and statistically significant in all outcome measures,

19
suggesting that routing an ICU discharge to the SDU is associated with improved patient outcomes. To get a
rough estimate of the magnitude of the effects we’ve estimated, we also use our estimation results to predict
patient outcomes under two extreme scenarios: (i) the SDU has ample capacity so that all patients will be
routed to the SDU (referred to asPSDU ) versus (ii) the hospital does not have an SDU and all patients
will be routed to the ward (referred to asPWard). We find that, on average, SDU care is associated with
significant improvements in patient outcomes: the relativereduction is 72% in the likelihood of in-hospital
death, 34% in the hospital remaining length-of-stay, 67.7%(63.9%) in the likelihood of ICU readmission
within 2 (5) days, and 52% in the likelihood of hospital readmission within 2 weeks.
We note that the large effect on mortality rate is under the hypothetical (and extreme) comparison of
sending all patients to the SDU versus ward. In practice, if there were no SDU, this could likely impact the
ICU discharge decision, so that, e.g. patients would have toreach a higher level of stability before being
discharged to the ward. Moreover, these estimates are basedon reroutingall patients to the ward, while our
estimates (as with all instrumental variables estimates) are for the subset of patients who ‘comply’ with the
IV. That is, our estimates are an average treatment effect for the patients who the SDU versus ward routing
decision may be impacted by SDU congestion. As it is difficultto ascertain exactly which patients comprise
this subset, we provide marginal estimates assuming the average treatment effect is consistent across our
entire cohort.
Another factor which could be impacting our results is “do not resuscitate (DNR)” orders, which are
patients’ end-of life wishes not to undergo Cardiopulmonary resuscitation (CPR) or advanced cardiac life
support if their heart were to stop or they were to stop breathing. In speaking with intensivists, we learned
it is possible that patients with DNRs are more likely to be sent to the ward, but also may be more likely to
die, resulting in an overestimate of the effect of SDU care. Unfortunately, we do not have access to patients’
DNR status, so cannot control for this. That said, DNR ordersonly represent 9% of ICU patients (Jayes
et al. 1993), so this is likely to affect only a small percentage of patients. Additionally, there is evidence
that DNR orders do not change the quality of care (Baker et al. 2003). We do not expect DNR orders to
impact our results for hospital readmission since we exclude patients who died in hospital in this model.
For remaining LOS, we find that our results are robust to including and excluding patients who died.
Our empirical findings also suggest strong evidence of an endogeneity bias between the routing following
ICU discharge and patient outcomes. The p-value of the likelihood ratio test with null hypothesisρ= 0 is
small, as seen in Table10, implying a strong correlation between the routing at ICU discharge and patient
outcomes. Ignoring this endogeneity tends to result in underestimates of the benefit of SDU care and could
result in a qualitatively different insight; see the columntitled with “Without IV”.
5.2. ED Cohort
We now consider the impact of SDU admission on patients beingadmitted to an inpatient unit from the ED.

20
5.2.1. High SeverityWe find that a busy SDU is associated with a decrease in likelihood of SDU
admission for high severity patients, while a busy ICU is associated with an increase in likelihood of SDU
admission. For the mortality model, the coefficient onSDUBusyi is −0.6325 with standard error0.1043
and p-value< .1%; for ICUBusyi, the coefficient is0.4072 with standard error0.1352 and p-vale< .1%.
The results are similar for the other patient outcome models. Table11 summarizes the impact of SDU
admission after ED transfer on the various patient outcomesfor these patients.
Table 11 Effect of SDU Admission Following the ED ( γ) on Patient Outcomes for High Severity Patients
With IV Without IV
Outcome γ (SE)Predicted Outcome
ρ (SE)Test
γ (SE)PSDU PICU ρ=0
Mortality 0.75∗ (0.33) 42.08% 20.86% -0.48∗ (0.18) 0.03 -0.05 (0.07)log(HospRemLOS) 0.45∗∗∗ (0.12) 8.31 5.32 -0.57∗∗∗ (0.07) 0.00 -0.32∗∗∗ (0.04)HospReadm2w 1.27∗∗ (0.40) 49.17% 11.51% -0.78∗ (0.20) 0.04 -0.08 (0.08)
Note.Standard error in parentheses.+(p < 10%),∗ (p < 5%),∗∗ (p < 1%),∗∗∗ (p < 0.1%).Predicted outcome:PSDU - Average predicted outcome if all patients will be routed tothe SDU
andPICU if everyone is routed to the ICU.PredictedHospRemLOS (days) is shown instead oflog(HospRemLOS)
For high severity patents, being admitted to the SDU appearsto be associated with worse outcomes, as
seen in the sign of SDU admission coefficient, which is positive and statistically significant in all outcome
measures. We also present the predicted patient outcomes under two extreme scenarios: (i) the ICU has no
available capacity but the SDU has ample capacity so all patients will be routed to the SDU (PSDU ) and (ii)
the ICU has ample capacity and all patients will be routed to the ICU (PICU ). Our results suggest that being
admitted to the SDU instead of the ICU is associated with substantial degradation in patient outcomes. SDU
admission is, on average, associated with an increase of 91.60% in in-hospital death and 28.21% in hospital
remaining length-of-stay. SDU care also increases the likelihood of hospital readmission within 2 weeks
by 2.93 times. As with the ICU cohort, the marginal effects estimates are based on the estimated treatment
effect, which is averaged across all patients who comply with the instruments. Thus, one should interpret
our results as demonstrating substantive and rigorous evidence to the statistical significance and direction
of the treatment effect. Again, we see evidence of a correlation between the SDU admission decision and
patient outcomes.
The results for LOS and hospital readmissions are consistent with Kim et al. (2015). Interestingly, we
find that being admitted to the SDU is associated with an increase in mortality risk, whileKim et al. (2015)
did not find an impact of non-ICU care on mortality. One potential explanation is thatKim et al. (2015)
considered all patients admitted from the ED to a medical service, while we stratify our analysis to focus on
only the high severity patients. As such, the results ofKim et al. (2015) may be distorted as SDU care may
improve mortality risk for some patients within their cohort while also degrading mortality risk for other

21
patients, thereby cancelling each other out. In contrast, since we focus on patients who are more likely to be
admitted to the ICU (i.e. 54.90% compared to 11% inKim et al. (2015)), we are able to provide a cleaner
estimate.
5.2.2. Low SeverityWe now consider the impact of SDU admission on low severity patients. For
low severity patients, a busy SDU is associated with a decrease in likelihood of SDU admission. For the
mortality model, the coefficient onSDUBusyi is −0.5117 with standard error0.0376 and p-value< .1%.
The results are similar for the other patient outcome models.
Table12 summarizes our results. We find that although SDU care is associated with worse outcomes for
high severity patients, it may actually benefit low severitypatients. Specifically, we find that SDU care is
associated with lower mortality rate and shorter hospital remaining length-of-stay, as seen in the positive
sign of SDU admission coefficient. We again use our estimation results to predict the patients outcomes
under two extreme cases: (i) the SDU has ample capacity and all patients will be routed to the SDU (PSDU )
and (ii) the hospital does not have an SDU and all patients will be admitted to the Ward (PWard). Our results
indicate that, on average, SDU care is associated with a reduction in mortality by 78.60% and hospital
remaining length-of-stay by 19.90%. As with the ICU cohort and the high severity patients, these marginal
estimates are based on the assumption that the SDU effects apply to all patients according to the average
treatment effect, so may overestimate the potential benefits of SDU care for non-compliers. We do not find
a statistically significant relationship between SDU care and the likelihood of hospital readmission within
2 weeks.
Table 12 Effect of SDU Admission Following the ED ( γ) on Patient Outcomes for Low Severity Patients
With IV Without IV
Outcome γ (SE)Predicted Outcome
ρ (SE)Test
γ (SE)PSDU PWard ρ=0
Mortality -0.55∗∗ (0.28) 0.64% 2.24% 0.33+ (0.17) 0.07 0.06 (0.06)log(HospRemLOS) -0.20∗∗∗ (0.04) 2.37 2.89 0.18∗∗∗ (0.03) 0.00 0.03∗ (0.01)HospReadm2w -0.13 (0.12) - - 0.09 (0.07) 0.21 0.02 (0.03)
Note.Standard error in parentheses.+(p < 10%),∗ (p < 5%),∗∗ (p < 1%),∗∗∗ (p < 0.1%).Predicted outcome:PSDU - Average predicted outcome if all patients could be routed to the SDU
andPWard if no SDU and everyone is routed to the Ward.PredictedHospRemLOS (days) is shown instead oflog(HospRemLOS)
5.3. Robustness Checks
We now describe a number of robustness checks for our main results. First, we tried different specifica-
tions of control variables. Recall that, some of our controlvariables – age, severity scores (LAPS2, COPS2,
SAPS3), length-of-stay at ICU, and length-of-stay before ICU admission – are modeled as spline variables

22
to account their possible non-linear effects on the ICU to SDU and ED to SDU routings and patient out-
comes. We repeated the analysis with different specifications, including changing the number of cutoffs and
values of these cutoffs. Our results are qualitatively similar to these changes.
The second robustness check we did is with respect to the length of time window for readmission. For
ICU readmission, we varied the time window of the ICU readmission from time of ICU discharge from 2 to
7 days and also during any time frame during the same hospitalstay. For hospital readmission, we consider
hospital readmission within 1 week, 2 weeks, and 30 days after a patient is discharged from the hospital.
We found that our main results are similar to those in Tables10, 11, and12with slight quantitative changes.
For example, the effects of the ICU to SDU and ED to SDU routings areweakerwhen the elapsed time
between two consecutive hospital stays is longer. We provide the detailed estimation results in Tables19,
28, and21 in the Appendix.
For ICU readmission, we also checked alternative specifications ofAvgOccV isited. In the paper, we
defineAvgOccV isited for ICU readmission as the average occupancy for all units a patients is admitted
to between two consecutive ICU admissions. We considered three alternatives: 1) the average occupancy
for all units a patient is admitted to inthe remaining hospital stay before leaving hospital; 2) the average
occupancy for all units a patient is admitted towithin 3 daysafter the ICU discharge and before the next ICU
admission; and 3) excluding a control forAvgOccV isited. While these three specifications yield similar
results, there are slight differences in the significance level – the first is the strongest and the last is the
weakest, see Table18 in the Appendix.
For the LOS models, we also considered the robustness of our results to including patients with in-
hospital death. We find that for the ICU cohort and for the low-severity patients in the ED Cohort, our
results are very robust. However, as seen in Table17, when including patients with in-hospital mortality in
the high-severity ED Cohort, the sign ofγ is negative and statistically significant. This raises questions as
to the robustness of our LOS results for the high-severity group. However, we believe the main results as
reported are more likely to be aligned with the true effect direction and size of SDU admission as it has
been well established in the medical literature to exclude patients with in-hospital death for LOS models
(e.g.Rapoport et al.(1996), Norton et al.(2007)).
5.3.1. Severity categorizationsIn our severity categorizations for the ED Cohort, we took a data-
driven approach and used thresholds onTx∗
ito partition the patients into Low and High Severity groups.
We varied the thresholds for these categorizations and examined the estimation results in the Appendix.
Table16 presents the results for the low severity patients. As with our main specification, we do not
find statistically significant results for the Hospital Readmission models. We find that the results for
HospRemLOS is very robust in magnitude and statistical significance to different specifications of the the
low severity threshold. While the mortality results are robust to lowering the threshold, which reduces the

23
sample size, we lose statistical significance when increasing the threshold. This may be because as the sam-
ple size is increased, more medium severity patients whose mortality risk may suffer with SDU admission
are included in the cohort. When examining the LOS results more closely, we see that as the threshold is
increased, the magnitude of the coefficient decreases, suggesting that the low severity cohort is including
more patients for which SDU care is detrimental.
Table15 presents the results for the high severity patients. We see that, in some cases, increasing the
threshold for high severity patients results in some of the regressions not converging. This is likely because
the size of the cohort is being made smaller and smaller, and there are not enough samples to solve the FMLE
optimization. Our tests suggest that the hospital readmission results are not very robust. On the other hand,
theHospRemLOS results are quite robust to changes in the threshold. Similar to our observations for the
low severity patients, we see that as the threshold decreases, the magnitude of the coefficient decreases. This
may be because medium severity patients who benefit from SDU care are entering into the high severity
cohort as the threshold is decreased. A similar argument canbe made for the mortality results.
5.3.2. Definitions of ‘Busy’ We also vary the definition of a busy SDU and a busy ICU by considering
different cutoffs for the number of available beds, rangingfrom one bed to four. On average, the percentage
of patients, who are discharged from the ICU when the SDU is congested, varies from 34% to 3% when
the cutoff is decreased from four beds to one (Table14). While the quantitative effect of a busy SDU and
ICU varies for these different specifications, the main results do not change–being admitted to the SDU
following ICU discharge is associated with better patient outcomes, and being admitted to the SDU from
the ED is associated with better and worse patient outcomes for low severity patients and high severity
patients, respectively. See Tables19, 20, 21, and28. We also considered alternative measures of SDU (ICU)
congestion based on percentiles of the SDU (ICU) occupancy level. We did this using a binary variable
indicating whether the occupancy level exceeds a thresholdpercentile as well as a piece-wise linear spline.
The estimation results are similar to our results obtained in the other specifications. See Tables22 - 30. We
find that our results are very robust to different specifications of our instrumental variables.
6. Conclusions and Managerial Insights
This paper studies the role of a hospital step-down unit (SDU) in the care of patients. To that end, we con-
sider a fundamental question regarding the SDU: Does admitting a patient to the SDU improve or degrade
patient outcomes and, if so, what is the magnitude of these effects? Our work represents an important first
step towards answering this question. We find that while the answer for patients discharged from the ICU
(its original purpose) is fairly clear, for those admitted from the ED, it is quite nuanced – some patients will
benefit, while others will not. Moreover, the impact of SDU care can be substantial, so it is essential to be
able to carefully identify which patients are appropriate for SDU care.
24
Using patient data from 10 hospitals, we use econometric models to estimate the impact of SDU care.
Our empirical results suggest that using SDUs according to their original intent — as a true step down unit
from the ICU — is associated with substantial improvements in patient outcomes relative to discharge to
a ward. Under the hypothetical comparison that all patientscan be discharged to the SDU rather than all
patients being discharged to the ward, we find that the SDU is associated with a reduction in in-hospital
mortality rate of 70%, ICU readmission rate of 67.7%, hospital readmission rate of 52%, and hospital
length-of-stay of 34%. As such, we find compelling evidence that there are measurable benefits to having
an SDU for these patients. It is important to note that our findings for patients being discharged from the
ICU provide guidelines and demonstrate the potential for using SDUs in a way that not only results in
better clinical outcomes, but also can result in significantcost savings for hospitals. Because SDUs are
significantly less expensive to operate than ICUs, and have the potential to significantly decrease ICU
and hospital readmissions as well as remaining hospital LOS, properly used they can result in decreased
hospital bed utilization and staffing costs. In the current healthcare environment in which hospitals are under
increasing pressure to be more cost-effective, findings like the ones in this paper can be very valuable in
achieving that goal.
Though the role of an SDU was originally intended for post-ICU care, its use has expanded and patients
are often admitted from non-ICU units. For patients admitted to an inpatient unit from the ED, the impact
of an SDU is much more nuanced. We take a data-driven approachto partition patients in to high and low
severity groups. We find that low severity patients may benefit from the additional monitoring provided in
the SDU. However, off-placing high severity patients who should be admitted to the ICU into the SDU is
associated with substantial adverse consequences with regard to mortality risk and hospital LOS. While
there appear to be potential benefits associated with SDUs, if used inappropriately, they could degrade
patient outcomes and increase costs. As such, it is essential to identify which patients can be safely admitted
to the SDU and those who cannot. If such classification provestoo challenging (e.g unavailability of relevant
clinical data such as those from tests and imaging), our results suggest that it may be better to restrict use of
the SDU to function as a true step-down unit and only allow admission of patients from the ICU. Of course,
this may require additional capacity in the ICU.
Our work complements the results ofArmony et al.(2013). When ICU and SDU capacity is limited,
Armony et al.(2013) provides insights into how to allocate resources between the two units depending on
the relative costs of abandonment of critical patients and bumping of semi-critical patients. This work is
a first step towards estimating the impact of bumping semi-critical patient from the SDU to the ward on
patient outcomes, thereby providing insights into the bumping cost component which drives the capacity
allocation decision.
There are a number of opportunities for future work. Our empirical analysis relies on the variation in
patient routings following ICU discharge or following admission from the ED due to SDU and/or ICU

25
capacity constraints. Consequently, our estimates fundamentally apply to patients whose SDU admission
comply with our instrumental variables. As such, it is not possible to make any statements about the impact
of SDU care for patients whose care pathway is invariant to SDU (or ICU) bed availability. While it is
difficult to extrapolate our results to make inferences on the precise magnitude of the effect of the SDU on
individual patients, our results demonstrate strong evidence as to the directional impact of an SDU. Because
SDUs go in and out of favor at individual hospitals, there maybe opportunities for natural experiments to
make such inferences without requiring an instrumental variable analysis. Alternatively, at a hospital system
such as Kaiser Permanente, it might be possible to conduct a controlled randomized trial by randomizing
which hospitals have SDUs. Of course, such a study would require substantial buy-in from hospital admin-
istrators and staff. The purpose of our work is to measure therelationship between SDU care and patient
outcomes rather than to build a predictive model to determine the role of SDU care for each individual
patient. In such a setting, a split-validation approach would be useful to verify the out of sample predictive
power of such a model.
Our empirical setting focuses on patients admitted to the hospital via the ED to a medical service. A num-
ber of studies in the medical literature consider the impactof SDUs on surgical patients (e.g.Eachempati
et al. (2004)). The impact of SDU congestion is likely very different forsurgical patients, where surgical
procedures and schedules often dictate the precise care pathway for these patients. Hence, an alternative
identification strategy is likely needed.
From a stochastic modeling point of view, it would be interesting to study the optimal control policies
regarding where to transfer patients from the ED or following ICU discharge in the presence of an SDU.
This would provide a system-level view that would capture the potential benefits of an SDU, including
externalities on other patients, beyond the estimates of individual patients estimated in this work. Addition-
ally, given the findings of this work, one could consider how to determine the capacity of the SDU relative
to the ICU given patient mix and arrival rates. One factor which would significantly impact this decision
is whether to restrict use of the SDU to be a true step-down versus allowing admission of patients from
non-ICU units, such as the ED.
ReferencesArmony, M., C. W. Chan, B. Zhu. 2013. Critical care capacity management: Understanding the role of a step down
unit. Working Paper, Columbia Business School.
Azoulay, E., F. Pochard, S. Chevret, C. Vinsonneau, M. Garrouste, Y. Cohen, M. Thuong, C. Paugam, C. Apperre,
B. De Cagny. 2001. Compliance with triage to intensive care recommendations.Critical care medicine292132
– 2136.
Baker, D., D. Einstadter, S. Husak, R. Cebul. 2003. Changes in the use of do-not-resuscitate orders after implementa-
tion of the patient self-determination act.Journal of General Internal Medicine18343 – 349.

26
Brown, S., S. Ratcliffe, S. Halpern. 2013. An empirical derivation of the optimal time interval for defining ICU
readmissions.Medical Care51706 – 714.
Byrick, R. J., J. D. Power, J. O. Ycas, K. A. Brown. 1986. Impact of an intermediate care area on ICU utilization after
cardiac surgery.Critical care medicine14869–872.
Cameron, A. C., P. K. Trivedi. 1998.Regression analysis of count data. Cambridge University Press.
Centers for Medicare & Medicaid Services. 2016. National health expenditure tables. URLwww.cms.
gov/Research-Statistics-Data-and-Systems/Statistics-Trends-and-Reports/
NationalHealthExpendData/Downloads/Tables.zip. Accessed, 06/07/2016.
Christensen, S., M. Johansen, C. Christiansen, R. Jensen, S. Lemeshow. 2011. Comparison of charlson comorbidity
index with saps and apache scores for prediction of mortality following intensive care.Journal of Clinical
Epidemiology3 203–211.
Coopersmith, C., H. Wunsch, M. Fink, W. Linde-Zwirble, K. Olsen, M. Sommers, K. Anand, K. Tchorz, D. Angus,
C. Deutschman. 2012. A comparison of critical care researchfunding and the financial burden of critical illness
in the United States.Critical Care Medicine401072 – 1079.
Doran, K., K. Ragins, A. Iacomacci, A. Cunningham, K. Jubanyik, G. Jenq. 2013. The revolving hospital door:
hospital readmissions among patients who are homeless.Medical Care51767 – 773.
Eachempati, S. R., L. J. Hydo, P. S. Barie. 2004. The effect ofan intermediate care unit on the demographics and
outcomes of a surgical intensive care unit population.Archives of Surgery139(3) 315–319.
Escher, M., T. Perneger, J. Chevrolet. 2004. National questionnaire survey on what influences doctors’ decisions about
admission to intensive care.BMJ 329425 – 429.
Escobar, G. J., M. N. Gardner, J. D. Greene, D. Draper, P. Kipnis. 2013. Risk-adjusting hospital mortality using a
comprehensive electronic record in an integrated health care delivery system.Medical Care51(5) 446–453.
Escobar, G. J., J. D. Greene, P. Scheirer, M. N. Gardner, D. Draper, P. Kipnis. 2008. Risk-adjusting hospital inpatient
mortality using automated impatient, outpatient, and laboratory databases.Medical Care46232–239.
Gibbons, J., S. Chakraborti. 2011.Nonparametric Statistical Inference. 5th ed. Boca Raton, FL: Chapman &
Hall/CRC.
Greene, W. H. 2012.Econometric Analysis. 7th ed. Upper Saddle River, NJ: Prentice Hall.
Hanson, C. W., C. S. Deutschman, H. L. Anderson, P. M. Reilly,E. C. Behringer, C. W. Schwab, J. Price. 1999.
Effects of an organized critical care service on outcomes and resource utilization: A cohort study.Critical Care
Medicine27270 – 274.
Harding, A. D. 2009. What can an intermediate care unit do foryou?Journal of Nursing Administration394 – 7.
Huang, Junfei, Boaz Carmeli, Avishai Mandelbaum. 2015. Control of patient flow in emergency departments, or
multiclass queues with deadlines and feedback.Operations Research63(4) 892–908.

27
Jayes, R., J. Zimmerman, D. Wagner, E. Draper, W. Knaus. 1993. Do-not-resuscitate orders in intensive care units.
current practices and recent changes.JAMA2702213 – 2217.
Kc, D. S., C. Terwiesch. 2012. An econometric analysis of patient flows in the cardiac intensive care unit.Manufac-
turing and Service Operations Management1450 – 65.
Keenan, S. P., W. J. Sibbald, K. J. Inman, D. Massel. 1998. A systematic review of the cost-effectiveness of noncardiac
transitional care units.Chest113172 – 177.
Kim, S. H., C. W. Chan, M. Olivares, G. Escobar. 2015. ICU admission control: An empirical study of capacity
allocation and its implication for patient outcomes.Management Science61(1) 19–38.
Kuntz, Ludwig, Stefan Scholtes, Sandra Sulz. 2016. Separate & concentrate: Accounting for process uncertainty in
the design of regional hospital systems.Working Paper, Cambridge University.
Mandelbaum, Avishai, Petar Momcilovic, Yulia Tseytlin. 2012. On fair routing from emergency departments to hos-
pital wards: Qed queues with heterogeneous servers.Management Science58(7) 1273–1291.
Mbongo, C., P. Monedero, F. Guillen-Grima, M. Yepes, M. Vives, G. Echarri. 2009. Performance of saps3, compared
with apache ii and sofa, to predict hospital mortality in a general ICU in southern europe.European Journal of
Anaesthesiology26940–945.
Nasraway, Stanley A, Ian L Cohen, Richard C Dennis, MichelleA Howenstein, Diana K Nikas, Jonathan Warren,
Suzanne K Wedel. 1998. Guidelines on admission and discharge for adult intermediate care units.Critical care
medicine26(3) 607–610.
Norton, S.A., L.A. Hogan, R.G. Holloway, H. Temkin-Greener, M.J. Buckley, T.E. Quill. 2007. Proactive palliative
care in the medical intensive care unit: Effects on length ofstay for selected high-risk patients.Crit Care Med
351530–1535.
Ouanes, I., C. Schwebel, A. Francais, C. Bruel, F. Philippart, A. Vesin, L. Soufir L, C. Adrie, M. Garrouste-Orgeas,
J. Timsit, B. Misset. 2012. A model to predict short-term death or readmission after intensive care unit discharge.
Journal of Critical Care27422 e1 – e9.
Rapoport, J., D. Teres, S. Lemeshow. 1996. Resource use implications of do not resuscitate orders for intensive care
unit patients.Am J Respir Crit Care Med153185–190.
Shi, P., M. Chou, J. Dai, D. Ding, J. Sim. 2014. Models and insights for hospital inpatient operations: Time-dependent
ED boarding time.Management Science, to appear.
Shmueli, A., C. Sprung, E. Kaplan. 2003. Optimizing admissions to an intensive care unit.Health Care Management
Science6 131–136.
Simchen, E., C. L. Sprung, N. Galai, Y. Zitser-Gurevich, Y. Bar-Lavi, G. Gurman, M. Klein, A. Lev, L. Levi, F. Zveibil,
et al. 2004. Survival of critically ill patients hospitalized in and out of intensive care units under paucity of
intensive care unit beds.Critical care medicine321654 – 1661.
Stacy, K. M. 2011. Progressive care units: Different but thesame.Critical Care Nurse3177 – 83.
28
Stowell, Andrew, Pierre-Geraud Claret, Mustapha Sebbane,Xavier Bobbia, Charlotte Boyard, Romain Genre Grand-
pierre, Alexandre Moreau, Jean-Emmanuel de La Coussaye. 2013. Hospital out-lying through lack of beds and
its impact on care and patient outcome.Scand J Trauma Resusc Emerg Med2117.
Strand, K., H. Flaatte. 2008. Severity scoring in the ICU: a review. Acta Anaesthesiologica Scandinavica52 467 –
478.
Suter, P., A. Armaganidis, F. Beaufils, X. Bonfill, H. Burchardi, D. Cook, A. Fagot-Largeault, L. Thijs, S. Vesconi,
A. Williams. 1994. Predicting outcome in ICU patients.Intensive Care Medicine20390 – 397.
Task Force of the American College of Critical Care Medicine, Society of Critical Care Medicine. 1999. Guidelines
for intensive care unit admission, discharge, and triage.Critical Care Medicine27633–638.
Tosteson, A., L. Goldman, I. S. Udvarhelyi, T. H. Lee. 1996. Cost-effectiveness of a coronary care unit versus an
intermediate care unit for emergency department patients with chest pain.Circulation94143–150.
Zimmerman, J. E., D. P. Wagner, W. A. Knaus, J. F. Williams, D.Kolakowski, E. A. Draper. 1995. The use of risk
predictions to identify candidates for intermediate care units. Chest108490 – 499.

29
Appendix A: Supplementary Tables
Table 13 Control variables for patient characteristics and hospital care
Variable Description ICU Cohort ED CohortGender Dummy variable: Males were coded 1 and females 0 X X
Age Continuous variable: Coded as piecewise linear spline variableswith knots at its50th and80th percentiles (65 and 81)
X X
LAPS2 Laboratory-based Acute Physiology Score; measures physio-logic derangement at admission and is mapped from 14 labora-tory test results, such as arterial pH and white blood cell count,obtained 72 hours preceding hospitalization to an integer valuethat ranges from 0 to 262 in our data set(higher scores indi-cate poorer condition); coded as piecewise linear spline variableswith knot at its50th and80th percentiles (94 and 134)
X X
COPS2 Comorbidity Point Score; measures the chronic illness burdenand is based on 41 comorbidities, such as diabetes, to whichpatients are categorized using outpatient and inpatient data fromthe 12 months preceding hospitalization. It ranges from 0 to267in our data set, a higher score indicates a higher comorbid illnessburden, it was coded as piecewise linear spline variables withknot at its50th and80th percentiles (33 and 87)
X X
SAPS3 Simplified Acute Physiology Score; measures the severity ofill-ness and predict vital status at hospital discharge based onICUadmission data. SAPS3 score is associated with each ICU admis-sion and is calculated based on data obtained within on hour ofICU admission. SAPS3 ranges from 14 to 100 in our data set;coded as piecewise linear spline variables with knot at its50th
and80th percentiles (52 and 61)
X
Admittingdiagnosis
A way of classifying ICD9 codes. This clinical classification sys-tem was developed by HCUP and buckets ICD9’s into about 200groups. A further grouping of the variable HCUP developed byGabriel Escobar to condense the HCUP grouping into 38 groupsso it could be used in a similar fashion as PRIMCOND3.
X X
Seasonality Month/day-of-week/time-of-day; Category variable for eachmonth and day-of-week. For time-of-day, we use category vari-ables for nurse shifts happening three times a day at 7am, 15pm,and 23pm.
X X
Previousunit
Category variable to track impatient unit a patient is admitted toimmediately before ICU admission.
X
LOSbeforeICU
Continuous variable that is the total lengh-of-stay (hrs) prior tothe ICU admission. It measures how long a patient has been inhospital before being admitted to the ICU, coded as piecewiselinear spline variables with knot at its50th and80th percentiles(2 and 31).
X
ICU LOS Continuous variable that is the lengh-of-stay (hrs) at the firstICU. It measures how long a patient has been taking care of atICU, coded as piecewise linear spline variables with knot atits50th and80th percentiles (38 and 83).
X
ED LOS Continuous variable that is the lengh-of-stay (hrs) at the first ED.It measures how long a patient has been taking care of at ED.
X

30
Table 14 ICU Cohort: Percentage of patients who are discharg ed from ICU when SDU is busy
% when number of available SDU bedsHosp SDU Size ≤ 1 ≤ 2 ≤ 3 ≤ 4
1 24 0.93 3.57 7.80 12.172 25 0.66 2.95 7.54 12.463 14 0.56 7.94 24.29 45.634 19 3.17 12.68 27.07 41.595 24 0.28 1.54 3.93 7.876 19 0.82 3.34 6.76 15.377 20 0.00 2.84 16.74 36.778 27 2.81 9.34 18.80 31.749 11 9.76 37.72 63.94 80.3410 32 0.34 2.66 6.19 12.71
All hosp 2.52 10.64 21.70 34.00

31
Table 15 Estimation Results for Patient Outcomes: Differen t High Severity Thresholds as specified by
percentiles of Tx∗
i .
Percentile ofTx∗
iEstimate (SE) AME ARC ρ (SE) Testρ= 0
Mortality
90th and above 0.35 (0.23) - - -0.26+ (0.13) 0.0591th and above 0.35 (0.24) - - -0.27+ (0.14) 0.0792th and above 0.36 (0.30) - - -0.28 (0.17) 0.1293th and above 0.51+ (0.29) 0.13 71.24% -0.37∗ (0.16) 0.0494th and above 0.52+ (0.31) 0.14 73.19% -0.36+ (0.18) 0.0695th and above 0.75∗ (0.33) 0.21 91.60% -0.48∗ (0.18) 0.0396th and above 0.96∗ (0.46) 0.28 116.71% -0.57+ (0.25) 0.0897th and above 0.80 (0.59) - - -0.47 (0.31) 0.20
log(HospRemLOS)
90th and above -0.01 (0.22) - - -0.23 (0.17) 0.1991th and above 0.23 (0.16) - - -0.41∗∗∗ (0.11) 0.0092th and above 0.25 (0.17) - - -0.42∗∗∗ (0.12) 0.0093th and above 0.36∗∗ (0.13) 0.36 23.93% -0.50∗∗∗ (0.09) 0.0094th and above 0.35∗∗ (0.13) 0.35 22.54% -0.51∗∗∗ (0.09) 0.0095th and above 0.45∗∗∗ (0.12) 0.45 28.21% -0.57∗∗∗ (0.07) 0.0096th and above 0.48∗∗ (0.14) 0.48 29.01% -0.56∗∗∗ (0.08) 0.0097th and above 0.51∗ (0.21) 0.51 29.09% -0.65∗∗∗ (0.11) 0.00
HospReadm1w
90th and above -0.27 (0.56) - - 0.15 (0.34) 0.6791th and above 0.19 (0.69) - - -0.13 (0.42) 0.7792th and above 0.33 (0.57) - - -0.21 (0.34) 0.5493th and above 0.45 (0.59) - - -0.31 (0.34) 0.4094th and above 0.53 (0.74) - - -0.36 (0.42) 0.2495th and above 1.27∗ (0.59) 0.32 390.23% -0.77 (0.26) 0.1196th and above Does not converge Does not converge97th and above Does not converge Does not converge
HospReadm2w
90th and above -0.33 (0.45) - - 0.22 (0.28) 0.4491th and above 0.07 (0.62) - - -0.02 (0.38) 0.7592th and above 0.29 (0.50) - - -0.16 (0.30) 0.5993th and above 0.63 (0.65) - - -0.39 (0.38) 0.3594th and above 0.72+ (0.59) 0.20 165.56% 0.47+ (0.34) 0.0995th and above 1.27∗∗ (0.40) 0.38 293.70% -0.78∗ (0.20) 0.0496th and above Does not converge Does not converge97th and above Does not converge Does not converge
HospReadm30d
90th and above -0.16 (0.35) - - 0.07 (0.21) 0.7691th and above 0.14 (0.37) - - -0.11 (0.22) 0.6492th and above 0.15 (0.35) - - -0.12 (0.21) 0.5693th and above 0.39 (0.36) - - -0.29 (0.21) 0.2194th and above 0.56 (0.40) - - -0.42 (0.23) 0.1195th and above 0.97∗∗ (0.31) 0.31 278.71% -0.65∗∗ (0.17) 0.0196th and above Does not converge Does not converge97th and above Does not converge Does not converge
Note.Standard error in parentheses.+(p < 10%),∗ (p < 5%),∗∗ (p < 1%),∗∗∗ (p < 0.1%).AME - Average Marginal Effect; ARC - Average Relative Change.

32
Table 16 Estimation Results for Patient Outcomes: Differen t Low Severity Thresholds as specified by
percentiles of Tx∗
i .
Percentile ofTx∗
iEstimate (SE) AME ARC ρ (SE) Testρ= 0
Mortality
85th and below -0.35 (0.35) - - 0.22 (0.22) 0.3280th and below -0.46 (0.34) - - 0.30 (0.21) 0.1875th and below -0.51 (0.33) - - 0.33 (0.20) 0.1270th and below -0.52 (0.31) - - -0.33 (0.20) 0.1165th and below -0.52 (0.30) - - -0.33 (0.19) 0.1160th and below -0.55∗∗ (0.28) -0.02 -78.60% 0.33+ (0.17) 0.0755th and below -0.58∗∗ (0.23) -0.02 -80.82% 0.34∗ (0.14) 0.0350th and below -0.58∗∗ (0.24) -0.02 -80.81% 0.33∗ (0.14) 0.0345th and below -0.58+ (0.31) -0.02 -81.40% 0.34+ (0.19) 0.09
log(HospRemLOS)
85th and below -0.08∗ (0.04) -0.08 -8.55% 0.11∗∗∗ (0.03) 0.0080th and below -0.14∗∗∗ (0.04) -0.14 -14.35% 0.14+ (0.03) 0.0975th and below -0.14∗∗∗ (0.04) -0.14 -14.65% 0.15∗∗∗ (0.03) 0.0070th and below -0.15∗∗∗ (0.04) -0.15 -15.15%-0.16∗∗∗ (0.03) 0.0065th and below -0.17∗∗∗ (0.04) -0.17 -16.87% 0.16∗∗∗ (0.03) 0.0060th and below -0.20∗∗∗ (0.04) -0.20 -19.90% 0.18∗∗∗ (0.03) 0.0055th and below -0.21∗∗∗ (0.04) -0.21 -20.26% 0.18∗∗∗ (0.03) 0.0050th and below -0.22∗∗∗ (0.04) -0.22 -21.46% 0.18∗∗∗ (0.03) 0.0045th and below -0.22∗∗∗ (0.05) -0.22 -21.67% 0.19∗∗∗ (0.03) 0.00
HospReadm1w
85th and below -0.04 (0.12) - - 0.04 (0.07) 0.5780th and below 0.00 (0.14) - - 0.01 (0.08) 0.8875th and below -0.03 (0.14) - - 0.02 (0.08) 0.8070th and below -0.03 (0.14) - - 0.16 (0.08) 0.8065th and below -0.03 (0.14) - - 0.05 (0.08) 0.8160th and below -0.03 (0.15) - - 0.02 (0.08) 0.7855th and below 0.00 (0.15) - - 0.00 (0.09) 0.9950th and below -0.03 (0.18) - - 0.00 (0.10) 0.9445th and below -0.11 (0.21) - - 0.05 (0.11) 0.67
HospReadm2w
85th and below -0.04 (0.10) - - 0.04 (0.07) 0.5080th and below -0.02 (0.11) - - 0.03 (0.07) 0.6975th and below -0.06 (0.12) - - 0.04 (0.07) 0.5270th and below -0.08 (0.12) - - 0.04 (0.07) 0.4565th and below -0.11 (0.14) - - 0.05 (0.07) 0.2560th and below -0.15 (0.12) - - 0.09 (0.07) 0.1855th and below -0.16 (0.13) - - 0.09 (0.07) 0.2050th and below -0.10 (0.14) - - 0.06 (0.08) 0.4345th and below -0.10 (0.17) - - 0.07 (0.09) 0.45
HospReadm30d
85th and below -0.04 (0.09) - - 0.04 (0.05) 0.4180th and below -0.02 (0.10) - - 0.03 (0.06) 0.5775th and below -0.07 (0.10) - - 0.05 (0.06) 0.3470th and below -0.10 (0.11) - - 0.06 (0.06) 0.3065th and below -0.09 (0.12) - - 0.05 (0.06) 0.2760th and below -0.10 (0.11) - - 0.07 (0.06) 0.2355th and below -0.09 (0.11) - - 0.06 (0.06) 0.3250th and below -0.09 (0.12) - - 0.06 (0.07) 0.3645th and below -0.12 (0.14) - - 0.08 (0.07) 0.29
Note.Standard error in parentheses.+(p < 10%),∗ (p < 5%),∗∗ (p < 1%),∗∗∗ (p < 0.1%).AME - Average Marginal Effect; ARC - Average Relative Change.

33
Table 17 Effect of SDU Admission Following the ED ( γ) on HospRemLOS When Including Patients with
In-Hospital Death
Cohort γ (SE)Predicted Outcome
ρ (SE)Test
PSDU PICU /PWard ρ=0
ED Cohort - High Severity -1.83∗∗ (0.07) 1.33% 8.31% (PICU ) 0.81∗∗∗ (0.02) 0.00ED Cohort - Low Severity -0.20∗∗∗ (0.04) 2.38 2.92 (PWard) 0.18∗∗∗ (0.03) 0.00Note.Standard error in parentheses.+(p < 10%),∗ (p < 5%),∗∗ (p < 1%),∗∗∗ (p < 0.1%).Predicted outcome:PSDU - Average predicted outcome if all patients could be routed to the SDU
andPICU (PWard) if no SDU and everyone is routed to the ICU (Ward).PredictedHospRemLOS (days) is shown instead oflog(HospRemLOS)
Table 18 ICU Cohort Robustness Test on ICU Readmissions: Alt ernative Specifications for AvgOccV isited
AvgOccV isited Estimate (SE) AME ARC ρ (SE) Testρ= 0ICUReadm2d
Before next ICU admission (Baseline)-0.51∗∗ (0.20) -0.04 -68% 0.32∗ (0.12) 0.02Before hospital discharge -0.62∗∗∗ (0.19) -0.05 -74% 0.38∗∗ (0.11) 0.00
3 days before next ICU admission -0.50∗∗ (0.20) -0.04 -67% 0.31* (0.12) 0.02AvgOccV isited not included -0.40∗ (0.20) -0.03 -58% 0.25∗ (0.12) 0.05
ICUReadm
Before next ICU admission (Baseline) -0.24 (0.20) - - 0.25∗ (0.12) 0.05Before hospital discharge -0.40∗ (0.18) -0.06 -53% 0.34∗∗ (0.11) 0.00
3 days before next ICU admission -0.23 (0.20) - - 0.24+ (0.12) 0.06AvgOccV isited not included -0.15 (0.20) - - 0.19 (0.12) 0.11
Note.Standard error in parentheses.+(p < 10%),∗ (p < 5%),∗∗ (p < 1%),∗∗∗ (p < 0.1%).AME - Average Marginal Effect; ARC - Average Relative Change.

34
Table 19 ICU Cohort Robustness Test on Patient Outcomes: Bin ary SDUBusy Based on Number of
Available Beds
SDUBusy= 1 Estimate (SE) AME ARC ρ (SE) Testρ= 0Mortality
SDUFreeBeds<=4 -0.56∗ (0.27) -0.06 -70% 0.23 (0.17) 0.17SDUFreeBeds<=3 -0.47∗ (0.23) -0.05 -64% 0.17 (0.14) 0.22SDUFreeBeds<=2 -0.60∗∗ (0.22) -0.06 -72% 0.26+ (0.14) 0.07SDUFreeBeds<=1 -0.69∗∗∗ (0.25) -0.07 -77% 0.31+ (0.16) 0.06
log(HospRemLOS)
SDUFreeBeds<=4 -0.42∗∗∗ (0.03) -0.42 -37% 0.47∗∗∗ (0.05) 0.00SDUFreeBeds<=3 -0.38∗∗∗ (0.10) -0.38 -36% 0.46∗∗∗ (0.05) 0.00SDUFreeBeds<=2 -0.35∗∗∗ (0.10) -0.35 -34% 0.44∗∗∗ (0.05) 0.00SDUFreeBeds<=1 -0.36∗∗∗ (0.12) -0.36 -34% 0.44∗∗∗ (0.06) 0.00
ICUReadm2d
SDUFreeBeds<=4 -0.70∗∗∗ (0.20) -0.06 -78% 0.43∗∗∗ (0.12) 0.00SDUFreeBeds<=3 -0.76∗∗∗ (0.17) -0.07 -81% 0.47∗∗∗ (0.10) 0.00SDUFreeBeds<=2 -0.51∗∗ (0.20) -0.04 -68% 0.32∗ (0.12) 0.02SDUFreeBeds<=1 -0.39 (0.27) - - 0.24 (0.17) 0.16
ICUReadm3d
SDUFreeBeds<=4 -0.30 (0.31) - - 0.21 (0.19) 0.28SDUFreeBeds<=3 -0.52∗ (0.22) -0.05 -67% 0.35∗ (0.13) 0.02SDUFreeBeds<=2 -0.45∗ (0.20) -0.05 -61% 0.31∗ (0.12) 0.02SDUFreeBeds<=1 -0.18 (0.35) - - 0.14 (0.21) 0.53
ICUReadm5d
SDUFreeBeds<=4 -0.41 (0.27) - - 0.30+ (0.16) 0.08SDUFreeBeds<=3 -0.55∗∗ (0.20) -0.07 -67% 0.39∗∗∗ (0.12) 0.00SDUFreeBeds<=2 -0.51∗∗ (0.18) -0.06 -64% 0.37∗∗∗ (0.10) 0.00SDUFreeBeds<=1 -0.15 (0.29) - - 0.14 (0.18) 0.42
ICUReadm
SDUFreeBeds<=4 -0.28 (0.25) - - 0.27+ (0.15) 0.08SDUFreeBeds<=3 -0.35+ (0.20) -0.05 -48% 0.32∗∗ (0.12) 0.01SDUFreeBeds<=2 -0.24 (0.20) - - 0.25∗ (0.12) 0.05SDUFreeBeds<=1 -0.02 (0.27) - - 0.11 (0.16) 0.49
HospReadm1w
SDUFreeBeds<=4 -0.49∗ (0.25) -0.07 -62% 0.24 (0.15) 0.12SDUFreeBeds<=3 -0.27 (0.25) - - 0.10 (0.15) 0.49SDUFreeBeds<=2 -0.22 (0.23) - - 0.07 (0.13) 0.60SDUFreeBeds<=1 -0.34 (0.31) - - 0.15 (0.18) 0.43
HospReadm2w
SDUFreeBeds<=4 -0.26 (0.22) - - 0.10 (0.13) 0.46SDUFreeBeds<=3 -0.32 (0.22) - - 0.14 (0.13) 0.30SDUFreeBeds<=2 -0.43∗ (0.21) -0.08 -52% 0.21+ (0.12) 0.09SDUFreeBeds<=1 -0.79∗∗∗ (0.21) -0.15 -74% 0.43∗∗∗ (0.13) 0.00)
HospReadm3w
SDUFreeBeds<=4 -0.22 (0.20) - - 0.11 (0.12) 0.35SDUFreeBeds<=3 -0.18 (0.20) - - 0.09 (0.12) 0.45SDUFreeBeds<=2 -0.39∗ (0.19) -0.09 -45% 0.22+ (0.11) 0.06SDUFreeBeds<=1 -0.70∗∗∗ (0.20) -0.16 -66% 0.41∗∗∗ (0.12) 0.00
HospReadm30d
SDUFreeBeds<=4 -0.18 (0.20) - - 0.08 (0.12) 0.49SDUFreeBeds<=3 -0.20 (0.21) - - 0.09 (0.12) 0.45SDUFreeBeds<=2 -0.44∗ (0.20) -0.11 -47% 0.24+ (0.12) 0.05SDUFreeBeds<=1 -0.71∗∗∗ (0.23) -0.18 -64% 0.41∗∗ (0.14) 0.01Note.Standard error in parentheses.+(p < 10%),∗ (p < 5%),∗∗ (p < 1%),∗∗∗ (p < 0.1%).AME - Average Marginal Effect; ARC - Average Relative Change.

35
Table 20 ED Cohort Robustness Test on Patient Outcomes: Bina ry SDUBusy Based on Number of
Available Beds. High Severity Patients.
SDUBusy= 1 Estimate (SE) AME ARC ρ (SE) Testρ= 0Mortality
SDUFreeBeds<= 4 0.45 (0.40) - - -0.30 (0.22) 0.19SDUFreeBeds<= 3 0.62+ (0.34) 0.17 86% -0.40+ (0.19) 0.06SDUFreeBeds<= 2 0.75∗ (0.33) 0.21 92% -0.48∗ (0.18) 0.03SDUFreeBeds<= 1 0.61 (0.41) - - -0.39 (0.23) 0.12
log(HospRemLOS)
SDUFreeBeds<= 4 0.48∗∗∗ (0.12) 0.48 31% -0.58∗∗∗ (0.07) 0.00SDUFreeBeds<= 3 0.49∗∗∗ (0.11) 0.49 32% -0.59∗∗∗ (0.06) 0.00SDUFreeBeds<= 2 0.45∗∗∗ (0.12) 0.45 28% -0.57∗∗∗ (0.07) 0.00SDUFreeBeds<= 1 0.48∗∗∗ (0.12) 0.48 31% -0.58∗∗∗ (0.07) 0.00
HospReadm1w
SDUFreeBeds<= 4 0.99 (1.12) - - -0.62 (0.58) 0.44SDUFreeBeds<= 3 0.32 (1.23) - - -0.25 (0.72) 0.74SDUFreeBeds<= 2 1.27∗ (0.59) 0.32 390% -0.77 (0.26) 0.11SDUFreeBeds<= 1 1.11 (0.81) - - -0.68 (0.40) 0.26
HospReadm2w
SDUFreeBeds<= 4 1.01 (0.95) - - -0.64 (0.51) 0.38SDUFreeBeds<= 3 1.02 (1.08) - - -0.45 (0.62) 0.53SDUFreeBeds<= 2 1.27∗∗ (0.40) 0.38 294% -0.78∗ (0.20) 0.04SDUFreeBeds<= 1 1.19∗ (0.57) 0.35 283% -0.74+ (0.29) 0.09
HospReadm30d
SDUFreeBeds<= 4 0.51 (0.77) - - -0.38 (0.45) 0.44SDUFreeBeds<= 3 0.42 (0.70) - - -0.33 (0.41) 0.46SDUFreeBeds<= 2 0.97∗∗ (0.31) 0.31 279% -0.65∗∗ (0.17) 0.01SDUFreeBeds<= 1 0.94∗∗ (0.37) 0.30 163% -0.63∗ (0.20) 0.03Note.Standard error in parentheses.+(p < 10%),∗ (p < 5%),∗∗ (p < 1%),∗∗∗ (p < 0.1%).AME - Average Marginal Effect; ARC - Average Relative Change.

36
Table 21 ED Cohort Robustness Test on Patient Outcomes: Bina ry SDUBusy Based on Number of
Available Beds. Low Severity Patients.
SDUBusy= 1 Estimate (SE) AME ARC ρ (SE) Testρ= 0Mortality
SDUFreeBeds<=4 -0.66∗ (0.34) -0.02 -85% 0.40 (0.21) 0.09SDUFreeBeds<=3 -0.59∗ (0.27) -0.02 -80% 0.35∗ (0.16) 0.05SDUFreeBeds<=2 -0.54∗∗ (0.27) -0.02 -78% 0.33+ (0.17) 0.07SDUFreeBeds<=1 -0.21 (0.25) - - 0.12 (0.15) 0.41
log(HospRemLOS)
SDUFreeBeds<=4 -0.22∗∗∗ (0.04) -0.22 -22% 0.19∗∗∗ (0.03) 0.00SDUFreeBeds<=3 -0.21∗∗∗ (0.04) -0.21 -21% 0.18∗∗∗ (0.03) 0.00SDUFreeBeds<=2 -0.20∗∗∗ (0.04) -0.20 -20% 0.17∗∗∗ (0.03) 0.00SDUFreeBeds<=1 -0.22∗∗∗ (0.04) -0.22 -22% 0.19∗∗∗ (0.03) 0.00
HospReadm1w
SDUFreeBeds<=4 -0.01 (0.15) - - 0.00 (0.09) 0.99SDUFreeBeds<=3 -0.06 (0.14) - - 0.03 (0.08) 0.71SDUFreeBeds<=2 -0.03 (0.15) - - 0.02 (0.08) 0.78SDUFreeBeds<=1 -0.12 (0.17) - - 0.07 (0.10) 0.45
HospReadm2w
SDUFreeBeds<=4 -0.12 (0.13) - - 0.08 (0.07) 0.27SDUFreeBeds<=3 -0.11 (0.12) - - 0.07 (0.07) 0.29SDUFreeBeds<=2 -0.15 (0.12) - - 0.09 (0.07) 0.18SDUFreeBeds<=1 -0.21 (0.14) - - 0.13+ (0.08) 0.10
HospReadm30d
SDUFreeBeds<=4 -0.09 (0.11) - - 0.06 (0.06) 0.31SDUFreeBeds<=3 -0.07 (0.11) - - 0.06 (0.06) 0.35SDUFreeBeds<=2 -0.10 (0.11) - - 0.07 (0.06) 0.23SDUFreeBeds<=1 -0.14 (0.11) - - 0.09 (0.06) 0.15Note.Standard error in parentheses.+(p < 10%),∗ (p < 5%),∗∗ (p < 1%),∗∗∗ (p < 0.1%).AME - Average Marginal Effect; ARC - Average Relative Change.

37
Table 22 ICU Cohort Robustness Test on Patient Outcomes: Bin ary SDUBusy Based on Occupancy
Percentile
With IVSDUBusy= 1 Estimate (SE) AME ARC ρ (SE) Testρ= 0
Mortality
SDUOcc>= 80thpercentile -0.55∗ (0.27) -0.06 -70% 0.23 (0.17) 0.19SDUOcc>= 85thpercentile -0.72∗∗ (0.29) -0.08 -78% 0.33+ (0.18) 0.09SDUOcc>= 90thpercentile -0.72∗∗ (0.27) -0.08 -78% 0.33+ (0.17) 0.07SDUOcc>= 95thpercentile -0.81∗∗∗ (0.27) -0.09 -82% 0.39∗ (0.17) 0.04
log(HospRemLOS)
SDUOcc>= 80thpercentile -0.50∗∗∗ (0.08) -0.50 -43% 0.51∗∗∗ (0.04) 0.00SDUOcc>= 85thpercentile -0.47∗∗∗ (0.09) -0.47 -42% 0.50∗∗∗ (0.04) 0.00SDUOcc>= 90thpercentile -0.42∗∗∗ (0.09) -0.42 -39% 0.48∗∗∗ (0.05) 0.00SDUOcc>= 95thpercentile -0.42∗∗∗ (0.10) -0.42 -37% 0.47∗∗∗ (0.05) 0.00
ICUReadm2d
SDUOcc>= 80thpercentile -0.63∗∗∗ (0.20) -0.05 -75% 0.39∗∗∗ (0.11) 0.00SDUOcc>= 85thpercentile -0.55∗ (0.23) -0.05 -71% 0.34∗ (0.14) 0.02SDUOcc>= 90thpercentile -0.38 (0.30) - - 0.24 (0.18) 0.20SDUOcc>= 95thpercentile -0.54∗ (0.24) -0.05 -70% 0.33∗ (0.14) 0.03
ICUReadm3d
SDUOcc>= 80thpercentile -0.44 (0.27) - - 0.30+ (0.17) 0.09SDUOcc>= 85thpercentile -0.19 (0.32) - - 0.14 (0.20) 0.47SDUOcc>= 90thpercentile -0.05 (0.38) - - 0.06 (0.23) 0.80SDUOcc>= 95thpercentile -0.24 (0.33) - - 0.17 (0.20) 0.40
ICUReadm5d
SDUOcc>= 80thpercentile -0.54∗∗∗ (0.22) -0.07 -66% 0.38∗∗∗ (0.13) 0.01SDUOcc>= 85thpercentile -0.40 (0.26) - - 0.30+ (0.16) 0.08SDUOcc>= 90thpercentile -0.19 (0.32) - - 0.16 (0.19) 0.41SDUOcc>= 95thpercentile -0.36 (0.26) - - 0.27 (0.15) 0.10
ICUReadm
SDUOcc>= 80thpercentile -0.54∗∗∗ (0.18) -0.08 -64% 0.43∗∗∗ (0.11) 0.00SDUOcc>= 85thpercentile -0.49∗∗ (0.19) -0.07 -60% 0.40∗∗∗ (0.12) 0.00SDUOcc>= 90thpercentile -0.12 (0.26) - - 0.18 (0.16) 0.28SDUOcc>= 95thpercentile -0.29 (0.23) - - 0.27+ (0.14) 0.06
HospReadm1w
SDUOcc>= 80thpercentile -0.37 (0.23) - - 0.27+ (0.14) 0.06SDUOcc>= 85thpercentile -0.55∗∗ (0.22) -0.08 -65% 0.38∗∗ (0.13) 0.01SDUOcc>= 90thpercentile -0.06 (0.25) - - 0.08 (0.15) 0.58SDUOcc>= 95thpercentile -0.54∗ (0.23) -0.08 -65% 0.38∗∗ (0.14) 0.01
HospReadm2w
SDUOcc>= 80thpercentile -0.23 (0.23) - - 0.17 (0.14) 0.24SDUOcc>= 85thpercentile -0.37+ (0.23) -0.07 -47% 0.26+ (0.14) 0.00SDUOcc>= 90thpercentile -0.18 (0.22) - - 0.14 (0.14) 0.33SDUOcc>= 95thpercentile -0.71∗∗∗ (0.21) -0.14 -70% 0.47∗∗∗ (0.13) 0.00
HospReadm3w
SDUOcc>= 80thpercentile -0.14 (0.22) - - 0.12 (0.13) 0.37SDUOcc>= 85thpercentile -0.22 (0.22) - - 0.17 (0.13) 0.20SDUOcc>= 90thpercentile -0.20 (0.22) - - 0.16 (0.13) 0.25SDUOcc>= 95thpercentile -0.67∗∗∗ (0.20) -0.16 -65% 0.45∗∗∗ (0.12) 0.00
HospReadm30d
SDUOcc>= 80thpercentile -0.06 (0.23) - - 0.07 (0.14) 0.63SDUOcc>= 85thpercentile -0.08 (0.22) - - 0.08 (0.13) 0.53SDUOcc>= 90thpercentile -0.13 (0.24) - - 0.11 (0.14) 0.45SDUOcc>= 95thpercentile -0.69∗∗∗ (0.23) -0.18 -63% 0.45∗∗ (0.14) 0.01Note.Standard error in parentheses.+(p < 10%),∗ (p < 5%),∗∗ (p < 1%),∗∗∗ (p < 0.1%).AME - Average Marginal Effect; ARC - Average Relative Change.

38
Table 23 ED Cohort Robustness Test on Patient Outcomes: Bina ry SDUBusy Based on Occupancy
Percentile. High Severity Patients.
SDUBusy= 1 Estimate (SE) AME ARC ρ (SE) Testρ=0Mortality
SDUOcc>=80thpercentile 0.56+ (0.33) 0.15 84% -0.37+ (0.18) 0.07SDUOcc>=85thpercentile 0.61+ (0.36) 0.17 86% -0.40+ (0.20) 0.08SDUOcc>=90thpercentile 0.75∗ (0.33) 0.21 92% -0.47∗ (0.18) 0.03SDUOcc>=95thpercentile 0.64+ (0.37) 0.18 86% -0.41+ (0.20) 0.07
log(HospRemLOS)
SDUOcc>=80thpercentile 0.38∗ (0.15) 0.38 24% -0.53∗∗∗ (0.09) 0.00SDUOcc>=85thpercentile 0.41∗∗ (0.14) 0.41 26% -0.54∗∗∗ (0.08) 0.00SDUOcc>=90thpercentile 0.45∗∗∗ (0.13) 0.45 29% -0.56∗∗∗ (0.07) 0.00SDUOcc>=95thpercentile 0.44∗∗ (0.13) 0.44 28% -0.56∗∗∗ (0.07) 0.00
HospReadm1w
SDUOcc>=80thpercentile 0.93 (0.86) - - -0.60 (0.45) 0.33SDUOcc>=85thpercentile 0.92 (1.00) - - -0.59 (0.52) 0.40SDUOcc>=90thpercentile 1.10+ (0.68) 0.26 379% -0.68 (0.33) 0.18SDUOcc>=95thpercentile 1.01 (1.07) - - -0.63 (0.54) 0.41
HospReadm2w
SDUOcc>=80thpercentile 0.82 (0.72) - - -0.54 (0.40) 0.29SDUOcc>=85thpercentile 1.04 (0.77) - - -0.6 (0.41) 0.28SDUOcc>=90thpercentile 1.26∗∗ (0.42) 0.37 290% -0.77+ (0.23) 0.07SDUOcc>=95thpercentile 1.16+ (0.67) 0.34 280% -0.72 (0.35) 0.21
HospReadm30d
SDUOcc>=80thpercentile 0.54 (0.49) - - -0.41 (0.28) 0.20SDUOcc>=85thpercentile 0.77+ (0.42) 0.25 151% -0.54+ (0.24) 0.07SDUOcc>=90thpercentile 0.94∗∗ (0.34) 0.31 279% -0.64∗ (0.19) 0.02SDUOcc>=95thpercentile 0.86∗ (0.43) 0.28 164% -0.59+ (0.24) 0.07Note.Standard error in parentheses.+(p < 10%),∗ (p < 5%),∗∗ (p < 1%),∗∗∗ (p < 0.1%).AME - Average Marginal Effect; ARC - Average Relative Change.

39
Table 24 ED Cohort Robustness Test on Patient Outcomes: Bina ry SDUBusy Based on Occupancy
Percentile. Low Severity Patients.
SDUBusy= 1 Estimate (SE) AME ARC ρ (SE) Testρ= 0Mortality
SDUOcc>= 80thpercentile -0.67∗ (0.30) -0.02 -85% 0.41 (0.19) 0.06SDUOcc>= 85thpercentile -0.84∗∗ (0.25) -0.03 -89% 0.51∗∗ (0.16) 0.01SDUOcc>= 90thpercentile -0.93∗∗ (0.21) -0.03 -90% 0.57∗∗ (0.13) 0.01SDUOcc>= 95thpercentile -0.42 (0.29) - - 0.25 (0.18) 0.17
log(HospRemLOS)
SDUOcc>= 80thpercentile -0.22∗∗∗ (0.04) -0.22 -22% 0.19∗∗∗ (0.03) 0.00SDUOcc>= 85thpercentile -0.22∗∗∗ (0.04) -0.22 -22% 0.19∗∗∗ (0.03) 0.00SDUOcc>= 90thpercentile -0.22∗∗∗ (0.04) -0.22 -22% 0.20∗∗∗ (0.03) 0.00SDUOcc>= 95thpercentile -0.22∗∗∗ (0.04) -0.22 -22% 0.20∗∗∗ (0.03) 0.00
HospReadm1w
SDUOcc>= 80thpercentile -0.01 (0.15) - - 0.02 (0.08) 0.77SDUOcc>= 85thpercentile -0.02 (0.15) - - 0.01 (0.09) 0.87SDUOcc>= 90thpercentile -0.01 (0.15) - - 0.01 (0.09) 0.91SDUOcc>= 95thpercentile -0.10 (0.17) - - 0.06 (0.09) 0.51
HospReadm2w
SDUOcc>= 80thpercentile -0.10 (0.12) - - 0.07 (0.07) 0.34SDUOcc>= 85thpercentile -0.13 (0.13) - - 0.08 (0.07) 0.26SDUOcc>= 90thpercentile -0.09 (0.11) - - 0.07 (0.06) 0.27SDUOcc>= 95thpercentile -0.20 (0.13) - - 0.13+ (0.08) 0.10
HospReadm30d
SDUOcc>= 80thpercentile -0.05 (0.11) - - 0.04 (0.06) 0.49SDUOcc>= 85thpercentile -0.07 (0.11) - - 0.05 (0.06) 0.39SDUOcc>= 90thpercentile -0.10 (0.11) - - 0.07 (0.06) 0.23SDUOcc>= 95thpercentile -0.14 (0.11) - - 0.10 (0.06) 0.13Note.Standard error in parentheses.+(p < 10%),∗ (p < 5%),∗∗ (p < 1%),∗∗∗ (p < 0.1%).AME - Average Marginal Effect; ARC - Average Relative Change.

40
Table 25 ICU Cohort Robustness Test on Patient Outcomes: Con tinuous SDUBusy Modeled as a Spline
Variable
With IVSDUOcc. as piece-wise linear splineEstimate (SE) AME ARC ρ(SE) Testρ=0
Mortality
With knot at80th pct -0.79∗∗∗ (0.25) -0.08 -81% 0.38∗ (0.16) 0.03With knot at85th pct -0.79∗∗∗ (0.25) -0.08 -81% 0.38∗ (0.16) 0.03With knot at90th pct -0.77∗∗∗ (0.25) -0.08 -81% 0.37∗ (0.16) 0.04With knot at95th pct -0.83∗∗∗ (0.26) -0.09 -83% 0.40∗ (0.16) 0.03
log(HospRemLOS)
With knot at80th pct -0.44∗∗∗ (0.09) -0.44 -44% 0.49∗∗∗ (0.04) 0.00With knot at85th pct -0.42∗∗∗ (0.09) -0.42 -42% 0.48∗∗∗ (0.05) 0.00With knot at90th pct -0.40∗∗∗ (0.10) -0.40 -38% 0.46∗∗∗ (0.05) 0.00With knot at95th pct -0.35∗∗∗ (0.11) -0.35 -34% 0.43∗∗∗ (0.06) 0.00
ICUReadm2d
With knot at80th pct -0.43+ (0.24) -0.04 -61% 0.26+ (0.15) 0.09With knot at85th pct -0.40 (0.26) - - 0.25 (0.16) 0.14With knot at90th pct -0.42 (0.26) - - 0.26 (0.16) 0.11With knot at95th pct -0.50∗ (0.24) -0.04 -67% 0.31∗ (0.15) 0.05
ICUReadm3d
With knot at80th pct -0.06 (0.31) - - 0.06 (0.19) 0.74With knot at85th pct -0.02 (0.33) - - 0.04 (0.20) 0.85With knot at90th pct -0.05 (0.34) - - 0.06 (0.20) 0.78With knot at95th pct -0.12 (0.34) - - 0.10 (0.20) 0.62
ICUReadm5d
With knot at80th pct -0.23 (0.27) - - 0.19 (0.16) 0.25With knot at85th pct -0.18 (0.28) - - 0.16 (0.17) 0.35With knot at90th pct -0.20 (0.28) - - 0.17 (0.17) 0.33With knot at95th pct -0.31 (0.26) - - 0.24 (0.15) 0.14
ICUReadm
With knot at80th pct -0.24 (0.21) - - 0.25+ (0.13) 0.07With knot at85th pct -0.15 (0.23) - - 0.19 (0.14) 0.18With knot at90th pct -0.07 (0.25) - - 0.14 (0.15) 0.34With knot at95th pct -0.12 (0.25) - - 0.17 (0.15) 0.26
HospReadm1w
With knot at80th pct -0.37+ (0.22) -0.05 -51% 0.27+ (0.14) 0.05With knot at85th pct -0.33 (0.23) - - 0.25+ (0.14) 0.09With knot at90th pct -0.29 (0.25) - - 0.23 (0.15) 0.14With knot at95th pct -0.45+ (0.23) -0.06 -58% 0.33∗ (0.14) 0.03
HospReadm2w
With knot at80th pct -0.38+ (0.21) -0.07 -47% 0.26+ (0.13) 0.06With knot at85th pct -0.39+ (0.21) -0.08 -49% 0.27+ (0.13) 0.05With knot at90th pct -0.42+ (0.23) -0.08 -51% 0.29+ (0.14) 0.05With knot at95th pct -0.63∗∗∗ (0.21) -0.12 -65% 0.42∗∗∗ (0.13) 0.00
HospReadm3w
With knot at80th pct -0.30 (0.20) - - 0.22+ (0.12) 0.09With knot at85th pct -0.34+ (0.21) -0.08 -41% 0.25+ (0.12) 0.06With knot at90th pct -0.40+ (0.21) -0.09 -46% 0.28∗ (0.13) 0.04With knot at95th pct -0.55∗∗ (0.20) -0.13 -57% 0.37∗∗ (0.12) 0.01
HospReadm30d
With knot at80th pct -0.24 (0.22) - - 0.17 (0.13) 0.19With knot at85th pct -0.29 (0.22) - - 0.21 (0.13) 0.13With knot at90th pct -0.39+ (0.23) -0.10 -43% 0.27+ (0.14) 0.07With knot at95th pct -0.60∗∗ (0.22) -0.16 -58% 0.40∗∗ (0.14) 0.01
Note.Standard error in parentheses.+(p < 10%),∗ (p < 5%),∗∗ (p < 1%),∗∗∗ (p < 0.1%).AME - Average Marginal Effect; ARC - Average Relative Change.

41
Table 26 ED Cohort Robustness Test on Patient Outcomes: Cont inuous SDUBusy Modeled as a Spline
Variable. High Severity Patients.
SDUOcc. as piece-wise linear splineEstimate (SE) AME ARC ρ (SE) Testρ=0Mortality
With knot at80th pct 0.54 (0.38) - - -0.36 (0.21) 0.12With knot at85th pct 0.66 (0.39) - - -0.37 (0.22) 0.13With knot at90th pct 0.71∗ (0.32) 0.19 91% -0.46∗ (0.17) 0.04With knot at95th pct 0.71+ (0.36) 0.18 87% -0.47+ (0.21) 0.06
log(HospRemLOS)
With knot at80th pct 0.40∗∗ (0.14) 0.40 25% -0.54∗∗∗ (0.08) 0.00With knot at85th pct 0.42∗∗ (0.13) 0.42 27% -0.55∗∗∗ (0.08) 0.00With knot at90th pct 0.43∗∗∗ (0.13) 0.43 27% -0.55∗∗∗ (0.08) 0.00With knot at95th pct 0.46∗∗∗ (0.12) 0.46 30% -0.58∗∗∗ (0.07) 0.00
HospReadm1w
With knot at80th pct 0.93 (1.04) - - -0.60 (0.54) 0.41With knot at85th pct 1.03 (0.96) - - -0.65 (0.49) 0.36With knot at90th pct 1.20∗ (0.58) 0.26 377% -0.69 (0.25) 0.15With knot at95th pct 1.05 (0.95) - - -0.66 (0.48) 0.25
HospReadm2w
With knot at80th pct 1.11 (0.73) - - -0.70 (0.38) 0.25With knot at85th pct 1.25∗ (0.57) 0.37 289% -0.77 (0.28) 0.14With knot at90th pct 1.26∗ (0.56) 0.37 290% -0.78+ (0.23) 0.09With knot at95th pct 1.14 (0.76) - - -0.71 (0.40) 0.28
HospReadm30d
With knot at80th pct 0.77+ (0.47) 0.25 150% -0.54 (0.27) 0.11With knot at85th pct 0.87∗ (0.43) 0.25 151% -0.59+ (0.24) 0.06With knot at90th pct 0.87∗ (0.44) 0.28 222% -0.60+ (0.25) 0.07With knot at95th pct 0.70 (0.71) - - -0.50 (0.41) 0.31
Note.Standard error in parentheses.+(p < 10%),∗ (p < 5%),∗∗ (p < 1%),∗∗∗ (p < 0.1%).AME - Average Marginal Effect; ARC - Average Relative Change.

42
Table 27 ED Cohort Robustness Test on Patient Outcomes: Cont inuous SDUBusy Modeled as a Spline
Variable. Low Severity Patients.
SDUOcc. as piece-wise linear splineEstimate (SE) AME ARC ρ (SE) Testρ=0Mortality
With knot at80th pct -0.61∗ (0.26) -0.02 -82% 0.37∗ (0.16) 0.04With knot at85th pct -0.60∗∗ (0.26) -0.03 -89% 0.36∗ (0.16) 0.04With knot at90th pct -0.54∗ (0.27) -0.02 -78% 0.32+ (0.17) 0.07With knot at95th pct -0.24 (0.25) - - 0.14 (0.15) 0.33
log(HospRemLOS)
With knot at80th pct -0.21∗∗∗ (0.04) -0.21 -21% 0.18∗∗∗ (0.03) 0.00With knot at85th pct -0.21∗∗∗ (0.04) -0.21 -21% 0.19∗∗∗ (0.03) 0.00With knot at90th pct -0.21∗∗∗ (0.04) -0.21 -21% 0.19∗∗∗ (0.03) 0.00With knot at95th pct -0.22∗∗∗ (0.04) -0.22 -22% 0.19∗∗∗ (0.03) 0.00
HospReadm1w
With knot at80th pct -0.09 (0.16) - - 0.06 (0.09) 0.53With knot at85th pct -0.11 (0.16) - - 0.07 (0.09) 0.45With knot at90th pct -0.13 (0.17) - - 0.08 (0.10) 0.41With knot at95th pct -0.14 (0.17) - - 0.09 (0.10) 0.38
HospReadm2w
With knot at80th pct -0.16 (0.12) - - 0.12 (0.17) 0.15With knot at85th pct -0.19 (0.13) - - 0.12 (0.07) 0.11With knot at90th pct -0.21 (0.13) - - 0.13+ (0.07) 0.08With knot at95th pct -0.22 (0.13) - - 0.14+ (0.08) 0.08
HospReadm30d
With knot at80th pct -0.06 (0.10) - - 0.05 (0.06) 0.38With knot at85th pct -0.10 (0.11) - - 0.07 (0.06) 0.24With knot at90th pct -0.11 (0.11) - - 0.08 (0.06) 0.18With knot at95th pct -0.15 (0.11) - - 0.10 (0.06) 0.12
Note.Standard error in parentheses.+(p < 10%),∗ (p < 5%),∗∗ (p < 1%),∗∗∗ (p < 0.1%).AME - Average Marginal Effect; ARC - Average Relative Change.

43
Table 28 ED Cohort Robustness Test on Patient Outcomes: Bina ry ICUBusy Based on Number of
Available Beds. High Severity Patients.
ICUBusy= 1 Estimate (SE) AME ARC ρ (SE) Testρ=0Mortality
ICUFreeBeds<= 4 0.63+ (0.35) 0.18 84% -0.41+ (0.23) 0.06ICUFreeBeds<= 3 0.68∗ (0.32) 0.19 86% -0.44∗ (0.18) 0.03ICUFreeBeds<= 2 0.75∗ (0.33) 0.21 92% -0.48∗ (0.18) 0.03ICUFreeBeds<= 1 0.69∗ (0.34) 0.19 86% -0.44∗ (0.19) 0.04
log(HospRemLOS)
ICUFreeBeds<= 4 0.42∗∗∗ (0.13) 0.42 27% -0.55∗∗∗ (0.08) 0.00ICUFreeBeds<= 3 0.43∗∗∗ (0.13) 0.43 27% -0.55∗∗∗ (0.08) 0.00ICUFreeBeds<= 2 0.45∗∗∗ (0.12) 0.45 28% -0.57∗∗∗ (0.07) 0.00ICUFreeBeds<= 1 0.56∗ (0.24) 0.56 30% -0.46∗∗∗ (0.07) 0.00
HospReadm1w
ICUFreeBeds<= 4 1.19+ (1.68) 0.29 390% -0.73 (0.32) 0.18ICUFreeBeds<= 3 1.15 (0.73) - - -0.71 (0.35) 0.21ICUFreeBeds<= 2 1.27∗ (0.59) 0.32 390% -0.77 (0.26) 0.11ICUFreeBeds<= 1 1.19+ (0.62) 0.29 388% -0.73 (0.29) 0.14
HospReadm2w
ICUFreeBeds<= 4 1.35∗∗ (0.36) 0.41 297% -0.83∗ (0.17) 0.02ICUFreeBeds<= 3 1.28∗∗ (0.35) 0.38 293% -0.79∗ (0.17) 0.02ICUFreeBeds<= 2 1.27∗∗ (0.40) 0.38 294% -0.78∗ (0.20) 0.04ICUFreeBeds<= 1 1.18∗∗ (0.43) 0.35 283% -0.73∗ (0.22) 0.05
HospReadm30d
ICUFreeBeds<= 4 1.01∗∗ y(0.28) 0.33 281% -0.68∗∗ (0.15) 0.01ICUFreeBeds<= 3 0.98∗∗ (0.27) 0.32 277% -0.66∗∗ (0.15) 0.01ICUFreeBeds<= 2 0.97∗∗ (0.31) 0.31 279% -0.65∗∗ (0.17) 0.01ICUFreeBeds<= 1 0.90∗∗ (0.35) 0.29 270% -0.62∗ (0.19) 0.02Note.Standard error in parentheses.+(p < 10%),∗ (p < 5%),∗∗ (p < 1%),∗∗∗ (p < 0.1%).AME - Average Marginal Effect; ARC - Average Relative Change.

44
Table 29 ED Cohort Robustness Test on Patient Outcomes: Bina ry ICUBusy Based on Occupancy
Percentile. High Severity Patients.
ICUBusy= 1 Estimate (SE) AME ARC ρ (SE) Testρ=0Mortality
ICUOcc>= 80thpercentile 0.51 (0.37) - - -0.34 (0.21) 0.13ICUOcc>= 85thpercentile 0.56 (0.36) - - -0.37+ (0.20) 0.09ICUOcc>= 90thpercentile 0.58∗ (0.38) 0.17 90% -0.35+ (0.21) 0.09ICUOcc>= 95thpercentile 0.60+ (0.35) 0.17 86% -0.39+ (0.20) 0.08
log(HospRemLOS)
ICUOcc>= 80thpercentile 0.42∗∗ (0.13) 0.42 27% -0.55∗∗∗ (0.08) 0.00ICUOcc>= 85thpercentile 0.40∗∗ (0.14) 0.40 25% -0.54∗∗∗ (0.08) 0.00ICUOcc>= 90thpercentile 0.49∗∗ (0.13) 0.49 30% -0.54∗∗∗ (0.08) 0.00ICUOcc>= 95thpercentile 0.39∗∗∗ (0.15) 0.39 23% -0.56∗∗∗ (0.07) 0.00
HospReadm1w
ICUOcc>= 80thpercentile 1.09+ (0.65) 0.26 375% -0.69 (0.32) 0.16ICUOcc>= 85thpercentile 1.15∗ (0.52) 0.28 388% -0.71+ (0.25) 0.08ICUOcc>= 90thpercentile 1.14+ (0.63) 0.27 380% -0.71 (0.31) 0.15ICUOcc>= 95thpercentile 1.12+ (0.68) 0.27 383% -0.70 (0.33) 0.18
HospReadm2w
ICUOcc>= 80thpercentile 1.24∗∗ (0.41) 0.36 286% -0.77∗ (0.24) 0.04ICUOcc>= 85thpercentile 1.27∗∗ (0.31) 0.38 293% -0.79∗∗ (0.15) 0.01ICUOcc>= 90thpercentile 1.29∗∗∗ (0.37) 0.38 294% -0.80∗ (0.18) 0.03ICUOcc>= 95thpercentile 1.22∗∗ (0.41) 0.36 287% -0.76∗ (0.21) 0.04
HospReadm30d
ICUOcc>= 80thpercentile 1.05∗∗ (0.24) 0.34 287% -0.70∗∗ (0.13) 0.01ICUOcc>= 85thpercentile 1.01∗∗ (0.25) 0.33 285% -0.68∗∗ (0.14) 0.01ICUOcc>= 90thpercentile 0.97∗∗ (0.28) 0.32 280% -0.66∗∗ (0.15) 0.01ICUOcc>= 95thpercentile 0.94∗∗ (0.30) 0.31 279% -0.64∗∗ (0.16) 0.01Note.Standard error in parentheses.+(p < 10%),∗ (p < 5%),∗∗ (p < 1%),∗∗∗ (p < 0.1%).AME - Average Marginal Effect; ARC - Average Relative Change.

45
Table 30 ED Cohort Robustness Test on Patient Outcomes: Cont inuous ICUBusy Modeled as a Spline
Variable. High Severity Patients.
ICUBusy= 1 Estimate (SE) AME ARC ρ (SE) Testρ= 0Mortality
With knot at80th pct 0.60+ (0.34) 0.17 90% -0.39+ (0.19) 0.07With knot at85th pct 0.63+ (0.33) 0.18 90% -0.41∗ (0.18) 0.05With knot at90th pct 0.68∗ (0.32) 0.19 91% -0.44∗ (0.18) 0.03With knot at95th pct 0.72∗ (0.30) 0.20 91% -0.46∗ (0.17) 0.02
log(HospRemLOS)
With knot at80th pct 0.42∗∗ (0.13) 0.42 27% -0.55∗∗∗ (0.08) 0.00With knot at85th pct 0.42∗∗ (0.13) 0.42 27% -0.55∗∗∗ (0.08) 0.00With knot at90th pct 0.42∗∗ (0.13) 0.42 26% -0.54∗∗∗ (0.08) 0.00With knot at95th pct 0.43∗∗ (0.13) 0.43 27% -0.55∗∗∗ (0.07) 0.00
HospReadm1w
With knot at80th pct 1.18∗ (0.54) 0.29 388% -0.73+ (0.25) 0.09With knot at85th pct 1.22∗ (0.54) 0.28 388% -0.75+ (0.25) 0.08With knot at90th pct 1.24∗ (0.54) 0.27 380% -0.76+ (0.24) 0.08With knot at95th pct 1.29∗ (0.50) 0.32 392% -0.78+ (0.22) 0.07
HospReadm2w
With knot at80th pct 1.24∗∗ (0.36) 0.36 286% -0.77∗ (0.18) 0.02With knot at85th pct 1.26∗∗ (0.37) 0.38 293% -0.78∗ (0.18) 0.02With knot at90th pct 1.27∗∗ (0.37) 0.38 295% -0.79∗ (0.18) 0.03With knot at95th pct 1.27∗∗ (0.37) 0.38 294% -0.79∗ (0.18) 0.02
HospReadm30d
With knot at80th pct 0.98∗∗ (0.27) 0.32 279% -0.66∗∗ (0.15) 0.01With knot at85th pct 0.97∗∗ (0.28) 0.33 285% -0.65∗∗ (0.14) 0.01With knot at90th pct 0.98∗∗ (0.29) 0.32 280% -0.66∗∗ (0.15) 0.01With knot at95th pct 0.99∗∗∗ (0.28) 0.32 287% -0.67∗∗ (0.15) 0.01Note.Standard error in parentheses.+(p < 10%),∗ (p < 5%),∗∗ (p < 1%),∗∗∗ (p < 0.1%).AME - Average Marginal Effect; ARC - Average Relative Change.
Table 31 ED Cohort Estimation Results for Patient Outcomes w ith RecentAdmissionICUi Included as an
Additional Instrument. High Severity Patients
Outcome Estimate (SE) AME ARC ρ (SE) Testρ= 0Mortality 0.73∗ (0.33) 0.20 92.81% -0.49+ (0.29) 0.08
log(HospRemLOS) 0.46∗∗∗ (0.13) 0.46 29.55% -0.59∗∗∗ (0.08) 0.00HospReadm1w 1.16 (0.46) 0.38 353.41% -0.79∗ (0.20) 0.05HospReadm2w 1.21∗ (0.39) 0.34 240.98% -0.79+ (0.25) 0.09HospReadm30d 0.92∗ (0.30) 0.29 233.60% -0.65 (0.38) 0.13
Note.Standard error in parentheses.+(p < 10%),∗ (p < 5%),∗∗ (p < 1%),∗∗∗ (p < 0.1%).AME - Average Marginal Effect; ARC - Average Relative Change.