the impact of spectrally asynchronous delay on the intelligibility of conversational...
TRANSCRIPT
THE IMPACT OF SPECTRALLY ASYNCHRONOUS DELAY ON THE INTELLIGIBILITY OF CONVERSATIONAL SPEECH
by
Amanda Judith Ortmann
B.S. in Mathematics and Communications, Missouri Baptist University, 2001
M.S. in Speech and Hearing Science, Washington University, 2003
Submitted to the Graduate Faculty of
the School of Health and Rehabilitation Sciences in partial fulfillment
of the requirements for the degree of
Doctor of Philosophy
University of Pittsburgh
2012

ii
UNIVERSITY OF PITTSBURGH
School of Health and Rehabilitation Science
This dissertation was presented
by
Amanda J. Ortmann
It was defended on
April 13, 2012
and approved by
John Durrant, Ph.D., Department of Communication Science and Disorders
Sheila Pratt, Ph.D., Department of Communication Science and Disorders
Rosalie Uchanski, Ph. D., Washington University School of Medicine, Department of
Otolaryngology
Dissertation Advisor: Catherine Palmer, Ph.D., Department of Communication Science and
Disorders

iii
Conversationally spoken speech is rampant with rapidly changing and complex acoustic
cues that individuals are able to hear, process, and encode to meaning. For many hearing-
impaired listeners, a hearing aid is necessary to hear these spectral and temporal acoustic cues of
speech. For listeners with mild-moderate high frequency sensorineural hearing loss, open-fit
digital signal processing (DSP) hearing aids are the most common amplification option. Open-fit
DSP hearing aids introduce a spectrally asynchronous delay to the acoustic signal by allowing
audible low frequency information to pass to the eardrum unimpeded while the aid delivers
amplified high frequency sounds to the eardrum that has a delayed onset relative to the natural
pathway of sound. These spectrally asynchronous delays may disrupt the natural acoustic pattern
of speech. The primary goal of this study is to measure the effect of spectrally asynchronous
delay on the intelligibility of conversational speech by normal-hearing and hearing-impaired
listeners.
A group of normal-hearing listeners (n = 25) and listeners with mild-moderate high
frequency sensorineural hearing loss (n = 25) participated in this study. The acoustic stimuli
included 200 conversationally-spoken recordings of the low predictability sentences from the
revised speech perception in noise test (r-SPIN). These 200 sentences were modified to control
for audibility for the hearing-impaired group and so that the acoustic energy above 2 kHz was
delayed by either 0 ms (control), 4ms, 8ms, or 32 ms relative to the low frequency energy. The
THE IMPACT OF SPECTRALLY ASYNCHRONOUS DELAY ON THE INTELLIGIBILITY OF CONVERSATIONAL SPEECH
Amanda J. Ortmann, PhD
University of Pittsburgh, 2012

iv
data were analyzed in order to find the effect of each of the four delay conditions on the
intelligibility of the final key word of each sentence.
Normal-hearing listeners were minimally affected by the asynchronous delay. However,
the hearing-impaired listeners were deleteriously affected by increasing amounts of spectrally
asynchronous delay. Although the hearing-impaired listeners performed well overall in their
perception of conversationally spoken speech in quiet, the intelligibility of conversationally
spoken sentences significantly decreased when the delay values were equal to or greater than 4
ms. Therefore, hearing aid manufacturers need to restrict the amount of delay introduced by DSP
so that it does not distort the acoustic patterns of conversational speech.

v
TABLE OF CONTENTS
PREFACE ............................................................................................................................... XVII
1.0 INTRODUCTION & SUMMARY ..................................................................................... 1
2.0 BACKGROUND .................................................................................................................. 6
2.1 SPEECH PERCEPTION BY NORMALLY-HEARING LISTENERS ................. 6
Acoustic Cues .................................................................................................... 6 2.1.1
Spectral Cues .................................................................................................... 8 2.1.2
Intensity Cues ................................................................................................. 10 2.1.3
Temporal Cues ............................................................................................... 10 2.1.4
Spectro-Intensity Cues ................................................................................... 11 2.1.5
Tempo-Intensity Cues .................................................................................... 12 2.1.6
Spectro-Temporal Cues ................................................................................. 13 2.1.7
Coarticulation ................................................................................................. 19 2.1.8
Theories of Speech Perception ...................................................................... 22 2.1.9
2.1.9.1 Articulation Based Theories .............................................................. 22
2.1.9.2 Auditory Based Theories of Speech Perception ............................... 26
Neurophysiology of Speech Perception ...................................................... 29 2.1.10
2.2 SPEECH PERCEPTION BY LISTENERS WITH MILD-MODERATE
SENSORINEURAL HEARING LOSS ............................................................................ 32

vi
Spectral Cues .................................................................................................. 33 2.2.1
Intensity Cues ................................................................................................. 34 2.2.2
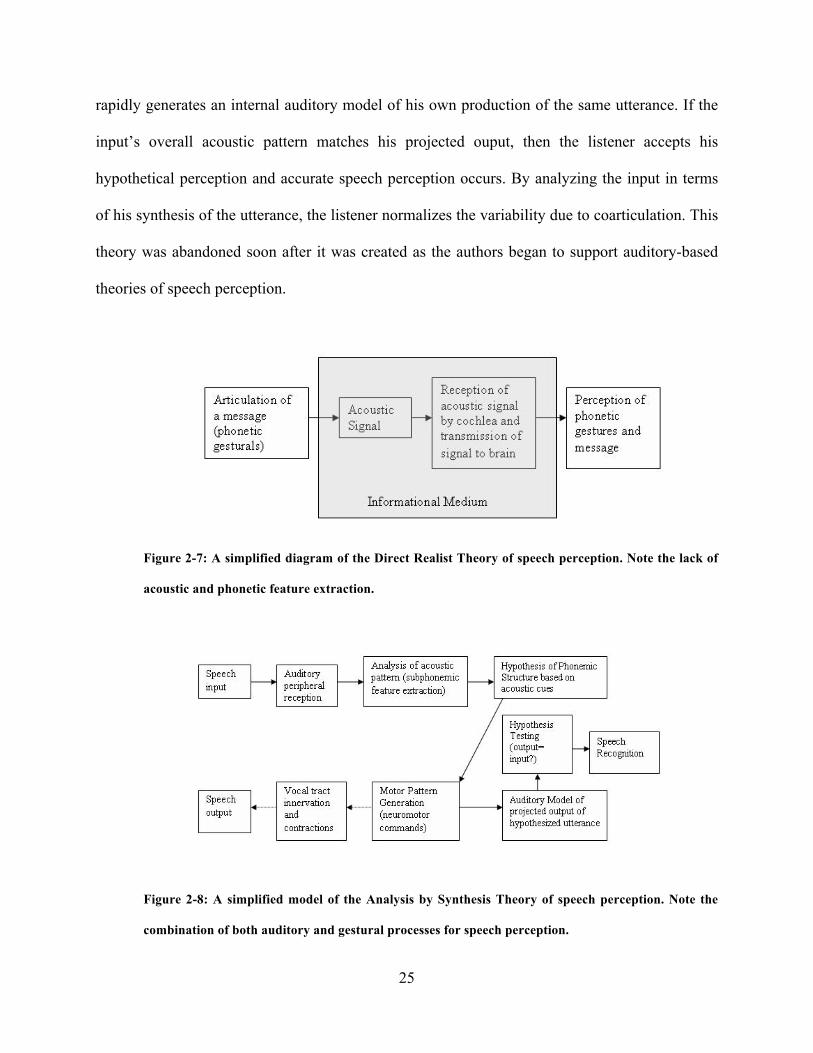
Temporal Cues ............................................................................................... 35 2.2.3
Spectro-Intensity Cues ................................................................................... 35 2.2.4
Tempo-Intensity Cues .................................................................................... 36 2.2.5
Spectro-Temporal Cues ................................................................................. 37 2.2.6
Hearing-Impaired Perceptual Performance and Models of Speech 2.2.7
Perception ................................................................................................................... 40
2.3 ACOUSTICS OF CONVERSATIONAL SPEECH ............................................... 41
Differences in Static Cues Between Conversational and Clear Speech .... 42 2.3.1
2.3.1.1 Spectral and Intensity Cues ............................................................... 42
2.3.1.2 Temporal Cues .................................................................................... 42
Differences in Dynamic Cues Between Conversational and Clear Speech 45 2.3.2
2.3.2.1 Spectro-Intensity Cues ....................................................................... 45
2.3.2.2 Tempo-Intensity Cues ........................................................................ 46
2.3.2.3 Spectro-Temporal Cues ...................................................................... 47
2.4 DIGITAL SIGNAL PROCESSING AND THE SPEECH SPECTRUM ............. 49
Consequences of Acoustic Delay—A brief review of the literature ........... 55 2.4.1
Summary and Empirical Question ............................................................... 60 2.4.2
3.0 METHODS ......................................................................................................................... 62
3.1 PRE-EXPERIMENT ................................................................................................. 62
Speech materials ............................................................................................. 62 3.1.1
Conversational recordings ............................................................................. 64 3.1.2

vii
Analysis of Conversational Speech ............................................................... 66 3.1.3
Subjects ........................................................................................................... 67 3.1.4
Procedure ........................................................................................................ 68 3.1.5
Data Analysis .................................................................................................. 70 3.1.6
3.2 MAIN-EXPERIMENT .............................................................................................. 70
Stimuli ............................................................................................................. 70 3.2.1
Simulated spectrally asynchronous delay .................................................... 71 3.2.2
Subjects ........................................................................................................... 79 3.2.3
Procedure ........................................................................................................ 83 3.2.4
Data Analysis .................................................................................................. 87 3.2.5
4.0 RESULTS ........................................................................................................................... 88
4.1 PRE-EXPERIMENT: CLEAR-SPEECH VS. CONVERSATIONALLY
SPOKEN SPEECH ............................................................................................................. 88
4.2 PRE-EXPERIMENT: INTELLIGIBILITY OF CONVERSATIONAL R-SPIN
RECORDINGS ................................................................................................................... 92
4.3 MAIN EXPERIMENT: EFFECT OF PRESENTATION ORDER ..................... 92
4.4 MAIN EXPERIMENT: EFFECT OF ASYNCHRONOUS DELAY FOR
NORMAL-HEARING LISTENERS ................................................................................ 94
4.5 MAIN EXPERIMENT: EFFECT OF ASYNCHRONOUS DELAY FOR
HEARING-IMPAIRED LISTENERS .............................................................................. 96
5.0 DISCUSSION ..................................................................................................................... 98
5.1 NORMAL-HEARING LISTENERS PERCEPTION OF SPECTRALLY
ASYNCHRONOUS DELAYS ........................................................................................... 99

viii
5.2 HEARING-IMPAIRED LISTENERS PERCEPTION OF SPECTRALLY
ASYNCHRONOUS DELAYS ......................................................................................... 100
APPENDIX A ............................................................................................................................ 102
APPENDIX B ............................................................................................................................ 106
APPENDIX C ............................................................................................................................ 107
APPENDIX D ............................................................................................................................ 108
APPENDIX E ............................................................................................................................ 111
BIBLIOGRAPHY ..................................................................................................................... 112

ix
LIST OF TABLES
Table 2-1: Acoustic Cue Matrix ..................................................................................................... 7
Table 2-2: Review of research regarding the impact of auditory delay ........................................ 57
Table 3-1: Gain and delay values for each of the 200 r-SPIN Low Predictability Sentences ...... 72
Table 3-2: Power analysis for Main Experiment .......................................................................... 79
Table 3-3: Comparison between the bandwidths of open-fit hearing aids (receiver in the hearing
aid and receiver in the canal) as reported by its manufacturer and as measured by an independent
lab at the University of Pittsburgh ................................................................................................ 82
Table 3-4: ANSI S3.6 (1996) RETSPL for ER-3A earphone ....................................................... 84
Table 3-5: An example the calculation of a participant’s hearing threshold in dB SPL .............. 85
Table 4-1: Acoustic differences between Clear, Conversational (same male speaker) and Original
recordings (different male speaker) of the R-SPIN LP sentences (Bilger et al., 1984). ............... 88
Table 4-2: Analysis of the severity of the error for the research outcome ................................... 95
Table 5-1: Main experiment normal-hearing listeners’ demographics (age and hearing
thresholds) ................................................................................................................................... 109
Table 5-2: Main experiment hearing-impaired listeners’ demographics (age and hearing
thresholds) ................................................................................................................................... 110
x
Table 5-3: individual data for hearing-impaired listeners percent correct key word identification
as a function of asynchronous delay ........................................................................................... 111

xi
LIST OF FIGURES
Figure 2-1: Spectrogram of the CV syllable /da/. Frequency is represented on the y axis, while
time is represented on the x-axis. Intensity is shown by the darkness of the bars within the
spectrogram. .................................................................................................................................... 8
Figure 2-2: The values and relative pattern of F1 (lower bars) and F2 (higher bars) for each of the
labeled vowels (from Delattre et. al., 1952). ................................................................................... 9
Figure 2-3: The second formant transitions for /b/, /d/, and /g/ and the each of the labeled vowels
(from Delattre et. al., 1955). ......................................................................................................... 14
Figure 2-4(a-c): Normal-hearing listeners’ identification and discrimination data for the EOA
continuums, a) /pa/ b) /ta/ and c) /ka/. For each of the graphs, the x-axis displays the 10 tokens
representing the shift in EOA from a more negative value to a more positive value. The space in
between each token value represents the adjacent token pairs (i.e., token 1 paired with token 2,
token 2 paired with token 3, and so on). The values along the y-axis are in percent. The line
graph represents the data from the labeling task, so higher on the y-axis means that the listeners’
perception is voiced, while lower values represent a more voiceless percept. The bar graph
displays the discrimination data, so higher y-axis values mean that a greater difference between
the token pair was detected. .......................................................................................................... 18
xii
Figure 2-5(a-d): Schematic spectrogram taken from Lotto & Kluender (1998) showing the
coarticulatory effects of preceding /al/ on /da/ and /ga/ and /ar/ on /da/ and /ga/. Note the
similarities in formant transitions of /ga/ and /da/ in (B) and (C). Also notice the spectral contrast
between the third formant of the preceding consonants /l/ and /r/ and the following consonants
/d/ and /g/. In (A) and (B), there is more contrast or disparity between F3 in /alga/ than /alda/. In
(C) and (D), note the spectral contrast in /arda/ that is not present in /arga/. ............................... 21
Figure 2-6: A simplified diagram of the Motor Theory of speech perception. Note the use of
neuromotor commands for speech production. ............................................................................. 23
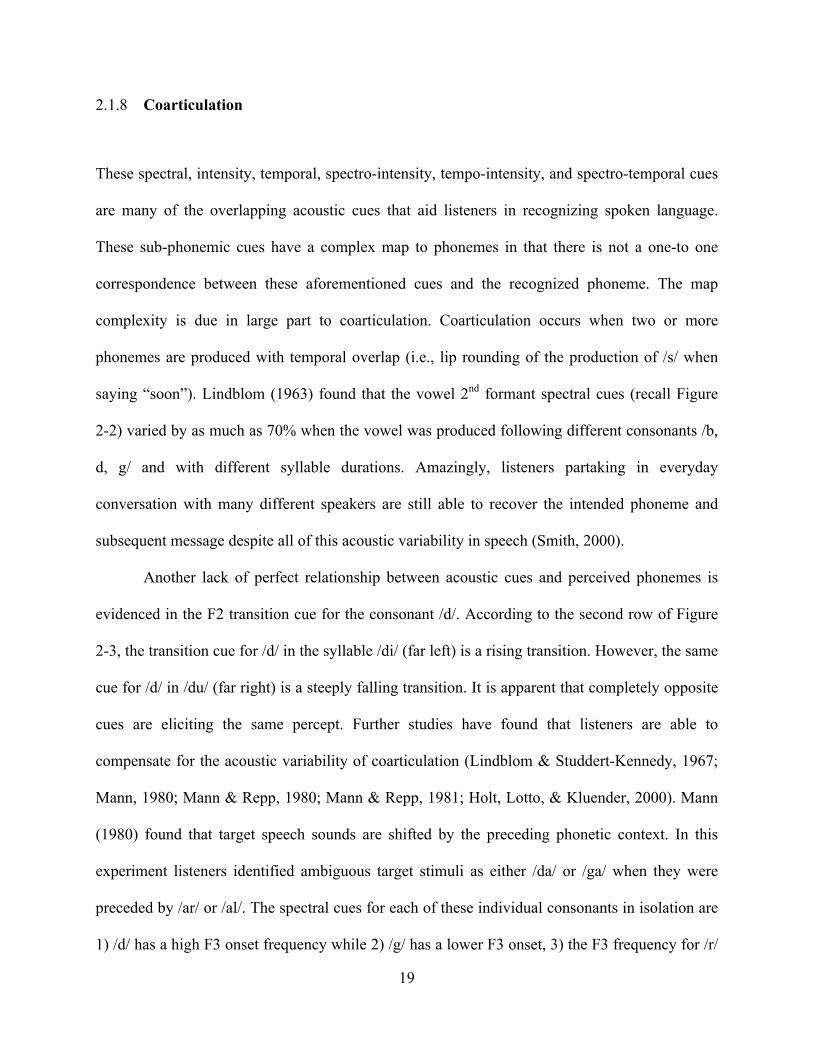
Figure 2-7: A simplified diagram of the Direct Realist Theory of speech perception. Note the
lack of acoustic and phonetic feature extraction. .......................................................................... 25
Figure 2-8: A simplified model of the Analysis by Synthesis Theory of speech perception. Note
the combination of both auditory and gestural processes for speech perception. ......................... 25
Figure 2-9: A simplified model of a General Approach to speech perception. Boxes above the
stages in the model indicate cues that can shift the perception of speech. ................................... 28
Figure 2-10 (a-c): Hearing-impaired listeners’ identification and discrimination data for the EOA
continuums, a) /pa/ b) /ta/ and c) /ka/. For each of the graphs, the x-axis displays the 10 tokens
representing the shift in EOA from a more negative value to a more positive value. The space in
between each token value represents the adjacent token pairs (i.e., token 1 paired with token 2,
token 2 paired with token 3, and so on). The values along the y-axis are in percent. The line
graph represents the data from the labeling task, so higher on the y-axis means that the listeners’
perception is voiced, while lower values represent a more voiceless percept. The bar graph
displays the discrimination data, so higher y-axis values mean that a greater difference between
the token pair was detected. .......................................................................................................... 39

xiii
Figure 2-11: Measured delay values for a) Siemens Triano BTE b) Widex Diva BTE c) Phonak
Claro BTE and d) Resound Canta BTE. The x-axis displays frequency in Hz and the y-axis
displays delay values in ms. .......................................................................................................... 52
Figure 2-12: The real-ear measurements showing the delay as a function of frequency with a
closed- fit and an open-fit earmold attached to the same hearing aid. The x-axis displays
frequency and the y-axis displays the delay values of the hearing device. For the open-fit
earmold the high frequencies were delayed by the DSP hearing aid, causing a spectrally
asynchronous delay. ...................................................................................................................... 55
Figure 3-1: Diagram of the acoustic modifications to each of the sentence stimuli. The + 18 dB
gain and delay pathway represents the DSP hearing aid pathway. ............................................... 71
Figure 3-2: A series of spectrograms depicting the generation of the final stimuli for the
conversationally spoken sentence, “Mr. Smith thinks about the CAP”. a) The original
conversational recording b) the original recording with a LP FIR filter at 2 kHz applied c) the
original recording with a HP FIR filter at 2 kHz applied d) the same sound file as (c) only with a
32 ms onset delay and a 18 dB gain applied, representing the hearing aid pathway of sound and
d) the final sound file that served as the stimuli which is the combination of (b + c + d),
representing the sound arriving at the ear drum with the combination of the natural pathway and
the hearing aid pathway. Note the reduction of temporal gaps between syllables in (e). ............. 73
Figure 3-3: A series of spectrograms depicting the generation of the final stimuli for the
conversationally spoken sentence, “I can’t consider the PLEA”. a) The original conversational
recording b) the original recording with a LP FIR filter at 2 kHz applied c) the original recording
with a HP FIR filter at 2 kHz applied d) the same sound file as (c) only with a 32 ms onset delay
and a 18 dB gain applied, representing the hearing aid pathway of sound and d) the final sound

xiv
file that served as the stimuli which is the combination of (b + c + d), representing the sound
arriving at the ear drum with the combination of the natural pathway and the hearing aid
pathway. Note the blurring of the formant transitions of “PLEA” in (e). .................................... 74
Figure 3-4: A series of spectrograms depicting the generation of the final stimuli for the
conversationally spoken sentence, “We’re speaking about the TOLL”. a) The original
conversational recording b) the original recording with a LP FIR filter at 2 kHz applied c) the
original recording with a HP FIR filter at 2 kHz applied d) the same sound file as (c) only with a
32 ms onset delay and a 18 dB gain applied, representing the hearing aid pathway of sound and
d) the final sound file that served as the stimuli which is the combination of (b + c + d),
representing the sound arriving at the ear drum with the combination of the natural pathway and
the hearing aid pathway. Note the shorter VOT of “TOLL” in (e). The VOT in (a) is 20 ms while
the VOT in (e) is -12 ms. .............................................................................................................. 75
Figure 3-5: A series of spectrograms depicting the generation of the final stimuli for the
conversationally spoken sentence, “We’re speaking about the TOLL”. a) The original
conversational recording b) the original recording with a LP FIR filter at 2 kHz applied c) the
original recording with a HP FIR filter at 2 kHz applied d) the same sound file as (c) only with a
8 ms onset delay and a 18 dB gain applied, representing the hearing aid pathway of sound and d)
the final sound file that served as the stimuli which is the combination of (b + c + d),
representing the sound arriving at the ear drum with the combination of the natural pathway and
the hearing aid pathway. Note the shorter VOT of “TOLL” in (e). The VOT in (a) is 20 ms while
the VOT in (e) is 12 ms ................................................................................................................. 76
Figure 3-6: A series of spectrograms depicting the generation of the final stimuli for the
conversationally spoken sentence, “Paul hopes she called about the TANKS”. a) The original
xv
conversational recording b) the original recording with a LP FIR filter at 2 kHz applied c) the
original recording with a HP FIR filter at 2 kHz applied d) the same sound file as (c) only with a
8 ms onset delay and a 18 dB gain applied, representing the hearing aid pathway of sound and d)
the final sound file that served as the stimuli which is the combination of (b + c + d),
representing the sound arriving at the ear drum with the combination of the natural pathway and
the hearing aid pathway. Note the shorter VOT of “TANKS” in (e). .......................................... 77
Figure 3-7: A series of spectrograms depicting the generation of the final stimuli for the
conversationally spoken sentence, “Jane was interested in the STAMP”. a) The original
conversational recording b) the original recording with a LP FIR filter at 2 kHz applied c) the
original recording with a HP FIR filter at 2 kHz applied d) the same sound file as (c) only with a
8 ms onset delay and a 18 dB gain applied, representing the hearing aid pathway of sound and d)
the final sound file that served as the stimuli which is the combination of (b + c + d),
representing the sound arriving at the ear drum with the combination of the natural pathway and
the hearing aid pathway. Note the shorter VOT and shorter gap between the /s/ and the /t/ of
“STAMP” in (e). ........................................................................................................................... 78
Figure 3-8: Average audiometric data of the 25 hearing-impaired participants ........................... 81
Figure 3-9: Measured Real Ear SPL Output in response to the “gain calibration filr” and NAL-R
target for 60 dB input for the (a) right ear and (b) left ear ............................................................ 86
Figure 4-1: Spectrogram demonstrating the difference in VOT of the word “tanks” between clear
(top; 62 ms) and conversational (bottom; 27 ms) speech. ............................................................ 89
Figure 4-2: Spectrogram demonstrating the intensity and durational differences in the release of
the final plosive /p/ of the word “sheep” between clear (top) and conversational speech (bottom).
....................................................................................................................................................... 90

xvi
Figure 4-3: Spectrogram demonstrating the intensity and durational differences in the release of
the final plosive /p/ of the word “sap” between clear (top) and conversational speech (bottom).
Notice the omission of the final plosive release. .......................................................................... 90
Figure 4-4: Spectrogram demonstrating the vowel duration difference of the word “sand”
between clear (top, 379 ms) and conversational speech (bottom, 200 ms) .................................. 91
Figure 4-5: Spectrogram demonstrating the difference in the formant transitions for the /r/ in
crown between clear (top) and conversational (bottom) speech ................................................... 91
Figure 4-6: The average percent correct key word identification of the 25 normal hearing
participants plotted as a function of presentation order (combined across all delay conditions).
Only the first presentation was significantly different from the other presentations at α < 0.05. 93
Figure 4-7: The average percent correct key word identification of the 25 hearing-impaired
participants plotted as a function of presentation order (combined across all delay conditions).
Only the difference between the first and last presentation was significantly different at α < 0.05.
....................................................................................................................................................... 94
Figure 4-8: The average percent key word identification by normal-hearing listeners as a
function of spectrally asynchronous delay. Only the difference between the 4 ms and the 32 ms
condition was found to be significant at α < 0.05. ........................................................................ 96
Figure 4-9: The effect of delay condition on key-word identification for hearing-impaired
listeners. All differences between conditions with the exception of the difference between 4 ms
and 8 ms were found to be significant at α < 0.05. ....................................................................... 97
Figure 5-1: Graphs depict the magnitude and phase response for the FIR high pass (top) and low
pass (bottom) filter used to create the delay conditions. ............................................................. 107

xvii
PREFACE
I would like to express my sincere gratitude to my family, friends, and my colleagues at both the
University of Pittsburgh and Washington University School of Medicine. All of you have played
a part in helping me get to where I am today. I couldn’t have done this without any of you. At
any point in time, one or more of you have all provided me with encouragement to help me face
my fears, inspiration to seek new questions and answers, motivation to be a better person, and
discipline to finish this dissertation. Thank you.

1
1.0 INTRODUCTION & SUMMARY
Speech perception is defined as the auditory perception of phonemic spectral and temporal
patterns, and the mapping of these acoustic properties to linguistic units. Although the perception
of speech seems to be an effortless task for individuals with normal hearing, it is no small feat.
The human auditory system is an extraordinary sensory network that is able to perceive sounds
ranging from 0 dB SPL to a sound pressure level that is 10 million times greater (140 dB SPL),
and frequencies ranging from 20 Hz to 20,000 Hz. This is an enormous range of acoustic inputs
received by the cochlea, the auditory sensory end organ measuring only 34-36 mm in length. In
addition to the broad range of sensitivity in the auditory system, humans also have the ability to
hear numerous sounds in their surrounding environment, whether it is the conversational chatter
from neighboring tables at a restaurant or the engine roar of a subway transportation system, and
still attend to the conversation at hand. In a matter of milliseconds, the auditory system is able to
detect the spectral and temporal properties of speech, despite a wide variety of adverse acoustic
environments, and translate these into a meaningful linguistic message.
The perceptual properties of the human auditory system are astoundingly fine-tuned in
three dimensions: intensity, frequency, and time. Normal-hearing listeners can discriminate
intensity differences of at least 0.5 to 1 dB, pure tone frequency differences of at least 3 Hz (can
be less than 1 Hz for complex tones), and temporal gaps of 2-3 ms (Gelfand, 1998). The acoustic
properties of speech are defined along the same three dimensions of intensity, frequency, and

2
time. Speech contains patterns or cues in each of these three areas, making it an acoustically
redundant signal. There have been numerous research studies exploring how normal-hearing
listeners use each of these cues in speech recognition. As more is understood about the complex
mapping of acoustic cues to phonemes and lexemes in the normal-functioning auditory system,
then researchers can qualify and quantify the distortions of the neural network in impaired
auditory systems.
For hearing-impaired listeners, the distortions of the neural map between acoustical
properties and lexemes begin peripherally with reduced access to the amplitude, spectral, and
temporal cues in the speech signal. Loss of audibility accounts for most but not all of the
deterioration in speech recognition performance for some listeners with hearing loss (Dubno,
Dirks, & Ellison, 1989; Hogan & Turner, 1998). In addition to loss of sensitivity, hearing-
impaired listeners have loss of frequency resolution (Moore & Glasberg, 1986). Restoration of
audibility can be achieved with amplification devices, but the cochlear spectral distortion is not
ameliorated. The goal of an auditory rehabilitation program using amplification is to restore
perceptual performance of hearing-impaired listeners to that of normal-hearing listeners by
enhancing the acoustic cues of the speech spectrum. Current hearing aid technology uses digital
signal processing (DSP) to apply gain, compression, and noise reduction algorithms to the
incoming acoustic signal. As a result of the frequency dependent amplitude compression as well
as the underlying DSP, the speech spectrum is spectrally and temporally distorted before it is
further distorted by the damaged cochlea.
DSP is the core of every amplification device on the market today. While DSP enables
the device to perform many complex algorithms on the incoming acoustic signal that purportedly
increase the speech recognition performance of hearing-impaired listeners, it introduces a delay

3
to the signal. The delay caused by DSP, or digital delay, is defined as the amount of time
necessary for an acoustic signal to pass through the microphone, DSP circuit, and the receiver of
the hearing assistive device. Spectrally asynchronous delays are delay values that vary as a
function of frequency bands within the speech spectrum, meaning that the arrival time at the ear
drum of one group of frequencies is delayed relative to another group of frequencies (e.g., low
frequencies are delayed more than the high frequencies). These delays disrupt the speech’s
spectral and temporal acoustic patterns that potentially serve as cues for phonemic recognition.
Currently, researchers have been asking the question of whether the spectral and temporal
distortions introduced by digital hearing aids and their processing schemes have a deleterious
effect on the speech perception abilities of hearing-impaired listeners. Before this question can
be addressed, a foundation must be laid. First, the literature on perceptual abilities of normal-
hearing listeners were explored not only to glean the various acoustical properties of speech that
serve as cues to speech perception, but also to gain insight into the various theories behind the
perception and translation of these acoustic cues into linguistic units. Secondly, the speech
perception abilities and the use of these acoustical cues by hearing-impaired listeners with mild-
moderate sensorineural hearing loss were summarized, and the deviations from normal
perceptual performance were quantified. As speech is spoken in a conversational manner outside
speech perception laboratories and is the target of amplification by hearing aids, a section was
devoted to the acoustic characteristics of conversational speech. Then, the spectro-temporal
distortions of the speech spectrum caused by the DSP implemented in modern hearing aids were
discussed. Lastly, the literature on the consequences of such distortions on the speech perception
of hearing-impaired listeners was reviewed.

4
The literature review led to the following empirical question: does the introduction of
spectrally asynchronous delay that is similar to the delay introduced by open-fit digital hearing
aids lead to poorer speech intelligibility of conversationally spoken speech by mild-moderate
hearing-impaired listeners? This question led to the construction of conversationally spoken
recordings of the revised Speech Perception in Noise (r-SPIN) test (Bilger, Neutzel, Rabinowitz,
& Rzeczkowski, 1984) low predictability sentences. These stimuli were chosen because they
forced the listener to rely on acoustic cues for speech perception rather than sentence context.
The new recordings of the r-SPIN sentences were found to carry all of the trademarks of
conversational speech such as faster articulation rate and shorter durations for both vowels and
and voice onset time of word-initial consonants, yet were highly intelligible to a group of 15
normal-hearing listeners.
Next, the conversational recordings of the r-SPIN sentences were modified so that the
stimuli represented what a hearing-impaired listener hears at the output of an open fit hearing
aid. Each sentence was filtered so that the onset of acoustic energy above 2 kHz was delayed
relative to the original onset of the sentence. This modified stimulus represented the combination
of the natural pathway of sound into the ear canal, and the delayed high frequency energy from
the output of the digital hearing aid. For hearing-impaired listeners, this delayed high frequency
information was amplified in accordance with the listeners hearing loss. A group of normal-
hearing and hearing-impaired listeners listened to and repeated the processed stimuli presented
randomly from four spectrally asynchronous delayed conditions: 0 ms delay (served as a control
condition), 4 ms, 8 ms, and 32 ms. The intelligibility of the final key-word of each sentence was
scored for each listener. The data were then averaged for each group and each delayed condition.
5
The group of normal-hearing listeners was minimally affected by the introduction of
spectrally asynchronous delay of energy above 2 kHz. In fact delays of 32 ms did not
significantly alter normal-hearing listeners’ intelligibility performance. Hearing-impaired
listeners were negatively affected by the introduction of spectrally asynchronous delays in that
their performance on the identification of the final key-word was significantly poorer with
introduction of a delay as short as 4 ms when compared to the control condition (0 ms delay).
However, this degradation in performance was very slight showing that hearing-impaired
listeners might be fairly tolerant of short spectrally asynchronous delays. However, hearing-
impaired listeners were not as tolerant of the 32 ms delay condition, showing that these listeners
may rely more heavily on the spectro-temporal cues for speech perception than the normal
hearing listeners who were not affected at all by the 32 ms condition. Therefore, hearing aid
manufacturers should be conscious of their devices signal processing speed.

6
2.0 BACKGROUND
2.1 SPEECH PERCEPTION BY NORMALLY-HEARING LISTENERS
Acoustic Cues 2.1.1
Speech is a complex and rapid-changing code containing acoustic cues structured by the
articulatory and aerodynamic mechanisms of speech production. Humans’ ability to understand
conversation in adverse conditions that degrade the speech signal proves that audibility of the
entire speech spectrum is not necessary for speech understanding. It is important to ask, “What
acoustic properties of speech are most critical to speech recognition?” Over the past 60 years,
researchers have been manipulating the spectrum of both natural speech and synthetic speech in
order to answer this very question. As a result, there is an abundance of literature regarding the
cues in the acoustic pattern of speech that listeners use to perceive phonemes.
Spectrograms (Figure 2-1) display the pattern of speech acoustics along three
dimensions: time along the abscissa, frequency along the ordinate, and intensity represented by
the darkness or boldness of the bands found within the spectrum. Cues to aid speech perception
result from the variance of each dimension with respect to another. These cues are classified as
spectral, intensity, temporal, spectro-intensity, tempo-intensity, and spectro-temporal cues. For
spectral, intensity and temporal cues, a single acoustic property provides a pattern resulting in

7
phoneme recognition, while the two remaining domains are held constant (i.e., in spectral cues
the frequency patterns serve as cues while intensity and time are held constant). While spectro-
intensity, tempo-intensity, and spectro-amplitude cues are defined as dynamic patterns that
emerge when one acoustic property varies as a function of another property. For example, an
acoustic pattern generated by frequency varying as a function of time is a spectro-temporal cue.
Table 2-1 contains an acoustic cue matrix showing the variation of the cues for phonemic
perception along the acoustic dimensions.
Table 2-1: Acoustic Cue Matrix
Spectral Intensity Temporal
Spectral • Vowel perception (formant spacing)
• Fricative perception (spectral
shape of noise) • Plosive perception (spectral shape of burst)
• Plosive perception (Burst intensity & consonant-vowel amplitude ratio)
• Consonant perception (formant transitions—slope and duration)
• Voicing perception (VOT, TOT, EOA)
Intensity • Voicing perception in consonants (F0)
• Perception of nasals
(weaker intensity)
• Manner of production • Voicing perception in consonants
(amplitude envelope)
Temporal • Voicing perception in final-position consonants (vowel duration)
• Fricative perception (duration of
noise) • Manner of production (periodicity)

8
Figure 2-1: Spectrogram of the CV syllable /da/. Frequency is represented on the y axis, while time is represented on the x-axis. Intensity is shown by the darkness of the bars within the spectrogram.
Spectral Cues 2.1.2
Spectral cues result from the resonances (formants) of the vocal tract during speech
production. When voicing is present, the spectral cues aid vowel recognition. Vowel perception
is dependent on the spectral pattern or spacing of the vowel formats. Delattre and his colleagues
(1952) at the Haskins Laboratory, where much of the early work on speech acoustics and
perception originated, used synthesized speech to manipulate the frequency spacing of the first
and second formant (F1 and F2). They presented the variations of the formant pairs to listeners to
find the pattern that resulted in the highest accuracy of vowel identification. Results indicated
that listeners use formant spacing (the frequency difference between F1 and F2), as a cue for
vowel identification. For example, results indicated that the difference between a listener
perceiving the vowel /i/ as in “beet” and /u/ as in “boot” was that /i/ had a much higher F2 and

9
subsequent formant spacing than /u/. Figure 2-2 shows the formant patterns that serve as spectral
cues for each labeled vowel.
Figure 2-2: The values and relative pattern of F1 (lower bars) and F2 (higher bars) for each of the labeled vowels (from Delattre et. al., 1952).
Spectral cues also contribute to the perception of fricatives. Due to the site of constriction
in the oral cavity during production, the frication noise takes on a variety of spectral resonance
patterns (Heinz & Stevens, 1961). The palatal fricatives /∫/ and /t∫/ have the largest resonant
cavity, so the high frequency noise spectrum is concentrated above 2 kHz. However the spectral
shape of the alveolar fricatives /s/ and /z/ are contained above 4 kHz. For the most anterior-
produced fricatives /f/ and /v/, the spectral shape of the noise is more broad-band due to a lack of
resonant oral cavity. Listener’s can use their perception of the spectral energy of the noise to
accurately label the phoneme presented (Harris, 1958; Heinz & Stevens, 1961; Jongman, 1989).
Just as there are spectral cues in the noise of the frication, there are also such cues in the
noise of the burst in plosive voiceless consonants. The frequency of the burst in relation to the
second formant of the following vowel aids listeners in determining the place of constriction for
the consonants /p/, /t/, and /k/. Liberman, Delattre, and Cooper (1952) showed that bursts

10
containing high spectral energy were perceived as /t/ by listeners, while bursts with spectral
energy lower in frequency relative to the vowel’s F2 were perceived as /p/. Listener’s reported
hearing /k/ when the spectrum of the burst was slightly higher than the following vowel’s F2.
Perception of nasal consonants is accomplished by spectral cues. Nasal consonants have a
perceptual feature called nasal murmur which is an additional resonance around 250 Hz
(Mermelstein, 1977). This low frequency spectral cue aids listeners in distinguishing the nasal
manner of the consonant being produced.
Intensity Cues 2.1.3
Intensity cues are acoustic perceptual features resulting from changes in the amplitude of
phonemic production. Intensity is the most salient cue for detecting voicing in vowel and
consonant production (Ohde, 1984). Presence of vocal-fold vibration results in overall acoustic
patterns that are more intense than those produced without vibration. Intensity cues also are used
to differentiate the manner of production between nasal and non-nasal consonants, in addition to
the aforementioned spectral cue of nasal murmurs. Fant (1952) found that nasal consonants tend
to have formants with weaker intensities than the neighboring vowels. Mermelstein (1977) also
found that the lower intensity level of the energy band in the upper formants separate the nasally
from the non-nasally-produced consonants.
Temporal Cues 2.1.4
Speech contains temporal variations that serve as acoustic cues in phonemic recognition.
Temporal cues aid the listeners in perceiving the presence or absence of voicing in consonants

11
(House, 1961). Raphael (1972) found that for consonants in the final position (VC) lengthening
the preceding vowel duration resulted in listeners perceiving more voiced consonants even when
the final consonant was actually a voiceless production. When the vowel of the word “bet” was
prolonged, the listeners’ perception of the final consonant changed to that of a voiced /d/ as in
“bed”.
The duration of the noise in fricatives provides a cue for the perception of consonant
voicing. Voiceless fricatives such as (/f/, /s/, and /∫/) tend to have longer durations of noise than
their voiced counterparts (/v/, /z/, and /t∫/) (Baum & Blumstein, 1987; Jongman, Wayland, &
Wong, 2000). Temporal cues also distinguish between the perception of fricatives and affricates.
A silent duration preceding /∫/ in the word “hash” causes the perception to shift toward /t∫/ as in
“hatch” (Raphael & Dorman, 1980).
Another temporal cue called periodicity is an important property of speech. Periodic and
quasi-periodic phonemes such as vowels and voiced consonants fluctuate at rates between 50-
500 Hz. Aperiodic phonemes such as fricatives and voiceless plosives typically have fluctuation
rates above 1 kHz. Listeners use this temporal cue not only to determine voicing and manner of
production, but also to determine pitch because the rate of periodicity reflects the fundamental
frequency of the voice (Rosen, 1992).
Spectro-Intensity Cues 2.1.5
All of the acoustic cues defined thus far have been one-dimensional. The remaining cues
can be described as bi-dimensional, meaning that one acoustic feature varies as a function of
another. Spectro-intensity cues are those in which changes in the intensity of certain frequency
regions elicit different phonetic percepts. For voiceless stop consonants /p/ and /t/, there are

12
spectral cues that distinguish the place of production with the noise burst of the alveolar
consonant /t/ having a higher frequency spectrum than the labial consonant /p/. Ohde and
Stevens (1983) conducted a study examining the effect of burst amplitude on the perception of
/pa/ and /ta/. The authors constructed a continuum of nine synthetic speech tokens with the
spectral cues varying in steps from that of /pa/ to that of /ta/. They found that by enhancing the
amplitude of the burst relative to the vowel energy, listeners tend to rate the sound as being /ta/
although the spectral cues correspond with the bilabial /pa/. Conversely, if the amplitude of the
burst was decreased relative to the vowel energy, then the listeners were more likely to perceive
/pa/, despite the fact that the spectral cues indicated /ta/. Similar relative amplitude cues also
exist for the fricative consonants /s/ and /∫/ (Hedrick & Ohde, 1993).
Tempo-Intensity Cues 2.1.6
The speech spectrum contains gross tempo-intensity variations commonly referred to as
the “amplitude envelope”. The amplitude fluctuation rate is characterized as having slow rise/fall
times with the fluctuation rate being between 2-50 Hz (Rosen, 1992). Van Tasell and her
colleagues (1987) explored the role of amplitude envelope on speech perception. In their
experiment, the authors generated 19 speech waveform envelope noises that corresponded to one
of 19 vowel-consonant-vowel utterances. The noise waveforms were then low pass filtered so as
to extract the amplitude envelope. Listeners were then asked to identify the consonant of the
filtered noise. The authors found that the listeners’ closed-set identification of the 19 consonants
was above chance. Error analysis revealed that listeners were able to use the amplitude envelope
cue to correctly group the utterances according to manner of production and presence of voicing.
Numerous studies involving cochlear implants and narrow-band filtering have further confirmed

13
the importance of amplitude envelope cues (Warren, Reiner, Bashford, & Brubaker, 1995;
Shannon, Zeng, Kamath, Wygonski, & Ekelid, 1995; Shannon, Zeng, & Wygonski, 1998).
Spectro-Temporal Cues 2.1.7
In his work describing the temporal information of speech, Rosen (1992) divided
speech’s temporal aspects into three features. The first two are the previously mentioned
periodicity and amplitude-envelope cues. The third feature called the fine-structured cue reflects
the variations of the spectrum over short-time intervals. These cues display the rapid spectral
movement over time. Examples of these spectro-temporal cues are formant transitions, duration
of transitions, and voicing onset cues.
Formant transitions result from the changes in the resonance of the articulatory
mechanism as it smoothly transitions from one production stance to another. Figure 2-3 shows
the F2 transitions from the consonants /b/, /d/, and /g/ to the vowels /i/, /e/ /ε/, /a/, /⊃/, /o/, and
/u/. The F2 transitions from the phoneme /b/ to each vowel is characterized as having a rising
transition, while the /g/ to vowel F2 transition is characterized as falling. The direction of the
alveolar /d/ phoneme F2 transitions vary as a function of the following vowel (Delattre,
Liberman, & Cooper, 1955). By systematically varying the direction and slope of the F2
transition, the listener’s perception changes between /ba/, /da/, and /ga/ (Liberman, Harris,
Hoffman, & Griffith, 1957).

14
Figure 2-3: The second formant transitions for /b/, /d/, and /g/ and the each of the labeled vowels (from Delattre et. al., 1955).
Stevens (1980) reported that this rapid change in the spectrum occurs over the first 10-30
ms of the utterance. Psychoacoustic experiments have shown that by keeping F1 steady and
removing the first 50 ms of the F2 transitions for the syllables /bV/, /dV/, and /gV/, listeners’
perception changes in that they report that they no longer hear the consonants /b/ and /g/, but
hear /d/ paired with different vowels (Delattre et al., 1955). It is apparent that there is an acoustic
wealth of information indicating the place of articulation during the brief formant transition
period. Spectro-temporal cues also differentiate the semivowel glides /r/ and /l/, in that /r/ is
marked by a low rising F3 and /l/ is characterized by a high falling F3 (Lisker, 1957). Longer
formant transitions (> 40 ms) indicate the production of semivowel glides /w/ and /j/. Liberman,
Cooper, Shankweiler, and Studdert-Kennedy (1956) found that by extending the transition
durations of /bε/ and /gε/ to 40-50 ms listeners reported hearing /wε/ and /jε/. Formant transitions
greater than 150 ms are perceived as diphthongs (Gay, 1970).

15
Spectro-temporal cues play a role in determining the presence or absence of voicing in
the production of consonants. Stevens and Klatt (1974) found that listeners use two spectro-
temporal cues in the perception of voicing. The first cue was the duration of the formant
transitions between the consonant and the vowel, with transitions of 10-30 ms perceived as
voiced. Voiceless consonants have minimal or even negligible formant transitions. This is due to
the transitions occurring during the voiceless burst of the initial plosive. The second cue the
authors mentioned for voiced-voiceless distinction was voice onset time (VOT).
Voice onset time is defined as the interval between the release of a stop occlusion and the
onset of voicing. Voiced initial stops in which the voicing occurs at the same time or
immediately following the release burst tend to have short VOT of no more than 20 ms.
Voiceless stops in which the voicing lags behind the release burst have VOT greater than 25 ms
(Lisker & Abramson, 1964). There is a clear and distinct categorical boundary between English
voiced and voiceless cognate pairs around 20 ms, where consonants with VOT greater than 20
ms tend to be perceived as voiceless and those with VOT less than 20 ms tend to be perceived as
voiced. The location of this boundary at 20 ms confirms earlier research on auditory perception
of temporal order (Hirsh, 1959).
The frequency characteristic of voicing tends to be the fundamental frequency of the
voice while the frequency characteristic of the release burst tends to be high frequency noise.
Therefore VOT can be described as the temporal relationship between low and high frequency
components. Pisoni (1977) carried out a study using non-speech tonal stimuli to mimic the VOT
feature of stop consonants. He used a low frequency 500 Hz tone to mimic the low frequency
voicing property and a 1500 Hz tone to represent the high frequency component of the burst and
varied their relative tone onset time (TOT) between -50 and + 50 ms. After training, listeners

16
produced sharp identification boundaries around -20 and +20 ms, paralleling the results of the
earlier VOT studies.
Recently, Yuan and colleagues (2004) proposed an acoustic cue called Envelope Onset
Asynchrony (EOA) that serves to distinguish a voiced consonant from its voiceless cognate in a
similar manner as VOT and TOT. EOA uses the time asynchrony between the onset of two
frequency bands of energy in the speech spectrum, the first being low passed at 350 Hz and the
second being high passed at 3000 Hz to determine whether the consonant is voiced. For an
articulated initial voiced consonant, low frequency energy either occurs before or simultaneously
with the onset of the high frequency energy in the speech spectrum. In contrast, the onset of low
frequency energy tends to follow the onset of high frequency energy for initial voiceless
consonants. EOA is derived from subtracting the onset of the high frequency energy band from
the onset of the low frequency energy band. Theoretically, the EOA for initial voiced consonants
should be a negative value or zero and the EOA for initial voiceless consonants should be a
positive value. In the acoustical analysis of two speakers’ speech spectrum, the authors found the
overall mean EOA of 8 voiced consonants to be -12.4 ms and the overall mean EOA of 8
voiceless consonants to be 142.5 ms.
Ortmann, Palmer, and Pratt (2010) tested a group of listeners in order to determine
whether EOA is a spectro-acoustic cue used by listeners for determining the presence of voicing
in initial consonants. Recordings of six individual consonant-vowel syllables /ba/, /pa/, /da/, /ta/,
/ga/, and /ka/ were filtered into two frequency bands, a low frequency band below 350 Hz and a
high frequency band above 3000 Hz. For each syllable, these bands were delayed in time relative
to one another in 25 ms steps so that an EOA continuum was generated for each CV token.
Listeners completed a 2 alternative forced choice labeling and discrimination task for each

17
continuum. Figure 2-4 shows the normal-hearing listeners’ group average labeling and
discrimination data for the syllables /pa/, /ta/, and /ka/. For each of the graphs, the percent of the
listeners’ responses indicating a voiced percept is plotted as a function of EOA changing from a
negative value to a positive value. For example, in Figure 2-4a the CV syllable /pa/ is perceived
by listeners as /ba/ when the EOA is manipulated to have a negative value (far left of the graph).
Overall, the results indicate that as the temporal onset asynchrony between low and high
frequency bands of speech is manipulated, listeners’ perception of the consonant’s voicing
properties changed from voiced to that of its voiceless cognate.

18
Figure 2-4(a-c): Normal-hearing listeners’ identification and discrimination data for the EOA continuums, a) /pa/ b) /ta/ and c) /ka/. For each of the graphs, the x-axis displays the 10 tokens representing the shift in EOA from a more negative value to a more positive value. The space in between each token value represents the adjacent token pairs (i.e., token 1 paired with token 2, token 2 paired with token 3, and so on). The values along the y-axis are in percent. The line graph represents the data from the labeling task, so higher on the y-axis means that the listeners’ perception is voiced, while lower values represent a more voiceless percept. The bar graph displays the discrimination data, so higher y-axis values mean that a greater difference between the token pair was detected.
a) NH-/pa/
Tokens1 2 3 4 5 6 7 8 9 10
Perc
ent
0
10
20
30
40
50
60
70
80
90
100EOA = ~ -80 - -5 ms EOA = ~ -5 - +70 ms EOA = ~ +70 - +110 ms
b) NH-/ta/
Tokens1 2 3 4 5 6 7 8 9 10
Perc
ent
0
10
20
30
40
50
60
70
80
90
100EOA = ~ -80 - -5 ms EOA = ~ -5 - +70 ms EOA = ~ +70 - +110 ms
c) NH-/ka/
Tokens1 2 3 4 5 6 7 8 9 10
Perc
ent
0
10
20
30
40
50
60
70
80
90
100EOA = ~ -80 - -5 ms EOA = ~ -5 - +70 ms EOA = ~ +70 - +110 ms
19
Coarticulation 2.1.8
These spectral, intensity, temporal, spectro-intensity, tempo-intensity, and spectro-temporal cues
are many of the overlapping acoustic cues that aid listeners in recognizing spoken language.
These sub-phonemic cues have a complex map to phonemes in that there is not a one-to one
correspondence between these aforementioned cues and the recognized phoneme. The map
complexity is due in large part to coarticulation. Coarticulation occurs when two or more
phonemes are produced with temporal overlap (i.e., lip rounding of the production of /s/ when
saying “soon”). Lindblom (1963) found that the vowel 2nd formant spectral cues (recall Figure
2-2) varied by as much as 70% when the vowel was produced following different consonants /b,
d, g/ and with different syllable durations. Amazingly, listeners partaking in everyday
conversation with many different speakers are still able to recover the intended phoneme and
subsequent message despite all of this acoustic variability in speech (Smith, 2000).
Another lack of perfect relationship between acoustic cues and perceived phonemes is
evidenced in the F2 transition cue for the consonant /d/. According to the second row of Figure
2-3, the transition cue for /d/ in the syllable /di/ (far left) is a rising transition. However, the same
cue for /d/ in /du/ (far right) is a steeply falling transition. It is apparent that completely opposite
cues are eliciting the same percept. Further studies have found that listeners are able to
compensate for the acoustic variability of coarticulation (Lindblom & Studdert-Kennedy, 1967;
Mann, 1980; Mann & Repp, 1980; Mann & Repp, 1981; Holt, Lotto, & Kluender, 2000). Mann
(1980) found that target speech sounds are shifted by the preceding phonetic context. In this
experiment listeners identified ambiguous target stimuli as either /da/ or /ga/ when they were
preceded by /ar/ or /al/. The spectral cues for each of these individual consonants in isolation are
1) /d/ has a high F3 onset frequency while 2) /g/ has a lower F3 onset, 3) the F3 frequency for /r/

20
is low frequency compared to 4) /l/ which has a high F3 frequency offset. Coarticulation of the
syllables /arda/ would result in the lowering of the F3 frequency for the consonant /d/ by the low
frequency offset of the consonant /r/. The syllables /alga/ would have an acoustic pattern in
which the third formant of /g/ would be raised by the temporal overlap with the consonant /l/
(See Figure 2-5a-d for a schematic diagram of this coarticulation). The results showed that
listeners identified the ambiguous phoneme as /da/ when the precursor syllable was /ar/ and
identified /ga/ more often in the context of /al/. Listeners were able to use context of the
preceding phoneme (/ar/ & /al/) to correct for the spectral variability of the neighboring phoneme
(/da/ & /ga/).
This puzzling relationship between speech acoustics and perception has caused
researchers to develop several theories as to how listeners can withstand so much acoustical
variation due to coarticulation and still retain phonemic and subsequent lexical recognition.
These theories are divided into those that are articulation-based theories and those that are
auditory-based theories (See Diehl, Lotto, & Holt, 2004 for a good review of speech perception
theories).

21
Figure 2-5(a-d): Schematic spectrogram taken from Lotto & Kluender (1998) showing the coarticulatory effects of preceding /al/ on /da/ and /ga/ and /ar/ on /da/ and /ga/. Note the similarities in formant transitions of /ga/ and /da/ in (B) and (C). Also notice the spectral contrast between the third formant of the preceding consonants /l/ and /r/ and the following consonants /d/ and /g/. In (A) and (B), there is more contrast or disparity between F3 in /alga/ than /alda/. In (C) and (D), note the spectral contrast in /arda/ that is not present in /arga/.

22
Theories of Speech Perception 2.1.9
2.1.9.1 Articulation Based Theories
The Motor Theory of speech perception was developed in the 1960’s by the research
group at the Haskin’s Laboratory (Liberman et al., 1967; Liberman & Mattingly, 1985). This
theory was conceptualized after the group spent nearly two decades capturing and linking
acoustic properties to phonetic structure. In 1957, Liberman and his colleagues constructed a
continuum of synthetic CV syllables varying in the slope of the F2 transition that resulted in a
perceptual continuum spanning /ba/ to /da/ to /ga/. These CV syllables were then presented to
listeners to either identify the initial consonant or to discriminate between pairs of adjacent
stimuli on the continuum. The results displayed a sharp boundary between the perceived
phoneme categories corresponding with a peak in discrimination accuracy between categories
and then falling to chance within categories. This effect is known as categorical perception.
Liberman and his colleagues, knowing the complex and variable map between the absolute
values of acoustic cues and phonemic perception, began to explain categorical perception in
terms of articulation rather than acoustics. They argued that the boundaries of the categories are
more coincidental with the articulator’s place of production than the acoustic properties of
speech. Because of this seemingly one-to-one correspondence between phonemes and
articulation, it was hypothesized that phonemic analysis occurs along the speech neuromotor
pathway rather than the auditory pathway.
The Motor Theory accounts for perceptual recovery from coarticulation by stating that
articulated phonemes are perceived by listeners via their own neuromotor commands. This way
the listener perceives the intended gesture rather than the actual coarticulated gesture made by
the speaker. Figure 2-6 displays the model of the Motor Theory of speech perception. In this

23
model, the auditory pathway is only responsible for receiving the acoustic patterns at the
subphonemic level. An important aspect of this theory is that there exists a specialized speech
decoder that breaks down the acoustic features into information about the vocal tract shape and
articulatory gestures. Liberman and Mattingly (1985) claim that this module, which is unique to
humans, enables listeners to recover from the acoustic consequences of coarticulation such as the
lowering of F3 onset in /da/ when spoken in the bi-syllable /arda/. The recovered intended
gestures are then sent to the neuromotor network where the features are extracted and linearly
mapped to the appropriate phoneme. According to the Motor theory, this speech module is
responsible for the human listener’s ability to separate speech in the presence of multiple talkers
in that this module recognizes the presence and dynamics of more than one vocal tract shape and
computes the resulting acoustic resonances, then separates the gestures according to vocal tract
shape (Dorman, Raphael, & Liberman, 1979).
Figure 2-6: A simplified diagram of the Motor Theory of speech perception. Note the use of
neuromotor commands for speech production.

24
The Direct Realist Theory, like the Motor Theory, is a gestural account of speech
perception in which perception is linked to production (Fowler, 1986). While motor theorists
believe that phonemic recognition occurs by recovery of the intended gestures of speech through
a specialized speech decoder and neuromotor commands, the direct realist believes that listeners
recover the talker’s actual gesture such as lip closure in the syllable /ba/. The Direct Realist
Theory does not require features to be extracted from the acoustic signal because the acoustic
signal is just a medium to transport gestures. Listeners do not perceive the spectral, intensity, and
temporal properties of speech, but rather the speaker’s actual articulation of phonemes. This
theory draws from the notion that when people rely on their haptic senses to feel and recognize a
certain object, the senses do not quantify the amount of pressure on the skin of their fingertips,
but rather seek information about the object itself (i.e., round, hard, smooth with stitches, and
size = baseball). Therefore it was hypothesized that listeners do not extract the actual acoustic
properties of speech to recognize sounds, but rather use the acoustics as a medium to perceive
the phonetically structured articulators.
Figure 2-7 displays a schematic diagram of the Direct Realist Theory (Folwer, 1996).
This theory explains the perceptual hardiness toward coarticulation, as in the /arda/ example by
stating that the syllable /ar/ and /da/ are two separate and independent phonemic units that are co-
produced. The listener recovers the two gestures and perceives the /da/ in /arda/ despite the
acoustic variability of F3 (Fowler, 2006).
The Analysis by Synthesis Theory, developed by Stevens and Halle (1967) at
Massachusetts Institute of Technology, combines both a gestural and an auditory approach to
speech perception. In this model (Figure 2-8), a listener perceives the acoustic pattern of speech,
then generates a hypothesis regarding the phonemic structure of the utterance. The listener then
25
rapidly generates an internal auditory model of his own production of the same utterance. If the
input’s overall acoustic pattern matches his projected ouput, then the listener accepts his
hypothetical perception and accurate speech perception occurs. By analyzing the input in terms
of his synthesis of the utterance, the listener normalizes the variability due to coarticulation. This
theory was abandoned soon after it was created as the authors began to support auditory-based
theories of speech perception.
Figure 2-7: A simplified diagram of the Direct Realist Theory of speech perception. Note the lack of acoustic and phonetic feature extraction.
Figure 2-8: A simplified model of the Analysis by Synthesis Theory of speech perception. Note the combination of both auditory and gestural processes for speech perception.

26
2.1.9.2 Auditory Based Theories of Speech Perception
The Auditory Approach to speech perception states that phonemic and lexical recognition
is achieved by the recovery of the acoustic properties of speech by the auditory sensory and
cognitive network. Although the Acoustic Approach acknowledges that acoustic cues are
generated by and correlated with articulatory gestures, speech understanding does not involve the
perception of these gestures, nor is perception tied to production. Instead, acoustic cues are
directly encoded as phonemes (Diehl et al., 2004). The Auditory Approach evolved as a result of
several findings that challenged the articulation based theories of speech perception. These
findings include results that indicated that some invariant acoustic cues to speech perception
exist (Blumstein & Stevens, 1979), findings that animals were able to exhibit speech perception
abilities (Kuhl & Miller, 1975; Kuhl & Miller, 1979; Kluender, Diehl, & Kileen, 1987), and data
that demonstrated that human listeners can perceive non-speech stimuli similarly to speech
stimuli (Stevens & Klatt, 1974; Pisoni, 1977; Holt et al., 2000).
Cole and Scott (1974) proposed that listeners’ identification of at least three acoustic cues
is crucial to accurate speech perception: invariant acoustic cues, context-conditioned cues, and
waveform envelope cues. They described invariant cues as the acoustic cues that accompany a
particular phoneme in any vowel context. Blumstein and Stevens (1979) stated that these
invariant cues occur in the first 10-20 ms after the release of stop consonants. The authors
analyzed the onset spectra of stop consonants paired with different vowels spoken by different
speakers. They found three general templates that classified voiced and voiceless stop
consonants according to place of articulation. The onset spectra of labial /b, p/ tend to have a flat
or falling amplitude-frequency pattern, while alveolar /d, t/ possess an amplitude rising spectra.
Velar consonants /g, k/ display a compact mid-frequency energy spectra. These three general

27
templates correctly identify the place of articulation 85% of the time across many speakers. An
additional perceptual study found that listeners can appropriately categorize synthetic CV stimuli
constructed with the differing onset spectral templates (Blumstein & Stevens, 1980).
Another invariant cue mentioned was VOT to indicate the presence of voicing during
stop consonant production. In quiet listening environments, although both VOT and the duration
of F1 transition are cues, the duration of VOT alone is a salient cue to indicate voicing (Stevens
& Klatt, 1974; Lisker, 1975; Summerfield & Haggard, 1977). In noisy environments the low
amplitude of the spectral burst is obliterated by the spectrum of the background noise. In line
with Cole and Scott’s theory that listeners use a combination of acoustic invariant and contextual
cues, Jiang, Chen, and Alwan (2006) found that listener’s perception of voicing in CVs depended
on the onset and duration of the first formant transition.
Research findings that chinchillas (Kuhl & Miller, 1975; Kuhl & Miller, 1978) and quails
(Kluender et al., 1987; Lotto, Kluender, & Holt, 1997) can perceive speech contradicts the
assumption by the Motor Theory of speech perception that humans possess a specialized speech
decoder. It appears that animals, without the mechanisms to produce speech, were able to
perceive speech. Both the Motor Theory and the Direct Realist theory of perception were refuted
further by findings showing similarities between perception of speech and non-speech stimuli by
human listeners. Since non-speech stimuli such as pure tones and noise bursts are not made by
articulatory gestures, a listener’s ability to be influenced by and perceive non-speech stimuli as
speech supports the notion that perception results from the recovery of acoustic information not
gestures (Holt & Kluender, 2000)
How does the Auditory Approach to speech perception explain listeners’ perceptual
resistance to the acoustical effects of coarticulation? In the previous example of /arda/ and /alga/,

28
the spectro-temporal cues for the consonants /d/ and /g/ are very similar due to the context of /r/
and /l/ (Figure 2-5). Yet listeners are able to resist the assimilative context to perceive /d/ and /g/.
As in the presence of noise when the invariant acoustic cues are ambiguous, listeners must rely
on context-conditioned cues for phonemic identification. The Auditory Approach (Figure 2-9)
points to spectral contrast as a cue within context to aid listeners in neutralizing the assimilated
effects of coarticulated phonemes (Lotto et al., 1997; Lotto & Kluender, 1998; Holt et al., 2000;
Holt, Lotto, & Kluender, 2001; Diehl et al., 2004). Acoustic spectral contrast occurs when there
are frequency differences in neighboring phonemes. Auditory perceptual contrast mechanisms
may exaggerate these differences so that accurate phonemic recognition is maintained across
context due to coarticulation (Holt & Kluender, 2000).
Figure 2-9: A simplified model of a General Approach to speech perception. Boxes above the stages in the model indicate cues that can shift the perception of speech.
Spectral contrast can explain the results of Mann (1980) in which the perception of /da/
increases (/ga/ responses decrease) in the context of the preceding /ar/. Figure 2-5c and d show
the schematic graphs generated by Lotto and Kluender (1998) of the first four formant transitions
for the /arda/ and /arga/ stimuli that were used in the Mann (1980) study. In the syllable /arda/,
the spectral disparity between the offset of the /r/ and the onset of the /d/ F3 transition is greater
than that in the syllable /arga/. The spectral contrast between the neighboring phonemes in /alga/

29
is shown in Figure 2-5b while Figure 2-5a shows the F3 spectral continuity of /alda/. This
general auditory mechanism of spectral contrast may be a valuable tool in predicting the
phonemic pattern of coarticulated speech despite its assimilative acoustic effects. Evidence for
the role of spectral contrast has been observed for phonemic syllables (Mann & Repp, 1981a,b;
Repp & Mann, 1980, 1981), lexemes (Elman & McClelland, 1988), and non-speech stimuli
(Stephens & Holt, 2003; Wade & Holt, 2005; Holt, 2005). Because perceptual accommodation
for coarticulation is evident at the subphonemic, phonemic, and lexical stages of auditory
perception, this suggests that speech perception is an interactive process with a bi-directional
flow of information between higher level cognition and the perception of the acoustical
properties of the sound (McCelland, Mirman, & Holt, 2006).
Neurophysiology of Speech Perception 2.1.10
Regardless of the model for the perception of speech, the phonemic acoustic pattern has
to be received by the ear and converted into the neural code that represents, depending on the
model, the intended gesture, the actual gesture, or the acoustic properties corresponding to the
target phoneme. The cochlea is a frequency analyzer consisting of rows of sensory hair cells
along its basilar membrane. These hair cells serve as transducers converting mechanical energy
to electrical impulses at the synapse of the attached auditory nerve fibers. Each hair cell and
corresponding nerve fiber is a band pass filter with a maximum sensitivity to a specific or
characteristic frequency (CF). The cochlea is tonotopically organized in that the CF of nerve
fibers is determined by the location of the hair cell on the basilar membrane. The spectral
properties of the speech signal are encoded by the place of neural activation along the cochlea

30
and this place code is preserved along the neural pathway to higher auditory centers (Hackney,
2006). The rate of neural discharge indicates acoustic energy, and the energy onset/offset.
Delgutte and Kiang (1984a,b,c,d) published a series of papers on their work of
quantifying how speech is encoded in the auditory nerve. In these experiments, the authors
recorded the responses of single nerve fibers with different CF’s to a variety of speech stimuli.
The auditory nerve responses to vowel and fricative stimuli can be described either in terms of
average rate of discharge or by the fine time patterns of spike (neuronal discharge) activity.
Peaks in the discharge rate occur in the nerve fibers whose CF corresponds to each of the
vowel’s formants, while the fine time pattern of the spike activity reflects the periodicity of the
signal (Delgutte & Kiang, 1984a). The place of maximal rate of neuronal discharge for voiceless
fricatives corresponded to the high frequency region of frication noise. The temporal pattern of
neuronal discharge of fibers with lower frequency CF’s does not display any form of modulation,
indicating that the signal is aperiodic (Delgutte & Kiang, 1984b).
For consonants, the auditory nerve fiber has to respond to the rapid amplitude and
spectral changes in the spectrum. There is evidence that nerve fibers use short-term adaptation as
a mechanism to enhance their sensitivity to the dynamic characteristics of speech (Smith, 1979;
Delgutte & Kiang, 1984c). Neural short-term adaptation occurs after the onset of an acoustic
stimulus causes a rapid increase in the spike rate of neuronal discharge. Immediately after this
sharp peak in activity, the nerve fibers gradually adapt to the signal by decreasing the rate of fire
over time. This adaptation allows the auditory nerve fiber to be able to increase discharge rate
when acoustic changes occur in the stimulus. Delgutte and Kiang (1984c) measured the effect of
preceding context on the neural response to the consonant vowel transition corresponding to /da/.
The 10 acoustic stimuli in their experiment consisted of /da/, and nine stimuli with the formant

31
transitions for /da/ preceded by the context of /a/, /i/, /u/, /n/, /s/, /sh/, /st/, and /d/ with the upper
formants (F4 & F5) enhanced. The authors measured the response of an anesthetized cat’s
auditory nerve fibers to each of these stimuli. The authors not only found evidence of neural
short-term adaptation, but also found that discharge rates during the transitions decreased for
those nerve fibers with CF’s corresponding to a frequency region that was present in the
preceding context. When the /da/ transitions followed the phoneme /sh/, the neural response for
the transitory period was reduced in the high CF-fibers. When the /da/ transition was preceded by
a predominately low frequency energy /n/, the neural response to the transition was reduced in
the low CF-fibers.
It is reasonable to posit that neural adaptation may explain the mechanisms of spectral
contrast. While the frequency regions that are shared between the coarticulated phonemes would
be suppressed, thus enhancing the regions in which there is little or no spectral overlap (Holt &
Kluender, 2000). In the example of /arga/, the lower frequency F3 of the /ar/ would theoretically
cause short term adaptation on the third formant of the /ga/ (Figure 2-5d). The F3 of /da/ is a
higher frequency than the F3 of the /ar/, so that different nerve fiber bundles are firing rather than
the already adapted fibers (Figure 2-5c). This enhancement would cause listeners to favor the
perception of /da/ in the context of /ar/.
Although, neural adaptation is an attractive source of the contrast effect, there is evidence
that contrast effects may arise from a more central auditory mechanism. Specifically, neural
adaptation is a monaural mechanism yet studies have shown that contrast effects can result from
dichotic presentations with the context cue delivered to one ear and the target stimuli delivered to
the opposite ear (Holt & Lotto, 2002). Also, neural adaptation dissipates after 50-100 ms
(Delgutte, 1980), while contrast effects linger after 400 ms (Holt & Lotto, 2002). Animal studies

32
further ruled out the role of the peripheral mechanism at the level of the auditory nerve and
cochlear nucleus in spectral contrast effects (Holt, Ventura, Rhode, Behesta, & Rinaldo, 2000).
The acoustic dimensions of frequency, amplitude, and time are encoded in the auditory
nerve fibers. This neural pattern of the speech spectrum is transmitted through the brainstem to
the auditory cortex where it is cognitively processed and translated into lexemes. There is
evidence that the tonotopicity from the cochlea to the auditory nerve fibers is somewhat
maintained in the auditory cortex (Cheung, Bedenbaugh, Nagarajan, & Schreiner, 2001). The
circuitry of the auditory cortex is extremely complex with ascending, descending and lateral
connections. The auditory cortical map and its functional relationships are not fully understood
and is a topic of interest and debate among researchers in the fields of neuroanatomy and
neurophysiology (Budinger & Heil, 2006).
2.2 SPEECH PERCEPTION BY LISTENERS WITH MILD-MODERATE
SENSORINEURAL HEARING LOSS
Sensorineural hearing loss causes a loss of sensitivity to sound. Elevated sensitivity thresholds
increase the amount of difficulty in understanding speech. For listeners with mild-moderate
hearing impairment, this loss of audibility accounts for most of the detriment in speech
recognition performance (Dirks, Bell, Rossman, & Kincaid, 1986; Humes, Dirks, Bell, Ahlstrom,
& Kincaid, 1986; Zurek & Delhorne, 1987; Dubno et al., 1989; Ching, Dillon, & Byrne, 1998).
However, several studies have reported that audibility is not the only contributor for degradation
of speech understanding in listeners with a more severe hearing impairment (Dubno et al., 1989;
Rankovic, 1991; Ching et al., 1998; Hogan & Turner, 1998; Turner & Cummings, 1999). The

33
poorer than predicted performance on speech recognition tasks have been attributed to the
reduction of frequency resolution in the damaged cochlea. Hearing-impaired listeners generally
have auditory filters that are more broadly tuned than normal-hearing listeners (Tyler, Wood, &
Fernandes, 1982; Glasberg & Moore, 1986; Moore & Glasberg, 1986). However, listeners with a
mild-moderate hearing impairment may perform as well as normal-hearing listeners on spectral
and temporal resolution tests (Tyler, Hall, Galsberg, & Patterson, 1984; Glasberg & Moore,
1986; Thibodeau & Van Tasell, 1987; Summers & Leek, 1995). Because mild-moderate hearing-
impaired listeners’ difficulty understanding speech in quiet environments is more related to lack
of audibility than poor spectral and temporal resolution, it can be hypothesized that these
listeners can perceive the spectral, amplitude, and temporal pattern/cues of speech similarly to
normal-hearing listeners once audibility has been achieved.
Spectral Cues 2.2.1
Spectral cues aid normal-hearing listeners in the perception of vowels. Nabelek and her
colleagues (1993) conducted an experiment to test whether normal-hearing and mild sloping to
moderately-severe hearing-impaired listeners differed in their perception of an /I – ε/ vowel
continuum once audibility was accounted for. Both groups of listeners listened to several
different vowel continuums with either a steady-state spectral cue or a formant transitional
spectro-temporal cue in three listening environments: quiet, noise, and reverberation. The
listeners were asked to label what they heard as being an /I/ or an /ε/. The location of the
boundary and slope of the identification functions for each continuum in each of the background
environments were compared between the groups. No significant differences were found
between the groups regardless of the acoustic cues (steady-state or transitions) or the background

34
noise (quiet, noise, or reverberation). The results indicate that hearing-impaired listeners can use
spectral cues to identify the vowels /I – ε/.
Spectral information is critical to the perception of fricatives. Hearing-impaired listeners
tend to have a lot of difficulty in the perception of fricatives due to the combination of the weak
intensities of these phonemes and the presence of high frequency hearing loss. Listeners with
hearing loss can use the spectral cue once it is made accessible to them through amplification.
Hearing-impaired listeners listening to the /s/, /f/, and /θ/ spoken in a CV context by male,
female, and child speakers, can correctly identify the fricative phoneme more than 80 % of the
time as long as audibility is achieved through 9 kHz (Stelmachowicz, Pittman, Hoover, & Lewis,
2001).
Intensity Cues 2.2.2
Intensity cues, in addition to spectral cues, aid in the perception of manner of phonemes such as
voiced consonants and nasality. Miller and Nicely (1955) analyzed the error patterns of normal-
hearing listeners’ perception of sixteen consonants. The listeners listened and categorized these
consonants under listening conditions comprised of either quiet or noisy environments, and low
pass filtered speech. The authors found that the listeners ability to identify the voicing or the
nasality of articulation was resistant to the deleterious effects of background noise, whereas place
of articulation is severely affected by environmental manipulations. Studies analyzing the
consonant confusion patterns of mild-moderately hearing-impaired listeners demonstrate results
in which the classification of nasality and voicing is least affected by the sensorineural hearing
loss while the number of errors for place of articulation is elevated (Dubno, Dirks, & Langhofer,
1982; Turner & Brus, 2001).
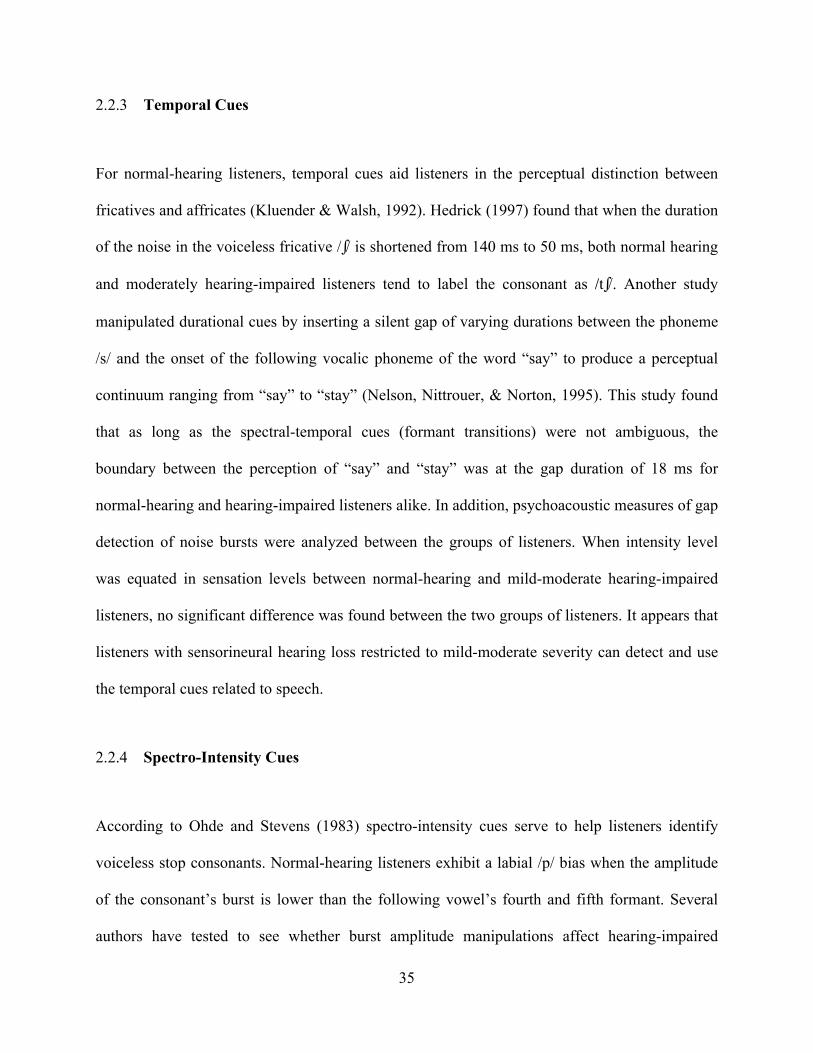
35
Temporal Cues 2.2.3
For normal-hearing listeners, temporal cues aid listeners in the perceptual distinction between
fricatives and affricates (Kluender & Walsh, 1992). Hedrick (1997) found that when the duration
of the noise in the voiceless fricative /∫/ is shortened from 140 ms to 50 ms, both normal hearing
and moderately hearing-impaired listeners tend to label the consonant as /t∫/. Another study
manipulated durational cues by inserting a silent gap of varying durations between the phoneme
/s/ and the onset of the following vocalic phoneme of the word “say” to produce a perceptual
continuum ranging from “say” to “stay” (Nelson, Nittrouer, & Norton, 1995). This study found
that as long as the spectral-temporal cues (formant transitions) were not ambiguous, the
boundary between the perception of “say” and “stay” was at the gap duration of 18 ms for
normal-hearing and hearing-impaired listeners alike. In addition, psychoacoustic measures of gap
detection of noise bursts were analyzed between the groups of listeners. When intensity level
was equated in sensation levels between normal-hearing and mild-moderate hearing-impaired
listeners, no significant difference was found between the two groups of listeners. It appears that
listeners with sensorineural hearing loss restricted to mild-moderate severity can detect and use
the temporal cues related to speech.
Spectro-Intensity Cues 2.2.4
According to Ohde and Stevens (1983) spectro-intensity cues serve to help listeners identify
voiceless stop consonants. Normal-hearing listeners exhibit a labial /p/ bias when the amplitude
of the consonant’s burst is lower than the following vowel’s fourth and fifth formant. Several
authors have tested to see whether burst amplitude manipulations affect hearing-impaired

36
listeners CV identification scores (Gordon-Salant, 1987; Montgomery & Edge, 1988; Kennedy,
Levitt, Neuman, & Weiss, 1998; Hedrick & Younger, 2001). These studies found that by
enhancing the amplitude of the consonant so that the consonant to vowel ratio (CVR) is
increased, hearing-impaired listeners’ performance on CV syllable identification tasks improved
by as much as 45.8 percentage points for specific phonemes (Kennedy et al., 1998).
A confounding factor in these results is that increasing the amplitude of the consonant
increases the audibility of the consonants’ spectral properties for hearing-impaired listeners.
Sammeth, Dorman, and Stearns (1999) conducted a study that manipulated CVR by holding the
consonant audibility constant while reducing the amplitude of the following vowel by 6 and 12
dB. They concluded that CVR enhancement by vowel reduction did not improve recognition
performance of voiceless stop for either normal-hearing or mild-moderate hearing-impaired
listeners. This study did find that hearing-impaired listeners, like the normal-hearing listeners,
exhibit a labial /p/ bias when the spectral burst was lower in amplitude. Mild-moderate hearing-
impaired listeners can use intensity cues that vary as a function of frequency in speech
perception.
Tempo-Intensity Cues 2.2.5
The cues within the temporal waveform of speech are very important to hearing-impaired
listeners. Studies using CV stimuli constructed so that all spectral information is reduced or
removed and the overall amplitude envelope is preserved have shown that hearing-impaired
listeners perform just as well as normal-hearing listeners in consonant identification tasks
(Turner, Souza, Forget, 1995; Turner, Chi, & Flock, 1999; Lorenzi, Gilbert, Carn, Garnier, &
Moore, 2006). Turner, Chi, and Flock (1999) further studied the role of temporal envelope cues

37
by dividing VCV stimuli into two or more frequency bands, then creating two amplitude
envelopes for each stimulus. When these bands of temporal patterns were given to normal-
hearing and hearing-impaired listeners, hearing-impaired listeners’ consonant recognition was
worse than that of normal-hearing listeners. Although hearing-impaired listeners can use tempo-
intensity cues, it appears that when given several temporal patterns corresponding to different
frequency regions of the stimulus, they are not able to integrate this information (Healy &
Bacon, 2002). This spectro-tempo-intensity cue has been labeled as the temporal fine structure
(TFS) of speech. It appears that hearing-impaired listeners’ inability to use the TFS as a cue
affects the listener’s ability to perceive speech in background noise (Qin & Oxenham, 2003;
Lorenzi et al., 2006)
Spectro-Temporal Cues 2.2.6
Spectro-temporal cues consist of formant transitions, transition durations, and voicing onset cues.
For normal-hearing listeners, formant transitions are critical to their perception of the place of
articulation. Listeners with sensorineural hearing loss have difficulty identifying the place of
articulation for stop consonants (Owens, Benedict, & Schubert, 1972; Walden, Schwartz,
Montgomery, & Prosek, 1981; Turner, Fabry, Barrett, & Horwitz, 1992; Turner & Brus, 2001).
Lindholm, Dorman, Taylor, and Hannley (1988) examined the perceptual importance of three
acoustic cues to the perception of voiced stop consonants by normal-hearing and mild-moderate
hearing-impaired listeners. The stimuli consisted of /bæ/, /dæ/, and /gæ/ with the appropriate
formant transitions, burst spectral templates, and rate of frequency change. The authors spliced
the formant transitions and burst spectral properties out of each CV. They also calculated the rate
of frequency change for each CV and found that for /bæ/ and /dæ/, the transition occurred over 5

38
ms while /gæ/ occurred over 20 ms. Then, the authors combined the cues in a matrix format to
produce 18 combination stimuli. For example one stimulus consisted of the /bæ/ transition,
paired with a /d/ burst spectrum, and a transition rate of 20 ms. These 18 combination stimuli
were then given to the listeners in an identification task. The results showed that normal-hearing
listeners mostly rely on the formant transition cue to identify the target phoneme regardless of
the conflicting cues. Hearing-impaired listeners relied on formant transition cues less than the
normal-hearing listeners. The impaired listeners’ identification performance was more influenced
by the spectral shape and temporal properties of the signal. It appears that the impaired auditory
system has some degree of difficulty using the rapidly changing formant transitions as a cue to
speech perception (Zeng & Turner, 1990; Turner, Smith, Aldridge, & Stewart, 1997).
Although hearing-impaired listeners demonstrate difficulty in using the transitions as
cues, such is not the case for voice onset timing cues. These timing onset cues help listeners
differentiate between voiced and voiceless cognate pairs. Johnson, Whaley, and Dorman (1984)
found that listeners with mild-moderate hearing impairment did not significantly differ from
listeners with normal sensitivity in the perception of voice onset time (VOT). Similarly, hearing
impairment does not affect the perception of envelope onset asynchrony (EOA). Ortmann,
Palmer, and Pratt (2010) examined the influence of EOA manipulations on the perception of
voicing in a group of mild-moderate hearing-impaired listeners in addition to the previously
mentioned group of normal-hearing listeners. Using the same stimuli and procedure as with the
normal-hearing group, the authors found that the perception of voicing in stop consonants is
influenced by the degree of temporal asynchrony. Figure 2-10 displays the hearing-impaired
groups’ average labeling and discrimination data for /pa/, /ta/, /ka/. The hearing-impaired

39
listeners did not significantly differ from the normal-hearing listeners (Figure 2-4) in their use of
EOA as a cue to voicing distinction.
Figure 2-10 (a-c): Hearing-impaired listeners’ identification and discrimination data for the EOA continuums, a) /pa/ b) /ta/ and c) /ka/. For each of the graphs, the x-axis displays the 10 tokens representing the shift in EOA from a more negative value to a more positive value. The space in between each token value represents the adjacent token pairs (i.e., token 1 paired with token 2, token 2 paired with token 3, and so on). The values along the y-axis are in percent. The line graph

40
represents the data from the labeling task, so higher on the y-axis means that the listeners’ perception is voiced, while lower values represent a more voiceless percept. The bar graph displays the discrimination data, so higher y-axis values mean that a greater difference between the token pair was detected.
Hearing-Impaired Perceptual Performance and Models of Speech Perception 2.2.7
Listeners with mild-moderate hearing impairment appear to use cues in each of the acoustic
dimensions to a certain extent once the speech signal is audible. Impaired auditory systems tend
to rely more on spectral shape and temporal cues, than rapidly changing formant transitions.
Articulation-based models of speech perception, such as the Motor Theory and Direct Realist
Theory account for poorer speech perception in hearing-impaired listeners by stating that
cochlear damage generates ambiguous gestures (intended or actual). Auditory-based theories
state that the damaged cochlea distorts the acoustic properties of speech and causes ambiguity in
the auditory neural mapping of features to phonemes/lexemes. Each of the models of speech
perception can provide an explanation for hearing-impaired listeners’ performance.
Little is known about the strategies hearing-impaired listeners use to differentiate
acoustic similarities brought on by coarticulation. Although hearing loss interferes with listeners’
access to the spectral and spectro-temporal properties of speech, mild-moderate hearing-impaired
listeners can use them to a certain extent (Lindholm et al., 1988). As coarticulation is rampant in
conversational speech, it is reasonable to assume that listeners with mild-moderate hearing loss
consistently use coarticulation to recover the intended phoneme. Auditory-based theories of
speech perception promote the role of contrast effects to predict the phonemic pattern of
coarticulated speech. It is not known whether hearing-impaired listeners are influenced by
spectral contrast. Hearing-impaired listeners use or lack of use of spectral contrast could
potentially shed light on the neural network mechanisms (peripheral v central) involved in

41
spectral contrast and could potentially strengthen the argument for one or more models of speech
perception.
2.3 ACOUSTICS OF CONVERSATIONAL SPEECH
The majority of speech perception studies use stimuli such as synthesized syllabic tokens,
naturally produced syllabic tokens, clearly spoken words, or rehearsed and read sentences or
passages. While these tokens allow for the experimenter’s control of the acoustic characteristics
of the stimuli, they are not wholly representative of the speech that listeners are exposed to daily.
Daily communication consists of speech spoken in a conversational manner. There are
intelligibility differences between conversational speech and speech spoken in a clear or
distinctive manner for both normal and hearing-impaired listeners (Payton, Uchanski, & Braida,
1994; Schum, 1996; Uchanski et. al., 1996; Krause & Braida, 2002; Liu, Del Rio, Bradlow, &
Zeng, 2004; Liu & Zeng, 2006). Picheny and his colleagues (1985) found that there is a decrease
in the intelligibility of conversationally produced nonsense sentences compared to similar
sentences spoken more clearly. Also, the acoustic information within conversationally produced
speech is different from clearly produced speech along the static dimensions of frequency,
intensity, and time and the dynamic dimensions of spectro-intensity, intensity-temporal, and
spectro-temporal variations (Picheny, Durlach, & Braida, 1986; Krause & Braida, 2004).

42
Differences in Static Cues Between Conversational and Clear Speech 2.3.1
2.3.1.1 Spectral and Intensity Cues
Static acoustic cues for speech perception result from a single acoustic property such as
frequency, intensity, or time information. Spectral differences between conversational speech
and clear speech are lower fundamental formant frequency values and elimination of the
spectrally rich burst information in consonant plosives in conversational speech (Picheny et. al.,
1986; Krause & Braida, 2004). In their analysis of conversational speech, Picheny et. al. (1986)
found that 60% of plosive bursts in the word final position were eliminated. Krause & Braida
(2004) performed a similar acoustical analysis of clear and conversational speech, and reported
that conversational speech has less relative energy above 1 kHz. Although the lack of high
frequency spectral information in conversational speech contributes to poorer speech perception,
it does not account for the total decreased intelligibility of conversationally spoken speech over
clearly produced speech.
2.3.1.2 Temporal Cues
Temporally, conversational speech is drastically different from clear speech. Conversational
speech ranges between 160 to 200 words per minute or 3-4 syllables per second, which is twice
as fast as clearly produced speech (Picheny et. al., 1986). Not only are there fewer pauses during
conversational speech, but also the overall rate of articulation increases (Picheny et. al., 1986,
Picheny et al., 1989; Byrd & Tan, 1996; Uchanski et al., 1996). Picheny, Durlach, and Braida
(1989) continued their series of studies examining the intelligibility differences between clear
and conversational speech by focusing on the role of speaking rate. The authors artificially
slowed down the rate of a spoken sentence until its overall duration was equal to the duration of

43
the same sentence spoken clearly. They also temporally compressed clearly produced speech so
that its overall duration was the same as conversationally produced speech. If speaking rate is a
determining factor in the intelligibility advantage of clear speech over conversational speech,
then slowing down conversational speech should increase intelligibility and increasing the rate of
clear speech should decrease intelligibility. The results of this study did show that shortening the
duration of clearly produced sentences decreased the intelligibility of the sentences. However,
temporally expanding the duration of conversational speech so that it was overall temporally
equal to clear speech did not improve performance. In fact, the intelligibility of artificially
slowed conversational speech was worse than unprocessed conversational speech.
Uchanski et. al. (1996) proposed that perhaps this failure to find an intelligibility
advantage by slowing down the rate of conversational speech was due to the uniform expansion
algorithm used to adjust the speaking rate. In their analysis of durational differences between
conversational and clear speech, they found differences in phonemic segmental durations
between the two speaking styles. They reported that while short vowels and voiced plosives
increase 29% and 43% in duration for clear speech over conversational speech, clearly produced
unvoiced fricatives and semivowels lengthen by 91% and 103% in comparison to conversational
speech. Uchanski and colleagues (1996) used a non-uniform time-scaling technique to artificially
slow down speech so that the phonemic segmental durations of conversationally produced
sentences were equal to that of clearly produced sentences. They also used this same time-
scaling algorithm to speed up clear speech so that it was equal in segmental duration to
conversational speech. Their results were similar to Picheny et al. (1989) in that artificially
slowing down conversational speech resulted in poorer speech intelligibility for both normal
hearing listeners in background noise and hearing-impaired listeners. Speeding up clear speech

44
also resulted in poorer intelligibility scores than those of non-processed conversational speech
for both groups of listeners.
Lui and Zeng (2006) inserted small gaps between the phonemic segments of
conversationally spoken speech so that the durations of the sentences were equal to that of
clearly spoken sentences. The intelligibility of the gap-inserted conversational sentences by
normal-hearing listeners in background noise did increase relative to the unaltered conversational
sentences. However, the intelligibility of their gap-inserted conversational speech was
significantly poorer than clearly produced sentences. The authors concluded that the uniform and
non-uniform signal processing used in the previous studies by Picheny et. al. (1989) and
Uchanski et. al. (1996) to alter either the overall or segmental durations of speech introduced
some extraneous distortions that resulted in poorer than predicted results (Lui & Zeng, 2006).
They also concluded that the insertion of gaps increased the amplitude modulation and allowed
more time for the efficient phonemic processing by the listeners (Fu, 2002)
Krause and Braida (2002) further examined the role of speaking rate by using naturally
produced speaking rate alterations of both clear and conversational speech. The authors trained
five speakers with significant public speaking experience to produce clearly articulated speech at
their internally defined slow, normal (conversational rate), and quick speaking rates. The
speakers also were instructed to read aloud nonsense sentences in a “conversational manner” at
each of the three rates. The speakers were given intensive training regarding the differences
between the two speaking styles and speaking rates. The intelligibility scores from two listeners
with normal hearing in background noise indicated that there is a benefit of clear speech as the
speaker’s rate increases. For each of the five talkers, producing speech in a clear manner yielded
higher intelligibility scores than the productions of conversational style speech, even when the

45
speaking rate between the two speaking styles was roughly equal to 200 words per minute.
Although the rate of articulation is a primary difference between clear and conversational speech,
the secondary fine acoustic differences between clear and conversational speech play larger roles
in intelligibility.
Differences in Dynamic Cues Between Conversational and Clear Speech 2.3.2
2.3.2.1 Spectro-Intensity Cues
The dynamic cues of speech perception are those described as bi-dimensional such as spectro-
intensity, tempo-intensity, and spectro-temporal cues. The faster speaking rate of conversational
speech causes the acoustical properties of the bi-dimensional cues to differ from those of clear
speech. One of the secondary effects of a faster speaking rate is an increase in phonemic
coarticulation. Byrd and Tan (1996) used electropalatography to measure speaker’s tongue-
palatal contact when speaking the sentence, “Say baC1 C2ab again” (C1 and C2 are two different
consonants) at a normal and a fast rate. They found that as speaking rate increases, the duration
of tongue-palatal contact decreases for the consonants and that coarticulation occurs.
Coarticulation was documented by the compromised tongue-palatal contact location between the
two articulated consonants. The articulation of the first consonant /d/ in the utterance /bad gab/
caused the place of constriction for the following /g/ to be more frontal and less intense at
conversational speaking rate than when /bad gab/ was spoken at a slower speaking rate. There
was also evidence that the second phoneme /g/ influences the place of articulation of the
preceding phoneme /d/. This alteration of tongue-palatal constrictions in conversational speech
results in spectral and spectro-intensity changes of plosive bursts. The weakening or deletion
(Picheny et. al., 1986; Krause & Braida, 2004) of the plosive burst intensity and the shift in the

46
plosive’s center frequency disrupt the acoustic cue patterns found in speech (Blumstein &
Stevens, 1979; Blumstein & Stevens, 1980; Ohde & Stevens, 1983) and could lead to phonemic
ambiguity in conversational speech.
2.3.2.2 Tempo-Intensity Cues
The increase of articulation rate in conversational speech alters the amplitude envelope of the
speech signal from that of slower, clearly spoken speech. Amplitude fluctuations over time are
cues for stop consonant identification due to the brief periods of silence prior to the release of the
burst (van Tassel et. al., 1987). Clearly spoken speech has greater temporal amplitude
modulation than conversational speech (Krause & Braida, 2002; Liu et. al., 2004; Liu & Zeng,
2006). Compared to clearly spoken speech, the boundaries between syllables are not as distinct
in conversationally spoken sentences. In conversational speech the plosive bursts are either
omitted (Picheny et. al., 1986, Krause & Braida, 2004) or slurred together (Byrd & Tan, 1996).
The faster articulation rate of conversational speech leads to fewer and smaller gaps between
syllables and words, which translates to a shallower depth for modulation frequencies below 3-4
Hz than clearly produced speech (Krause & Braida, 2004). Conversational speech does not
obliterate the tempo-intensity cue for phonemic identification, but it could make this cue slightly
less distinctive. Although listeners with normal hearing rely on other acoustic cues to correctly
identify consonants when these tempo-intensity cues are compromised (Christensen & Humes,
1997), listeners with hearing impairment rely heavily on these tempo-intensity cues (Lindbolm
et. al., 1988; Summers & Leek, 1992).

47
2.3.2.3 Spectro-Temporal Cues
Spectro-temporal cues occur when frequency varies as a function of time. Voice onset time
(VOT) and formant transitions are two examples of spectro-temporal cues. The dynamic formant
movement has been shown to influence listeners’ perception of consonants (Delattre et. al.,
1955) and vowels (Hillenbrand et al., 1995). In conversational speech the vowel space, which is
measured by the frequency area between the first and second formants of uttered vowels, is
reduced when compared to clearly produced speech (Picheny et. al., 1986; Moon & Lindblom,
1994; Ferguson & Kewley-Port, 2002). Ferguson and Kewley-Port (2002) analyzed the acoustic
properties of 10 vowels uttered by a single speaker in both a conversational and clearly spoken
manner. They found that the magnitude of the dynamic formant (F1 and F2) movement (amount
of formant frequency change over time) was significantly smaller in conversationally produced
speech than clearly produced speech. The combination of the shorter duration of conversational
speech and the smaller vowel space of the speaker’s formant variability alters the duration and
slope of the formant transitions. Normal-hearing listeners give greater perceptual weight to rapid
formant transitions than the other acoustic cues in identifying consonants (Lindholm et. al., 1988;
Hedrick & Jesteadt, 1996; Hedrick & Younger, 2001, 2007). Hearing-impaired listeners can
perceive and use the rapid formant transitions, but their contributions to speech intelligibility are
smaller than that for normal-hearing listeners. Hedrick and Younger (2007) demonstrated that
hearing-impaired listeners performed similarly to normal-hearing listeners on the use of formant
transitions to identify /p/ in a quiet listening environment. Once the formant transition was
degraded by background noise or reverberation, the hearing-impaired listeners gave formant
transitions less perceptual weight while normal-hearing listeners continued to use the transition
information to identify phonemes. The shortening of formant transitions during conversational

48
speech could degrade this frequency-temporal cue for hearing-impaired listeners so that they
may no longer rely on it for phonemic perception.
In their acoustical analysis of clear and conversational speech, Picheny et. al. (1986)
found that VOT was shorter for speech spoken in a conversational manner. For conversational
speech, the VOT in stressed word-initial voiceless plosives was an average of about 80 ms as
opposed to an average of 160 ms for clearly produced speech. Previous studies have reported
shorter VOTs for voiceless plosives in speech spoken at a conversational rate (Klatt, 1975). Klatt
(1975) reported an average VOT value of 47 ms for /p/ in the word-initial position (as in “pat”),
and 12 ms for /p/ in the word-initial consonantal cluster of /sp/ (as in “spoon”). Krause and
Braida (2004) also analyzed VOT differences in their corpus of conversationally and clearly
spoken sentences by two speakers with public speaking experiences. The two speakers were
chosen because they were able to produce “clear” speech at a conversational speaking rate of 200
words per minute. These were the same speakers that were used in their previous study which
demonstrated that there is a 14 point intelligibility advantage in speech spoken clearly even when
it is spoken at the same rate as speech produced in a conversational manner (Krause & Braida,
2002). The authors found that of the two speakers analyzed, only one had shortened his/her word
initial voiceless stop consonants’ VOT in conversational speech (Krause & Braida, 2004). Since
VOT tends to be shortened in conversationally spoken speech, it is likely that envelope onset
asynchrony (EOA) also is affected in that the high frequency band containing the burst and
aspiration are closer to the onset of the voicing of the vowel for voiceless plosives.
In conclusion, conversationally spoken speech varies greatly from clearly produced
speech. Although the increase of articulation rate is the most apparent difference between clear
and conversational speech, it does not account for total reduction of speech intelligibility

49
(Picheny et. al., 1989; Uchanski et. al., 1996; Krause & Braida, 2002, 2004; Lui & Zeng, 2006).
Conversational speech contains the very same static and dynamic acoustic cues as clearly
produced speech, but the distinctiveness of these cues is degraded. When assessing either a
listener’s real-world speech intelligibility or the impact a signal processing scheme has on speech
intelligibility, it is important to choose speech stimuli that represent the acoustic properties of
conversational speech.
2.4 DIGITAL SIGNAL PROCESSING AND THE SPEECH SPECTRUM
Listeners with mild-moderate hearing impairment use the spectral, intensity, and temporal
patterns in speech as cues for speech recognition. It is important to consider how amplification
devices and signal processing schemes can manipulate and change these acoustic properties.
There is a volume of literature examining the effects of various algorithms such as wide dynamic
range compression, noise reduction algorithms, and adaptive directional microphones on speech
perception in hearing-impaired listeners (Ricketts & Henry, 2002; Souza, 2002; Chung, 2004;
Souza, Jenstad, & Folino, 2005; Jenstad & Souza, 2005; Palmer, Bentler, & Mueller, 2006;
Bentler & Chiou, 2006). These algorithms can affect the amplitude envelope cues and spectro-
intensity cues of speech, and can be deleterious to individuals with more severe hearing
impairment. However, underneath these algorithms lies a source of signal distortion that is not as
well studied. The digital signal processing (DSP) chip, which is inherent to every hearing aid
sold in the United States today, introduces a delay to the speech signal that could possibly disrupt
some of the spectro-temporal cues found in speech.

50
The delay at the output of digital hearing aids is a result of the combination of converter
delay and processing delay. Converter delay is the delay caused by the analog/digital converter,
which delays the signal approximately 0.7 ms across the spectrum of the incoming signal.
Processing delay is defined as the resultant delay arising from the DSP algorithm that divides the
signal into different frequency bands. Processing delay can be defined as either spectrally
synchronous or spectrally asynchronous depending on the algorithm employed. Kates (2005)
described three basic types of digital processing. First, there are DSP circuits that employ a time
domain filter bank algorithm to divide the incoming signal. Time domain filtering introduces a
spectrally asynchronous delay that delays the low frequency output relative to high frequency
output. A second type of signal processing uses frequency domain filtering or fast Fourier
transforms (FFT) to divide the incoming signal. FFT technique buffers or stores the incoming
signal for analysis. The resultant output of a DSP circuit employing FFT has a spectrally
synchronous delay, meaning all frequencies are delayed a value determined by the size of the
input buffer. A third DSP employs digital frequency warping. Warping combines the use of
overlapping all-pass filters and FFT. Digital frequency warping introduces a spectrally
asynchronous delay that delays the low frequency information relative to the high frequency
information.
Figure 2-11(a-d) displays the delay values of four brands of digital hearing aids fit with a
closed-earmold: Siemens Triano, Widex Diva, Phonak Claro, and Resound Canta. Each hearing
aid was programmed to the NAL-NL1 target for a 50 dB flat hearing loss. Two hearing aids of
each manufacturer were used for test/retest reliability purposes. These measurements were taken
from the ear canal of the Knowles Electronic Mannequin for Acoustic Research (KEMAR) who
was fit with each hearing aid. The recordings for these measurements were obtained using an

51
Etymotic Research ER-11 microphone and a Zwislocki coupler inside of KEMAR. In an
anechoic chamber, KEMAR was positioned in front of a loudspeaker at 0° azimuth. The delay of
the amplification device was measured by subtracting the arrival time at the microphone of an
impulse sound generated from a speaker without a hearing aid present from the arrival time of
the impulse sound at the microphone with a functional hearing aid present. The Siemens Triano
and Widex Diva hearing aids, which employ a time-domain filter bank algorithm, show signs of
spectrally asynchronous delays with the low frequencies delayed relative to the high frequencies,
while Phonak Claro and Resound Canta hearing aids with frequency domain filtering algorthms
displayed a constant delay value across all frequencies. These delay values agree with those
reported by Dillon and his colleagues in 2003.

52
Figure 2-11: Measured delay values for a) Siemens Triano BTE b) Widex Diva BTE c) Phonak Claro BTE and d) Resound Canta BTE. The x-axis displays frequency in Hz and the y-axis displays delay values in ms.
In addition to digital delay, there may be a physical delay caused by the fitting of the
hearing aid. With advances in feedback cancellation algorithms, audiologists are able to fit
digital hearings with an open-fit earmold. The advantages of the open-fit platform include
minimal occlusion and provision of amplification only in the region of hearing loss for
individuals with primarily a high frequency hearing loss. Open fit earmolds allow for two
pathways of sound transmission to the eardrum. The openness of the earmold allows the natural

53
direct pathway of sound to reach the eardrum directly. All frequencies reach the eardrum, but the
high frequency energy is attenuated by the high frequency hearing loss of the listener (Mueller &
Ricketts, 2006). Amplified high frequency energy is delivered to the ear via the digital hearing
aid by the open-fit earmold. The arrival time of the amplified high frequencies is delayed relative
to the sound that arrived at the eardrum via the direct pathway. As the low frequencies are the
most, and often times the only frequencies, audible to hearing-impaired listeners from the
unamplified direct pathway, there is a an asynchronous delay between the low frequencies and
the amplified high frequencies at the tympanic membrane.
As a result, the sound at the eardrum is spectrally asynchronous due to the combination of
the direct air conduction pathway and the output of the digital hearing aid. Figure 2-12 shows
measurements of the effects of an open-fit earmold on the delay values at the output of the
amplification device. These measurements were taken from the ear canal of the Knowles
Electronic Mannequin for Acoustic Research (KEMAR) who was fit with the same hearing aid
twice, once with an occluding earmold, and then with an open fit earmold. The recordings for
this measurement were obtained using an Etymotic Research ER-7 microphone and a Zwislocki
coupler inside of KEMAR. In an anechoic chamber, KEMAR was positioned in front of a
loudspeaker at 0° azimuth. The relative delay of the amplification device was measured by
subtracting the arrival time at the microphone of an impulse sound generated from a speaker
without a hearing aid present from the arrival time of the impulse sound at the microphone with a
functional hearing aid present.
A MATLAB code calculated the relative delay between the peak-to-peak amplitude of
the impulse sound between unaided and aided conditions. With an occluding earmold, there is a
flat delay of the acoustic signal to the ear of 6.5 ms between 500 and 8000 Hz. The same hearing

54
aid fit with an open-fit earmold generated a spectrally asynchronous delay with essentially no
delay up to 2000 Hz, then abrupt rise to a 6.5 ms delay through 6000 Hz. There is no delay in the
low frequencies because the direct pathway of sound via the open-fit earmold causes the peak
amplitude between unaided and open-fit aided condition to occur at the same time. The peak
amplitude for the high frequencies is the delayed output of the hearing aid device. This does not
mean that all high frequency energy is delayed in an open fit hearing aid. Unamplified high
frequency energy does enter the ear canal, but the equation for calculating relative delay only
uses the measured maximum peak amplitude of each frequency as the arrival time. A third
measurement was made with the open-fit hearing aid turned off. This measurement shows that
the direct pathway of sound to the ear canal is not delayed relative to a true open ear with no
hearing aid present (Figure 2-12). However, this unamplified high frequency energy, though not
delayed, is not audible to hearing-impaired listeners most of the time. The resulting delay of the
audible high and low frequency energy of the input signal is spectrally asynchronous.
Recently, with the advent of aggressive feedback cancellation algorithms, more clinicians
are opting for open-fitting schemes for their patients. The open-fit amplification device delivers
amplified high frequency energy to the ear, while the audible low frequency energy travels
through the open ear canal. This hearing aid style is an attractive solution for the sloping high-
frequency hearing loss that is commonly caused by aging and noise exposure. Due to the rise in
the popularity of open fit hearing aids, manufacturers are inventing hearing aid devices
specifically designed for the open-fit platform.

55
Figure 2-12: The real-ear measurements showing the delay as a function of frequency with a closed- fit and an open-fit earmold attached to the same hearing aid. The x-axis displays frequency and the y-axis displays the delay values of the hearing device. For the open-fit earmold the high frequencies were delayed by the DSP hearing aid, causing a spectrally asynchronous delay.
Consequences of Acoustic Delay—A brief review of the literature 2.4.1
Recently, with the increase in digital hearing aid products and open fitting schemes, researchers
have been interested in quantifying the deleterious effects of acoustic delay. Although the
research literature examining the effects of acoustic delays on speech perception and production
is variable (See Table 2-2 for a review of findings), there is a conclusion that spectrally
asynchronous delays are more detrimental than spectrally synchronous delays to the listener’s
tolerance and performance (Greenberg, Arai & Silipo 1998; Grant & Greenberg, 2001; Stone &
Moore 2003).
Stone and Moore conducted a series of studies (1999, 2002, 2003, 2005, 2008) to
examine the perceptual consequences of acoustic delay. In their studies they used three different
Del
ay (m
sec)

56
outcome measures: a 7-point rating scale to rate the subjective perception of annoyance due to
acoustic delay, a vowel-consonant-vowel (VCV) identification task, and a speech production
measure. For each outcome measure, a different tolerable delay value was obtained. Overall their
results indicated that increasing auditory delay has a negative impact on listeners’ perception.
Specifically, their results indicated that participants are least tolerant of the qualitative effects of
spectrally asynchronous acoustic delays. Participants rated delays as short as 9 ms as disturbing,
even though the acoustic delays did not begin to disrupt the participants’ speech identification
abilities until about 15 ms (Stone & Moore 2003). Speech production was not affected by
spectrally asynchronous delays, but it was affected by synchronous delay greater than 30 ms
(Stone & Moore, 2002, 2003). When Stone et al. (2008) manipulated asynchronous delay so that
it was similar to the delay introduced by an open-fit hearing aids, results indicated that listeners
were even less tolerant of delay with values of 5-6 ms being rated as disturbing.
Many studies involving acoustic delays used sentence materials as the measure of
intelligibility performance. Greenberg et al (1998) found that speech recognition performance is
relatively unaffected until the acoustic delay exceeds 50 ms. The increased tolerance for
spectrally asynchronous delays is most likely due to the acoustic redundancy found in sentence
material as opposed to the VCV clusters used by Stone and Moore. Despite this increase of
acoustic redundancy, listeners are still affected by these delays. Acoustic delays interfere with
auditory-visual speech recognition (Grant & Seitz, 2000). For auditory-visual speech perception,
the allowable delays can be as much as 160 ms before speech recognition of sentences
deteriorates (Grant & Greenberg, 2001).
It is important to note the type of acoustic delay the above researchers used in their study.
Stone and Moore used synchronous delay values (1999, 2002, 2005), a spectrally asynchronous

57
delay with the low frequencies being more delayed than high frequency energy (2003), and a
spectrally asynchronous delay with the high frequencies being delayed relative to low
frequencies (2008). Grant and Greenberg (2001) and Greenberg et al (1998) generated spectrally
asynchronous sentence stimuli in which two mid frequency energy bands were delayed relative
to two lateral bands of energy. Grant and Seitz (2000) used synchronous delay values in testing
auditory-visual perception. Although these studies give information about the effects of
spectrally-asynchronous delays, only one (Stone et al., 2008) introduced signal manipulations
that mimic the acoustic delay values at the output of an open fit digital hearing aid. The resultant
delay of an open-fit device is asynchronous in that the amplified high frequency energy above
2000 Hz is delayed, while the low frequency energy is not delayed at all (Figure 2-12). This
single study indicated that listeners might be more susceptible to the subjective consequences of
this type of delay. It would be useful to know if there are any objective consequences of such a
delay.
Table 2-2: Review of research regarding the impact of auditory delay
Reference Outcome Measure Stimuli Type & Presentation Modality
Type of delay Hearing function of
subjects
Maximum tolerable delay
McGrath & Summerfield, 1985
Performance on a sentence recognition task
Video recorded sentence material with and auditory presentation of F0 pulse train Presented Auditory-Visually
Spectrally synchronous
Normal hearing subjects
40 ms
Grant & Seitz, 1998
Performance on a sentence recognition task in background noise
Auditory and Video recorded sentence materials with a fixed SNR Presented Auditory-Visually
Spectrally synchronous
Mild to severe sloping sensorineural hearing loss
200 ms

58
Arai & Greenberg, 1998
Performance on a sentence recognition task
Audio recorded sentence material filtered in to 19 ¼ octave channels Presented Audition only
Spectrally asynchronous These 19 channels were then delayed with respect to each other to create “jittered” speech
Normal hearing subjects
140 ms
Greenberg, Arai, & Silipo, 1998
Performance on a sentence recognition task
Audio recorded sentence material then filtered into 4 1/3 octave bands Presented Audition only
Spectrally asynchronous delays with the mid frequency bands varied relative to the lateral bands
Normal hearing subjects
50 ms
Stone & Moore, 1999
7 point rating scale of disturbance due to delay of acoustic signal
Subjects listened to a recorded passage of read text Presented Audition only
Spectrally synchronous
Normal hearing subjects with simulated hearing loss
20 ms
Agnew & Thornton, 2000
Subjects manually adjusted the amount of group delay introduced by the aid by adjusting a slider on a computer. Subjects adjust the amount of delay until they were just able to notice the delay and further increased the delay until they reported it to be “objectionable”
Subjects spoke and rated the effect of delay on the sound of their own voice.
Spectrally synchronous
Normal hearing
3-5 ms was “noticeable” > 10 ms was “objectionable
Grant & Greenberg, 2001
Performance on a sentence recognition task
Auditory and Video recorded sentence materials Audio consisted of two spectral slits rather than the full bandwidth of speech
Spectrally synchronous
Normal hearing subjects
160 ms

59
Stone & Moore, 2002
7 point rating scale of disturbance due to delay of acoustic signal Laryngographic measures of speech production
Subjects read aloud a passage of written text Presented Audition only
Spectrally synchronous
Normal hearing subjects
20 ms for disturbance rating 30 ms for speech production disruption
Stone & Moore, 2003
7 point rating scale of disturbance due to delay of acoustic signal Speech perception performance score Measurement of speech production rates
Subjects read aloud a passage of written text VCV syllables for speech perception measures Presented Audition only
Spectrally asynchronous delays Low frequencies were delayed relative to high frequencies
Symmetric, bilateral moderate sensorineural hearing loss
9 ms for disturbance rating 15 ms for decreased performance on VCV identification task Speech production was not affected by the delays introduced in this study
Stone & Moore, 2005
7 point rating scale of disturbance due to delay of acoustic signal
Subjects read aloud a passage of written text
Spectrally synchronous
Symmetric, bilateral sensorineural hearing loss
Slight HL = 23 ms Mild HL = 15 ms Moderate HL =32 ms
Stone, Moore, Meisenbacher, & Derleth, 2008
7 point rating scale of disturbance due to delay of acoustic signal
Subjects listened to 5 second recordings of continuous discourse
Spectrally synchronous & Spectrally asynchronous simulating the delay found in open-fit hearing aids
Normal hearing subjects One condition involved a simulated hearing loss
5-6 msec for gain plus spectrally synchronous delay 5 msec for spectrally asynchronous delay with a 2k Hz high frequency delay Results for simulated hearing loss and high frequency delay/gain inconclusive
Envelope Onset Asynchrony (EOA) is the time asynchrony between high and low
frequency energy onset in naturally produced speech (Yuan et al., 2004). Voiceless CVs tend to

60
have positive EOA so that high frequency energy onset precedes low frequency energy. If you
manipulate the EOA of a naturally produced voiceless CV by delaying the high frequency energy
onset, the perception changes to that of its voiced cognate (Ortmann et al., 2010). It may be
possible that the introduction of the asynchronous delay by the open fitting platform could
interfere with the wearer’s perception of voicing. The audible low frequency energy of the
syllable /pa/ could travel via the ear canal and arrive at the eardrum prior to the arrival of the
amplified high frequency energy thus causing the perception to be more like /ba/. Further
research in which the asynchronous delay is manipulated in a similar fashion to digital hearing
aid devices needs to be conducted in order to confirm this hypothesis.
Summary and Empirical Question 2.4.2
The review of speech perception research points to many acoustic cues used by listeners to aid in
phonemic recognition. The output of the human articulator contains acoustic patterns that vary in
frequency, intensity, and time. The structured variance of these dimensions with respect to one
another form the cues listeners use to perceive speech. In reviewing the literature on the speech
perception ability of normal-hearing listeners and hearing-impaired listeners with mild-moderate
sensorineural hearing loss, it was found that in quiet listening environments both groups of
listeners use the same acoustic cues for speech perception. Hearing-impaired listeners tend to
rely on temporal, tempo-intensity, and some spectro-temporal properties of speech for speech
perception (Johnson et al., 1984; Lindholm et al., 1988; Turner et al., 1995, Ortmann et al.,
submitted).
In everyday situations hearing-impaired listeners are exposed to conversationally spoken
speech that is different from the clearly spoken speech or synthetic speech that is used in

61
audiometric speech perception tests. The most obvious acoustical differences between clearly
produced and conversationally spoken speech are the faster articulation rate and fewer pauses of
conversational speech (Picheny et al., 1986; Uchanski et al., 1996; Krause & Braida, 2002; Liu
& Zeng, 2006). In addition to the fast rate of conversational speech, there are acoustic alterations
at the phonemic level. The spectral bursts of word-final plosive consonants are often times
shortened or omitted (Picheny et al., 1986), the temporal distinction or gaps between syllables
and words are smaller (Picheny et. al., 1986; Byrd & Tan, 1996), and the dynamic spectro-
temporal cues, such as formant transitions and voice onset time are shorter (Picheny et. al., 1986;
Ferguson & Kewley-Port, 2002, 2004). The degradation of these acoustic cues by conversational
speech increases perceptual ambiguity by hearing-impaired listeners (Picheny et. al., 1985;
Payton et. al., 1994;). While normal-hearing listeners can capitalize on the redundancy of these
cues, hearing-impaired listeners are not as fortunate.
When assessing the effect of current signal-processing schemes on speech intelligibility,
it is important to use conversational speech as stimuli in order to not only capture the “real
world” hearing aid benefit by the hearing-impaired listener, but also to see the interaction
between the hearing device and conversational speech’s rapidly changing acoustics. One possible
interaction stems from the digital delay introduced by digital signal processing in combination
with open-fitting schemes. It is hypothesized that these spectrally asynchronous delays disrupt
the temporal cues hearing-impaired listeners need to accurately perceive conversational speech.
This review of the literature leads to the following question.
♦ Does the introduction of spectrally asynchronous delay that is similar to the delay
introduced by open-fit digital hearing aids, lead to poorer speech intelligibility of
conversationally spoken speech by mild-moderate hearing-impaired listeners?
• If so, how much spectrally asynchronous delay can be tolerated before
speech intelligibility is affected?

62
3.0 METHODS
In order to answer the aforementioned empirical questions, careful consideration was taken to
ensure that the proposed project would be constructed so that variability due to extraneous
factors would be minimized. A Pre-Experiment validated the stimuli used in the Main-
Experiment that focuses on the question, “Does the introduction of spectrally asynchronous
delay that is similar to the delay introduced by open-fit digital hearing aids, lead to poorer speech
intelligibility of conversationally spoken speech by mild-moderate hearing-impaired listeners?”
The following section outlines the characteristics of the speech stimuli, signal processing
conditions, study participants, and procedures for administration of the protocol for both the Pre-
Experiment and the Main-Experiment. A description of the statistical analysis and a list of the
possible outcomes are presented.
3.1 PRE-EXPERIMENT
Speech materials 3.1.1
The speech materials used for this research study are the sentences from the revised Speech
Perception in Noise (r-SPIN) test (Bilger, Nuetzel, Rabinowitz, & Rzeczkowski, 1984). The r-
SPIN consists of eight lists of 50 sentences. Within each list are 25 high predictability and 25

63
low predictability sentences. High predictability sentences are those in which sentence context
serves as a cue for determining the final monosyllabic word of the sentence. An example of a
high predictability sentence is “The doctor prescribed the DRUG”. Using sentence context,
listeners can identify the final word as “drug” even if the acoustical properties of the word are
degraded by background noise. A low predictability sentence provides limited linguistic context
to cue the final word. For example, “She has known about the DRUG” is a low predictability
sentence. Lack of contextual cues will make the final word harder to identify than when it is in
the high predictability sentence. Although the word “drug” is the same in both sentences,
listeners are more reliant on the acoustic characteristics of the word when it is in the low
predictability sentence. Because the purpose of this research study is to see whether the
acoustical consequences of spectrally asynchronous delay impact speech intelligibility, only the
25 low predictability sentences from each of the eight lists were used. This ensured that the
listeners relied on acoustic cues for speech perception, not sentence context. Appendix A
includes all of the low predictability sentences in their appropriate list.
Sentence material, as opposed to single word lists, was chosen so that the stimuli would
best reflect conversational speech. Sentences also capture word and syllabic boundaries, which
could be less distinct with the addition of spectrally asynchronous delay. The r-SPIN sentence
materials were chosen not only because of the ability to control for the use of sentence context,
but also because all of the sentences have been subject to rigorous psychometric testing to
control for word familiarity, word frequency, prosodic factors, and phonetic content within and
across each list of sentences (Kalikow, Stevens, & Elliot, 1977; Bilger et. al., 1984).
In the development of the SPIN, Kalikow and his colleagues (1977) formed an initial
corpus of 1,148 homogenous sentences constrained to 5-8 words and 6-8 syllables each. These

64
sentences were constructed so that 669 sentences had a highly predictable final monosyllabic
word and 479 sentences had low predictability for identification of the final word. All the words
were controlled for word frequency in the English language. After conducting several speech
perception tests with these sentences using normal- hearing listeners as participants, the authors
threw out several hundred sentences due to either poor intelligibility of the sentences or low key
word familiarity. The authors also ensured that phonetic content of the sentences and final
keywords were typical of conversational language. The final products of this culling process
were eight equivalent lists of 50 low and high predictable sentences (Kalikow et. al., 1977).
Bilger and his group (1984) revised the original SPIN to ensure list equivalency among the low
probability sentences. They also standardized the test with + 8 signal to noise ratio on 128
listeners with sensorineural hearing loss.
Kalikow et. al. (1977) compared the intelligibility of key words in high versus low
predictability context presented with a signal to noise ratio of +10 dB. For a group of 81 normal-
hearing listeners, the average score for low predictability (LP) key words was 88% correct. If the
LP sentences were given to normal –hearing listeners in a quiet environment, the average score
should be greater than 88%. This study’s recorded LP sentences were presented to a group of
normal-hearing listeners to ensure that the key words of the sentences were intelligible under
optimal conditions.
Conversational recordings 3.1.2
A single male speaker with experience in radio and television public speaking was used for the
recording of the LP sentence materials. The speaker was seated in a sound treated booth with his
mouth 8 inches away from a mounted Audio-Technica cardiod-dynamic microphone (bandwidth

65
= 60 to 13,000 Hz). The microphone was routed to a Panasonic digital recorder with settings for
a mono recording at a 44.1 kHz sampling rate. The sensitivity of the microphone was adjusted to
prevent any peak clipping of the speaker’s voice. The speaker was instructed to say each
sentence at least four times. For the first sentence utterance, the speaker was instructed to read
the sentence aloud in a clear manner. The following instructions from Schum (1996) were given.
“Imagine that you are speaking to a person that you know is hearing-impaired.
I want you to speak as clearly and precisely as possible. Try to produce
each word as accurately as you can.”
Once the satisfactory recording of a clearly produced sentence was made, as indicated by
the speaker speaking slowly, carefully enunciating each word, then he was instructed for
conversational speech. The speaker was told to memorize the sentence, and to say each sentence
within conversation three times. He was instructed as follows.
“Speak naturally as you would in conversation with your friends.
Conversational speech is different from the clearly spoken speech
you used before. For example, you tend to talk faster in conversation.
Keep this in mind as you say these sentences again. I want you to
sound as natural and conversational as possible.”
For each sentence, the speaker was engaged in a conversation about the sentence. He said
the sentence as memorized and immediately followed the sentence with another, so as to keep
the natural flow of conversation. For example, if the sentence was “I was considering the crook”,
the speaker said, “I was considering the crook. He broke into my house the other day.” Not only
does the additional sentence kept the natural flow of conversation, but it also minimized the
speaker’s tendency to stress the final spoken word. The second sentence was given to the speaker

66
and was 10-12 syllables in length, so that all of the sentence pairs were similar in syllabic
structure. The speaker was not given any guidelines as to how fast or “conversational” he should
speak. Krause and Braida (2002, 2004) showed that there are individual differences in the
articulation rate of conversational speech. The rules for the recording were that it must sound as
natural as possible, that it must be spoken effortlessly, and that it is faster than his clear speech
productions. When the recording session was complete, there were four recordings (one sentence
will be clearly spoken and the three others will be spoken conversationally) of each of the 200
sentences.
Analysis of Conversational Speech 3.1.3
All soundfiles were edited in Adobe Audition 2.0. For each sentence recording, the
soundfiles were low pass filtered (10 kHz cutoff) to remove any high frequency noise. The single
clear production and the three conversational productions of each sentence were excised and
saved in individual files. For each sentence, only one of the three conversational productions was
chosen as the final sentence stimulus. The determinants for the final conversational recording
stimulus were the speaking rate (words per minute, wpm), the articulation rate (syllables per
second, syl/s), vowel duration, and VOT. Picheny et. al. (1986) found that the average rate of
conversationally spoken speech was 200 wpm. Krause and Braida (2002) found that some talkers
spoke conversationally at rates up to 315 wpm. The conversationally spoken sentences chosen to
be part of the stimuli had average speaking rates between 200 and 315 wpm. These sentences
were analyzed further with measurements of vowel duration and VOT. Ferguson and Kewley-
Port (2002) reported that the vowel duration of conversational speech is roughly 50% that of
clear speech. The VOT of word-initial voiceless plosives is shortened in conversational speech as

67
well (Klatt, 1975; Picheny et. al., 1986; Krause & Braida, 2004). The chosen conversational
sentence presented vowel durations that were roughly half that of its clearly produced
counterpart and a measureable decrease in the VOT of voiceless plosives. The speaking rate,
vowel duration, and VOT of each of the recordings, clearly spoken, conversationally spoken, and
the original r-SPIN recordings (Bilger et al., 1984) were analyzed and compared for differences.
Picheny et al. (1986) reported that word-final plosives sometimes are not released in
conversational speech. As the listeners are being scored on the recognition of the final key word
of the r-SPIN LP sentences, it was a criterion that the final word had to contain acoustic cues for
every phoneme in the word. The change in speaking rate and durations of vowels and VOT, as
well as the availability of phonemic cues in the final word served as the criteria for choosing
each of the conversationally produced token of the r-SPIN LP test items. Once each sentence was
chosen, the intensity levels were equated on average RMS via Adobe Audition. Each sentence
was assigned into the appropriate equivalent list designated by Kalikow and colleagues (1977).
There were 8 lists of 25 sentences for a total of 200 conversationally spoken sentences (see
Appendix A). These 200 conversationally spoken sentences were presented to 15 normal-hearing
listeners to test for the intelligibility of the final target word of each sentence.
Subjects 3.1.4
Fifteen normal-hearing participants were tested for the validation of the conversationally
recorded sentences. The participants were recruited from the community of the St. Louis area, as
well as from the caseloads of the Washington University School of Medicine Adult Audiology
Clinic. All participants were between the ages of 19-30 years old (mean age = 23). The
participants were excluded if they were not native speakers of English and/or if they reported

68
having recent middle ear pathology, otologic surgery, and/or neurologic pathology. The
participants were not excluded on the basis of race or gender. All participants will be given
informed consent in accordance with the guidelines of the Institutional Review Board (IRB) of
both Washington University in St. Louis, Missouri and University of Pittsburgh in Pittsburgh,
Pennsylvania. In addition to the aforementioned age and case history criteria, these participants
all had audiometric thresholds less than 15 dB from 250 Hz through 8 kHz in both ears and word
recognition scores of the Northwestern University monosyllabic word lists (NU-6) within the
90% confidence limit based on their pure tone average (Dubno, Lee, Matthews, Mills, & Lam,
1995).
Procedure 3.1.5
All participants were screened after obtaining informed consent. Only after signing the consent
form were they considered enrolled in the study. A self-report case history questionnaire
(Appendix B) was administered to inquire into the participants’ general health, history of hearing
loss and/or middle ear disease, otologic surgery, and neurologic disorder. To determine auditory
status, a standard audiometric test battery was completed. This included bilateral air and bone
conduction threshold testing at the standard audiometric frequencies (ASHA, 1978), and word
recognition testing with the Auditec recording of the Northwestern University Test #6 (NU-6)
word lists (Tillman & Carhart, 1966). All of the equipment used to perform the tests of auditory
function was calibrated according to the appropriate ANSI standards. All testing was conducted
in test rooms that meet the ANSI standards for maximum background noise.
Once the participants were confirmed to have normal hearing and met all of the
inclusionary criteria, they participated in the listening task. The listeners were seated in an
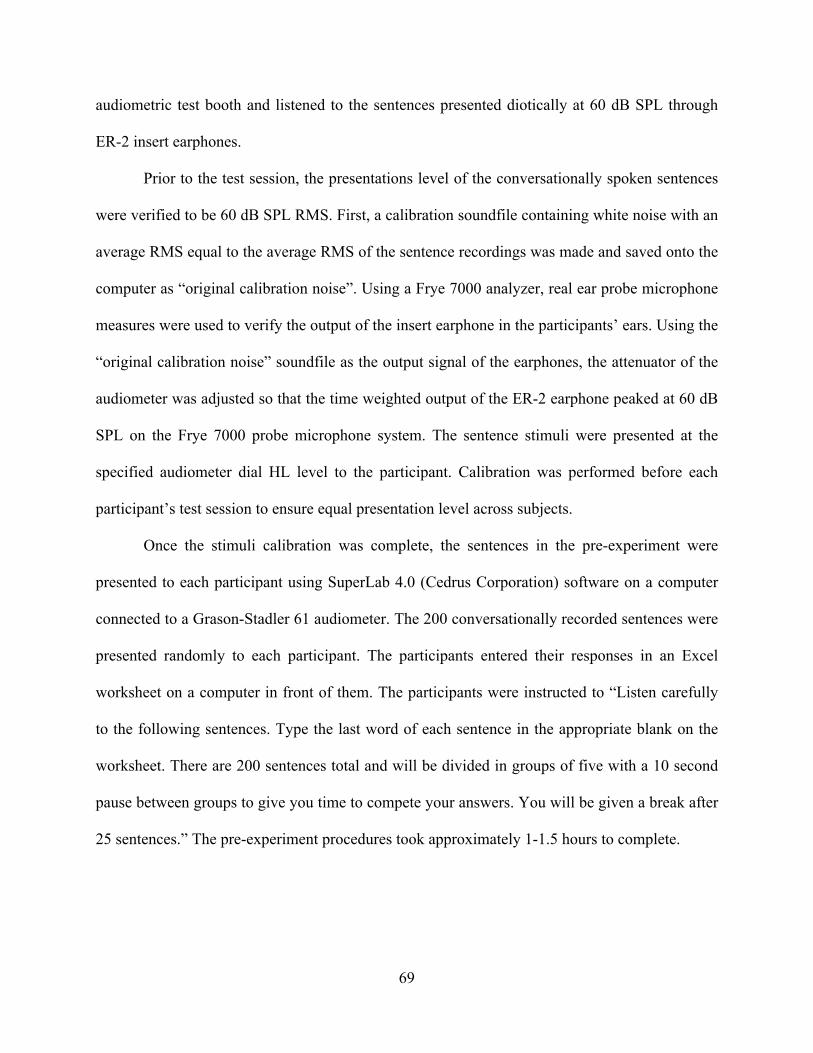
69
audiometric test booth and listened to the sentences presented diotically at 60 dB SPL through
ER-2 insert earphones.
Prior to the test session, the presentations level of the conversationally spoken sentences
were verified to be 60 dB SPL RMS. First, a calibration soundfile containing white noise with an
average RMS equal to the average RMS of the sentence recordings was made and saved onto the
computer as “original calibration noise”. Using a Frye 7000 analyzer, real ear probe microphone
measures were used to verify the output of the insert earphone in the participants’ ears. Using the
“original calibration noise” soundfile as the output signal of the earphones, the attenuator of the
audiometer was adjusted so that the time weighted output of the ER-2 earphone peaked at 60 dB
SPL on the Frye 7000 probe microphone system. The sentence stimuli were presented at the
specified audiometer dial HL level to the participant. Calibration was performed before each
participant’s test session to ensure equal presentation level across subjects.
Once the stimuli calibration was complete, the sentences in the pre-experiment were
presented to each participant using SuperLab 4.0 (Cedrus Corporation) software on a computer
connected to a Grason-Stadler 61 audiometer. The 200 conversationally recorded sentences were
presented randomly to each participant. The participants entered their responses in an Excel
worksheet on a computer in front of them. The participants were instructed to “Listen carefully
to the following sentences. Type the last word of each sentence in the appropriate blank on the
worksheet. There are 200 sentences total and will be divided in groups of five with a 10 second
pause between groups to give you time to compete your answers. You will be given a break after
25 sentences.” The pre-experiment procedures took approximately 1-1.5 hours to complete.

70
Data Analysis 3.1.6
Once all of the data from the pre-experiment were collected, the data for each listener were
converted into percent correct final-word identification. The data were then averaged across
listeners and compared to the average score obtained by Kalikow et al. (1977).
3.2 MAIN-EXPERIMENT
Stimuli 3.2.1
The purpose of the main-experiment was to examine whether spectrally asynchronous delay
affects the intelligibility of conversationally spoken sentences for hearing-impaired listeners. The
stimuli used in the main-experiment were the set of 200 conversationally spoken sentences that
was found to be intelligible by the group of normal-hearing listeners from the pre-experiment.
The stimuli were modified so that the acoustic properties mimic the asynchronously delayed
pattern of open-fit hearing aids. Figure 2-12 shows that the energy above 2 kHz is delayed in an
open-fit hearing aid. Armed with this information, a MATLAB code was written to create four
conditions in which the frequencies above 2 kHz were delayed by a specific value (0, 4, 8, or 32
ms) relative to the frequencies below the 2 kHz cut-off.

71
Simulated spectrally asynchronous delay 3.2.2
The steps for creating the asynchronously delayed sound files are depicted in Figure 3-1.
Each sentence was filtered into a high-pass energy and a low-pass energy band using a digital
finite impulse response (FIR) filter with an order of 50. Appendix C shows the magnitude and
the phase response of the FIR filters. A FIR filter was chosen because it does not distort the
phase of the signal. An order of 50 allows for stop-band attenuation with minimal ripple. The
high pass band was then amplified by 18 dB according to the 1/3 gain rule for a moderate high
frequency hearing loss of 55 dB. The 1/3 gain rule is used for many hearing aid prescriptive gain
targets. Following the flat 18 dB amplification of the high frequencies, a delay value of 0, 4, 8, or
32 ms was applied. Zero ms represented the condition with no added asynchronous delay. Four
and 8 ms are the conditions that are similar to the delay values of DSP hearing aids, whereas 32
ms is the condition in which a perceptual consequence of asynchronous delay is expected (Stone
& Moore, 2003).
Figure 3-1: Diagram of the acoustic modifications to each of the sentence stimuli. The + 18 dB gain
and delay pathway represents the DSP hearing aid pathway.

72
The amplified delayed high passed sound file was added to both the unamplified non-
delayed high-pass sound file and the low-pass sound file to create the final output of a sound file.
This output is similar to the acoustic pattern of sound at the eardrum of an open-fit hearing aid
wearer. The addition of the unamplified non-delayed FIR high-pass filter and the FIR low-pass
filter equals the input signal, thus representing the “natural pathway” of sound to the eardrum.
The amplified delayed FIR high-pass band represents the output of the hearing aid. This
MATLAB code allowed for manipulation of the high frequency band delay values while keeping
the “natural pathway” and the amplification value constant for all sentence stimuli. Table 3-1
outlines the prepared stimuli.
Table 3-1: Gain and delay values for each of the 200 r-SPIN Low Predictability Sentences
200 r-SPIN Low Predictability Sentences
200 r-SPIN Low Predictability Sentences
200 r-SPIN Low Predictability Sentences
200 r-SPIN Low Predictability Sentences
Gain value > 2 kHz
+18 dB +18 dB +18 dB +18 dB
Delay value > 2 kHz
0 ms 4 ms 8 ms 32 ms
Figure 3-2 displays a series of spectrograms for the conversationally spoken recording of
“Mr. Smith thinks about the CAP.” The top spectrogram (a) displays the original recording while
(b) displays the same sound file after a low-pass 50-order FIR filter at 2 kHz. The third
spectrogram (c) displays the output after a high pass 50-order FIR filter at 2 kHz. Figure 3-2 (d)
displays the same spectrogram as (c) only a delay of 32 ms and a gain of +18 dB was applied;
this spectrogram represents the “hearing aid” pathway of an open fit device. The bottommost
figure (e) represents the final sound file that was used as stimuli for the study. It is the

73
combination of spectrograms (b + c + d) and represents the sound that arrives at the eardrum via
the natural sound pathway and the hearing aid pathway. The yellow line that bisects all of the
spectrograms marks the onset of the high frequency band in the original recording. The 32 ms
delay onset of the high frequency band relative to the original recording is seen in figure (d).
Note that when the non-delayed (c) and delayed high frequency bands (d) are added together, the
gaps between syllable and words, particularly between “the” and the final word “CAP”, are
overlaid and reduced (e).
Figure 3-2: A series of spectrograms depicting the generation of the final stimuli for the conversationally spoken sentence, “Mr. Smith thinks about the CAP”. a) The original conversational recording b) the original recording with a LP FIR filter at 2 kHz applied c) the original recording with a HP FIR filter at 2 kHz applied d) the same sound file as (c) only with a 32 ms onset delay and a 18 dB gain applied, representing the hearing aid pathway of sound and d) the final sound file that served as the stimuli which is the combination of (b + c + d), representing the sound arriving at the ear drum with the combination of the natural pathway and the hearing aid pathway. Note the reduction of temporal gaps between syllables in (e).

74
In addition to the reduction of the gaps between words and syllables, the spectrally
asynchronous delay also caused a jitter or echo of spectral cues such as formant transitions.
Figure 3-3 displays the series of spectrograms for the sentence “I can’t consider the PLEA.” Just
as the previous figure (a) is the original file, (b) is the LP energy, (c) is the HP energy, (d) is the
HP energy with 18 dB gain and 32 ms delay, and (e) is the final stimuli constructed by adding (b
+ c + d). The formant transition in the final word “PLEA” in Figure 3-3 (e) is somewhat blurred
with a 32 ms spectrally asynchronous delay.
Figure 3-3: A series of spectrograms depicting the generation of the final stimuli for the conversationally spoken sentence, “I can’t consider the PLEA”. a) The original conversational recording b) the original recording with a LP FIR filter at 2 kHz applied c) the original recording with a HP FIR filter at 2 kHz applied d) the same sound file as (c) only with a 32 ms onset delay and a 18 dB gain applied, representing the hearing aid pathway of sound and d) the final sound file that served as the stimuli which is the combination of (b + c + d), representing the sound arriving at the ear drum with the combination of the natural pathway and the hearing aid pathway. Note the blurring of the formant transitions of “PLEA” in (e).

75
Spectrally asynchronous delays affect the voice-onset-time (VOT) of initial voiceless
plosives. Figure 3-4 shows the 32 ms asynchronously delayed stimulus construction of the
sentence, “We’re speaking about the TOLL.” In the original recording (a), “TOLL” has a VOT
of 20 ms, however when a 32 ms asynchronous delay is applied the VOT is -12 ms (e). Figure
3-5 shows the same sentence construction with a 8 ms asynchronous delay (e), making the VOT
of “TOLL” 12 ms.
Figure 3-4: A series of spectrograms depicting the generation of the final stimuli for the conversationally spoken sentence, “We’re speaking about the TOLL”. a) The original conversational recording b) the original recording with a LP FIR filter at 2 kHz applied c) the original recording with a HP FIR filter at 2 kHz applied d) the same sound file as (c) only with a 32 ms onset delay and a 18 dB gain applied, representing the hearing aid pathway of sound and d) the final sound file that served as the stimuli which is the combination of (b + c + d), representing the sound arriving at the ear drum with the combination of the natural pathway and the hearing aid pathway. Note the shorter VOT of “TOLL” in (e). The VOT in (a) is 20 ms while the VOT in (e) is -12 ms.

76
Figure 3-5: A series of spectrograms depicting the generation of the final stimuli for the conversationally spoken sentence, “We’re speaking about the TOLL”. a) The original conversational recording b) the original recording with a LP FIR filter at 2 kHz applied c) the original recording with a HP FIR filter at 2 kHz applied d) the same sound file as (c) only with a 8 ms onset delay and a 18 dB gain applied, representing the hearing aid pathway of sound and d) the final sound file that served as the stimuli which is the combination of (b + c + d), representing the sound arriving at the ear drum with the combination of the natural pathway and the hearing aid pathway. Note the shorter VOT of “TOLL” in (e). The VOT in (a) is 20 ms while the VOT in (e) is 12 ms
Figure 3-6 and Figure 3-7 depict the change in VOT for the key words “TANKS” and
“STAMP”. With an 8 ms spectrally asynchronous delay the spectral burst of the /t/ within each
word occurred at the onset of the vowel vocalization (compare (a) and (e) in both figures). Also,
for “STAMP” in Figure 3-7, the temporal gap between the /s/ and the /t/ was shortened.

77
Figure 3-6: A series of spectrograms depicting the generation of the final stimuli for the conversationally spoken sentence, “Paul hopes she called about the TANKS”. a) The original conversational recording b) the original recording with a LP FIR filter at 2 kHz applied c) the original recording with a HP FIR filter at 2 kHz applied d) the same sound file as (c) only with a 8 ms onset delay and a 18 dB gain applied, representing the hearing aid pathway of sound and d) the final sound file that served as the stimuli which is the combination of (b + c + d), representing the sound arriving at the ear drum with the combination of the natural pathway and the hearing aid pathway. Note the shorter VOT of “TANKS” in (e).
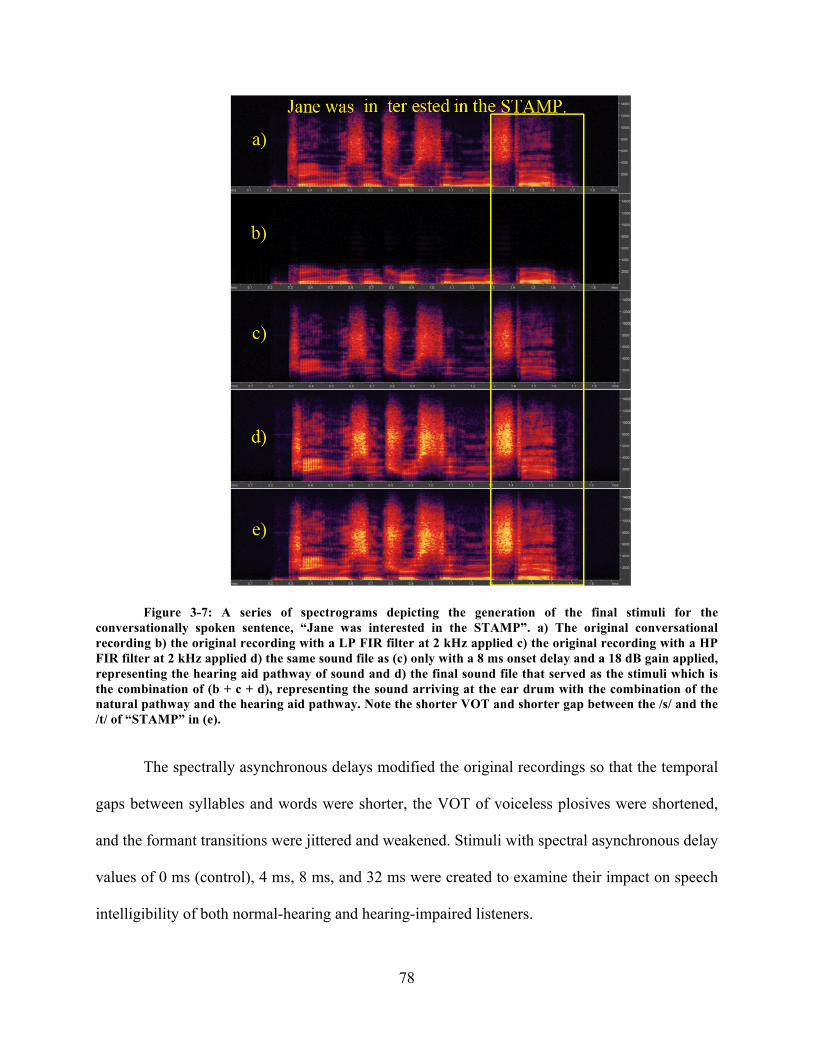
78
Figure 3-7: A series of spectrograms depicting the generation of the final stimuli for the conversationally spoken sentence, “Jane was interested in the STAMP”. a) The original conversational recording b) the original recording with a LP FIR filter at 2 kHz applied c) the original recording with a HP FIR filter at 2 kHz applied d) the same sound file as (c) only with a 8 ms onset delay and a 18 dB gain applied, representing the hearing aid pathway of sound and d) the final sound file that served as the stimuli which is the combination of (b + c + d), representing the sound arriving at the ear drum with the combination of the natural pathway and the hearing aid pathway. Note the shorter VOT and shorter gap between the /s/ and the /t/ of “STAMP” in (e).
The spectrally asynchronous delays modified the original recordings so that the temporal
gaps between syllables and words were shorter, the VOT of voiceless plosives were shortened,
and the formant transitions were jittered and weakened. Stimuli with spectral asynchronous delay
values of 0 ms (control), 4 ms, 8 ms, and 32 ms were created to examine their impact on speech
intelligibility of both normal-hearing and hearing-impaired listeners.

79
Subjects 3.2.3
Based on a moderate effect size, alpha set to 0.05, it was calculated that 12-32
participants are necessary to achieve a power level of 0.8. As the design of this experiment is a
repeated measures ANOVA, the degree of correlation between measures has a significant impact
on power. Because the same participants were tested under each of the 4 asynchronous delay
conditions (0 ms, 4 ms, 8 ms, and 32 ms), some degree of correlation is expected between
measures. Table 3-2 displays the relationship between the correlation between measures and
sample size necessary to achieve a power of 0.08. For this study, a correlation of 0.4 was chosen,
as it is not the weakest or strongest correlation. The correlation between measures will likely be
higher than 0.4 as it would be expected to have consistent ranking of participants across
conditions. Positing a correlation of 0.4 errs on the side of caution in case the data display a
weaker correlation than expected. Therefore 25 participants in each group were enrolled in the
main experiment examining the effects of asynchronous delay on the intelligibility of
conversational speech.
Table 3-2: Power analysis for Main Experiment
Moderate effect size, alpha = 0.05, power = 0.8
Value of Correlation Required Sample Size
0.2 32 0.3 29 0.4 25 0.5 20 0.6 17 0.7 12
The participants were recruited from the community of the St. Louis area, as well as from
the caseloads of the Washington University School of Medicine Adult Audiology Clinic. All

80
participants were between the ages of 21-65 years old (Average age = 57 years, sd = 7.2). Age-
related decline in auditory temporal processing has been shown to begin in the sixth decade of
life (CHABA, 1988). Dubno, Dirks, and Morgan (1982) found that a group of subjects over the
age of 65 with normal hearing required a higher articulation index than a group of younger
normal hearing subjects to achieve 50% recognition of the LP r-SPIN sentences in noise.
Therefore, the age of 65 served as the age cut-off for recruitment. The participants were excluded
if they were not native speakers of English and/or if they reported having recent middle ear
pathology, otologic surgery, and/or neurologic pathology. They also were excluded if they were
current hearing aid users to control for hearing aid experience. The participants were not
excluded on the basis of race or gender. All participants were given informed consent in
accordance with the guidelines of the Institutional Review Board (IRB) of both Washington
University in St. Louis, Missouri and University of Pittsburgh in Pittsburgh, Pennsylvania.
Appendix D contains the individual demographic data for all participants of the main
experiment.
The hearing-impaired participants for the main experiment presented high frequency
hearing loss consistent with candidates for open-fit amplification. Figure 3-8 displays the
average audiometric data for the hearing-impaired participants. All of the participants had
speech reception thresholds that were within 8 dB of their 3-frequency pure tone average (500,
1000, & 2000 Hz). The word recognition score of each participant was within the 90%
confidence interval according to his or her pure tone average (Dubno, et al., 1995).

81
Figure 3-8: Average audiometric data of the 25 hearing-impaired participants
The rational behind allowing more severe hearing losses past 4 kHz results from two
arguments. The first is the fact that the hearing loss of individuals with age-related high
frequency sensorineural hearing loss tends to continue a downward slope past 4 kHz. Including
these individuals will allow the data to generalize to this clinical population. Secondly, most
open-fit hearing aids on the market tend to roll-off amplification past 3-4 kHz. This is due in part
to the limited bandwidth of the hearing aids. With the advent of receiver in the canal (RIC) open-
fit devices, manufacturers claim that the bandwidth of amplification extends out to 6-8 kHz.
However test box measurements obtained by researchers at the University of Pittsburgh have
found that most RIC hearing aids do not have usable gain past 3-4.7 kHz. Table 3-3 compares
the measured bandwidth as defined as useable gain for a flat 50 dB hearing loss of both receiver
in the hearing aid with open fit tubing and receiver in the canal hearing aids by several
manufacturers with the reported bandwidth of the aids by their manufacturer. Regardless of
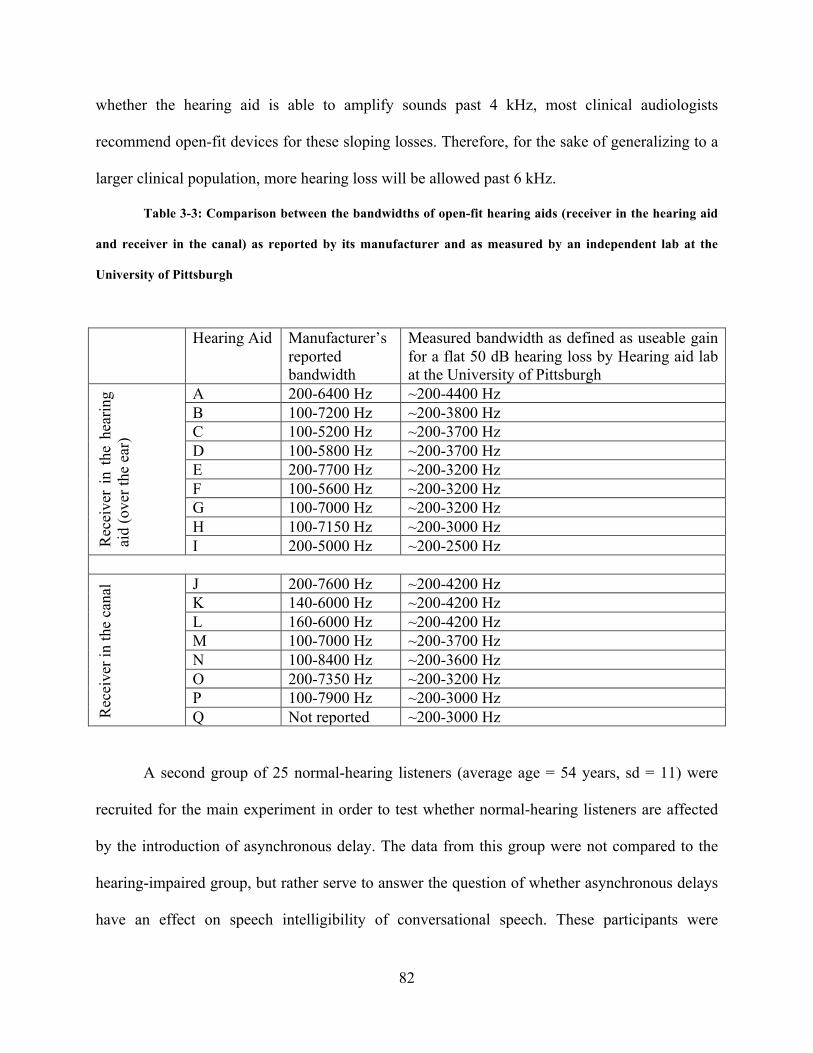
82
whether the hearing aid is able to amplify sounds past 4 kHz, most clinical audiologists
recommend open-fit devices for these sloping losses. Therefore, for the sake of generalizing to a
larger clinical population, more hearing loss will be allowed past 6 kHz.
Table 3-3: Comparison between the bandwidths of open-fit hearing aids (receiver in the hearing aid
and receiver in the canal) as reported by its manufacturer and as measured by an independent lab at the
University of Pittsburgh
Hearing Aid Manufacturer’s reported bandwidth
Measured bandwidth as defined as useable gain for a flat 50 dB hearing loss by Hearing aid lab at the University of Pittsburgh
Rec
eive
r in
the
hea
ring
aid
(ove
r the
ear
)
A 200-6400 Hz ~200-4400 Hz B 100-7200 Hz ~200-3800 Hz C 100-5200 Hz ~200-3700 Hz D 100-5800 Hz ~200-3700 Hz E 200-7700 Hz ~200-3200 Hz F 100-5600 Hz ~200-3200 Hz G 100-7000 Hz ~200-3200 Hz H 100-7150 Hz ~200-3000 Hz I 200-5000 Hz ~200-2500 Hz
Rec
eive
r in
the
cana
l J 200-7600 Hz ~200-4200 Hz K 140-6000 Hz ~200-4200 Hz L 160-6000 Hz ~200-4200 Hz M 100-7000 Hz ~200-3700 Hz N 100-8400 Hz ~200-3600 Hz O 200-7350 Hz ~200-3200 Hz P 100-7900 Hz ~200-3000 Hz Q Not reported ~200-3000 Hz
A second group of 25 normal-hearing listeners (average age = 54 years, sd = 11) were
recruited for the main experiment in order to test whether normal-hearing listeners are affected
by the introduction of asynchronous delay. The data from this group were not compared to the
hearing-impaired group, but rather serve to answer the question of whether asynchronous delays
have an effect on speech intelligibility of conversational speech. These participants were

83
excluded if they were not native speakers of English and/or if they reported having recent middle
ear pathology, otologic surgery, and/or neurologic pathology. The participants were not excluded
on the basis of race or gender. These participants had audiometric thresholds less than 20 dB
from 250 Hz through 8 kHz in both ears and word recognition scores on the Northwestern
University monosyllabic word lists (NU-6) were within the 90% confidence limit based on their
pure tone average (Dubno, Lee, Matthews, Mills, & Lam, 1995).
Procedure 3.2.4
All participants were screened after obtaining informed consent. Only after signing the consent
form were they considered enrolled in the study. A self-report case history questionnaire
(Appendix B) was administered to inquire into the participant’s general health, history of hearing
loss and/or middle ear disease, otologic surgery, and neurologic disorder. To determine auditory
status, a standard audiometric test battery was completed. This included bilateral air and bone
conduction threshold testing at the standard audiometric frequencies (ASHA, 1978), NS word
recognition testing with the Auditec recording of the Northwestern University Test #6 (NU-6)
word lists (Tillman & Carhart, 1966). All of the equipment used to perform the tests of auditory
function was calibrated according to the appropriate ANSI standards. All testing was conducted
in test rooms that meet the ANSI standards for maximum background noise.
After the audiometric data were obtained, each participant’s hearing thresholds in dB HL
were converted to dB SPL. First, the dB HL value was added to the calibrated ANSI S3.6 (1996)
reference earphone sound pressure levels (RETSPL) to obtain the conversion from dB HL to dB
SPL. This value reflects the dB SPL level when played in the average ear canal volume. Table
3-4 shows the ANSI S3.6 RETSPL values for ER-3A earphones. To obtain the SPL thresholds

84
specific to the participant’s ear canal volume, the measured Real Ear to Coupler Difference
(RECD) was added to the dB SPL. RECD is the difference in SPL between the average ear canal
volume assumed by a 2cc coupler and the probe microphone measurement of SPL in the actual
ear canal of a participant.
Table 3-4: ANSI S3.6 (1996) RETSPL for ER-3A earphone
Frequency (Hz) dB SPL in HA-2 (with rigid tube)
250 14 500 5.5 1000 0 1500 2 2000 3 3000 3.5 4000 5.5 6000 2 8000 0
The RECD was measured by connecting the audiometric ER-3A earphone (the earphone
used during audiometric testing) to a HA-2 coupler in Frye 7000 Hearing Aid Analyzer. After
plugging the input jack of the ER-3A earphones into the Frye 7000, the system generated a
frequency sweep signal to capture the output of the ER-3A earphone across frequencies. Next,
the Frye 7000’s probe microphone was inserted in the participant’s ear canal. The ER-3A
earphone was inserted into the participant’s ear over the probe microphone, taking care that the
probe tip was past the depth of the insert earphone. Again, the system generated a pure-tone
sweep while the probe microphone measured the output of the earphone in the ear. The
difference in dB between these two measures is the RECD. Table 3-5 shows how the RECD is
added to a participant’s thresholds in dB HL and the RETSPL value to obtain that participant’s

85
thresholds in dB SPL. Calculation of each individual’s hearing threshold in dB SPL was the first
step in ensuring audibility of the stimuli used for the experiment.
Table 3-5: An example the calculation of a participant’s hearing threshold in dB SPL
Frequency 250 500 1000 2000 3000 4000 6000 8000
Hearing threshold in dB HL 5 5 20 35 40 45 50 65
+ RETSPL 14 5.5 0 3 3.5 5.5 2 0
+ RECD = -1 -2 1 5 6 10 7 6
Hearing threshold in dB SPL 18 8.5 21 43 49.5 60.5 59 71
The presentation level of the stimuli was determined in the following manner. First, prior
to the presence of any participant, the “original calibration noise” soundfile was modified with
the MATLAB algorithm that applied 18 dB of gain above 2 kHz. This file was saved as “gain
calibration noise” on the computer. It was used to verify the audibility of high frequency signals
for each hearing-impaired participant in the main-experiment. Also, the audiometer attenuator
was adjusted so that the time-weighted output of the ER-2 earphone peaked at 60 dB SPL on
probe microphone measurements for the “original calibration noise” as described in the pre-
experiment.
During calibration for the hearing-impaired listeners, a Frye Fonix 7000 probe
microphone was threaded into the participant’s ear canal. The participant’s hearing thresholds in
dB SPL were entered in the Fonix system. The real ear system was set up so that it was
measuring an SPL-o-gram with the stimulus turned off. An ER-2 earphone was inserted into the
participant’s ear over the probe microphone. For the hearing-impaired listeners, the “gain

86
calibration file” was played at the audiometer attenuator setting determined earlier. The Fonix
7000 displayed the output of the ER-2 earphone playing the “gain calibration file”. The output
measure was examined, verifying that the output at all frequencies from 250-4 kHz closely
matched NAL-R target for 60 dB input. The audiometer attenuator was adjusted in 2 dB steps
until audibility was achieved. Figure 3-9 displays the average NAL-R target for 60 dB input and
the average output of the earphone as measured by the probe microphone. The final attenuator
setting was the presentation level for the listening task. The probe microphone was then removed
from the hearing-impaired participant’s ear, and the same calibration measurements were made
on the opposite ear. Once the presentation levels were determined, the probe microphone was
removed from the participant’s ear, and the experimental listening task began.
Figure 3-9: Measured Real Ear SPL Output in response to the “gain calibration filr” and NAL-R
target for 60 dB input for the (a) right ear and (b) left ear
Eight-hundred sentences were presented randomly to each participant using SuperLab 4.0
(Cedrus Corporation) software on a computer connected to a Grason-Stadler 61 audiometer. The
800 processed sentences represent the 4 conditions of simulated high frequency delay. Each set
of 200 conversational sentences had asynchronous delay values of 0 ms (control condition), 4
ms, 8 ms, and 32 ms. These 800 sentences were presented randomly to 25 hearing-impaired
participants and 25 normal-hearing listeners, thereby reducing a condition presentation order

87
effect. The possibility of a learning effect from repeating the same 200 sentences for each of the
four conditions is slim as Kalikow and colleagues (1977) found negligible learning effects for the
low predictability sentences. Regardless, the data were analyzed to ensure that there was not a
learning effect from sentence repetition.
Each participant was seated in a sound treated room with ER-1 insert earphones placed in
each ear. A microphone mounted in front of the participant recorded his or her responses. The
participant was instructed to “Listen carefully to the following sentences. Repeat each sentence
immediately after you hear it. Please speak clearly into the microphone. The listening task is
divided into 16 blocks of 50 sentences. You will be given a break between each block. If you
need a break sooner for any reason, please speak up and let me know.” The participants were
asked to repeat the entire sentence to prevent listeners from using all of their attention resources
on the final key word.
Data Analysis 3.2.5
The recorded data from each participant in the main-experiment were presented to a normal-
hearing listener to judge the last word (key word) being spoken in each of the 800 sentences. The
judge was given the answer keys containing the 800 correct key words in the order of
presentation for each participant. The judge marked whether the participant got each key word
correct or incorrect. If the participant was incorrect, the judge also wrote down the word that
he/she heard the participant say. The judge was blinded to the conditions, thus removing tester
bias. The percent correct key word identification and the identification errors were extracted
from the recordings in this manner for all of the sentences spoken by each participant.

88
4.0 RESULTS
4.1 PRE-EXPERIMENT: CLEAR-SPEECH VS. CONVERSATIONALLY SPOKEN
SPEECH
The conversationally spoken, clearly spoken, and the original recording of each of the 200 r-
SPIN sentences were analyzed in Adobe Audition to calculate speaking rate in words per minute
(wpm) and syllable per second (syl/s), vowel duration of the final key word, and the voiceless
voice onset time (VOT) of the key word. All data were analyzed with a paired t-test for
significant differences and the descriptive data are listed in Table 4-1
Table 4-1: Acoustic differences between Clear, Conversational (same male speaker) and Original
recordings (different male speaker) of the R-SPIN LP sentences (Bilger et al., 1984).
As displayed in Table 4-1, the speaking rate of the conversational recordings was
significantly faster than both the clear recordings and original recordings (p<0.01). The

89
conversational recordings were nearly twice as fast as the clear speech recordings (270 wpm vs.
144 wpm). Also, the mean voiceless VOT for the conversational recordings was significantly
shorter than both the clear and original recordings (p<0.01) being roughly one third of that found
for the clear recordings (95 ms vs. 33 ms). The mean voiceless VOT for the clear and original
recordings did not significantly differ (p<0.01). Figure 4-1 displays a spectrogram demonstrating
the difference in VOT of the word “tanks” between clear (top; 62 ms) and conversational
(bottom; 27 ms) speech. As with many of the conversationally spoken words with a voiceless
plosive in the word-initial position, the burst and aspiration of the initial consonant /t/ in tank
was reduced.
Figure 4-1: Spectrogram demonstrating the difference in VOT of the word “tanks” between clear
(top; 62 ms) and conversational (bottom; 27 ms) speech.
For plosives in word-final position, the conversational recordings exhibited weaker
bursts and releases as compared to the clear speech recording. Figure 4-2 and Figure 4-3 show
spectrograms for two sentences with plosives in the word-final position of the final key word. In
Figure 4-2, the burst in the /p/ of the word “sheep” in the conversational recording is weaker and

90
the aspiration is shorter than its clear speech counterpart. However, in Figure 4-3, the release of
the /p/ in “sap” is omitted in the conversationally spoken version of the sentence.
Figure 4-2: Spectrogram demonstrating the intensity and durational differences in the release of the
final plosive /p/ of the word “sheep” between clear (top) and conversational speech (bottom).
Figure 4-3: Spectrogram demonstrating the intensity and durational differences in the release of the
final plosive /p/ of the word “sap” between clear (top) and conversational speech (bottom). Notice the
omission of the final plosive release.

91
Vowel duration was significantly shorter in the conversationally recorded speech than
both the clear speech and the original recordings (p < 0.01). The spectrogram in Figure 4-4
demonstrates the vowel duration difference of the key word “sand” between the clear and
conversational recordings. Formant transitions were shorter as a consequence of the
conversational speech’s faster articulation rate and shorter vowel durations as shown in Figure
4-5.
Figure 4-4: Spectrogram demonstrating the vowel duration difference of the word “sand” between
clear (top, 379 ms) and conversational speech (bottom, 200 ms)
Figure 4-5: Spectrogram demonstrating the difference in the formant transitions for the /r/ in crown
between clear (top) and conversational (bottom) speech
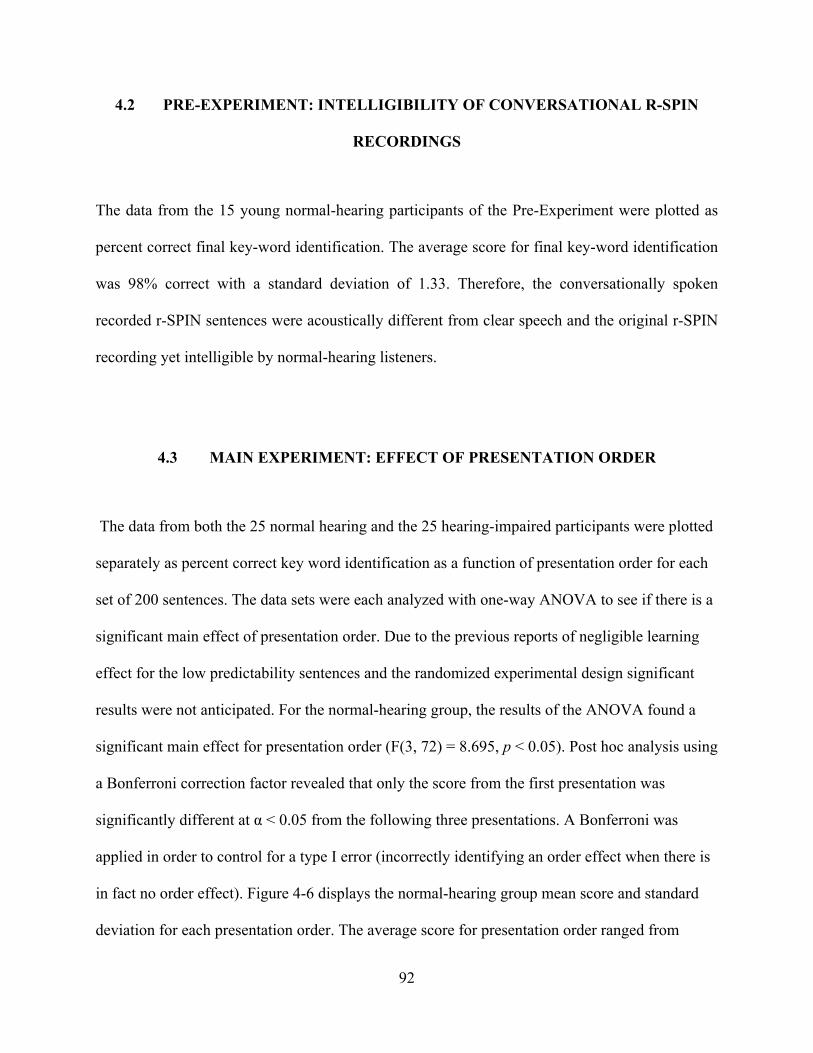
92
4.2 PRE-EXPERIMENT: INTELLIGIBILITY OF CONVERSATIONAL R-SPIN
RECORDINGS
The data from the 15 young normal-hearing participants of the Pre-Experiment were plotted as
percent correct final key-word identification. The average score for final key-word identification
was 98% correct with a standard deviation of 1.33. Therefore, the conversationally spoken
recorded r-SPIN sentences were acoustically different from clear speech and the original r-SPIN
recording yet intelligible by normal-hearing listeners.
4.3 MAIN EXPERIMENT: EFFECT OF PRESENTATION ORDER
The data from both the 25 normal hearing and the 25 hearing-impaired participants were plotted
separately as percent correct key word identification as a function of presentation order for each
set of 200 sentences. The data sets were each analyzed with one-way ANOVA to see if there is a
significant main effect of presentation order. Due to the previous reports of negligible learning
effect for the low predictability sentences and the randomized experimental design significant
results were not anticipated. For the normal-hearing group, the results of the ANOVA found a
significant main effect for presentation order (F(3, 72) = 8.695, p < 0.05). Post hoc analysis using
a Bonferroni correction factor revealed that only the score from the first presentation was
significantly different at α < 0.05 from the following three presentations. A Bonferroni was
applied in order to control for a type I error (incorrectly identifying an order effect when there is
in fact no order effect). Figure 4-6 displays the normal-hearing group mean score and standard
deviation for each presentation order. The average score for presentation order ranged from

93
95.86 at the first presentation to 97.12 at the third presentation. Although the difference in the
percent correct score between the first presentation and the subsequent presentations of each
sentence is minimal (roughly a 1.25 percentage point difference), the difference was found to be
significant at p < 0.05 due to the small variance of the data. However, given the low
predictability nature of key word in each sentences, the fact in that all of the sentences and
experimental conditions were randomly presented to each listener in one block, and the high
accuracy in identification (ceiling effect) of key words in sentence by normal hearing listeners, it
was decided that the learning effect was negligible.
Figure 4-6: The average percent correct key word identification of the 25 normal hearing
participants plotted as a function of presentation order (combined across all delay conditions). Only the first
presentation was significantly different from the other presentations at α < 0.05.
The results of the ANOVA for the hearing-impaired group also revealed a significant
main effect for presentation order (F(3, 72) = 5.103, p < 0.05). Post hoc analysis using a
Bonferroni correction factor revealed that only the score between the first and last presentation
was significantly different at α < 0.05. Figure 4-7 displays the hearing-impaired group mean
score and standard deviation for each presentation order. The average score for presentation
order ranged from 87.26 at the first presentation to 89.16 at the final presentation. Again, given
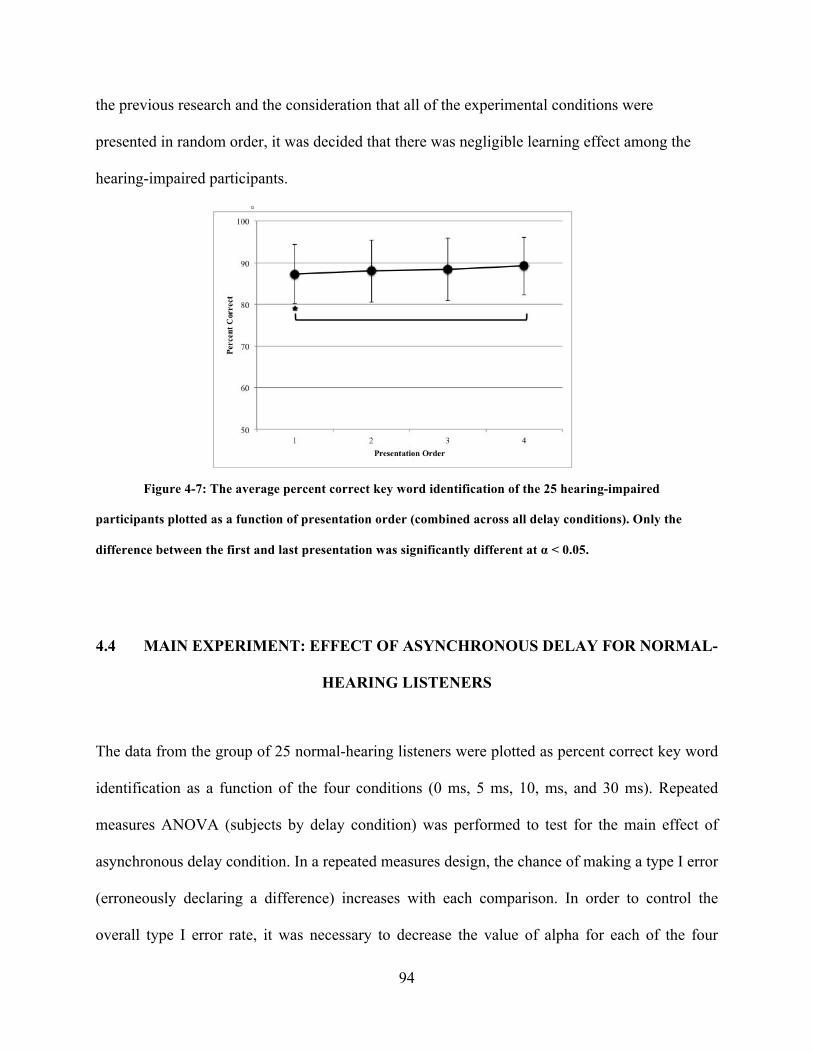
94
the previous research and the consideration that all of the experimental conditions were
presented in random order, it was decided that there was negligible learning effect among the
hearing-impaired participants.
Figure 4-7: The average percent correct key word identification of the 25 hearing-impaired
participants plotted as a function of presentation order (combined across all delay conditions). Only the
difference between the first and last presentation was significantly different at α < 0.05.
4.4 MAIN EXPERIMENT: EFFECT OF ASYNCHRONOUS DELAY FOR NORMAL-
HEARING LISTENERS
The data from the group of 25 normal-hearing listeners were plotted as percent correct key word
identification as a function of the four conditions (0 ms, 5 ms, 10, ms, and 30 ms). Repeated
measures ANOVA (subjects by delay condition) was performed to test for the main effect of
asynchronous delay condition. In a repeated measures design, the chance of making a type I error
(erroneously declaring a difference) increases with each comparison. In order to control the
overall type I error rate, it was necessary to decrease the value of alpha for each of the four

95
comparisons. However as the type I error rate is minimized, the chances of making a type II error
increases. It is important to examine the severity of each error type prior to making the decision
to control the type I error with the use of a Bonferroni to adjust the level of alpha for each
comparison. Table 4-2 lists the possible true outcomes of the study and the errors associated with
each outcome. The severity of the error is listed in the final column. The severity of the type II
error (incorrectly declaring no difference between varying amounts of asynchronous delay) is
much higher than that of the type I error. In order to tightly control the type II error rate, the
Bonferroni correction factor was not applied.
Table 4-2: Analysis of the severity of the error for the research outcome
Possible True outcomes
Consequence Potential Errors Erroneous conclusion
Severity of error
Type I Type II
% correct on SPIN test without delay = % correct on SPIN test with delay
Suggest that asynchronous delays up to 30 ms have no effect on hearing impaired listener’s ability to understand conversational speech
Incorrectly declared a difference between SPIN scores
Cannot make type II error when the true outcome is no difference between scores
Type I error: Asynchronous delay has an effect on hearing impaired listeners speech perception and needs to be controlled in DSP circuits.
Severity is low because it does not matter whether delays are controlled or not.
% correct on SPIN test without delay ≠ % correct on SPIN test with delay
Suggest that asynchronous delays affect SPIN scores and the amount of delay needs to be tightly controlled in DSP circuits.
Cannot make a type I error when the true outcome reports a difference between scores.
Incorrectly declared no difference between groups.
Type II error: Asynchronous delay up to 30 ms has no effect on hearing impaired listeners speech perception.
Severity is high because asynchronous delays do need to be controlled. The delay has a negative effect on listeners’ speech perception.
Figure 4-8 displays the results of the effect of delay condition on key word identification
by normal-hearing listeners. The results of the ANOVA for the normal hearing group revealed a
significant main effect for delay condition (F(3, 72) = 2.852, p = 0.043). Post hoc analysis
revealed that only the score between the 4 ms and the 32 ms condition was significantly different

96
at α < 0.05. The average score ranged between 96.32 (32 ms condition) and 97.14 (4 ms
condition). However, this slight difference was found to be statistically significant due to the low
variability among scores.
Figure 4-8: The average percent key word identification by normal-hearing listeners as a function of
spectrally asynchronous delay. Only the difference between the 4 ms and the 32 ms condition was found to be
significant at α < 0.05.
4.5 MAIN EXPERIMENT: EFFECT OF ASYNCHRONOUS DELAY FOR
HEARING-IMPAIRED LISTENERS
The data from the group of 25 hearing-impaired listeners were plotted as percent correct key
word identification as a function of the four conditions (0 ms, 4 ms, 8, ms, and 32 ms). Repeated
measures ANOVA (subjects by delay condition) was performed to test for the main effect of
asynchronous delay condition. As with the normal-hearing data, a Bonferroni correction factor
was not applied in order to control the type II error rate. Figure 4-9 displays the effect of each
delay condition on key word identification for the group of hearing-impaired listeners. The

97
average values were 89.74%, 88.66%, 88.36%, and 85.36% for the 0, 4, 8, and 32 ms conditions
respectively. Appendix E displays the individual data for the hearing-impaired listeners with the
individuals with a greater than 5% decrease in score with increasing delay values highlighted. A
main effect for the asynchronous delay condition was found (F(3, 72) = 19.788, p < 0.05). A
post-hoc analysis revealed that only the difference between the 4 ms and the 8 ms condition was
not significant; all other differences were significant at α < 0.05.
Figure 4-9: The effect of delay condition on key-word identification for hearing-impaired listeners.
All differences between conditions with the exception of the difference between 4 ms and 8 ms were found to
be significant at α < 0.05.

98
5.0 DISCUSSION
The results of the Pre-Experiment determined that the conversationally recorded r-SPIN low
predictability sentences were acoustically different from both clear speech and the original
commercially available r-SPIN recordings (Bilger et al., 1984, Cosmos Distributing, Inc.), yet
intelligible by normal-hearing listeners. These conversationally spoken recordings were used to
better represent “real world” speech acoustics and to reflect interactions between signal
processing algorithms and the rapidly changing speech acoustics.
The Main experiment used these 200 conversationally recorded r-SPIN sentences
repeated for each asynchronous delay condition (0 ms, 4 ms, 8 ms, and 32 ms). Although all 800
sentences were presented in random order to each participant and previous research reported no
learning effect of the low predictability r-SPIN sentences (Kalikow et al., 1977), the data were
analyzed to determine if there was an effect of presentation order. Although there was a
statistically significant difference for both the normal-hearing and hearing-impaired group of
listeners for which the key word identification of the first presentation was slightly poorer than
the last presentation, the learning effect was deemed negligible due to the randomized
experimental design, the small effect size, and previous research finding minimal learning effect
with low-predictability sentences.

99
5.1 NORMAL-HEARING LISTENERS PERCEPTION OF SPECTRALLY
ASYNCHRONOUS DELAYS
Normal-hearing listeners were essentially unaffected by spectrally asynchronous delays up to 32
ms. The only statistically significant difference found was between the 4 ms and the 32 ms delay
condition, and the difference was roughly equal to an additional 1.5 correct key word
identification out of 200 sentences or a less than a 1 percentage point change in score. It appears
that normal-hearing listeners were either able to ignore the spectro-temporal distortion and/or use
other acoustic cues to correctly identify the key word. For example, previous research has found
that normal-hearing listeners give greater perceptual weight to rapid formant transitions than to
other acoustic cues when identifying consonants (Lindholm et. al., 1988; Hedrick & Jesteadt,
1996; Hedrick & Younger, 2001, 2007). With the delays occurring above 2 kHz, the F1 formant
transitions were unaltered, while most of the F2 and F3 formant transitions were left intact albeit
delayed in time. Normal-hearing listeners may have been able to use these formant transitions
and other redundant acoustic cues such as spectro-intensity cues to correctly identify key words
despite the delay of signals above 2 kHz up to 32 ms. Another consideration would be that the
normal-hearing listeners were able to suppress or ignore the acoustic delay above 2 kHz to take
advantage of the “open-ear” or the unaltered non-hearing aid pathway of sound.
100
5.2 HEARING-IMPAIRED LISTENERS PERCEPTION OF SPECTRALLY
ASYNCHRONOUS DELAYS
Hearing-impaired listeners performed well on the key word identification of the r-SPIN LP
conversationally spoken sentences with an average score for the control condition (zero delay) of
89.74 with a standard deviation of 6.53. This score isn’t surprising considering that the task was
performed in quiet and that audibility was tightly controlled by the inclusion criteria (no greater
than a moderate loss from 2-4 kHz) and through the application of appropriate gain to meet the
NAL-NL1 prescribed SPL output target based upon each participant’s hearing thresholds.
Hearing-impaired listeners were adversely affected by a 32 ms delay to the spectrum above 2
kHz. These results confirm previous research that found that perceptual differences were found
with frequency dependent delay greater than 24 ms (Stone and Moore, 2003). The difference
between the control condition and the shorter delay conditions of 4 and 8 ms was also
statistically significant, albeit it was only a slight degradation in performance (an average
difference of only 1 percentage point between the conditions). It appears that once audibility is
accounted for, hearing-impaired listeners are tolerant of spectrally asynchronous delays up to 8
ms, but then are adversely affected by 32 ms in quiet listening situations. Given that there is a
negative consequence of spectrally asynchronous delay on the speech perception abilities of
hearing-impaired listeners, hearing aid manufacturers should be conscious of the speed of
hearing aid digital processing.
It is possible that the hearing-impaired listeners, like the normal-hearing listeners relied
somewhat on the formant transitions that were held intact despite the delay conditions for correct
key word identification. When the individual data are examined (Appendix E), it appears that
some listeners are tolerant of the asynchronous delay similar to that of normal-hearing listeners.

101
When the hearing threshold data of these listeners are examined (Appendix D), it seems that the
hearing-impaired listeners with milder losses are more tolerate of the delay conditions. As for the
other listeners who were affected by the asynchronous delay, perhaps they rely on other speech
perceptual cues. Studies have shown that hearing-impaired listeners rely less on formant
transitions and more on spectral shape and temporal properties of speech for phonemic
identification (Lindholm et al., 1988; Hedrick and Younger 2007). Listeners with mild-moderate
sensorineural loss can perceive timing cues such as voice onset time (VOT) and spectro-temporal
cues such as envelope onset asynchrony (EOA) similar to those with normal hearing (Johnson et
al., 1984; Ortmann et al., 2010). If hearing-impaired listeners are relying on these particular
spectro-temporal cues for phonemic and subsequently word identification, then their perceptual
performance is more likely to be affected by spectrally asynchronous delays as these delays blur
the onset of voiceless plosives. This hypothesis was supported by significantly poorer
performance in the conditions with spectrally asynchronous delay by hearing-impaired listeners,
but not by normal-hearing listeners.
Hedrick and Younger (2007) demonstrated that hearing-impaired listeners rely even less
on formant transitions when performing in conditions with background noise or reverberation. It
would be assumed that in background noise, these listeners would rely more on spectro-temporal
cues such as VOT or EOA in these conditions. It would be of interest to measure the
intelligibility of the conversational sentences with the same delay conditions in background noise
and/or reverberation. It is hypothesized that because listeners are relying more on gap and
spectro-temporal distinctions, they would be more susceptible to shorter asynchronous delay
values.

102
APPENDIX A
REVISED SPEECH PERCEPTION IN NOISE (R-SPIN) LOW PREDICTABILITY
SENTENCES
List 1 List 2 1. Miss White won’t think about the CRACK. 1. Miss Black thought about the LAP. 2. He wouldn’t think about the RAG. 2. Miss Black would consider the BONE. 3. The old man talked about the LUNGS. 3. Bob could have known about the SPOON. 4. I was considering the CROOK. 4. He wants to talk about the RISK. 5. Bill might discuss the FOAM. 5. He heard they called about the LANES. 6. Nancy didn’t discuss the SKIRT. 6. She has known about the DRUG. 7. Bob has discussed the SPLASH 7. I want to speak about the CRASH. 8. Ruth hopes he heard about the HIPS. 8. I should have considered the MAP. 9. She wants to talk about the CREW. 9. Ruth must have known about the PIE. 10. They had a problem with the CLIFF. 10. The man should discuss the OX. 11. You heard Jane called about the VAN. 11. They heard I called about the PET. 12. We could consider the FEAST. 12. Bill cannot consider the DEN. 13. Bill heard we asked about the HOST. 13. She hopes Jane called about the CALF. 14. I had not thought about the GROWL. 14. Jane has a problem with the COIN. 15. He should know about the HUT. 15. Paul hopes she called about the TANKS. 16. I’m glad you heard about the BEND. 16. The girl talked about the GIN. 17. You’re talking about the POND. 17. Mary should think about the SWORD. 18. Nancy had considered the SLEEVES. 18. Ruth could have discussed the WITS. 19. He can’t consider the CRIB. 19. You had a problem with a BLUSH. 20. Tom discussed the HAY. 20. We have discussed the STEAM. 21. She’s glad Jane asked about the DRAIN. 21. Tom is considering the CLOCK. 22. Bill hopes Paul heard about the MIST. 22. You should not speak about the BRAIDS. 23. We’re speaking about the TOLL. 23. Peter should speak about the MUGS. 24. We spoke about the KNOB. 24. He has a problem with the OATH. 25. I’ve spoken about the PILE. 25. Tom won’t consider the SILK.

103
List 3 List 4 1. Mr. White discussed the CRUISE. 1. Mary had considered the SPRAY. 2. Miss White thinks about the TEA. 2. The woman talked about the FROGS. 3. He is thinking about the ROAR. 3. Miss Brown will speak about the GRIN. 4. She’s spoken about the BOMB. 4. Bill can’t have considered the WHEELS. 5. You want to talk about the DITCH. 5. Mr. Smith spoke about the AID. 6. We’re discussing the SHEETS. 6. He hears she asked about the DECK. 7. Betty has considered the BARK. 7. You want to think about the DIME. 8. Tom will discuss the SWAN. 8. You’ve considered the SEEDS. 9. You’d been considering the GEESE. 9. Ruth’s grandmother discussed the
BROOM. 10. They were interested in the STRAP. 10. Miss Smith considered the SCARE. 11. He could discuss the BREAD. 11. Peter has considered the MAT. 12. Jane hopes Ruth asked about the STRIPES. 12. The old man considered the KICK. 13. Paul spoke about the PORK. 13. Paul could not consider the RIM. 14. Mr. Smith thinks about the CAP. 14. I’ve been considering the CROWN. 15. We are speaking about the PRIZE. 15. We’ve spoken about the TRUCK. 16. Harry had thought about the LOGS. 16. Mary could not discuss the TACK. 17. Bob could consider the POLE. 17. Harry might consider the BEEF. 18. Ruth has a problem with the JOINTS. 18. We’re glad Bill heard about the ASH. 19. He is considering the THROAT. 19. Nancy should consider the FIST. 20. We can’t consider the WHEAT. 20. They did not discuss the SCREEN. 21. The man spoke about the CLUE. 21. The old man thinks about the MAST. 22. David has discussed the DENT. 22. Paul wants to speak about the BUGS. 23. Bill heard Tom called about the COACH. 23. You’re glad she called about the BOWL. 24. Jane has spoken about the CHEST. 24. Miss Black could have discussed the
ROPE. 25. Mr. White spoke about the FIRM. 25. I hope PAUL asked about the MATE.
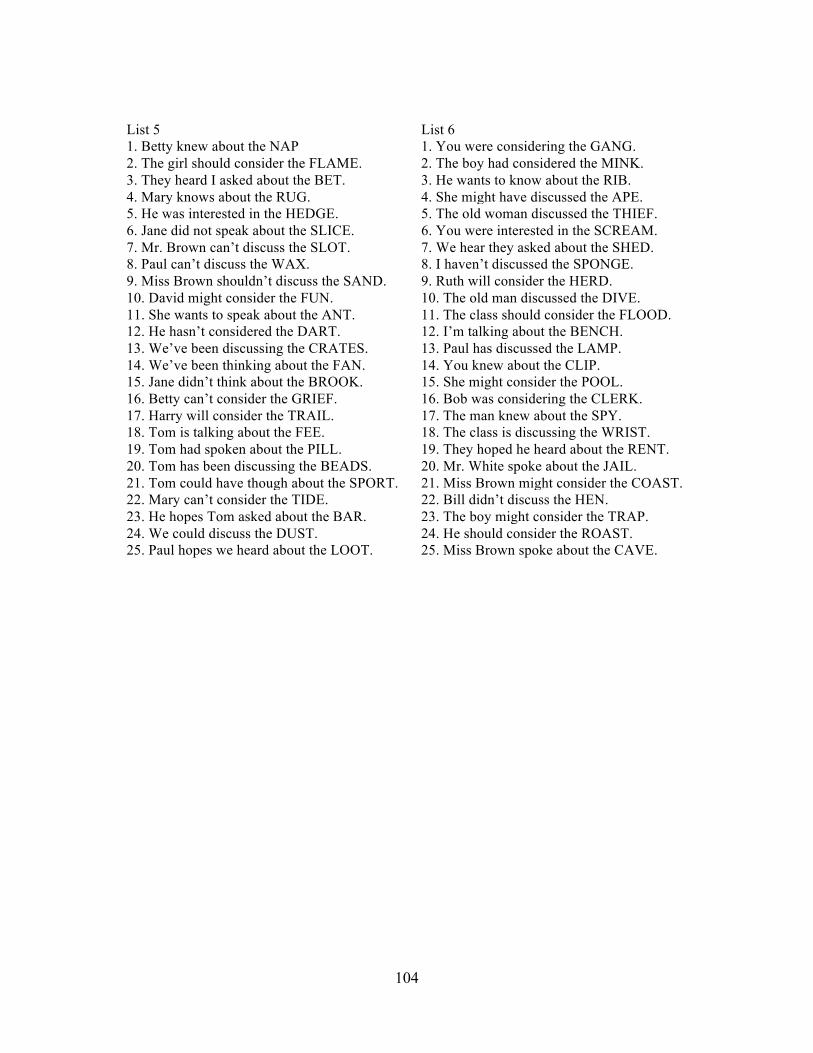
104
List 5 List 6 1. Betty knew about the NAP 1. You were considering the GANG. 2. The girl should consider the FLAME. 2. The boy had considered the MINK. 3. They heard I asked about the BET. 3. He wants to know about the RIB. 4. Mary knows about the RUG. 4. She might have discussed the APE. 5. He was interested in the HEDGE. 5. The old woman discussed the THIEF. 6. Jane did not speak about the SLICE. 6. You were interested in the SCREAM. 7. Mr. Brown can’t discuss the SLOT. 7. We hear they asked about the SHED. 8. Paul can’t discuss the WAX. 8. I haven’t discussed the SPONGE. 9. Miss Brown shouldn’t discuss the SAND. 9. Ruth will consider the HERD. 10. David might consider the FUN. 10. The old man discussed the DIVE. 11. She wants to speak about the ANT. 11. The class should consider the FLOOD. 12. He hasn’t considered the DART. 12. I’m talking about the BENCH. 13. We’ve been discussing the CRATES. 13. Paul has discussed the LAMP. 14. We’ve been thinking about the FAN. 14. You knew about the CLIP. 15. Jane didn’t think about the BROOK. 15. She might consider the POOL. 16. Betty can’t consider the GRIEF. 16. Bob was considering the CLERK. 17. Harry will consider the TRAIL. 17. The man knew about the SPY. 18. Tom is talking about the FEE. 18. The class is discussing the WRIST. 19. Tom had spoken about the PILL. 19. They hoped he heard about the RENT. 20. Tom has been discussing the BEADS. 20. Mr. White spoke about the JAIL. 21. Tom could have though about the SPORT. 21. Miss Brown might consider the COAST. 22. Mary can’t consider the TIDE. 22. Bill didn’t discuss the HEN. 23. He hopes Tom asked about the BAR. 23. The boy might consider the TRAP. 24. We could discuss the DUST. 24. He should consider the ROAST. 25. Paul hopes we heard about the LOOT. 25. Miss Brown spoke about the CAVE.

105
List 7 List 8 1. We’re considering the BROW. 1. Bob heard Paul called about the STRIPS. 2. I am thinking about the KNIFE. 2. Paul has a problem with the BELT. 3. They’ve considered the SHEEP. 3. They knew about the FUR. 4. He’s glad we heard about the SKUNK. 4. We’re glad Ann asked about the FUDGE. 5. The girl should not discuss the GOWN. 5. Jane was interested in the STAMP. 6. Mr. Smith knew about the BAY. 6. Miss White would consider the MOLD. 7. We did not discuss the SHOCK. 7. They want to know about the AIM. 8. Mr. Black has discussed the CARDS. 8. The woman discussed the GRAIN. 9. Mr. Black considered the FLEET. 9. You hope they asked about the VEST. 10. We are considering the CHEERS. 10. We should have considered the JUICE. 11. Sue was interested in the BRUISE. 11. The woman considered the NOTCH. 12. Miss. Smith couldn’t discuss the ROW. 12. The woman knew about the LID. 13. I am discussing the TASK. 13. Jane wants to speak about the CHIP. 14. Paul should know about the NET. 14. Bob should not consider the MICE. 15. Miss Smith might consider the SHELL. 15. Ruth hopes she called about the JUNK. 16. You cannot have discussed the GREASE. 16. I can’t consider the PLEA. 17. I did not know about the CHUNKS. 17. Paul was interested in the SAP. 18. I should have known about the GUM. 18. He’s glad you called about the JAR. 19. Mary hasn’t discussed the BLADE. 19. Miss Smith knows about the TUB. 20. Ruth has discussed the PEG. 20. The man could not discuss the MOUSE. 21. We have not thought about the HINT. 21. Ann was interested in the BREATH. 22. The old man discussed the YELL. 22. You’re glad they heard about the
SLAVE. 23. They’re glad we heard about the TRACK. 23. The man could consider the SPOOL. 24. The boy can’t talk about the THORNS. 24. Peter knows about the RAFT. 25. Bill won’t consider the BRAT. 25. She hears Bob asked about the CORK.

106
APPENDIX B
CASE HISTORY FORM
Read the following questions and circle the appropriate answer:
1. How old are you? ___________________________________________________________ 2. Are you in good general health? Yes No If you answered no, please explain your medical conditions: ____________________________________________________________________________________________________________________________________________________________ 3. Do you feel that you have a hearing loss? Yes No If yes, do you feel that one ear is better than the other? Yes No If so, which ear is your better ear? Right Left 4. Are you a native speaker of English? Yes No 5. Have you had any recent ear infections, drainage, or pain in your ears? Yes No If you answered yes, please give the date of the ear infection and when and how it was resolved: ______________________________________________________________________ ______________________________________________________________________________ 6. Have you had any surgeries performed on your ears? Yes No If yes, please explain: ______________________________________________________ ______________________________________________________________________________ 7. Have you ever been diagnosed with any neurologic disorder (i.e., brain tumor, stroke, Parkinson’s disease, etc.)? Yes No If yes, please explain: ______________________________________________________ ______________________________________________________________________________

107
APPENDIX CFIR FILTER REPSONSE
Figure 5-1: Graphs depict the magnitude and phase response for the FIR high pass (top) and low
pass (bottom) filter used to create the delay conditions.

108
APPENDIX D
DEMOGRAPHIC INFORMATION FOR THE PARTIPANTS OF THE MAIN EXPERIMENT

109
Table 5-1: Main experiment normal-hearing listeners’ demographics (age and hearing thresholds)
Frequency in Hz
Age Ear 250 500 1000 2000 3000 4000 6000 8000 NH1 21 RE 15 10 10 10 5 5 5 5
LE 15 15 10 15 10 5 5 10 NH2 46 RE 15 15 10 5 15 10 10 0
LE 10 5 10 5 15 10 10 0 NH3 61 RE 10 15 15 15 15 15 15 15
LE 10 15 15 15 15 15 15 15 NH4 64 RE 20 15 5 5 10 10 20 20
LE 15 10 10 15 20 20 10 15 NH5 61 RE 20 15 15 10 5 10 15 15
LE 15 15 20 15 15 15 10 15 NH6 61 RE 10 10 15 10 5 20 20 20
LE 10 10 10 15 5 20 20 15 NH7 65 RE 5 5 5 10 10 10 20 15
LE 5 5 0 10 20 20 20 20 NH8 59 RE 10 10 15 15 20 20 20 25
LE 10 10 20 15 15 20 20 20 NH9 65 RE 15 15 15 15 15 20 15 20
LE 15 15 15 15 15 15 15 10 NH10 62 RE 10 15 15 10 15 10 10 10
LE 15 15 15 15 10 15 15 10 NH11 63 RE 15 10 15 15 15 15 15 20
LE 15 10 15 5 15 15 10 15 NH12 54 RE 15 10 10 10 5 5 10 10
LE 10 10 10 10 5 10 10 5 NH13 55 RE 15 10 5 10 15 15 15 15
LE 10 10 5 10 15 10 15 10 NH14 55 RE 10 10 5 0 10 10 10 15
LE 10 5 5 0 5 10 10 15 NH15 54 RE 10 10 15 15 20 15 15 20
LE 15 10 15 10 20 15 15 15 NH16 56 RE 15 10 10 10 5 5 10 10
LE 15 15 10 5 5 5 10 15 NH17 61 RE 20 15 15 10 15 15 10 15
LE 20 15 15 10 15 15 10 15 NH18 59 RE 15 15 15 10 15 10 15 15
LE 15 15 10 15 15 10 15 10 NH19 56 RE 5 10 10 0 10 15 15 15
LE 5 5 5 5 10 15 15 15 NH20 54 RE 15 10 5 5 5 15 10 10
LE 15 10 5 0 5 10 15 15 NH21 42 RE 15 10 10 10 10 10 5 5
LE 15 10 5 10 15 5 10 5 NH22 37 RE 10 10 5 5 5 5 0 0
LE 10 10 5 5 0 5 0 0 NH23 28 RE 10 5 0 5 0 0 5 0
LE 5 0 0 5 0 0 5 0 NH24 51 RE 10 10 10 10 10 15 15 15
LE 10 10 10 15 10 15 10 5 NH25 39 RE 10 10 0 0 5 10 5 0
LE 5 5 0 0 5 5 5 0
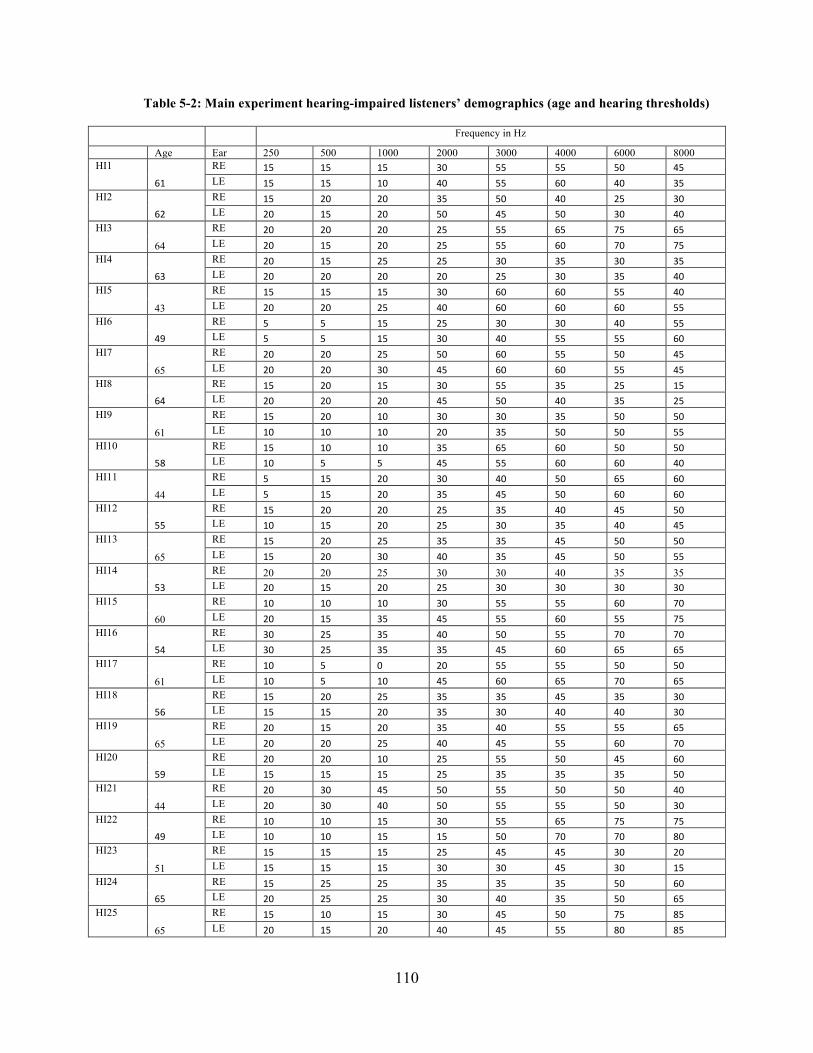
110
Table 5-2: Main experiment hearing-impaired listeners’ demographics (age and hearing thresholds)
Frequency in Hz
Age Ear 250 500 1000 2000 3000 4000 6000 8000 HI1
61
RE 15 15 15 30 55 55 50 45 LE 15 15 10 40 55 60 40 35
HI2 62
RE 15 20 20 35 50 40 25 30 LE 20 15 20 50 45 50 30 40
HI3
64
RE 20 20 20 25 55 65 75 65 LE 20 15 20 25 55 60 70 75
HI4 63
RE 20 15 25 25 30 35 30 35 LE 20 20 20 20 25 30 35 40
HI5
43
RE 15 15 15 30 60 60 55 40 LE 20 20 25 40 60 60 60 55
HI6 49
RE 5 5 15 25 30 30 40 55 LE 5 5 15 30 40 55 55 60
HI7
65
RE 20 20 25 50 60 55 50 45 LE 20 20 30 45 60 60 55 45
HI8 64
RE 15 20 15 30 55 35 25 15 LE 20 20 20 45 50 40 35 25
HI9
61
RE 15 20 10 30 30 35 50 50 LE 10 10 10 20 35 50 50 55
HI10 58
RE 15 10 10 35 65 60 50 50 LE 10 5 5 45 55 60 60 40
HI11
44
RE 5 15 20 30 40 50 65 60 LE 5 15 20 35 45 50 60 60
HI12 55
RE 15 20 20 25 35 40 45 50 LE 10 15 20 25 30 35 40 45
HI13
65
RE 15 20 25 35 35 45 50 50 LE 15 20 30 40 35 45 50 55
HI14 53
RE 20 20 25 30 30 40 35 35 LE 20 15 20 25 30 30 30 30
HI15
60
RE 10 10 10 30 55 55 60 70 LE 20 15 35 45 55 60 55 75
HI16 54
RE 30 25 35 40 50 55 70 70 LE 30 25 35 35 45 60 65 65
HI17
61
RE 10 5 0 20 55 55 50 50 LE 10 5 10 45 60 65 70 65
HI18 56
RE 15 20 25 35 35 45 35 30 LE 15 15 20 35 30 40 40 30
HI19
65
RE 20 15 20 35 40 55 55 65 LE 20 20 25 40 45 55 60 70
HI20 59
RE 20 20 10 25 55 50 45 60 LE 15 15 15 25 35 35 35 50
HI21
44
RE 20 30 45 50 55 50 50 40 LE 20 30 40 50 55 55 50 30
HI22 49
RE 10 10 15 30 55 65 75 75 LE 10 10 15 15 50 70 70 80
HI23
51
RE 15 15 15 25 45 45 30 20 LE 15 15 15 30 30 45 30 15
HI24 65
RE 15 25 25 35 35 35 50 60 LE 20 25 25 30 40 35 50 65
HI25
65
RE 15 10 15 30 45 50 75 85 LE 20 15 20 40 45 55 80 85

111
APPENDIX E
Table 5-3: individual data for hearing-impaired listeners percent correct key word identification as a
function of asynchronous delay
Delay Conditions 0 ms 4 ms 8 ms 32 ms HI1 98 93.5 95.5 91.5 HI2 87.5 82.5 86 82 HI3 90.5 88.5 91.5 85.5 HI4 95.5 97 98 97 HI5 92.5 93.5 95 91.5 HI6 91.5 87.5 89.5 88.5 HI7 85.5 86.5 82.5 76 HI8 97 97 96 96.5 HI9 99 98.5 98 96 HI10 90.5 91 89 85.5 HI11 78 72 74 72 HI12 91 91 89 83.5 HI13 89 86 92.5 84 HI14 90.5 90.5 88.5 88.5 HI15 76.5 78.5 75.5 69.5 HI16 84 88 83 78 HI17 94.5 94 95 95 HI18 89 91 86.5 87 HI19 97.5 93 88.5 92.5 HI20 87 85 88.5 85.5 HI21 77 74.5 72 65.5 HI22 81.5 81 79 74 HI23 98.5 97 97.5 96.5 HI24 91.5 90.5 92 89 HI25 90.5 89 86.5 83.5 HIGHLIGHTED PARTICIPANT NUMBER INDICATES THAT DATA SLOPE AS A FUNCTION OF INCREASING DELAY.

112
BIBLIOGRAPHY
Agnew, J. & Thornton, J. M. (2000). Just noticeable and objectionable group delays in digital hearing aids. Journal of the American Academy of Audiology, 11, 330-336.
American Speech and Hearing Association (1978). Guidelines for manual pure-tone threshold audiometry. ASHA 20:97-301
American National Standards Institute. (1996). American national standard specification for audiometers ANSI S3.6-1996). New York.
Baum, S. R. & Blumstein, S. E. (1987). Preliminary observations on the use of duration as a cue to syllable-inital fricative consonant voicing in English. Journal of the Acoustical Society of America, 82, 1073-1077.
Bentler, R. & Chiou, L. (2006). Digital noise reduction: an overview. Trends in Amplification, 10, 67-82.
Bilger, R. C., Nuetzel, J. M., Rabinowitz, W. M., & Rzeczkowski, C. (1984). Standardization of a test of speech perception in noise. Journal of Speech and Hearing Research, 27, 32-48.
Blumstein, S. E. & Stevens, K. N. (1979). Acoustic invariance in speech production: evidence from measurements of the spectral characteristics of stop consonants. Journal of the Acoustical Society of America, 66, 1001-1017.
Blumstein, S. E. & Stevens, K. N. (1980). Perceptual invariance and onset spectra for stop consonants in different vowel environments. Journal of the Acoustical Society of America, 67, 648-662.
Budinger, E. & Heil, P. (2006). Anatomy of the auditory cortex. In Listening to Speech: An Auditory Perspective. Greenberg, S. & Ainsworth W. A. (Eds.). Lawrence Erlbaum: New Jersey.
Byrd, D., & Tan, C. C. (1996) Saying consonant clusters quickly. Journal of Phonetics, 24, 263-282.
Cheung, S. W., Bedenbaugh, P. H., Nagarajan, S. S., & Schreiner, C. E. (2001). Functional organization of squirrel monkey primary auditory cortex: Responses to pure tones. Journal of Neurophysiology, 85, 1732-1749.

113
Ching, T. Y. C., Dillon, H., & Byrne, D. (1998). Speech recognition of hearing-impaired listeners: Predictions from audibility and the limed role of high-frequency amplification. Journal of the Acoustical Society of America, 103, 1128-1140.
Christensen, L. A. & Humes, L. E. (1997). Identification of multidimensional stimuli containing speech cues and the effects of training. Journal of the Acoustical Society of America, 102, 2297-2310.
Chung, K. (2004). Challenges and recent developments in hearing aids: part 1. Speech understanding in noise, microphone technologies and noise reduction algorithms. Trends in Amplification, 8, 83-124.
Cole, R. A. & Scott, B. (1974). Toward a theory of speech perception. Psychological Review, 81, 348-374.
Delattre, P., Liberman, A. M., Cooper, F. S., & Gerstman, L. J. (1952). An experimental study of the acoustic determinants of vowel color: observations on one- and two-formant vowels synthesized from spectrographic patterns. Word, 8, 195-210.
Delattre, P. C., Liberman, A. M., & Cooper, F. S. (1955). Acoustic loci and transitional cues for consonants. Journal of the Acoustical Society of America, 27, 769-773.
Delgutte, B. (1980). Representation of speech-like sounds in the discharge patterns of auditory-nerve fibers. Journal of the Acoustical Society of America, 68, 843-857.
Delgutte, B & Kiang, N. Y. S. (1984a). Speech coding in the auditory nerve: I: Vowel-like sounds. Journal of the Acoustical Society of America, 75, 866-878.
Delgutte, B & Kiang, N. Y. S. (1984b). Speech coding in the auditory nerve: III: Voiceless fricative consonants. Journal of the Acoustical Society of America, 75, 887-896.
Delgutte, B & Kiang, N. Y. S. (1984c). Speech coding in the auditory nerve: IV: Sounds with consonant-like dynamic characteristics. Journal of the Acoustical Society of America, 75, 897-907.
Delgutte, B & Kiang, N. Y. S. (1984d). Speech coding in the auditory nerve: V: Vowels in background noise. Journal of the Acoustical Society of America, 75, 908-918.
Diehl, R. L., Lotto, A. J., & Holt, L. L. (2004). Speech perception. Ann. Rev. Psychol. 55, 149-179.
Dillon, H., Kiedser, G., O’Brien, A., & Silberstein, H. (2003). Sound quality comparisons of advanced hearing aids. The Hearing Journal, 56(4), 30-40.
Dirks, D. D., Bell, T. S., Rossman, R. N., & Kincaid, G. E. (1986). Articulation index predictions of contextually dependent words. Journal of the Acoustical Society of America, 80, 82-92.
114
Dorman, M.F., Raphael, L. J., & Isenberg, D. (1980). Acoustic cues for a fricative-affricate contrast in word-final position. Journal of Phonetics, 8, 397-405.
Dorman, M. F., Raphael, L. J., & Liberman, A. M. (1979). Some experiments on the sound of silence in phonetic perception. Journal of the Acoustical Society of America, 65, 1518-1532.
Dubno, J. R., Dirks, D. D., & Langhofer, L. R. (1982). Evaluation of hearing-impaired listeners using a Nonsense-Syllable Test: II: Syllable recognition and consonant confusion patterns. Journal of Speech and Hearing Research, 25, 141-148
Dubno, J. R., Dirks, D. D., & Ellison, D. E. (1989). Stop-consonant recognition for normal-hearing listeners with high-frequency hearing loss II: Articulation index predictions. Journal of the Acoustical Society of America, 85, 355-364.
Dubno, J., Lee, F., Matthews, L., Mills, J., & Lam, C. (1995). Confidence limits for maximum word recognition scores. Journal of Speech and Hearing Research 38: 490-502
Fant, G. (1952). Descriptive analysis of the acoustic aspects of speech. Logos, 5, 3-17.
Ferguson, S. H. & Kewley-Port, D. (2002). Vowel intelligibility in clear and conversational speech for normal-hearing and hearing-impaired listeners. Journal of the Acoustical Society of America, 112, 259-271.
Fowler, C. A. (1986). An event approach to the study of speech perception from a direct realist perspective. Journal of Phonetics, 14, 3-28.
Folwer, C. A. (1996). Listeners do hear sounds, not tongues. Journal of the Acoustical Society of America, 99, 1730-1741.
Folwer, C. A. (2006). Compensation for coarticulation reflects gesture perception, not spectral contrast. Perception & Psychophysics, 68, 161-177.
Fu, Q. J. (2002). Temporal processing and speech recognition in cochlear implant users, NeuroReport, 13, 1635-1639.
Gay, T. A. (1970). A perceptual study of American English diphthongs. Language and Speech, 13, 171-189.
Gelfand, S.A. (1998). Hearing: and introduction to psychological and physiological acoustics. Third Edition. Marcel Dekker: New York.
Glasberg, B. R. & Moore, B. C. J. (1986). Auditory filter shapes in subjects with unilateral and bilateral cochlear impairments. Journal of the Acoustical Society of America, 79, 1020-1033.
Gordon-Salant, S. (1987). Effects of acoustic modification on consonant recognition by elderly hearing-impaired subjects. Journal of the Acoustical Society of America, 81, 199-1202.
115
Grant, K. W., & Greenberg, S. Speech intelligibility derived from asynchronous processing of auditory-visual information. In: Proceedings Auditory-Visual Speech Processing. (AVSP 2001), Scheelsminde, Denmark; 2001, 132-137.
Grant, K. W., & Seitz, P. F. (2000). The use of visible speech cues for improving auditory detection of spoken sentences. J Acoust Soc Am, 108, 1197-1208.
Greenberg, S., Arai, T., Silipo, R. Speech intelligibility derived from exceedingly sparse spectral information. International Conference on Spoken Language Processing, Sydney, 1998, 2803-2806.
Hackney, C. M. (2006). From cochlea to cortex: a simple anatomical description. In Listening to Speech: An Auditory Perspective. Greenberg, S. & Ainsworth W. A. (Eds.). Lawrence Erlbaum: New Jersey.
Harris, K. S. (1958). Cues for the discrimination of American English fricatives in spoken syllables. Language & Speech, 1, 1-7.
Heinz, J. M. & Stevens, K. N. (1961). On the properties of voiceless fricative consonants. Journal of the Acoustical Society of America, 33, 589-96.
Hedrick, M. S. (1997). Effect of acoustic cues on labeling fricatives and affricates. Journal of Speech, Language, and Hearing Research, 40, 925-938.
Hedrick, M. S. & Jesteadt, W. (1996). Effect of relative amplitude, presentation level, and vowel duration on perception of voiceless stop consonants by normal and hearing-impaired listeners, Journal of the Acoustical Society of America, 100, 3398-3407.
Hedrick, M. S. & Ohde, R. N. (1993). Effect of relative amplitude of frication on the perception of place of articulation. Journal of the Acoustical Society of America, 94, 2005-2027.
Hedrick, M. S. & Younger, M. S. (2001). Perceptual weighting of relative amplitude and formant transition cues in aided CV syllables. Journal of Speech, Language, and Hearing Research, 44, 964-974.
Hedrick, M. S., & Younger, M. S. (2007). Perceptual weighting of stop consonant cues by normal and impaired listeners in reverberation versus noise. Journal of Speech, Language, and Hearing Research, 50, 254-269.
Healy, E. W. & Bacon, S. P. (2002). Across-frequency comparison of temporal speech information by listeners with normal and impaired hearing. Journal of Speech, Language, and Hearing Research, 36, 1306-1314.
Hillenbrand, J., Getty, L., Clark, M., & Wheeler, K. (1995). Acoustic characteristics of of American English vowels. Journal of the Acoustical Society of America, 97, 3099-3523.
Hirsh, I. J. (1959). Auditory perception of temporal order. Journal of the Acoustical Society of America, 31, 759-767.

116
Hogan, C. A. & Turner, C. W. (1998). High frequency audibility: benefits for hearing-impaired listeners. Journal of the Acoustical Society of America, 104, 432-441.
Holt, L. L. (2005). Temporally non-adjacent non-linguistic sounds affect speech categorization. Psychological Science, 16, 305-312.
Holt, L. L. Lotto, A. J., & Kluender, K. R. (2000). Neighboring spectral content influences vowel identification. Journal of the Acoustical Society of America, 108, 710-722.
Holt, L. L. & Kluender, K. R. (2000). General auditory processes contribute to perceptual accommodation of articulation. Phonetica, 57, 170-180.
Holt, L. L., Ventura, V., Rhode, W. R., Behesta, S., & Rinaldo, A. (2000). Context-dependent neural coding in the chinchilla cochlear nucleus. Journal of the Acoustical Society of America, 108, 2641.
Holt, L. L., Lotto, A. J., & Kluender, K. R. (2001). Influence of fundamental frequency on stop-consonant voicing perception. A case of learned covariation or auditory enhancement? Journal of the Acoustical Society of America, 109, 764-774.
House, A. S. (1961). On vowel duration in English. Journal of the Acoustical Society of America, 33, 1174-1178.
Humes, L. E., Dirks, D. D., Bell, T. S., Ahlstrom, C., & Kincaid, G. E. (1986). Applications of the articulation index and the speech transmission index to the recognition of speech by normal-hearing and hearing-impaired listeners. Journal of Speech and Hearing Research, 29, 447-462.
Jenstad, L. M. & Souza, P. E. (2005). Quantifying the effect of compression hearing aid release time on speech acoustics and intelligibility. Journal of Speech, Language, and Hearing Research, 48, 651-667.
Jiang, J. Chen, M., & Alwan, A. (2006). On the perception of voicing in syllable-initial plosives in noise. Journal of the Acoustical Society of America, 119, 1092-1105.
Johnson, D., Whaley, P., & Dorman, M. F. (1984). Processing of cues for stop consonant voicing by young hearing-impaired listeners. Journal of Speech and Hearing Research, 27, 112-118.
Jongman, A. (1989). Duration of the frication noise required for identification of English fricatives. Journal of the Acoustical Society of America, 33, 1718-1725.
Jongman, A., Wayland, R., & Wong, S. (2000). Acoustic characteristics of English fricatives. Journal of the Acoustical Society of America, 108, 1252-1263.
Kates, J. M. (2005). Principles of digital dynamic-range compression. Trends in Amplification, 9, 45-76.

117
Kalikow, D. N., Stevens, K. N., & Elliot, L. L. (1977). Development of a test of speech intelligibility in noise using sentence materials with controlled word predictability. Journal of the Acoustical Society of America, 61, 1337-1351.
Kennedy, E., Levitt, H., Neuman, A. C., & Weiss, M. (1998). Consonant-vowel intensity ratios for maximizing consonant recognition by hearing-impaired listeners. Journal of the Acoustical Society of America, 103, 1098-1114.
Klatt, D. H. (1975). Voice onset time, frication, and aspiration word-initial consonant clusters. Journal of Speech and Hearing Research, 18, 686-706.
Kluender, K. R., Diehl, R. L., & Kileen, P. R. (1987). Japanese quail can learn phonetic categories. Science, 237, 1195-1197.
Kluender, K. R. & Walsh, M. A. (1992). Amplitude rise time and the perception of voiceless affricate/fricative distinction. Perception & Psychophysics, 51, 328-333.
Krause, J. C., & Braida L. D. (2002). Investigating alternative forms of clear speech: The effects of speaking rate and speaking mode on intelligibility. Journal of the Acoustical Society of America, 112, 2165-2172.
Krause, J. C., & Braida L. D. (2004). Acoustic properties of naturally produced clear speech at normal speaking rates, Journal of the Acoustical Society of America, 115, 362-378.
Kuhl, P. K., & Miller, J. D. (1975). Speech perception by the chinchilla: voiced-voiceless distinction in alveolar plosive consonants. Science, 190, 68-72.
Kuhl, P. K., & Miller, J. D. (1978). Speech perception by the chinchilla: identification functions for synthetic VOT stimuli. Journal of the Acoustical Society of America, 63, 905-917.
Liberman, A. M., Delattre, P. C., & Cooper, F. S. (1952). The role of selected stimulus-variables in the perception of the unvoiced stop consonants. Am. J. Psychol., LXV, 497-516.
Liberman, A. M., Delattre, P. C., Gertsman, L., J., & Cooper F. S. (1956). Tempo of frequency change as a cue for distinguishing classes of speech sounds. J. Exp. Psychol., 52, 127-137.
Liberman, A. M., Harris, K. S., Hoffman H. S., & Griffith, B. C. (1957). The discrimination of speech sounds within and across phoneme boundaries. J. Exp. Psychol., 54, 358-368.
Liberman, A. M., Cooper, F. S., Shankweiler, D. S., & Studdert-Kennedy, M. (1967). Perception of the speech code. Psychol. Rev., 74, 431-461.
Liberman, A. M. & Mattingly, I. G. (1985). The motor theory of speech perception revised. Cognition, 21, 1-36.
Lindblom, B. (1963). Spectrographic study of vowel reduction. Journal of the Acoustical Society of America, 35, 1773-1781.

118
Linblom, B. E. F., & Suddert-Kennedy, M. (1967). On the role of formant transitions in vowel recognition. Journal of the Acoustical Society of America, 42, 830-843.
Lindholm, J. M., Dorman, M., Taylor, B., E., & Hannley, M. T. (1988). Stimulus factors influencing the identification of voiced stop consonants by normal-hearing and hearing-impaired adults. Journal of the Acoustical Society of America, 83, 1608-1614.
Lisker, L. (1957). Minimal cues for separating /w,r,l,y/ in intervocalic position. Word, 13, 256-267.
Lisker, L. (1975). Is it VOT or a first-formant transition detector? Journal of the Acoustical Society of America, 57, 1547-1551.
Lisker, L., & Abramson, A. S. (1964). A cross-language study of voicing in initial stops: acoustical measurements Word, 20, 384-422.
Liu, S., Del Rio, E., Bradlow, A. R., & Zeng, F. G. (2004). Clear speech perception in acoustic and electric hearing. Journal of the Acoustical Society of America, 116, 2374-2383.
Liu, S. & Zeng, F. G. (2006). Temporal properties in clear speech perception. Journal of the Acoustical Society of America, 120, 424-432.
Lorenzi, C., Gilbert, G., Carn, H., Garnier, S., & Moore, B. C. J. (2006). Speech perception problems of the hearing impaired reflect inability to use temporal fine structure. Proceedings of the National Academy of Sciences in the United States of America, 103, 18866-18869.
Lotto, A. J., Kluender, K. R., & Holt, L. L. (1997). Perceptual compensation for coarticulation by Japanese quail (Coturnix coturnix japonica). Journal of the Acoustical Society of America, 102, 1134-1140.
Mann, V. A. (1980). Influence of preceding liquid on stop-consonant perception. Perception & Psychophysics, 28, 407-412.
Mann, V. A. & Repp, B. H. (1981a): Influence of vocalic context on the perception of the [sh]-[s] distinction. Perception & Psychophysics, 28, 213-228.
Mann, V. A., & Repp, B. H. (1981b). Influence of preceding fricative on stop-consonant perception. Journal of the Acoustical Society of America, 69, 548-558.
McClelland, J. L., Mirman, D., & Hotl, L. L. (2006). Are there interactive processes in speech perception? Trends in Cognitive Science, 10, 363-369.
McGrath, M., & Summerfield, Q. (1985). Intermodal timing relations and audio-visual speech recognition by normal-hearing adults. Journal of the Acoustical Society of America, 77, 678-685.
119
Mermelstein, P. (1977). On detecting nasals in continuous speech. Journal of the Acoustical Society of America, 61, 581-587.
Miller, G. A. & Nicely, P. E. (1955). An analysis of perceptual confusions among some English consonants. Journal of the Acoustical Society of America, 27, 338-352.
Montgomery, A. & Edge, R. (1988). Evaluation of the speech enhancement techniques to improve intelligibility for hearing-impaired adults. Journal of Speech and Hearing Research, 31, 386-393.
Moon, S. J., & Lindblom, B. (1994). Interaction between duration, context, and speaking style in English stressed vowels. Journal of the Acoustical Society of America, 96, 40-55.
Moore, B. J. C. & Glasberg, B. R. (1986). Comparisons of frequency selectivity in simultaneous and forward masking for subjects with unilateral cochlear impairments. Journal of the Acoustical Society of America, 80, 93-107.
Mueller, H. G. & Ricketts, T. A. (2006). Open-canal fittings: ten take home tips. Hearing Journal, 59, 11, 24-39.
Nabelek, A. K., Czyzewski, Z., & Crowley, H. J. (1993). Vowel boundaries for steady-state and linear formant trajectories. Journal of the Acoustical Society of America, 94, 675-687.
Nelson, P. B., Nittrouer, S. & Norton, S. J. (1995). “Say-stay” identification and psychoacoustic performance of hearing-impaired listeners. Journal of the Acoustical Society of America, 97, 1830-1838.
Ohde, R. N. (1984). Fundamental frequency as an acoustic correlate of stop consonant voicing. Journal of the Acoustical Society of America, 75, 224-230.
Ohde, R. N. & Stevens, K. N. (1983). Effect of burst amplitude on the perception of stop consonant place of articulation. Journal of the Acoustical Society of America, 74, 706-714.
Ortmann, A. J., Palmer, C. V., & Pratt, S. R. (2010). The impact of spectrally-asynchronous delays on consonant voicing perception. Journal of the American Academy of Audiology, 21, 493-511.
Owens, E., Benedict, M., & Schubert, E. (1972). Consonant phonemic errors associated with pure tone configurations and certain kinds of hearing impairment. Journal of Speech and Hearing Research, 15, 308-322.
Palmer, C. V., Benter, R., & Mueller H. G. (2006). Amplification with digital noise reduction and the perception of annoying and aversive sounds. Trends in Amplification, 10, 95-104.
Payton, K. L., Uchanski, R. M., & Braida, L. D. (1994). Intelligibility of conversational and clear speech in noise and reverberation for listeners with normal and impaired hearing. Journal of the Acoustical Society of America, 95, 1581-1592.

120
Picheny, M. A., Durlach, N. I., & Braida, L. D. (1985). Speaking clearly for the hard of hearing I: Intelligibility differences between clear and conversational speech. Journal of Speech and Hearing Research, 28, 96-103.
Picheny, M. A., Durlach, N. I., & Braida, L. D. (1986). Speaking clearly for the hard of hearing II. Acousic characteristics of clear and conversational speech. Journal of Speech and Hearing Research, 29, 434-446.
Picheny, M. A., Durlach, N. L., & Braida, L. D. (1989). Speaking clearly for the hard of hearing III. An attempt to determine the contribution of speaking rate to differences in intelligibility between clear and conversational speech. Journal of Speech and Hearing Research, 32, 600-603.
Pisoni, D. B. (1977). Identification and discrimination of the relative onset time of two component tones: implications for voicing perception in stops Journal of the Acoustical Society of America, 51, 1352-1361.
Qin, M. K. & Oxenham, A. J. (2003). Effects of simulated cochlear implant processing on speech reception in fluctuating maskers. Journal of the Acoustical Society of America, 114, 446-454.
Rankovic, C. M. (1991). Application of the articulation index to hearing aid fitting. Journal of Speech and Hearing Research, 34, 391-402.
Raphael, L. J. (1972). Preceding vowel duration as a cue to the perception of the voicing characteristic of word-final consonants in American English. Journal of the Acoustical Society of America, 51, 1296-1303.
Repp, B. H. & Mann, V. A. (1981). Perceptual assessment of fricative-stopcoarticulation. Journal of the Acoustical Society of America, 69, 1154-1163.
Repp, B. H. & Mann, V. A. (1980). Fricative-stop coarticulation: Acoustic and perceptual evidence. Journal of the Acoustical Society of America, 71, 1562-1567.
Ricketts, T. & Henry, P. (2002). Evaluation of an adaptive directional-microphone hearing aid. International. Journal of Audiology, 41, 100-112.
Rosen, S. (1992). Temporal information in speech: acoustic, auditory, and linguistic aspects. Phil. Trans. R. Soc. Lond., 336, 367-373.
Sammeth, C. A., Dorman, M. F., & Stearns, C. J. (1999). The role of consonant-vowel amplitude ratio in the recognition of voiceless stop consonants by listeners with hearing impairment. Journal of Speech, Language, and Hearing Research, 42, 42-55.
Schum D. (1996). Intelligibility of clear and conversational speech of young and elderly talkers. Journal of the American Academy of Audiology, 7, 212-218.

121
Shannon, R. V., Zeng, F. G., Kamath, V., Wygonski, J., & Ekelid, M. (1995). Speech recognition with primarily temporal cues. Science, 270, 303-304.
Shannon, R. V., Zeng, F. G., & Wygonski, J. (1998). Speech recognition with altered spectral distribution of temporal cues. Journal of the Acoustical Society of America, 104, 2467-2476.
Smith, B. L. (2000). Variations in temporal patterns of speech production among speakers of English. Journal of the Acoustical Society of America, 108, 2438-2442.
Smith, R. L. (1979). Adaptation, saturation, and physiological masking in single auditory-nerve fibers. Journal of the Acoustical Society of America, 65, 166-178.
Souza, P. E. (2002). Effects of compression on speech acoustics, intelligibility, and sound quality. Trends in Amplification, 6, 131-165.
Souza, P. E., Jenstad, L. M., & Folino, R. (2005). Using multichannel wide-dynamic range compression in severely hearing-impaired listeners: effects on speech recognition and quality. Ear and Hearing, 26, 120-131.
Stelmachowicz, P. G., Pittman, A. L., Hoover, B. M., & Lewis, D.E. (2001). Effect of stimulus bandwidth on the perception of /s/ in normal- hearing-impaired children and adults. Journal of the Acoustical Society of America, 110, 2183-2190.
Stephens, J. D. & Holt, L. L. (2003). Preceding phonetic context affects perception of nonspeech. Journal of the Acoustical Society of America, 114, 3036-3039.
Stevens, K. N. (1980). Acoustic correlates of some phonetic categories. Journal of the Acoustical Society of America, 68, 836-842.
Stevens, K. N. & Halle, M. (1967). Remarks on analysis by synthesis and distinctive features. In Models for the perception of speech and visual form. W. Wathen-Dunn (Ed.) Cambridge, Mass.: MIT Press.
Stevens, K. N., & Klatt, D. H. (1974). Role of formant transitions in the voiced-voiceless distinctions for stops. Journal of the Acoustical Society of America, 55, 653-659.
Stone, M. A., & Moore, B. C. J. (1999). Tolerable hearing aid delays I. Estimation of limits imposed by the auditory path alone using simulated hearing losses. Ear and Hearing, 20, 182-192.
Stone, M. A., & Moore, B. C. J. (2002). Tolerable hearing aid delays II. Estimation of limits imposed during speech production. Ear and Hearing, 23, 325-338.
Stone, M. A., & Moore, B. C. J. (2003). Tolerable hearing aid delays III. Effects of speech production and perception of across-frequency variation in delay. Ear and Hearing, 24, 175-183.

122
Stone, M. A., & Moore, B. C. J. (2005). Tolerable hearing aid delays: IV. Effects on subjective disturbance during speech production by hearing-impaired subjects. Ear and Hearing, 26, 225-235.
Stone, M. A., Moore, B. C. J., Meisenbacher, K., & Derleth, R. P. (2008). Tolerable hearing aid delays V. Estimation of limits for open canal fittings. Ear and Hearing, 29, 601-617.
Summerfield, Q. & Haggard, M. (1977). On the dissociation of spectral and temporal cues to the voicing distinction in initial stop consonants. Journal of the Acoustical Society of America, 62, 435-448.
Summers, W. V., & Leek, M. R. The role of spectral and temporal cues in vowel identification by listeners with impaired hearing. Journal of Speech and Hearing Research, 35, 1189-1199.
Summers, V., & Leek, M. R. (1995). Frequency glide discrimination in the F2 region by normal-hearing and hearing-impaired listeners. Journal of the Acoustical Society of America, 97, 3825-3832.
Thibodeau, L. M. & Van Tasell, D. J. (1987). Tone detection and synthetic speech discrimination in band-reject noise by hearing-impaired listeners. Journal of the Acoustical Society of America, 82, 864-873.
Tilman, T. W., & Carhar, R. (1966). An expanded test for speech discrimination utilizing CNC monosyllabic words: Northwestern University’s auditory test no 6. SAM-TR-66-55.
Turner C. W., Souza, P. E., & Forget, L. N. (1995). Use of temporal envelope cues in speech recognition by normal and hearing-impaired listeners. Journal of the Acoustical Society of America, 97, 2568-2576.
Turner, C. W., Chi, S. L., & Flock, S. (1999). Limiting spectral resolution in speech for listeners with sensorineural hearing loss. Journal of Speech, Language, and Hearing Research, 42, 773-784.
Turner, C. W. & Cummings, K. J. (1999). Speech audibility for listeners with high-frequency hearing loss . American Journal of Audiology, 8, 47-56.
Turner, C. W. & Brus, S. L. (2001). Providing low- and mid-frequency speech information to listeners with sensorineural hearing loss. Journal of the Acoustical Society of America, 109, 2999-3006.
Turner, C. W., Fabry, D. A., Barrett, S., & Horwitz, A. R. (1992). Detection and recognition of stop consonants by normal-hearing and hearing-impaired listeners. Journal of Speech and Hearing Research, 35, 942-949.
Turner, C. W., Smith, S. J., Aldridge, P. L., & Stewart, S. L. (1997). Formant transition duration and speech recognition in normal and hearing-impaired listeners. Journal of the Acoustical Society of America, 101, 2822-2825.

123
Tyler, R., Wood, E., & Fernandes, M. (1982). Frequency resolution and hearing loss. British Journal of Audiology, 16, 45-63.
Tyler, R. Hall, J., Glasberg, B. C. J., & Patterson, R. (1984). Auditory filter asymmetry in the hearing impaired. Journal of the Acoustical Society of America, 76, 1363-1368.
Uchanski, R. M., Choi, S. S., Braida, L. D., Reed, C. M., Durlach, N. I. (1996). Speaking clearly for the hard of hearing IV: Further studies of the role of speaking rate. Journal of Speech and Hearing Research, 39, 494-509.
Van Tasell, D. J., Soli, S. D., Kirby, V. M., & Widin, G. P. (1987). Speech waveform envelope cues for consonant recognition. Journal of the Acoustical Society of America, 82, 1152-1161.
Wade, T. & Holt, L. L. (2005). Effects of later-occurring nonlinguistic sounds on speech categorization. Journal of the Acoustical Society of America, 118, 1701-1710.
Walden, B. E., Schwartz, D. M., Montgomery, A. A., & Prosek, R. A. (1981). A comparison of the effects of hearing impairment and acoustic filtering on consonant recognition. Journal of Speech and Hearing Research, 24, 32-43.
Warren, R. M., Reiner, K. R., Bashford, J. A., Jr., & Brubaker, B. S. (1995). Spectral redundancy: Intelligibility of sentences heard through narrow spectral slits. Perception & Psychophysics, 57, 175-182.
Yuan, H., Reed, C. M., & Durlach, N. I. (2004). Envelope-onset asynchrony as a cue to voicing in initial English consonants. Journal of the Acoustical Society of America, 116, 3156-3167.
Zeng, F. G. & Turner, C. W. (1990). Recognition of voiceless fricatives by normal and hearing-impaired listeners. Journal of Speech and Hearing Research, 33, 440-449.
Zurek, P. M. & Delhorne, L. A. (1987). Consonant recognition in noise by listeners with mild and moderate sensorineural hearing impairment. Journal of the Acoustical Society of America, 82, 1548-1559.