the impact of product value, product evaluation, …
TRANSCRIPT

THE IMPACT OF PRODUCT VALUE, PRODUCT
EVALUATION, PRICE AND BRAND POSITIONING
TOWARDS CONSUMER PURCHASING DECISIONS
(A CASE STUDY OF LENOVO LAPTOP USERS IN CENTRAL JAKARTA)
By
Yang Xiaobing
ID no. 014201300166
A skripsi presented to the
Faculty of Business President University
In partial fulfillment of the requirements for
Bachelor Degree in Economics Major of Management
April 2017

i
PANEL OF EXAMINERS
APPROVAL SHEET

ii
SKRIPSI ADVISER
RECOMMENDATION LETTER

iii
DECLARATION OF ORIGINALITY

iv
ABSTRACT
The purpose of this study is to examine the purchasing decisions of consumers through
the investigation of Lenovo laptop users. The study included four independent
variables (product value, product evaluation, price and product positioning) and a
dependent variable (consumer purchase decision). Researchers used quantitative
studies to study the data, which was collected using questionnaires. A total of 150
questionnaires were valid in this study. Multivariate regression tests were performed
using the T test (partial test) and F test (simultaneous test) hypothesis test to analyze
the effect of the dependent variable on the dependent variable. Data analysis uses SPSS
20.0 to generate results. The findings of this study that product evaluation and price do
not have a significant impact on consumer purchasing decisions. The four variables of
product value, product evaluation, price and product positioning have a significant
impact on consumer purchasing decisions. At the same time, these four important
independent variables provide 44% of the dependent variable.
Key words: Technology, product value, product evaluation, price, product
positioning, consumers purchasing decisions.

v
ACKNOWLEDGEMENT
I'm very glad to study in President University, I would like to thank President
University for giving me the opportunity to achieve and obtain my bachelor degree, I
also thank you very much for many people who helping and supporting me during the
skripsi process. Without family, friends and the advisor’s help, I can't complete my
thesis. These people are:
1. I want to thanks to my thesis advisor Ms. Siska. Thank you for teaching me how to
write the thesis, giving me the most professional knowledge and skills, give me the
most accurate and most useful guidance and advice. Thank you for your help, if
without your help and advice, I can't complete my thesis smoothly.
2. I want to thank my family, my parents. Thank you for always supporting me,
encouraged me, always believe me and give me confidence. Especially during the
thesis process you always enlighten and comfort me. At the same time I also thank
you very much for parents care about me in the life all the time.
3. I would like to express my gratitude to my dearest friends of batch 2013 Chinese
friends. Thank you for your help and support me during my thesis process and my
college life in President University.
Cikarang, April 10st, 2017
My deeply gratitude
Yang Xiaobing

vi
TABLE OF CONTENTS
PANEL OF EXAMINERS
APPROVAL SHEET ................................................................................................... i
SKRIPSI ADVISER
RECOMMENDATION LETTER ............................................................................. ii
DECLARATION OF ORIGINALITY .................................................................... iii
ABSTRACT ................................................................................................................ iv
ACKNOWLEDGEMENT .......................................................................................... v
TABLE OF CONTENTS ........................................................................................... vi
CHAPTER I
INTRODUCTION ....................................................................................................... 1
1.1 Background ..................................................................................................... 1
1.2 Problem Identification ..................................................................................... 4
1.3 Statement of Problem ...................................................................................... 4
1.4 Research Objectives ........................................................................................ 5
1.5 Significance of the Study ................................................................................ 5
1.6 Scope and Limitation of the Study .................................................................. 6
CHAPTER II
LITERATURE REVIEW ........................................................................................... 7
2.1 Consumer Purchasing Decisions ..................................................................... 7
2.2 Product Value .................................................................................................. 7
2.3 Product Evaluation .......................................................................................... 8
2.4 Price................................................................................................................. 9
2.5 Brand Positioning ............................................................................................ 9
2.6 Previous Researches ...................................................................................... 10
2.7 Research Gaps ............................................................................................... 15
2.8 Theoretical Framework ................................................................................. 17

vii
2.9 Hypothesis ..................................................................................................... 18
CHAPTER III
METHODOLOGY .................................................................................................... 19
3.1 Research Method ........................................................................................... 19
3.2 Operational Definition of Variables .......................................................... 20
3.3 Research Framework ..................................................................................... 22
3.4 Research Instrument ...................................................................................... 24
3.5 Sampling Design ........................................................................................... 25
3.5.1 Research population ........................................................................... 25
3.5.2 Sample size......................................................................................... 25
3.5.3 Sampling technique ............................................................................ 26
3.5.4 Data collection method ...................................................................... 27
3.6 Validity and Reliability Test ......................................................................... 28
3.6.1 Validity Test ....................................................................................... 28
3.6.2 Reliability Test ................................................................................... 29
3.7 Descriptive Statistics Analysis ...................................................................... 30
3.7.1 Mean ................................................................................................... 30
3.7.2 Standard deviation .............................................................................. 30
3.8 Classical Assumption Test ............................................................................ 31
3.8.1 Normality Test ................................................................................... 31
3.8.2 Multicollinearity Test ......................................................................... 31
3.8.3 Heteroscedasticity Test ...................................................................... 32
3.8.4 Autocorrelation Test .......................................................................... 32
3.9 Multiple Linear Regressions ......................................................................... 32
3.10 Hypothesis Test ........................................................................................... 33
3.10 F - Test ................................................................................................ 33
3.10.2 T - Test ............................................................................................. 34

viii
3.11 Coefficient of Determination (R2) ............................................................... 35
CHAPTER IV
ANALYSIS AND RESULTS .................................................................................... 37
4.1 Pre-Test Result .............................................................................................. 37
4.1.1Validity Test ........................................................................................ 37
4.1.2 Reliability Test ................................................................................... 38
4.2 Descriptive Statistics Analysis ...................................................................... 39
4.3 Classical Assumption Test ............................................................................ 40
4.3.1 Normality Test ................................................................................... 40
4.3.2 Multicollinearity Test ......................................................................... 41
4.3.3 Heteroscedasticity Test ...................................................................... 43
4.3.4 Autocorrelation Test .......................................................................... 44
4.4 Multiple Linear Regressions ......................................................................... 44
4.5 Hypothesis Test ............................................................................................. 45
4.5.1 T-Test ................................................................................................. 45
4.5.2 F-Test ................................................................................................. 46
4.6 Coefficient of Determination (R2) ................................................................. 47
4.7 Interpretation of Result and Discussions ...................................................... 47
CHAPTER V
CONCLUSION AND RECOMMENDATION ...................................................... 51
5.1 Conclusion .................................................................................................... 51
5.2 Recommendation........................................................................................... 52
REFERENCES .......................................................................................................... 54
APPENDICES ........................................................................................................... 60
Appendix 1-Data Collection of Pre-test .............................................................. 60
Appendix 2-Reliability and Validity Test ........................................................... 62
Appendix 3-Questionnaire .................................................................................. 69

ix
Appendix 4-Data Collection for 110 Respondents ............................................. 72
Appendix 5-Output of SPSS 20.0 ....................................................................... 78

1
CHAPTER I
INTRODUCTION
1.1 Background
The first computer in the history of mankind was invented by the French scientist Blaise
Pascal in 1642. 30 years ago no laptop computers, desktop personal computer use is a
small number of people and technology research and development. The rapid
development of science and technology constantly affects all sectors of society.
Especially in the 21st century, such as network information technology and atomic
energy technology and many other technological and development profoundly changed
the natural and human fate (Lin, 2014).
In the information technology era, the revolution in IT technology has brought about a
rapid increase in the processing capacity of digital technology. Its technological
advancement may be crucial to the development of the IT industry where digital
devices are microprocessors, a collection of millions of tiny circuits, and as "brains"
for personal computers, from video games, cars, and refrigerators. Using the concept
known as Moore's Law, the amount of power in the processor doubles approximately
every two years. The use of nanowires in microprocessors in 2013 has allowed this
trend to be inherited, with the biggest gain from laptop computer (Peckham, 2013).
In 2015, the global PC industry continued to fall due to macroeconomic conditions and
exchange rate fluctuations. Lenovo's global PC sales fell 6% year on year to 5,600
million, the market is down 12%. Lenovo's personal computer business revenue of
29.646 billion US dollars, accounting for Lenovo's overall revenue of about 66%, down
11%, mainly due to exchange rate fluctuations and slowdown in demand for personal
computer market due. Excluding exchange rate factors, revenue decreased by about 6%

2
year on year. The PC business recorded a profit before tax of $ 1,491 million, compared
to $ 1,772 million in 2014 (Pan, 2016).
Lenovo Group announced a global restructuring plan to achieve cost savings. Lenovo
announced the layoffs in the global 3,200, of which Motorola mobile workers
accounted for the vast majority, which will bring one-time cost of 600 million US
dollars. Lenovo said, Motorola and Lenovo mobile phone integration will save a lot of
staff costs (Jun, 2016). Yang Yuanqing (Lenovo Group's CEO) said earlier, The reason
for the layoffs is mainly due to a serious decline in the personal computer market,
Lenovo PC slowdown, Lenovo's core business to deal with the challenges facing the
decline, in order to ensure efficiency, need to make some changes (Heater, 2016).
Indonesian Lenovo CEO Rajesh Hiro Thadani said he is trying to lead the computer
and notebook computer market in Indonesia, which is through the continuous
introduction of new products. "This is the main step to deal with the market." Indonesia
Lenovo also with the national computer retailers, at present, the country has 4,000 retail
stores, the sale of Lenovo products. Rajesh also believes that Lenovo to change the
logo after the image is very important, mainly in the education sector, Lenovo will be
through the implementation of Siap Maju as the theme of social semi-liability planning,
the ultimate development of customer networks (Indonesian Finance, 2016).
Below is the recent ranking of brand laptop computer:
Figure1.1 Top 10 Laptop Brands Ranking in Globally Source: http://www.laptopmag.com/articles/laptop-brand-ratings

3
Based on Table1.1from 2011 to 2016, APPLE ranks first, DELL continues to rise to
the second, ASUS increased from 7 to 3.In contrast, HP are down from the third to the
sixth. But LENOVO in 2014 decreased from the second to sixth rise back to fourth in
2015.
In today digital information age, office or learning, or entertainment and shopping,
need to use computer. Basically now every family has a computer. Era of rapid
development, science and technology product update the change quickly, people's
consumption level is relatively improved. Product value and product reviews for
consumers to purchase products are crucial determinants. When buy a product of
science and technology, whether car or TV, or even computers, product brand is very
important. Prices determine consumers' purchasing power. However, for different
products, buy with a same price, will affect purchasing power which will lead to a
different purchasing decision.
Figure1.2 Users of Laptop Brands in Indonesia
Source: http://www.di-onlinesurvey.com/en/2017/01/06/laptop-market-in-indonesia

4
The results were obtained through the use of computer brands in 500 local residents in
Indonesia. The survey concluded that: Acer in the first place, its share of 27%, the
second is Asus, accounting for 25%, Dell third, accounting for 11%; then Toshiba,
Lenovo and HP with the possession 9% of the proportion.
1.2 Problem Identification
Lenovo's position in Indonesia is not as good as imagined. The current personal
computer market will begin to fall into the sunset industry. Now in the traditional PC
industry has been ignored, the market competition pressure on other computer brands.
Indonesian Lenovo (2016) said PC sales were down from the third quarter of last year.
And last year, Indonesia's Lenovo Company confirmed that it had sold 1 million
computers and laptops. "The decline in sales volume is less than one point, but this
decline has caused us not to grow." According to Indonesian Lenovo, the retail market
is the largest contributor to sales, up 70%". The remaining 30% comes from the
company's market (Indonesian Finance, 2016). For this situation, there are many
factors that affect consumer purchasing decisions, including product value, product
evaluation, price, brand positioning and so on. These factors will affect Lenovo's long-
term future development, so the survey will do such a survey: product value, product
evaluation, price and brand positioning on the impact of consumer purchasing
decisions.
1.3 Statement of Problem
It is from these issues that the researcher planned to carry out a study based on the
factors affecting consumer purchasing decision:
1. Does product value have an impact on customer purchasing decisions?
2 Does product evaluation have an impact on customer purchasing decisions?
3 Does price have an impact on customer purchasing decisions?

5
4 Does brand positioning have an impact on customer purchasing decisions?
5 Does product value, product evaluation, price, brand positioning have an impact on
customer purchasing decisions?
1.4 Research Objectives
Base Don the purpose of the researcher, the research objective soft and study can be
interpreted as follows:
1. To find out the impact of product value on customer purchasing decisions.
2. To find out the impact of product evaluation on customer purchasing decisions.
3. To find out the impact of price on customer purchasing decisions.
4. To find out the impact of brand positioning on customer purchasing decisions.
5. To find out the impact of product value, product evaluation, price, brand
positioning on customer purchasing decisions.
1.5 Significance of the Study
The purpose is to study Lenovo notebook computers in the Indonesian market,. The
impact of product value, product evaluation, price, brand positioning to customer
purchasing decisions.
The study involved information management capabilities are hoping is significant for
the following:
1. For the company: This study will help Lenovo to judge the Indonesian market,
as well as the understanding of consumers. In the traditional PC industry to retain
the instability of the old user, in order to provide consumers with better choices.

6
2. For researcher: research consumer and problem on science and technology. For
the markets and customers have a very good improvement. To investigate and get
to what the customer favorite technology products. Make some research
orientation for the future marketing development of Lenovo.
3. For university: Help student’s later reference, and can be taken to help them study
the literature, or the continuation of the study. So that this problem has been deeply
research, science and technology Development Company to get the majority of
studies.
1.6 Scope and Limitation of the Study
a. Scope
The scope of this survey is in the city of Jakarta, Indonesia, to find Lenovo laptop
customers to purchase decisions. The survey was conducted by local residents at
Central Jakarta (Mangga Dua Mall, Central Park and Mal Taman Anggrek) as a survey.
b. Limitation
Lenovo Group is the world's leading large brands, notebook computers, desktop
computers, mobile communications industry. The research, researchers only take
Lenovo notebook computer industry as an example. As the research time and limited
human resources, to take paper survey, Lenovo notebook computer stores to conduct
customer surveys, limited number of respondents. There are only four factors that
influence the purchase of products, such as product value, product evaluation, price,
brand positioning, and the factors that consumers may purchase. May be many, the
four factors can not contain a comprehensive. Researchers mainly in this paper, four
factors as long as the factors to study.

7
CHAPTER II
LITERATURE REVIEW
2.1 Consumer Purchasing Decisions
Before the consumer purchasing decision, usually consumer will ask more information
to marketer, to make sure intention products content and type either the desired product.
Consumers will get good product information before purchasing decisions (Vlašić,
Janković & Kramo, 2011). Others have a significant impact on consumer decisions.
When deciding when to buy or consume a product, the consumer's judgment may be
influenced by others, such as his wife, his intimate friend and his children, or even the
salesperson (Wood & Hayes, 2012).
Consumer purchasing decisions are primarily those that result from the purchase, use
of goods and services. Purchasing Decisions Consumers are decision-making processes
for individual participation in the assessment, acquisition, use or disposition of goods
and services. Consumer purchasing is an activity that is directly related to the
acquisition, consumption and disposal of goods and services, including the decision-
making process before and after such actions. The consumer purchase decision consists
of three main actions: buying, consuming, and processing the goods handling service.
Consumer decision-making is the active factor of competition theory. Consumer
behavior helps to formulate production policies. In order to effectively segment the
market and target marketing, it is important to know the consumers and their
purchasing decisions (Khuong & Duyen, 2016).
2.2 Product Value
Product value includes all the key elements of the product, as well as consumers in the
purchase of products to find the benefits. According to the interests of consumers,

8
demand and purchase decisions, for different customers, products, there are different
values. The consumer's idea of product value leads to buying behavior. Product prices
are an important part of the value sought by consumers, but the price is not the only
value the consumer appreciates, nor do the most influential factor consumers decide to
buy. In addition to a reasonable price, the consumer's desired product has many benefits,
including durability, appeal, and options for color, size, appearance modeling and other
characteristics. In the process of product quality of service, the effective embodiment
of product value (Holmes, 2010).
For a long time, price promotion has been the main strategy of the marketers, leading
consumers to guard against dealer promotions, and often expected to cut prices, which
led to lower product value. Many companies create standards for customer satisfaction
through goals and strategies, but only a few have focused on their customer experience
feedback problem (Kelsi, 2014).
2.3 Product Evaluation
Product evaluation and choice depends on the consumer's expectations of a product
become a reality, and become a goal, so that consumers take the initiative to
consumption. The attractiveness of the product prior to the selection, and the benefit of
selection and forecasting during consumption (Stijn, 2012). Provide product review
information, target consumers' reviews, analyze and leverage reviews by consumer
reviews, and effectively identify key aspects and benefit from consumer reviews
through consumer opinions (Yu, Zha, Wang & Chua, 2011).
The intrinsic attributes of the consumer's view of the product, such as quality and
reliability. Consumer attitudes towards the product and purchase intention. In the
process of product evaluation of consumers, product image directly affects consumers'
evaluation of products. Radio, television, art, school or film as a medium to display
products, will give customers a different product evaluation (Stoenescu, 2014).

9
2.4 Price
The amount of product payment in the general sense is called the price, he is a company
profitability and income of the main factors. In the marketing sense, however,
consumers use money to exchange the value of goods and services, or the fees
generated by products and services, which are called prices (Niharika, 2015). The price
is the quotation amount that the consumer must exchange to receive. Different elements
lead to different prices of products, so the price is not fixed, dynamic prices can
withstand the change of time. Pricing is determined by product costs, marketing and
operating costs, advertising costs, or price changes caused by various factors in the
market. The pricing of the products will also change relatively (Singh, 2012).
2.5 Brand Positioning
Brand positioning is the marketing staff strive to win the impression of consumers in
the market brand is located in the height or everywhere, because the concept of each
consumer is different, have different views, including different mentality and different
values. Brand positioning is basically defined as the product and brand attributes
convey to the customer's mind. We know that each customer is different, they have
different brand or product ideas, and they have different expectations of the brand or
product (Azmat & Lakhani, 2015).
Digital products business more competitive, more attention to digital products.
Understanding the brand positioning of the company's products is important to perceive
the consumer, in the product competition, depending on the brand positioning and then
the expected target shopping malls and consumers, consider how to supply. Branding
and positioning organizations, providing value through business and developing
customer value (Aditya, 2013). The paper uses the media category to analyze the brand
positioning, determines the appropriateness of the management decision, and
establishes the strategy through communication and target perception to the consumer

10
brand positioning (Blankson & Kalafatis, 2014). The brand positioning as a robust
indicator of consumer evaluation of co-brands. Positioning perceptions of partner
brands are positively related to co-brand positioning perceptions (Singh, Kalafatis &
Ledden 2014).
2.6 Previous Researches
In previous research about factors impact consumer purchasing decisions, there are
most realistic and important factors impact consumer purchasing decisions, and
through data collection and data analysis, it was important to determine which factors
were most important. Table 2.1 shows the previous researches:
Table 2.1 Previous Researches
No Previous Researcher Title of Previous Research Results
1 Shukla, P. (2010) Impact of Contextual
Factors, Brand Loyalty and
Brand Switching on
Purchase Decisions
The study examines our prior
knowledge regarding
influence of contextual
factors, and behavioral
intentions (brand loyalty and
brand switching) on the
purchase decisions. Using
extensive literature review
combined with exploratory
research involving focus
groups with young adults
separate scales were
identified and validated for

11
individual characteristics,
brand loyalty and brand
switching. To assess the
strength of the hypothesized
model, a survey of young
adults was conducted. The
segment was chosen
particularly for their spending
habits, trend setting attitude,
and approach to buying.
Analysis provided support for
the hypothesized framework.
2 Shamsunnahar Tania
(2012)
Factors Influencing
Teachers’ Laptop Purchases
The results show that all of
the independent variables
affect the purchase of the
laptop. The following factors
influence the consumer
purchase decision: brand,
technical, characteristics,
value and mobility. When
consumers decide to buy a
new laptop, the marketer
should consider the type,
purpose, and characteristics
of the customer. Because of
the importance of branding
and mobility to all consumer
groups, the researchers argue

12
that these features should be
emphasized in advertising
and advocacy.
3 Nadiya Nisar (2014) A Study into Purchasing
Decision of Laptops Owing
to Shift in Consumers'
Attitude From Perception to
Specification in Reference
With APPLE Computers
In this survey, the author use
the Brand Equity, Hedonic
Items, Utilitarian Items,
Consumer Emotional
Attachments, Perceived
Value and Brand
Commitment six Factors
Survey on consumer
purchasing decisions on the
Apple laptop.
It showed, brand attributes,
Consumer Emotional
Attachments, Utilitarian
Items and Perceived Value
play a key role in the decision
of consumers to buy Apple
computers.
4 S. Madhan Kumar &
V. Sathish Kumar
(2014)
A Study on Consumer
Preference and Satisfaction
towards Laptops with
Special Reference to Erode
In this paper, the use of data
analysis method is to find
consumers to buy laptop
factors, and analysis of
ranking. The results show
that the price accounted for
66% of the ratio, the quality
of 64%, battery life of 62%,

13
color of 46%. Through the
consumer search results to
collect the notebook how to
choose a variety of views,
products and services, price,
quality and technical support,
which accounted for the
highest proportion of the
price.
5 Gurleen (2014) Customer satisfaction and
factors influencing the
purchase decisions of
notebook computers in
Punjab
The author of the method
uses a quantitative approach
to extract the consumer
purchase decision using the
results shown. The author
through the notebook internal
configuration and external
image analysis to draw the
following conclusions, the
impact of the various factors
in the first, the memory and
the processor is located in the
second. Aesthetics is located
in the third, brand image in
the end.
6 Sejal Acharya (2015)
Mapping of Consumers’
Perception for Laptop
In this study, the author used
the notebook's function,
pricing, after-sales service,
warranty conditions and

14
promotional offers and other
factors to investigate the
impact of consumer
purchasing decisions on the
laptop. The results show that
all of these factors will have
an impact on consumer
decision-making. In order to
increase market share, the
company should provide a
better product development
pricing strategy, marketing
staff should improve the
quality of products and
services to make relative
efforts.
7 Yeriko A. N. Tampi,
Sifrid S. Pangemanan
and Ferdinand J.
Tumewu (2016)
Consumer Decision Making
in Selecting Laptop Using
Analytical Hierarchy
Process (AHP) Method
(Study: HP, ASUS and
TOSHIBA)
The results of the analysis
developed using analytical
hierarchy process (AHP) by
collecting data produced five
criteria (product value-added
features, designs, core
technologies, prices and
payment terms). When the
consumer chooses the
notebook computer, the
peripheral specification gives
the highest influence to

15
customer's choice. Followed
by the core technology
functions, and finally value-
added features.
Source: Constructed by Researcher (2017)
2.7 Research Gaps
Shukla (2010) pointed out Similar results were also observed from the brand switching
measurement model. In store promotion (the tangible connection point) was found to
be the most important factor affecting brand switching. It was also observed that
promotions which were advertised in various media such as television, radio and others
had low impact on consumer brand switching behavior. In this paper, the researchers
used four factors to study, from different directions and according to the relevance of
factors with the questionnaire on the consumer face to face data collection. Relatively
speaking, than the use of its brand-based basis has more elements, from different
aspects to reflect the real psychological consumers.
Shamsunnahar (2012) investigating the problems and factors that teachers have in the
process of purchasing a laptop and find the reasons for the teacher's purchase of the
laptop. Through the brand, technical, characteristics, value and mobility this five
factors to find teacher's purchasing decisions. In this study the author using product
value, product evaluation, price, and brand positioning four factors to investigate the
consumer masses choose to buy Lenovo brand laptop research. Relative to its research
content more purposeful, from four different aspects looking for a breakthrough in the
problem, the establishment of effective research direction.
Nadiya (2014) investigating the consumer's perception of Apple's brand and the key
factors in consumer buying decisions and the impact of student purchases on laptops.
The conclusion is that gender has no impact on the impact of laptop purchase decisions.

16
Brand loyalty makes consumers dependent on the study of consumer user surveys
without gender distinction, to ensure that each survey of consumers to an independent
personal perspective to complete the questionnaire.
Kumar and Kumar (2014) through the study of consumer preferences and satisfaction
with the notebook to find the factors that affect consumers to buy laptops. The impact
factors are: price, quality, Battery features, Technical features, Availability of color .In
this study, the researchers Four factors product value and price cover all of its factors,
and two other factors (brand positioning and product evaluation). Compared to the
more delicate and extensive.
Gurleen (2014) analyzed the laptop consumer purchase decisions, the use of multiple
brand models of laptop internal configuration and external price of the chain study, in
India Punjab with sampling research methods to do consumer purchase decision-
making survey. This study is located in Central Jakarta area, because India and
Indonesia citizen have different level of income and consumption. The object specify
in Lenovo's laptop only.
Sejal (2015) investigating consumers' use of laptop, look for consumer buying
decisions. The results show that most consumers choose their favorite brand when
purchasing a computer, refer to product information, information sources for the
official product configuration information, friends and network messages. Researchers
in this article from the product value, product evaluation, price and product positioning
in many aspects of consumer purchase decisions. In contrast, it is more comprehensive
and detailed, can explore consumer psychology, and in the hearts of consumers what
aspects of its decision-making more helpful.
Yeriko, Sifrid & Tumewu (2016) stated that by using the of five factors and three brands
using AHP and network source data analysis concluded that, peripheral equipment
specifications, core technology and value-added features of the three factors on the
consumer purchase laptop decision-making impact. This paper uses four factors to take

17
a sample survey method to collect first-hand data, looking for brand association only
the user to conduct research. Compared to more targeted and accurate.
2.8 Theoretical Framework
Researchers in the literature based on the following factors to determine the impact of
consumer purchasing decisions. This theoretical model contains independent and
dependent variables. The final theoretical model is as follows:
Figure 2.1 Theoretical Framework
Source: Theoretical Framework by Chen (2016)
According to the theoretical model of Figure 2.1, there are four independent variables
and one dependent variable: product value is X1, product evaluation is X2, price is X3

18
and brand positioning is X4 as independent variables. Consumer purchasing decision is
Y as dependent variable.
2.9 Hypothesis
Assumptions as a way of investigation are often used in groups to speculate. In order
to prove the authenticity of the problem, the investigators need to test hypothesis and
theoretical knowledge to examine how to use random sampling to determine whether
to support the hypothesis of the authenticity of the evidence (Antonio, 2010).
Hypothesis1: The product value has a significant impact on consumer purchasing
decision of Lenovo laptop.
Hypothesis2: The product evaluation has a significant impact on consumer purchasing
decision of Lenovo laptop.
Hypothesis3: The price has a significant impact on consumer purchasing decision of
Lenovo laptop.
Hypothesis4: The brand positioning has a significant impact on consumer purchasing
decision of Lenovo laptop.
Hypothesis5: The product value, product evaluation, price and brand positioning have
significant impact on consumer purchasing decision of Lenovo laptop simultaneously.

19
CHAPTER III
METHODOLOGY
3.1 Research Method
Research is the process of gathering and analyzing information to help researchers
obtain research results and increase the understanding of the subject matter (Edmonds
& Kennedy, 2010). In social phenomena, there are two types of variables, namely
quantitative and qualitative. Quantitative variables example are the word scale and the
number of statistics, usually used to measure or measure something. While quantitative
describes such as faith, feelings and attitudes such social phenomena cannot be
measured directly, and their essence is not quantitative (Sreevidya & Sunitha, 2011).
Qualitative methods can be applied to a range of research methods. Theories derive
from science, including linguistics, philosophy, anthropology, sociology, and
psychology. The diversity of qualitative research can define a set of core features that
can be interpreted and understood in depth, understanding the social and material
situation through the researcher's experience, viewpoints, and history. A detailed
description and classification of new concepts and ideas, to distinguish between the
type of association and development of the model and explain. A detailed description
and classification of new concepts and ideas, to distinguish between the type of
association and development of the model and explain. Emphasis on the Interpretation
of Social Meaning (Moriarty, 2011).
Quantification is an educational system. Researchers need to decide what to study, ask
specific narrow questions, collect quantifiable data, use statistical and mathematical
analysis of these collected figures, and conduct research in a fair and objective manner
(Edmonds & Kennedy, 2010). Quantitative studies are applicable to measurable

20
phenomena, and the results can be displayed in quantitative terms (Sreevidya & Sunitha,
2011).
3.2 Operational Definition of Variables
Table 3.1 Operational Definition
Variable Operational Definition Indicators
Product
value
Each consumer has a unique
value, consumers of product value
judgments directly affect the
consumer's buying behavior,
which includes: product
durability, color, size and
attractiveness (Holmes, 2010).
Durability: product quality and raw
material life cycle.
Color: Product appearance paint
color.
Size: The overall size and thickness
of the product.
Attractiveness: product modeling by
consumers like.
Product
evaluation
Consumer expectations of the
product is to determine whether
consumers buy products, one of
the main factors. Others
comments on the product reviews
and the quality and reliability of
the product itself will enable
consumers to establish a goal, and
take the initiative to buy (Stijn,
2012), (Yu, Zha, Wang & Chua,
2011) and (Stoenescu, 2014).
Recognized: The degree of
recognition of consumer products.
Opinion: Volkswagen consumers of
the brand products of good or bad
evaluation.
Quality: The operation speed of the
product, and the firmness of the
material.
Reliability: The product will not be
sold after the price of a substantial
price reduction or increase the price.

21
Price In marketing activities,
promotions and discounts are
often very tempting to consumers,
so that consumers have the desire
to buy. Product purchase payment
is called the price, but the
appropriate price to allow
enterprises to stable development.
Price as an objective factor
directly affect the consumer's
psychology (Niharika, 2015) and
(Singh, 2012).
Product: Product price and its
content have a corresponding level.
Promotion: Manufacturers in the
price does not affect the situation
with the gift of value-added products
as a promotional tool.
Discount: In the product
replacement, the product content and
price match.
Appropriateness: The price and its
contents correspond to the
circumstances, the consumer can
accept the product price.
Brand
positioning
Brand positioning is important for
consumer perception. Its purpose
is to allow consumers to recognize
the brand, the brand attributes
passed to consumers through the
advertising media and other forms
of brand image, so that consumers
can keep in mind (Azmat &
Lakhani, 2015), (Aditya, 2013)
and (Singh, Kalafatis, & Ledden
2014).
Perception: Consumers through the
brand comprehensive factors to
judge, according to past experience
and psychological cognitive process
of the brand acceptance.
Image: The brand public relations,
consumer brand, good or bad
judgment.
Spread: Brand in the public, such as
advertising, television, newspapers
and posters and so on.

22
Attitude: The brand's services can
enhance the attitude of consumers to
build the trust of consumers.
Consumer
purchasing
decisions
Consumers to buy products before
going to as much as possible to
understand the product
information, access to the hearts
of consumers expect the product.
Consumers in the purchase of
products in the process, there are
three main decisions: the
purchase, consumption and
services (Vlašić, Janković &
Kramo, 2011) and (Khuong &
Duyen, 2016).
Information: Consumers often go
back and understand the product's
information and content before
purchasing the product.
Purchase: When consumers buy
products, they often go back and
consider the added value of the
product.
Consumption: Consumers in the
process of consumption is not just to
buy a thing so simple, including the
procurement process and services.
Service: Consumers in the purchase
of products and services at the same
time, the impression of the product
brand and the judge is determined by
the service.
Source: Constructed by Researcher (2017)
3.3 Research Framework
This research mainly analyzes the influence of product value, product evaluation, price
and brand positioning on consumer purchase decision of Lenovo laptop users in Central
Jakarta. During the study, the researcher had to collect data at Central Jakarta (Mangga
Dua Mall, Central Park and Mal Taman Anggrek). Upon completion of the data

23
collection, the Researcher identifies the problem and finds the effect of each
independent variable on the dependent variable from the collected data. In the second
chapter of the literature, each factor has been the theoretical support. The support of
these theories and perspectives will help researchers refine the questionnaire.
Figure 3.1 Research Framework Source: Constructed by Researcher

24
In this paper, the process steps, first of all we want to point out the central goal of the
article and then to determine the problem, looking for the previous literature as a survey
of support. Find the survey population and create a questionnaire, and then through the
reliability and validity of the test to determine whether each problem is available, or
will be re-established or modified questionnaire re-test. Distribution of the
questionnaire to collect data and data analysis and interpretation, and finally draw
conclusions and put forward the feasibility of the proposal.
3.4 Research Instrument
Researcher need to use the most effective method to collect survey data. In the previous
theoretical support, researchers need to analyze and make use of effective factors to
make and send out questionnaires, and collect the raw data through questionnaire to
describe and analyze the results. Quantitative analysis can therefore be used to measure
and summarize the results of the analysis (Bryman, Bell, Mills & Yue, 2010).
Researchers used a quantitative approach to survey questionnaires as an instrument
(presented in English and Indonesian). The first few questions in the questionnaire
count the population's attributes and information, and then the problem turns into
technical questions about research objectives. Based on the Table 3.1 Operational
Definition’s Indicators, there four independent variables and one dependent variable,
25 questions were proposed (each factor is a set of 5 data sets, each group of data has
4 problems). They were measured on five-point Likert scale, 1 -5 are Strongly Disagree,
Disagree, Neutral, Agree, Strongly Agree (Figure 3.2). This chapter will provide a brief
description and analysis of the data, which will be analyzed and explained in more
detail in Chapter IV.

25
Table 3.2 Grade Statement
Degree Scale
Strongly Disagree (SD) 1
Disagree (D) 2
Neutral (N) 3
Agree (A) 4
Strongly Agree (SA) 5
Source: adopted Likert scale (Chen, 2016)
3.5 Sampling Design
3.5.1 Research population
In the study, the surveyed population must be within the scope of the investigator's
research objectives. To ensure the data accuracy of the population under investigation,
the researcher must use the sampling technique to test the population correctly, so that
the error may lead to erroneous data And inaccurate data (Bryman, Bell, Mills & Yue,
2010).In this study, the researcher used a sampling survey approach, the survey will be
located in the Central Jakarta (Mangga Dua Mall, Central Park and Mal Taman
Anggrek), Lenovo's consumers and intention to purchase.
3.5.2 Sample size
Sample size refers to the number of cases or units contained in a sample. In the sample
survey, the determination of sample size is very important. Sample size is too large,
will waste a lot of manpower, material and financial resources; sample is too small,
will make the sampling error is too large, the survey results and the actual situation
vary greatly affect the results of the survey (Sekaran & Bougie, 2013). Based on the

26
experience presented in the case, a sample size greater than 30 and less than 500 is
appropriate for most studies. Therefore, in this study, the investigators collected
samples for the number of 150 peoples to complete the investigation of the
experimental study. The sample size can be determined by the Slovin's formula:
𝒏 =𝐍
𝟏 + 𝐍𝐞²
So
𝑛 =150
1 + 150 × 0.05²
=109.09 (approximate value for 110)
Where:
n= sample size
N= population
e= level of confidence 95%
Based on the size of the sampling results, small letter total of 150 respondents were
interviewed by the investigators. Investigators can take paper-based questionnaires to
investigate and collect data.
3.5.3 Sampling technique
In the population sampling test, because the survey population is broad, cannot test to
each individual, the sampling technique may save time, the money, and the human
resources at the same time carries on the research. Probabilistic sampling techniques

27
can be used to test the accuracy of statistical methods, which can be used to estimate
population parameters, since it represents the entire population. Sampling techniques
are also a reliable technique for eliminating sampling bias (Bryman, Bell, Mills & Yue
2010).The investigators will use paper-based questionnaires to conduct interviews with
participating respondents at Central Jakarta (Mangga Dua Mall, Central Park and Mal
Taman Anggrek).
3.5.4 Data collection method
Data collection methods are part of the study design (Figure 3.2). There are three main
methods of data phones, questionnaires, interviews and observations of people and
phenomena. Each data collection method has its own shortcomings and advantages, in
the study of appropriate data collection methods will increase the research value
(Sekaran & Bougie, 2013).
Figure 3.2 Data collection methods (Shaded parts)
Source: Research Methods for Business "A Skill-Building Approach" (Sekaran & Bougie, 2013).

28
In this study, respondents were asked to use paper-type questionnaires and go to the
Central Jakarta (Mangga Dua Mall, Central Park and Mal Taman Anggrek) for study.
The details of the survey will be to each respondent, in order to determine the
authenticity of the data and the reliability of the results.
3.6 Validity and Reliability Test
3.6.1 Validity Test
Validity is the empirical evidence of the degree of comprehensive evaluation of
judgment, the adequacy of theoretical support and the appropriateness of reasoning,
based on test results or other behavioral measurement patterns. Validity is not an
inherent characteristic test. It is the reasonableness, specific purpose, and reasoning of
the use of test scores. Validity cannot be summarized by a single number such as
reliability numbers or standard measurement errors. Specific test results are used to
support meaningful test scores by accumulating empirical, statistical, conceptual and
theoretical support (Thompson, 2013).
The correlation coefficient is a measure of the relationship between the measured points
and the two variables, X and Y (David, Dennis and Thomas, 2011).
The Pearson product moment correlation coefficient is given by the following formula.
𝒓𝒙𝒚 =𝐒𝐱𝐲
𝐒𝐱𝐒𝐲
Where:
rxy = sample correlation coefficient
Sxy = sample covariance
Sx = sample standard deviation of x
Sy = sample standard deviation of y

29
3.6.2 Reliability Test
Reliability refers to the accuracy of the test scores or repeatability. The method of
assessing reliability is the internal consistency index, called KR-20 or α (alpha). The
KR-20 index ranges from 0.0 (test scores include only random errors) to 1.0 (test scores
have no measurement error). Full reliability is not possible, for high-risk certification
exams, expect a reliability of 0.90 or higher (Thompson, 2013).
𝛂 =𝐊 × 𝐫
𝟏 + (𝐊 − 𝟏)𝐫
Where:
K = total number of items
r = mean correlation between any variables
α = instrument reliability's coefficient
Table 3.4 Cronbach's Alpha Internal consistency
Cranach's Alpha Internal consistency
α ≥ 0.9 Excellent
0.7 ≤ α < 0.9 Good
0.6 ≤ α < 0.7 Acceptable
0.5 ≤ α < 0.6 poor
α < 0.5 Reject
Source: Andale (2012)
According to the standard and the higher the better value than the Alpha in Table3.4,
reliability testing cannot be less than 0.6. If less than 0.6, then the result will be rejected.

30
3.7 Descriptive Statistics Analysis
3.7.1 Mean
The most important position in the measurement is the average of the measured
variables. The measurement of the center position needs to be measured with the mean
value. If the data is sufficient, the mean isx, and if the data is for the population, the
mean is μ (David, Dennis & Thomas, 2011). In the statistical formula for the first time
that the value of the variable x with x1, the second for the x2, the first observation of
the variable i by xi. Sample average formula is as follows:
𝐱 =∑𝐱𝐢
𝐧
Where:
x = mean
∑ = summation
x = represents scores
n = number of scores
3.7.2 Standard deviation
The standard deviation is the sum of squares of the difference between each number of
data in a set and the mean of the set of data divided by the number of data, which is the
square root. The standard deviation is defined as the positive square root of the variance
(David, Dennis & Thomas, 2011).
𝐒 = √𝟏
𝐍 − 𝟏∑(𝐱𝐢 − 𝐱 )
𝟐𝐍
𝐢=𝟏

31
Where:
S = sample standard deviation
N = number of scores in a sample
N-1 = degrees of freedom or Bessel's correction
x = value of a sample
x = mean
3.8 Classical Assumption Test
3.8.1 Normality Test
Normality test is the process of data analysis, used to analyze the normal distribution,
the use of mathematical or graphical analysis to analyze the normal distribution of
samples or data. The most common normal distribution analysis model is Kolmogorov-
Smirnov (K-S ), The K-S test is a comparison of the sample scores in the normal
distribution set with the same standard deviation and the same mean, the residual is
normally distributed when the significant level is higher than 0.05 (Samuel, 2015).
3.8.2 Multicollinearity Test
Multicollinearity refers to the fact that independent variables are only used to interpret
or predict the value of the dependent variable. In multivariate regression, most
independent variables are, to some extent, mutually dependent (David, Dennis &
Thomas, 2011). Multicollinearity a test used to test the linear regression of the
correlations between independent variables. The higher the value, the independent
variables between the co-linearity and dependence of the relationship between the
variables will be independent variables (Samuel, 2015).

32
3.8.3 Heteroscedasticity Test
The Heteroscedasticity test is an important assumption for the classical linear
regression model to ensure that the regression parameter estimator has good statistics.
This assumption is not satisfied if the random error in the global function regression
does not satisfy the homogeneity variance (Samuel, 2015).
3.8.4 Autocorrelation Test
Autocorrelation is a periodic variable that tests for t, and whether there is a correlation
between the variable between its predecessor variable (t-1) and test t (Samuel, 2015).
The value of y (denoted by yt) at time t is related to the y value in the previous time
period. In this case known as autocorrelation (also known as serial correlation) exists
in the data (David, Dennis & Thomas, 2011).
3.9 Multiple Linear Regressions
In the regression analysis, when there are two or more independent variables, this
situation is called multiple regression. A phenomenon is often associated with a number
of factors, the optimal combination of multiple independent variables to jointly predict
or estimate the dependent variable than using only one independent variable to predict
or estimate more effective and more realistic. It's equation following:
𝐘 = 𝛃𝟎 + 𝛃𝟏𝐗𝟏 + 𝛃𝟐𝐗𝟐 + 𝛃𝟑𝐗𝟑 + 𝛃𝟒𝐗𝟒 + 𝛆
Where:
Y = dependent variable (consumer purchasing decisions)
β0 = Y intercept
β1 - β4 = regression coefficient
X1 = independent variable (product value)

33
X1 = independent variable (product evaluation)
X1 = independent variable (price)
X1 = independent variable (brand positioning)
ε = random error
3.10 Hypothesis Test
3.10 F - Test
F-test is a measurement model of the global significance test. F-test can be used to
analyze whether a dependent variable will be affected by an independent variable in a
study. The results were compared with standard mean significance (Samuel, 2015). The
formula is as following:
𝑭 = [
𝐑𝟐
𝐤 ]
⌈ ( 𝟏−𝐑𝟐 )
( 𝐧−𝐤−𝟏 ) ⌉
Where:
F = statistic test for F distribution
R2 = coefficient of determination
k = number of independent variables in the model
n = number of samples
H0: β1 = β2 =β3 =β4, when the significance of F > 0.05, then result will be accept H0
Ha: at least when βi 0, when the significance of F < 0.05, then result will be reject H0
In this study, α = 0.05 was considered significant. When the F test result is less than α
= 0.05, the result will be accepted. When the result of the F test is greater than α = 0.05,

34
the result is reject.
3.10.2 T - Test
In the T test, the results of the t test were compared with the t-table. The significance t
(P value) is used to determine whether the dependent variable will have an impact on
each of the independent variables (Samuel, 2015).
𝒕 = 𝐛𝐣 − 𝛃𝐣
𝐒𝐛𝐣
Where:
j = 1, 2, 3.... n
t = the significance of in dividable regression coefficients
bj = estimated coefficient of independent variable
βj = actual coefficient of independent variable
Sbj = standard error of the regression coefficient
The end of the test t, to detect the significant results (P value). There is significant P
value standard is α = 0.05. When the F test result is less than α = 0.05, the result will
be accepted. When the result of the F test is greater than α = 0.05, the result is reject.
1) H01: β1 = 0, when significant t > 0.05, then will be accept H01
There is not the product value has a significant impact on consumer purchasing
decision of Lenovo laptop.
Ha1: β1 0, when significant t < 0.05, then will be accept Ha1
There is the product value has a significant impact on consumer purchasing decision
of Lenovo laptop.

35
2) H02: β2 = 0, when significant t > 0.05, then will be accept H02
There is not the product evaluation has a significant impact on consumer purchasing
decision of Lenovo laptop.
Ha2: β2 0, when significant t < 0.05, then will be accept Ha2
There is the product evaluation has a significant impact on consumer purchasing
decision of Lenovo laptop.
3) H03: β3 = 0, when significant t > 0.05, then will be accept H03
There is not the price has a significant impact on consumer purchasing decision of
Lenovo laptop.
Ha3: β3 0, when significant t < 0.05, then will be accept Ha3
There is the price has a significant impact on consumer purchasing decision of Lenovo
laptop.
4) H04: β4 = 0, when significant t > 0.05, then will be accept Ha4
There is not the brand positioning has a significant impact on consumer purchasing
decision of Lenovo laptop.
Ha4: β4 0, when significant t < 0.05, then will be accept Ha4
There is the brand positioning has a significant impact on consumer purchasing
decision of Lenovo laptop.
3.11 Coefficient of Determination (R2)
R2 refers to the proportion of the total variance of the response dependent variable that
can be explained by the independent variable. If the R-square is 0.8, it means that the

36
regression relationship can explain 80% of the dependent variable variation. If you can
control the independent variable, the variation of the dependent variable will be
reduced by 80% (David, Dennis & Thomas, 2011).

37
CHAPTER IV
ANALYSIS AND RESULTS
4.1 Pre-Test Result
4.1.1Validity Test
In this test, the researcher selects 30 peoples for preliminary testing. If the result of R
is less than the R table, it means that the result is invalid and is not available. If the
result of R is greater than the R table, then the result is valid and available. Based on
the results of SPSS 20, Table 4.1 Result of Validity Test shows the results, all the data
is available.
Table 4.1 Result of Validity Test
Validity R-Table Corrected Item
Total correlation
Status
Product
Value
PV1 0.361 0.852 Valid
PV2 0.361 0.908 Valid
PV3 0.361 0.752 Valid
PV4 0.361 0.908 Valid
Product
Evaluation
PE1 0.361 0.566 Valid
PE2 0.361 0.912 Valid
PE3 0.361 0.912 Valid
PE4 0.361 0.764 Valid
Price P1 0.361 0.658 Valid

38
P2 0.361 0.811 Valid
P3 0.361 0.811 Valid
P4 0.361 0.487 Valid
Brand
Positioning
BP1 0.361 0.914 Valid
BP2 0.361 0.914 Valid
BP3 0.361 0.870 Valid
BP4 0.361 0.870 Valid
Consumer
Purchasing
Decisions
CPD1 0.361 0.943 Valid
CPD2 0.361 0.943 Valid
CPD3 0.361 0.786 Valid
CPD4 0.361 0.828 Valid
Source: Constructed in SPSS 20.0
4.1.2 Reliability Test
Table 4.2 Result of Reliability Test
Variable Cronbach's Alpha Remarks
Product value 0.873 Reliable
Product evaluation 0.786 Reliable
Price 0.625 Reliable
Brand positioning 0.912 Reliable
Consumer purchasing
decision
0.883 Reliable
Source: Constructed in SPSS 20.0

39
Based on Table 3.4, the minimum value of the standard value obtained by Cranach's
Alpha Internal consistency is α > 0.6. In reliability test, all the results are all greater
than 0.6, so these results are reliable.
4.2 Descriptive Statistics Analysis
Table 4.3 Descriptive Statistics
N Range Minimu
m
Maximu
m
Mean Std.
Deviation
Varianc
e
TPV 110 3.75 1.00 4.75 3.4727 .81510 .664
TPE 110 3.75 1.00 4.75 3.2000 .85925 .738
TP 110 3.75 1.00 4.75 3.2591 .79341 .630
TBP 110 4.00 1.00 5.00 3.3477 .76558 .586
TCPD 110 3.50 1.25 4.75 3.4477 .73345 .538
Valid N
(listwise) 110
Source: Constructed in SPSS 20.0
Based on the results of SPSS, the minimum and maximum values of the total consumer
purchasing decisions (TCPD) is 1.25 and 4.75, respectively, and the mean and standard
deviation is 3.4477 and 0.73345, respectively. The standard deviation shows a
maximum total product evaluation (TPE) is 0.85925. This result indicates that product
evaluation will be a key factor in customer acquisition decisions in this study.

40
4.3 Classical Assumption Test
4.3.1 Normality Test
Quantitative data common graphs are histograms. You can use the percentage of data
to outline histogram graphics. Place the variables on the horizontal axis and place the
frequency on the vertical axis to construct the histogram. The relative frequency
through the rectangle is shown for limiting the frequency corresponding to the height
(David, Dennis & Thomas, 2011).
Figure 4.1 Histogram Source: Constructed in SPSS 20.0
Based on Figure 4.1 Histogram, it can be seen that most of the results are displayed
between -2 and 2 according to the SPSS 20 output, and the graphic data are normal
distribution. The results show that the rectangles are well distributed and left and right.

41
Figure 4.2 Normal P - P Plot of Regression Standardized Residual Source: Constructed in SPSS 20.0
Based on Figure 4.2 Normal P - P Plot of Regression Standardized Residual. The results
show that in the normal distribution, the data spread around the diagonal and along the
diagonal direction, and then the regression model satisfies the assumption of normality.
4.3.2 Multicollinearity Test
Multiple colinearity is produced when at least two highly relevant predictors are
evaluated simultaneously in the regression model. Predictor variables between multiple
collinearity may blur the collinear predictor variables on the causal variables of the key
independent effects of the calculation and recognition as they share the overlapping
information. A common interpretation of the regression coefficients of a predictor as a

42
measure of the change in the expected value of the response variable due to the increase
in one unit of the predictive variable when the other predictor variables are kept
constant when the predictor is highly correlated, which may lead to The misleading
conclusion of the effect of each collinear predictor in the regression model (Kristina,
MinJae & Mohammad, 2016). Because multiple collinearity increases is different from
0, without multiple linearity and lower standard error. In the Collinearity Statistics is
divided into Tolerance and VIF, where Tolerance standard interval of 0.01 <x <1, VIF
standard interval of 0.1 <x <10. Interval with its results.
Table 4.4 Coefficientsa
Source: Constructed in SPSS 20.0
Based on the Table 4.4 Coefficientsa in Tolerance area, total product value (TPV) is
0.416, total product evaluation (TPE) is 0.417, total price (TP) is 0.456 and Brand
positioning is 0.491 The results of these independent variables are all 0.01 < x <1
standard Interval, didn't have multiollinearity problem.
Based on the Table 4.4 Coefficientsa in VIF area, total product value (TPV) is 2.403,
total product evaluation (TPE) is 2.398, total price (TP) is 2.159 and Brand positioning
Model Unstandardized
Coefficients
Standardized
Coefficients
t Sig. Collinearity
Statistics
B Std.
Error
Beta Tolerance VIF
(Constant) 1.186 .263 4.500 .000
TPV .176 .100 .196 1.761 .081 .416 2.403
TPE .262 .095 .307 2.766 .007 .417 2.398
TP .231 .098 .250 2.356 .020 .456 2.195
TBP .018 .098 .018 .179 .858 .491 2.035

43
is 2.035 The results of these independent variables are all 0.1 < x <10 standard Interval,
didn't have multiollinearity problem.
4.3.3 Heteroscedasticity Test
In the quantitative study population data test, the heteroskedasticity test is used for data
analysis to arrive at the results, to detect its randomness and values. The error may
increase as the IV value increases, or may increase as the IV value becomes extreme in
any direction, which will produce something of a similar shape (Williams, 2015).
Figure 4.3 Scatter plot of Heteroskedasticity Source: Constructed in SPSS 20.0 (2017)
Based on Figure 4.3 Scatter plot of Heteroskedasticity, derived from the SPSS20 output.
In the normal distribution of the graph, the data is randomly scattered without
patterning. The results show no heteroscedasticity.

44
4.3.4 Autocorrelation Test
When there have autocorrelation, a significant error in the test of statistical significance
can be performed based on the assumed regression model. Therefore, it is important to
be able to detect autocorrelation and take corrective action. Durbin and Watson
developed a table that can be used to determine when the test statistic indicates the
presence of autocorrelation (David, Dennis and Thomas, 2011). The standard range of
the Durbin-Watson is -2 <x <2. When the result belongs to the standard range of
Durbin-Watson, it will pass the autocorrelation test.
Table 4.5 Model Summaryb
Mode
l
R R Square Adjusted R
Square
Std. Error of
the Estimate
Durbin-Watson
1 .679a .461 .440 .54877 1.975
Source: Constructed in SPSS 20.0 (2017)
According the Table 4.5 Model Summaryb, result of SPSS 20 is 1.975 belongs to the
standard range of Durbin-Watson. So, there didn't have problem of autocorrelation.
4.4 Multiple Linear Regressions
Dependent variables are predicted variables. One or more variables that can be used to
predict the value of a dependent variable are called independent variables. Regression
involves two or more independent variables. Multiple regression analysis is usually
used to describe y and X related equations and error terms (David, Dennis & Thomas,
2011).
In this survey, the investigator selected value as the coefficient of the multivariate
regression equation. For the analysis and testing of the multivariate regression equation,
the multivariate regression line is based on the independent variables because all
variables are the same.

45
In this study, the confidence was 95%, so the maximum error was 5% (0.05). When the
result was less than or equal to 0.05, the result would be significance. Based on the
results of Table 4.4, the product value (X1) is 0.081, product evaluation (X2) is 0.007,
price (X3) is 0.020 and brand positioning (X4) is 0.858. The values of X1 and X4 are all
greater than 0.05, so X1 and X4 is not significance. X2 and X3 are less than 0.05, so X2
and X3 is significance. The multiple regression line models as follows:
Y=0.307X2+0.250X3+ε
According to the regression line equation, X2 has an effect of 0.307 on Y. If other
factors remain unchanged, X2 increases or decreases by one point, then Y will increase
or decrease by 0.307.
According to the regression line equation, X3 has an effect of 0.250 on Y. If other
factors remain unchanged, X3 increases or decreases by one point, then Y will increase
or decrease by 0.250.
4.5 Hypothesis Test
4.5.1 T-Test
T is expressed in units of standard error calculation. T of greater amplitude (it can be
positive or negative), more evidence for the null hypothesis, namely there is no
significant difference. T is close to zero, the less likely exists significant differences.
Repeat random sampling data in the same group, and each will have a slightly different
t value, this is due to random sampling error (Patrick, 2016). The significant confidence
interval is < 0.05.
On the result of analysis Table 4.4 shows about the researcher analysis of 4 independent
variable as following:

46
Product value (x1): result of t is 0.081 > 0.05, the product value has not significant
impact on consumer purchasing decision of Lenovo laptop.
Product evaluation (x2): result of t is 0.007 < 0.05, the product evaluation has a
significant impact on consumer purchasing decision of Lenovo laptop.
Price (x3): result of t is 0.020 < 0.05, the price has a significant impact on consumer
purchasing decision of Lenovo laptop.
Brand positioning (x4): result of t is 0.858 > 0.05, the brand positioning has not
significant impact on consumer purchasing decision of Lenovo laptop.
4.5.2 F-Test
F statistics is based on the ratio of mean square. Is used to calculate the estimate of the
degrees of freedom (DF) of the population variance estimation. F test assesses the
equality of variance. By changing the included in the ratio of the variance, F inspection
become very flexible. Can use F statistic and F test to test the regression model is
significant on the whole, compare different model fitting, specific regression test item
and test mean equality (Jim, 2016). When the result would be impact of independent
variable should significance < 0.05.
Table 4.6 ANOVAa
Model Sum of
Squares
df Mean
Square
F Sig.
1
Regression 27.016 4 6.754 22.427 .000b
Residual 31.621 105 .301
Total 58.637 109
Source: Constructed in SPSS 20.0

47
On the result of Table 4.6 shows, P value (Sig.) is 0.000 < 0.05. So product value (x1),
product evaluation (x2), price (x3) and brand positioning (x4) all independent variable
have the significance toward impact of dependent variable consumer purchasing
decisions (Y).
4.6 Coefficient of Determination (R2)
The coefficient is often expressed as a percentage, and the higher the coefficient, the
higher the percentage of the data and the percentage of the first pass. If the coefficient
is 0.80, then 80% of the points should be in the regression line, the value of 1 or 0
means that the regression line all data or no data (Andale, 2012)
Table 4.7 Model Summaryb
Mode
l
R R Square Adjusted R
Square
Std. Error of
the Estimate
Durbin-
Watson
1 .679a .461 .440 .54877 1.975
Source: Constructed in SPSS 20.0
According to Table 4.7 Model Summaryb, the results showed that R is 0.679, R Square
is 0.461. In the research, because the number of independent variables is more than 2,
so you need to use Adjusted R Square is 0.440, so the proportion of factors in this
survey accounted for 44%, the remaining 56% in other surveys.
4.7 Interpretation of Result and Discussions
H1:Hypothesis 1: The product value has a significant impact on consumer
purchasing decision of Lenovo laptop.

48
Based on 4.5.1 T-Test, the result showed that the product value has not significant
impact on consumer purchasing decision of Lenovo laptop. Following Table 4.4
Coefficientsa the result P-value of product value is 0.081, this result more than 0.05, so,
Ha is rejected and the H1 is accepted.
Nadiya (2014) investigates consumer decision-making on Apple laptops, and perceived
value plays a key role in the decision of consumers to buy Apple laptops. In the product
appearance, shape and color, etc. are mostly in line with the needs of consumers. Most
consumers say that looking for more value-added products.
Data analysis shows that the product value of this factor has no significant on customer
purchasing decision. Lenovo users in the Central Jakarta survey, indicate Lenovo’s
Series of products (ThinkPad and IdeaPad) is have with the values of mass users.
H2: The product evaluation has a significant impact on consumer purchasing
decision of Lenovo laptop.
Based on 4.5.1 T-Test, the result showed that the product evaluation has a significant
impact on consumer purchasing decision of Lenovo laptop. Following Table 4.4
Coefficientsa the result P-value of product value is 0.007, this result less than 0.05, so,
Ha is accepted and the H1 is rejected.
Stijn (2012) product evaluation and choice depends on the consumer's expectations of
a product become a reality, and become a goal, so that consumers take the initiative to
consumption. The attractiveness of the product prior to the selection, and the benefit of
selection and forecasting during consumption.
Based on the result in this research, the product evaluation has a significant impact on
consumer purchasing decision of Lenovo laptop.
H3: The price has a significant impact on consumer purchasing decision of
Lenovo laptop.

49
Based on 4.5.1 T-Test, the result showed that the price has a significant impact on
consumer purchasing decision of Lenovo laptop. Following Table 4.4 Coefficientsa the
result P-value of product value is 0.020, this result less than 0.05, so, Ha is accepted
and the H1 is rejected.
Kumar & Kumar (2014) though use of data analysis method is to find consumers to
buy laptop factors, and analysis of ranking. The results show that the price accounted
for 66% of the ratio, the quality of 64%, battery life of 62%, color of 46%. Through the
consumer search results to collect the notebook how to choose a variety of views,
products and services, price, quality and technical support, which accounted for the
highest proportion of the price.
Based on the result in this research, the price has a significant impact on consumer
purchasing decision of Lenovo laptop.
H4: The brand positioning has a significant impact on consumer purchasing
decision of Lenovo laptop.
Based on 4.5.1 T-Test, the result showed that the brand positioning has not significant
impact on consumer purchasing decision of Lenovo laptop. Following Table 4.4
Coefficientsa the result P-value of product value is 0.858, this result more than 0.05, so,
Ha is rejected and the H1 is accepted.
Aditya (2013) digital products business more competitive, more attention to digital
products. Understanding the brand positioning of the company's products is important
to perceive the consumer, in the product competition, depending on the brand
positioning and then the expected target shopping malls and consumers, consider how
to supply. Branding and positioning organizations, providing value through business
and developing customer value.
In this study, the brand positioning has not significant impact on consumer purchasing
decision of Lenovo laptop. Lenovo brand in Indonesia has a high reputation. In the

50
laptop industry, Lenovo's brand positioning is very clear, but also in line with the minds
of consumers brand image.
H5: The product value, product evaluation, price and brand positioning have
significant impact on consumer purchasing decision of Lenovo laptop
simultaneously.
Based on Table 4.5 Model Summaryb result, the R Square is 0.461. That result showed
there are two independent variables (X) on the impact towards dependent variable (Y).
And then, significant standard values were 0.05, compared to less than the results of
0.00, this means that all of X have an impact on Y.
Shukla (2010) in this research results show that contextual factors, brand loyalty, brand
switching three independent variables on the purchase or replacement of laptop
customers have an impact on the decision. Research shows that with the progress of
science and technology, product promotion at the same time, the external factors on the
impact of consumer decision-making more important.
For final result of this study, the product evaluation and price has significant impact on
consumer purchasing decision of Lenovo laptop.

51
CHAPTER V
CONCLUSION AND RECOMMENDATION
5.1 Conclusion
Through the analysis of the results and explanations of the previous chapters, the paper
summarizes the impact of the dependent variables, which are product value, product
evaluation, price and brand positioning toward the customer purchase decision in the
Central Jakarta,
1. Based on result of t test the product value has no significant impact on consumer
purchasing decision of Lenovo laptop. This means in the product appearance, shape
and color, etc. Lenovo companies also need to work. Most consumers say they are
looking for more value-added products.
2. Based on result of t test the Product evaluation has a significant impact on consumer
purchasing decision of Lenovo laptop. This means product evaluation on the impact of
consumers is very important, Lenovo should be in the promotion of their products at
the same time should improve service attitude.
3. Based on result of t test the Price has a significant impact on consumer purchasing
decision of Lenovo laptop. This means the price is that every consumer will be
concerned about the problem, consumers agree with the price of the product location,
this product will be recognized by consumers.
4. Based on result of t test the Brand positioning has no significant impact on consumer
purchasing decision of Lenovo laptop. This means Lenovo company should increase
its advertising and media coverage in Indonesian laptop market.
5. The results show that the adjusted R squared is 0.44, which means that two
independent variables have an impact on the dependent variable. Results the

52
significance of F p-value are 0.00, and the result was less than the significance of 0.05,
so the results were significant. The result means that all the independent variables have
a significant impact on the independent variables.
5.2 Recommendation
a. For Lenovo company:
1. The survey results showed that product value doesn’t have any impact on consumer
purchasing decisions. It is recommended that when Lenovo company in the new
innovative products, at the same time, make they to take the users opinion from
the product itself, so it will allow customers to more easily accept the value of new
products and better quality of user experience.
2. The survey results showed that brand positioning doesn’t have any impact on
consumer purchasing decisions. It is recommended that Lenovo company should
increase its advertising and media coverage in Indonesian notebook market.
Lenovo can use a variety of media to help consumers build a good consumer
awareness and Lenovo uses kinds of activities in order to provide a consumer's
clear impression on the brand position, so that consumers understand Lenovo’s
brand and brand positioning.
b. For future researcher:
1. This research uses product value, product evaluation, price and brand positioning
in four directions to make Lenovo brand users to investigate. For the future research
needs to go further, the use of a number of factors, make the study more delicate
and more targeted.
2. Future laptops will certainly make a change from the product itself, for example,
battery, screen and additional functions. The researchers recommended that in

53
future studies, the product itself for the investigation of the customer experience or
customer satisfaction research made.

54
REFERENCES
Books
Anol Bhattacherjee. (2012). Social Science Research: Principles, Methods, and
Practices, 2ndedition.
Alan Bryman, A., Emma Bell, E., Albert J. Mills. & Anthony R. Yue. (2010). Business
Research Methods. Library and Archives Canada Cataloguing in Publication.
David R. Anderson., Dennis J. Sweeney. & Thomas A. Williams. (2011). Statistic for
Business and Economics 11e. © 2011, 2008 South-Western, Cengage Learning.
Eleventh EditionMoriarty, J. (2011). Qualitative Methods Overview. © School for
Social Care Research, ISBN 978-0-85328-455-0.
Sekaran, U. & Bougie, R. (2013). Research Methods for Business: A Skill-Building
Approach, 6th Edition. Southern Illinois University at Carbondale. © John Wiley
& Sons, Inc.
U. Sreevidya, Sunitha. K. & K. Venugopalan. (2012). Business Research Methods.
Calicut university P.O, Malappuram Kerala, India 673 635. School of Distance
Education.
Journals
Aditya, W. A. (2013). Positioning Analysis of Top Brand Digital Products in Indonesia.
International Journal of Science and Research. Vol.4. 274-279.
Alfred, O. (2013). Influences of Price and Quality on Consumer Purchase of Mobile
Phone in the Kumasi Metropolis in Ghana A Comparative Study. European
Journal of Business & Management. Vol.5 (1). 179-198.

55
Antonio, P. (2010). Tympanoplasty in Children: A Review of 91 Cases. Auris Nasus
Larynx, 38(1). 21-25.
Blankson, C., & Kalafatis, S.P. (2014). Positioning Strategies of International and
Multicultural-Oriented Service Brands. Journal of Services Marketing, Vol. 21(6).
435-450.
Edmonds, W. A., & Kennedy, T. D. (2010). A Reference Guide to Basic Research
Design for Education and the Social and Behavioral Sciences. Journal of Family
Violence. Vol.25 (5). 509-520.
G. Vlasic, M. Jankovic, & A. Kramo-Caluk. (2011). Information Hunt: The Impact of
Product Type and Time Pressure on Choice of Information Source for Purchase
Decisions. Management Journal of Contemporary Management. Vol.16. 87-103.
Holmes, T. (2010). Value-added Wood Products Marketing Guide for Manufacturers
and Entrepreneurs. International Journal of Trade, Economics and Finance. Vol.
6(4). 440-453.
Kristina P. V., MinJae, L. M., Joseph B. M. & Mohammad H. R. (2016).
Multicollinearity in Regression Analyses Conducted in Epidemiologic Studies.
Epidemiology (Sunnyvale, Calif). Vol. 6(2). 212-217.
Kanwal G. K. (2014). Customer Satisfaction and Factors Influencing the Purchase
Decisions of Notebook Computers in Punjab. Journal of Research in
Marketing.Vol. 2(3). 205.
M. Azmat. & A. S. Lakhani. (2015). Impact of Brand Positioning Strategies on
Consumer Standpoint (A Consumer’s Perception). Journal of Marketing and
Consumer Research. An International Peer-reviewed Journal. Vol.14. 109-116.

56
M. N. Khuong, H. T. M., Duyen K. M. N., & Ngoc, N. T. (2016). Personal Factors
Affecting Consumer Purchase Decision Towards Men Skin Care Products — A
Study in Ho Chi Minh City, Vietnam. International Journal of Trade, Economics
and Finance. Vol. 7(2). 44-50.
Niharika. (2015). Effect of Marketing Mix on Customer Satisfaction. International
Journal of Science, Technology & Management. Vol.4 (1). 73-81.
Nadiya, N. (2014). A Study into Purchasing Decision of Laptops Owing to Shift in
Consumers Attitude from Perception to Specification in Reference with APPLE
Computers. Abhinav International Monthly Refereed Journal of Research in
Management & Technology. Vol. 3(11). 44-50.
Qiao, J. L. (2014). Ethical Thinking of The Development of Science and Technology.
International Conference on Social Science. 384-387.
Ribeiro, J. C., Rui, C., Natercia, S., Jose, R., & Antonio, P. (2011). Tympanoplasty in
Children: A Review of 91 Cases. Auris Nasus Larynx. Vol.38 (1), 21-5.
Stoenescu, R. D. G. (2014). Stereotypes in Consumers’ Product Evaluation Based on
the Country-of-Origin. SEA - Practical Application of Science. Vol.11 (3). 623-
630.
Singh, M. (2012). Marketing Mix of 4p’s for Competitive Advantage. Gifts &
Decorative Accessories. Vol. 3(6). 40-45.
Samuel Sutanto, S. (2015). The Analysis of Motivation towards Luxury Car
Consumption in Surabaya. IBuss Management. Vol. 3(2). 442-450.
Singh, J., Kalafatis, S.P., Ledden, L. (2014). Consumer Perceptions of Cobrands: The
Role of Brand Positioning Strategies. Marketing Intelligence & Planning, Vol.
32(2). 145 – 159.

57
Shukla, P. (2010). Impact of Contextual Factors, Brand Loyalty and Brand Switching
on Purchase Decisions. Journal of Consumer Marketing. Vol. 26(5). 348-357.
S. M. Kumar, M. Phill & V. S. Kumar. (2014). A Study on Consumer Preference and
Satisfaction towards Laptops with Special Reference to Erode. Journal of
Business and Management. Pp. 54-56.
Stijn, M. J.O. & C. Janiszewski. (2012). A Goal-Based Model of Product Evaluation
and Choice. Moriarty Journal of Consumer Research. Vol. 39(2). 260-292.
Sejal, A. S. & A. C. Brahmbhatt. (2015). Mapping of Consumers’ Perception for
Laptop. Indian Journal of Research. Vol.4 (9). 204-207.
Sekaran, U., & Bougie, R. (2013). Research Methods for Business: A Skill-Building
Approach. Leadership & Organization Development Journal. Vol.34 (7).700-701.
Shamsunnahar T. S. (2012). Factors Influencing Teachers’ Laptop Purchases. Ulab
Journal of Science and Engineering. Vol.3 (1). 12-17.
Srichetta, P., & Thurachon, W. (2012). Applying Fuzzy Analytic Hierarchy Process to
Evaluate and Select Product of Notebook Computers. International Journal of
Modeling & Optimization. Vol. 2(2). 168-173.
Thompson, N. A. (2013). Reliability & Validity. Journal of Language Teaching &
Research. Vol. 3(3). 30-32.
Valters, K. (2010). The Impact of Customer Values on Purchasing Behavior: A Case
of Latvian Insurance Market. Economics & Management. 605-611.
Wood, W., & Hayes, T. (2012). Social Influence on Consumer Decisions: Motives,
Modes, and Consequences. Journal of Consumer Psychology. Vol. 22(3). 324–
328.

58
Williams, R. (2015). Heteroskedasticity. The Journal of European Physical. Vol. 51(5).
1-16.
Yeriko, A. N. Tampi., S. S. Pangemanan, F. J. Tumewu. (2016). Consumer Decision
Making in Selecting Laptop Using Analytical Hierarchy Process (AHP) Method
(Study: HP, ASUS and TOSHIBA). Journal of Consumer Psychology. Vol. 28(5).
366–371.
Yu, J., Zha, Z. J., Wang, M., & Chua, T. S. (2011). Aspect Ranking: Identifying
Important Product Aspects from Online Consumer Reviews. Meeting of the
Association for Computational Linguistics: Human Language Technologies.
1496-1505.
Websites
Brian Heater (2016). “Lenovo undergoes another big layoff round, mostly impacting
Motorola” https://techcrunch.com/2016/09/26/lenovo-layoffs/
Brand ranking: http://www.laptopmag.com/articles/laptop-brand-ratings
Indonesian Finance. (2013). Lenovo pasar PC untuk memperkuat negara kita akan terus
meluncurkan produk baru. http://www.shangbaoindonesia.com/?p=91396
Indonesian Finance. (2016). PC pengusaha kelemahan pasar untuk menampilkan
strategi baru mereka. http://www.shangbaoindonesia.com/?p=153106
Jim Frost. (2016) Understanding Analysis of Variance (ANOVA) and the F-
test.http://blog.minitab.com/blog/adventures-in-statistics-2/understanding-
analysis-of-variance-anova-and-the-f-test
Laptop market in Indonesia. (2017). http://www.di-
onlinesurvey.com/en/2017/01/06/laptop-market-in-indonesia/

59
Peckham, M. (2013). Could nanowire transistors rescue moore’s law from
obsolescence.http://techland.time.com/2013/05/01/could-nanowire-transistors-
rescue-moores-law-from-obsolescence/
Wangpan (2016). “The global PC industry recession Lenovo not spared”
http://tech.qq.com/a/20160526/053496.htm
Yanjun (2016) Investor News "For a mature CEO, he should have a certain
concentration, the gains and losses must have the right, rational cognition.
http://tech.163.com/16/0321/05/BILJ2V2K000915BD.html

60
APPENDICES
Appendix 1-Data Collection of Pre-test
PV PE P BP CPD
Q1 Q2 Q3 Q4 AVG Q1 Q2 Q3 Q4 AVG Q1 Q2 Q3 Q4 AVG Q1 Q2 Q3 Q4 AVG Q1 Q2 Q3 Q4 AVG
4 3 5 3 3.75 5 4 4 3 4 3 5 5 3 4 3 3 4 4 3.5 4 4 3 5 4
5 5 5 5 5 4 5 5 5 4.75 5 5 5 4 4.75 5 5 5 5 5 5 5 5 5 5
5 4 5 4 4.5 5 5 5 5 5 4 5 5 3 4.25 5 5 5 5 5 5 5 4 5 4.75
5 4 5 4 4.5 4 5 5 5 4.75 4 4 4 3 3.75 5 5 5 5 5 5 5 4 5 4.75
4 3 4 3 3.5 3 4 4 5 4 3 4 4 3 3.5 5 5 4 4 4.5 4 4 3 4 3.75
4 3 3 3 3.25 3 4 4 4 3.75 3 5 5 3 4 4 4 4 4 4 4 4 3 3 3.5
4 4 4 4 4 3 4 4 4 3.75 4 4 4 3 3.75 4 4 4 4 4 4 4 4 4 4
5 5 4 5 4.75 4 4 4 3 3.75 5 5 5 3 4.5 3 3 4 4 3.5 5 5 5 4 4.75
4 4 4 4 4 3 5 5 3 4 4 5 5 4 4.5 3 3 5 5 4 4 4 4 4 4
4 4 4 4 4 4 4 4 3 3.75 4 4 4 3 3.75 3 3 4 4 3.5 4 4 4 4 4
5 5 5 5 5 4 5 5 4 4.5 5 5 5 3 4.5 4 4 5 5 4.5 5 5 5 5 5
4 4 4 4 4 4 3 3 3 3.25 4 4 4 3 3.75 3 3 3 3 3 4 4 4 4 4
3 3 3 3 3 3 4 4 4 3.75 3 3 3 3 3 4 4 4 4 4 3 3 3 3 3
4 4 4 4 4 3 3 3 3 3 4 4 4 3 3.75 3 3 3 3 3 4 4 4 4 4
4 3 5 3 3.75 5 4 4 3 4 3 5 5 3 4 3 3 4 4 3.5 4 4 3 5 4
5 5 5 5 5 4 5 5 5 4.75 5 5 5 4 4.75 5 5 5 5 5 5 5 5 5 5
5 4 5 4 4.5 5 5 5 5 5 4 5 5 4 4.5 5 5 5 5 5 5 5 4 5 4.75

61
4 4 4 4 4 3 3 3 3 3 4 4 4 4 4 3 3 3 3 3 4 4 4 4 4
4 3 5 3 3.75 5 4 4 5 4.5 3 5 5 4 4.25 5 5 4 4 4.5 4 4 3 5 4
5 5 5 5 5 4 5 5 5 4.75 5 5 5 4 4.75 5 5 5 5 5 5 5 5 5 5
5 4 5 4 4.5 5 5 5 5 5 4 5 5 3 4.25 5 5 5 5 5 5 5 4 5 4.75
5 4 5 4 4.5 4 5 5 5 4.75 4 4 4 4 4 5 5 5 5 5 5 5 4 5 4.75
4 3 4 3 3.5 3 4 4 4 3.75 3 4 4 4 3.75 4 4 4 4 4 4 4 3 4 3.75
4 4 4 4 4 4 4 4 3 3.75 4 4 4 3 3.75 3 3 4 4 3.5 4 4 4 4 4
5 5 5 5 5 4 5 5 4 4.5 5 5 5 3 4.5 4 4 5 5 4.5 5 5 5 5 5
4 5 4 5 4.5 3 5 5 4 4.25 5 5 5 4 4.75 4 4 5 5 4.5 4 4 5 4 4.25
4 5 5 5 4.75 3 3 3 4 3.25 5 4 4 4 4.25 4 4 3 3 3.5 4 4 5 5 4.5
3 3 3 3 3 4 4 4 3 3.75 3 5 5 4 4.25 3 3 4 4 3.5 3 3 3 3 3
4 3 3 3 3.25 5 4 4 3 4 3 5 5 3 4 3 3 4 4 3.5 4 4 3 3 3.5
4 4 3 4 3.75 4 5 5 4 4.5 4 4 4 4 4 4 4 5 5 4.5 4 4 4 3 3.75

62
Appendix 2-Reliability and Validity Test
Reliability Test
Reliability of Product Value (PV)
Reliability Statistics
Cronbach's
Alpha
Cronbach's
Alpha Based on
Standardized
Items
N of Items
.873 .878 4
Reliability of Product Evaluation (PE)
Reliability Statistics
Cronbach's
Alpha
Cronbach's
Alpha Based on
Standardized
Items
N of Items
.786 .798 4
Reliability of Price (P)
Reliability Statistics
Cronbach's
Alpha
Cronbach's
Alpha Based on
Standardized
Items
N of Items
.625 .645 4

63
Reliability of Brand Positioning (BP)
Reliability Statistics
Cronbach's
Alpha
Cronbach's
Alpha Based on
Standardized
Items
N of Items
.912 .915 4
Reliability of Consumer Purchasing Decision (CPD)
Reliability Statistics
Cronbach's
Alpha
Cronbach's
Alpha Based on
Standardized
Items
N of Items
.883 .898 4
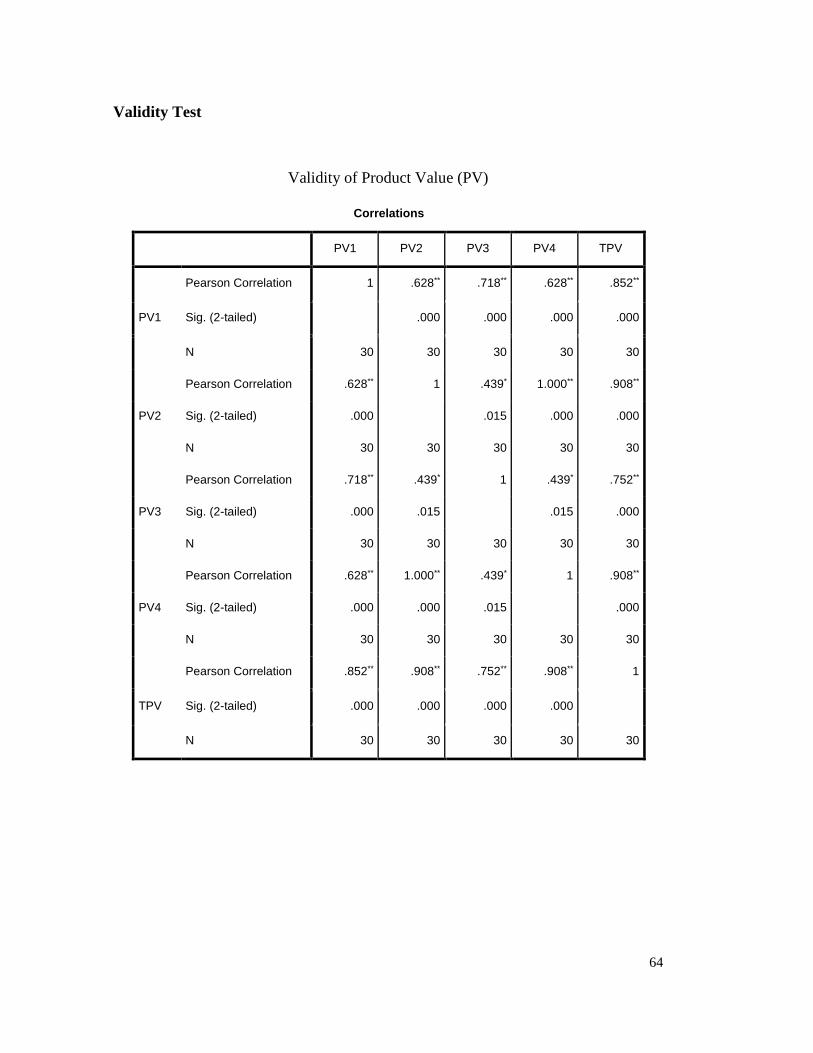
64
Validity Test
Validity of Product Value (PV)
Correlations
PV1 PV2 PV3 PV4 TPV
PV1
Pearson Correlation 1 .628** .718** .628** .852**
Sig. (2-tailed) .000 .000 .000 .000
N 30 30 30 30 30
PV2
Pearson Correlation .628** 1 .439* 1.000** .908**
Sig. (2-tailed) .000 .015 .000 .000
N 30 30 30 30 30
PV3
Pearson Correlation .718** .439* 1 .439* .752**
Sig. (2-tailed) .000 .015 .015 .000
N 30 30 30 30 30
PV4
Pearson Correlation .628** 1.000** .439* 1 .908**
Sig. (2-tailed) .000 .000 .015 .000
N 30 30 30 30 30
TPV
Pearson Correlation .852** .908** .752** .908** 1
Sig. (2-tailed) .000 .000 .000 .000
N 30 30 30 30 30

65
Validity of Product Evaluation (PE)
Correlations
PE1 PE2 PE3 PE4 TPE
PE1
Pearson Correlation 1 .317 .317 .155 .566**
Sig. (2-tailed) .088 .088 .414 .001
N 30 30 30 30 30
PE2
Pearson Correlation .317 1 1.000** .595** .912**
Sig. (2-tailed) .088 .000 .001 .000
N 30 30 30 30 30
PE3
Pearson Correlation .317 1.000** 1 .595** .912**
Sig. (2-tailed) .088 .000 .001 .000
N 30 30 30 30 30
PE4
Pearson Correlation .155 .595** .595** 1 .764**
Sig. (2-tailed) .414 .001 .001 .000
N 30 30 30 30 30
TPE
Pearson Correlation .566** .912** .912** .764** 1
Sig. (2-tailed) .001 .000 .000 .000
N 30 30 30 30 30

66
Validity of Price (P)
Correlations
P1 P2 P3 P4 TP
P1
Pearson Correlation 1 .200 .200 .218 .658**
Sig. (2-tailed) .290 .290 .248 .000
N 30 30 30 30 30
P2
Pearson Correlation .200 1 1.000** .128 .811**
Sig. (2-tailed) .290 .000 .501 .000
N 30 30 30 30 30
P3
Pearson Correlation .200 1.000** 1 .128 .811**
Sig. (2-tailed) .290 .000 .501 .000
N 30 30 30 30 30
P4
Pearson Correlation .218 .128 .128 1 .487**
Sig. (2-tailed) .248 .501 .501 .006
N 30 30 30 30 30
TP
Pearson Correlation .658** .811** .811** .487** 1
Sig. (2-tailed) .000 .000 .000 .006
N 30 30 30 30 30

67
Validity of Brand Positioning (BP)
Correlations
BP1 BP2 BP3 BP4 TBP
BP1
Pearson Correlation 1 1.000** .595** .595** .914**
Sig. (2-tailed) .000 .001 .001 .000
N 30 30 30 30 30
BP2
Pearson Correlation 1.000** 1 .595** .595** .914**
Sig. (2-tailed) .000 .001 .001 .000
N 30 30 30 30 30
BP3
Pearson Correlation .595** .595** 1 1.000** .870**
Sig. (2-tailed) .001 .001 .000 .000
N 30 30 30 30 30
BP4
Pearson Correlation .595** .595** 1.000** 1 .870**
Sig. (2-tailed) .001 .001 .000 .000
N 30 30 30 30 30
TBP
Pearson Correlation .914** .914** .870** .870** 1
Sig. (2-tailed) .000 .000 .000 .000
N 30 30 30 30 30

68
Validity of Consumer Purchasing Decision (CPD)
Correlations
CPD1 CPD2 CPD3 CPD4 TCPD
CPD1
Pearson Correlation 1 1.000** .628** .718** .943**
Sig. (2-tailed) .000 .000 .000 .000
N 30 30 30 30 30
CPD2
Pearson Correlation 1.000** 1 .628** .718** .943**
Sig. (2-tailed) .000 .000 .000 .000
N 30 30 30 30 30
CPD3
Pearson Correlation .628** .628** 1 .439* .786**
Sig. (2-tailed) .000 .000 .015 .000
N 30 30 30 30 30
CPD4
Pearson Correlation .718** .718** .439* 1 .828**
Sig. (2-tailed) .000 .000 .015 .000
N 30 30 30 30 30
TCPD
Pearson Correlation .943** .943** .786** .828** 1
Sig. (2-tailed) .000 .000 .000 .000
N 30 30 30 30 30

69
Appendix 3-Questionnaire
My name is Robin Yang, I am a student of Management Study Program at President University. I
am doing a research, as the topic of my thesis which is "The Impact of Product Value, Product
Evaluation, Price and Brand Positioning towards Consumer Purchasing Decision of Lenovo Laptop
Users in Central Jakarta". I would be grateful if you fill in the questionnaire, in order to complete
the research process. The information acquired from this questionnaire will be confidentially used
for academic purpose only. Thank you!
Nama saya Robin, mahasiswa jurusan manajemen dari President University. Saat ini saya sedang
melakukan penelitian skripsi saya, dengan judul, "Dampak Nilai Produk, Evaluasi Produk, Harga
dan Brand Positioning Terhadap Keputusan Pembelian Konsumen Laptop Lenovo Di Jakarta
Pusat" Saya akan berterima kasih jika Anda mengisi kuesioner untuk menyelesaikan proses
penelitian skripsi saya. Informasi yang diperoleh dari kuesioner ini akan rahasia dan digunakan
untuk tujuan akademis saja. Terima kasih!
Please check "√" the answer that you choose from the questions given below.
Likert Scale
Please check "√" the questionnaire based on the instruction below :
*Product Value
No Statement Scale
1 2 3 4 5
1
Lenovo laptops service life is relatively long.
(Pelayanan laptop Lenovo yang diberikan termasuk
lama)
2
Lenovo laptop appearance can attract more
consumers.
(Penampilan laptop Lenovo dapat menarik lebih
banyak pelanggan)
3 Lenovo laptop size is very much in line with your
needs.
Have you ever used a Lenovo laptop?
Apakah Anda pernah menggunakan laptop Lenovo?
YES
NO
1 = Strongly Disagree 2 = Disagree 3 = Neutral 4 = Agree 5 = Strongly Agree

70
(Ukuran laptop Lenovo sangat sesuai dengan
kebutuhan saya)
4
Lenovo laptop relative more attractive compares to
other brands.
(Laptop Lenovo relatif lebih menarik ketimbang
merek-merek laptop lainnya)
* Product Evaluation
No Statement Scale
1 2 3 4 5
1
Consumers think that Lenovo's laptop utility is
higher.
(Konsumen menganggap laptop Lenovo memiliki
tingkat kepraktisan yang tinggi)
2
Lenovo laptop has a very good reputation.
(Laptop Lenovo memiliki reputasi yang sangat
baik)
3
Consumers agree laptop Lenovo have a high
quality.
(Konsumen setuju bahwa laptop Lenovo memiliki
kualitas yang tinggi)
4
Consumer feedback towards Lenovo has a high
reliability.
(Tingkat umpan balik konsumen Lenovo memiliki
keandalan yang tinggi)
* Price
No Statement Scale
1 2 3 4 5
1 Lenovo laptop are cheap.
(Harga laptop Lenovo murah)
2 Lenovo laptop prices are reasonable.
(Laptop Lenovo memiliki harga yg masuk akal)
3
Lenovo's price is acceptable to consumers
(Harga laptop Lenovo dapat diterima dengan wajar
oleh konsumen)
4
Lenovo have promotional discount activities
(Lenovo memiliki berbagai kegiatan promosi
diskon)

71
* Brand Positioning
No Statement Scale
1 2 3 4 5
1
Lenovo laptop has a very deep impression.
(Laptop Lenovo memiliki kesan yang sangat
mendalam)
2
Lenovo's image in the public mind is very good.
(Image laptop Lenovo dalam pikiran publik sangat
baik)
3 Lenovo's publicity is welcomed.
(Publisitas laptop Lenovo disambut dengan baik)
4
Lenovo's customer service and product promotion
attitude is very good.
(Sikap pelayanan konsumen dan promosi produk
yang dilakukan oleh Lenovo sangat baik)
* Consumer Purchasing Decision
NO
Statement
1
2
Scale
3
4
5
1
Consumers are very satisfied with Lenovo's
product information.
(Konsumen sangat puas dengan informasi produk
yang disediakan oleh Lenovo)
2
Consumers are willing to buy Lenovo laptop.
(Konsumen bersedia untuk membeli laptop
Lenovo)
3
Consumers enjoy purchasing Lenovo laptop's
process.
(Konsumen memahami dan menerima laptop
Lenovo)
4
Lenovo's products and services can meet the
needs of consumers.
(Konsumen menikmati pembelian proses laptop
Lenovo)
Thank you

72
Appendix 4-Data Collection for 110 Respondents
PV1 PV2 PV3 PV4 AVG PE1 PE2 PE3 PE4 AVG P1 P2 P3 P4 AVG BP1 BP2 BP3 BP4 AVG CPD1 CPD2 CPD3 CPD4 AVG
1 2 3 2 2 2 2 1 1 1.5 1 2 3 1 1.75 2 2 2 2 2 1 1 3 1 1.5
2 2 3 2 2.25 1 1 1 3 1.5 2 1 1 1 1.25 1 1 1 1 1 1 1 2 2 1.5
1 1 1 2 1.25 3 3 3 2 2.75 1 3 2 3 2.25 4 5 2 4 3.75 2 1 1 1 1.25
3 1 2 1 1.75 2 3 2 3 2.5 1 1 1 1 1 3 4 3 3 3.25 3 3 4 4 3.5
4 1 2 1 2 1 1 1 1 1 3 1 1 2 1.75 1 1 2 3 1.75 1 1 2 1 1.25
1 1 1 3 1.5 2 2 2 1 1.75 3 1 2 2 2 1 2 1 1 1.25 4 1 5 3 3.25
4 1 1 3 2.25 1 1 1 1 1 4 1 2 1 2 2 4 2 1 2.25 2 2 3 3 2.5
4 5 5 2 4 4 4 4 4 4 4 4 3 4 3.75 4 4 2 2 3 4 4 3 2 3.25
5 4 4 5 4.5 4 3 3 3 3.25 4 3 3 3 3.25 4 4 3 4 3.75 2 3 4 3 3
3 3 3 3 3 2 2 2 2 2 2 1 4 2 2.25 2 4 2 4 3 2 4 4 3 3.25
5 2 2 4 3.25 2 2 3 1 2 2 1 2 1 1.5 3 4 2 4 3.25 2 1 3 5 2.75
1 1 1 1 1 1 2 1 2 1.5 1 2 3 2 2 1 2 1 2 1.5 3 1 4 1 2.25
2 2 2 2 2 3 2 3 2 2.5 3 3 3 3 3 2 3 3 2 2.5 3 2 2 2 2.25
3 2 1 1 1.75 1 1 2 1 1.25 3 3 3 3 3 2 2 1 2 1.75 3 4 3 3 3.25
3 4 2 4 3.25 2 2 1 1 1.5 2 1 1 2 1.5 2 2 2 2 2 1 2 3 2 2
4 3 3 1 2.75 1 3 3 3 2.5 1 3 4 2 2.5 3 1 2 4 2.5 2 2 3 2 2.25

73
4 1 1 2 2 1 2 1 2 1.5 1 3 3 2 2.25 4 4 2 3 3.25 3 2 1 2 2
3 3 3 3 3 3 3 3 3 3 2 2 2 2 2 3 3 4 3 3.25 2 3 3 3 2.75
3 2 3 2 2.5 2 2 3 2 2.25 2 3 2 3 2.5 3 2 2 2 2.25 3 3 4 3 3.25
2 5 3 1 2.75 1 3 3 3 2.5 3 1 3 3 2.5 4 1 1 2 2 1 3 3 2 2.25
4 1 1 3 2.25 2 3 2 2 2.25 4 3 2 2 2.75 3 3 3 1 2.5 3 3 2 2 2.5
2 2 2 2 2 2 2 2 2 2 2 2 2 2 2 2 2 2 2 2 2 2 3 1 2
2 1 1 1 1.25 1 1 1 1 1 2 1 1 3 1.75 2 2 1 2 1.75 2 4 1 4 2.75
5 5 4 5 4.75 3 4 2 4 3.25 4 4 4 2 3.5 4 5 3 4 4 2 4 4 4 3.5
1 2 3 2 2 2 2 1 1 1.5 1 2 1 1 1.25 2 1 2 3 2 1 3 3 3 2.5
4 4 4 4 4 3 3 3 4 3.25 3 4 3 3 3.25 4 4 4 4 4 4 4 4 4 4
4 3 3 3 3.25 4 4 4 2 3.5 4 3 3 5 3.75 4 3 4 4 3.75 4 3 3 3 3.25
4 4 4 4 4 5 4 3 5 4.25 5 4 5 5 4.75 5 4 4 4 4.25 4 4 4 3 3.75
4 4 4 4 4 2 3 4 4 3.25 4 3 4 4 3.75 5 5 3 5 4.5 3 3 2 3 2.75
4 3 4 4 3.75 4 4 3 4 3.75 3 4 4 5 4 4 4 3 3 3.5 4 4 3 3 3.5
4 4 4 5 4.25 4 4 4 2 3.5 3 3 4 4 3.5 5 5 5 5 5 4 4 4 4 4
4 4 4 4 4 4 4 4 2 3.5 4 4 4 4 4 4 4 3 3 3.5 4 5 5 5 4.75
4 4 4 4 4 4 2 4 5 3.75 4 3 3 3 3.25 3 3 3 4 3.25 2 3 3 3 2.75
4 3 5 4 4 4 3 3 4 3.5 4 3 3 3 3.25 4 4 3 4 3.75 4 4 4 4 4
4 4 4 5 4.25 3 3 3 4 3.25 3 3 2 3 2.75 4 4 4 5 4.25 3 4 4 3 3.5

74
4 4 4 4 4 4 5 2 4 3.75 3 3 3 3 3 5 5 5 4 4.75 4 4 4 4 4
4 4 4 4 4 4 4 4 5 4.25 3 3 3 4 3.25 3 3 4 3 3.25 4 5 4 4 4.25
4 3 3 5 3.75 3 2 2 3 2.5 4 3 4 4 3.75 5 5 4 3 4.25 4 4 4 3 3.75
4 5 4 5 4.5 4 3 4 4 3.75 4 4 3 4 3.75 4 2 4 4 3.5 3 4 3 4 3.5
4 4 4 4 4 3 3 3 3 3 4 3 3 4 3.5 4 4 2 4 3.5 4 4 2 5 3.75
4 4 3 4 3.75 3 4 3 4 3.5 3 3 4 3 3.25 2 3 4 2 2.75 4 4 3 4 3.75
4 4 4 4 4 3 4 3 3 3.25 3 3 3 4 3.25 3 3 3 3 3 5 5 5 4 4.75
4 3 5 4 4 4 4 5 4 4.25 3 3 3 2 2.75 3 4 4 3 3.5 4 4 5 5 4.5
4 5 4 3 4 4 5 4 3 4 4 4 3 4 3.75 2 3 3 3 2.75 4 4 4 4 4
3 3 4 4 3.5 2 3 3 2 2.5 4 4 4 3 3.75 3 4 4 4 3.75 5 5 4 4 4.5
4 3 2 4 3.25 4 4 3 4 3.75 3 2 4 5 3.5 4 4 5 5 4.5 4 2 4 4 3.5
4 4 4 4 4 2 3 3 3 2.75 2 3 2 2 2.25 4 4 4 4 4 3 3 4 3 3.25
3 3 3 2 2.75 3 4 3 4 3.5 4 3 5 4 4 5 5 5 4 4.75 3 3 2 4 3
3 3 4 3 3.25 4 4 4 4 4 5 5 4 4 4.5 2 3 3 4 3 4 4 4 4 4
4 4 4 5 4.25 4 5 3 5 4.25 4 4 4 4 4 4 4 4 4 4 3 4 4 4 3.75
4 4 4 5 4.25 3 3 3 2 2.75 3 4 3 3 3.25 3 3 3 3 3 3 3 4 3 3.25
4 3 4 3 3.5 4 5 4 4 4.25 4 3 3 3 3.25 3 3 3 3 3 3 4 4 4 3.75
4 4 4 4 4 3 4 4 4 3.75 4 4 5 4 4.25 2 3 3 3 2.75 3 3 4 3 3.25
4 4 4 4 4 4 4 3 4 3.75 3 3 4 4 3.5 3 3 3 3 3 3 4 3 3 3.25

75
4 4 4 4 4 4 4 4 5 4.25 3 3 5 3 3.5 3 4 4 3 3.5 3 3 4 5 3.75
4 4 4 4 4 4 4 5 5 4.5 4 4 3 4 3.75 4 4 4 4 4 4 3 3 4 3.5
4 4 4 4 4 3 4 3 3 3.25 4 4 4 4 4 3 3 3 5 3.5 4 4 4 3 3.75
4 4 4 4 4 4 3 2 4 3.25 3 3 3 3 3 5 4 4 3 4 3 3 3 3 3
4 4 4 4 4 2 3 3 2 2.5 3 3 3 4 3.25 4 4 4 3 3.75 4 3 3 3 3.25
3 5 5 5 4.5 3 3 3 3 3 4 3 3 4 3.5 4 4 4 4 4 3 3 3 3 3
3 4 4 4 3.75 3 4 3 3 3.25 4 3 4 4 3.75 4 3 3 4 3.5 4 4 5 5 4.5
3 5 5 5 4.5 2 3 3 4 3 4 4 5 5 4.5 4 4 4 5 4.25 4 4 4 3 3.75
2 4 3 4 3.25 4 4 5 3 4 4 4 2 4 3.5 3 3 3 3 3 4 4 3 4 3.75
2 4 2 5 3.25 4 5 5 5 4.75 4 5 5 4 4.5 4 4 3 2 3.25 5 5 5 4 4.75
4 2 4 4 3.5 4 4 4 4 4 4 4 2 4 3.5 3 3 3 3 3 4 3 4 4 3.75
4 5 4 4 4.25 4 5 3 3 3.75 4 4 4 3 3.75 5 4 4 2 3.75 4 4 3 4 3.75
4 4 4 4 4 4 4 3 2 3.25 4 3 3 5 3.75 3 4 4 4 3.75 3 4 4 3 3.5
4 2 4 3 3.25 4 4 4 4 4 5 4 4 5 4.5 3 3 3 3 3 4 4 4 4 4
2 5 2 5 3.5 3 4 2 3 3 4 4 3 5 4 4 4 4 4 4 4 3 3 4 3.5
5 3 2 3 3.25 3 3 2 3 2.75 4 4 4 4 4 3 4 4 5 4 4 3 2 4 3.25
5 5 5 4 4.75 2 3 3 4 3 4 4 4 4 4 3 4 4 5 4 4 4 3 4 3.75
2 5 3 5 3.75 3 3 3 3 3 4 3 4 4 3.75 4 4 5 2 3.75 5 5 5 4 4.75
4 5 5 4 4.5 3 4 3 3 3.25 4 4 4 4 4 3 3 3 3 3 4 3 3 4 3.5

76
5 4 4 2 3.75 4 5 2 2 3.25 4 4 4 4 4 4 5 2 2 3.25 4 4 3 4 3.75
4 4 5 3 4 4 3 4 4 3.75 3 3 3 3 3 3 2 4 3 3 3 3 3 4 3.25
4 4 3 2 3.25 5 4 5 4 4.5 4 5 5 5 4.75 3 3 3 4 3.25 4 3 3 4 3.5
5 3 4 5 4.25 3 3 4 3 3.25 3 4 3 4 3.5 3 3 5 2 3.25 3 3 3 4 3.25
4 4 4 4 4 3 3 3 4 3.25 3 4 3 3 3.25 4 3 4 4 3.75 5 5 3 4 4.25
4 5 3 4 4 3 3 5 2 3.25 4 3 4 4 3.75 5 4 5 4 4.5 4 4 3 4 3.75
3 5 5 4 4.25 4 4 4 4 4 4 3 3 4 3.5 3 3 4 4 3.5 4 4 5 4 4.25
4 4 3 3 3.5 3 3 3 3 3 3 3 3 3 3 3 3 3 3 3 4 4 3 4 3.75
4 4 4 4 4 3 4 3 3 3.25 4 3 5 4 4 3 4 4 3 3.5 4 5 3 4 4
3 4 3 3 3.25 2 3 3 3 2.75 3 4 3 3 3.25 3 4 3 3 3.25 4 4 3 4 3.75
4 3 3 5 3.75 3 4 4 4 3.75 2 3 3 4 3 4 3 3 5 3.75 4 3 4 4 3.75
5 4 5 5 4.75 4 4 5 5 4.5 4 4 5 3 4 5 4 5 5 4.75 5 5 5 4 4.75
4 3 4 4 3.75 4 4 4 4 4 4 5 5 5 4.75 4 3 4 4 3.75 4 4 4 4 4
3 4 4 5 4 5 5 5 4 4.75 4 4 4 4 4 3 4 4 5 4 4 3 3 4 3.5
3 3 4 4 3.5 2 3 3 4 3 4 5 3 3 3.75 3 3 4 4 3.5 4 4 4 4 4
4 4 4 4 4 4 4 4 4 4 4 4 3 2 3.25 4 4 4 4 4 4 4 3 4 3.75
4 3 3 3 3.25 3 3 3 3 3 4 4 4 4 4 4 3 3 3 3.25 3 3 3 3 3
4 3 3 3 3.25 3 3 3 3 3 3 4 2 3 3 4 3 3 3 3.25 3 3 3 4 3.25
3 3 2 3 2.75 2 3 3 3 2.75 3 3 2 3 2.75 3 3 2 3 2.75 4 5 5 5 4.75

77
3 3 3 3 3 3 3 2 3 2.75 2 3 3 4 3 3 3 3 3 3 4 3 3 4 3.5
3 3 3 4 3.25 3 4 4 3 3.5 3 3 3 3 3 3 3 3 4 3.25 3 4 3 4 3.5
4 3 4 4 3.75 4 4 4 4 4 3 3 3 3 3 4 3 4 4 3.75 3 3 3 4 3.25
4 4 3 5 4 3 3 3 5 3.5 3 4 3 3 3.25 4 4 3 5 4 3 4 3 3 3.25
4 2 3 4 3.25 5 4 4 3 4 3 3 3 3 3 4 2 3 4 3.25 5 5 3 4 4.25
3 3 3 4 3.25 4 4 4 3 3.75 2 4 3 3 3 3 3 3 4 3.25 4 3 4 4 3.75
4 3 4 4 3.75 4 4 4 4 4 4 4 3 3 3.5 4 3 4 4 3.75 4 4 3 4 3.75
4 4 3 4 3.75 4 3 3 4 3.5 4 4 3 3 3.5 4 4 3 4 3.75 4 3 3 4 3.5
4 3 3 4 3.5 4 4 4 3 3.75 4 4 3 4 3.75 4 3 3 4 3.5 4 4 4 4 4
4 3 4 4 3.75 3 3 3 3 3 4 4 4 4 4 4 3 4 4 3.75 3 4 4 4 3.75
3 3 3 3 3 4 4 3 2 3.25 3 3 3 3 3 3 3 3 3 3 4 4 3 4 3.75
3 4 2 4 3.25 3 3 3 3 3 4 4 4 3 3.75 3 4 2 4 3.25 4 4 2 4 3.5
4 2 4 5 3.75 5 4 4 3 4 3 4 3 4 3.5 4 2 4 5 3.75 4 3 2 4 3.25
4 2 5 5 4 3 4 4 4 3.75 4 5 2 2 3.25 4 3 3 4 3.5 4 3 3 4 3.5
4 3 3 4 3.5 3 3 3 3 3 3 4 3 3 3.25 3 3 3 3 3 4 4 4 4 4
3 3 3 3 3 4 4 4 4 4 3 4 3 3 3.25 3 5 4 4 4 4 4 4 4 4
3 4 4 4 3.75 3 4 4 5 4 4 5 2 2 3.25 3 4 4 5 4 4 4 4 4 4
3 4 4 5 4 4 4 5 2 3.75 4 5 2 2 3.25 4 4 3 5 4 4 1 4 4 3.25

78
Appendix 5-Output of SPSS 20.0
Descriptive
Descriptive Statistics
N Range Minimum Maximum Mean Std. Deviation Variance
TPV 110 3.75 1.00 4.75 3.4727 .81510 .664
TPE 110 3.75 1.00 4.75 3.2000 .85925 .738
TP 110 3.75 1.00 4.75 3.2591 .79341 .630
TBP 110 4.00 1.00 5.00 3.3477 .76558 .586
TCPD 110 3.50 1.25 4.75 3.4477 .73345 .538
Valid N
(listwise) 110
Regression
Variables Entered/Removeda
Model Variables
Entered
Variables
Removed
Method
1 TBP, TP, TPE,
TPVb . Enter
a. Dependent Variable: TCPD
b. All requested variables entered.

79
Model Summaryb
Model R R Square Adjusted R
Square
Std. Error of the
Estimate
Durbin-Watson
1 .679a .461 .440 .54877 1.975
a. Predictors: (Constant), TBP, TP, TPE, TPV
b. Dependent Variable: TCPD
ANOVAa
Model Sum of Squares df Mean Square F Sig.
1
Regression 27.016 4 6.754 22.427 .000b
Residual 31.621 105 .301
Total 58.637 109
a. Dependent Variable: TCPD
b. Predictors: (Constant), TBP, TP, TPE, TPV
Coefficientsa
Model Unstandardized
Coefficients
Standardized
Coefficients
t Sig. 95.0% Confidence
Interval for B
Collinearity
Statistics
B Std. Error Beta Lower
Bound
Upper
Bound
Tolerance VIF
1
(Constant) 1.186 .263 4.500 .000 .663 1.708
TPV .176 .100 .196 1.761 .081 -.022 .374 .416 2.403
TPE .262 .095 .307 2.766 .007 .074 .450 .417 2.398
TP .231 .098 .250 2.356 .020 .037 .426 .456 2.195

80
TBP .018 .098 .018 .179 .858 -.177 .212 .491 2.035
Coefficient Correlationsa
Model TBP TP TPE TPV
1
Correlations
TBP 1.000 -.132 -.193 -.414
TP -.132 1.000 -.437 -.234
TPE -.193 -.437 1.000 -.278
TPV -.414 -.234 -.278 1.000
Covariances
TBP .010 -.001 -.002 -.004
TP -.001 .010 -.004 -.002
TPE -.002 -.004 .009 -.003
TPV -.004 -.002 -.003 .010
a. Dependent Variable: TCPD
Collinearity Diagnosticsa
Model Dimension Eigenvalue Condition Index Variance Proportions
(Constant) TPV TPE TP TBP
1
1 4.906 1.000 .00 .00 .00 .00 .00
2 .036 11.665 .69 .00 .22 .05 .01
3 .024 14.331 .19 .15 .06 .25 .43
4 .018 16.518 .10 .03 .71 .65 .00
5 .016 17.609 .01 .81 .00 .05 .56

81
a. Dependent Variable: TCPD
Residuals Statisticsa
Minimum Maximum Mean Std. Deviation N
Predicted Value 2.1030 4.2091 3.4477 .49785 110
Residual -1.46217 1.67563 .00000 .53861 110
Std. Predicted Value -2.701 1.529 .000 1.000 110
Std. Residual -2.664 3.053 .000 .981 110
a. Dependent Variable: TCPD
Charts

82

83

84

85

86