the impact of oralantidiabetics on weight in...
TRANSCRIPT

THE IMPACT OF ORAL ANTIDIABETICS ON WEIGHT IN
THE ELDERLY WITH TYPE 2 DIABETES MELLITUS
IN THE AMBULATORY SETTING
by
Dusica Tasic
A thesis submitted to the faculty ofThe University of Utah
in partial fulfillment of the requirements for the degree of
Master of Science
Department of Pharmacotherapy
The University of Utah
May 2012

Copyright © Dusica Tasic 2012
All Rights Reserved

T h e U n i v e r s i t y o f U t a h G r a d u a t e S c h o o l
STATEMENT OF THESIS APPROVAL
The thesis of Dusica Tasic
has been approved by the following supervisory committee members:
Diana Brixner , Chair 5/13/2009
Date Approved
Xiaoming Sheng , Member 5/13/2009
Date Approved
Laura Shane-McWhorter , Member 5/13/2009
Date Approved
and by Diana Brixner , Chair of
the Department of Pharmacotherapy
and by Charles A. Wight, Dean of The Graduate School.

ABSTRACT
Comparison of data gathered in an electronic medical record (EMR) database on Type 2
Diabetes Mellitus (T2DM) patients age 65 years and older with oral antidiabetics (OAD)
agent prescription and recorded body mass index (BMI)/weight was performed.
A retrospective review of the General Electric Centricity Medical Quality
Improvement Consortium (MQIC) research database containing the ambulatory health
records of US patients was conducted. T2DM patients age 65 and older were identified by
diagnosis, OAD prescription or both. Six months of continuous OAD activity was required;
395 days pre-index-date (index date was defined by first OAD prescription) clinical activity
was required. Two BMI and weight readings were mandated, at baseline, closest to index
date and follow-up, closest to 6 months after initiation of OAD activity. A historical,
longitudinal cohort design was used and data were analyzed using analysis of variance
(ANOVA) with Tukey test for adjustment of the differences in the means between the
groups for continuous variables; Pearson's Chi-square test was used to test association for
categorical variables.
The overall mean age for all of the OAD groups was 72.7 years. The values of the
baseline diastolic blood pressure (DBP) differed (p=0.0009), as well as age (p< 0.001); DBP
indicated patients were in Hypertension Stage 1. The baseline A1C level was shown to be
statistically significant between the groups (p< 0.001) with the highest mean value in
sulfonylureas group (7.7). Significant differences between the OAD groups were also found
in respect to race and smoking status (p=0.004 and < 0.0001).

In comparison between the baseline and the follow-up values, statistical significance was
found in both of the outcomes and a drop of 0.7 BMI units was initiated among all of the OAD
groups. The overall mean BMI value among all of the OAD groups was 29.08
kg/m². The change in BMI after 6 months of monotherapy demonstrated that meglitinides
had the biggest decrease in BMI (-1.27), followed by the metformin group (-1.06) and the
sulfonylureas showed the least BMI drop (-0.14). Weight as the secondary outcome variable
demonstrated an average 3.97 lb weight loss between all of the OAD groups. Major weight
loss was found in the meglitinides users (-7.82lb), pursued by the metformin group (-6.41lb);
the sulfonylureas group reported the least weight loss (-0.89lb).
EMR data demonstrated an association between the OAD user and BMI/weight and
associated conditions consistent with elderly T2DM patients in a real-world setting. The
likelihood of weight loss was somewhat consistent with the previous literature, except in the
case of the TZD group, where the literature showed the expected weight gain and this study
does not support these findings.
iv

To Djordje and my parents for their love and support

ABSTRACT . . . . . . . . . . . . . .
LIST OF TABLES
LIST OF FIGURES
Chapters
1. INTRODUCTION
2. LITERATURE REVIEW
Oral antidiabetics agents studied
3. STUDY DESIGN AND METHODS
Study design
Variables
Procedures
Statistical methods
4. RESULTS
Study population
Differences among the OAD groups
6. DISCUSSION
Limitations
. . . . . . . . . . . . . . . . . . . . . . . . . . . . . . . . . . . . . . . . . . . . . iii
. . . . . . . . . . . . . . . . . . . . . . . . . . . . . . . . . . . . . . . . . . . . . . . . . . . . . viii
. . . . . . . . . . . . . . . . . . . . . . . . . . . . . . . . . . . . . . . . . . . . . . . . . . . . . . x
. . . . . . . . . . . . . . . . . . . . . . . . . . . . . . . . . . . . . . . . . . . . . . . . xi
. . . . . . . . . . . . . . . . . . . . . . . . . . . . . . . . . . . . . . . . . . . . . . . . . . . . . 1
. . . . . . . . . . . . . . . . . . . . . . . . . . . . . . . . . . . . . . . . . . . . . . . . 4
. . . . . . . . . . . . . . . . . . . . . . . . . . . . . . . . . . . . . . . . . . . . . . . . . . . . . . . 7
. . . . . . . . . . . . . . . . . . . . . . . . . . . . . . . . . . . . . . . . . . . . 8
. . . . . . . . . . . . . . . . . . . . . . . . . . . . . . . . . . . . . . 10
. . . . . . . . . . . . . . . . . . . . . . . . . . . . . . . . . . . . . . . . . . . . . . . . . . . . . . . . . . . 10
. . . . . . . . . . . . . . . . . . . . . . . . . . . . . . . . . . . . . . . . . . . . . . . . . . . . . . . . . . . . . . 10
. . . . . . . . . . . . . . . . . . . . . . . . . . . . . . . . . . . . . . . . . . . . . . . . . . . . . . . . . . . . 11
. . . . . . . . . . . . . . . . . . . . . . . . . . . . . . . . . . . . . . . . . . . . . . . . . . . . . . 16
. . . . . . . . . . . . . . . . . . . . . . . . . . . . . . . . . . . . . . . . . . . . . . . . . . . . . . . . . . . 18
. . . . . . . . . . . . . . . . . . . . . . . . . . . . . . . . . . . . . . . . . . . . . . . . . . . . . . . 18
. . . . . . . . . . . . . . . . . . . . . . . . . . . . . . . . . . . . . . . . 27
. . . . . . . . . . . . . . . . . . . . . . . . . . . . . . . . . . . . . . . . . . . . . . . . . . . . . . . 41
. . . . . . . . . . . . . . . . . . . . . . . . . . . . . . . . . . . . . . . . . . . . . . . . . . . . . . . . . . . . 44
ACKNOWLEDGMENTS
Preliminary studies
TABLE OF CONTENTS

APPENDICES
A. INCLUSION AND EXCLUSION – DIAGNOSIS,
PHARMACOTHERAPEUTIC AGENTS . . . . . . . . . . . . . . . . . . . . . . . . . . . . . . . . . . . . 46
. . . . . . . . . . . . . . . . . . . . . . . . . . . . . . . . . . . . . . . . . . 49
. . . . . . . . . . . . . . . . . . . . . . . . . . . . . . . . . . . . . . . . . . . . . . . . . 50
D. . . . . . . . . . . . . . . . . . . . . . . . . . . . . 52
. . . . . . . . . . . . . . . . . . . . . . . . . . . . . . . . . . . . . . . . . . . . . . . . . . . . . . 59
B. COVARIATE MEDICATIONS
C. DIAGNOSIS CODES
DESCRIPTION OF PRIMARY VARIABLES .
REFERENCES
E. BASELINE CHARACTERISTICS BY DRUG CLASS . . . . . . . . . . . . . . . . . . . . . . 55
vii

1. Oral antidiabetic agents . . . . . . .
2. Baseline demographics characteristics
3. Frequency of the OAD use among the elderly Type 2 Diabetes
4. Baseline characteristics of the categorical variables
5. Baseline characteristics of the continuous variables
6. Characteristics of the outcome variables at baseline and follow-up
7. Characteristics of the baseline BMI stratified
by underweight/normal/overweight/obese OAD users
8. Characteristics of the follow-up BMI stratified
by underweight/normal/overweight/obese OAD users
9. Association between the baseline A1C and the OAD classes
10. Association between the patient age and the OAD classes
11. Association between the baseline BMI and the OAD classes
. . . . . . . . . . . . . . . . . . . . . . . . . . . . . . . . . . . . . . . . . . 9
. . . . . . . . . . . . . . . . . . . . . . . . . . . . . . . . . . . . 21
. . . . . . . . . . . . . . . . . 23
. . . . . . . . . . . . . . . . . . . . . . . . . . 23
. . . . . . . . . . . . . . . . . . . . . . . . . . 24
. . . . . . . . . . . . . . 25
. . . . . . . . . . . . . . . . . . . . . . . . . . . . 26
. . . . . . . . . . . . . . . . . . . . . . . . . . . . 26
. . . . . . . . . . . . . . . . . . . 28
. . . . . . . . . . . . . . . . . . . . 32
. . . . . . . . . . . . . . . . . . 33
12. Association between the change in BMI and the OAD classes . . . . . . . . . . . . . . . . . 34
13. Association between the baseline diastolic BP and the OAD classes . . . . . . . . . . . . 35
15. Association between the baseline weight and the OAD classes . . . . . . . . . . . . . . . . 37
16. Association between the follow-up weight and the OAD classes . . . . . . . . . . . . . . . 38
14. Association between the baseline triglycerides and the OAD classes . . . . . . . . . . . 36
LIST OF TABLES
PageTable

17. Association between the change in weight and the OAD classes . . . . . . . . . . . . . . . 39
. . . . . . . . . . . . . . . 40
19. . . . . . . . . . . . . . . . . . . . . . . . . . . . . . . . . . . . . . . . .
. . . . . . . . . . . . . . . . . . . . . . . . . . . . . . .
. . . . . . . . . . . . . . . . . . . . . . . . . . . . . . . . . . . . . . . . . . . . . .
. . . . . . . . . . . . . . . . . . . . . . . . . . . . . . . . . . . . . . . . . . . . . . . . . . . . .
. . . . . . . . . . . . . . . . . . . . . . . . . . . . . . . . . . . . . . .
. . . . . . . . . . . . . . . . . . . . . . . . . . . . . . . . . . . . . .
. . . . . . . . . . . . . . . . . . . . . . . . . . . . . . . . . . . . . . . . . . . . . . . . . . . .
18. Association between the change in weight and the OAD classes
Diagnoses indicative of diabetes 46
20. Oral antidiabetic drugs for study inclusion 47
21. List of exclusion criteria 48
22. Covariate drugs 49
23. Comorbid cardiovascular diseases 50
24. Charlson Comorbidity Index (CCI) 51
25. Primary variables 52
PageTable
ix

1. Study timeline
2. Study population flowchart
3. Mean baseline A1C by OAD categories
4. Mean change A1C by OAD categories
5. Mean change of A1C by individual OAD medication
6. Means age at index date by OAD categories
7. Mean baseline BMI by OAD categories
8. Mean change in BMI by OAD categories
9. Mean baseline diastolic BP by OAD categories
10. Mean baseline triglycerides by OAD categories
11. Mean baseline weight by OAD categories
12. Mean follow-up weight by OAD categories
13. Mean weight change by OAD categories
14. Mean baseline Charlson index by OAD categories
. . . . . . . . . . . . . . . . . . . . . . . . . . . . . . . . . . . . . . . . . . . . . . . . . . . . . . . 13
. . . . . . . . . . . . . . . . . . . . . . . . . . . . . . . . . . . . . . . . . . . . . .19
. . . . . . . . . . . . . . . . . . . . . . . . . . . . . . . . . . . . . . 28
. . . . . . . . . . . . . . . . . . . . . . . . . . . . . . . . . . . . . . . 29
. . . . . . . . . . . . . . . . . . . . . . . . . . . 30
. . . . . . . . . . . . . . . . . . . . . . . . . . . . . . . . . 31
. . . . . . . . . . . . . . . . . . . . . . . . . . . . . . . . . . . . . 32
. . . . . . . . . . . . . . . . . . . . . . . . . . . . . . . . . . . . 33
. . . . . . . . . . . . . . . . . . . . . . . . . . . . . . . 34
. . . . . . . . . . . . . . . . . . . . . . . . . . . . . 35
. . . . . . . . . . . . . . . . . . . . . . . . . . . . . . . . . . 36
. . . . . . . . . . . . . . . . . . . . . . . . . . . . . . . . . 37
. . . . . . . . . . . . . . . . . . . . . . . . . . . . . . . . . . . 38
. . . . . . . . . . . . . . . . . . . . . . . . . . . . 39
15. . . . . . . . . . . . . . . . . . . . . . . . . . . . . . . . . . 55
16. . . . . . . . . . . . . . . . . . . . . . . . . . . . . . . . . . . . 56
17. . . . . . . . . . . . . . . . . . . . . . . . . . . . . 57
18. . . . . . . . . . . . . . . . . . . . . . . . . 58
Mean baseline HDL by OAD categories
Mean baseline LDL by OAD categories
Mean baseline systolic BP by OAD categories
Mean baseline total cholesterol by OAD categories
LIST OF FIGURES
Figure Page

I would like to acknowledge the advice and guidance of Dr. Diana Brixner, my
committee chair. I also thank the members of my graduate committee, Dr. Laura Shane-
McWhorter and Dr. Xiaoming Sheng, for their guidance and suggestions throughout this
endeavor.
In addition to my committee, I am also grateful for all the help, suggestions and support I
have received from Dr. Michael Goodman and Dr. Carrie McAdam-Marx. Without their
directions and encouragement, this thesis would not have been possible.
I am thankful for the research training I have received from Pharmacotherapy Outcomes
Research Center. This thesis is the finale of all the methodologies, theories and techniques I
have learned in this academic institution. The support from the faculty and staff inspire me to
continue to strive for the finest in the field of outcomes research.
I would also like to thank my significant other, Djordje Hadzi Boskovic, for his absolute
support and for being patient through my ups and downs.
ACKNOWLEDGMENTS

Diabetes is a chronic condition that impairs or destroys the body's ability to regulate the
level of glucose in the body. Also, diabetes mellitus can be defined as group of metabolic
diseases characterized by high levels of blood glucose (hyperglycemia)[7]. It occurs as the
result of defects in the body's ability to produce and secrete insulin, or the ability to use
insulin, in some cases both. There are two major types of the metabolic disorder, Type 1 and
Type 2 diabetes mellitus. Type 1 diabetes occurs when the body stops producing insulin
[11]. Type 2 diabetes occurs when the body develops insulin resistance, or a decreased
sensitivity to the action of insulin, thus, the body does not effectively use the insulin it
produces [12]. Type 2 is the most prominent form and accounts for 90%-95% of all diabetes
cases in the U.S. This type of diabetes most commonly presents in adulthood and is
associated with obesity and patients can generally survive without exogenous insulin.
Usually, diabetes is associated with multiple complications that lean to morbidity and early
mortality. The major group of complications varies from arteriosclerosis of the major
arteries in the body, called macrovascular complications; these can lead to coronary artery
disease, myocardial infarction and stroke [13]. Events like this are responsible for 65% of
the deaths among patients with Type 2 diabetes; roughly 50% are due to heart attack and
15% die from stroke [11].
INTRODUCTION
CHAPTER 1

Over 40% of people living with Type 2 diabetes are over the age of 65. The condition
represents a significant health burden for such patients and the care of this population is a
considerable cost for society overall. There are several lines of evidence to suggest that Type
2 diabetes in elderly adults has a strong genetic predisposition [2-4]. Elderly patients with a
family history of diabetes are more likely to develop the disease as they age. Prevalence of
diabetes is to a great extent higher in some ethnic groups, especially Native Americans,
followed by Hispanics, African Americans and Micronesians. The demographic scale of
people age 60 years and older living with diabetes is as follows: male population accounts for
12.0 million (11.2%) and female population, 11.5 million (10.2%). Based on ethnicity, non-
Hispanic whites account for 14.9 million (or 9.8% of all non-Hispanic whites aged 20 years
or older have diabetes) and non-Hispanic blacks, 3.7 million (14.7 %) [9]. The value of body
mass index (BMI) potentially can impact quality of life and life style habits among the
elderly population (65 years and older) with Type 2 diabetes [27].
The American Diabetes Association (ADA), has explicitly recommended that care of
patients 65 years of age and older be individualized and a key component of individualizing
diabetes care should be the acknowledgment of a patient's perceptions of the quality-of-life effects
of different types of therapy [1]. BMI (low, normal or high) can be affected by: patients' diet, daily
exercise, total fat intake and quality of life. Patients who present with Type 2 diabetes may be
started on
Type 2 diabetes (
therapeutic nutrition management and exercise to reduce weight and obtain control over
the A1C level and degree of insulin resistance [25, 27]. However, if the patients on diet and
exercise fail to achieve and maintain glycemic control, pharmacotherapy is recommended.
The purpose of the study is to explore the association of oral antidiabetics (OAD) classes
and BMI/weight change over 6 months in T2DM) elderly patients in
ambulatory setting. This study was conducted utilizing the real-world data in the GE EMR
2

database; therefore, it provides more evidence to support or deviate from the clinical trial’s
findings. The proposed study investigated the distribution of T2DM elderly patients in the
General Electric Electronic Medical Records (GE EMR) database in regards to:
1. BMI and weight trends in elderly with diabetes patients using OAD medication
2. OAD use in elderly with diabetes patients and baseline clinical variables
3

Type 2 diabetes is a common disease in the elderly population. By the age of 75,
approximately 20% of the population is afflicted with this illness. From 1980 through
2006, the number of Americans with diabetes tripled (from 5.6 million to 16.8 million)
[28]. People aged 65 years or older account for approximately 37% of the population
with diabetes. Diabetes in elderly adults is metabolically distinct from diabetes in the
younger patient population, and the approach to therapy needs to be different in this age
group[29]. Diabetes is associated with considerable morbidity, mainly from macro- and
microvascular complications, depression, kidney failure and weight gain. Several lines
of evidence suggest that optimal glycemic control and risk factor modification can
substantially reduce the risk of complications in elderly patients [29]. A study by
Brixner D. et al. 2007, indicates that BMI and lab values are the key source for
recognition of the cardiovascular metabolic syndrome and therefore risk of later
developing diabetes [30].
In the past, treatment options were limited. Currently, numerous treatments are
available for use in older patients with diabetes. Recent studies have described several new
and exciting therapeutic opportunities for elderly patients with diabetes. Regardless of the
most suitable drug therapy, patients still experience various complications; one of the most
recurring is weight change [31]. Considering the slowness in metabolism ascommonly
LITERATURE REVIEW
CHAPTER 2

people age and the association of Type 2 diabetes and weight gain, there are newer oral
antidiabetic drugs (OADs) designed to purposely either cause weight loss and/or cause less
weight gain, presented as BMI change.
A model developed at the National Institutes of Health (NIH) showed that regular
measurement and tracking of BMI over time in diabetic patients can help better control A1C
level; therefore the better Type 2 diabetes disease management, as well as compared with non-
BMI control for patients with the onset of diabetes at 65 years and older [4, 5]. Most OADs,
except metformin, have shown moderate increase in patients' weight by 1 to 3 kg [31]. Also,
metformin did not show an effect on weight change in placebo-controlled trials either [21, 22].
Sulfonylureas are well known as agents associated with weight gain in elderly patients [32].
Thiazolidinediones (TZD) caused similar gain in weight (1 to 2.5 kg) compared to
sulfonylurea. In one of the most important studies regarding diabetes, the UK Prospective
Diabetes Study (UKPDS), second-generation sulfonylureas, such as glibenclamide and
chlorpropamide, had an effect on weight gain [14].
Astudy byAsche et al. studied the adverse events (AE) rates with OAD use in the elderly
and concluded the findings differed from those seen in clinical trials, particularly for weight
gain and hypoglycemia. AEs related to sulfonylurea therapy were in the same range as in
clinical trials for weight gain; AEs related to thiazolidinediones therapy were more common
than in clinical trials and lower for hypoglycemia and edema [33].
Some of the literature is not consistent with what has been previously discussed. The
results found by Cohen et al. showed that weight gain does not essentially accompany
treatment of T2DM. The OAD therapy is related with some weight gain, in certain drug
classes, where it is mostly due to modification of glycemia and improvement of weight loss
prior to the OAD treatment [19]. Significant decrease in levels of triglycerides, low-density
lipoprotein, total cholesterol and A1C were associated with use of metformin and TZD
5

(rosiglitozone). Also, metformin showed significant decrease in body weight, and was as
effective in normal and overweight individuals as it is in those who are obese; there are
evidence-based data to support metformin use in obese individuals with T2DM [20, 21].
Metformin is particularly appropriate for overweight patients with high fasting blood-
glucose levels [22]. An open randomized cross-over study compared metformin with
glibenclamide over one year in non-insulin-dependent patients. Equivalent effect on
glycemic control was found, but, in contrast to glibenclamide, metformin reduced body
weight [23].
The literature also showed that TZDs caused a significant weight change among elderly
patients in the EMR database, which somewhat supports findings from previous studies with
regard to combination therapy of rosiglitazone with metformin or sulfonylurea [25, 26]. The
literature indicates that rosiglitazone in combination with other OAD agents is a cost-
effective intervention for the treatment of normal weight, overweight and obese patients
with T2DM when compared with conventional care [24]. Additionally, Shearer et al.
concluded that after adjusting for the baseline weight, TZD still showed 1.12lb weight loss,
which conflicts with the current literature findings. A few assumptions have to be addressed
regarding previously mentioned results: 1) no patients' lifestyle data were reported or 2)
missing prescription refill data, therefore no record of patients' therapy compliance.
Importantly, in older adults with T2DM, the TZDs should be used cautiously; and in patients
with heart failure, TZDs are absolutely contraindicated. Contraindicated heart failure is 2.5
times more frequent in users of TZDs and insulin compared with insulin users alone, the risk
of heart failure is 4.5% in patients taking TZDs compared with 2.6% for non-TZD users [25].
TZDs have a lesser role in treating T2DM in older patients because of their significant
cardiovascular-related concerns, association with increased fracture risk and rosiglitazone's
potential to cause macular edema [26].
6

Following patients BMI is of great importance to try to improve not only patients'
weight but also compliance rates. For aging patients (50 years of age or older) and at disease
onset, there is a sustainable difference in BMI trends compared to those who are between 60-
70 years old [24]. The study by Rezende FA et al. 2006, proved that there is an association
between inadequate metabolic profile and the excess of body weight and/or central obesity,
evidencing the need for a nutritional and clinical intervention in the Type 2 diabetes patients,
in order to reduce the risk of future chronic complications [34].
Preliminary studies
One of the few essential studies on diabetes care that looked at the relationship between
glycemic control (as measured by glycosylated hemoglobin or A1C) and diabetic
complications, as well as potential reduction of those complications, is the United Kingdom
Prospective Diabetes Study (UKPDS). The UKPDS looked at the adult population of Type 2
diabetes to compare intensive pharmacologic therapy versus conventional therapy with diet
[14]. The study showed that second-generation sulfonylurea, such as glibenclamide and
chlorpropamide, were associated with minor weight gain, 2.4 kg on average. The newest
sunfonylurea agent, glimiperide, has shown better outcomes regarding A1C, lower insulin
levels in conditions of low blood glucose and certain weight loss.After 4 months of treatment
with glimiperide, patients lost up to 1.9 kg, after 1 year, -2.9 kg and after 1.5 years, -3.0 kg.
Greater decrease in BMI was found in males compared to females and there was evidence
that menopause did not have any significant influence on the results. UKPDS researchers
found that as A1C levels reached normal, each 1% improvement reduced the risk of all
diabetes complications, including heart attack, stroke and amputation [15].
7

Oral antidiabetics agents studied
Generally, patients are initiated on an oral antidiabetic agent (OAD). In fact 70% of
Type 2 diabetes patients are treated with oral OADs. Currently, five different classes of
hypoglycemic agents are available, each class displaying unique pharmacologic properties
[17]. These classes are as they appear:
and
(see Table 1). In the case of the patients who do not tend to manage adequate glucose
control with diet and exercise, single OAD therapy can be attempted. When choosing an
agent, it is of the greatest importance to consider both patient- and drug-specific
characteristics. If adequate blood glucose control is not attained using a single OAD, a
combination of agents with different mechanisms of action may have additive therapeutic
effects and result in better glycemic control and at the same time improve patients' BMI
goal. However, over a third of new Type 2 diabetes patients change OAD medication within
the first year for reasons such as therapy failure and side effects [16]. Thus, it is important to
understand the efficacy, safety and cost effectiveness of OADs in the initial treatment of
Type 2 diabetes. From a patients' perspective and even from that of payers', as well, there is
still the question to be addressed: What first-line OAD strategy will be the most cost
effective in treating new patients to achieve the recommended glycemic goal with minimal
side effects, in the proposed study weight gain/loss?
sulfonylureas, meglitinides, biguanides,
thiazolidinediones, alpha-glucosidase inhibitors dipeptidyl-peptidase 4 inhibitors
8

Sulfonylureas
Meglitinides
Biguanide
Thiazolidinediones
Alpha-glucosidase Inh*
DPP-4 inhibitors*
Renal failureHepatic insufficiencyDKA
Hepatic insufficiencyDKA
Predisposition to lactic acidosisPoor peripheral perfusionHypoxic states, Sepsis
Congestive heart failureLiver diseaseDKASmall-bowel diseaseSevere renal insufficiencyDKA
DKA
HypoglycemiaWeight gain
Hypoglycemia
Gl upsetLactic acidosis
Fluid retentionPeripheral edema
FlatulenceDiarrheaGl upset
HeadacheNausea, vomitingDiarrhea
Side EffectsContraindicationsClass of Agent
*Alpha-glucosidase inhibitors and DPP-4 inhibitors decrease the hemoglobin A1C level0.5% to 1%; other classes of agents decrease it by 1% to 2%.
References 19, 22, 23, 27.CrCl = Creatinine clearance, DKA = Diabetic ketoacidosis, DPP-4 =
Dipeptidyl-peptidase-4, GI Gastrointestinal
Source:Abbreviations:
Table 1. Oral antidiabetic agents
9

Study design
Variables
This study employed a cross-sectional cohort design to evaluate the association between
the use of oral anidiabetics agents (OAD) and change in BMI and weight utilizing data from
January 1, 1997, through December 31, 2008.
The cohort included an elderly population age 65 years and older at the date of first OAD
prescription within the GE EMR database, who had 12 months of continuous pre-index-
date activity; index date was defined as first OAD prescription.
Persons excluded were individuals who were diagnosed with depression, cancer, HIV,
protein-calorie malnutrition, hypothyroidism and weight loss medications (see Appendix A
for ICD-9 codes).
The primary dependent variable was Body Mass Index (BMI), measured at baseline
and follow up, and presented as the BMI change. In addition, the weight, as the secondary
outcome variable, was measured at baseline, follow-up and presented as change in
weight.
Primary independent or predictor variables were OAD classes, age, race, glycated
hemoglobin (A1C), low-density lipoprotein (LDL), high-density lipoprotein (HDL), total
≥
STUDY DESIGN AND METHODS
CHAPTER 3

cholesterol (TC), triglycerides (TG), comorbid condition (see Appendix D), insurance type,
age, and drugs/ drug classes known to be associated with Type 2 diabetes (seeAppendix C).
Procedures
Data used in the proposed study were gathered through the General Electric Centricity
Electronic Medical Record (GE EMR, GE Healthcare, Waukesha, WI) research database
from 1996 to present. It is a longitudinal patient database containing, but not limited to,
demographic data, vital signs, laboratory orders and results, medication list entries and
prescriptions, and diagnoses or problems. Patients in the EMR database are similar in age
and racial/ethnic subgroups to the US population based on the 2005 United States (US)
Census estimates. Patients 65 years and older were representative of 16.6% of the patients
within the GE EMR which is somewhat consistent with US Census national population
estimates of 13.6%. The main reason for this difference is that frailer, sicker elderly will be
presented more in the EMR than in the general population of the same age. The prevalence of
Type 2 diabetes in the GE EMR identified by diagnosis codes was 6.55% in 2007. The
important fact is that the GE EMR database has a higher representation of women compared
to national estimates (58.1% female in EMR vs. 50.8% in the US). Patient data are available
for only 35 of 50 US states, with a higher representation of Northeastern, Midwestern and
Southern States, 24.27%, 33.13% and 29.94%, respectively.
Participants are selected from a network of outpatient private physician practices that
uses an ambulatory EMR, known as Centricity Office from General Electric Healthcare
Information Technology (GEHC IT). All data in this database are de-identified (DI)
according to HIPAA standards. For each patient, the EMR begins with demographic
information followed by details regarding medications and prescriptions, symptoms,
11

physical examination findings, laboratory and radiology results and diagnoses. In addition,
this database includes information such as weight, height, blood pressure, and glucose and
cholesterol level, HDL, LDL, triglycerides and smoking status. After this part is done, a
reporting data set is created for analysis. These data sets are used for primary care research,
health system research and, in particular, for quality of health care studies. Following HIPPA
standards, medical practices that use this EMR can decline participation in MQIC (Medical
Quality Improvement Consortium) studies, and their patients' records are going to be
excluded from the research data sets.
The values of the GE EMR database are as follows: 1) Centricity EMR is used by over
100 clinical practice sites to manage 30 million patient records in 35 states, 2) the GE EMR
research database contains longitudinal ambulatory electronic health data for over 10
million patients of all ages (but not limited to demographic data, vital signs, laboratory
orders and results, medication list entries and prescriptions, and diagnoses or problems), and
3) variety of practice types are represented in the consortium ranging from solo practitioners
to community clinics, academic medical centers, and large integrated delivery networks.
Approximately 60% of the participating clinicians practice primary care.
This EMR allows the use of combinations of clinical data, such as chief complaint data,
comprehensive laboratory values, and vital signs.Therefore, these parameters identify
patients, which can be valuable in maximizing the identification of patients; such data also
enable research of treatment outcomes.
Patients were selected from the GE EMR database according to the following selection
criteria:
1. Age 65 or older on index date
2. No OAD prescription prior to index date (naive diabetic patients)
3. Indication of Type 2 diabetes based on meeting at least one of the following requirements:
12

a. Diagnosis of Type 2 diabetes based on an ICD-9 codes of 250.X0 or 250.X2, or
b. At least one prescription order for an oral antidiabetic drug (OAD) (Index Date) (see
Appendix A and Table 1). All patients need to have only one OAD prescription at date
prescribed, excluding the fixed dose combinations.
Within this historic cohort study design, the patients were followed for 6 months (+30
days) from the index date. The study required that included patients have at least a year of
continuous pre-index-date activity (see Figure 1).
4. Continuously active in the database for a minimum of 365 days (+/-30days) prior to
index date
5. Continuously active in the database for at least 6 months (+30 days) post-index-date
6. Naïve patient population- no other OAD, insulin per med list entry naïve prior to
index date
7. Comorbid conditions- Exclusion of the patients with cancer, HIV, depression,
protein-calorie malnutrition, hypothyroidism, hyperthyroidism, and weight loss
medications (seeAppendixAfor ICD-9 codes)
8. Number of patients with diagnose of Type 1 Diabetes (exclusion criteria)
9. Number of patients with no other added-on OAD or insulin in 210 days (180
days+30 days) post-index-date
10. Baseline BMI reading (Index date +/- 30 days) for 210 days data
Figure 1. Study timeline
Pre-index-date activity
i: Index datei –395 days
Observation Period
i+210 days
13

11. Follow-up BMI reading for 180 days (+30 days) post-index-date, completed the
final number of patients (study population). Patient population was stratified based on
diabetes treatment on index date and divided into 6 study groups:
MET monotherapy
SU monotherapy
TZD monotherapy
Alpha Glucose inhibitors monotherapy (later excluded due to the lack of number of
patients)
DPP-4 inhibitor monotherapy
Meglitinides monotherapy
Data were entered into SAS Proprietary Software 9.2 (SAS Institute Inc., Cary, NC,
USA) for analysis. Demographics information that included age, ethnicity, region, insurance
type, smoking and alcohol status for the population and each group was recorded, and
presented in a tabular format. Clinical baseline characteristic and comorbidities were also
recorded, namely, blood pressure,A1C, LDL, HDL, TG, TC, hypertension, acute myocardial
infarction, cardiovascular disease, cerebrovascular disease and kidney disease. Prescription
orders for the covariate medication of the study population were also recorded, namely: 1)
dyslipidemias, antipsychotics, antiretrovirals, hormone replacement therapy, glucocorticoids
and 2) hyperglycemia/ Glucose Intolerance, such as, atypical antipsychotics, glucocorticoids,
thyroid hormone, oral contraceptives and nicotinic acid. For a full description of the
prescription medication see Appendix B. Results were presented in tabular format, reporting
baseline demographics with percentage of certain OAD users.
The following characteristics of the patients' were captured to portray the OAD study
population and afterward employed as variables in the Analysis of Variance (ANOVA) with
Tukey test performed to explain the differences in study groups.
�
�
�
�
�
�
14

�
�
�
Demographic data
o Age ( 65-69, 70-74, 75-80, 80)
o Gender (Male, Female)
o Race/ethnicity (Caucasian,African-American, Hispanic, Other, Unknown)
o Region (Northeast, South, Midwest, West)
o Insurance status (Commercial, Medicare, Medicaid, Self-pay, Not Reported )
Baseline clinical characteristics
o A1C; continuous and categorical (<7.0, 7.0 - <9.0, 9.0)
o BP; mean SBPand mean DBP( 130/80, 130/80)
o BMI (systematically calculated by EMR based on height and weight); continuous
and categorical [under or normal (BMI < 24.9), overweight (BMI 25-29.9), obese (BMI 30-
34.9), very obese (35.0-39.9), extremely obese (BMI>40).]
o Weight (continuous)
o Smoking status; current, former, nonsmoker, other
o Alcoholism- cirrhosis, alcohol dependence, severe alcohol abuse (defined by ICD-9
codes as appears: 303, 571.2 and V11.3)
o Lipid levels
� TGs; continuous and categorical (<150 mg/dl, 150 mg/dl)
� HDLs; continuous and categorical (<40 mg/dl, 40 mg/dl)
� LDLs; continuous and categorical (< 100 mg/dl, 100 mg/dl)
� TC; continuous and categorical (<240 mg/dl, 240 mg/dl)
o Covariate drugs: other therapy drugs influences studied outcomes (seeAppendix B.)
Comorbidities
o Charlson Comorbidity Index at time of study entry ( seeAppendix C)
≥
≥ ≥
≤ ≥
≥
≥
≥
≥
15

o Individual comorbid conditions: hypertension, acute MI, cardiovascular disease,
cerebrovascular disease and kidney disease (seeAppendix C)
The A1C level on baseline and after 6 months from index date was captured for
individual patients. There was a need for acknowledging the recordings of the change inA1C
level after 6 months for a certain OAD monotherapy, and an attempt was made to describe
and if possible to strengthen the impact of the OAD on the diabetes clinical outcomes. The
results of the change in A1C level were presented by drug level, where change in A1C level
after six months for each OAD medication was measured; these readings tried to accompany
the previously shown change in clinical outcomes (BMI and weight).
The primary outcome variables was the BMI (unit and percent change), and change in
weight (unit and percent change). Change was measured from baseline to 6 months for all
patients with 6 month (+30 days) follow-up BMI or weight readings.
Descriptive statistics were utilized to describe the baseline demographic and clinical
characteristics for elderly Type 2 diabetes patients. Tests for statistically significant
differences in baseline characteristics by baseline treatment was conducted using analysis of
variance (ANOVA), which is used for comparison among two and more groups of interest,
for continuous variables and Pearson's chi-square test for categorical variables. Any present
small sample cell size (<5) was analyzed by using the Fisher exact test. The ANOVA was
accompanied by the Tukey test, used to find which means are significantly different from one
another. It compares all possible pairs of means with multiple-comparison adjustment.
Changes in BMI and weight from baseline for the 6 months follow-up analyses were
reported for patients overall and by index diabetes treatment. The sample power calculation
Statistical methods
16

was not performed, since the presented analysis is the Post-hoc analysis of variances, where
it is not suggested to do the power calculation. These outcomes analyses were accounted for
the patients in each outcome that have baseline and follow-up data.
In addition to ANOVA, general linear models were developed to estimate the mean
change in outcomes for patients by baseline drug treatment for subjects with baseline and
follow-up readings of the individual outcome measures at 6 months. The model controlled
for patient baseline BMI and weight values, some of the demographic and clinical
characteristics that differ between patients that could impact outcomes, for the addition of
covariate drugs.
Mean change in outcomes, BMI and weight, was estimated utilizing coefficients
derived from theANOVA.Also the general linear model was used to assess the differences in
outcomes between patients; p-value with 95% confidence intervals was reported. The results
were presented as units change for both outcomes, also the statistical significant
comparisons betwen OAD groups were shown. All statistical tests were performed at a 0.05
significance level using SAS Proprietary Software 9.2 (SAS Institute Inc., Cary, NC, USA).
17

Study population
From the total population of 11,071,328 within the EMR database, 428,456 people
had an OAD prescription-Index date (first OAD prescription in EMR database from
1996 though 2008). For the purposes of the study, we included only patients 65 years of
age and older at or after the date of first OAD prescription (n=1,440,198). Monotherapy
OAD, including the patients who were prescribed with one OAD medication during the
study period, limited the population to 122,780 patients (1.1% of the overall EMR
database). Then, 46,776 patients had 395 days of pre-index-date activity, where 61.9%
of the patients were lost due to the insufficient (fewer than 395 days) activity prior to
index date. An additional 6.4% patients were excluded due to the lack of 6 months
activity after index date. Another 16% unique patients were excluded from the
46,776 patients group based on the criterion of including only naive antidiabetic agent
users. Based on the diagnosis exclusion criteria, 7.6% patients were excluded from the
study. This included 158 patients due to the Type 1 diabetes, 9383 with ICD9 code
(cancer, HIV, hypothyroidism, hyperthyroidism, protein-calorie malnutrition) and
208 patients with prescriptions for weight loss medications. From the index date, 8,004
(1.5% lost) patients were followed for the 6 months (+30 days) of continuous OAD
monotherapy with no add-on or switches on the therapy. Baseline BMI and
of
RESULTS
CHAPTER 4

weight readings (+/- 30 days from the index date) were captured for 5,162 unique patients
(2.3% patients were excluded due to the lack in BMI readings). This resulted in a study
population of 2721 patients (1.9% lost) who had follow-up BMI and weight readings, 6
months + 30 days from the index date (see Figure 2). Additionally one patient was excluded
due to the deficient power in theAlpha Glucose Inhibitors group (group contained one patient,
therefore was dropped from further analysis), which brought the final study population to
GE EMR DatabaseN=11,071,328
1) First Rx order for any OAD Tx = index dateN= 428,456
2) Age 65 on index dateN= 140,198≥
3) Only monotherapy OAD (exclude FDC) patients on date prescribedN=122,780
4) 395 days pre-index-date activityN= 46, 776
5) 210 days post-index-date activityN= 38, 949
6) No other OAD, insulin per med list entry naïve prior to index dateN= 19,270
Figure 2. Study population flowchart
19
7) Exclusions-comorbid conditionsN= 9,887
(ICD9's- 9,383, Drugs- 208, Type I Diabetes-158)
8) No other added-on OAD, or switch, or insulin in 210 days (6 months+30 days) post-index-dateN= 8,004
9) BMI index date +/- 30 daysN= 5,162
10) BMI at least 6 months (+ 30 days) from index dateStudy population
N= 2,721

2720 unique patients, where from the initial 122,780 collection, 97.7% patients were
excluded.
Of the monotherapy study population (N=122,780), 38.1% patients had a year pre-
index-date activity; 8004 patients had a 6 months monotherapy OAD activity and of those, 2,
721 patients had at least two BMI and weight readings (baseline and follow-up). This study
has a lesser sample size, accordingly to the rigorous patient selection criteria and excluding
the major diseases and covariate therapies that were shown to be associated with weight and
elderly Type 2 Diabetic patients.
The included patients were 65 years of age or older,
therefore the majority was insured though Medicare: 67%, 67%, 74%, 70% and 79%.
were
Table 2 shows the baseline characteristics of the study
population by OAD groups (study cohorts). The study population was somewhat evenly
distributed across the age categories (65-69, 70-74, 75-79 years of age) within OAD groups,
with the exception of the DPP-4 Inhibitors group (11%, 15% and 74%). Ethnicity data were
not reported for the majority of patients (55%, 56%, 49%, 67% and 70%, respectively). The
Caucasian group represented the most reported ethnicity (38%, 34%, 44%, 26% and 18%,
respectively). Gender distribution difference was found only in the metformin group, male
vs. females, 45% and 55%, respectively.
Data
were gathered mostly from the Northeast region of the United States (34%, 30%, 33%, 37%
and 36%); the West region was underrepresented in the study. Reported baseline BP showed
the patients mainly, regardless of the OAD group, in Hypertension Stage 1 (blood
pressure from >130/80 mmHg to 159/99 mmHg). There were many missing observations in
the following baseline variables: HDL, LDL, total cholesterol, triglycerides, alcohol and
smoking status. From the total study population, hypertension (16%, 16%, 17%, 11% and
15%) and cardiovascular disease (8%, 13%, 8%, 7% and 6%) accounted for the majority of
the comorbidities within the study population.
20

Table 2. Baseline demographics characteristics
21
Variable
Age
65-69
(N=1602)
MET
(N=819)
SU
(N=239)
TZD
(N=27)
DPP-4 Inhibitors
(N=33)
Meglitinides
40% 23% 31% 11% 24%
70-74 34% 43% 3 %8 15% 39%
75-79 26% 34% 3 %1 74% 36%
Total N for Age
Gender
Male
Female
45% 50% 5 %1 52% 45%
55% 50% 49% 48% 55%
Race
38% 34% 44% 26% 18%Caucasian
African-American
4% 5% 5% 7% 6%
1% 3% 0% 0% 3%Hispanic
1% 2% 1% 0% 3%Other
55% 56% 49% 67% 70%Unknown
Region
34% 30% 33% 37% 36%Northeast
25% 26% 33% 33% 36%South
27% 30% 23% 22% 12%Midwest
14% 14% 12% 7% 15%West
Insurance
16% 17% 14% 15% 12%Commercial
67% 67% 74% 70% 79%Medicare
0% 0% 0% 0% 0%Medicaid
0% 0% 0% 0% 0%Self-pay
16% 16% 12% 15% 9%Other/Unknown
Blood Pressure
30% 29% 33% 33% 42%Normal
64% 63% 64% 63% 55%Hypertension-stage1
5% 6% 3% 4% 3%Hypertension-stage2
A1C
29% 18% 25% 30% 42%<7.0
32% 34% 29% 26% 27%7.0-8.9
5% 8% 6% 0% 0%>9.0
Number of nonmissing observations 1,060 484 143 15 23
Tryglicerides
17% 11% 24% 22% 15%<150 mg/dl
20% 17% 19% 15% 18%<150 mg/dl
Number of nonmissing observations
590 232 102 10 11
HDL
18% 17% 16% 15% 15%<40 mg/dl
35% 25% 42% 26% 33%>40 mg/dl
Number of nonmissing observations 850 346 140 11 16

Table 2 continued
22
Variable (N=1602)
MET
(N=819)
SU
(N=239)
TZD
(N=27)
DPP-4 Inhibitors
(N=33)
Meglitinides
LDL
19% 15% 23% 11% 6%<100 mg/dl
22% 15% 20% 15% 30%>100 mg/dl
Number of observations 663 247 104 7 12Total cholesterol
<240 mg/dl 49% 40% 51% 30% 45%
>240 mg/dl 5% 5% 6% 7% 6%
Number of nonmissing observations 868 365 138 10 17
Smoking status
Current 6% 4% 3% 4% 0%
Former
Not current
15% 11% 1 %1 30% 12%
6% 4% 10% 7% 6%
Number of nonmissing observations
Alcohol status
100% 100% 100% 100% 100%
0% 0% 0% 0% 0%Alcoholic
Covariate lipid medication
86% 82% 83% 85% 82%
14% 18% 17% 15% 18%
Comobridity-Hypertension
84% 84% 83% 89% 85%no diagnosis
16% 16% 17% 11% 15%diagnosis
Comobridity-Acute Ml
100% 99% 100% 100% 100%no diagnosis
Comorbidity-CVD
92% 87% 92% 93% 94%no diagnosis
8% 13% 8% 7% 6%diagnosis
97% 96% 98% 100% 97%no diagnosis
3% 4% 2% 0% 3%diagnosis
19% 16% 14% 7% 18%
722 279 98 13 12
Unknown
Not an alcoholic
86% 83% 88% 93% 88%no drug
14% 17% 12% 7% 12%drug
Covariate glusoce medicationsno drug
drug
diagnosis 0% 1% 0% 0% 0%
Comorbidity-CRVD
Comorbidity-Kidney Disease
99% 97% 97% 93% 97%no diagnosis
1% 3% 3% 7% 3%diagnosis

Table 3 illustrates the frequency of the individual OAD agents among the elderly Type 2
Diabetic patients. Of the total of 2720 patients, the most prescribed OAD agent was metformin with
1602 users (58.9%), followed by the glipizide, 395 users (14.52%) and pioglitazone, 156 (5.74%).
Glipizide was the most prescribed in the class of sulfonylureas followed by the glimepiride with 211
users (7.76%)andglyburide,198 (7.28%)of the total2720elderlydiabeticpatients.
Table 4 describes the baseline characteristics of the categorical variables. The
differences were assessed using a Chi-square test. The rates of comorbid conditions differed
between the treatment groups (acute MI, CVD and KD with p-values 0.0357, 0.0007 and
0.0001, respectively). Significant differences between the OAD groups were also found with
respect to race and smoking status (p=0.004 and < 0.0001).
Table 4. Baseline characteristics of the categorical variables
Categorical variables at Baseline
Variable F P-Value
Gender 7.9 0.092
Race 34.6 0.0044*
Region 18.1 0.1127
Insurance 8.5 0.9327
Smoking status 53.4 <.0001*
Alcohol status 2.1 0.7181
Covariate lipid medication 6.5 0.1608
Covariate glusoce medications 6.9 0.1398
Comobridity-Hypertension 0.6 0.9631
Comorbidity-Acute MI 10.3 0.0357*
Comorbidity-CVD 19.3 0.0007*
Comorbidity-CRVD 4.7 0.3225
Comorbodity-Kidney Disease 22.7 0.0001*
23
Table 3. Frequency of the OAD use among the elderly Type 2 diabetes
Prescribed drug Number of patients Percent (%)
GLIMEPIRIDE
GLIPIZIDE
GLYBURIDE
GLYBURIDE MICRONIZED
METFORMIN HCL
NATEGLINIDE
PIOGLITAZONE HCL
REPAGLINIDE
ROSIGLITAZONE MALEATE
SITAGLIPTIN PHOSPHATE
TOLBUTAMIDE
Total
211
395
198
13
1602
20
156
13
83
27
2
2720
7.76
14.52
7.28
0.48
58.9
0.74
5.74
0.48
3.05
0.98
0.07
100.00

Table 5 illustrates the characteristics of continuous variables at baseline. The overall
mean age in the OAD groups was 72.7 years. The values of the baseline diastolic blood
pressure (DBP) differed (p=0.0009), as well as age (p< 0.001); also, DBP indicated that the
patients were in Hypertension Stage 1. The A1C level was shown to be statistically
significant (p< 0.001) with the highest mean value in the sulfonylureas group (7.7).
Table 6 describes the characteristics of the outcome variables (BMI and weight) at the
baseline, closest reading to the Index date, and at the 6 months follow-up period. In comparing
the baseline and follow-up values, statistical significance was found in both of the outcomes,
BMI and the weight. The mean baseline BMI for all OAD groups was 29.78 kg/m², where the
metformin users had the highest baseline BMI value (31.24 kg/m²); lowest baseline BMI was
found among the DPP-4 Inhibitors patients (29.07 kg/m²). After the closest sixth month
reading considering the monotherapy OAD, the overall mean BMI value was 29.08 kg/m².
Further, the overall mean change in BMI among all of the OAD groups was - 0.7 BMI units
(data show the weight loss among patients). The change in BMI after 6 months of
Table 5. Baseline characteristics of the continuous variables
Countinuos variables at baseline
Variable Age Systolic Diastolic A1C TG HDL LDL TC
Mean 71.2 134.8 75.5 7.3 179.9 46.3 105.3 184.3
Lower 71.0 133.9 74.9 7.2 171 45.4 102.8 181.6
Upper 71.4 135.9 75.9 7.3 188.9 47.2 107.9 187
Mean 72.5 134.7 73.9 7.7 221.8 44.3 103.5 185.5
Lower 72.2 133.4 73.3 7.5 197.7 42.9 99 180.9
Upper 72.7 135.9 74.7 7.8 245.8 45.7 107.9 190.1
Mean 71.7 132.1 73.9 7.5 170.5 47.5 103.3 187
Lower 71.2 129.7 72.5 7.2 150.1 44.9 95.7 179.6
Upper 72.2 134.4 75.4 7.7 190.8 50.1 110.9 194.4
Mean 75.4 135.1 74.1 7.1 145.1 47.8 121.3 193.6
Lower 73.8 128.7 70.5 6.7 81.4 37.8 75.8 162.7
Upper 77.0 141.5 77.6 7.5 208.7 57.8 166.7 224.5
Mean 72.8 130.7 70.9 6.7 159.1 44.4 128.6 186.7
Lower 71.3 123.9 67.4 6.4 111.8 38.8 109.7 161.1
Upper 74.2 137.5 74.5 7.1 206.3 50.1 147.5 212.3
F 18.8 1.6 4.7 8.6 5.1 2.03 1.99 0.26
P-Value <.0001* 0.1639 0.0009* <.0001* 0.0004* 0.0885 0.0933 0.9053
Blood Pressure
Meglitinides
MET
SU
TZD
DPP-4 Inhibitors
* Statistically significant at alpha <0.05
24

monotherapy showed the meglitinides had the biggest decrease in BMI (-1.27), followed by
the metformin group (-1.06) and the sulfonylureas showed the least BMI drop (-0.14).
The secondary outcome was weight, where the mean baseline weight was 180.17 pounds (lb).
Patients prescribed with metformin weighed the most (191.45 lb) at baseline. The follow-up
weight mean was 176.20 lb; therefore, the 3.97 lb weight loss was reported between all of the
OAD groups. Major weight loss was found in the meglitinides users (-7.82lb), followed by the
metformin group (-6.41lb). The sulfonylureas group reported the least weight loss (-0.89lb).
Table 7 describes the BMI baseline frequency distribution by the OAD classes. Furthermore,
the baseline BMI was stratified by four cohorts: underweight (BMI less than 18 kg/m2), normal
(BMI 18-24.9 kg/m2 ), overweight (25-30 kg/m2) and obese (over 30 kg/m2). Over 58% of the
patients were metformin users, and of those, 64.63% were in the obese group. The majority,
41.23% of the sulfonylureas users, were in the normal weight BMI group and a similar trend was
observed in the case of DPP-4 Inhibitors and meglitinides (1.54%, 2.46%, respectively).
Table 6. Characteristics of the outcome variables at baseline and follow-up
Variable Baseline Followup Change Baseline Followup Change
Mean 31.24 30.17 -1.06 191.45 185.11 -6.41
Lower 30.95 29.90 -1.16 189.45 183.14 -6.98
Upper 31.52 30.45 -0.96 193.44 187.07 -5.85
Mean 29.67 29.53 -0.15 181.23 180.38 -0.89
Lower 29.30 29.16 -0.27 178.41 177.61 -1.56
Upper 30.05 29.90 -0.02 184.04 183.15 -0.22
Mean 29.69 29.43 -0.26 181.59 180.57 -0.97
Lower 28.99 28.71 -0.50 176.79 175.66 -2.38
Upper 30.38 30.15 -0.01 186.39 185.47 0.43
Mean 29.07 28.33 -0.74 173.41 169.70 -3.96
Lower 26.66 26.00 -1.16 159.43 156.09 -6.35
Upper 31.49 30.67 -0.32 187.38 183.30 -1.58
Mean 29.21 27.94 -1.27 173.24 165.25 -7.82
Lower 26.46 25.38 -3.11 157.91 150.62 -17.30
Upper 31.97 30.50 0.56 188.58 179.89 1.66
F 12.99 3.8 31.86 11.74 4.56 39
P-Value <.0001* 0.0044* <.0001* <.0001* 0.0011* <.0001*
Meglitinides
MET
SU
TZD
DPP-4Inhibitors
BMI WeightOutcomevariablesatbaseline
*Statistically significant at alpha <0.05
25

Table 8 illustrates the BMI follow-up frequency distribution by the OAD classes, where
the weight reading closest to the 6 months of OAD monotherapy was accounted for. Results
are somewhat similar to the BMI baseline frequency distribution. The heaviest elderly
diabetic patients were seen in the metformin group, with 62.5% obese patients; weight loss
was indicated in these patients, since there were 64.63% patients in the obese group at the
baseline and there were 62.50% after 6 months. The sulfonylureas users showed minor
weight gain, 28.92% patients in the obese group at the follow-up compared to the 26.73% of
the patients in the obese group at baseline.
Table 7. Characteristics of the baseline BMI stratified byunderweight/normal/overweight/obese OAD users
Baseline BMI
OAD Class Underweight
(%)
Normal
(%)
Overweight
(%)
Obese
(%)
Total
(%)
MET 60.00 45.54 54.36 64.63 58.9
SU 30.00 41.23 31.6 26.73 30.11
TZD 5.00 9.23 11.49 7.07 8.79
DPP4-Inhibitors 0.00 1.54 1.10 0.82 0.99
Meglitinides 5.00 2.46 1.44 0.75 1.21
Total 0.74 11.95 33.27 54.04 100
Table 8. Characteristics of the follow-up BMI stratified byunderweight/normal/overweight/obese OAD users
Follow up BMI
OAD Class Underweight
(%)
Normal
(%)
Overweight
(%)
Obese
(%)
Total
(%)
MET 58.62 54.2 55.88 62.5 58.9
SU 27.59 33.08 30.62 28.92 30.11
TZD 6.9 8.65 11.34 7 8.79
DPP4-Inhibitors 0.0 1.78 0.82 0.9 0.99
Meglitinides 6.9 2.29 1.34 0.68 1.21
Total 1.07 14.45 35.66 48.82 100.0
26

Differences among the OAD groups
Figure 3, Table 9, Figure 4, Figure 5, Figure 6, Table 10, Figure 7, Table 11, Figure 8,
Table 12, Figure 9, Table 13, Figure 10, Table 14, Figure 11, Table 15, Figure 12, Table 16,
Figure 13, Table 17, Figure 14, and Table 18, illustrate the association between the baseline
levels of BMI, Weight, A1C, Diastolic Blood Pressure (DBP), Triglycerides, Age and study
cohorts (OAD classes). Also, the correlation between the follow-up BMI, weight and OAD
groups was analyzed. An analysis of variance (ANOVA) is a statistical test in which the
observed variance is partitioned into components due to different explanatory variables. The
ANOVA describes that the means of several groups are all equal, and therefore generalizes
the Student's t-test to more than two groups. The Tukey test, which is used in conjunction
with an ANOVA to find which pairs of means are significantly different from one another
(and compares all possible pairs of means), was applied in proposed analysis. The
statistically significance differences between the pairs ofAOD classes were found at alpha <
0.05 at and are presented in the legend, below each figure as they appear. All of the analyses
for the variable of interest were performed at OAD class level, except for the change of the
A1C level that was done both at class and individual OAD agent level. The reasons for this
motion were: 1) there are no OAD agents refill data available in GE EMR and improvement
of the A1C level after 6 months of OAD monotherapy could be attributed to the actual OAD
medication and 2) to emphasize the impact, of the better A1C controlled OAD therapy, on
clinical outcomes (BMI and weight).
27

Figure 3. Mean baseline A1C by OAD categories
*Based on the ANOVA model using the Tukey test, significance differences were found atalpha < 0.05 for the following comparisons: Metformin vs. Sulfonylureas and Sulfonylureasvs. Meglitidines
Table 9. Association between the baseline A1C and the OAD classes-ANOVA model using Tukey test*
Variable- BaselineA1C
Drugcategoriescomparison Mean1 Mean2 Difference inMeans Lower Upper
Metforminvs. Sulfonylureas 7.28 7.68 -0.40 -0.6107 -0.1950
Sulfonylureas vs. Metformin 7.68 7.28 0.40 0.1950 0.6107
Sulfonylureas vs. Meglitidines 7.68 6.71 0.97 0.1602 1.7774
Meglitidines vs. Sulfonylureas 6.71 7.68 -0.97 -1.7774 -0.1602
95%CI
*All of the above comparisons were statistically significant at alpha <0.05
28

Figure 4. Mean change A1C by OAD categories
*Based on the ANOVA model using the Tukey test, significance differences were found atalpha < 0.05 for the following comparison: Metformin vs. Sulfonylureas
29

Figure 5. Mean change of A1C by individual OAD medication
*Based on the ANOVA model using the Tukey test, significance differences were found atalpha < 0.05 for the following comparison: Metformin vs. Glimiperide, Metformin vs.Glipizide and Metformin vs. Glyburide
30

Figure 6. Means age at index date by OAD categories
*Based on the ANOVA model using the Tukey test, significance differences were found atalpha < 0.05 for the following comparisons: Metformin vs. Sulfonylureas, Metformin vs.DPP-4 Inhibitors and Sulfonylureas vs. DPP-4 Inhibitors, TZD vs. DPP-4 Inhibitors
31

Variable- Baseline Age
Drug categories comparison Mean 1 Mean 2 Difference in Means Lower Upper
Metformin vs. Sulfonylureas 71.232 72.466 -1.23 -1.7099 -0.7585
Metformin vs. DPP4-Inhibitors 71.232 75.407 -4.18 -6.3243 -2.0261
Sulfonylureas vs. DPP4-Inhibitors 72.466 75.407 -2.94 -5.107 -0.7749
Sulfonylureas vs. Metformin 72.466 71.232 1.23 0.7585 1.7099
TZD vs. DPP4-Inhibitors 71.732 75.407 -3.68 -5.9235 -1.4268
DPP4-Inhibitors vs. Metformin 75.407 71.232 4.18 2.0261 6.3243
DPP4-Inhibitors vs. Sulfonylureas 75.407 72.466 2.94 0.7749 5.107
DPP4-inhibitors vs. TZD 75.407 71.732 3.68 1.4268 5.9235
95% CI
Table 10. Association between the patient age and the OAD classes-ANOVA model using Tukey test*
*All of the abovecomparisons were statistically significant at alpha <0.05.
Figure 7. Mean baseline BMI by OAD categories
*Based on the ANOVA model using the Tukey test, significance differences were found at alpha< 0.05 for the following comparisons: Metformin vs. Sulfonylureas and Metformin vs. TZD
32

Table 11. Association between the baseline BMI and the OAD classes-ANOVA model using Tukey test*
Variable- Baseline BMI
Drug categories comparison Mean 1 Mean 2 Difference in Means Lower Upper
Metformin vs. Sulfonylureas 31.24 29.67 1.57 0.8985 2.2328
Metformin vs. TZD 31.24 29.69 1.55 0.4741 2.6279
Sulfonylureas vs. Metformin 29.67 31.24 -1.57 -2.2328 -0.8985
TZD vs. Metformin 29.69 31.24 -1.55 -2.6279 -0.4741
95% CI
*All of the above comparisons were statistically significant at alpha <0.05.
Figure 8. Mean change in BMI by OAD categories
*Based on the ANOVA model using the Tukey test, significance differences were found atalpha < 0.05 for the following comparisons: Metformin vs. Sulfonylureas, Metformin vs.TZD and Sulfonylurea vs. Meglitinides
33

Table 12. Association between the change in BMI and the OAD classes-ANOVA model using Tukey test*
Variable- Change in BMI
Drug categories comparison Mean 1 Mean 2 Difference in Means Lower Upper
Metformin vs. Sulfonylureas -1.06 -0.15 -0.92 -1.1540 -0.6803
Metformin vs. TZD -1.06 -0.26 -0.81 -1.1895 -0.4249
Sulfonylureas vs. Metformin -0.15 -1.06 0.92 0.6803 1.1540
Sulfonylureas vs. Meglitidines -0.15 -1.27 1.13 0.1485 2.1063
TZD vs. Metformin -0.26 -1.06 0.81 0.4249 1.1895
Meglitidines vs. Sulfonylureas -1.27 -0.15 -1.13 -2.1063 -0.1485
95%CI
*All of the above comparisons were statistically significant at alpha <0.05.
Figure 9. Mean baseline diastolic BP by OAD categories
*Based on the ANOVA model using the Tukey test, significance differences were found atalpha < 0.05 for the following comparisons: Metformin vs. Sulfonylureas.
34

Table 13. Association between the baseline diastolic BP and the OAD classes-ANOVA model using Tukey test*
Variable- Baseline Diastolic BP
Drug categories comparison Mean 1 Mean 2 Difference in Means Lower Upper
Metformin vs. Sulfonylureas 75.49 73.99 1.49 0.2893 2.696
Sulfonylureas vs. Metformin 73.99 75.49 -1.49 -2.696 -0.2893
95%CI
*All of the above comparisons were statistically significant at alpha <0.05.
Figure 10. Mean baseline triglycerides by OAD categories
*Based on the ANOVA model using the Tukey test, significance differences were foundat alpha < 0.05 for the following comparisons: Metformin vs. Sulfonylureas andSulfonylureas vs TZD.
35

Table 14. Association between the baseline triglycerides and the OAD classes-ANOVA model using Tukey test*
Variable- Baseline Triglycerides
Drug categories comparison Mean 1 Mean 2 Difference in Means Lower Upper
Metformin vs. Sulfonylureas 179.988 221.7629 -41.78 -69.825 -13.724
Sulfonylureas vs. Metformin 221.763 179.988 41.78 13.724 69.825
Sulfonylureas vs. TZD 221.763 170.47 51.29 8.289 94.296
TZD vs. Sulfonylureas 170.763 221.763 -51.29 -94.296 -8.289
95% CI
*All of the above comparisons were statistically significant at alpha <0.05.
Figure 11. Mean baseline weight by OAD categories
*Based on the ANOVA model using the Tukey test, significance differences were found at alpha< 0.05 for the following comparisons: Metformin vs. Sulfonylureas, Metformin vs. TZD
36

Table 15. Association between the baseline weight and the OAD classes-ANOVA model using Tukey test*
Variable- Baseline Weight
Drug categories comparison Mean 1 Mean 2 Difference in Means Lower Upper
Metformin vs. Sulfonylureas 191.45 181.23 10.22 5.467 14.975
Metformin vs.TZD 191.45 181.59 9.86 2.186 17.528
Sulfonylureas vs. Metformin 181.23 191.45 -10.22 -14.975 -5.467
TZD vs. Metformin 181.59 191.45 -9.86 -17.528 -2.186
95% CI
*All of the above comparisons were statistically significant at alpha <0.05.
Figure 12. Mean follow-up weight by OAD categories
*Based on theANOVAmodel using the Tukey test, significance differences were found at alpha< 0.05 for the following comparisons: Metformin vs. Sulfonylure and Metformin vs. Meglitidines.
37

Table 16. Association between the follow-up weight and the OAD classes-ANOVA model using Tukey test*
Variable- Follow up Weight
Drug categories comparison Mean 1 Mean 2 Difference in Means Lower Upper
Metformin vs. Sulfonylureas 185.11 180.38 4.72 0.025 9.421
Metformin vs. Meglitidines 185.11 165.25 19.85 0.618 39.085
Sulfonylureas vs. Metformin 180.38 185.11 -4.72 -9.421 -0.025
Meglitidines vs. Metformin 165.25 185.11 -19.85 -39.085 -0.618
95%CI
*All of the above comparisons were statistically significant at alpha <0.05.
Figure 13. Mean weight change by OAD categories
*Based on the ANOVA model using the Tukey test, significance differences were found atalpha < 0.05 for the following comparisons: Metformin vs. Sulfonylureas, Metformin vs.TZD, Sulfonylureas vs. Meglitidines and TZD vs. Meglitidines.
38

Table 17. Association between the change in weight and the OAD classes-ANOVA model using Tukey test*
Variable- Weight Change
Drug categories comparison Mean 1 Mean 2 Difference in Means Lower Upper
Metformin vs. Sulfonylureas -6.34 -0.84 -5.50 -6.808 -4.195
Metformin vs.TZD -6.34 -1.03 -5.32 -7.4248 -3.2085
Sulfonylureas vs. Metformin -0.84 -6.34 5.50 4.195 6.808
Sulfonylureas vs. Meglitidines -0.84 -7.99 7.15 1.7503 12.5465
TZD vs. Metformin -1.03 -6.34 5.32 3.2085 7.4248
TZD vs. Meglitidines -1.03 -7.99 6.96 1.3176 12.6094
Meglitidines vs. Sulfonylureas -7.99 -0.84 -7.15 -12.5465 -1.7503
Meglitidines vs.TZD -7.99 -1.03 -6.84 -12.5381 -1.1485
95% CI
*All of the above comparisons were statistically significant at alpha <0.05.
Figure 14. Mean baseline Charlson index by OAD categories
*Based on the ANOVA model using the Tukey test, significance differences were found at alpha< 0.05 for the following comparisons: Metformin vs. Sulfonylureas and Sulfonylureas vs.
39

Table 18. Association between the change in weight and the OAD classes-ANOVA model using Tukey test*
Variable- Baseline Diastolic BP
Drug categories comparison Mean 1 Mean 2 Difference in Means Lower Upper
Metformin vs. Sulfonylureas 2.27 2.57 -0.29 -0.411 -0.176
Sulfonylureas vs. Metformin 2.57 2.27 0.29 0.1761 0.411
95% CI
*All of the above comparisons were statistically significant at alpha <0.05.
40

As Type 2 diabetes is a commonly recognized disease in the elderly population,
where literature is implying that approximately 20% of the population over 65 years of
age is afflicted with this illness, the number of Americans with diabetes tripled (from 5.6
million to 16.8 million) in the last decade [28, 29]. People aged 65 years or older account
for approximately 37% of the population with diabetes. Diabetes in elderly adults is
metabolically distinct from diabetes in the younger patient population, and the approach
to therapy needs to be different in this age group[29]. Diabetes is associated with
considerable morbidity, mainly from macro- and microvascular complications,
depression, kidney failure and weight gain. Medical care of patients with Type 2 diabetes
65 years of age and older should be individualized and a key component of
individualizing diabetes care should be the acknowledgment of a patient's perceptions of
the effects of different types of therapy [1]. The ADA 2008 guidelines suggested Type 2
diabetic patients should be given constant access to counseling on increasing physical
activity and finally on weight loss of 5–10% of body weight in overweight/obese
individuals [35].
Astudy by Brixner D. et al. 2007, indicates that BMI and lab values are the key source for
recognition of the cardiovascular metabolic syndrome and therefore risk of later developing
diabetes [30]. Majority of the patients presented in this study at baseline were obese (overall
DISCUSSION
CHAPTER 5

mean BMI at baseline was 29.78 kg/m2) and in the category of hypertension-stage 1 (61.8%
overall for all OAD patients). These facts support the severity of the Type 2 diabetes present
in examined patients. The National Institutes of Health (NIH) model showed that tracking of
BMI over time in diabetic patients can help better control A1C level, therefore the better
Type 2 diabetes disease management, as well as compared with non-BMI control for patients
with the onset of diabetes at 65 years and older [4, 5]. The results of this research indicate the
commonly
association between the BMI and A1C level at baseline; the mean of 31.24kg/m2 BMI was
captured in the metformin group where the percentage of the patients (34%) with A1C 7.0-
8.0 units was the highest.Asimilar trend was observed for the sunfonylureas and TZD group,
with 29.67 kg/m2 BMI and 32% of the sulfonylureas patients, and 29.69 kg/m2 and 29% of
the TZD users.
In the past, treatment options were limited. Compared to the past where the treatment options
were limited, literature has showed, today, numerous treatments are available for use in older
patients with Type 2 diabetes. Still, even with the most suitable drug therapy, various
complications will occurr; one of the most recurring is weight change [31].
Considering the major changes in metabolism as people age and the association of Type 2
diabetes and weight gain, there are newer oral antidiabetic drugs (OADs) designed to purposely
either cause weight loss and/or cause less weight gain, presented as BMI change. Results of this
research reported baseline BMI stratified by the below, normal and above normal weight for the
studied OAD agents. The values for the three major OAD classes showed that majority of the
metformin users, 64.63%, were obese, 11.49% of the TZD users were overweight; however, most
of the sulfonylureas patients, 41.23%, were in the normal weight group. Compared to follow-up
BMI for the same three OAD groups, there was a consistent drop in all of the previously
mentioned categorizes. Still, most of the metformin users, 62.5%, were obese, 11.34% of the
TZD patients were overweight and 33.08% of sulfonylureas users were at normal weight.
42

Based on the differences in available monotherapy OAD treatments and the distribution
of elderly Type 2 diabetes Mellitus (T2DM) patients in the GE EMR database treated with
those OAD drugs, a statistically significant weight loss in studied groups was found. Both
BMI and weight reduction was associated with the meglitinides users (-1.27 BMI units),
followed by the metformin group (-1.06 BMI units) and the sulfonylureas showed the least
BMI drop (-0.14).Although the meglitinides group showed a higher weight loss compared to
with
regard to combination therapy of rosiglitazone with metformin or sulfonylurea. The
literature indicates that rosiglitazone in combination with other OAD agents is a cost
the metformin group, it is important to mention the difference in sample size among these
study cohorts (metformin vs. meglitinides, 1601 vs. 33, respectively). Furthermore, there was
a significant baseline BMI difference between the metformin and meglitinides users, 31.24
and 29.21, respectively. Results by Cohen et al. showed that weight gain does not essentially
accompany treatment of T2DM. The OAD therapy is associated with some weight gain, in
certain drug classes, where it is mostly due to modification of glycemia and improvement of
weight loss prior to the OAD treatment [1]. Significant decrease in levels of triglycerides,
low-density lipoprotein, total cholesterol andA1C were associated with use of metformin and
TZD (rosiglitozone) at baseline. Also, metformin showed significant decrease in body
weight, as effective in normal and an overweight individual as it is in those who are obese;
there are evidence-based data to support metformin use in obese individuals with T2DM [2,
3].. Metformin is particularly appropriate for overweight patients with high fasting blood-
glucose levels [4]. An open randomized 1-year cross-over study compared metformin with
glibenclamide non-insulin-dependent patients. Equivalent effect on glycemic control was
found, but, in contrast to glibenclamide, metformin reduced body weight [5].
The results also showed that TZDs caused a significant weight loss among elderly
patients in the EMR database, which somewhat supports findings from previous studies
43

-effective intervention for the treatment of normal weight, overweight and obese patients
with T2DM when compared with conventional care [6]. Additionally, the study found that
after adjusting for the baseline weight, TZD still showed 1.12lb weight loss, which conflicts
with the current literature findings. A few assumptions have to be addressed regarding the
previously mentioned results compared to presented results: 1) there are no patients' lifestyle
data available though the GE EMR database, or 2) prescription refill data, therefore no
1) Absence of randomization, which deteriorate the results in regard to differences
between the OAD groups; Propensity score matching, or the Heckman method, will prevent
potential selection biases.
2) Proposed analysis was statistically limited; the regression model will strengthen the
results and provide more precise findings.
record of patients' therapy compliance. Importantly, in older adults with T2DM, the TZDs
should be used vigilantly; use in patients with heart failure is absolutely contraindicated.
Contraindicated heart failure is 2.5 times greater in users of TZDs and insulin compared with
insulin users alone. The risk of heart failure is 4.5% in patients taking TZDs compared with
2.6% for non-TZD users [7]. TZDs have a lesser role in treating T2DM in older patients
because of their significant cardiovascular-related concerns, association with increased
fracture risk, and rosiglitazone's potential to cause macular edema [8].
Although studied T2DM patients showed significant weight loss, further research is needed.
The existing database limitations, such as missing values in many clinical variables, data entry
mistakes and lack of over a year of patients' continuous clinical activity, provide uncertainty in the
presented findings. Furthermore, the research had study design limitations:
Limitations
44

In elderly T2DM, treatment aims need to be individualized because of the heterogeneity
of the geriatric population. Persons 65 years of age or older with T2DM are often complex to
manage given the multitude of comorbid conditions. Older adults often have renal and/or
hepatic compromise, thus they respond differently to antihyperglycemic therapies
differently than do their younger equivalents, and depending on comorbid conditions, some
medication classes may be more appropriate than others.
45

INCLUSION AND EXCLUSION – DIAGNOSIS,
PHARMACOTHERAPEUTIC AGENTS
APPENDIX A
Table 19. Diagnoses indicative of diabetes
ICD-9 Code
250.00
250.02
250.10
250.12
250.20
250.22
250.30
250.32
250.40
250.42
250.50
250.52
250.60
250.62
250.70
Description
Diabetes mellitus without mention of complication, type II or unspecified
type, not stared as uncontrolled
Diabetes mellitus without mention of complication, type II or unspecified
type, uncontrolled
Diabetes with ketoacidosis, type II or unspecified type, not stated as
uncontrolled
Diabetes with ketoacidosis, type II or unspecified type, uncontrolled
Diabetes with hyperosmolarity, type II or unspecified type, not stated as
uncontrolled
Diabetes with hyperosmolarity, type II or unspecified type, uncontrolled
Diabetes with other coma, type II or unspecified type, not stated as
uncontrolled
Diabetes with other coma, type II or unspecified type, uncontrolled
Diabetes with renal manifestations, type II or unspecified type, not stated as
uncontrolled
Diabetes with renal manifestations, type II or unspecified type, uncontrolled
Diabetes with ophthalmic manifestations, type II or unspecified type, not
stated as uncontrolled
Diabetes with ophthalmic manifestations, type II or unspecified type,
uncontrolled
Diabetes with neurological manifestations, type II or unspecified type, not
stated as uncontrolled
Diabetes with neurological manifestations, type II or unspecified type,
uncontrolled
Diabetes with peripheral circulatory disorders, type II or unspecified type,
not stated as uncontrolled

Table 19. continued
47
Table 20. Oral antidiabetic drugs for study inclusion
GPI_CATEGORY_2 GPI_CATEGORY_3 GPI_CATEGORY_4
ALPHA-GLUCOSIDASE
INHIBITORS
ALPHA-GLUCOSIDASE
INHIBITORS
ACARBOSE
ALPHA-GLUCOSIDASE
INHIBITORS
ALPHA-GLUCOSIDASE
INHIBITORS
MIGLITOL
MEGLITINIDE ANALOGUES MEGLITINIDE ANALOGUES NATEGLINIDE
BIGUANIDES BIGUANIDES METFORMIN HCL
DIPEPTIDYL PEPTIDASE-4
(DPP-4) INHIBITORS
DIPEPTIDYL PEPTIDASE-4
(DPP-4) INHIBITORS
SITAGLIPTIN PHOSPHATE
INSULIN SENSITIZING
AGENTS
THIAZOLIDINEDIONES PIOGLITAZONE HCL
INSULIN SENSITIZING
AGENTS
THIAZOLIDINEDIONES ROSIGLITAZONE MALEATE
MEGLITINIDE ANALOGUES MEGLITINIDE ANALOGUES REPAGLINIDE
SULFONYLUREAS SULFONYLUREAS ACETOHEXAMIDE
SULFONYLUREAS SULFONYLUREAS CHLORPROPAMIDE
SULFONYLUREAS SULFONYLUREAS GLIMEPIRIDE
SULFONYLUREAS SULFONYLUREAS GLIPIZIDE
SULFONYLUREAS SULFONYLUREAS GLYBURIDE
SULFONYLUREAS SULFONYLUREAS GLYBURIDE MICRONIZED
SULFONYLUREAS SULFONYLUREAS TOLAZAMIDE
SULFONYLUREAS SULFONYLUREAS TOLBUTAMIDE
250.72
250.80
250.82
250.90
250.92
Diabetes with peripheral circulatory disorders, type II or unspecified type,
uncontrolled
Diabetes with other specified manifestations, type II or unspecified type,
uncontrollednot stated as
Diabetes with other specified manifestations, type II or unspecified type,
uncontrolled
Diabetes with unspecified complication, type II or unspecified type, not
uncontrolledstated as
Diabetes with unspecified complication, type II or unspecified type, not
uncontrolled

Table 21. List of exclusion criteria
296.2, 296.3,
296.31, 296.32,
296.33, 296.34,
296.35, 296.36
296.21, 296.22,
296.23, 296.24,
296.25, 296.26
Major depression, single and recurrent episode
244.0, 244.1,
244.2, 244.3.
244.8, 244.9
Hypothyroidism
262 Protein-calorie malnutrition
GPI_CATEGORY_1 Weight loss medication, ‘ADHD/ANTI-NARCOLEPSY/ANTI-
OBESITY/ANOREXIANTS'
42, 79.53 795.71 HIV
140.0-140.9,
141.0-141.9,
142.0-142.0-142.2,
142.8, 142.9, 143,
143.1, 143.8,
143.9, 144, 144.1,
144.8, 144.9,
145.0-145.9,
146.0-146.9,
147.0-147.3,
147.8,
147.9…148.0-
239.8
Cancer
250.X1, 250.X3 Type 1 Diabetes
48

COVARIATE MEDICATIONS
APPENDIX B
Table 22. Covariate drugs
Drug/Therapeutic Class GPI_Code GPILevel
DyslipidemiasAntispyschotics,antiretrovirals, HRT,glucocorticoids
ANTIPSYCHOTICSANTIRETROVIRALSESTROGENSPROGESTINSGLUCOCORTICOSTEROIDS
12112
Hyperglycemia/ Glucose IntoleranceAtypical antipsychotics,glucocorticoids, thyroidhormone, oral contraceptives,nicotinic acid,
BENZISOXAZOLESDIBENZAPINESZIPRASIDONEGLUCOCORTICOSTEROIDSTHYROID HORMONESCOMBINATION CONTRACEPTIVES – ORALNICOTINIC ACID DERIVATIVES
2242222

DIAGNOSIS CODES
APPENDIX C
Table 23. Comorbid cardiovascular diseases
ICD-9 Code Description
Hypertension
401.XX Essential hypertension
402.XX Hypertensive heart disease
404.XX Hypertensive heart and kidney disease
405.X Secondary hypertension
Acute MI
410.XX Acute myocardial infarction
Cardiovascular Disease
411.XX Other acute and subacute forms of ischemic heart disease
414.XX Other forms of chronic ischemic heart disease
428.X Heart failure
429.X Ill-defined descriptions and complications of heart disease
413.X Angina pectoris
440.X Atherosclerosis
Cerebrovascular Disease
437.0 Cerebral atherosclerosis
437.1 Other generalized ischemic cerebrovascular disease
437.2 Hypertensive encephalopathy
437.3 Cerebral aneurysm, nonruptured
430.X Subarachnoid hemorrhage
434.X Occlusion of cerebral arteries
431.X Intracerebral hemorrhage
432.X Other and unspecified intracranial hemorrhage
433.X Occlusion and stenosis of precerebral arteries
434.X Occlusion of cerebral arteries
436.X Acute, but ill-defined, cerebrovascular disease
437.X Other and ill-defined cerebrovascular disease
438.X Late effects of cerebrovascular disease
997.02 Iatrogenic cerbrovascular infarction or hemorrhage
Kidney Disease
403.XX Hypertensive kidney disease
404.XX Hypertensive heart and kidney disease
585.X Chronic kidney disease (CKD)

Charlson Comorbidity Index
The Charlson Comorbidity Index (CCI) encompasses 19 medical conditions (ICD-9)
weighted 1–6. From the weighted conditions, a sum score can be tallied to yield the total
comorbidity score (see Table A.6). To account for increasing age, one point is added to the
CCI score for each decade of life over the age of 50 (1 point for 60s, 2 points for 70s, 3 for
80s.) Thus, possible CCI scores range from 0 to 36.
Table 24. Charlson Comorbidity Index (CCI)
Comorbidity D’Hoore ICD-9 Codes Charlson Weight
Myocardial Infarction 410, 411 1
Congestive Heart Failure 398, 402, 428 1
Peripheral vascular disease 440-447 1
Cerebrovascular disease 430-433, 435 1
Dementia 290, 291, 294 1
Chronic obstructive
pulmonary disease
491-493 1
Rheumatologic disease 710, 714, 725 1
Peptic ulcer disease 531-534 1
Mild liver disease 571, 573 1
Diabetes 250 (excluding 250.4-
250.6)
1
Hemiplegia or paraplegia 342, 434, 436, 437 2
Moderate or severe renal disease 403, 404, 580-586 2
Diabetes + complications 250.4-250.6 2
Malignancy 200, 202, 203 2
Moderate or severe
liver disease
070, 570, 572 3
Metastatic solid tumor 196-199 6
AIDS 042-044 6
51
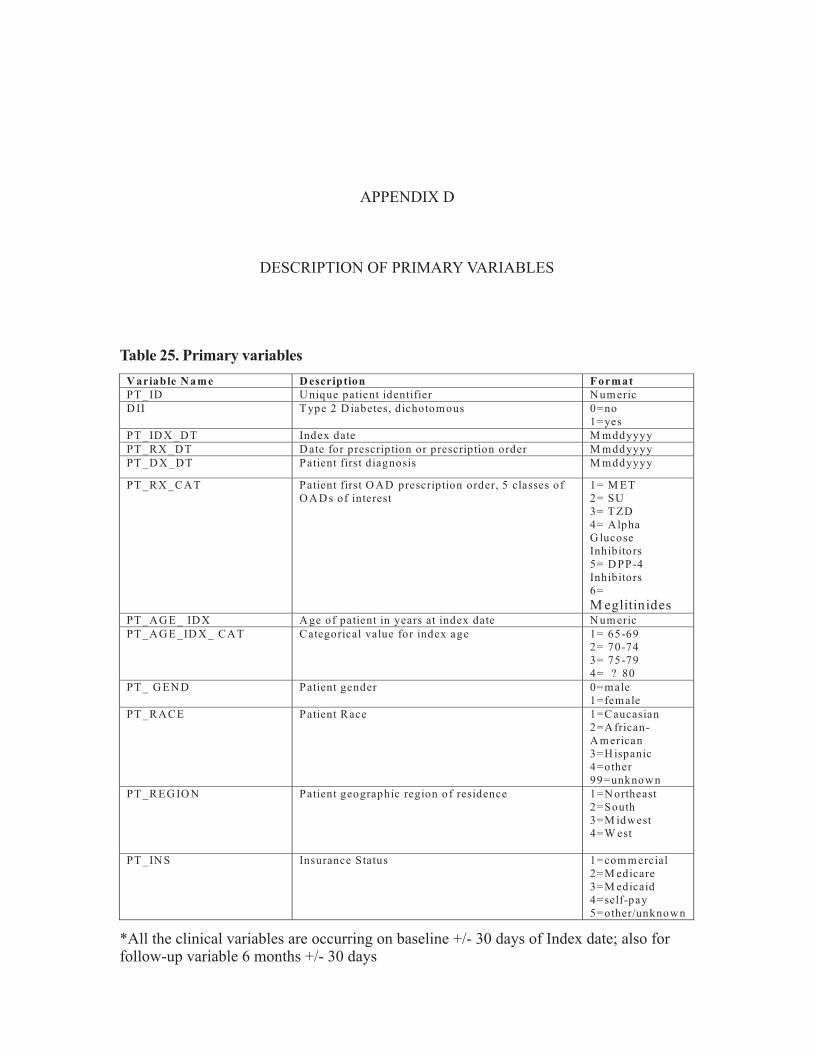
DESCRIPTION OF PRIMARY VARIABLES
APPENDIX D
V ariable N ame D escription Format
PT _ID U nique patient identifier N um eric
D II T ype 2 D iabetes, dichotomous 0=no
1=yes
PT _ID X _DT Index date M mddyyyy
PT _RX _DT D ate for prescription or prescription order M mddyyyy
PT _D X _DT Patient first diagnosis M mddyyyy
PT _RX _CAT Patient first O AD prescription order, 5 classes of
O A D s of interest
1= M ET
2= SU
3= T ZD
4= Alpha
G lucose
Inhibitors
5= D PP-4
Inhibitors
6=
M eglitinidesPT _AG E_ ID X A ge of patient in years at index date N um eric
PT _AG E_ID X _ CAT Categorical value for index age 1= 65-69
2= 70-74
3= 75-79
4= ? 80
PT _ G EN D Patient gender 0=male
1=female
PT _RACE Patient Race 1=Caucasian
2=A frican-
A m erican
3=H ispanic
4=other
99=unknown
PT _REG IO N Patient geographic region of residence 1=N ortheast
2=South
3=M idwest
4=W est
PT _IN S Insurance Status 1=com m ercial
2=M edicare
3=M edicaid
4=self-pay
5=other/unknown
Table 25. Primary variables
*All the clinical variables are occurring on baseline +/- 30 days of Index date; also forfollow-up variable 6 months +/- 30 days

Variable Name Description Format
BMI_BL Baseline BMI, continuous, 30 days +/- of index
date
Numeric (XX)
BMI_BL_CAT Baseline BMI, categorical 1=<18.5
2=18.5-24.9
3=25-29.9
4=30-39.9
5=? 40
BMI_FL Follow up BMI, continuous, 6 months +/- 30 days Numeric (XX)
BMI_FL_CAT Follow up BMI, categorical 1=<18.5
2=18.5-24.9
3=25-29.9
4=30-39.9
5= ? 40
BMI_CHG
Change in BMI from baseline to 6 months follow-
up (null if baseline and follow-up readings not
available.) Numeric (XX)
WT_BL
Baseline weight occurring on index date +/- 30
days Numeric (XX)
WT_ FU Follow-up WT value (180 days ± 30 days) Numeric (XX)
WT_ CHG
Change in WT from baseline to 6 months follow-
up (null if baseline and follow-up readings not
available.) Numeric (XX)
A1C_BL Baseline, A1C value Numeric (XX)
A1C_BL_CAT
Baseline A1C value, categorical 1=<7.0
2=7.0-8.9
3=? 9.0
A1C_CHG
Change in BMI from baseline to 6 months follow-
up (null if baseline and follow-up readings not
available.)
Numeric (XX)
BP_BL_CAT
Baseline mean BP, categorical variable 1= Normal,
<130/80
2= ? 130/80 to
169/99= Stage 1
(Hypertension)
3= Hypertension,
? 170/100= Stage
2 (Hypertension)
SBP_BL Baseline systolic blood pressure, numerical
variable
Numeric (XX)
DBP_BL Baseline diastolic blood pressure, categorical
variable
Numeric (XX)
TG_BL Baseline triglyceride level Numeric (XX)
TG_BL_CAT Baseline triglyceride level, categorical 1=<150 mg/dl
2=? 150 mg/dl
HDL_BL Baseline HDL level Numeric (XX)
HDL_BL_CAT Baseline HDL level, categorical 1=<40 mg/dl
2=? 40 mg/dl
LDL_BL Baseline LDL level Numeric (XX)
LDL _BL_CAT Baseline LDL level, categorical 1=<100 mg/dl
2=? 100 mg/dl
TC_BL Baseline total cholesterol level Numeric (XX)
TC _BL_CAT Baseline total cholesterol level, categorical 1=<240 mg/dl
2=? 240 mg/dl
53
*All the clinical variables are occurring on baseline +/- 30 days of Index date; also forfollow-up variable 6 months +/- 30 days
Table 25. continued

Variable Name Description Format
COVMED_LIPID Dichotomous variable indicating use of a
medication that my cause dyslipidemia on or
before the index date (see Table 3 in Appendix)
0=no drug
1=drug
COVMED_GLUCOSE Dichotomous variable indicating use of a
medication that my cause hyperglycemia on or
before the index date (see Table 3 in Appendix)
0=no drug
1=drug
SMOKE_STAT Smoking status, categorical variable, as currently
as most
1=Current
2=Former
3=Non-smoker
4=Unknown
ALCOH_STAT Alcohol status, dichotomous variable, date (395
days pre Index date)
1= no
2=yes
BL_CCI Baseline Charlson’s comorbidity index, see
Appendix 2; valid values = 0 – 36) based on ICD-
9 codes occurring on or before index date (395
days pre Index date)
Numeric (XX)
COM_HTN Hypertension diagnosis, as Comorbid condition,
(see Appendix 2, table 1), 395 days pre or on
Index date
0=no diagnosis
1=diagnosis
COM_AMI Acute MI diagnosis, as Comorbid condition, (see
Appendix 2, table 1), 395 days pre or on Index
date
0=no diagnosis
1=diagnosis
COM_CVD Cardiovascular disease diagnosis, as Comorbid
condition, (see Appendix 2, table 1), 395 days pre
Index date
0=no diagnosis
1=diagnosis
COM_CRVD Cerebrovascular Disease diagnosis, as Comorbid
condition, (see Appendix 2, table 1), 395 days pre
or on Index date
0=no diagnosis
1=diagnosis
COM_KD Kidney disease diagnosis, as Comorbid condition,
(see Appendix 2, table 1), 395 days pre or on
Index date
0=no diagnosis
1=diagnosis
54
*All the clinical variables are occurring on baseline +/- 30 days of Index date; also forfollow-up variable 6 months +/- 30 days
Table 25. continued

BASELINE CHARACTERISTICS BY DRUG CLASS
-Statistically insignificant variables
APPENDIX E
Figure . Mean baseline HDL by OAD categories15
*Based on the ANOVA model using the Tukey test, significance differences were notfound at alpha < 0.05 between the studied OAD classes.

Figure 16. Mean baseline LDL by OAD categories
*Based on the ANOVA model using the Tukey test, significance differences were notfound at alpha < 0.05 between the studied OAD classes
56

Figure 17. Mean baseline systolic BP by OAD categories
*Based on the ANOVA model using the Tukey test, significance differences werenot found at alpha < 0.05 between the studied OAD classes
57

Figure 18. Mean baseline total cholesterol by OAD categories
*Based on the ANOVA model using the Tukey test, significance differences were notfound at alpha < 0.05 between the studied OAD classes
58

1. The CDC Diabetes Cost-Effectiveness Group: Cost-effectiveness of intensive glycemic
control, intensified hypertension control, and serum cholesterol level reduction, for Type 2
diabetes. Journal of American MedicalAssociation,2002; 287: 2542–2551
2. Cowie CC, Eberhardt MS: Socio demographic characteristics of persons with diabetes, Diabetes
inAmerica. Harris M, Ed. Bethesda, Maryland, National Institutes of Health, 1995: 85–116
3. Nathan DM, Singer DE, Godine JE, Perlmuter LC: Non-insulin-dependent diabetes in
older patients: complications and risk factors. American Journal of Medicine, 1986; 81:
837– 842
4. Kuller LH: Stroke and Diabetes. In Diabetes in America. 2nd ed. Harris M, Ed. Bethesda,
Maryland, National Institutes of Health, 1995, p. 449–456
5. Eastman RC, Javitt JC, Herman WH, Dasbach EJ, Copley-Merriman C, Maier W, Dong F,
Manninen D, Zbrozek AS, Kotsanos J, Garfield SA, Harris M: Model of complications of
NIDDM: II. Analysis of the health benefits and cost-effectiveness of treating NIDDM with
the goal of normoglycemia. Diabetes Care, 1997; 20:735–744
6. Huang ES, Shook M, Jin L, Chin MH, Meltez DO: The impact of patient preferences on
the cost-effectiveness of intensive glucose control in older patients with new-onset diabetes,
Diabetes Care, February 2006; 29(2):259-264
7. American Diabetes A. Diagnosis and Classification of Diabetes Mellitus. Diabetes Care,
January 1, 2006; 29(suppl 1):S43-48
8. Center for Disease Control, National Diabetes Surveillance System.
. AccessedApril 20th, 2009
9. Center for Disease Control, National Diabetes Surveillance System.
AccessedApril 18th, 2009
10. Center for Disease Control, National Diabetes Surveillance System
AccessedApril 15th, 2009
http://www.cdc.gov/diabetes/statistics/index.htm
http://www.diabetes.niddk.nih.gov/dm/pubs/statistics/#people
http://www.diabetes.niddk.nih.gov/dm/pubs/statistics/#costs
REFERENCES

11. Center for Disease Control, National diabetes fact sheet: general information and national
estimates on diabetes in the United States
AccessedApril 17th, 2009
12. Gungor N, Bacha F, Saad R, Janosky J, Arslanian S. Youth type 2diabetes:
Insulin resistanc ;
22. Haas L.,“Management of diabetes mellitus medications in the nursing home”, Drugs
Aging 2005; 22: 209-18.Med 2007; 47: 755-765
23. Hermann LS., “Prospective comparative study in NIDDM patients of metformin and
glibenclamide with special reference to lipid profiles”, Eu J Clin Pharmacol, 1991;41(3):263-265
e, β-cell failure, or both? Diabetes Care, 2005 28(3): 638-644
13. Grundy SM, Benjamin IJ, Burke GL, et al. Diabetes and Cardiovascular Disease: A
Statement for Healthcare Professionals From the American Heart Association, Circulation,
September 7, 1999; 100(10):1134-1146
14. UK Prospective Diabetes Study (UKPDS) Group, Intensive blood-glucose control with
sulphonylureas or insulin compared with conventional treatment and risk of complications
in patients with Type 2 diabetes, Lancet, 1998;352: 837-858
15. Stratton IM, Adler AI, Neil HAW, et al. Association of glycaemia with macrovascular
and microvascular complications of Type 2 diabetes (UKPDS 35): prospective
observational study, BMJ,August 12, 2000;321(7258):405-412
16. Boccuzzi S, Wogen J, Fox J, Sung J, Shah A, Kim J. Utilization of oral hypoglycemic
agents in a drug-insured US population, Diabetes Care, 2001; 24(8):1411-1415
17. Oral Beatriz Luna, Mark Feinglos, Oral Agents in the Management of Type 2 diabetes
Mellitus,American Family Physician, 2001; 63:1747-1756
18. American Diabetes Association, Direct and Indirect costs o Diabetes in United States,
Accessed January 05th, 2009 http://www.diabetes.org/diabetes-statistics/cost-of-diabetes-in-us.jsp
19. Cohen O., “Weight gain in Type 2 diabetes mellitus--not all uphill”, Diabetes Res Clin
Pract. 2008 Jan; 79 (1): 128-132. Epub 2007Aug 27
20. Sahin M., “Effects of metformin or rosiglitazone on serum concentrations of
homocysteine, folate, and vitamin B12 in patients with Type 2 diabetes mellitus”, J Diabetes
Complications, 2007 Mar-Apr;21(2):118-123
21. Ong CR., “Long-term efficacy of metformin therapy in nonobese individuals with Type 2
diabetes”, Diabetes Care, 2006 Nov; 29 (11): 2361-2364
http://www.cdc.gov/diabetes/pubs/pdf/ndfs_2005.pdf
60

24. Shearer AT., “Cost-effectiveness of rosiglitazone oral combination for the treatment of
Type 2 diabetes in Germany”, Pharmacoeconomics 2006; 24 Suppl 1: 35-48
25.Yki-Jarvinen H. “Thiazolidinediones”, N Engl J Med 2004; 351: 1106-1118
26. Nesto RW, Bell D, Bonow RO et al. “Thiazolidinedione use, fluid retention, and
congestive heart failure: a consensus statement from the American Heart Association and
American DiabetesAssociation”, Diabetes Care 2004; 27: 256-263
36. Inzucchi SE, McGuire DK., “New drugs for the treatment of diabetes: part II: Incretin-
based therapy and beyond”, Circulation 2008 Jan 29;117(4):574-584
37. Saaddine JB, Cadwell B, Gregg EW, Engelgau MM, Vinicor F, Imperatore G, Narayan V,
“Improvements in Diabetes Processes of Care and Intermediate Outcomes: United States,
1988–2002”,Annuals of Internal Medicine 2006;144:465-474
27. Neumiller JJ, “Pharmacological Management of Glycemic Control in the Geriatric Patient
with Type 2 diabetes Mellitus”, The Consultants Pharmacist January 2009; 24 (1)
28. , accessed on March 30th, 2009
29.
, accessed on March 30th, 2009
30. Brixner D, “Association between cardiometabolic risk factors and body mass index
based on diagnosis and treatment codes in an electronic medical record database”, J Manag
Care Pharm. 2008 Oct;14(8):756-767
31. Van Dam RM, “Dietary Patterns and Risk for Type 2 diabetes Mellitus in U.S. Men”,Ann
Intern Med. 2002;136:201-209
32. Zimmet P, “Preventing diabetic complications: A primary care perspective”, Diabetes
Research and Clinical Practice, May 2009; 84(2); 107-116
33. Asche CV, “Evaluation of adverse events of oral antihyperglycemic monotherapy
experienced by a geriatric population in a real-world setting: a retrospective cohort
analysis”, DrugsAging, 2008;25(7):611-622
34. Rezende FA, “Body mass index and waist circumference: association with
cardiovascular risk factors”,Arq Bras Cardiol. 2006 Dec; 87(6):728-734
35. American Diabetes Association, “Standards of Medical Care in Diabetes-2008”,
Diabetes Care Jan 2008; 31(suppl 1): S12-S54
http://www.diabetes.org/diabetes-statistics.jsp
http://www.diabetes.org/food-nutrition-lifestyle/lifestyle-prevention/thriving-with-
diabetes/twd-tips-for-really-helping.jsp
61