the impact of oakland’s proposed city minimum wage...
TRANSCRIPT

POLICY BRIEFJune 2014
CWED
The Impact of Oakland’s Proposed City Minimum Wage Law: A Prospective Studyby Michael Reich, Ken Jacobs, Annette Bernhardt and Ian Perry
Michael Reich is Professor of Economics and Director of the UC Berkeley Institute for Research on Labor and Employment; Ken Jacobs is the Chair of the UC Berkeley Center for Labor Research and Education; Annette Bernhardt is a visiting professor of sociology and visiting researcher, Institute for Research on Labor and Em-ployment; Ian Perry is a researcher at the UC Berkeley Center for Labor Research and Education.
Acknowledgments: We thank Sylvia Allegretto, Chris Benner, Cynthia Kroll, William Lester, Zeynep Ton and staff of the California Employment Development Department for their helpful assistance.
Center on Wage and Employment DynamicsInstitute for Research on Labor and Employment
University of California, Berkeley

2 Oakland’s Proposed City Minimum Wage Law
Executive Summary
The Lift Up Oakland Coalition, an alliance of community, labor, small business and faith organizations, has placed an initiative on the Oakland November 2014 ballot that would establish a minimum wage of $12.25 for businesses in the city starting March 1, 2015. This study examines the effects of a $12.25 minimum wage on Oakland workers and businesses.
Drawing on a variety of government data sources, we estimate that more than a quarter of the Oak-land workforce would benefit from the proposed policy, with the average worker earning an additional $2,700 a year. Our analysis of the existing economic research literature suggests that businesses will adjust to modest increases in operating costs through reduced employee turnover costs, improved work performance, and a small, one-time increase in restaurant prices.
Specifically, we find:
• About 25 to 30 percent of Oakland workers or between 40,000 to 48,000 Oakland workers would receive a pay raise.
o Between 31,000 to 34,000 would be directly affected by a minimum wage increase.o Between 9,000 to 14,000 would be indirectly affected by a ripple effect.
• Workers’ hourly wages and annual incomes would rise, resulting in increased annual earnings of $120 million per year.
o Hourly wages of affected workers would rise by an average of $1.69/hour.o Average annual earnings would increase by about $2,700 per year.
• Adults and workers of color would see significant benefits of a pay increase. o 96.5 percent of affected workers are in their twenties or older, and over half of the workers
receiving raises are in their thirties or older. o Workers of color (Black, Hispanic, and Asian) make up about 62.1 percent of the total
workforce in Oakland, but they represent about 78.7 percent of workers affected by a minimum wage increase to $12.25.
o About 43.0 percent of the affected workers are Hispanic/Latino.
• Increasing the minimum wage would have a modest impact on business operating costs and consumer prices.
o Research evidence indicates that the costs of a higher minimum wage are absorbed through reduced worker turnover, improved worker performance and small one-time increases in restaurant prices.
o Operating costs would increase by 0.3 percent for retail businesses and 2.8 percent for restaurants.
o Restaurant prices would increase by 2.5 percent. A $10 meal would increase by 25 cents, to a total of $10.25. For retail and the local economy as a whole, price increases would be negligible.

3 Oakland’s Proposed City Minimum Wage Law
• Previous studies found that minimum wage increases have little negative impact on employment.
o Three rigorous studies of the employment impacts of existing local minimum wage laws all find no significant impact on employment.
o A national study compares employment in all the counties that straddle state borders with different minimum wages, for the period 1990 to 2012. This study finds no statistically significant effects of minimum wage increases on either employment or hours in restaurants and other low-wage industries, controlling for a range of regional and local differences that previous research did not include.
• The proposed 36 percent minimum wage increase in Oakland lies within the range of previous local minimum wage laws.
o The ten previous local minimum wage laws in the U.S. have mandated an average increase of 43.0 percent, with a range of 13.3 percent to 84.5 percent.
o The proposed policy would increase the minimum wage to 54 percent of the Oakland median wage of $22.64 an hour. This ratio is within the historical range of the ratio of the federal minimum wage to the median wage.
Introduction
Residents of Oakland, California will soon be voting whether or not to adopt a city-wide minimum wage policy. The proposal under consideration would establish a minimum wage of $12.25 for busi-nesses operating in the city as of March 1, 2015, indexed to inflation in subsequent years. In this report, we first estimate the number of workers that would be affected and describe their demographic and job characteristics. We then estimate the resulting increase in wages and analyze their likely impacts on business costs, prices and employment. We also compare the magnitude of the proposed increase to those in the ten other extant local minimum wage laws.
Background
Real wages for the majority of American workers have stagnated over the last decade, even as incomes at the top rose sharply (Mishel and Shierholz 2013). According to the California Budget Project, workers in the bottom 20 percent of the income distribution in California now earn 12 percent less in inflation-adjusted wages than in 1979 (California Budget Project 2014). Even though states like California have set minimum wage rates above the federal level, they still remain below their historic value in inflation-adjusted terms and do not reflect the higher cost of living in many urban areas.
In response, cities and counties have begun to set their own minimum wages at levels that reflect lo-cal economic conditions and living costs. Ten cities and counties have approved local minimum wage laws. Most recently Seattle, Washington approved a minimum wage of $15 an hour, to be phased in over several years. In the Bay Area, in 2003 San Francisco became the first city in the nation to pass a citywide minimum wage law. In 2012, San Jose voters approved a minimum wage initiative setting the minimum wage to $10 per hour as of January 1, 2014 with subsequent annual cost of living increases.

4 Oakland’s Proposed City Minimum Wage Law
Proposals are also currently under consideration to increase the minimum wage to $12.53 in Berkeley, $13 in Richmond and $15 in San Francisco. California’s minimum wage is set to increase to $9 on July 1, 2014 and to $10 on January 1, 2016.
Oakland, the largest city in Alameda County, accounts for about one-fourth of the county’s population. Its principal immediate neighbors are Emeryville and Berkeley to the north, the East Bay Regional Park District to the east, San Leandro to the south and Alameda to the west. About 45 percent of employed Oakland residents work in Oakland; conversely, about 60 percent of workers with jobs located in Oak-land commute in from nearby cities.1 The proposed minimum wage law would cover everyone who works in Oakland (excepting state and federal government employees and the self-employed).
Oakland’s economic situation has improved in recent years. During the Great Recession that began in December 2007, employment did not fall as rapidly in Oakland as in Alameda County or in California. As shown in Figure 1, the number of jobs in Oakland is very close to pre-recession levels, a better record than that of Alameda County and California as a whole. Moreover, while the 2014 Oakland unemploy-ment rate remains higher (8.9 percent) than in Alameda County as a whole (5.7 percent), both rates have been falling, and at about the same pace.2
Figure 1. Quarterly Employment Growth (Indexed to 2007)
Source: U.S. Census Bureau, Quarterly Workforce Indicators Data (not seasonally adjusted)

5 Oakland’s Proposed City Minimum Wage Law
Figure 2. Median Annual Earnings by Place of Work (2012 Dollars)
Source: U.S. Census Bureau, American Community Survey, 2005-2012.Notes: Estimates are three-year averages.
Despite the recovery, inflation-adjusted median annual earnings for those who work in Oakland are still below pre-recession levels. These declines in median earnings likely reflect a faster contraction of middle wage jobs during the recession and a faster growth of low-wage jobs during the recovery. However, workers in Alameda County as a whole experienced a somewhat larger decline in real earnings than did Oakland Workers (Figure 2). Median inflation adjusted annual earnings fell 8.4 percent for workers in Oakland and 10.4 percent in Alameda County between 2007 and 2012. Nonetheless, median annual earnings for those who work in Oakland are actually higher than in nearby Berkeley, Hayward and San Leandro and slightly higher than in Alameda County as a whole.3
Oakland’s economy thus exhibits the same uneven recovery that characterizes the East Bay and the state as a whole. Income inequality in the region has been growing, leaving low-wage workers further be-hind. According to a recent Brookings Institution report, inequality in Oakland ranks seventh among U.S cities, just behind New York (Berube 2014). Moreover, according to the Census Bureau, income inequality in Oakland-- as measured by the city’s Gini coefficient-- has risen by 2.65 percent since 2008, a more rapid increase than in neighboring San Francisco, and more rapid than in the U.S.4 At the same time, median rents in Oakland increased by 20 percent between 2005 and 20125, twice the rate of in-crease in median household incomes.6

6 Oakland’s Proposed City Minimum Wage Law
Impacts on Workers
Estimated Number of Affected Workers
To estimate the number of workers affected by the proposed minimum wage increase, we obtain the wage distribution of workers in Alameda County using the 2012 American Community Survey (ACS), scaled to approximate employment counts for Oakland.7 This step is necessary because the ACS does not allow us to identify individuals who work in Oakland; the smallest geographic area for measuring place of work is the county. We therefore assume that the proportion and characteristics of low-wage workers in Alameda County are similar to low-wage workers in Oakland. Our analysis suggests that the Alameda County workforce serves as a good proxy for the Oakland workforce on many dimensions. For example, 2012 median annual earnings were $43,480 for workers employed in Oakland and $41,922 for workers employed in Alameda County.8 Where we expect workforce characteristics to differ between the county and the city, we use additional methods to provide an estimate. We do not include self-em-ployed workers or federal or state government employees in our sample, since these groups of workers are not covered by the proposed Oakland law. After obtaining the wage distribution in Oakland just before the proposed minimum wage law would go into effect, we then estimate the number of workers that would be affected by the increase and the additional wages they would receive if the policy were implemented. To construct these estimates, we also adjust for projected wage growth at the bottom of the wage distribution that would occur without the policy, the interim increase in the state minimum wage to $9 on July 1, 2014, the subsequent state minimum wage increase to $10 on January 1, 2016, and projected employment growth. We produce a low and a high estimate. Both estimates include a directly affected group (workers who make less than the proposed minimum wage) and an indirectly affected group (workers who make slightly more than the proposed minimum wage, but who are also likely to receive a small raise via what is known as the “ripple effect”). The two estimates differ in their assumptions about the size of the ripple effect and the number of very low-wage earners (workers making less than the minimum wage). More information on our methodology is available in an online technical appendix (see Welch-Love-man, Perry and Bernhardt 2014). In this report we present the midpoint of the two estimates, unless otherwise noted.
Table 1 shows the estimated number and percent of workers affected by Oakland’s proposed minimum wage increase. We estimate that between 25 and 30 percent of Oakland workers will receive pay raises, which translates into 40,000 to 48,000 Oakland workers. The majority of the affected workers will be directly affected workers – that is, those earning less than $12.25 when the law would go into effect.

7 Oakland’s Proposed City Minimum Wage Law
Table 1. Number of Workers Affected by Oakland’s Proposed Minimum Wage Increase
Low Estimate High Estimate
Workers Percent of Workforce Workers Percent of Workforce
All Affected Workers 40,000 24.8 48,000 29.5
Directly Affected Workers 31,000 19.1 34,000 20.7
Indirectly Affected Workers 9,000 5.7 14,000 8.7
Source: Authors’ analysis of ACS, OES, and QCEW data. See Welsh-Loveman, Perry and Bernhardt 2014.
Estimated Size of Wage Increases
In addition to the number of workers affected, we also estimate the additional earnings that affected workers would receive as a result of the proposed minimum wage law. Table 2 presents four measures: the average increase in hourly wages, the average increase in annual earnings, the average percentage in-crease in annual earnings and the total projected increase in earnings. We estimate that hourly wages of affected workers will rise by about $1.69, that their annual earnings will increase by about $2,700, and that their earnings will increase by about 18.7 percent.9 In total, workers will earn about $120 million more in the first year of implementation as a result of the higher wage rate.
Table 2. Pay Increases for Workers Affected by Oakland’s Proposed Minimum Wage Law
Total Increase In Earnings $120,100,000
Average Hourly Wage Increase $1.69
Average Annual Earnings Increase $2,700
Average Percent Annual Earnings Increase 18.7
Source: Authors’ analysis of ACS, OES, and QCEW data. See Welsh-Loveman, Perry and Bernhardt 2014.Notes: Results refer to workers affected by Oakland’s proposed minimum wage increase.
Demographics of Affected Workers
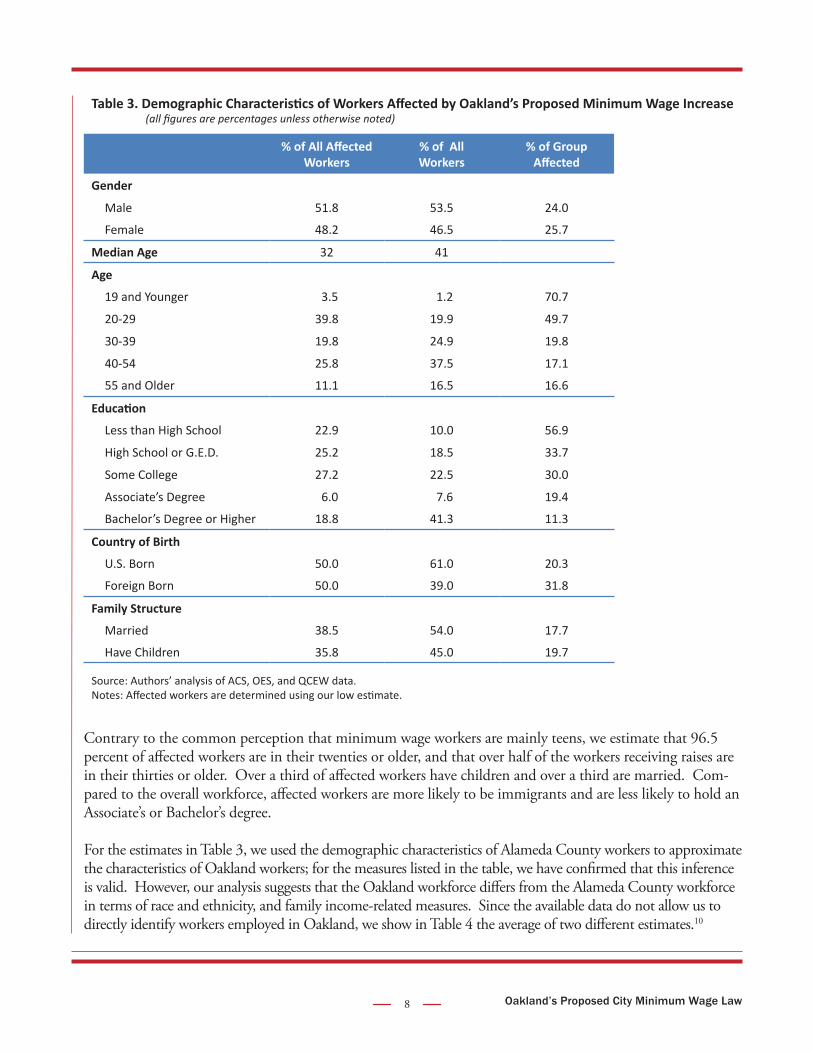
Table 3 profiles key demographic characteristics of the workers affected (both directly and indirectly through the ripple effect) by the proposed Oakland minimum wage law. In this table we use our low estimate to identify affected workers.
The first column of Table 3 displays the distribution of affected workers among demographic groups. For example, 48.2 percent of affected workers are women and 51.8 are men. Column 2 shows the same breakdown for all workers in Oakland. The last column shows the percentage of workers in each demo-graphic group that will be affected by the proposed law. For example, 25.7 percent of female workers and 24.0 percent of male workers will receive a wage increase under the proposed law.
8 Oakland’s Proposed City Minimum Wage Law
Table 3. Demographic Characteristics of Workers Affected by Oakland’s Proposed Minimum Wage Increase (all figures are percentages unless otherwise noted)
% of All Affected Workers
% of All Workers
% of Group Affected
Gender
Male 51.8 53.5 24.0
Female 48.2 46.5 25.7
Median Age 32 41
Age
19 and Younger 3.5 1.2 70.7
20-29 39.8 19.9 49.7
30-39 19.8 24.9 19.8
40-54 25.8 37.5 17.1
55 and Older 11.1 16.5 16.6
Education
Less than High School 22.9 10.0 56.9
High School or G.E.D. 25.2 18.5 33.7
Some College 27.2 22.5 30.0
Associate’s Degree 6.0 7.6 19.4
Bachelor’s Degree or Higher 18.8 41.3 11.3
Country of Birth
U.S. Born 50.0 61.0 20.3
Foreign Born 50.0 39.0 31.8
Family Structure
Married 38.5 54.0 17.7
Have Children 35.8 45.0 19.7
Source: Authors’ analysis of ACS, OES, and QCEW data.Notes: Affected workers are determined using our low estimate.
Contrary to the common perception that minimum wage workers are mainly teens, we estimate that 96.5 percent of affected workers are in their twenties or older, and that over half of the workers receiving raises are in their thirties or older. Over a third of affected workers have children and over a third are married. Com-pared to the overall workforce, affected workers are more likely to be immigrants and are less likely to hold an Associate’s or Bachelor’s degree.
For the estimates in Table 3, we used the demographic characteristics of Alameda County workers to approximate the characteristics of Oakland workers; for the measures listed in the table, we have confirmed that this inference is valid. However, our analysis suggests that the Oakland workforce differs from the Alameda County workforce in terms of race and ethnicity, and family income-related measures. Since the available data do not allow us to directly identify workers employed in Oakland, we show in Table 4 the average of two different estimates.10

9 Oakland’s Proposed City Minimum Wage Law
As shown in Table 4, workers of color will disproportionately benefit from the proposed law compared to white workers. The families of affected workers are disproportionately low-income (with more than half falling below 200 percent of the federal poverty level), and more likely to be receiving food stamps. Substantial majorities of working poor families will receive an increase in income from the proposed law.
Table 4. Estimated Race and Household Income Characteristics of Workers Affected by Oakland’s Proposed Minimum Wage Increase (all figures are percentages unless otherwise noted)
% of All Workers Getting a Raise % of All Workers % of Group
Getting a Raise
Race/EthnicityWhite (Non-Hispanic) 18.2 34.1 15.3Black (Non-Hispanic) 13.6 13.8 29.2Hispanic 43.0 25.3 49.9Asian (Non-Hispanic) 22.1 23.0 28.6Other 3.2 3.8 24.2
Household Income Relative to Poverty Level (FPL)
Less than 100% of FPL 18.7 6.8 81.5100% to 150% of FPL 21.6 9.0 71.8150% to 200% of FPL 15.2 7.4 60.6More than 200% of FPL 44.4 76.7 16.9
Average Worker Share of Household Income 41.3 55.4
Food Stamp AssistanceFamily Receives Food Stamp Assistance 19.2 8.7 64.9
Source: Authors’ analysis of ACS, OES, and QCEW data.Notes: See text for explanation of the two estimation methods. Affected workers are determined using our low estimate.
Job Characteristics of Affected Workers
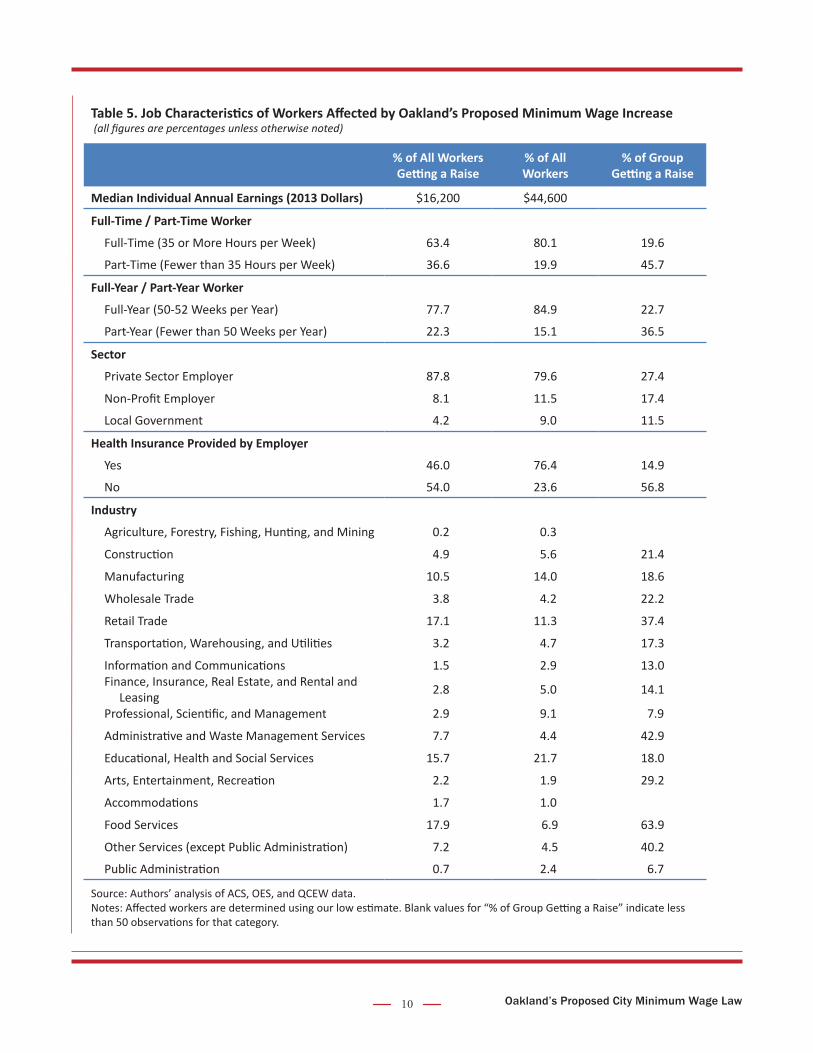
In Table 5, we profile the job characteristics of workers affected by the proposed minimum wage law. Not surprisingly, the median annual earnings of affected workers is quite low, less than half of the me-dian for the workforce as a whole. Affected workers are also more likely to work part-time and part-year than the general workforce, and are less likely to have health insurance provided by their employer. The industry breakdown is also instructive. Fully half of all affected workers are employed in three indus-tries: retail trade (17.1 percent); restaurants (17.9 percent); and education, health and social services industries (15.7 percent). (The latter set of industries includes teachers’ assistants, medical assistants, childcare workers and private-pay home health aides). Several smaller industries also have a dispro-portionate number of affected workers, such as administrative and waste management services (largely temporary workers).
10 Oakland’s Proposed City Minimum Wage Law
Table 5. Job Characteristics of Workers Affected by Oakland’s Proposed Minimum Wage Increase (all figures are percentages unless otherwise noted)
% of All Workers Getting a Raise
% of All Workers
% of Group Getting a Raise
Median Individual Annual Earnings (2013 Dollars) $16,200 $44,600
Full-Time / Part-Time Worker
Full-Time (35 or More Hours per Week) 63.4 80.1 19.6
Part-Time (Fewer than 35 Hours per Week) 36.6 19.9 45.7
Full-Year / Part-Year Worker
Full-Year (50-52 Weeks per Year) 77.7 84.9 22.7
Part-Year (Fewer than 50 Weeks per Year) 22.3 15.1 36.5
Sector
Private Sector Employer 87.8 79.6 27.4
Non-Profit Employer 8.1 11.5 17.4
Local Government 4.2 9.0 11.5
Health Insurance Provided by Employer
Yes 46.0 76.4 14.9
No 54.0 23.6 56.8
Industry
Agriculture, Forestry, Fishing, Hunting, and Mining 0.2 0.3
Construction 4.9 5.6 21.4
Manufacturing 10.5 14.0 18.6
Wholesale Trade 3.8 4.2 22.2
Retail Trade 17.1 11.3 37.4
Transportation, Warehousing, and Utilities 3.2 4.7 17.3
Information and Communications 1.5 2.9 13.0Finance, Insurance, Real Estate, and Rental and Leasing 2.8 5.0 14.1
Professional, Scientific, and Management 2.9 9.1 7.9
Administrative and Waste Management Services 7.7 4.4 42.9
Educational, Health and Social Services 15.7 21.7 18.0
Arts, Entertainment, Recreation 2.2 1.9 29.2
Accommodations 1.7 1.0
Food Services 17.9 6.9 63.9
Other Services (except Public Administration) 7.2 4.5 40.2
Public Administration 0.7 2.4 6.7
Source: Authors’ analysis of ACS, OES, and QCEW data.Notes: Affected workers are determined using our low estimate. Blank values for “% of Group Getting a Raise” indicate less than 50 observations for that category.

11 Oakland’s Proposed City Minimum Wage Law
Impacts on Businesses
Impact on Costs for Business Owners
We next estimate the impact of Oakland’s proposed minimum wage law on the operating costs of busi-nesses. Our strategy is to compare the estimated increase in the overall wage bill resulting from the proposed law to the existing wage bill paid by employers, drawing on our estimates in Table 1 and Table 2 above.
Table 6 shows our analysis of the estimated increase in business operating costs in two traditionally low-wage industries, retail and restaurants. Businesses’ total wage bill will increase 2.4 percent for the retail industry, and 8.9 percent in the restaurant industry. However, operating costs will rise by a much smaller amount, since wage costs only make up a portion of the total operating costs that businesses face. Labor costs (excluding health benefits) account for 11 percent of retail operating costs and 31 per-cent of restaurant operating costs.11 We therefore estimate that total operating costs will increase by 0.3 percent for retail and 2.8 percent for restaurants, as a result of the proposed minimum wage law.
Table 6. Impact of Oakland's Proposed Minimum Wage Increase On Business Operating Costs
Retail Industries% Change in Payroll Costs 2.4
Labor Costs as % of Operating Costs* 11
% Change in Operating Costs 0.3
Restaurant Industries% Change in Payroll Costs 8.9
Labor Costs as % of Operating Costs* 31
% Change in Operating Costs 2.8
Source: Authors' analysis of ACS, OES, QCEW, U.S. Census Monthly and Annual Retail Trade and BEA data.*Labor costs exclude health insurance. Operating costs include costs of merchandise purchased for re-sale.
Given these modest estimated increases in operating costs, we turn next to a discussion of how busi-nesses might adjust. We discuss, in turn, the effects of minimum wages on employment and hours, on worker productivity and turnover, and on consumer prices. Impact on Employment and Hours
In a recent report prepared for the City of Seattle, Reich, Jacobs and Bernhardt (2014) provide an ex-tensive review and synthesis of economic research on the employment and hours impacts of minimum wage increases. Here, we draw on that paper and provide a brief summary of what we consider to be the most compelling studies.
Research evidence from local minimum wage laws

12 Oakland’s Proposed City Minimum Wage Law
There are three rigorous studies of the employment impacts of existing local minimum wage laws. Dube, Naidu and Reich (2007) studied the impact of San Francisco’s minimum wage law after it in-creased from $6.75 to $8.50 an hour in 2004. They surveyed a sample of restaurants before and after the wage increase. The sample included restaurants from San Francisco as well as neighboring East Bay cities that were not covered by the policy.
The authors found no statistically significant negative effects on either employment or the proportion of full-time jobs as a result of the San Francisco law. This finding holds for both full-service and fast-food restaurants (one might expect more sensitivity to a higher minimum wage in the latter). Figure 3 shows the results from their follow-up study (Reich, Jacobs, and Dietz 2014). Restaurant employment in San Francisco rose slightly faster than in surrounding counties after the minimum wage increase, and again after San Francisco implemented two additional policies (paid sick leave and a health spending requirement).
Figure 3. Bay Area Restaurant Employment
Source: Reich, Jacobs and Dietz (2014) Notes: Shaded areas indicate recessions. Surrounding counties include San Mateo, Santa Clara, and Alameda Counties.
0
10,000
20,000
30,000
40,000
50,000
60,000
2001 2002 2003 2004 2005 2006 2007 2008 2009 2010 2011
Minimum wage Paid sick
leave Health spending requirement
San Francisco
Surrounding counties (weighted average)
Potter (2006) studied the impact of Santa Fe’s minimum wage law after it increased from $5.15 to $8.50 in 2004, a substantial increase of 65 percent. Potter compares changes in employment at Santa Fe businesses before and after the ordinance went into effect, and to changes in employment in nearby Albuquerque over the same time period. (Albuquerque did not have a city minimum wage law at that time.) Potter found no statistically significant negative impact of Santa Fe’s minimum wage increase on the city’s employment. This finding also held for accommodation and food services, the industries with the highest proportion of minimum wage workers.

13 Oakland’s Proposed City Minimum Wage Law
Finally, Schmitt and Rosnick (2011) studied the impact of the above two laws, comparing employment trends in these cities before and after their minimum wage increases to control groups of surrounding suburbs and nearby metropolitan areas. The authors focused on fast-food restaurants, food services, retail trade, and other low-wage industries, and found no discernible negative effects on employment, even three years after the respective ordinances were implemented.12
Evidence from state and federal minimum wage laws
The results from studies of local minimum wage laws are corroborated by extensive research on state and federal minimum wage laws. Allegretto, Dube, Reich and Zipperer (2013) looked at every state and federal minimum wage increase in the U.S. between 1990 and 2012 and identified several hundred pairs of adjacent counties that were located on different sides of a state border with a minimum wage difference. This research design compares the employment trends of the most affected groups – teens and restaurants – across adjacent counties with different minimum wage levels. This study finds no statistically significant effects of minimum wage increases on either employment or hours in restaurants and other low-wage industries, controlling for a range of regional and local differences that previous research did not include.
Belman and Wolfson (2014) provide the most extensive recent summary of the minimum wage research literature. They conclude that minimum wage employment effects in the U. S. are “both vanishingly small and not statistically significant in even the most generous test” (p. 168). A separate review of minimum wage research by Schmitt (2013) similarly finds “the minimum wage has little or no discern-ible effect on the employment prospects of low-wage workers.”
In summary, the best research studies find that minimum wage mandates (in the range implemented to date) do not have a statistically significant negative effect on employment or hours. How, then, do firms adjust to the modest increase in operating costs estimated above?
Effects on Worker Productivity and Recruitment and Retention Costs
As discussed in detail by Reich, Jacobs and Bernhardt (2014), businesses can adjust to the increased costs of a minimum wage increase without reducing employment. First, when workers are paid more, their productivity can improve, as can their attitude about their job, how hard they work, and their ability to make it to work on time (Reich, Jacobs and Dietz 2014 and Hirsch, Kaufman and Zelenska 2011). Sec-ond, minimum wages can reduce the high levels of job churning that characterize low-wage labor markets. The National Restaurant Association estimates that annual employee turnover in restaurants approaches 75 percent in some restaurant classifications (National Restaurant Association 2010). Turnover levels are high as workers leave jobs that pay higher wages or because they are unable to stay in their jobs due to poverty-related problems such as difficulties with transportation, child care, or health. Dube, Lester and Reich (2013) found that a 10 percent increase in the minimum wage results in a 2.1 percent reduction in turn-over for restaurant workers. Turnover can be quite costly to firms, even for low-wage workers. Boushey and Glynn (2012) find that the median cost of replacement for a job paying $30,000 a year or less is 16.1 percent of an employee’s annual earnings. As a result, rather than eliminating jobs, raising the minimum wages can reduce turnover and increase job stability. The associated reduction in employers’ recruitment and retention costs offsets about 20 to 25 percent of the costs of minimum wage increases (Dube, Lester and Reich 2013).

14 Oakland’s Proposed City Minimum Wage Law
Impact on Restaurant Prices
Firms also adjust to increased costs by passing on some of the increases to consumers through higher prices. Since the minimum wage applies to all employers, firms such as restaurants that serve the local market will be able to pass costs through to consumers without experiencing a competitive disadvan-tage. And since the demand for restaurant meals responds inelastically to price increases, restaurant profits do not fall.
Research by Aaronson, French and MacDonald (2008) has found that for every percentage point in-crease in the minimum wage, restaurant prices rise by 0.072 percent. An earlier study (Lee et al. 2000) showed that restaurant operating costs increase by about 0.1 percent for each percentage increase in the minimum wage (see also Benner and Jayaraman 2012). The two studies together thus suggest that 70 to 75 percent of cost increases are passed on as higher restaurant prices. Preliminary results from a study of San Jose’s recent experience arrive at a similar estimate (Allegretto and Reich 2014). Applying this estimate to restaurants in Oakland implies an average price increase of 2.6 percent, which is very close to annual restaurant price increases in recent years.
Table 7. Impact of Oakland's Proposed Minimum Wage Increase On Restaurant Prices
Low Estimate High Estimate
Retail Industries 0.2% 0.3%
Restaurant Industries 2.0% 2.9%
Source: Authors' analysis of ACS, OES, QCEW, U.S. Census Monthly and Annual Retail Trade and BEA data.
In Table 7 we provide our own estimates of the impact on restaurant and retail prices. Our low estimate uses the lower estimated increase in operating costs from Table 6, and assumes that 75 percent of those costs are passed through to consumers. Our high estimate uses the higher estimate for increases in oper-ating costs and assumes that 100 percent of the costs are passed through to consumers. For restaurants, we predict a one-time increase in prices of 2.0 to 2.9 percent. The midpoint of this range, 2.5 percent, is very similar to the prediction from the research literature above. The price of a $10 menu item would thus increase very modestly, to $10.25. For retail and the local economy as a whole, price increases would be negligible. Comparison to Other Minimum Wage Increases
It is important to emphasize that the economic research summarized above is necessarily limited to studying the minimum wage laws that have been implemented to date. It is therefore useful to ask how the Oakland’s proposed minimum wage increase compares to those that have been implemented in the past.
The proposed ordinance would increase Oakland’s minimum wage by 36.1 percent at the time of pro-posed implementation (in March 1, 2015, the state minimum wage will be $9 an hour, rising to $10 on January 1, 2016). While high, the size of the proposed increase is well within the range of other local minimum wage laws. The ten previous local minimum wage laws in the U.S. have mandated an average

15 Oakland’s Proposed City Minimum Wage Law
increase of 43.0 percent in their minimum wage, with a range of 13.3 to 84.5 percent (this calculation includes Seattle’s new law). A number of these laws were phased in over time, with the first year’s in-crease typically the largest. Across all existing laws, first-year increases ranged from 6.7 to 65.0 percent, with an average of 25.6 percent. Again, Oakland’s proposed increase falls within the range of other cities’ laws.
While the proposed wage standard for Oakland is higher than is currently in effect in other Bay Area cities, Richmond, Berkeley and San Francisco are all considering wage increases that would be close to, or in the case of San Francisco, higher than, the $12.25 an hour under consideration in Oakland.
Another measure used by economists to determine the ability of the economy to absorb higher mini-mum wage levels is the ratio of the minimum wage to the median wage. The proposed wage of $12.25 is 54 percent of the median wage in Oakland of $22.64 an hour. This ratio is within the historical range of the federal minimum wage-median ratio, which reached 55 percent in 1968 (Dube 2013), and it is lower than the 59 percent ratio in the new Seattle law.
Conclusion
Drawing on a variety of government data sources, we estimate that 40,000 to 48,000 workers would benefit from Oakland’s proposed minimum wage policy, with the average worker earning an additional $2,700 a year. Our analysis of the existing economic research literature suggests that businesses will adjust to modest increases in operating costs through reduced employee turnover costs, improved work performance, and a small, one-time increase in restaurant prices.

16 Oakland’s Proposed City Minimum Wage Law
References
Aaronson, Daniel, Eric French and James MacDonald. 2008. “The Minimum Wage, Restaurant Prices, and Labor Market Structure.” Journal of Human Resources 43(3): 688-720.
Allegretto, Sylvia, Arindrajit Dube, Michael Reich and Ben Zipperer. 2013. “Credible Research Designs for Minimum Wage Studies.” Working Paper No. 148-13. Institute for Research on Labor and Employment, UC Berkeley. Available at: http://www.irle.berkeley.edu/workingpapers/148-13.pdf.
Allegretto, Sylvia and Michael Reich. 2014. “Minimum Wage Effects on Prices: Preliminary Results.” Paper presented at the Portland meetings of the Labor and Employment Research Association.
Belman, Dale and Paul Wolfson. 2014. What Does the Minimum Wage Do? Kalamazoo, MI: W.E. Upjohn Institute for Employment Research.
Benner, Chris and Saru Jayaraman. 2012. “A Dime a Day: the Impact of the Harkin/Miller Proposal on the Price of Food.” University of California Berkeley Food Labor Research Center, Food Chain Workers Alliance and Restaurant Opportunities Center. Available at: http://laborcenter.berkeley.edu/foodlabor/price_food12.pdf.
Berube, Alan. 2014. “All Cities Are Not Create Equal,” Brookings Institution, Appendix. Available at: http://www.brookings.edu/~/media/research/files/papers/2014/02/city%20inequality/appendix.pdf
Boushey, Heather and Sarah Glynn. 2012. “There are Significant Business Costs to Replacement Employees.” Center for American Progress. Available at: http://www.americanprogress.org/wp-content/uploads/2012/11/CostofTurnover.pdf.
California Budget Project. 2014. “Where Is the Wage Growth? Wage Stagnation in California’s Economy,” May 8, 2014. Available at: http://www.cbp.org/pdfs/2014/140508_Wage_Stagnation_EB.pdf.
Dube, Arindrajit. 2013. “Statement by Arindrajit Dube before the U.S. Senate Committee on Health, Education, Labor & Pensions,” March 14, 2013. Available at: http://www.help.senate.gov/imo/media/doc/Dube1.pdf
Dube, Arindrajit, William Lester and Michael Reich. 2013. “Minimum Wage Shocks, Employment Flows and Labor Market Frictions.” Working Paper No. 149-13. Institute for Research on Labor and Employment, UC Berkeley. Available at: http://www.irle.berkeley.edu/workingpapers/149-13.pdf.
Dube, Arindrajit, Suresh Naidu and Michael Reich. 2007. “The Economic Effects of a Citywide Minimum Wage.” Industrial and Labor Relations Review 60, 4: 522-543.
Dube, Arindrajit, Suresh Naidu and Michael Reich. 2014. “Labor Market Impacts of San Francisco’s Minimum Wage.” In Michael Reich, Ken Jacobs and Miranda Dietz (eds.) When Mandates Work: Raising Labor Standards at the Local Level, pp. 47-69. Berkeley, CA: University of California Press.

17 Oakland’s Proposed City Minimum Wage Law
Hirsch, Barry T., Bruce Kaufman, and Tetyana Zelenska. 2011. “Minimum Wage Channels of Adjustment.” IZA Discussion Paper No. 6132. Institute for the Study of Labor. Available at: http://www2.gsu.edu/~ecobth/IZA_HKZ_MinWageCoA_dp6132.pdf.
Lee, Chinkook, Gerald Schluter and Brian O’Roark 2000. “Minimum wage and food prices: an analysis of price pass-through effects.” International Food and Agribusiness Management Review 3: 111–128.
Mishel, Lawrence and Heidi Shierholz. 2013. “A Decade of Flat Wages.” Briefing Paper No. 365. Economic Policy Institute, Washington, D.C.
National Restaurant Association and Deloitte & Touche LLP. 2010. “Restaurant Industry Operations Report 2010 Edition.”
Potter, Nicholas. 2006. “Measuring the Employment Impacts of the Living Wage Ordinance Santa Fe, New Mexico.” University of New Mexico, Bureau of Business and Economic Research. Available at: https://bber.unm.edu/pubs/EmploymentLivingWageAnalysis.pdf
Reich, Michael, Ken Jacobs and Annette Bernhardt. 2014. “Local Minimum Wage Laws: Impacts of Workers, Families, and Businesses.” Working Paper No. 104-14. Institute for Research on Labor and Employment, UC Berkeley.
Reich, Michael, Ken Jacobs and Miranda Dietz (eds.) 2014. When Mandates Work: Raising Labor Standards at the Local Level. Berkeley, CA: University of California Press.
Schmitt, John. 2013. “Why is There No Discernable Employment Effect of the Minimum Wage.” Washington, DC: Center for Economic and Policy Research. Available at: http://www.cepr.net/documents/publications/min-wage-2013-02.pdf
Schmitt, John and David Rosnick. 2011. “The Wage and Employment Impact of Minimum-Wage Laws in Three Cities.” Center for Economic and Policy Research. Available at: http://www.cepr.net/documents/publications/min-wage-2011-03.pdf
Welsh-Loveman, Jeremy, Ian Perry and Annette Bernhardt. 2014. “Data and Methods for Estimating the Impact of Proposed Local Minimum Wage Laws.” Institute for Research on Labor and Employment, UC Berkeley. Available at: http://www.irle.berkeley.edu/cwed/briefs/2014-01-data-and-methods.pdf
Yelowitz, Aaron. 2005a. “Santa Fe’s Living Wage Ordinance and the Labor Market.” Employment Policies Institute. Available at: http://www.epionline.org/studies/yelowitz_09-2005.pdf
Yelowitz, Aaron. 2005b. “How Did the $8.50 Citywide Minimum Wage Affect the Santa Fe Labor Market?” Employment Policies Institute. Available at: http://www.epionline.org/studies/yelowitz_12-2005.pdf
Yelowitz, Aaron. 2012. “The Labor Market Effects of Citywide Compensation Floors.” Employment Policies Institute. Available at: http://www.epionline.org/studies/yelowitz_12-2005.pdf
18 Oakland’s Proposed City Minimum Wage Law
Endnotes1 Bay Area Census analysis of 2006-2010 American Community Survey Commute Flows. http://www.bayareacensus.ca.gov/transportation.htm2 Bureau of Labor Statistics Local Area Unemployment Statistics.3 U.S. Census Bureau; American Community Survey, 2005-2012 American Community Survey 3-Year Estimates, Table B08521; <http://factfinder2.census.gov>; accessed 6 June 2014.4 U.S. Census Bureau; American Community Survey, 2008 and 2012 American Community Survey 1-Year Estimates, Table B19083; <http://factfinder2.census.gov>; accessed 5 June 2014.5 Based on annual data. U.S. Census Bureau; American Community Survey, 2005-2012 American Community Survey 1-Year Estimates, Table B25064; <http://factfinder2.census.gov>; accessed 3 June 2014.6 Based on annual data. U.S. Census Bureau; American Community Survey, 2005-2012 American Community Survey 1-Year Estimates, Table B19013; <http://factfinder2.census.gov>; accessed 3 June 2014.7 According to the Quarterly Census of Employment and Wages, Oakland accounted for 25 percent of Alameda County employment in the second quarter of 2013.8 U.S. Census Bureau; American Community Survey, 2010-2012 American Community Survey 3-Year Estimates, Table B08521; <http://factfinder2.census.gov>; accessed 6 June 2014.9 Although more workers will receive an increase in our high estimate, the average wage increases are smaller because the additional workers included in the high estimate will receive below-average increases. For more detail on our estimation methods, see Welsh-Loveman, Perry and Bernhardt (2014).10 The first estimate simply uses the characteristics of Alameda County workers. The second estimate uses the characteristics of Alameda County workers who live in or near Oakland (including Emeryville, Piedmont, San Leandro, and the city of Alameda). Oakland accounts for 79 percent of the residents in this area. The second estimate should not be interpreted as a more accurate estimate, because only 40.5 percent of Oakland workers live in Oakland.11 To determine the labor share of operating costs in retail we use data from the U.S. Census Monthly and Annual Retail Trade (http://www.census.gov/retail/index.html), which provides data on retail sales, merchandise purchased by retailers for resale and detailed operating expenses. We add operating expenses and purchases together to determine total operating costs. We add the costs of fringe benefits (minus health insurance) to annual payroll to estimate total labor costs. Health benefits are excluded since, unlike payroll taxes and workers compensation insurance, the costs of the benefits will not change if wages are increased. Dividing labor costs by operating costs gives us the labor share. The Retail Trade data does not provide the cost of goods purchased for resale in the restaurant industry. Industry data on gross operating surplus is available in the Bureau of Economic Analysis Input-Output Account Data (http://www.bea.gov/industry/io_annual.htm). The data was accessed from the Use Table, 2012, before redefinitions, producer value. We subtract gross operating surplus from sales to get the total restaurant operating costs and proceed as done for retail. 12 The restaurant industry-backed Employment Policies Institute has produced three studies of Santa Fe and San Francisco (Yelowitz 2005a; 2005b; 2012). In our assessment, these studies suffer from serious methodological problems that make the results unreliable. They also offer contradictory results; see Reich, Jacobs and Bernhardt (2014) for details.

Center on Wage and Employment DynamicsInstitute for Research on Labor and EmploymentUniversity of California, Berkeley2521 Channing Way #5555Berkeley, CA 94720-5555(510) 643-8140http://www.irle.berkeley.edu/cwed