the impact of natural hazards and disasters on agriculture
TRANSCRIPT
1
This brochure was preparedfor the World Conferenceon Disaster Risk Reductionin Sendai, Japan,March 2015, and updated in May 2015.
I443
4E/
2/02
.15
Viale delle Terme di Caracalla00153, Rome - ITALY
© FAO, 2015
www.fao.org/resilience
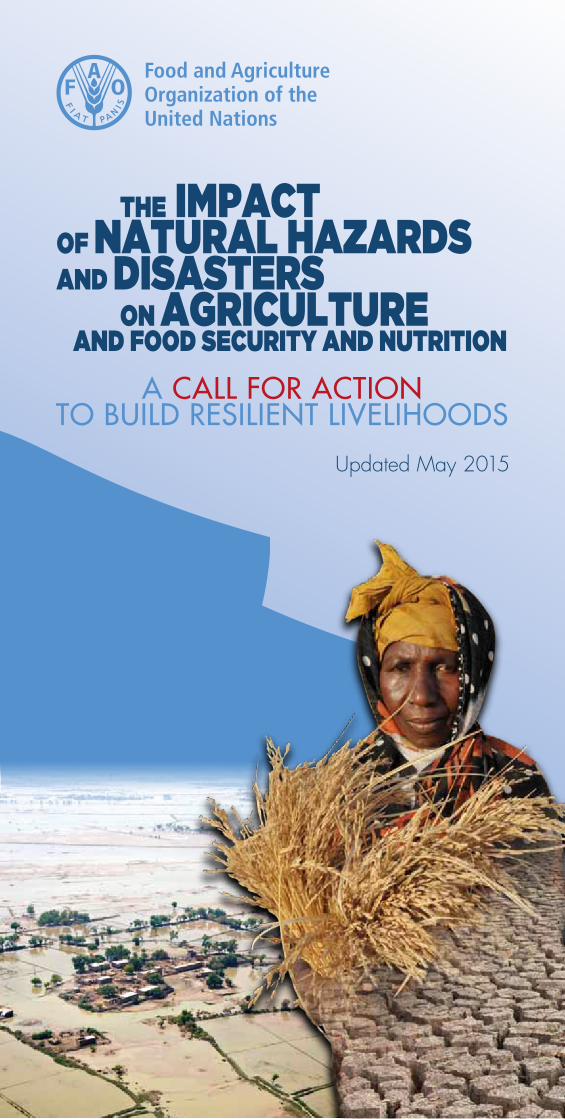
THE IMPACTOF NATURAL HAZARDSAND DISASTERS ON AGRICULTURE AND FOOD SECURITY AND NUTRITION
A CALL FOR ACTIONTO BUILD RESILIENT LIVELIHOODS
Updated May 2015
2
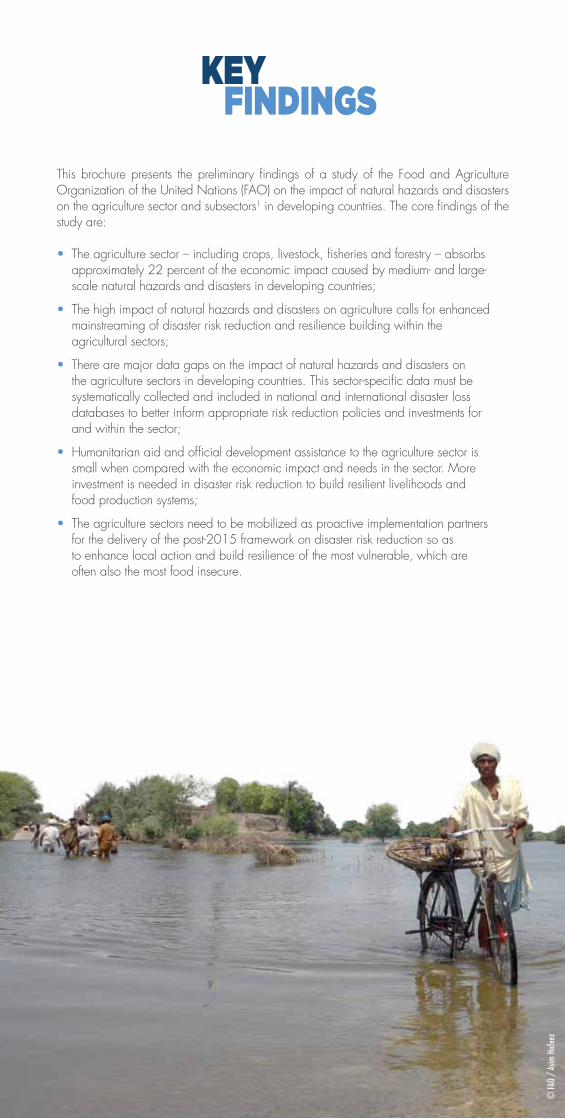
This brochure presents the preliminary findings of a study of the Food and Agriculture Organization of the United Nations (FAO) on the impact of natural hazards and disasters on the agriculture sector and subsectors1 in developing countries. The core findings of the study are:
• The agriculture sector – including crops, livestock, fisheries and forestry – absorbs approximately 22 percent of the economic impact caused by medium- and large-scale natural hazards and disasters in developing countries;
• The high impact of natural hazards and disasters on agriculture calls for enhanced mainstreaming of disaster risk reduction and resilience building within the agricultural sectors;
• There are major data gaps on the impact of natural hazards and disasters on the agriculture sectors in developing countries. This sector-specific data must be systematically collected and included in national and international disaster loss databases to better inform appropriate risk reduction policies and investments for and within the sector;
• Humanitarian aid and official development assistance to the agriculture sector is small when compared with the economic impact and needs in the sector. More investment is needed in disaster risk reduction to build resilient livelihoods and food production systems;
• The agriculture sectors need to be mobilized as proactive implementation partners for the delivery of the post-2015 framework on disaster risk reduction so as to enhance local action and build resilience of the most vulnerable, which are often also the most food insecure.
Key findings
© FA
O /
Asim
Haf
eez
3
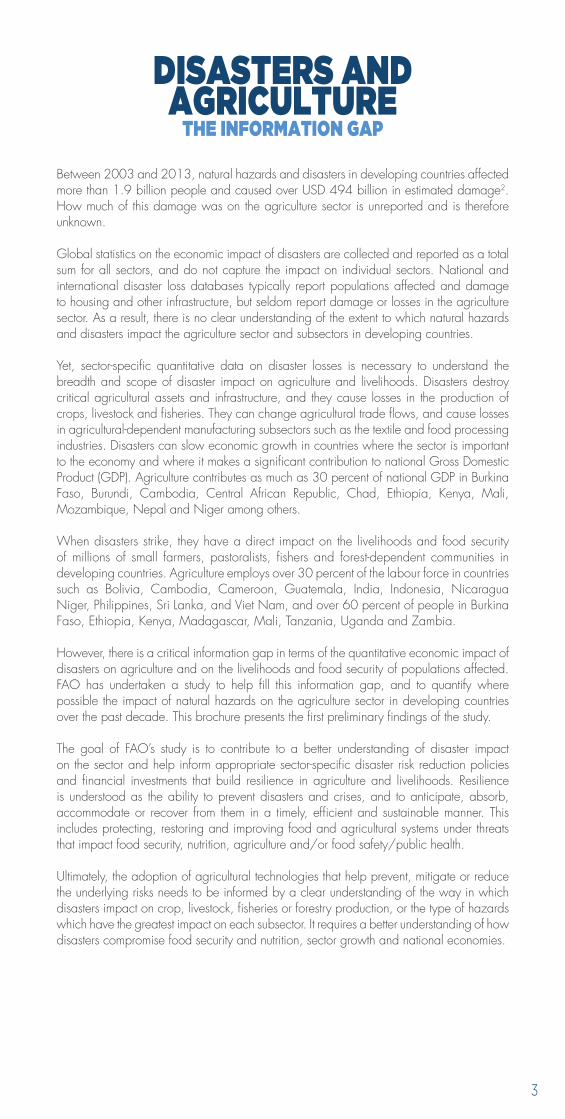
Between 2003 and 2013, natural hazards and disasters in developing countries affected more than 1.9 billion people and caused over USD 494 billion in estimated damage2. How much of this damage was on the agriculture sector is unreported and is therefore unknown.
Global statistics on the economic impact of disasters are collected and reported as a total sum for all sectors, and do not capture the impact on individual sectors. National and international disaster loss databases typically report populations affected and damage to housing and other infrastructure, but seldom report damage or losses in the agriculture sector. As a result, there is no clear understanding of the extent to which natural hazards and disasters impact the agriculture sector and subsectors in developing countries.
Yet, sector-specific quantitative data on disaster losses is necessary to understand the breadth and scope of disaster impact on agriculture and livelihoods. Disasters destroy critical agricultural assets and infrastructure, and they cause losses in the production of crops, livestock and fisheries. They can change agricultural trade flows, and cause losses in agricultural-dependent manufacturing subsectors such as the textile and food processing industries. Disasters can slow economic growth in countries where the sector is important to the economy and where it makes a significant contribution to national Gross Domestic Product (GDP). Agriculture contributes as much as 30 percent of national GDP in Burkina Faso, Burundi, Cambodia, Central African Republic, Chad, Ethiopia, Kenya, Mali, Mozambique, Nepal and Niger among others.
When disasters strike, they have a direct impact on the livelihoods and food security of millions of small farmers, pastoralists, fishers and forest-dependent communities in developing countries. Agriculture employs over 30 percent of the labour force in countries such as Bolivia, Cambodia, Cameroon, Guatemala, India, Indonesia, Nicaragua Niger, Philippines, Sri Lanka, and Viet Nam, and over 60 percent of people in Burkina Faso, Ethiopia, Kenya, Madagascar, Mali, Tanzania, Uganda and Zambia.
However, there is a critical information gap in terms of the quantitative economic impact of disasters on agriculture and on the livelihoods and food security of populations affected. FAO has undertaken a study to help fill this information gap, and to quantify where possible the impact of natural hazards on the agriculture sector in developing countries over the past decade. This brochure presents the first preliminary findings of the study.
The goal of FAO’s study is to contribute to a better understanding of disaster impact on the sector and help inform appropriate sector-specific disaster risk reduction policies and financial investments that build resilience in agriculture and livelihoods. Resilience is understood as the ability to prevent disasters and crises, and to anticipate, absorb, accommodate or recover from them in a timely, efficient and sustainable manner. This includes protecting, restoring and improving food and agricultural systems under threats that impact food security, nutrition, agriculture and/or food safety/public health.
Ultimately, the adoption of agricultural technologies that help prevent, mitigate or reduce the underlying risks needs to be informed by a clear understanding of the way in which disasters impact on crop, livestock, fisheries or forestry production, or the type of hazards which have the greatest impact on each subsector. It requires a better understanding of how disasters compromise food security and nutrition, sector growth and national economies.
disasters and agriculture
the information gap
4
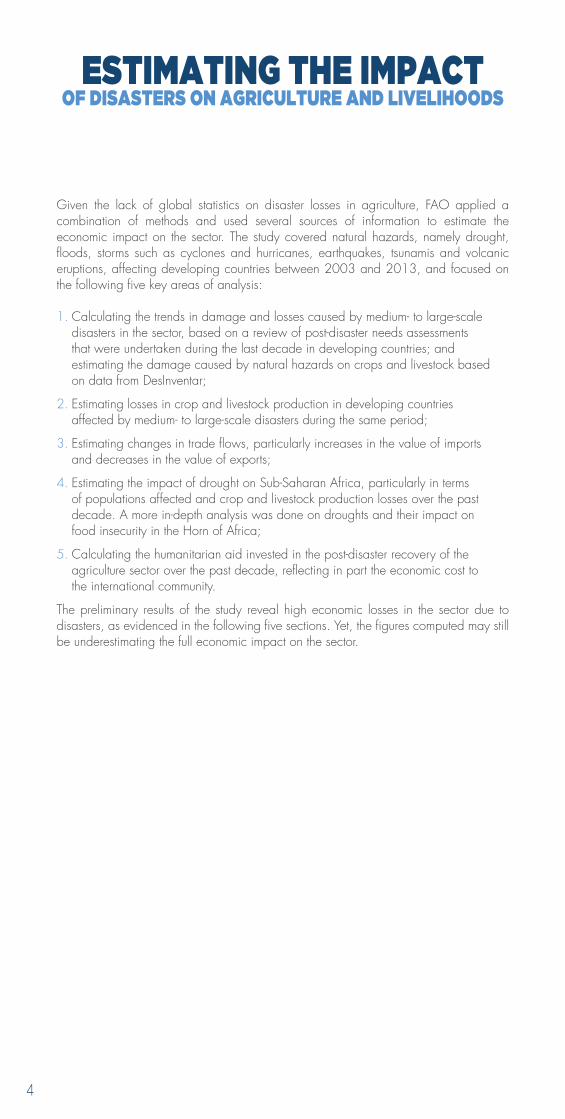
Given the lack of global statistics on disaster losses in agriculture, FAO applied a combination of methods and used several sources of information to estimate the economic impact on the sector. The study covered natural hazards, namely drought, floods, storms such as cyclones and hurricanes, earthquakes, tsunamis and volcanic eruptions, affecting developing countries between 2003 and 2013, and focused on the following five key areas of analysis:
1. Calculating the trends in damage and losses caused by medium- to large-scale disasters in the sector, based on a review of post-disaster needs assessments that were undertaken during the last decade in developing countries; and estimating the damage caused by natural hazards on crops and livestock based on data from DesInventar;
2. Estimating losses in crop and livestock production in developing countries affected by medium- to large-scale disasters during the same period;
3. Estimating changes in trade flows, particularly increases in the value of imports and decreases in the value of exports;
4. Estimating the impact of drought on Sub-Saharan Africa, particularly in terms of populations affected and crop and livestock production losses over the past decade. A more in-depth analysis was done on droughts and their impact on food insecurity in the Horn of Africa;
5. Calculating the humanitarian aid invested in the post-disaster recovery of the agriculture sector over the past decade, reflecting in part the economic cost to the international community.
The preliminary results of the study reveal high economic losses in the sector due to disasters, as evidenced in the following five sections. Yet, the figures computed may still be underestimating the full economic impact on the sector.
estimating the impact of disasters on agriculture and livelihoods
5
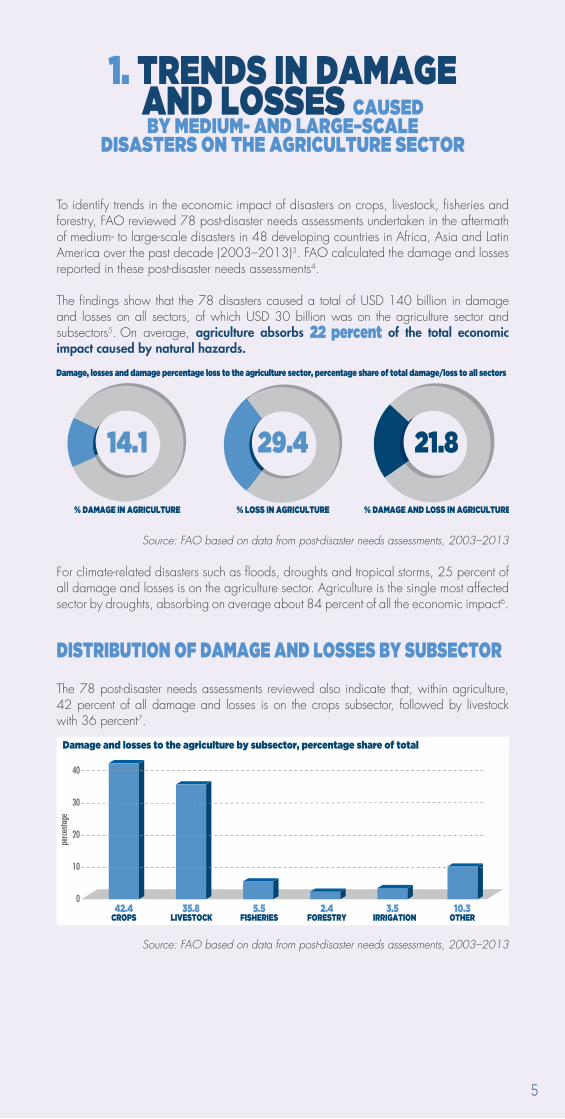
To identify trends in the economic impact of disasters on crops, livestock, fisheries and forestry, FAO reviewed 78 post-disaster needs assessments undertaken in the aftermath of medium- to large-scale disasters in 48 developing countries in Africa, Asia and Latin America over the past decade (2003–2013)3. FAO calculated the damage and losses reported in these post-disaster needs assessments4.
The findings show that the 78 disasters caused a total of USD 140 billion in damage and losses on all sectors, of which USD 30 billion was on the agriculture sector and subsectors5. On average, agriculture absorbs 22 percent of the total economic impact caused by natural hazards.
29.4
% LOSS IN AGRICULTURE
21.8
% DAMAGE AND LOSS IN AGRICULTURE % DAMAGE IN AGRICULTURE
Damage, losses and damage percentage loss to the agriculture sector, percentage share of total damage/loss to all sectors
14.1
Source: FAO based on data from post-disaster needs assessments, 2003–2013
For climate-related disasters such as floods, droughts and tropical storms, 25 percent of all damage and losses is on the agriculture sector. Agriculture is the single most affected sector by droughts, absorbing on average about 84 percent of all the economic impact6.
distribution of damage and losses by subsector
The 78 post-disaster needs assessments reviewed also indicate that, within agriculture, 42 percent of all damage and losses is on the crops subsector, followed by livestock with 36 percent7.
CROPS LIVESTOCK FISHERIES FORESTRY IRRIGATION OTHER
Damage and losses to the agriculture by subsector, percentage share of total
42.4 35.8 5.5 2.4 3.5 10.30
10
20
30
40
perce
ntag
e
Source: FAO based on data from post-disaster needs assessments, 2003–2013
1. trends in damageand losses caused by medium- and large–scale
disasters on the agriculture sector
5
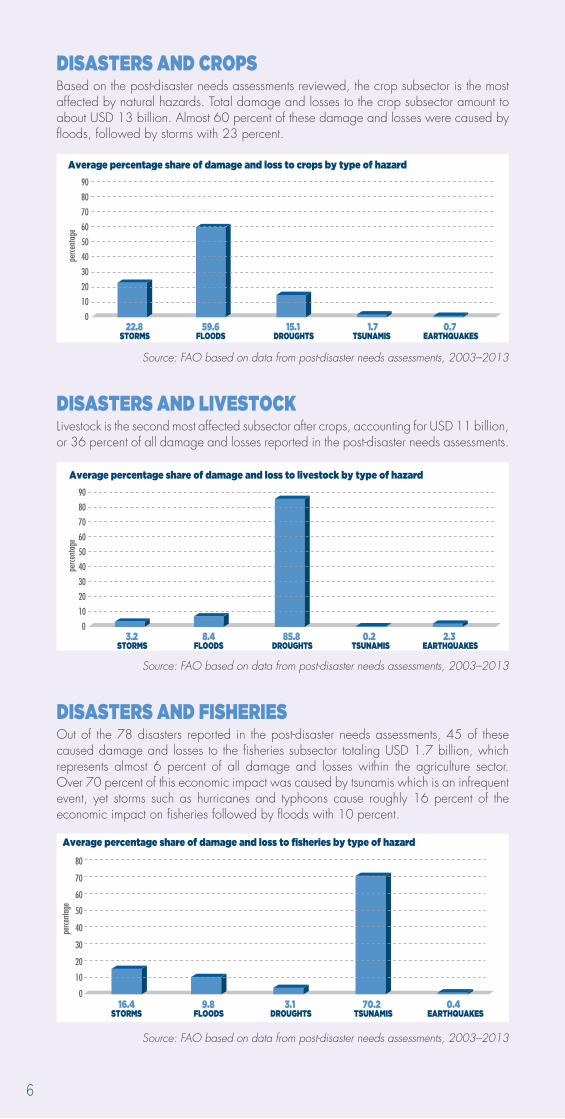
disasters and cropsBased on the post-disaster needs assessments reviewed, the crop subsector is the most affected by natural hazards. Total damage and losses to the crop subsector amount to about USD 13 billion. Almost 60 percent of these damage and losses were caused by floods, followed by storms with 23 percent.
TSUNAMIS1.7
0
10
20
30
40
50
60
70
80
90
STORMS22.8
FLOODS59.6
EARTHQUAKES0.7
DROUGHTS15.1
Average percentage share of damage and loss to crops by type of hazard
perce
ntag
e
Source: FAO based on data from post-disaster needs assessments, 2003–2013
disasters and livestocKLivestock is the second most affected subsector after crops, accounting for USD 11 billion, or 36 percent of all damage and losses reported in the post-disaster needs assessments.
TSUNAMIS0.2
0
10
20
30
40
50
60
70
80
90
STORMS3.2
FLOODS8.4
EARTHQUAKES2.3
DROUGHTS85.8
Average percentage share of damage and loss to livestock by type of hazard
perce
ntag
e
Source: FAO based on data from post-disaster needs assessments, 2003–2013
disasters and fisheriesOut of the 78 disasters reported in the post-disaster needs assessments, 45 of these caused damage and losses to the fisheries subsector totaling USD 1.7 billion, which represents almost 6 percent of all damage and losses within the agriculture sector. Over 70 percent of this economic impact was caused by tsunamis which is an infrequent event, yet storms such as hurricanes and typhoons cause roughly 16 percent of the economic impact on fisheries followed by floods with 10 percent.
STORMS FLOODS DROUGHTS TSUNAMIS EARTHQUAKES
Average percentage share of damage and loss to fisheries by type of hazard
16.4 9.8 3.1 70.2 0.40
10
20
30
40
50
60
70
80
perce
ntag
e
Source: FAO based on data from post-disaster needs assessments, 2003–2013
6
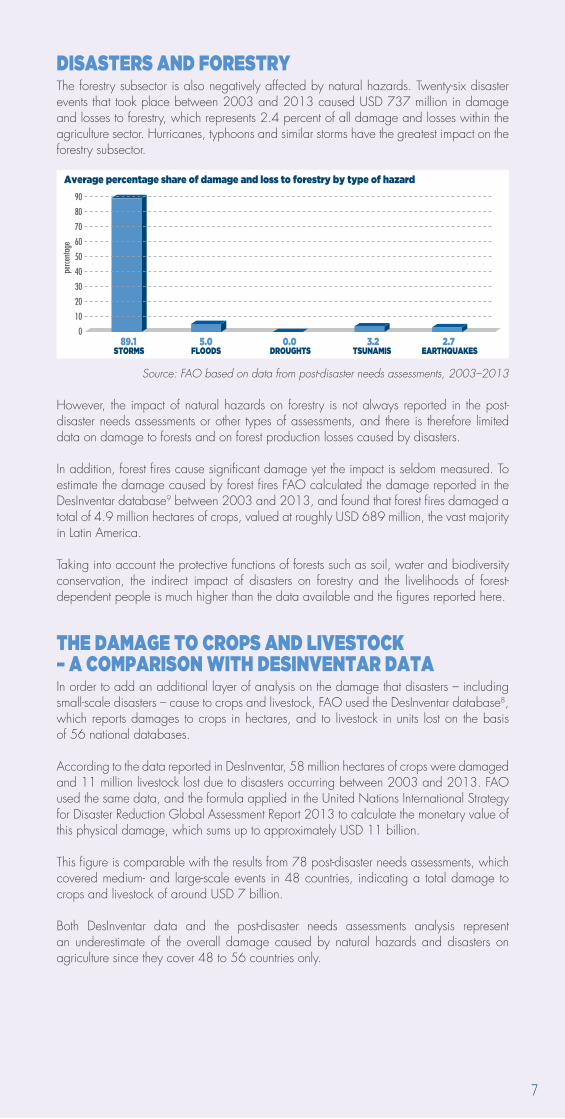
disasters and forestryThe forestry subsector is also negatively affected by natural hazards. Twenty-six disaster events that took place between 2003 and 2013 caused USD 737 million in damage and losses to forestry, which represents 2.4 percent of all damage and losses within the agriculture sector. Hurricanes, typhoons and similar storms have the greatest impact on the forestry subsector.
TSUNAMIS
Average percentage share of damage and loss to forestry by type of hazard
3.20
10
20
30
40
50
60
70
80
90
STORMS89.1
FLOODS5.0
EARTHQUAKES2.7
DROUGHTS0.0
perce
ntag
e
Source: FAO based on data from post-disaster needs assessments, 2003–2013
However, the impact of natural hazards on forestry is not always reported in the post-disaster needs assessments or other types of assessments, and there is therefore limited data on damage to forests and on forest production losses caused by disasters.
In addition, forest fires cause significant damage yet the impact is seldom measured. To estimate the damage caused by forest fires FAO calculated the damage reported in the DesInventar database9 between 2003 and 2013, and found that forest fires damaged a total of 4.9 million hectares of crops, valued at roughly USD 689 million, the vast majority in Latin America.
Taking into account the protective functions of forests such as soil, water and biodiversity conservation, the indirect impact of disasters on forestry and the livelihoods of forest-dependent people is much higher than the data available and the figures reported here.
the damage to crops and livestocK– a comparison with desinventar dataIn order to add an additional layer of analysis on the damage that disasters – including small-scale disasters – cause to crops and livestock, FAO used the DesInventar database8, which reports damages to crops in hectares, and to livestock in units lost on the basis of 56 national databases.
According to the data reported in DesInventar, 58 million hectares of crops were damaged and 11 million livestock lost due to disasters occurring between 2003 and 2013. FAO used the same data, and the formula applied in the United Nations International Strategy for Disaster Reduction Global Assessment Report 2013 to calculate the monetary value of this physical damage, which sums up to approximately USD 11 billion.
This figure is comparable with the results from 78 post-disaster needs assessments, which covered medium- and large-scale events in 48 countries, indicating a total damage to crops and livestock of around USD 7 billion.
Both DesInventar data and the post-disaster needs assessments analysis represent an underestimate of the overall damage caused by natural hazards and disasters on agriculture since they cover 48 to 56 countries only.
7
d
Given the lack of global data on losses in agriculture, FAO attempted to estimate crop and livestock production losses in countries affected by disasters during the past decade (2003–2013). For the analysis, a first selection was made of disasters affecting 250 000 people or more, and a second selection was made of disasters when the population affected was above the ten-year average for that country10.This allowed for a selection of medium- to larger-scale disasters that are likely to have an impact on production at the national level.
National crop production losses were estimated by comparing decreases in the yield, during the year when disasters occurred and the subsequent year, with the yield linear trend (2003–2013). This calculation was applied to cereals, pulses and other primary food and cash crop commodities11.Yield losses were multiplied by the area harvested to obtain production losses in tons. These were converted into monetary losses using producer prices.
National livestock production losses were estimated by comparing decreases in total production of livestock commodities (cattle and goat meat; cow and goat milk) in the year of disaster and in the subsequent year, with the production linear growth trend (2003–2013). Work is underway to update figures taking into account other livestock subsectors as well.
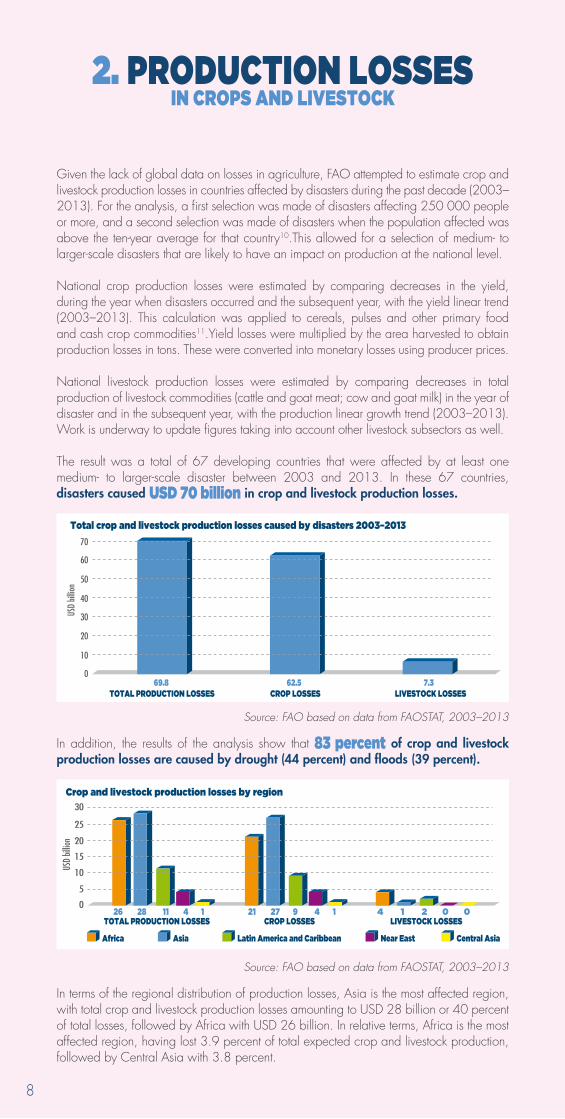
The result was a total of 67 developing countries that were affected by at least one medium- to larger-scale disaster between 2003 and 2013. In these 67 countries, disasters caused usd 70 billion in crop and livestock production losses.
TOTAL PRODUCTION LOSSES CROP LOSSES LIVESTOCK LOSSES
Total crop and livestock production losses caused by disasters 2003–2013
69.8 62.5 7.3 0
10
20
30
40
50
60
70
USD
billio
n
Source: FAO based on data from FAOSTAT, 2003–2013
In addition, the results of the analysis show that 83 percent of crop and livestock production losses are caused by drought (44 percent) and floods (39 percent).
TOTAL PRODUCTION LOSSES CROP LOSSES LIVESTOCK LOSSES
Crop and livestock production losses by region
26 28 11 4 1 21 27 9 4 1 4 1 2 0 0 0
5
10
15
20
25
30
Africa Asia Latin America and Caribbean Near East Central Asia
USD
billio
n
Source: FAO based on data from FAOSTAT, 2003–2013
In terms of the regional distribution of production losses, Asia is the most affected region, with total crop and livestock production losses amounting to USD 28 billion or 40 percent of total losses, followed by Africa with USD 26 billion. In relative terms, Africa is the most affected region, having lost 3.9 percent of total expected crop and livestock production, followed by Central Asia with 3.8 percent.
2. production lossesin crops and livestocK
8
9
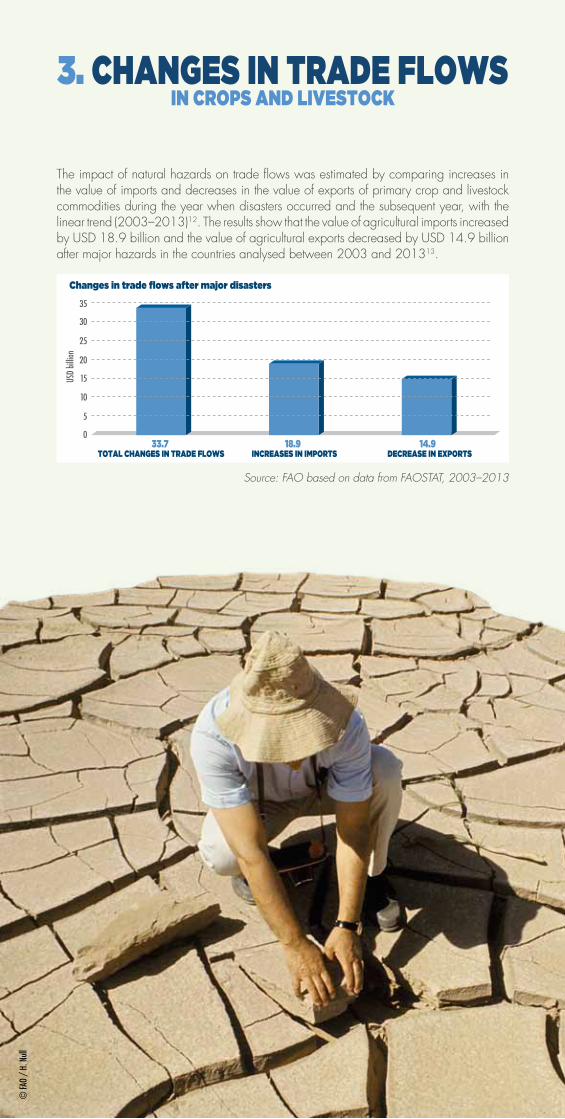
The impact of natural hazards on trade flows was estimated by comparing increases in the value of imports and decreases in the value of exports of primary crop and livestock commodities during the year when disasters occurred and the subsequent year, with the linear trend (2003–2013)12. The results show that the value of agricultural imports increased by USD 18.9 billion and the value of agricultural exports decreased by USD 14.9 billion after major hazards in the countries analysed between 2003 and 201313.
TOTAL CHANGES IN TRADE FLOWS INCREASES IN IMPORTS DECREASE IN EXPORTS
Changes in trade flows after major disasters
33.7 18.9 14.9 0
5
10
15
20
25
30
35
USD
billio
n
Source: FAO based on data from FAOSTAT, 2003–2013
3. changes in trade flows in crops and livestocK
© FA
O /
H. N
ull
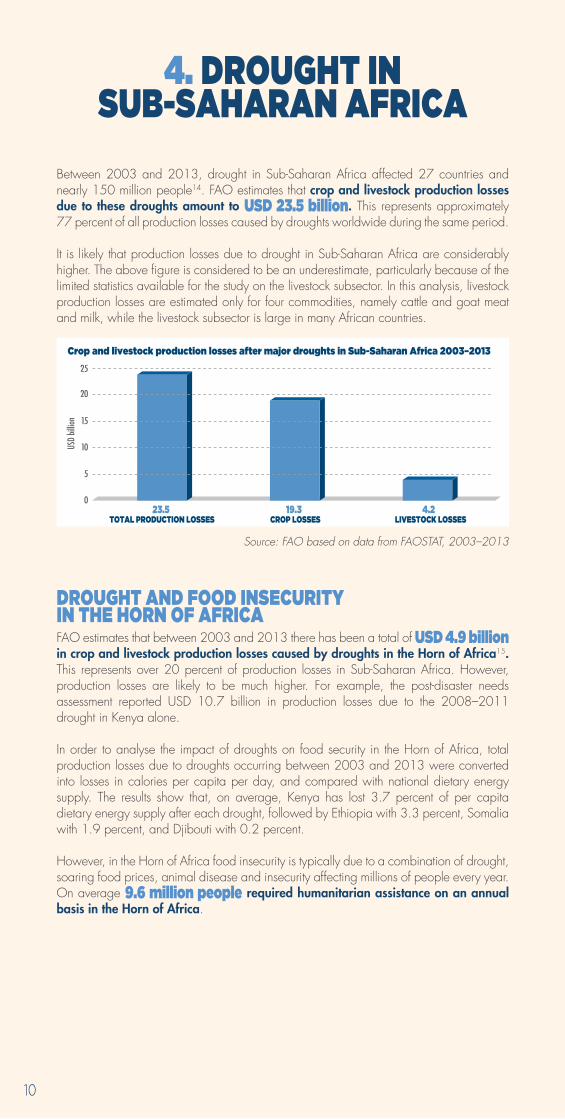
Between 2003 and 2013, drought in Sub-Saharan Africa affected 27 countries and nearly 150 million people14. FAO estimates that crop and livestock production losses due to these droughts amount to usd 23.5 billion. This represents approximately 77 percent of all production losses caused by droughts worldwide during the same period.
It is likely that production losses due to drought in Sub-Saharan Africa are considerably higher. The above figure is considered to be an underestimate, particularly because of the limited statistics available for the study on the livestock subsector. In this analysis, livestock production losses are estimated only for four commodities, namely cattle and goat meat and milk, while the livestock subsector is large in many African countries.
TOTAL PRODUCTION LOSSES CROP LOSSES LIVESTOCK LOSSES
Crop and livestock production losses after major droughts in Sub-Saharan Africa 2003–2013
23.5 19.3 4.2 0
5
10
15
20
25
USD
billio
n
Source: FAO based on data from FAOSTAT, 2003–2013
drought and food insecurity in the horn of africaFAO estimates that between 2003 and 2013 there has been a total of USD 4.9 billion in crop and livestock production losses caused by droughts in the Horn of Africa15.This represents over 20 percent of production losses in Sub-Saharan Africa. However, production losses are likely to be much higher. For example, the post-disaster needs assessment reported USD 10.7 billion in production losses due to the 2008–2011 drought in Kenya alone.
In order to analyse the impact of droughts on food security in the Horn of Africa, total production losses due to droughts occurring between 2003 and 2013 were converted into losses in calories per capita per day, and compared with national dietary energy supply. The results show that, on average, Kenya has lost 3.7 percent of per capita dietary energy supply after each drought, followed by Ethiopia with 3.3 percent, Somalia with 1.9 percent, and Djibouti with 0.2 percent.
However, in the Horn of Africa food insecurity is typically due to a combination of drought, soaring food prices, animal disease and insecurity affecting millions of people every year.On average 9.6 million people required humanitarian assistance on an annual basis in the Horn of Africa.
4. drought in sub-saharan africa
10
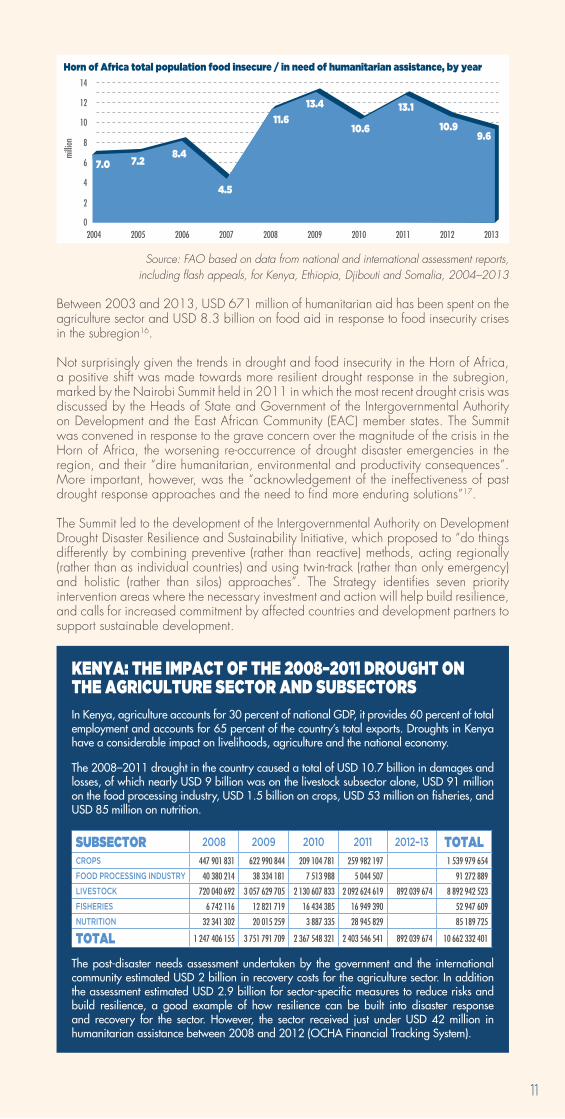
Horn of Africa total population food insecure / in need of humanitarian assistance, by year
02004 2005 2006 2007 2008 2009 2010 2011 2012 2013
14
12
10
8
6
4
2
7.0 7.28.4
4.5
11.6
13.4
10.6
13.1
10.99.6
milli
on
Source: FAO based on data from national and international assessment reports, including flash appeals, for Kenya, Ethiopia, Djibouti and Somalia, 2004–2013
Between 2003 and 2013, USD 671 million of humanitarian aid has been spent on the agriculture sector and USD 8.3 billion on food aid in response to food insecurity crises in the subregion16.
Not surprisingly given the trends in drought and food insecurity in the Horn of Africa, a positive shift was made towards more resilient drought response in the subregion, marked by the Nairobi Summit held in 2011 in which the most recent drought crisis was discussed by the Heads of State and Government of the Intergovernmental Authority on Development and the East African Community (EAC) member states. The Summit was convened in response to the grave concern over the magnitude of the crisis in the Horn of Africa, the worsening re-occurrence of drought disaster emergencies in the region, and their “dire humanitarian, environmental and productivity consequences”. More important, however, was the “acknowledgement of the ineffectiveness of past drought response approaches and the need to find more enduring solutions”17.
The Summit led to the development of the Intergovernmental Authority on Development Drought Disaster Resilience and Sustainability Initiative, which proposed to “do things differently by combining preventive (rather than reactive) methods, acting regionally (rather than as individual countries) and using twin-track (rather than only emergency) and holistic (rather than silos) approaches”. The Strategy identifies seven priority intervention areas where the necessary investment and action will help build resilience, and calls for increased commitment by affected countries and development partners to support sustainable development.
Kenya: the impact of the 2008–2011 drought on the agriculture sector and subsectorsIn Kenya, agriculture accounts for 30 percent of national GDP, it provides 60 percent of total employment and accounts for 65 percent of the country’s total exports. Droughts in Kenya have a considerable impact on livelihoods, agriculture and the national economy.
The 2008–2011 drought in the country caused a total of USD 10.7 billion in damages and losses, of which nearly USD 9 billion was on the livestock subsector alone, USD 91 million on the food processing industry, USD 1.5 billion on crops, USD 53 million on fisheries, and USD 85 million on nutrition.
subsector 2008 2009 2010 2011 2012–13 totalCrops 447 901 831 622 990 844 209 104 781 259 982 197 1 539 979 654
Food proCessing industry 40 380 214 38 334 181 7 513 988 5 044 507 91 272 889
LivestoCk 720 040 692 3 057 629 705 2 130 607 833 2 092 624 619 892 039 674 8 892 942 523
Fisheries 6 742 116 12 821 719 16 434 385 16 949 390 52 947 609
nutrition 32 341 302 20 015 259 3 887 335 28 945 829 85 189 725
total 1 247 406 155 3 751 791 709 2 367 548 321 2 403 546 541 892 039 674 10 662 332 401
The post-disaster needs assessment undertaken by the government and the international community estimated USD 2 billion in recovery costs for the agriculture sector. In addition the assessment estimated USD 2.9 billion for sector-specific measures to reduce risks and build resilience, a good example of how resilience can be built into disaster response and recovery for the sector. However, the sector received just under USD 42 million in humanitarian assistance between 2008 and 2012 (OCHA Financial Tracking System).
11
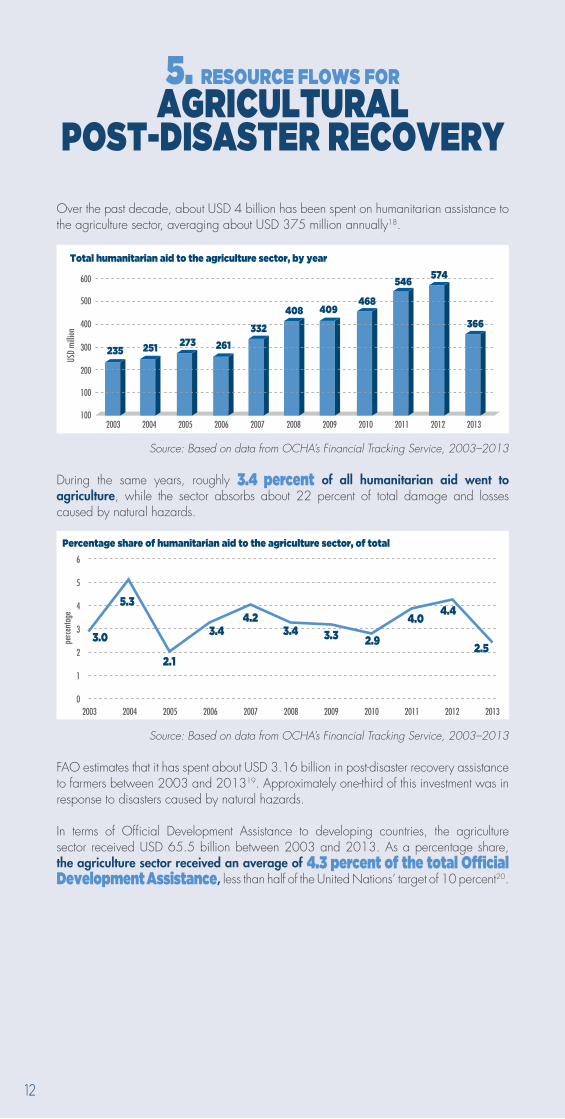
Over the past decade, about USD 4 billion has been spent on humanitarian assistance to the agriculture sector, averaging about USD 375 million annually18.
Total humanitarian aid to the agriculture sector, by year
100
100
200
300
400
500
2003 2004 2005 2006 2007 2008 2009 2010 2011 2012 2013
600
235 251 273 261
332
408 409468
546574
366
USD
milli
on
Source: Based on data from OCHA’s Financial Tracking Service, 2003–2013
During the same years, roughly 3.4 percent of all humanitarian aid went to agriculture, while the sector absorbs about 22 percent of total damage and losses caused by natural hazards.
Percentage share of humanitarian aid to the agriculture sector, of total
020042003 2005 2006 2007 2008 2009 2010 2011 2012 2013
6
5
4
3
2
1
3.0
5.3
2.1
3.44.2
3.4 3.3 2.9
4.04.4
2.5
perce
ntag
e
Source: Based on data from OCHA’s Financial Tracking Service, 2003–2013
FAO estimates that it has spent about USD 3.16 billion in post-disaster recovery assistance to farmers between 2003 and 201319. Approximately one-third of this investment was in response to disasters caused by natural hazards.
In terms of Official Development Assistance to developing countries, the agriculture sector received USD 65.5 billion between 2003 and 2013. As a percentage share, the agriculture sector received an average of 4.3 percent of the total Official development assistance, less than half of the United Nations’ target of 10 percent20.
5. resource flows for agricultural
post-disaster recovery
12
13
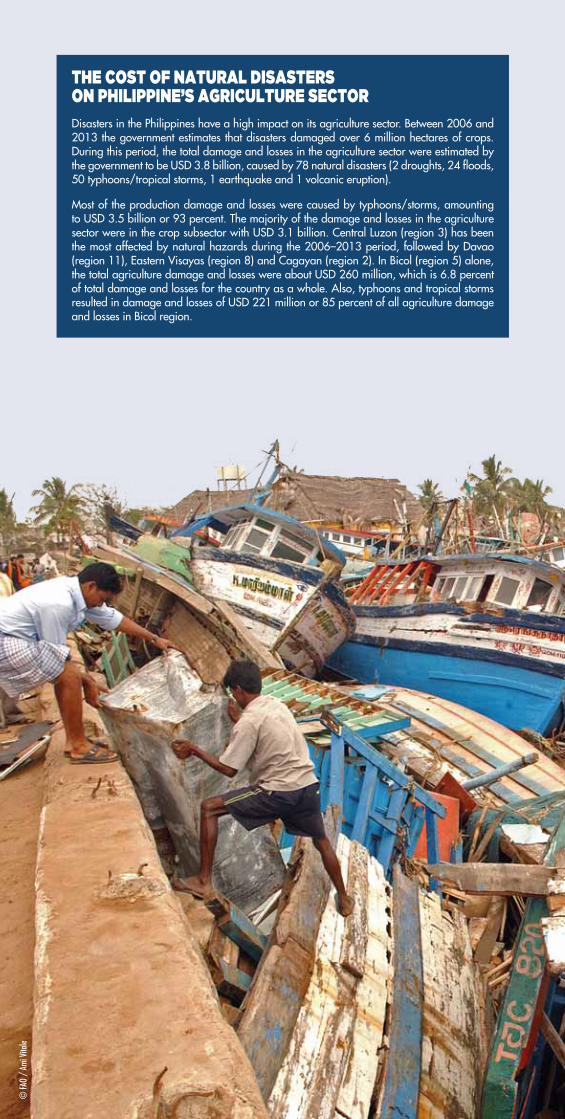
the cost of natural disasters on philippine’s agriculture sector Disasters in the Philippines have a high impact on its agriculture sector. Between 2006 and 2013 the government estimates that disasters damaged over 6 million hectares of crops. During this period, the total damage and losses in the agriculture sector were estimated by the government to be USD 3.8 billion, caused by 78 natural disasters (2 droughts, 24 floods, 50 typhoons/tropical storms, 1 earthquake and 1 volcanic eruption).
Most of the production damage and losses were caused by typhoons/storms, amounting to USD 3.5 billion or 93 percent. The majority of the damage and losses in the agriculture sector were in the crop subsector with USD 3.1 billion. Central Luzon (region 3) has been the most affected by natural hazards during the 2006–2013 period, followed by Davao (region 11), Eastern Visayas (region 8) and Cagayan (region 2). In Bicol (region 5) alone, the total agriculture damage and losses were about USD 260 million, which is 6.8 percent of total damage and losses for the country as a whole. Also, typhoons and tropical storms resulted in damage and losses of USD 221 million or 85 percent of all agriculture damage and losses in Bicol region.
© FA
O /
Ami V
itale
14
While there are clear indications that natural disasters have a high impact on the agriculture sector, there are major gaps in the data and information available worldwide. National and international disaster loss databases seldom report losses in the sector. As a result, little is known on the types of hazards that cause the greatest sector losses. While droughts affect many countries in Sub-Saharan Africa and appear to be increasing in frequency, there is little data on the losses they cause to the agriculture sector and subsectors, and on the full extent of their impact on food security and poverty. The impact on subsectors such as fisheries and forestry is typically under-reported as well. Yet, quantifying and reporting such sector losses is fundamental to understand the challenges and to address them.
Disaster risk reduction measures are necessary to reduce, prevent and mitigate the significant impact of disasters on agriculture. Agricultural growth and productivity depends on food production systems that are resilient against production failure due to shocks and climate variability. This requires a strong emphasis on sector-specific disaster risk reduction measures, technologies and practices, as well as on a more sustainable use and management of vital resources such as land, water, soil nutrients and genetic resources.
Yet progress in mainstreaming disaster risk reduction into the agriculture sector is limited21.Many countries have national platforms, legislation and policies on disaster risk reduction, but few address agriculture, food security and nutrition with sector-specific disaster risk reduction policies and objectives. Reducing risks and building resilience within agriculture requires a policy environment that is conducive to the full mainstreaming of disaster risk reduction within the sector. Sector-specific disaster risk reduction planning is needed and must be included in national agriculture development plans to proactively reduce disaster losses in the sector, enable sector growth and protect the food security and nutrition of vulnerable populations.
The four priority areas of disaster risk reduction in the post-2015 disaster risk reduction framework should be applied within the agriculture sector and subsectors; they need to be specified as part of national goals to achieve sustainable and productive agriculture systems, including farm technologies and practices that help prevent, mitigate and reduce disaster risks, and sector-specific vulnerability assessments and early warning systems.
Financial resources for disaster risk reduction within the agriculture sector are needed to enable actionable results. This is true also at subnational levels, where financing and concrete actions are needed to support local farming communities.
In addition to national disaster risk reduction platforms, an institutional architecture is needed within the agriculture sector and subsectors, where key ministries/departments, research institutions, civil society and other relevant national actors contribute to disaster risk reduction planning and implementation within the sector.
Recognizing the critical importance of resilience in agriculture for food security and nutrition, some countries have started to adopt clear policies to mainstream disaster risk reduction across key sectors, such as Pakistan where mainstreaming risk reduction is one of its nine priorities within the National Disaster Risk Management Framework including mainstreaming within the agriculture sector. Other countries such as the United Republic of Tanzania have developed national agriculture development plans that explicitly integrate risk reduction as part of their strategy to achieve sector growth while also building resilience. These examples reflect good practices that need to be replicated and up-scaled more broadly in countries where the damage and losses to agriculture caused by disasters is high and therefore compromises sector development objectives for growth and productivity, and undermine national goals to achieve food security.
a call for action to build
resilient livelihoods
endnotes
1. In this study, the agriculture sector is understood to include crops, livestock, fisheries and forestry.
2. Based on data from the EM-DAT CRED database. The damage reported in this database is an under-estimate, since it reports economic damage in less than 30percent of its records, as noted in the 2013 Global Assessment Report by the United Nations International Strategy for Disaster Reduction.
3. Out of the 78 post-disaster needs assessments reviewed only three assessed the impact of drought.
4. The PDNA methodology assesses “damage” in terms of the total or partial destruction of physical assets and infrastructure in the disaster-affected areas, in terms of their monetary value expressed as the replacement costs; and “losses” in terms of changes in economic flows arising from the disaster which continue until economic recovery and reconstruction is achieved. For example, in the agriculture sector losses refer to the decline in output in crops, livestock and fisheries production associated with the damage to infrastructure and assets.
5. In this study, the damage and losses calculated for the sector includes data on irrigation systems often reported under the water and sanitation sector in post-disaster needs assessments, as well as on forestry typically reported under the environment sector.
6. Based on post-disaster needs assessments in Djibouti, Kenya and Uganda.
7. The “other” category in the analysis of post-disaster needs assessments refers to damage and losses to agricultural infrastructure such as offices, which are not specific to subsectors.
8. DesInventar is a conceptual and methodological tool for the generation of National Disaster Inventories and the construction of databases of damage, losses and the effects of disasters. The methodology was developed in 1994 by researchers and institutional actors linked to the Network of Social Studies in the Prevention of Disasters in Latin America and is supported by, among others, UNDP and United Nations International Strategy for Disaster Reduction.
9. FAO estimated the monetary value of crop and livestock damage using the same formula used in the 2013 Global Assessment Report by the United Nations International Strategy for Disaster Reduction. The formula is: Number of crop hectares damaged and livestock units lost * (GDPpercapita2012 * 0.01 + 90). The formula results from regression analysis against GDP per capita, conducted using data on crop and livestock costs in a number of developing countries.
10. Disaster years were based on the EM-DAT CRED database. All droughts affecting 250 000 people or more were included in the analysis. In the case of Djibouti, all droughts reported in the EM-DAT CRED database were included.
11. In addition to cereals and pulses, the analysis focused on top ten commodities by production quantity and top ten commodities by production value at the national level.
12. The indicators used for estimating changes in trade flows measure the total annual monetary value of imports and exports of primary crop and livestock commodities in each country. Source: FAOSTAT
13. Countries and disasters are the same selected for the estimation of production losses. However, 45 out of 141 disasters were excluded from the trade analysis due to lack of data on agricultural trade.
14. Based on data from EM-DAT: International Disaster Database, www.emdat.be, Université Catholique de Louvain, Brussels, Belgium.
15. Findings refer to production losses due to droughts in Kenya, Ethiopia, Djibouti and Somalia between 2003–2013.
16. Data based on OCHA Financial Tracking Service.
17. Intergovernmental Authority on Development (IGAD). 2013. The IGAD Drought Disaster Resilience and Sustainability Initiative Strategy.
18. Based on data from OCHA’s Financial Tracking Service. Data refers to all crises (natural hazards and conflict).
19. FAO estimates refer to all crises (natural hazards and conflict).
20. Data based on OECD Creditor Reporting System.
21. See for example FAO’s Input Paper for the forthcoming Global Assessment Report 2015 by the United Nations International Strategy for Disaster Reduction: Mainstreaming Disaster Risk Reduction in Agriculture: An Assessment of Progress Made Against the Hyogo Framework for Action.
Cover photo: © FAO / Seyllou Diallo / Truls Brekke
This brochure was preparedfor the World Conferenceon Disaster Risk Reductionin Sendai, Japan,March 2015, and updated in May 2015.
I443
4E/
2/02
.15
Viale delle Terme di Caracalla00153, Rome - ITALY
© FAO, 2015
www.fao.org/resilience
THE IMPACTOF NATURAL HAZARDSAND DISASTERS ON AGRICULTURE AND FOOD SECURITY AND NUTRITION
A CALL FOR ACTIONTO BUILD RESILIENT LIVELIHOODS
Updated May 2015