the impact of mother literacy and participation … the impact of mother literacy and participation...
TRANSCRIPT

1
The impact of mother literacy
and participation programs on
child learning: evidence from a
randomized evaluation in India
Rukmini Banerji, Annual Status of Education Report Centre
James Berry, Cornell University Marc Shotland, Abdul Latif Jameel Poverty Action Lab
Grantee Final Report Accepted by 3ie: March 2014

2
Note to readers This impact evaluation has been submitted in partial fulfilment of the requirements of
grant OW2.153 issued under Open Window 2. This version is being published online as it
was received. A copy-edited and formatted version will be produced in the near future. All
content is the sole responsibility of the authors and does not represent the opinions of 3ie,
its donors or its board of commissioners. Any errors and omissions are the sole
responsibility of the authors. All affiliations of the authors listed in the title page are those
that were in effect at the time the report was accepted. Any comments or queries should
be directed to the corresponding author James Berry at [email protected]
Suggested citation: Banerji, R, Berry, J and Shortland, M, 2014. The impact of mother
literacy and participation programs on child learning: evidence from a randomized
evaluation in India, 3ie Grantee Final Report. New Delhi: International Initiative for
Impact Evaluation (3ie)
Funding for this impact evaluation was provided by 3ie’s donors, which include UKaid, the
Bill & Melinda Gates Foundation, Hewlett Foundation and 12 other 3ie members that
provide institutional support. A complete listing is provided on the 3ie website.
The Impact of Mother Literacy and Participation
Programs on Child Learning: Evidence from a
Randomized Evaluation in India
Rukmini Banerji*, James Berry†, Marc Shotland‡

3
February 12, 2014
We thank Annie Duflo for collaboration and insights on the study design and
implementation. We are also grateful to Jessica Chan, Nandini Gupta, Ravi Gupta,
Rachna Nag Chowdhuri, and Nikhil Wilmink for superb work coordinating the field
activities in Rajasthan and Bihar. Laurel Wheeler and Kevin Kho provided excellent
research assistance. This research was funded by the International Initiative for
Impact Evaluation. All errors are our own. The views expressed in this article are not
necessarily those of 3ie or its members.
* ASER Centre0 † Cornell University, corresponding author ([email protected])
‡ Jameel Poverty Action Lab

4
Contents
1 Introduction.................................................................................................... 6
2 Program Description ....................................................................................... 9
3 Conceptual Framework and Theory of Change ..............................................11
3.1 Conceptual Framework ................................................................................ 11
3.2 Theory of Change ....................................................................................... 13
4 Data collection ...............................................................................................14
5 Results - Mothers ..........................................................................................15
5.1 Estimating Equation .................................................................................... 15
5.2 Program Takeup .......................................................................................... 16
5.3 Test Scores ................................................................................................ 18
5.4 Intermediate Outcomes ............................................................................... 19
5.5 Empowerment and Time Use ....................................................................... 19
6 Results - Children ..........................................................................................21
6.1 Test Scores ................................................................................................ 21
6.2 Intermediate Outcomes ............................................................................... 22
7 Impact Heterogeneity ...................................................................................23
7.1 Mothers ..................................................................................................... 24
7.2 Children ..................................................................................................... 24
8 Internal and External Validity ........................................................................25
8.1 Internal Validity .......................................................................................... 25
8.2 External Validity .......................................................................................... 25
8.3 Cost Effectiveness ....................................................................................... 27
9 Policy Recommendations ...............................................................................29
10 Conclusion .....................................................................................................29
11 References .....................................................................................................31
Tables ..................................................................................................................33
Appendix .............................................................................................................44
A Location Selection ....................................................................................... 45
B Power Calculations ...................................................................................... 46
Appendix Tables ..................................................................................................47

5
Abstract
We report the results of a randomized evaluation of three programs
designed to improve the home learning environment among rural households in
India. Households were assigned into one of four groups that received either: (1)
adult literacy classes for mothers, (2) training for mothers on how to enhance
their children’s learning at home, (3) a combination of the first two interventions,
or (4) nothing, which serves as the control group. We find that mothers in the
first three groups perform 0.11, 0.06, and 0.15 standard deviations better
(respectively) on a combined language and math test when compared to the
control group. We find that the three programs had statistically significant effects
of 0.04, 0.05, and 0.07 standard deviations on children’s math scores
(respectively), but only the combined intervention had significant effects on
language scores. We also find that the interventions increased women’s
empowerment, mother participation in child learning, and the presence of
education assets in the home. The key policy implication of our study is that the
effects sizes may not justify the programs as a tool to improve child learning
alone, but they can serve as a useful tool to policy makers interested in
influencing child learning, mother learning, and the home learning environment.

6
1 Introduction
Improving the quality of primary education in the developing world remains a crucial issue
for researchers and policymakers alike. While developing countries have made significant
gains towards universal enrollment, with a net enrollment rate of 90% in low and middle
income countries in 2011 (World Bank, 2013), learning has not matched this progress. For
example, a 2012 survey in India found that 96% of rural primary school-aged children
were enrolled, but only 38% could read a simple story (ASER Centre, 2013). Low quality
education is often considered the result of a low quality education system, characterized
by poor school infrastructure, limited materials, inappropriate pedagogy, and low-quality
teachers. To address this issue, researchers are building evidence on interventions that
improve education in developing countries through changes in inputs at school (Kremer et
al., 2013).
However, low learning levels can also be attributed to the home environment: in low-
income households parents spend less time on educational activities with their children,
are less productive with the time they spend, have lower expectations, and allocate fewer
resources to education. All of these factors are believed to be directly related to the low
education levels of parents. While the correlations between parents’ education levels, the
home environment, and ultimately child outcomes are strong, endogeneity makes it
difficult for researchers to establish causal links (Thomas et al., 1996). However, for
policymakers who face a generation of parents with already low levels of education,
perhaps the more important question is: if the household environment is indeed an
important factor in the child’s education, can policies targeted toward parents help
promote a better home learning environment? In this case, evidence on effective
interventions is much more limited, as we discuss below.
With the aim of influencing the home environment, some policymakers have initiated adult
education campaigns, and this movement has been gaining momentum. In India, the
National Literacy Mission was launched in 1988 “to impart functional literacy to non-
literates in the age group of 15-35 years in a time-bound manner” (Government of India,
2009). In 2009, the Prime Minister of India launched Saakshar Bharat, the revised version
of the National Literacy Mission, aiming to achieve an “80 percent literacy rate and reduce
the gender gap in literacy to 10 percent” by 2012 (UNESCO, 2012). Many other countries
and donors are investing in such programs, in part because they could promote children’s
schooling (DFID, 2008). Unfortunately, the evidence of the effectiveness of such programs
on child learning is sparse, especially in contexts where parents have little-to-no formal
education.

7
This study is designed to evaluate whether child learning can be improved through
interventions focused on improving the human capital of the mother herself, and/or by
interventions that work with the mother but are focused on enhancing at-home learning
for the child. We present the results of a randomized evaluation of three interventions in
rural India designed by Pratham, an education NGO in India,1 to improve child learning
through increased mother literacy and direct encouragement of learning at home. We test
for these effects by randomly assigning villages to one of four groups. In the first group,
mothers in the village are offered the mother literacy (ML) intervention: daily literacy and
math classes. In the second, mothers are given the Child Home Activities and Materials
Packet (CHAMP) intervention: materials, activities, and training each week to promote
enhanced involvement in their children’s education at home. In the third, mothers are
offered both the literacy and enhanced home-learning interventio(ML-CHAMP). The fourth
group serves as a control with no intervention. The evaluation was carried out in 480
villages in the states of Bihar and Rajasthan. In each state, 240 villages were randomly
assigned in equal proportions to the four groups.
We provide evidence that these programs can affected a broad set of learning outcomes as
well as improving the home learning environment for children. For mothers, the ML
program increased learning outcomes by 0.11 standard deviations, CHAMP increased test
scores by 0.06 standard deviations, and ML-CHAMP increased test scores by 0.15 standard
deviations. We also find significant impacts of each of the 3 programs an aggregate
measure of women’s empowerment outcomes. Turning to the results for children, we find
that the ML, CHAMP, and ML-CHAMP increased child math scores by 0.04, 0.05, and 0.07
standard deviations, respectively. The only significant impacts on language scores were in
the combined interventions. We find little evidence that the programs affected formal
schooling behavior, but each of the 3 interventions affected mother’s self-reported
participation in child learning, and educational assets in the home. The evidence is
therefore consistent with the interventions improving child learning by changing the home
environment, particularly through increased productivity of the time children spend
studying. However, we cannot rule out that the interventions affected children directly
through either child attendance in mother literacy classes or through direct participation in
CHAMP sessions. We also note that these are short-term effects, conducted after the
programs had been run for 1 year. More research is needed to study whether these effects
persist well after the programs have ended.
Our child learning effects are small relative to similar interventions targeting child learning:
a recent survey by Kremer, et al. (2013) lists 15 interventions that have statistically
significant effects sizes ranging from 0.14 to 0.6 standard deviations, while our estimate
for the combined ML-CHAMP program is 0.07 standard deviations. However, we find effects
on a broader set of outcomes of policy interest. The key policy implication of our study is
therefore that the effects sizes may not justify the programs as a tool to improve child
learning alone, but they can serve as a useful tool to policy makers interested in
influencing child learning, mother learning, and the home learning environment.
1 Pratham, is a large, India-wide NGO specializing in child literacy and numeracy. For more
information, see http://www.pratham.org.

8
Our study adds to the literature that asks whether the skills believed to help parents
influence their child’s learning can be acquired as an adult. Such programs fall into three
categories: (1) adult literacy programs, (2) child-participation programs, and (3) “family
literacy” programs which typically bundle the first two, along with other components such
as job training, remedial education for children, etc., in different combinations. Also, these
programs are implemented in different contexts: some in higher-income countries, where
parents have had some personal experience with a formal education system and varying
levels of literacy, and developing countries where there is much less exposure, and literacy
levels are far lower. We focus our literature review on research in developing countries, as
parents in poor countries are much less likely to have a substantial experience with formal
education and therefore are likely to respond differently to these programs. However, we
do highlight particularly relevant studies from higher-income countries.
Several evaluations attempt to establish the impact of developing-country adult literacy
programs on adults and children, although much of the research suffers from
methodological limitations. Some studies find significant impacts of adult literacy programs
on adult learning using ex-post comparison with non-participants (Carron, 1990; Ortega
and Rodriguez, 2008). Aker et al. (2011) conduct a randomized evaluation of a program
that provided cell phones to participants in existing adult education classes in Niger and
find significant impacts of the cell phone program on math and literacy scores. However,
there is no evaluation of the adult literacy program, per se. Research on the effects of
adult literacy programs on children’s outcomes is sparse, and these studies also rely on
retrospective selection of a comparison group (Aoki, 2005; Abadzi, 2003).2
There are few existing studies evaluating developing-country participation programs that
encourage parents to be more involved in their children’s schooling. Bekman (1998)
evaluates a Turkish program that trained mothers to help educate their children at home.
Using a matching procedure to construct a comparison group, the study finds large effects
of the program on child learning. In the developed country context, a randomized
evaluation of a program in France to enhance parental involvement in the education of
their adolescent children found significant positive effects on parental and student
participation, student attitudes, and students’ grades in school (Avvisati et al., 2011).
In the family literacy movement, we only know of one randomized evaluation, which is in
the developed-country context: St. Pierre et al.’s (1993) evaluation of the National Even
Start Program in the U.S. The authors find no statistically significant effects on child
learning, performance, or parental help with studies. However, the sample size was small
and takeup was low.
Our study adds to the prior literature by providing the first randomized evaluation (of
which we are aware) of 1) an adult literacy program, 2) a participation program, and 3) a
combined “family literacy” program, in a developing country. We also examine impacts on
both adult and child outcomes, a feature that is relatively rare in prior literature.
2 Although there are numerous evaluations of adult literacy programs in the U.S., much of the
research also suffers from methodological limitations (Beder, 1999).

9
Our paper is structured as follows. Section 2 discusses the programs and context. Section
3 outlines a conceptual framework for the effects of the programs on child learning. 4
covers the study design, data collected and analysis. Section 5 describes the results for
mothers and 6, the results for children. Section 7 analyzes heterogeneity in test score
impacts. Section 8 discusses internal and external validity. We conduct a cost-
effectiveness analysis in Section 9 and discuss implications for policy in Section 10. We
conclude in Section 11.
2 Program Description
The interventions were conducted in two blocks (district subdivisions) of the Purnia district
in Bihar and two blocks of the Ajmer district in Rajasthan. Bihar and Rajasthan were
selected by Pratham for two key reasons. First, both states share low literacy levels.
According to the latest census, these states have the lowest female literacy rates in India
at roughly 53% each (Census of India, 2011). Children’s education outcomes are similar
between the two states. For example, 48% of rural children in grades 3 to 5 can read at a
grade 1 level in both states, just below the national average of 54% (ASER Centre, 2013).
The intervention districts within each state were selected because of existing Pratham
programs and infrastructure in those areas. Within the intervention districts, the blocks
were selected because they did not have any preexisting Pratham programs.
Second, while education outcomes are similar between the two states, Rajasthan and Bihar
provide distinct contexts in which to study the interventions.3 Rajasthan ranks
substantially higher than Bihar along several other key dimensions of economic
development. Bihar has the lowest GDP per capita of any state in the country, and while
Rajasthan is below the national average, its per capita GDP is double that of Bihar (Central
Statistics Office, 2013). Similarly, in Rajasthan 67% of households have electricity, about
the national average, while Bihar ranks last among Indian states, with only 16% of
households having electricity (Census of India, 2011).
Households in our sample broadly follow these patterns. Appendix Table 1 displays the
differences in baseline education, wealth, demographic, and time use variables between
the two states. The average education level for a mother in our sample is under 1 year for
Rajasthan and Bihar, and both have similar scores on our baseline test, with Rajasthan
mothers scoring slightly higher in math. Child learning levels are also slightly higher in the
Rajasthan sample. Households in the Rajasthan sample have substantially more assets and
are more likely to be electrified. Women in the Rajasthan sample spend more time working
(46 hours per week compared to 26), while women in the Bihar sample spend more time
per week reading to their children or helping with homework (2.4 hours per week
compared with 1.4). In addition to these contextual differences, each intervention was
implemented by a separate local team and was supervised by separate state-level Pratham
leadership.
3 In Appendix C we explore heterogeneity in the program effects on mother and child learning by
state.

10
In each state, 240 hamlets were selected for the randomization. Hamlets were selected
based on a target number of households (the approximate size that could support one
mother literacy class) and geographic distance from other target locations to limit
spillovers. In Rajasthan, where villages are typically far apart, one appropriately-sized
hamlet per village was selected, and the randomization was effectively conducted at the
village level. In Bihar, where hamlets may be close to one another (whether in the same
village or in different villages), hamlets of the target size were included if they were
sufficiently far from other included hamlets.4 For ease of exposition, we refer to the
randomization unit as a “village” throughout.
In each state, 60 villages were randomly assigned to each of the four treatment groups.
Randomization was stratified geographically to allow Pratham to organize its monitoring
structure based on a known number of program villages in each area. The 240 villages in
each state were first divided into geographically proximate “clusters” of 20 villages. These
clusters of villages were further divided into 2 “phases”. These phases determined the
order of the rollout of the programs. The Pratham team rolled out the interventions in
Phase 1 villages and began in Phase 2 villages approximately 3 weeks later. The
randomization was stratified by the resulting 24 groups of 10 villages in each state.
Assignment within each cluster of 20 villages was balanced such that each intervention
was implemented in exactly 5 villages.
Three interventions were designed and implemented by Pratham in each location. Each
was implemented for approximately one year. Recruitment of mothers for each program
was targeted towards a set of women in each village with children aged 5 to 8. These
mothers were targeted in order to maximize precision of estimated effects on children just
beginning formal education. It was hypothesized that the programs would have the
greatest effects on children that were just beginning to develop the most basic reading and
math skills. Within each village in the sample, a census was conducted to determine a list
of target mothers. Twenty-two mothers of children aged 5 to 8 years old were randomly
selected to be targeted. If there were fewer than 22 such mothers in the village, all
mothers were targeted. On average, there were 18.5 mothers in each village in the study.
The targeting strategy used in the evaluation may differ from that used in other adult
literacy programs. For example, the Sakshar Bharat program typically recruits women
from the vicinity of the teacher’s home who are interested in attending. In our case, it was
not possible to use a sample of this type, because gauging interest was difficult without
actually holding classes to see which mothers would attend. When asked directly, almost
all women said they were interested in the classes. Instead, we decided to recruit a fixed
set of mothers who would be interested. Additionally, because adult literacy programs
typically have low takeup, we decided to focus on mothers with young school-aged
children.
4 Appendix A details the location selection procedure within the study blocks.

11
While our recruitment strategy was designed to be simple and replicable, the particular
strategy may result in different impacts from other programs with different recruitment
strategies. For example, without explicit targeting, only the most motivated mothers may
attend, and this might have more impact on them or their children. Alternatively, a
strategy that targeted different types of women could have different effects on mothers of
young children if it changed the composition of the classes. In actuality, classes typically
consisted of both targeted and non-targeted women, but we cannot rule out that our
targeting strategy created a particular class composition that in turn affected the results
on the targeted women.
The Mother Literacy (ML) intervention consisted of daily literacy classes held in the
villages. In each location, a volunteer was recruited from the community to teach classes
for two hours per day at the time and place that was most convenient to interested
women. Volunteers utilized a version of Pratham’s Read India methodology. This approach,
shown effective in teaching children to read Banerjee et al. [2010], was modified to suit
the interests of adults. While ML classes were open to any who wished to attend, pratham
staff and volunteers were given a list of target mothers to recruit into the classes.
The Child and Mother Activities Packet (CHAMP) intervention was designed to engage the
mothers at home with their children’s learning. Once per week, a Pratham staff member
visited each target mother and gave her a worksheet to help her child complete. Mothers
were also given instruction on how to review her child’s school notebooks, discuss child
learning with her child’s school teacher, and encourage the child to do schoolwork at
home.
The combined intervention (ML-CHAMP) included both the ML and CHAMP interventions.
The combined intervention was not integrated—both interventions were simply conducted
in the same villages with the same target group of mothers.
3 Conceptual Framework and Theory of Change
This section presents a conceptual framework and theory of change for the ML and
CHAMP interventions. Although the focus in this section is on how the programs can
influence child learning, we recognize that some of the “intermediate” outcomes in the
framework—in particular, mother learning and empowerment—could themselves be
important policy objectives.
3.1 Conceptual Framework
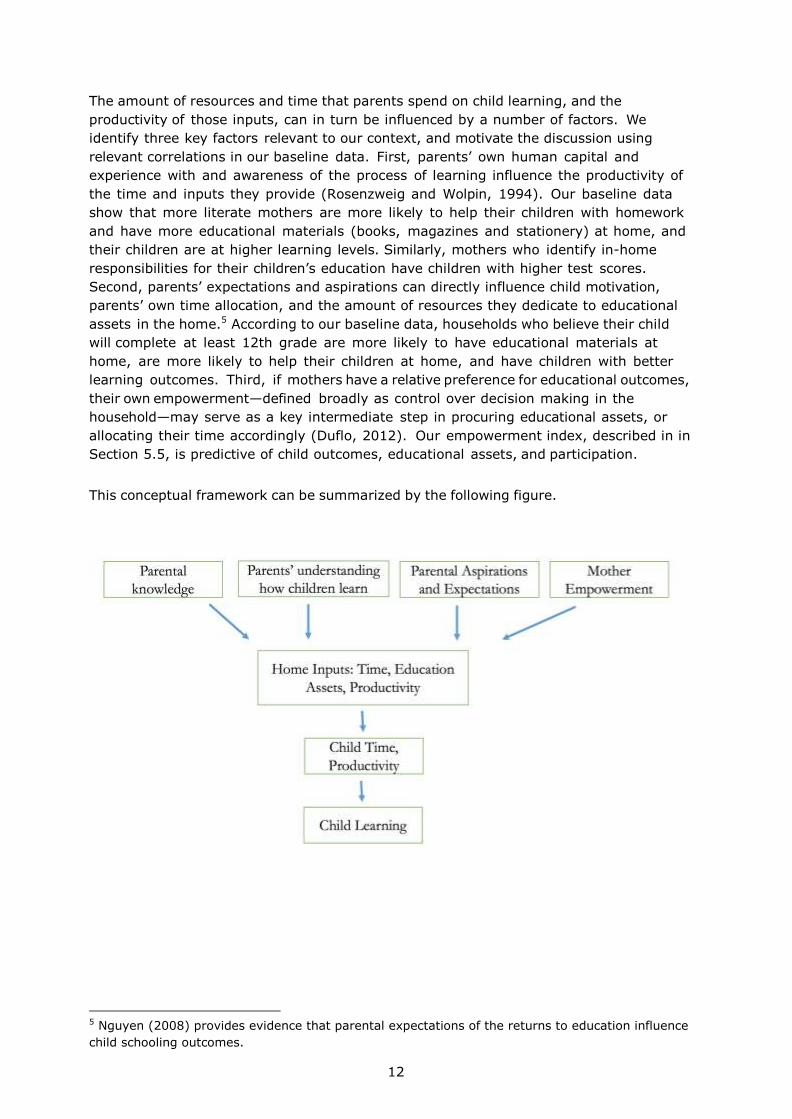
In theory, the amount children learn at home is a function of the time they spend on
educational activities and the productivity of that time spent. The factors that could
contribute to both time and productivity are quite similar: child preferences, the
educational inputs or assets available, time parents spend monitoring educational
activities and/or directly instructing, and the productivity of the time parents spend. In
other words, children will likely spend more time learning and be more productive learners
when their parents dedicate resources and productive time to their education.
12
The amount of resources and time that parents spend on child learning, and the
productivity of those inputs, can in turn be influenced by a number of factors. We
identify three key factors relevant to our context, and motivate the discussion using
relevant correlations in our baseline data. First, parents’ own human capital and
experience with and awareness of the process of learning influence the productivity of
the time and inputs they provide (Rosenzweig and Wolpin, 1994). Our baseline data
show that more literate mothers are more likely to help their children with homework
and have more educational materials (books, magazines and stationery) at home, and
their children are at higher learning levels. Similarly, mothers who identify in-home
responsibilities for their children’s education have children with higher test scores.
Second, parents’ expectations and aspirations can directly influence child motivation,
parents’ own time allocation, and the amount of resources they dedicate to educational
assets in the home.5 According to our baseline data, households who believe their child
will complete at least 12th grade are more likely to have educational materials at
home, are more likely to help their children at home, and have children with better
learning outcomes. Third, if mothers have a relative preference for educational outcomes,
their own empowerment—defined broadly as control over decision making in the
household—may serve as a key intermediate step in procuring educational assets, or
allocating their time accordingly (Duflo, 2012). Our empowerment index, described in in
Section 5.5, is predictive of child outcomes, educational assets, and participation.
This conceptual framework can be summarized by the following figure.
5 Nguyen (2008) provides evidence that parental expectations of the returns to education influence
child schooling outcomes.

13
Although it is not shown in the figure, there may also be feedbacks across the various
sources of home inputs. For example, human capital, experience, and awareness may
also influence parental aspirations, as well as relative empowerment. In our baseline,
literacy, education level and awareness of activities, are all correlated with aspirations and
our empowerment index.
3.2 Theory of Change
One driving assumption behind ML and CHAMP is that mothers in particular have a
preference to help their children learn, but lack the skills, awareness and/or experience
to do anything at home, and therefore do not dedicate as much productive time or
resources. Nearly every mother in our baseline reported that the parents could do more
(than sending their kids to school) to improve learning. Eighty-six percent of mothers
reported that parents have specific responsibilities toward their children’s education
(beyond sending them to school). However, only one-third listed any in-home activities
(spending time, telling stories, helping with, checking, or monitoring the completion of
homework) that might help. Thirty percent reported that they did not know what
responsibilities parents might have.
By design, ML was intended to directly influence the human capital of mothers—the
skills. Classes focused on basic literacy and numeracy. Through an increase in these
skills, the productivity of time and inputs that mothers provide to their children would
increase. Specifically, if more numerate or literate, mothers would better understand the
concepts their children are learning, and can therefore use that knowledge to teach
children directly as a supplement to school work. These classes could also give mothers
experience in the process of learning as adults. While different from child learning (e.g. it
doesn’t involve the formal education system), mothers may still be able to translate their
own experience of learning into an understanding of how children learn. For example, a
better understanding of the importance of practicing concepts could induce mothers to
motivate and monitor their children at home.
CHAMP was intended to increase mothers’ awareness of the process of learning, time
spent, and assets available in the home, but not human capital nor preferences directly.
Parents were given materials and guidance on how to interact with their kids at home to
foster child learning. In this case, the theory is that if mothers were given specific
materials and instructed on activities known to promote learning, they would be able to
mimic the environment and interactions that children of more educated parents have.
Again, this increase in awareness is intended to increase the inputs and productivity of
inputs that mothers provide. CHAMP could also improve the human capital of mothers.
While not directly giving instruction on how to read, write or do math, the interaction—
both with Pratham staff and/or with their own children—may result in mothers learning.
These interventions could influence preferences, aspirations, and expectations as well. In
ML, direct exposure to the process of learning could increase mother interest in child
learning and their aspirations for their children. In CHAMP, mothers may similarly
increase their perceptions of the value of their children’s education through their
involvement in child learning.

14
Either intervention could also promote a sense of empowerment. To the extent that ML
and CHAMP influence mother learning, this could increase mothers’ ability to make
decisions related to education or household decisions more broadly. Through direct
exposure to a classroom environment, ML could also provide skills and confidence to make
education decisions within the household. Although CHAMP provides exposure to the
learning process through a slightly different mechanism, this exposure could similarly
make mothers more empowered to make education decisions. In addition, by providing
skills to mothers and exposure to education, both interventions could increase mother
aspirations for daughters relative to sons.
Finally, either ML or CHAMP could also affect child learning directly. If children attend the
ML classes (along with, or in place of mothers), it could influence children’s own
motivation, the time they spend on educational activities, and the productivity of that
time. If children are present when CHAMP material and activities are being demonstrated,
this could impact their productivity, time and preferences, independent from interacting
with their mother.
4 Data collection
Baseline data were collected from selected households at the onset of the interventions,
and endline data were collected after approximately one year. Data collection consisted
of standardized tests and household surveys.
The standardized tests, designed to evaluate a basic set of Hindi and math skills, were
developed by the ASER Centre, Pratham’s research arm and were an expanded version of
the ASER Centre’s standard assessment tool used each year in their Annual Status of
Education Report.6 At the baseline, the tests were administered to all eligible mothers,
target children, other children in the household in grades 1 to 4, and children aged 4
and below who were going to be enrolled in school in the next year. The endline testing
included all mothers and children tested at baseline, in addition to the remaining children
who were aged 3 or 4 at the baseline. These tests were scored on a 20-point scale for
children in both the baseline and endline, a 24-point scale for mothers at baseline, and a
28-point scale for mothers at endline. The mother test was the same as the child test, but
included several additional questions that related to the material taught in the mother
literacy classes. Minor additions and deletions were made in the testing instruments
between baseline and endline. For the purposes of the analysis, test scores were
normalized based on the control group means and standard deviations in each round of
testing, separately for mothers and children.
In addition to the primary standardized testing instruments, at the baseline other
household members were given very short tests designed to quickly assess whether they
could read simple sentences and do basic subtraction.
6 The ASER tool is used in the ASER Centre’s national assessments of child learning and is
administered to approximately 450,000 children annually (ASER Centre, 2013).

15
The household surveys were administered to eligible mothers. The baseline contained
modules on basic household demographics, asset ownership, schooling status of children
in the household, mother perceptions of education, and mother’s time use. In addition,
questions were asked about the time use of the child aged 5-8 in the household (in the
cases where there was more than one such child, one was randomly selected). The
endline survey repeated the measures of the baseline survey, with the exception of
demographics, and included additional questions on empowerment.
Table 1 contains descriptive statistics from the baseline tests and surveys and
compares the means of the variables between each treatment group and the control
group. Out of 60 comparisons performed, 6 are significant at the 10% level, and 3 are
significant at the 5% level. No variable is jointly significantly different at the 10% level
between the 3 treatment groups and the control group (not shown). On the whole, this
suggests that the randomization was successful in creating comparable groups.
Appendix Table 2 details weighting procedure and the weighted test scores for each
question on the test. The average baseline mother scores on the test were 3.0/10 for
reading and 3.1/14 for math. Mothers scored the highest on the most basic
competencies on the test, such as picture recognition, letter recognition, writing one’s
own name, and number recognition. Child scores averaged 2.9/10 in reading, and 2.9/10
in math. As with mothers, children scored the highest on the most basic competencies.
Out of 8857 mothers tested at baseline, 8552 (97%) were re-tested for the endline. Child
tests are available for 14,575 out of 15,502 (94%) of children tested at the baseline.
5 Results - Mothers
5.1 Estimating Equation
Throughout the analysis we utilize the following estimating equation:
(1)
In this equation, Yihv is the outcome for individual i, in household h, in village v. ML,
CHAMP, and MLCHAMP are dummies indicating the treatment status of the village. Y01 is
the baseline value of the outcome of interest (when measured). G is a dummy for
stratum, as described in Section 2 above. εiv is the individual error term, clustered by
village, the level of randomization.

16
5.2 Program Take up
Take up of the mother literacy classes is analyzed in Table 2. Compared with the control
group, approximately 32% more mothers in the ML treatment and 37% in the ML-CHAMP
treatment reported ever having attended the classes.7 Children attended the classes as
well. Children were 21% more likely to ever attend in the ML treatment, and 27% more
likely to ever attend in the ML-CHAMP treatment, compared with the control group.
According to our focus group discussions and interviews, mothers reported self-motivation
as a primary reason for attending ML classes. The primary excuses for absence were lack
of free time, a perception that there was little value—some said it was too late for them to
benefit from education, and Pratham should instead concentrate on teaching their
children directly—and lack of support from the rest of the family. By the same token, we
found a similar number of examples where mothers saw value and had support from
family members. The quality and innovation of volunteers appeared to be a critical
factor. For example, one volunteer posted a sign outside with mothers’ names and
attendance. Another would bang a drum in the village before every class. At the other
end of the spectrum, when volunteers were less motivated, mothers in one-on-one
interviews blamed irregularity of classes as a reason for not attending.
In Table 3 we quantitatively analyze the determinants of mother take up of mother
literacy classes in the ML and ML-CHAMP treatments. We regress attendance in the
classes on set of variables including household characteristics, child schooling behavior,
mother education, mother experience with literacy classes, work behavior, empowerment
and participation in child learning. Column 1 includes a dummy for the state of Bihar,
while Column 2 includes the full set of stratification unit dummies.
Household composition could affect demands on a mother’s time (in the case of very
young children), mother’s interest in improving child learning (primary-aged children)
and other household resources that could free mother’s time (in the case of older
household members). However, we little no evidence of a relationship between take up
and our three measures of household composition. Mothers of primary-aged children
are 1-2 percentage points more likely to attend, although the coefficient is significant at
the 10% level in one of the two specifications. We also find no evidence for a relationship
between mother weekly housework or market work hours and take up. We find weak
evidence that mothers with children in school are slightly more likely to attend, but child
test scores are not significantly related to take up. Mothers are, however, 7% less likely
to attend when their children are in private school. In this case, mothers who are already
sending their children to private school may not see the classes as important to
supporting child learning.
7 It is important to note that 7 percent of mothers in the control group attended classes. There are
three potential explanations for this non-compliance. First, some control group mothers could have
attended some classes in treatment villages. Second, a government program “Saakshar Bharat” that
was conducted in the spring of 2012 in 11 villages in Bihar. Research staff monitored this program
carefully. Where they were set up, classes were held for approximately one week, and were held in
both treatment and control villages. Finally, some mothers may have misunderstood the survey
question.

17
The relationship between mother education and attendance is non-monotonic: mothers
are more likely to attend when they have some education, but more years of education
makes them less likely to attend. In addition, mothers scoring higher on the baseline test
are significantly more likely to attend the classes. Taken together, these results suggest
that mothers are more interested in attending when they have some education, but the
classes are not attractive at higher levels of education. Because the test only covered
the most basic competencies, this implies positive relationship between test scores and
attendance over the levels covered by the test, but attendance could be lower for women at
higher-level competencies.
Mother experience with literacy classes in the past is a strong predictor of attendance in
the Pratham classes: mothers who have attended in the past are 8% more likely to attend
during the intervention. Similarly, members of a self-help group are 9-10% more likely to
attend, implying that mothers with experiences meeting in groups of women are more
comfortable attending.
Finally, mothers in Bihar had 11% higher take up than those in Rajasthan. This mirrors
Pratham and research staff observations that mothers were on average more motivated and
had more time to attend, and volunteers were more readily available to teach in Bihar. In
Column 2 of Table 3, we replace the dummy for Bihar with the 48 stratification unit
dummies. As indicated above, the stratification unit varies both by geographic area and
implementation phase. In this case, differences in take up could be driven by geography,
Pratham staff and volunteer characteristics, and perhaps by slight changes in
implementation across phases. The stratification unit dummies are highly jointly significant,
implying that implementation or geographic differences did affect take up.
CHAMP was a door-to-door intervention where Pratham staff visited each mother in her
household. Although complete data on CHAMP take up is pending, administrative data
from Rajasthan implies that 97% of mothers were visited at least once, and mothers
were visited 12 times during the year, on average. In most villages 15 sessions were
held, and the average attendance rate is 82% across all targeted mothers. Interviews
with parents suggested that the inherent interest and ability of the child were key
determinants parental engagement. Some identified child lack of interest and lack of
ability as the reason they did not invest in the process. Others were less involved because
their child was “sharp” and able to complete the worksheets on her own. These parents
often felt that their primary responsibility was to monitor that the worksheets were
completed, and not necessarily to explain the activities.

18
5.3 Test Scores
Turning to the results on mother learning, Table 4 presents the effect of the treatment
groups on mothers’ normalized test scores. All three programs had statistically significant
impacts on literacy, math and combined test scores. The Mother Literacy program
improved mother test scores by 0.09 standard deviations in Hindi and 0.12 standard
deviations in math, and 0.11 standard deviations overall. The last column in the table
presents instrumental variables estimates of the effects of take up of the program on
learning, instrumenting take up with assignment to the ML treatment. To account for
spillovers within households, “take up” is defined as either the mother or the child
attending a class at least once. Using this method, the effect of takeup is 0.33 standard
deviations overall.8 We note that in our context, a number of control mothers did attend
classes, thereby not complying with the original treatment assignment. Therefore, the IV
estimate represents the effect of class attendance on test scores only for the mothers who
were induced to take up the classes because they were in an ML village rather than a
control village. This estimate is valid under monotonicity: that is, we must assume that
mothers who would have attended in the control group were not less likely to attend by
virtue of being assigned to the treatment group. This assumption would be violated if, for
example, mothers preferred to attend classes in villages other than their own. However,
because social ties tend to be stronger within villages, rather than across villages,
monotonicity is likely satisfied in this case.
The CHAMP program improved mother test scores as well. Test scores improved by
0.04 standard deviations in Hindi, 0.07 standard deviations in math, and 0.06 standard
deviations overall.
The effect of the combined intervention on total test scores was 0.15 standard deviations.
While this is slightly lower than the sum of the effects of the ML and CHAMP
interventions, we cannot reject that the ML-CHAMP effect equals the sum of the effects
of the two individual interventions (p-value = 0.335).
Appendix Tables 3 and 4 display the treatment effects on each question of the test for
language and math, respectively. For comparability across questions, the maximum score
for each question is re-scaled to 1. On the language portion of the test, ML and ML-
CHAMP interventions had the largest effects on more basic skills such as reading letters,
reading simple words, and writing the mother’s name. For example, mothers in the ML
group were 3.5 percentage points more likely to be able to read letters, while mothers in
the ML-CHAMP group were 4.7 percentage points more likely to read letters, compared
with the endline control group mean of 17.3%. The point estimates for CHAMP, on the
other hand, were modest and positive (about 0.5 to 1.5 percentage points) on most
questions, although most of the estimated effects are not statistically significant.
8 Note that the exclusion restriction in the IV estimation assumes that the mother literacy classes
influenced learning only through attendance in the classes. This assumption would be violated, if, for
example, mother learning was influenced by the attendance of other members in the community.

19
On the math portion of the test, all three interventions had the strongest effects on the
number recognition questions, the most basic skills tested. For example, the mothers’
ability to identify digits 1-9 was 7, 3 and 11 percentage points higher in ML, CHAMP, and
ML-CHAMP, respectively, compared to the control group mean of 47%. Interestingly, all
three interventions also had statistically significant effects on the mother’s ability to
complete the division word problem in addition to the more basic math skills. This
suggests that either classes attracted some relatively more numerate mothers, or that
the programs were particularly effective in “mental math” (i.e. solving word problems) in
addition to the more basic skills.
The fact that the interventions affected more basic skills is supported by our qualitative
observations. In focus groups, mothers in ML classes identified basic skills such as the
ability to write their own name and those of family members, and the ability to dial
numbers on a cell phone as the primary skills they expected to learn. In CHAMP,
qualitative observations suggested that were more actively engaged in understanding
basic activities on the worksheets, rather than simply monitoring their children’s work.
This could explain why CHAMP improved mothers’ basic number recognition.
5.4 Intermediate Outcomes
The programs could have affected mother learning through a variety of channels. In
addition to the more direct effects that mother literacy and child participation could have
had on mother learning, there are a number of indirect channels. Section 6 analyzes
changes in the home environment, including education assets at home (e.g., books,
slates) and mothers’ involvement in child learning. We find that the programs did increase
both assets and mothers’ involvement in child learning, both of which could have had
feedbacks to mother learning.
We also find evidence that the programs induced others in the households to help the
mothers learn. Table 5 analyzes whether the mother reported learning various skills
from family members. We find that significantly more mothers in the ML and ML-CHAMP
treatments reported learning any of the skills from family members, from 21% in the
control group to 26% in ML and ML-CHAMP. For the CHAMP interventions, we find smaller
coefficients, and the coefficients are significant only for learning about counting and
counting change.
5.5 Empowerment and Time Use
This subsection examines the effects of the programs on women’s empowerment and time
use. These indicators are both potential channels through which the program could have
affected mother and child learning, as well as important outcomes in and of themselves.

20
We first turn to the effects of the programs on women’s empowerment. We include 19
variables from the survey instrument reflecting a number of underlying aspects of
empowerment. First, we include a set of variables reflecting the mother’s ability to make
decisions and carry out tasks on her own. Second, we include a set of variables indicating
whether the mother is involved in certain household decisions. Third, we include a set of
variables reflecting beliefs about own and daughters’ education. Finally, we include a
measure of happiness.9
Using these variables, we construct an index of empowerment using the methodology
from Kling et al (2007). Each variable is normalized by subtracting the control group
mean and dividing the result by the control group standard deviations. The resulting
normalized variables are then averaged to create the index. We construct separate
indices for both the baseline and endline. The baseline index contains fewer elements
than the endline index, as additional empowerment questions were added to the endline
questionnaire.
Table 6 presents the program effects on the index and its components. Using our index, we
find positive and statistically significant impacts of each of the three treatments on
empowerment. The estimated effects of the ML and CHAMP programs were both 0.04
standard deviations, both significant at the 5% level. Turning to the components of the
index, both the ML and CHAMP interventions had significant impacts on whether the
mother counts change, beliefs about adult daughter’s choices, and beliefs that the
mother should be responsible for her children’s education. The ML intervention also had
impacts on several variables more directly related to mother literacy and math (the
mother signing her name, considering herself literate, the value of goods she could buy),
and beliefs about a wife’s level of education relative to her husband. The CHAMP
intervention had a significant impact on leaving the village without adult accompaniment
and a small negative impact on self-help group membership.
We next turn to the effects of the programs on women’s time use. Andrabi et al. (2012)
find that women with more education spend more time with their children. In Table 7,
we examine whether the ML, CHAMP and combined programs affect mother time use in
this manner. Across all measures, we see little evidence that the programs impacted time
use. The combined interventions increased weekly hours spent on paid work by 1 hour per
week (significant at the 10% level), and livestock work by 0.5 hours per week (significant
at the 5% level). These effects could be a result of increased productivity brought about by
the interventions. Because of the number of comparisons made in this table, these results
could have arisen due to pure chance.10 Indeed, we fail to reject that all 33 coefficients in
the table are zero (p-value: 0.38).
9 We note that involvement in work activities could also arise as a result of empowerment, or it could
provide a greater sense of empowerment (Duflo, 2012). We do not include work in our index, as our
available measures do not include detail on the type of work or on women’s own earnings. 10 These effects could also be the result of increased productivity working, either through an increase
in literacy or numeracy, or through increased interactions with volunteers or other women. In
addition, increases in empowerment could have led women to work more. However, this was not an
expected result, and we have somewhat limited data on labor supply to explore the mechanisms.

21
6 Results - Children
6.1 Test Scores
Table 8 presents the effects of the treatment groups on child test scores. All children
tested at the endline are included in this table, including the younger children not tested at
baseline. The regressions include a dummy variable for missing values of the baseline test
scores.
All three interventions had significant impacts on math skills: the effect size is 0.04
standard deviations for ML, 0.05 standard deviations for CHAMP, and 0.07 standard
deviations for ML- CHAMP. The effects of ML and CHAMP on literacy and cumulative scores
are not statistically different from zero. However, ML-CHAMP had statistically significant
effects on literacy (0.05 standard deviations), and cumulative scores (0.06 standard
deviations).
The last column of Table 8 follows the mother test score results in Table 4 by presenting
instrumental variables estimates of the effect of a mother or child attending the ML
classes on child learning. The IV estimate of the effect of attendance is 0.11 standard
deviations for math and is significant at the 5% level. Because the reduced-form
estimates are not significant for literacy or cumulative test scores, it is not surprising that
the IV estimates are not significant at conventional levels.
Appendix Tables 5 and 6 disaggregate the test score effects by individual question. As
with the mother results, we re-scale the questions so that the maximum possible score
for each is 1. The results for language are displayed in Appendix Table 5. The ML
intervention did not have a statistically significant impact on any competency, and the
estimated magnitudes are very small and inconsistently signed. For the CHAMP
intervention, the magnitudes of the coefficients on each question is positive, but none
reaches statistical significance. The ML-CHAMP intervention had positive and statistically
significant impacts on the child’s ability to read letters, matra (more complex) words, and
paragraphs.
Appendix Table 6 displays question-wise results for math. Across all three interventions,
the largest effects are concentrated in the more basic number recognition questions. For
example, child scores were 2.3, 4.0 and 3.9 percentage points higher on the question that
asked the child to identify the digits 1 to 9, compared with the endline control group mean
of 56.0 percent.
From discussions with mothers, volunteers and Pratham staff found that there was more
demand from mothers to learn math. This could have driven the stronger child results for
math, in that mother enthusiasm for learning math could have led mothers to engage more
with their children in math.

22
6.2 Intermediate Outcomes
This section analyzes impacts of the treatment groups on intermediate outcomes. We
start by discussing outcomes that relate to learning outside of the home. Table 9
presents the impacts of the programs on school participation. We find no evidence that
the individual programs affected current enrollment, regular attendance or recent
absences, although we find a small positive impact on school attendance of the combined
program. Finally, we find a statistically significant increase in monthly tuition expenditures
for the ML group, but the effects are smaller and statistically insignificant in the ML and ML-
CHAMP groups. On balance, this table shows limited, if any, impacts of the interventions
on schooling outcomes. We note, however, that enrollment is relatively high among our
study population. In interviews, many parents claimed that the most they could do within
the formal schooling system is send their children to school and cited poor quality and
poor access as barriers they could not overcome.11
We next turn to a set of indicators of the mother’s participation in the child’s schooling.
We include 9 measures of mother involvement, including indicators of school visits,
helping with homework, and talking to the child and others about the child’s studies. We
construct an index of mother involvement using the 9 measures, following the procedure
outlined above. These survey questions were asked about the randomly selected child,
and hence the sample size is equal to the sample of mothers.
Table 10 presents the results on mother involvement. We find positive and statistically
significant impacts of all three programs on the index of indicators. The magnitudes are
approximately 0.04 for ML, 0.07 for CHAMP and 0.05 for ML-CHAMP. While both ML and
CHAMP had statistically significant impacts on the mother looking at the child’s
notebook, talking to the child about studies and talking to others about the child’s
studies, CHAMP had impacts on the mother knowing whether the child received homework
and on helping her child with homework. This is encouraging given qualitative
observations from early in the intervention which suggested that mothers in CHAMP
villages were learning how to monitor CHAMP worksheets, but were not transferring the
skills over to school homework.
11 While one father expressed dissatisfaction with the schooling system, claiming “”like any
government employee, the teachers don’t do any work...the best solution is to send the children to
private school,” he lamented that “there is no private school in the vicinity, so they are still studying
[at the government school].” One mother explained, “even if the teachers taught for a couple of
hours in a day, our children would at least learn something,” and later expressed that “all [Pratham]
could do [to help] is spend money and send [her child] to a better school.” Another mother
complained “she and her husband want to shift [their children] into a private school. [But] there is
no private school nearby so they are contemplating their options.”

23
We next examine impacts on child time use. Table 11 presents the estimated impacts of
the program on the child’s weekly time use. Overall, there were very few impacts. The
combined ML-CHAMP intervention increased time spent on homework by 0.3 hours per
week, statistically significant at the 5% level. While the effects of the individual
interventions fail to reach statistical significance at the 5% level, the magnitude of the
CHAMP effect is 0.2 hours per week, significant at the 10% level, suggesting that the ML-
CHAMP effect could be driven primarily by CHAMP. The ML and ML-CHAMP interventions
also have significant impacts on time spent in household business. An increase in labor
supply of children is similar to the labor supply increases found in the time use analysis
for mothers. In the case of children, increases in labor supply could be due to
complementarities with mother labor supply, or because the interventions made children
more productive in household businesses. As with the mother labor supply results,
however, more work is needed to understand the mechanisms behind these impacts.
Table 12 presents the treatment effects on the presence of education assets in the home.
These assets include pencils, school books, other books, newspapers/magazines, and
slates. For the ML intervention, the only statistically significant effect is on the
presence of schoolbooks, with an estimated magnitude of 0.018. The CHAMP
intervention, on the other hand, had a statistically significant effect on the presence of
pencils, school books, other books, and newspapers/magazines. The combined
intervention increased the presence of school books, other books, and slates. (Note that
pencils are present in 95% of comparison group households, so minimal of movement on
this indicator is unsurprising.)
Finally, in Table 13 we turn to a set of indicators that reflect mother aspirations for their
children and perceptions of child reading ability. We do not find statistically significant
impacts of any of the interventions on the highest grade that the mother aspires her
child to pass. In interviews mothers often reported inherent child ability and future
achievement as given, and not something they had much control over. We do find that
the CHAMP and combined interventions increased mother perceptions of her child’s
reading and math ability. When compared to the child’s actual ability, however, the
CHAMP and combined programs caused mothers to be overly optimistic: the absolute
difference between the mother’s perception and measured child ability increased for the
CHAMP and combined interventions.
7 Impact Heterogeneity
We use the following estimating equation to examine heterogeneity in treatment effects:
In this equation, Vari is the interacted variable, and the remainder of the variables are
defined as in equation (1).

24
7.1 Mothers
Table 14 examines heterogeneity in treatment effects of the interventions on mother test
scores. We focus on heterogeneity by the state where the intervention took place, the
mother’s baseline score, mother’s age, and mother’s education level.
The first three columns of Appendix Table 7 examine heterogeneity by state. There is
evidence that the ML and ML-CHAMP interventions were more effective in Bihar. For
example, the effects of the ML intervention were 0.02 standard deviations higher for
language, 0.13 standard deviations higher for math, and 0.09 standard deviations higher
for composite scores in Bihar compared with Rajasthan. The latter two results are
significant at the 1 percent level. Similarly, the ML-CHAMP intervention increased
language, math, and combined scores by 0.08, 0.12, and 0.11 standard deviations more
in Bihar than in Rajasthan. There are no significant differences in treatment effects across
states for the CHAMP intervention. The greater effectiveness of the ML and ML-CHAMP
interventions in Bihar is consistent with the fact that mothers were 10% more likely to
attend the classes in Bihar (see Section 5.2).
Columns 4 through 7 of Appendix Table 7 examine heterogeneity by mother’s baseline
test score. Although mothers did take up the mother literacy classes more often at higher
test scores, there is little evidence that ML and ML-CHAMP were more effective for
mothers with higher or lower test scores. ML-CHAMP increased composite scores
significantly more for mothers who scored lower at the baseline, but the interaction
effects on the disaggregated language and math scores are insignificant and
inconsistently signed. On the other hand, the CHAMP intervention was significantly more
effective for mothers with higher initial test scores. This result implies that a basic level
of literacy and numeracy was helpful for mothers to improve their own learning in
CHAMP.
The remaining columns of Table 14 examine heterogeneity by mother age and education
level. Here, there are few significant interaction effects, and the magnitudes are small.
There is evidence that ML-CHAMP was more effective for less-educated mothers in
increasing math and composite scores, although these interactions are not reflected in
either the ML or CHAMP interventions.
7.2 Children
Tables 15a and 15b examine heterogeneity in treatment effects on child test scores.
Appendix Table 15a uses the same set of variables that were used in the analysis for
mothers. Overall, there is little evidence of heterogeneity by any of these variables.
Unlike the effects found for mothers, there is no significant heterogeneity by state,
although the point estimates do suggest that ML and ML-CHAMP were more effective in
Bihar. Children with older mothers had significantly stronger effects of the ML
intervention on math and composite scores.

25
Table 15b examines heterogeneity by child age, child baseline score, and gender. Again,
there are few large or statistically significant effects. There is some evidence that ML-
CHAMP was more effective for older children in improving literacy and composite scores.
The only other statistically significant interaction in the table suggests that lower-scoring
children performed better in math in the ML-CHAMP intervention, although this
heterogeneity is not reflected in language or composite scores.
8 Internal and External Validity
8.1 Internal Validity
As a randomized evaluation, we are fairly confident of the internal validity of this study.
In theory, the intention to treat estimates could be biased by (1) initial imbalance of the
treatment and control groups (2) attrition, and (3) spillovers or crossovers. As described
in Section 4, the treatment and control groups were balanced from the onset. Attrition
was also very low. Out of 8857 mothers tested at baseline, 8552 (97%) were re-tested
for the endline. Child tests are available for 14,575 out of 15,502 (94%) of children tested
at the baseline. Last, spillovers and crossovers were largely contained by the unit of
randomization. If spillovers and crossovers were indeed a problem, our intention to treat
estimate would give us the lower-bound of the (internally-valid) impact of the program.
8.2 External Validity
The success of a program depends on the interaction of (a) the concept, (b) the
implementation, and (c) the context. Its external validity depends on how these same
factors interact in new areas where the program is implemented.
The concepts being tested here are specific adult and family literacy program models.
One question is whether this model is “gold plated,” or alternatively, replicable and
scalable. The model relies on four main factors: (1) the pedagogy and material; (2) the
recruitment, training, retention and motivation of local Pratham staff (for village
mobilization, CHAMP implementation, and monitoring); (3) the recruitment, training,
retention and motivation of volunteers to run Mother Literacy classes; and (4) the
recruitment, retention and motivation of mothers.
The pedagogy and material are replicable. In fact, they would likely be improved in
future iterations of the program. During the first few months of classes, material was
used that was later deemed ineffective by the program team. In theory, if replicated,
these mistakes could be avoided. Some of the material designed for this program was
given to Bihar for its state-wide adult literacy campaign.
The recruiting methods used were not unlike the methods used by Pratham in its other
interventions. Pre-intervention mobilization lasted, on average, 2 days per treatment village
for Pratham staff and 2 days per treatment village for mothers. However, Pratham is
particularly skilled at mobilizing communities and, in particular, volunteers. It is unlikely
that a government-run program could extract similar levels of intrinsic motivation (to
work and volunteer). That said, modest monetary incentives could be used to generate
sufficient labor supply.

26
One aspect to note is that the interventions targeted mothers of children aged 5-8,
and our effects are estimated for this group. These mothers were identified based on a
village census conducted by the research team. The target criterion was chosen in order to
maximize power to detect effects on this group of children, as it was hypothesized that
these children would be most likely to experience effects of the programs. In order to
replicate the interventions with the same target group, an implementer would have to
identify this group, either through a community census or through other means. Doing
so is likely not cost-prohibitive, as children and their mothers could be identified either
through schools, or through door-to-door interactions within the community rather than
through a formal census.
If a more broad set of women was targeted, our estimated effects would not necessarily
apply to women of other age groups or those with other characteristics. However, our
estimated effects would apply to targeted mothers of young school-aged children,
provided that the spillovers across targeted women are similar across the different
targeting mechanisms.
Retention and motivation may be the most difficult aspects to replicate—particularly of
staff and volunteers. However, both motivation and retention were major challenges for
this program, and would likely be a challenge for others. Here, financial incentives could
actually be more effective than the volunteer model. While altruistic motivation could
wane, especially as the novelty wears off and challenges arise, financial incentives would
be contingent on retention, and could be made contingent on performance.
Overall, each intervention spent $17-40 per mother for an 11-month intervention. The
cost is therefore unlikely to be prohibitive for scaling up.
It would be difficult to suggest that the implementation of this program was exceptional.
The largest challenges to implementation involved the timely production of material,
retention of volunteers and mothers, and determining the right period to hold classes. For
example, harvest-time classes could only be held at night (if at all). And night-time
classes required external sources of light, which required purchasing solar lamps. A
significant amount of time was spent learning this and procuring lights, resulting in long
periods with no teaching activities. This waste could be easily avoided in future
replications or scale-ups.
Although we argue that the program is replicable, we note that differences in
implementation by different implementing organizations may yield different results. In
particular, because take up and retention of mothers and volunteers was challenging,
organizations that do not monitor implementation of the programs may face much
lower take up. Section 10 provides further discussion of this point, using the example of
Saakshar Bharat, India’s state-run adult literacy program.

27
The intervention locations were purposefully chosen (rather than being randomly chosen,
and representative of a larger geographical area). As discussed in Section 2, Bihar and
Rajasthan were selected by Pratham based on the low literacy levels of the two states
and the differences between the states along other dimensions. The intervention
districts within each state were selected because of existing Pratham programs and
infrastructure in those areas. Within the intervention districts, the blocks were selected
because they did not have any pre-existing Pratham programs. However the specific
blocks do not appear to be outliers relative to the districts or state as a whole.
Households appear similar to state-wide characteristics.
As noted in Section 2, running the interventions in multiple sates in different areas of
the country aids external validity of the evaluation. Although the interventions were
identical in both states, they were implemented by different local teams and supervised
by separate state-level Pratham leadership. And while learning levels in both states were
similar, the differences in wealth and preexisting activities of the mothers presented distinct
implementation challenges in each area.
This suggests that the program may be externally valid to the rest of those two states,
other states with similar characteristics, and in particular, poor and illiterate districts of
other states. There are also poor and illiterate regions outside of India. We are less
comfortable suggesting that these program’s material and pedagogy are appropriate
there. More replication studies in other regions would be useful.
8.3 Cost Effectiveness
This section presents a summary of program costs and a discussion of cost-effectiveness.
Our overall finding is that for child learning, the cost per unit improvement is less than that
of other interventions deemed effective. We note, however, that we find effects along a
number of other dimensions that cannot be explicitly included in the cost-effectiveness
calculation.
As with most cost-effectiveness comparisons across studies, we note that differences in
target population, competencies tested, testing instruments, local prices, and methods of
calculating costs may limit comparability. Our cost-effectiveness calculation follows the
methodology in Kremer, et al. (2013).
We report costs in dollars, converted using the exchange rate as of when the study
began. Panel A of Table 16 provides a breakdown of costs for each program. Because ML-
CHAMP was simply a combination of ML and CHAMP, the costs of ML-CHAMP were
approximately equal to the sum of the ML and CHAMP interventions.

28
We separate the total costs into three components. First, we use the actual cost incurred to
pay for Pratham staff. In the ML program, Pratham staff monitored the volunteers, and in
the CHAMP program, Pratham staff implemented the intervention. Second, we compute the
opportunity cost of the ML volunteers’ time. This is based on the proportion of time spent
on the classes (2 hours per day) and the average wage in non-agricultural occupations
computed from the India Labor Bureau.12 These costs were incurred only in the ML and ML-
CHAMP interventions. Finally, we include costs of training, monitoring and materials. These
costs were substantially higher in the ML intervention than in the CHAMP intervention
because Pratham learning materials were provided to each mother in ML classes. Overall,
as a result of volunteer opportunity costs and higher training, monitoring, and materials
costs, the ML intervention was substantially more costly per targeted mother ($34 for ML
vs. $17 for CHAMP).
To arrive at the standard deviation improvement per child per $100 spent, we divide the total costs
of each program by the total number of beneficiaries and the estimated treatment effects
reported Table 8. The results are displayed in Panel B of Table 16. Following Kremer, et al.,
(2013), we report cost effectiveness only for interventions with statistically significant
impacts on a particular test. CHAMP is most cost effective for math and composite scores,
while ML-CHAMP is most effective in improving literacy.13
To compare our results with a broad set of alternative interventions aimed at improving
child learning, we compare our impact estimates for children with those reviewed in
Kremer, et al. (2013). Our estimates, ranging 0.04 to 0.07 standard deviations, fall
below the range of statistically-significant estimates in the Kremer, et al. (2013) study.
This latter set of estimates ranges from 0.14 standard deviations to 0.6 standard
deviations. Turning to cost-effectiveness, 14 out of the 15 studies in Kremer, et al. (2013)
that found statistically significant impacts are also more cost-effective.
Even though the interventions may be less cost effective than others in improving child
test scores, our study examines and finds impacts on a broad set of outcomes, including
mother learning, women’s empowerment, and the home learning environment. A full cost-
effectiveness analysis would take into account the full set of impacts relative to costs.
However, given the limited number of studies that examine these outcomes, in addition
to a lack of a consistent framework to compare cost-effectiveness along these
dimensions, we are unable to perform this broader comparison. Without an explicit
comparison with alternative interventions, we tentatively conclude that the interventions
studied here are cost-effective considering the broad set of outcomes affected and the
relatively low cost of the interventions (between $17 and $50 per beneficiary
household). Our study should serve as a starting point for future work to deepen the
evidence base so that more explicit cost-effectiveness comparisons can be made in the
future.
12 http://labourbureau.nic.in 13 Panel C of Table 16 shows the results of the equivalent cost-effectiveness calculation for mother
learning. The three interventions produce very similar gains per $100 spent. The ML intervention is
most cost effective for literacy, while the CHAMP intervention is most cost effective for math and
composite scores. As noted in the introduction, our study is the first to provide a rigorous
evaluation of the effects of adult literacy or home input interventions on adult learning outcomes. As
such, we are unable to compare our effects on mothers with those found in other studies.

29
9 Policy Recommendations
The key policy implication of this study is that the ML, CHAMP and combined ML-CHAMP
programs can be an effective tool for policy makers interested in improving child
learning, mother learning, mother empowerment and the home learning environment.
As discussed above, there may be more cost-effective interventions for improving child
learning alone, but we are able to provide rigorous evidence of effectiveness over a much
broader set of outcomes than those studied in the literature on child learning interventions.
We emphasize, however, that replication is crucial for understanding whether these
results apply to other contexts. As discussed in Section 8.2, while performing the study in
two different states using different Pratham implementation teams aids in external validity,
more work is needed to understand whether the effects found here apply to different
populations and different implementing organizations.
In addition to the standard caveats in extrapolating our results to other contexts, we note
that these results are short-term and were taken at the end of one year of
implementation. Through future research, we hope to study longer-run impacts. Many
learning interventions are subject to “fade out” of effects over time (e.g., Banerjee, et al.
(2007)). In many programs, however, the interventions do not produce long-lasting
institutional improvements in school or in the home environment. If the programs
studied here have indeed caused a fundamental shift in the home learning environment,
learning effects could persist as a result.
Our experience has shown that take up, attendance, and general implementation are
critical challenges in these types of programs. Saakshar Bharat, India’s state-run adult
literacy program, follows a similar model to ML. One might therefore expect that a
properly implemented Saakshar Bharat program in the populations studied may have
similar effects to those we find here. However, based on our field observations of Saakshar
Bharat, the program is not implemented very thoroughly. Even though Saakshar Bharat
was scheduled to run throughout our intervention areas at the same time as our
programs, our field teams noted little to no Saakshar Bharat activity in these areas once
teachers had been recruited. Thus, while our study shows that these programs can be
effective when implemented properly, the planned process of implementation is not always
followed.
10 Conclusion
Adult literacy and participation programs are increasing in popularity, frequency, funding
and influence—particularly in developing countries. Proponents and policymakers draw an
explicit link between the education of parents and child welfare outcomes when
advocating for such programs. The underpinning theory starts with the observation that
parent levels of education are strongly correlated with child outcomes, and draws on
further evidence that the relationship is causal (rather than due to other factors such as
inherent ability, or cultural preferences, which could lead to both outcomes
independently). Educating parents in adulthood, the theory goes, will shift preferences
toward demanding more quantity of education and of higher quality, household
resources toward more educational assets at home, time allocation toward more time
educating their children at home, and increased productivity of that time. However,
there is very little rigorous evidence on whether these programs are actually effective in
the developing country context.

30
We show that an adult literacy and a participation program targeting mothers in rural
India were effective at “educating parents”—improving mothers’ basic literacy and
numeracy skills. These programs also had an impact on measures of women’s
empowerment, educational assets in the home, and the participation of mothers in child
learning. Lastly, they improved learning levels of younger school-aged children. Literacy
classes were more effective at educating the mothers than the participation program,
while the participation program was most effective at improving child learning outcomes.
The results on learning (for mothers and children) were highest when the two
interventions were combined, suggesting that the two interventions are at least additive,
and not substitutes.
We find that the programs influenced a number of intermediate outcomes that could in
turn have affected child learning. However, we cannot isolate the most important of these
factors in the effectiveness of the programs. Understanding the importance of the each
mechanism is a key area for future research. Nonetheless, our evaluation shows that
literacy and participation programs can impact both mother and child learning. This is
encouraging evidence for policy- makers looking to improve adult and child learning, as
well as the education environment in the home.
31
11 References
Adult literacy: An update, 2008, Department for International Development Briefing
Abadzi, H., 2003. Adult literacy: A review of implementation experience. The World Bank
Operations Evaluation Department.
Aker, J.C., Ksoll, C. and Lybbert, T.J., 2012. Can mobile phones improve learning? Evidence
from a field experiment in Niger. American Economic Journal: Applied Economics, 4(4): 94-
120.
Andrabi, T., Das, J. and Khwaja, A.I., 2012. What did you do all day?: Maternal education
and child outcomes. Journal of Human Resources, 47:873–912.
Aoki, A., 2005. Assessing learning achievements and development impact: Ghana’s
national functional literacy program. Australian Journal of Adult Learning, 45.
ASER Centre, 2013. Annual status of education report (rural) 2012.
Avvisati, F., Gurgand, M., Guyon, N. and Maurin, E., 2010. Getting parents involved: A
field experiment in deprived schools. CEPR Discussion Paper No. DP8020.
Banerjee, A., Cole, S., Duflo, E. and Linden, L., 2007. Remedying education: Evidence
from two randomized experiments in India. Quarterly Journal of Economics, 122(3): 1235–
1264.
Banerjee, A.V., Banerji, R., Duflo, E., Glennerster, R. and Khemani, S., 2010. Pitfalls of
participatory programs: Evidence from a randomized evaluation in education in India.
American Economic Journal: Economic Policy, 2(1): 1–30.
Beder, H., 1999. The outcomes and impacts of adult literacy education in the United States.
National Center for the Study of Adult Learning and Literacy Report 6, (6).
Bekman, S., 1998. A fair chance: An evaluation of the mother-child program. Mother-
Child Education Foundation Publication 13.
Carron, G., 1990. The functioning and effects of the Kenya literacy program. African
Studies Review, 33(3): 97–120, ISSN 00020206.
Central Statistics Office of India, 2013. Statement: Per capital net state domestic product at
constant (2004-2005) prices. Technical report, Central Statistics Office. Available at:
<http://mospi.nic.in/Mospi_New/upload/Item_12_SDP-2004-05.xls>
Duflo, E., 2012. Women empowerment and economic development. Journal of Economic
Literature, 50(4): 1051–1079.
Kling, J.R., Liebman, J.B. and Katz, L.F., 2007. Experimental analysis of neighborhood
effects. Econometrica, 75 (1): 83–119.
Nguyen, T., 2008. Information, role models and perceived returns to education:
Experimental evidence from Madagascar. Mimeo, MIT.
India Office of the Registrar General & Census Commissioner, 2011. Provisional population
totals paper 1 of 2011 India. Technical report.

32
Ortega, D. and Rodriguez, F., 2008. Freed from illiteracy? A closer look at
venezuelaÿs mision robinson literacy campaign. Economic Development and Cultural
Change, 57(1): 1–30.
Rosenzweig, M.R. and Wolpin, K.I., 1994. Are there increasing returns to the
intergenerational production of human capital? Maternal schooling and child
intellectual achievement. The Journal of Human Resources, 29.
St. Pierre, T., Swartz, J., Murray, S., Deck, D. and Nickel, P., 1993. National
evaluation of the Even Start Family Literacy Program: Report on effectiveness. US
Department of Education - Office of Policy and Planning.
The World Bank Group, 2013. World development indicators, education statistics.
Technical report, The World Bank Group.
Thomas, D., Schoeni, R.F. and Strauss, J., 1996. Parental investments in schooling:
The roles of gender and resources in urban Brazil. Labor and Population Program,
Working Paper Series, 96-02.

33
Tables
Table 1: Randomization Check
Mean Relative to Control
Control ML CHAMP ML-CHAMP N
(1) (2) (3) (4) (5)
Assets
First Pincipal Component of Durables Ownership
-0.0328
0.00923
0.0924
0.0282
8888
[2.261] [0.0866] [0.0952] [0.0906] Main Income Source of Household
Farming
0.431
0.0251
0.00974
0.0414*
8819
[0.495] [0.0230] [0.0250] [0.0226] Wages 0.431
[0.495]
-0.0121
[0.0215]
-0.0149
[0.0226]
-0.0370*
[0.0216]
8819
Other
Number of Household Members
0.447
[0.497]
-0.0129
[0.0133]
0.00521
[0.0143]
-0.00445
[0.0131]
8819
Target-Aged Children (5 yrs to 8 yrs) 1.453
[0.612]
-0.0351*
[0.0184]
-0.0293
[0.0199]
-0.0158
[0.0179]
8888
Other Primary-Aged Chilred (4 yrs and 9 yrs) 1
[0.960]
0.0475
[0.0298]
0.0217
[0.0307]
0.0467*
[0.0275]
8888
Younger Children (Less than 4 yrs) 0.942
[0.909]
-0.0161
[0.0299]
0.0115
[0.0335]
0.0639**
[0.0303]
8888
Older Children (More than 9 yrs)
Mother Test Scores
3.269
[1.751]
0.00905
[0.0632]
0.114*
[0.0687]
0.0932
[0.0634]
8888
Mother- Literacy 2.993
[2.474]
0.0442
[0.110]
0.134
[0.131]
0.0548
[0.115]
8857
Mother- Numeracy 3.022
[3.376]
0.0885
[0.153]
0.147
[0.181]
0.0822
[0.160]
8857
Mother- Composite
Children's Test Scores
6.015
[5.616]
0.133
[0.259]
0.281
[0.307]
0.137
[0.271]
8857
Children- Literacy 2.803
[2.370]
0.0603
[0.0883]
0.0730
[0.0908]
0.0824
[0.0876]
15502
Children- Numeracy 2.770
[3.032]
0.114
[0.111]
0.131
[0.117]
0.0857
[0.109]
15502
Children- Composite
Other Members' Reading/Math
5.573
[5.233]
0.175
[0.195]
0.204
[0.204]
0.168
[0.192]
15502
Other Members- Can Read? 0.380
[0.485]
-0.00151
[0.0162]
0.0274
[0.0178]
0.0163
[0.0175]
13891
Other Members- Can Do Math?
Parent Education
0.249
[0.433]
0.00460
[0.0146]
0.0249
[0.0170]
0.0233
[0.0147]
13891
Mother Education Level 0.764
[2.282]
0.0475
[0.102]
0.152
[0.118]
0.0694
[0.103]
8864
Father Education Level 3.876
[4.438]
-0.150
[0.203]
0.133
[0.226]
0.234
[0.213]
8181
Mother Has Past Experience with Literacy Classes
Child Gender
0.117
[0.321]
-0.00839
[0.0123]
-0.00825
[0.0130]
-0.0209*
[0.0124]
8635
Child Is Male 0.521
[0.500]
-0.0133
[0.0108]
-0.00804
[0.0110]
-0.0214**
[0.0106]
15500
Notes:
Columns 2, 3 and 4 display the differences in means between each
treatment group and the control group.
Standard errors are clustered at the village level.
* denotes significance at 0.10; ** at 0.05; *** at 0.01

34
Table 2: Takeup of Mother Literacy Classes
Mean OLS: Impact of treatment in endline
Control ML CHAMP ML-CHAMP N
(1) (2) (3) (4) (5)
Knew about ML classes 0.218
[0.413]
0.402***
[0.0226]
-0.00558
[0.0199]
0.451***
[0.0217]
8581
Mother attended ML classes 0.0710
[0.257]
0.321***
[0.0184]
-0.00101
[0.0128]
0.368***
[0.0177]
8581
Child attended with mother 0.0252
[0.157]
0.161***
[0.0126]
0.0000870
[0.00727]
0.218***
[0.0133]
8581
Child attended alone 0.0380
[0.191]
0.140***
[0.0115]
-0.00884
[0.00728]
0.179***
[0.0132]
8511
Notes:
Columns 2, 3 and 4 display estimated coefficients of a regression of the outcome
in each row on treatment group dummies, controlling for stratification unit dummies.
Standard errors are clustered at the village level.
* denotes significance at 0.10; ** at 0.05; *** at 0.01

35
Table 3: Determinants of Mother Takeup
Dependent Variable:
Mother Attended
(1) (2)
1st PC of Durables -0.00227 -0.000612
[0.00644] [0.00526]
# Children 0-4 -0.000514 -0.000447
[0.0101] [0.00924]
# Children 5-14 0.0165* 0.0110
[0.00840] [0.00694]
# Adults 15+ -0.00707 -0.00195
[0.00597] [0.00491]
Total hours worked per week 0.000456 0.000389
[0.000398] [0.000370]
Selected child age 0.00486 0.0115*
[0.00946] [0.00664]
Selected child is a girl -0.00143 -0.0146
[0.0177] [0.0153]
Selected child in school 0.0333 0.0473**
[0.0271] [0.0200]
Selected child in private school -0.0808** -0.0878***
[0.0364] [0.0332]
Seleted child test score 0.00121 -0.00725
[0.0113] [0.0101]
Father education level -0.00585** -0.00331
[0.00234] [0.00210]
Mother total test score 0.282** 0.311***
[0.120] [0.109]
Mother education > 0 -0.0304*** -0.0289***
[0.00610] [0.00562]
Mother education: years 0.0587*** 0.0563***
[0.0145] [0.0126]
Mother age -0.00210 -0.00270**
[0.00138] [0.00120]
Has mother attended adult- 0.0832*** 0.0777***
literacy classes before [0.0295] [0.0250]
SHG Member 0.0967*** 0.0910***
[0.0268] [0.0239]
Baseline Empowerment Index 0.0594** 0.0615***
[0.0255] [0.0230]
Baseline Mother- 0.0255* 0.0197
Child Participation Index [0.0151] [0.0129]
State = Bihar 0.0996***
[0.0316]
Mean of Dep. Var. 0.425
R-Squared 0.0600 0.0869
P-value: test that all stratification unit
dummies N
=0 0.000
Columns 1 and 2 display estimated coefficients of a
regression of the mother child attendance respectively on
the determinants in each row.
* denotes significance at 0.10; ** at 0.05; *** at 0.01

31
Baseline Mean Endline Mean
Table 4: Mother Learning
OLS: Impact of treatment in endline First stage IV
All Obs
Control
ML
CHAMP
ML-CHAMP
N
P-value:
additive effects
Attend lit
class
Impact of lit
class
(1) (2) (3) (4) (5) (6) (7) (8) (9)
Literacy 0.0430
0.115
0.0913*** 0.0400** 0.126*** 8552 0.848
0.341*** 0.261***
[1.055] [1.329] [0.0185] [0.0193] [0.0188] [0.0189] [0.0529]
Numeracy 0.0616 -0.0158 0.120*** 0.0693*** 0.159*** 8552 0.226 0.353***
[1.065] [1.017] [0.0167] [0.0158] [0.0173] [0.0493]
Total 0.0560 0.0414 0.111*** 0.0587*** 0.150*** 8552 0.385 0.325***
[1.066] [1.153] [0.0151] [0.0142] [0.0158] [0.0439]
Notes:
Columns 3, 4 and 5 display estimated coefficients of a regression of the outcome in each row on treatment group dummies, controlling
for stratification unit dummies and baseline values.
Column 7 displays the p-value of the test that the coefficients ML+CHAMP=ML-CHAMP.
Column 8 displays the impact of assignment to the mother literacy treatment group on literacy class attendance by mother or child.
Column 9 displays the impact of literacy class attendance on the dependent variables, using assignment to the ML treatment group as an
instrument for attendance.
Standard errors are clustered at the village level.
* denotes significance at 0.10; ** at 0.05; *** at 0.01

32
Table 5: Family Assistance in Mother Learning
Endline Mean OLS: Impact of treatment in endline
Control ML CHAMP ML-CHAMP N
(1) (2) (3) (4) (5)
Family member taught mother: ANY 0.206
[0.404]
0.0507***
[0.0146]
0.00683
[0.0154]
0.0560***
[0.0146]
8581
Family member taught mother: to write her name 0.173
[0.378]
0.0414***
[0.0131]
-0.00953
[0.0135]
0.0502***
[0.0130]
8581
Family member taught mother: counting 0.0818
[0.274]
0.0509***
[0.0106]
0.0200*
[0.0107]
0.0577***
[0.0105]
8581
Family member taught mother: hh accounts 0.0537
[0.226]
0.0230***
[0.00825]
0.0118
[0.00826]
0.0285***
[0.00828]
8581
Family member taught mother: counting change 0.0514
[0.221]
0.0314***
[0.00820]
0.0194**
[0.00860]
0.0295***
[0.00956]
8581
Notes:
Columns 2, 3 and 4 display estimated coefficients of a regression of the outcome in each row on treatment
group dummies, controlling for stratification unit dummies.
Standard errors are clustered at the village level.
* denotes significance at 0.10; ** at 0.05; *** at 0.01
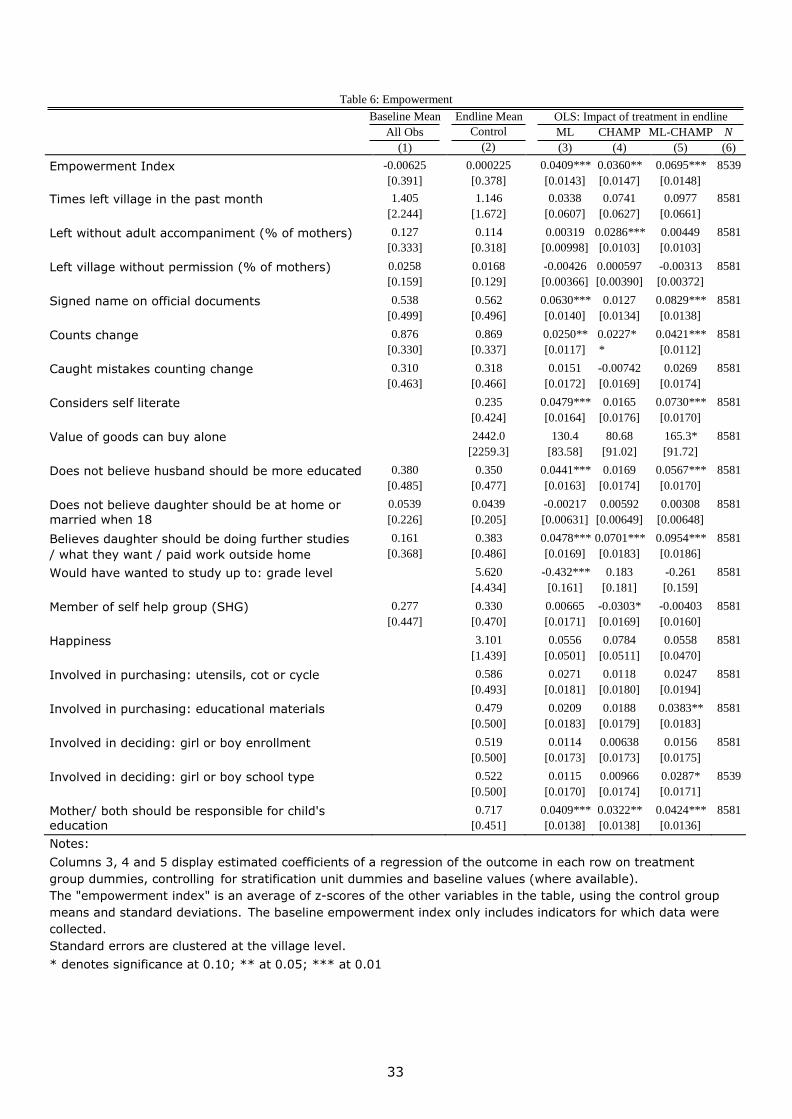
33
Table 6: Empowerment
Baseline Mean Endline Mean
OLS: Impact of treatment in endline
All Obs Control ML CHAMP ML-CHAMP N
(1) (2) (3) (4) (5) (6)
Empowerment Index -0.00625
[0.391]
0.000225
[0.378]
0.0409***
[0.0143]
0.0360**
[0.0147]
0.0695***
[0.0148]
8539
Times left village in the past month 1.405
[2.244]
1.146
[1.672]
0.0338
[0.0607]
0.0741
[0.0627]
0.0977
[0.0661]
8581
Left without adult accompaniment (% of mothers) 0.127
[0.333]
0.114
[0.318]
0.00319
[0.00998]
0.0286***
[0.0103]
0.00449
[0.0103]
8581
Left village without permission (% of mothers) 0.0258
[0.159]
0.0168
[0.129]
-0.00426
[0.00366]
0.000597
[0.00390]
-0.00313
[0.00372]
8581
Signed name on official documents 0.538
[0.499]
0.562
[0.496]
0.0630***
[0.0140]
0.0127
[0.0134]
0.0829***
[0.0138]
8581
Counts change 0.876
[0.330]
0.869
[0.337]
0.0250**
[0.0117]
0.0227*
*
[0.0114]
0.0421***
[0.0112]
8581
Caught mistakes counting change 0.310
[0.463]
0.318
[0.466]
0.0151
[0.0172]
-0.00742
[0.0169]
0.0269
[0.0174]
8581
Considers self literate 0.235
[0.424]
0.0479***
[0.0164]
0.0165
[0.0176]
0.0730***
[0.0170]
8581
Value of goods can buy alone 2442.0
[2259.3]
130.4
[83.58]
80.68
[91.02]
165.3*
[91.72]
8581
Does not believe husband should be more educated 0.380
[0.485]
0.350
[0.477]
0.0441***
[0.0163]
0.0169
[0.0174]
0.0567***
[0.0170]
8581
Does not believe daughter should be at home or
married when 18
0.0539
[0.226]
0.0439
[0.205]
-0.00217
[0.00631]
0.00592
[0.00649]
0.00308
[0.00648]
8581
Believes daughter should be doing further studies 0.161 0.383 0.0478*** 0.0701*** 0.0954*** 8581
/ what they want / paid work outside home [0.368] [0.486] [0.0169] [0.0183] [0.0186]
Would have wanted to study up to: grade level 5.620
[4.434]
-0.432***
[0.161]
0.183
[0.181]
-0.261
[0.159]
8581
Member of self help group (SHG) 0.277
[0.447]
0.330
[0.470]
0.00665
[0.0171]
-0.0303*
[0.0169]
-0.00403
[0.0160]
8581
Happiness 3.101
[1.439]
0.0556
[0.0501]
0.0784
[0.0511]
0.0558
[0.0470]
8581
Involved in purchasing: utensils, cot or cycle 0.586
[0.493]
0.0271
[0.0181]
0.0118
[0.0180]
0.0247
[0.0194]
8581
Involved in purchasing: educational materials 0.479
[0.500]
0.0209
[0.0183]
0.0188
[0.0179]
0.0383**
[0.0183]
8581
Involved in deciding: girl or boy enrollment 0.519
[0.500]
0.0114
[0.0173]
0.00638
[0.0173]
0.0156
[0.0175]
8581
Involved in deciding: girl or boy school type 0.522
[0.500]
0.0115
[0.0170]
0.00966
[0.0174]
0.0287*
[0.0171]
8539
Mother/ both should be responsible for child's education
0.717
[0.451]
0.0409***
[0.0138]
0.0322**
[0.0138]
0.0424***
[0.0136]
8581
Notes:
Columns 3, 4 and 5 display estimated coefficients of a regression of the outcome in each row on treatment
group dummies, controlling for stratification unit dummies and baseline values (where available).
The "empowerment index" is an average of z-scores of the other variables in the table, using the control group
means and standard deviations. The baseline empowerment index only includes indicators for which data were
collected.
Standard errors are clustered at the village level.
* denotes significance at 0.10; ** at 0.05; *** at 0.01

34
Table 7: Mother Time Use
Baseline Mean Endline Mean
OLS: Impact of treatment in endline
All Obs Control ML CHAMP ML-CHAMP N
(1) (2) (3) (4) (5) (6)
Help w/ homework (weekly hrs) 1.686
[2.903]
2.313
[2.704]
0.114
[0.0919]
0.126
[0.0973]
0.0602
[0.0918]
8519
Read (weekly hrs) 0.201
[1.056]
0.324
[1.332]
-0.0116
[0.0397]
-0.0217
[0.0365]
0.00582
[0.0422]
8399
Play with child (weekly hrs) 0.255
[1.309]
1.322
[3.172]
0.0720
[0.110]
0.0544
[0.116]
-0.0272
[0.108]
8472
Share stories (weekly hrs) 0.383
[1.201]
0.515
[1.401]
0.0196
[0.0464]
-0.00556
[0.0438]
0.0358
[0.0507]
8514
Paid work (weekly hrs) 26.81
[18.53]
31.27
[20.93]
1.022*
[0.604]
0.487
[0.587]
0.975
[0.610]
8547
Livestock work (weekly hrs) 9.242
[7.020]
9.528
[6.745]
0.171
[0.246]
-0.253
[0.231]
0.505**
[0.241]
8573
Collect animal feed (weekly hrs) 6.828
[6.601]
0.209
[0.261]
-0.161
[0.266]
0.178
[0.274]
8577
Collect wood (weekly hrs) 3.302
[4.962]
0.0804
[0.179]
-0.125
[0.193]
0.00144
[0.189]
8570
Housework (weekly hrs) 22.20
[8.844]
18.86
[7.918]
0.365
[0.304]
0.252
[0.301]
0.316
[0.286]
8581
Buy supplies (weekly hrs) 4.832
[6.188]
1.231
[2.656]
-0.0582
[0.0901]
-0.0654
[0.0905]
-0.0182
[0.0877]
8567
Look after children (weekly hrs) 5.751
[4.035]
4.640
[3.695]
-0.209**
[0.106]
-0.143
[0.109]
0.0737
[0.104]
8581
Notes:
Columns 3, 4 and 5 display estimated coefficients of a regression of the outcome in each row on treatment
group dummies, controlling for stratification unit dummies and baseline values (where possible).
Standard errors are clustered at the village level.
* denotes significance at 0.10; ** at 0.05; *** at 0.01

35
Table 8: Child Learning
Baseline Mean
Endline Mean
OLS: Impact of treatment in endline
First
stage IV
All Obs
Control
ML CHAMP
ML-
CHAMP N
P-value: ML-
CHAMP = ML
+ CHAMP
Attend lit
class
Impact of
lit class
(1) (2) (3) (4) (5) (6) (7) (8) (9)
Literacy 0.0253
0.134
-0.00229 0.0288 0.0537*** 18282 0.331
0.352*** 0.000552
[1.008]
[1.130]
[0.0192] [0.0197] [0.0186]
[0.0199] [0.0548]
Numeracy 0.0306
0.127
0.0374** 0.0469** 0.0685*** 18282 0.552
0.114**
[1.014]
[1.058]
[0.0185] [0.0189] [0.0182]
[0.0523]
Total 0.0292
0.134
0.0194 0.0387** 0.0632*** 18282 0.841
0.0635
[1.012] [1.085] [0.0176] [0.0183] [0.0171] [0.0499]
Notes:
Columns 3, 4 and 5 display estimated coefficients of a regression of the outcome in each row on treatment group dummies, controlling
for stratification unit dummies and baseline values. Missing value dummies are included for children not tested at baseline.
Colunmn 7 displays the p-value of the test that the coefficients ML+CHAMP=ML-CHAMP.
Column 8 displays the impact of assignment to the mother literacy treatment group on literacy class attendance by mother or child.
Column 9 displays the impact of litteracy class attendance on the dependent variables, using assignment to the ML treatment group as
an instrument for attendance.
Standard errors are clustered at the village level.
* denotes significance at 0.10; ** at 0.05; *** at 0.01

36
All Obs Control ML CHAMP ML-CHAMP N
(1) (2) (3) (4) (5) (6)
Monthly tuition fees 14.25
[36.68]
20.92
[53.28]
3.564*
[1.926]
2.114
[1.962]
1.299
[1.839]
8438
Child is enrolled 0.775
[0.418]
0.0122
[0.0118]
0.0136
[0.0116]
0.0144
[0.0118]
25053
Child is / will be enrolled 0.905
[0.293]
-0.00203
[0.00741]
0.00483
[0.00724]
0.00964
[0.00722]
25053
Child attends school 0.833
[0.373]
0.845
[0.362]
-0.00486
[0.0109]
0.00349
[0.0108]
0.0193*
[0.0106]
25053
Child attends private school 0.114
[0.318]
0.0805
[0.272]
0.00565
[0.00847]
-0.000640
[0.00859]
0.00427
[0.00883]
25053
Hours spent in school 3.642
[1.971]
4.063
[1.599]
0.0554
[0.0554]
0.0827
[0.0537]
0.0885
[0.0558]
8475
Days missed per month 2.152
[4.753]
-0.0820
[0.175]
-0.0206
[0.183]
-0.133
[0.164]
7383
Days missed in last week 2.825
[2.469]
1.379
[1.946]
0.0275
[0.0710]
-0.0572
[0.0760]
-0.0361
[0.0683]
6980
Table 9: Child Schooling
Baseline Mean Endline Mean
OLS: Impact of treatment in endline
Notes:
Columns 3, 4 and 5 display estimated coefficients of a regression of the outcome in each row on treatment
group dummies, controlling for stratification unit dummies and baseline values (where available).
Standard errors are clustered at the village level.
* denotes significance at 0.10; ** at 0.05; *** at 0.01

37
Table 10: Mother-Child Participation
Baseline Mean Endline Mean
OLS: Impact of treatment in endline
All Obs Control ML CHAMP ML-CHAMP N
(1) (2) (3) (4) (5) (6)
Mother-Child Participation Index 0.0231
[0.643]
0.0123
[0.512]
0.0371**
[0.0184]
0.0634***
[0.0196]
0.0507**
[0.0198]
8231
Take child to school (# times/week) 0.255
[1.095]
0.336
[1.130]
-0.0385
[0.0380]
0.0370
[0.0420]
-0.00939
[0.0357]
8451
Visit school (% of mothers) 0.128
[0.335]
0.155
[0.362]
0.00511
[0.0119]
0.0136
[0.0129]
0.0132
[0.0123]
8451
Visit school (% of mothers, not because of bullying
or for fees)
0.0969
[0.296]
0.0763
[0.266]
0.00894
[0.00951]
0.0157*
[0.00903]
0.00824
[0.00895]
8451
Know whether child received homework (% of
mothers)
0.762
[0.426]
0.0158
[0.0151]
0.0321**
[0.0150]
0.0189
[0.0162]
8479
Help child with homework (% of mothers) 0.325
[0.469]
0.708
[0.455]
0.0158
[0.0153]
0.0419***
[0.0146]
0.0258*
[0.0154]
8479
Time spent helping per week (weekly hrs) 1.686
[2.903]
2.313
[2.704]
0.114
[0.0919]
0.126
[0.0973]
0.0602
[0.0918]
8519
Looked at notebook (% of mothers) 0.126
[0.332]
0.216
[0.412]
0.0300**
[0.0149]
0.0651***
[0.0157]
0.0495***
[0.0152]
8572
Talk to child about school: number of times per week
3.090
[3.018]
0.222**
[0.101]
0.194*
[0.105]
0.247**
[0.105]
8438
Talk to others about child's studies: number of times per week
0.551
[0.497]
1.609
[2.222]
0.235***
[0.0778]
0.181**
[0.0773]
0.251***
[0.0797]
8521
Notes:
Columns 3, 4 and 5 display estimated coefficients of a regression of the outcome in each row on treatment group
dummies, controlling for stratification unit dummies and baseline values (where available).
The "Mother-Child Participation Index" is an average of z-scores of the other variables in the table, using the
control group means and standard deviations. The baseline participation index only includes indicators for which
data were collected.
Standard errors are clustered at the village level.
* denotes significance at 0.10; ** at 0.05; *** at 0.01
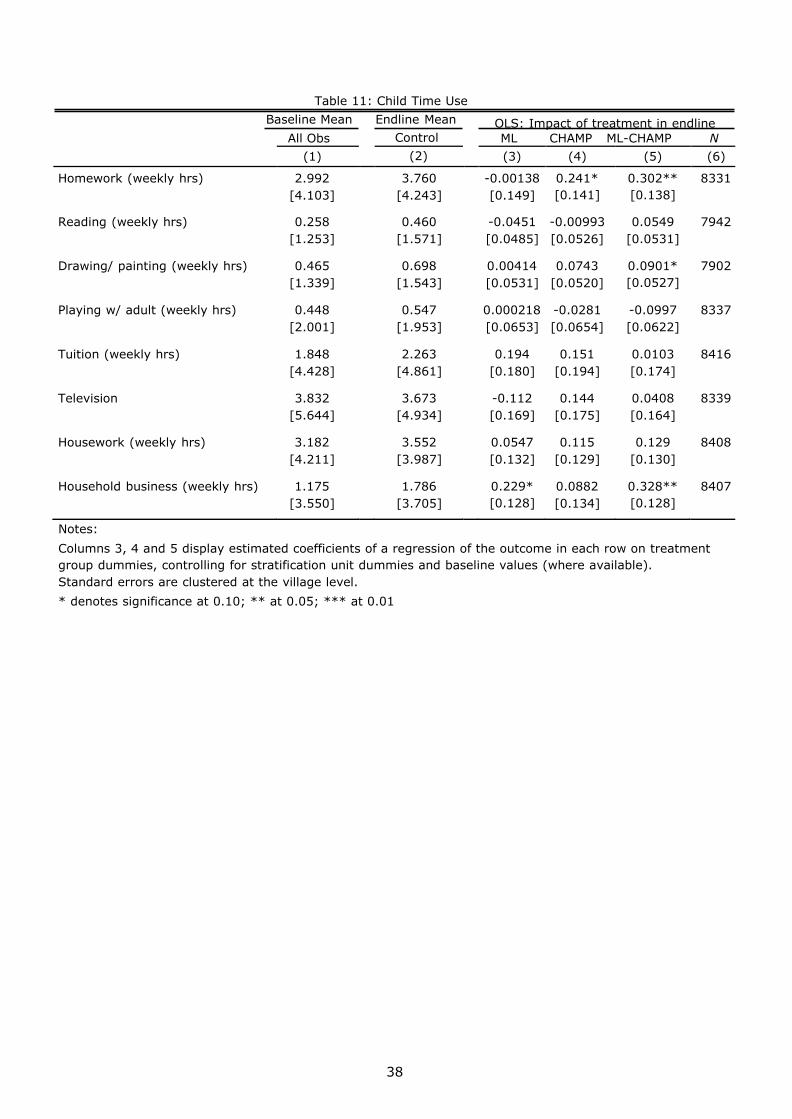
38
Table 11: Child Time Use
Baseline Mean Endline Mean
OLS: Impact of treatment in endline
All Obs Control ML CHAMP ML-CHAMP N (1) (2) (3) (4) (5) (6)
Homework (weekly hrs) 2.992
[4.103]
3.760
[4.243]
-0.00138
[0.149]
0.241*
[0.141]
0.302**
[0.138]
8331
Reading (weekly hrs) 0.258
[1.253]
0.460
[1.571]
-0.0451
[0.0485]
-0.00993
[0.0526]
0.0549
[0.0531]
7942
Drawing/ painting (weekly hrs) 0.465
[1.339]
0.698
[1.543]
0.00414
[0.0531]
0.0743
[0.0520]
0.0901*
[0.0527]
7902
Playing w/ adult (weekly hrs) 0.448
[2.001]
0.547
[1.953]
0.000218
[0.0653]
-0.0281
[0.0654]
-0.0997
[0.0622]
8337
Tuition (weekly hrs) 1.848
[4.428]
2.263
[4.861]
0.194
[0.180]
0.151
[0.194]
0.0103
[0.174]
8416
Television 3.832
[5.644]
3.673
[4.934]
-0.112
[0.169]
0.144
[0.175]
0.0408
[0.164]
8339
Housework (weekly hrs) 3.182
[4.211]
3.552
[3.987]
0.0547
[0.132]
0.115
[0.129]
0.129
[0.130]
8408
Household business (weekly hrs) 1.175
[3.550]
1.786
[3.705]
0.229*
[0.128]
0.0882
[0.134]
0.328**
[0.128]
8407
Notes:
Columns 3, 4 and 5 display estimated coefficients of a regression of the outcome in each row on treatment
group dummies, controlling for stratification unit dummies and baseline values (where available).
Standard errors are clustered at the village level.
* denotes significance at 0.10; ** at 0.05; *** at 0.01

39
Table 12: Education Assets
Baseline Mean Endline Mean
OLS: Impact of treatment in endline
All Obs Control ML CHAMP ML-CHAMP N
(1) (2) (3) (4) (5) (6)
Education assets in home: pencil (% of hh) 0.930
[0.256]
0.945
[0.227]
-0.0000251
[0.00850]
0.0148**
[0.00727]
0.0123
[0.00795]
8581
Education assets in home: school books 0.906
[0.292]
0.0179*
[0.00978]
0.0168*
[0.00935]
0.0264***
[0.00990]
8581
Education assets in home: other books/ comics
0.229
[0.420]
0.245
[0.430]
0.0164
[0.0155]
0.0364**
[0.0169]
0.0410**
[0.0159]
8581
Education assets in home: newspaper/ magazine
0.122
[0.328]
0.0533
[0.225]
0.0105
[0.00789]
0.0301***
[0.00881]
0.00867
[0.00789]
8581
Education assets in home: slate 0.891
[0.312]
0.0125
[0.0103]
-0.00444
[0.0104]
0.0259***
[0.00974]
8581
Education assets in home: none 0.0154
[0.123]
-0.00161
[0.00398]
-0.00581
[0.00357]
-0.00197
[0.00375]
8581
Education assets index 0.0176
[0.651]
7.45e-09
[0.570]
0.0344
[0.0212]
0.0613***
[0.0206]
0.0708***
[0.0211]
8581
Notes:
Columns 3, 4 and 5 display estimated coefficients of a regression of the outcome in each row on treatment
group dummies, controlling for stratification unit dummies and baseline values (where available).
Standard errors are clustered at the village level.
* denotes significance at 0.10; ** at 0.05; *** at 0.01
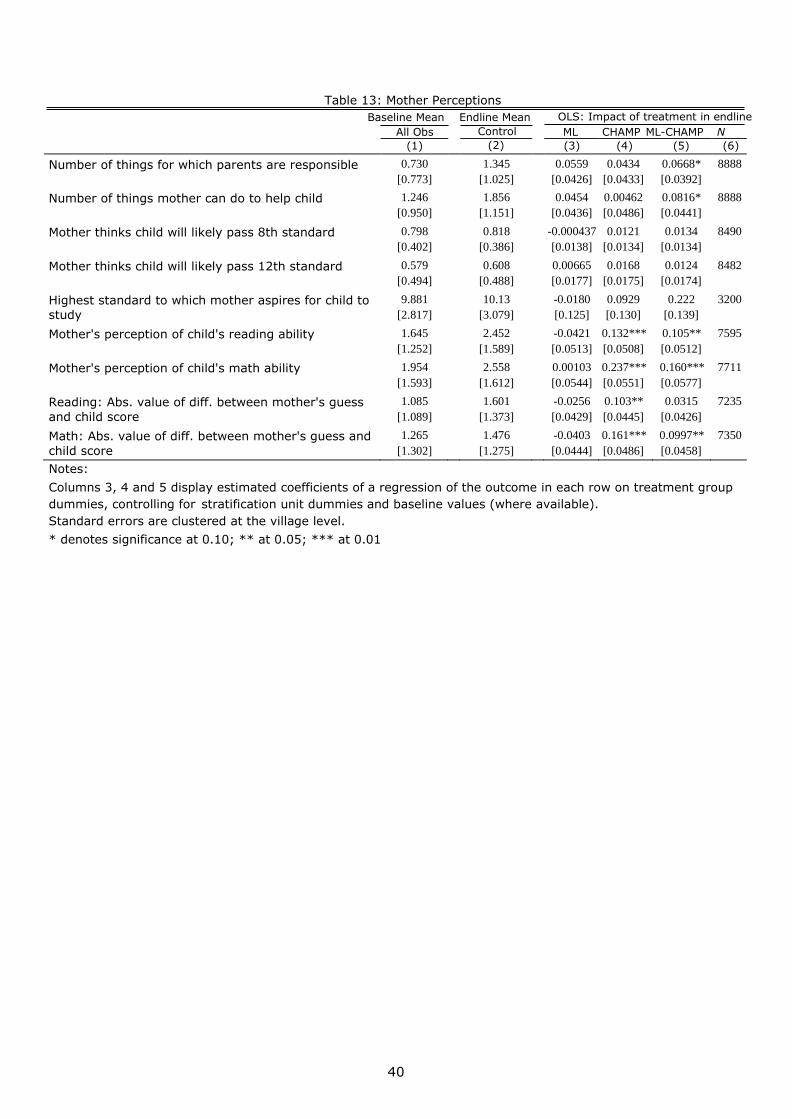
40
Table 13: Mother Perceptions
Baseline Mean Endline Mean
OLS: Impact of treatment in endline
All Obs Control ML CHAMP ML-CHAMP N
(1) (2) (3) (4) (5) (6)
Number of things for which parents are responsible 0.730
[0.773]
1.345
[1.025]
0.0559
[0.0426]
0.0434
[0.0433]
0.0668*
[0.0392]
8888
Number of things mother can do to help child 1.246
[0.950]
1.856
[1.151]
0.0454
[0.0436]
0.00462
[0.0486]
0.0816*
[0.0441]
8888
Mother thinks child will likely pass 8th standard 0.798
[0.402]
0.818
[0.386]
-0.000437
[0.0138]
0.0121
[0.0134]
0.0134
[0.0134]
8490
Mother thinks child will likely pass 12th standard 0.579
[0.494]
0.608
[0.488]
0.00665
[0.0177]
0.0168
[0.0175]
0.0124
[0.0174]
8482
Highest standard to which mother aspires for child to
study
9.881
[2.817]
10.13
[3.079]
-0.0180
[0.125]
0.0929
[0.130]
0.222
[0.139]
3200
Mother's perception of child's reading ability 1.645
[1.252]
2.452
[1.589]
-0.0421
[0.0513]
0.132***
[0.0508]
0.105**
[0.0512]
7595
Mother's perception of child's math ability 1.954
[1.593]
2.558
[1.612]
0.00103
[0.0544]
0.237***
[0.0551]
0.160***
[0.0577]
7711
Reading: Abs. value of diff. between mother's guess
and child score
1.085
[1.089]
1.601
[1.373]
-0.0256
[0.0429]
0.103**
[0.0445]
0.0315
[0.0426]
7235
Math: Abs. value of diff. between mother's guess and
child score
1.265
[1.302]
1.476
[1.275]
-0.0403
[0.0444]
0.161***
[0.0486]
0.0997**
[0.0458]
7350
Notes:
Columns 3, 4 and 5 display estimated coefficients of a regression of the outcome in each row on treatment group
dummies, controlling for stratification unit dummies and baseline values (where available).
Standard errors are clustered at the village level.
* denotes significance at 0.10; ** at 0.05; *** at 0.01

41
Table 14. Heterogeneity in Impact
Outcome: Mother Test Scores
Interacted Variable
State = Bihar Mother Baseline Score Mother Age Mother Education Level
Literacy Numeracy Composite
Literacy Numeracy Composite Literacy Numeracy Composite Literacy Numeracy Composite
(1) (2) (3) (4) (5) (6) (7) (8) (9) (10) (11) (12)
ML 0.0810***
0.0533***
0.0657***
0.0903***
0.120***
0.111***
0.0615 0.0610 0.0596 0.0988***
0.122***
0.117*** [0.026
6]
[0.019
9]
[0.018
3]
[0.018
0]
[0.0164
]
[0.0148
]
[0.0768
]
[0.0615] [0.0563
]
[0.0153
]
[0.0165
]
[0.0142
] CHAMP 0.0681**
0.0740***
0.0773***
0.0370**
0.0659***
0.0557***
0.0933 0.164***
0.138** 0.0264*
0.0544***
0.0459*** [0.027
2] [0.0196]
[0.0177]
[0.0181]
[0.0150]
[0.0135]
[0.0768]
[0.0601] [0.0564]
[0.0148]
[0.0156]
[0.0127] ML-CHAMP 0.0865*
**
0.0973*
**
0.0958*
**
0.125*
**
0.161*
**
0.151**
*
0.179*
*
0.123* 0.150** 0.131**
*
0.173**
*
0.162**
* [0.026
5]
[0.022
1]
[0.020
1]
[0.018
1]
[0.0170
]
[0.0155
]
[0.0792
]
[0.0635] [0.0604
]
[0.0163
]
[0.0176
]
[0.0153
] Variable 0.221***
0.0811 0.169***
1.182***
0.899***
1.059***
-0.000776
-0.00692***
-0.00258**
0.149***
0.0711***
0.0917*** [0.082
5]
[0.050
4]
[0.059
8]
[0.026
0]
[0.0117
]
[0.0141
]
[0.0015
8]
[0.00124
]
[0.0011
9]
[0.0087
1]
[0.0059
4]
[0.0056
0] Variable x ML 0.0201 0.130***
0.0890***
0.0221 -0.0095
2
-0.00602
0.000921
0.00179 0.00160 -0.0133
-0.00567
-0.0104 [0.036
9] [0.0321]
[0.0294]
[0.0324]
[0.0171]
[0.0192]
[0.00215]
[0.00181]
[0.00163]
[0.0103]
[0.00814]
[0.00759] Variable x CHAMP -
0.0561 -0.00996
-0.0375
0.0571*
0.0371**
0.0369**
-0.00166
-0.00298*
-0.00247
0.00518
0.00852 0.00607 [0.037
6] [0.0299]
[0.0265]
[0.0326]
[0.0159]
[0.0180]
[0.00212]
[0.00172]
[0.00161]
[0.00905]
[0.00772]
[0.00635] Variable x ML-
CHAMP 0.0788**
0.123***
0.109***
0.0370 -0.0358**
-0.0118
-0.00165
0.00110 0.0000176
-0.0107
-0.0198***
-0.0176***
[0.037
0]
[0.033
3]
[0.030
4]
[0.033
0]
[0.0170
]
[0.0181
]
[0.0022
0]
[0.00188
]
[0.0017
4]
[0.0097
1]
[0.0073
5]
[0.0064
4] N 8552 8552 8552 8552 8552 8552 8552 855
2
8552 8528 8528 8528
Each column displays the results of a regression of the mother's normalized literacy, numeracy or composite test score on
treatment dummies, the interaction variable indicated, and interactions of the variable and treatment dummies.
Regressions control for baseline test scores (except where the interacted variable is the baseline
score itself), and stratum dummies. Standard errors are clustered at the village level.
* denotes significance at 0.10; ** at 0.05; *** at 0.01

42
Table 15a. Heterogeneity in
Impact Outcome: Child Test
Scores
Interacted Variable
State = Bihar Mother Baseline Score Mother Age Mother Education Level
Literacy Numeracy
Composite
Literacy Numeracy Composite Literacy Numeracy Composite Literacy Numeracy Composite (1) (2) (3) (4) (5) (6) (7) (8) (9) (10) (11) (12)
ML -0.00299
0.0281
0.0147
-0.00107
0.0385**
0.0207 -0.101 -0.0849
-0.0946 -0.00679
0.0371**
0.0173 [0.027
7]
[0.024
3]
[0.024
2]
[0.0187
]
[0.0179
]
[0.0170
]
[0.071
8]
[0.063
5]
[0.0622
]
[0.0188
]
[0.0182
]
[0.0172
] CHAMP 0.023
1
0.0511
**
0.038
6
0.0226 0.0453*
*
0.0350*
*
-
0.0300
-
0.0251
-0.0317 0.0116 0.0402*
*
0.0275 [0.028
2] [0.0255]
[0.0252]
[0.0174]
[0.0180]
[0.0167]
[0.0733]
[0.0626]
[0.0620]
[0.0179]
[0.0182]
[0.0170] ML-CHAMP 0.043
8
0.0494
**
0.0480
**
0.0525*
**
0.0682*
**
0.0625*
**
0.0200 0.121* 0.0800 0.0457*
*
0.0655*
**
0.0579*
** [0.026
9]
[0.022
4]
[0.022
3]
[0.0174
]
[0.0176
]
[0.0162
]
[0.075
2]
[0.068
5]
[0.0669
]
[0.0183
]
[0.0177
]
[0.0166
] Variable -0.0695
-0.0243
-0.0406
0.0775***
0.0638***
0.0743***
-0.00481***
-0.00235*
-0.00381***
0.0336***
0.0302***
0.0316*** [0.066
7]
[0.060
0]
[0.058
6]
[0.0125
]
[0.0110
]
[0.0112
]
[0.0015
2]
[0.0012
5]
[0.0012
3]
[0.0061
0]
[0.0059
7]
[0.0057
8] Variable x ML 0.0015
3
0.016
9
0.0085
4
0.0049
6
0.0172 0.0079
5
0.0030
3
0.00379
**
0.00352
*
0.0064
8
0.0031
7
0.0045
2 [0.0383]
[0.0363]
[0.0349]
[0.0174]
[0.0151]
[0.0151]
[0.00209]
[0.00187]
[0.00180]
[0.00807]
[0.00807]
[0.00766] Variable x CHAMP 0.010
3
-
0.00762
0.0001
33
0.0298
*
0.0141 0.0177 0.0018
0
0.0022
3
0.0021
7
0.0147
*
0.0046
1
0.0089
6 [0.039
3]
[0.037
2]
[0.036
3]
[0.0178
]
[0.0152
]
[0.0158
]
[0.0020
9]
[0.0018
3]
[0.0017
7]
[0.0084
4]
[0.0076
0]
[0.0075
3] Variable x ML-CHAMP
0.0182
0.0350
0.0279
0.0217 0.0225 0.0219 0.00103
-0.00164
-0.000539
0.00815
0.00301
0.00552 [0.037
2]
[0.035
5]
[0.033
7]
[0.0184
]
[0.0150
]
[0.0155
]
[0.0022
1]
[0.0020
0]
[0.0019
3]
[0.0091
8]
[0.0079
5]
[0.0080
3] N 18282 18282 18282 17823 17823 17823 18282 18282 18282 18234 18234 18234
Each column displays the results of a regression of the child's normalized literacy, numeracy or composite test
score on treatment dummies, the interaction variable indicated, and interactions of the variable and treatment
dummies.
Regressions control for baseline test scores (except where the interacted variable is the baseline
score itself), and stratum dummies. Standard errors are clustered at the village level.
* denotes significance at 0.10; ** at 0.05; *** at 0.01

43
Table 15b. Heterogeneity in Impact
Outcome: Child Test Scores
Interacted Variable
Child Age Child Baseline Score Gender
Literacy Numeracy Composite Literacy Numeracy Composite Literacy Numeracy Composite
(13) (14) (15) (16) (17) (18) (19) (20) (21)
ML 0.0256 0.0188 0.0226 -0.00954 0.0385* 0.0165 -0.00873 0.0360 0.0164
[0.0351] [0.0331] [0.0300] [0.0210] [0.0198] [0.0186] [0.0235] [0.0231] [0.0214]
CHAMP 0.0110 0.0306 0.0230 0.0172 0.0460** 0.0325* 0.0370 0.0588** 0.0496**
[0.0350] [0.0338] [0.0316] [0.0203] [0.0197] [0.0186] [0.0238] [0.0240] [0.0222]
ML-CHAMP -0.0367 0.0389 0.00669 0.0547*** 0.0723*** 0.0658*** 0.0554** 0.0609*** 0.0598***
[0.0326] [0.0342] [0.0310] [0.0198] [0.0194] [0.0179] [0.0225] [0.0228] [0.0209]
Variable 0.0412*** 0.0685*** 0.0486*** 0.970*** 0.888*** 0.951*** 0.0481*** 0.0829*** 0.0651***
[0.00558] [0.00551] [0.00516] [0.0133] [0.0118] [0.0102] [0.0180] [0.0185] [0.0166]
Variable x ML -0.00456 0.00283 -0.000608 0.00909 0.00940 0.00925 0.0137 0.00442 0.00707
[0.00597] [0.00548] [0.00487] [0.0201] [0.0161] [0.0150] [0.0248] [0.0253] [0.0226]
Variable x CHAMP 0.00265 0.00259 0.00244 0.0195 -0.0173 0.000399 -0.0156 -0.0225 -0.0207
[0.00603] [0.00546] [0.00514] [0.0198] [0.0163] [0.0150] [0.0263] [0.0257] [0.0237]
Variable x ML-
CHAMP
0.0143** 0.00447 0.00890* 0.0193 -0.0302* -0.00619 -0.00200 0.0175 0.00862
[0.00555] [0.00548] [0.00488] [0.0184] [0.0166] [0.0142] [0.0263] [0.0257] [0.0239]
N 18281 18281 18281 14575 14575 14575 18282 18282 18282
Each column displays the results of a regression of the child's normalized literacy, numeracy or composite test score on
treatment dummies, the interaction variable indicated, and interactions of the variable and treatment dummies.
Regressions control for baseline test scores (except where the interacted variable is the baseline score itself), and stratum
dummies. Standard errors are clustered at the village level.
* denotes significance at 0.10; ** at 0.05; *** at 0.01

44
Table 16. Cost Effectiveness of Interventions
Intervention
ML CHAMP ML-CHAMP
Panel A: Cost Summary
Pratham Staff
$37,521 $30,699 $68,219
Volunteer Time $21,653 -- $21,653
Training, monitoring, materials $14,861 $4,730 $17,289
Total $74,035 $35,428 $107,162
Panel B: Standard Deviation Improvement per $100 spent--Children
Literacy -- -- $4.29
Math $4.33 $1.70 $3.36
Composite -- $2.06 $3.64
Children affected 4,572 4,447 4,653
Panel C: Standard Deviation Improvement per $100 spent--Mothers
Literacy $3.73 $4.19 $3.95
Math $2.84 $2.42 $3.13
Composite $3.07 $2.85 $3.32
Mothers affected 2,176 2,115 2,151
Costs incurred in rupees converted to dollars using 2011 exchange rate of
46.7 rupees/dollar.
Volunteer time estimated based on average daily wage in non-agricultural
occupations.
Cost-effectiveness estimates in Panels B and C computed based on total
costs of each program divided by the a) effect sizes reported in Tables 4
and 8, for mothers and children, respectively, b) number of beneficiaries,
and c) 100.

45
Appendix
A Location Selection
Because of the slightly different organization of the villages in Rajasthan and Bihar, a
different selection procedure was used in each state. The procedure focused on finding
distinct geographic units, called ‘hamlets’, in which the programs could run, while limiting
spillovers. Hamlet eligibility was therefore determined based on size, according to the
number of households, and distance from other target hamlets. Size and location of
hamlets were determined from “Rapid Rural Assessments” conducted in study blocks.
In Rajasthan, dispersed clusters of villages comprise larger geographic units known as,
‘Gram Panchayats’. Villages are divided into smaller hamlets, which are known there as,
‘mohellas’. Hamlets in Rajasthan met the size eligibility requirements if they contained
between 40 and 100 households, whereby a household is defined as a family that eats
from one kitchen.14 To limit spillovers, one hamlet per village was selected.
All villages in two blocks, Kekri and Bhinay, were targeted for the intervention in
Rajasthan. Within each village, first preference was given to hamlets with 60-80
households, as Pratham and the research team determined this to be the approximate
size to support one adult literacy class. In each village, the hamlet with 60-80
households was selected unless there was more than one, in which case one hamlet of
that size was chosen at random. If there were no hamlets in a village with 60-80
households, second preference was given to hamlets of 40-100 households. Again, if
there was only one hamlet in a target village with 40-100 households, it was selected;
otherwise, one hamlet of that size was selected at random. To identify a total of 240
target hamlets, the boundaries of Kekri and Bhinay were extended into a third block.
Target hamlets were identified using the same procedure used in Kekri and Bhinay until
240 had been selected. The average size of study hamlets was 74 households. Targeted
households contained 7.0 members, on average.
In Bihar, the village boundaries are less distinct and villages are much denser than in
Rajasthan. Each panchayat has multiple revenue villages, with each revenue village
comprising smaller hamlets known there as, ‘tolas’ (the equivalent of a ‘mohella’ in
Rajasthan). Within each revenue village, there is typically a main village and hamlets
that surround the main village. In Bihar, hamlets were considered eligible if they
contained between 25 and 150 households15 and if they were at least 500 meters from any
other target hamlet.
14 In one instance, a hamlet containing more than 100 households was split into smaller “synthetic
hamlets” for the purposes of the intervention. 15 The household criteria differed between Rajasthan and Bihar because the criteria for Rajasthan
would not have produced a sufficient number of eligible hamlets were it applied in Bihar. Due to the
higher upper bound on number of households, Pratham agreed to hold more than one class in a
target hamlet where necessary in Bihar.

46
All revenue villages and hamlets in two blocks, Dhamdaha and B. Kothi, were targeted
for the intervention. To limit spillovers, hamlets in Bihar were selected only if their
boundaries were 500 meters or more from the boundaries of other target hamlets.16 If
an eligible hamlet was closer than 500 meters in proximity from another eligible hamlet,
the hamlet with between 40 and 80 households was selected, as Pratham determined this
to be the approximate size to support one adult literacy class. If more than one hamlet
contained 40-80 households within the 500 meter radius, one was randomly selected for
the intervention. Second preference was given to a hamlet of 25-150 households
whenever no hamlet in the 500 meter radius contained between 40 and 80 households.17
If the eligible hamlets were in an adjacent row, the hamlets at the ends of the row were
selected.18
The selection process yielded 269 eligible hamlets. Of those, 240 hamlets were
randomly selected, and the remainder were used by Pratham for pilot activities. The
average size of study hamlets was 68 households. Targeted households contained 6.6
members, on average.
B Power Calculations
The following section is a formatted version of the Power Calculations section of the
original 3ie grant proposal.
We look to prior Pratham interventions when setting a reasonable effect size. The data used
for our power calculations come from an evaluation of the Pratham Read program in Uttar
Pradesh (UP) in 2005-2006. This evaluation utilized the literacy test included in the
ASER survey to measure child literacy levels both at a baseline and at an endline twelve
months later. Banerjee et al. (2007) found that being in a school and grade that was
assigned a balsakhi (Pratham-trained tutor) resulted in a 0.15 standard deviation (SD)
increase in test scores in the first year of the program, and a 0.25 SD increase in year two.
Meanwhile, fewer than 50% of the students ever interacted with the balsakhi—and those
who didn’t also did not appear to improve relative to the control group.
Our study, which uses child literacy levels as the primary outcome measure and basis for
sample size, will similarly observe endline literacy levels nine months after baseline
measurements. We assume similar impact and takeup—a 0.15 SD average treatment
effect on children, and a 50% mother participation rate in the literacy program or the
materials intervention—implying a 0.3 SD impact on children whose mothers
participated. We are relatively confident in this compliance figure given past experience
in these communities, and because the mothers have already signaled their interest in
improving their children’s education by sending their young children to reading classes.
The estimated takeup rate will be refined through pilots.
16 GPS coordinates were used to confirm distances between the boundaries of hamlets. Distances
were checked between hamlets within revenue villages as well as across revenue villages. 17 In any given 500-meter radius, if there were no hamlets of 40-80 households but multiple hamlets
of 25-150 households, one hamlet of 25-150 households was selected at random. 18 In two cases, target hamlets were eliminated because Pratham determined that adult literacy rates
were too high to sustain classes.

47
According to data from the UP study, baseline reading levels and other demographic
covariates explain a little more than 60% of the variance in endline reading levels. Hence,
our power calculations use R2=0.62. Conducting an analysis of variance of reading level
for children between 5 and 8 years old in the UP study, and defining the village as our
cluster, we find an intra-cluster correlation (rho) of 0.079
Using the above inputs, and accepting a type two and type one error rate of 80% and 5%
respectively, we calculate that the minimum number of clusters required to detect a 0.15
standard deviation impact is 108 (implying 54 for one treatment and 54 for the control).
We round the villages-per-group number from 54 up to 60 and apply it to the other two
interventions. Our power calculations show that if we survey 20 children per village (and
their mothers), we require 60 villages per treatment group to distinguish an impact of
0.15 standard deviations. Since we aim to detect this impact within each state, this
sample is required for each state independently. Therefore, our sample totals to 240
villages per state, or 480 villages total. Pooling the two states together, the minimum
detectable effect would be 0.1 standard deviations. Further pooling the different
treatments that include mother literacy (ML + ML-CHAMP) or mother-child activities
(CHAMP + ML-CHAMP) will allow detection of even smaller impacts when compared to the
control. Based on these (and the above) assumptions, we believe our power calculations
are relatively conservative.
It is important to note that the effect size applies to both the comparison between the
intervention groups and the control group, as well as the comparison between
interventions. For example, the impact of the combined intervention will have to be
greater than that of the individual interventions by at least 0.15 SD for an advantage to be
detectable. We hypothesize that these individual interventions are highly complementary,
and thus that this difference is not unreasonable.
We will also look at differential outcomes in subgroups that are socially marginalized to
greater and lesser degrees. It is important to note that the assumptions in our power
calculations do not account for this sub-group analysis within each state. However, as
mentioned above, pooling the two states together can increase our sample and thus allow
such comparisons. For example, while our target population of illiterate children with
illiterate mothers defines an already deeply marginalized group, some of the children
enrolled in read classes will have semi-literate mothers, and will be included in both the
sample and population. Therefore, on top of measuring the improvement in learning levels
of our target population, these additional data will allow us to measure improvement vis-
a-vis the less marginalized groups (e.g. children with semi-literate mothers). Additionally,
as described in the heterogeneity section, we will examine differential outcomes for girls
and boys. Though girls of this age range in these regions do not perform lower than the
corresponding boys, they may be considered marginalized for other social reasons.
Appendix Tables

48
Appendix Table 1: Baseline Means of Variables in Rajasthan and Bihar Samples
Rajasthan Bihar
(1) (2)
Education and Learning
Mother education level 0.741 0.922
(2.173) (2.480)
Father education level 4.819 3.124
(4.436) (4.296)
Mother's weighted baseline literacy score 3.220 2.871
(2.535) (2.548)
Mother's weighted baseline numeracy score 3.612 2.601
(3.504) (3.391)
Child attends school 0.840 0.827
(0.366) (0.378)
Child attends private school 0.155 0.0240
(0.362) (0.153)
Child's weighted baseline literacy score 3.144 2.626
(2.546) (2.224)
Child's weighted baseline numeracy score 3.022 2.730
(3.018) (3.116)
Assets and Demographics
First Principal Component of Durables Ownership 1.250 -1.202
(2.281) (1.397)
Does household have electricity 0.808 0.154
(0.394) (0.361)
Roof has cement, stone, metal, beams, or plastic 0.981 0.626
(0.136) (0.484)
Family's largest source of income was self-employed agriculture or rent agriculture 0.517 0.385
(0.500) (0.487)
Family's largest source of income was agricultural wages, regular wages, or
irregular wages 0.311 0.543
(0.463) (0.498)
Number of children (14 and younger) in household 4.671 5.038
(1.777) (1.657)
Number of adults (15 and older) in household 3.682 2.980
(2.099) (1.395)
Mother Time Use
Hours weekly spent on housework 21.27 23.10
(8.374) (9.185)
Hours weekly spent on agricultural, paid, and livestock work 46.11 26.38
(17.78) (19.03)
Hours weekly spent looking after, telling stories to, or playing with kids 5.300 7.456
(3.945) (4.886)
Hours weekly spent helping with homework or reading with kids 1.378 2.385
(2.458) (3.876)

49
Appendix Table 2a: Question-wise Literacy Baseline Means
Baseline Endline Baseline Weighted Score
Weight Weight Mothers Children
(1) (2) (3) (4)
Identify Pictures 2 2 1.495 1.458
(0.388) (0.566)
Read Letters 2 2 0.392 0.690
(0.712) (0.838)
Read simple words 1 1 0.146 0.251
(0.341) (0.416)
Read complex words 1 1 0.131 0.214
(0.327) (0.393)
Read paragraph 2 2 0.197 0.250
(0.596) (0.662)
Read Story * -- 2
Write own name *
1
1
0.565
(0.496)
Write child's name * 1 1 0.117
(0.321)
Write village name * -- 2
Literacy score
10
14
3.042
2.863
(2.547) (2.390)
Notes:
Columns 1 and 2 display the weights used in aggregating the test questions.
* Denotes that the question appeared only on the mother test.

50
Appendix Table 2b: Question-wise Numeracy Baseline Means
Baseline Endline Baseline Weighted Score
Weight Weight Mothers Children
(1) (2) (3) (4)
Subtraction word problem * 1 1 0.402
(0.490)
Division word problem * 1 1 0.228
(0.420)
Read digits 1-9 1 1 0.593 0.626
(0.471) (0.466)
Identify digits 1-9 1 1 0.448 0.529
(0.459) (0.474)
Read digits 11-20 1 1 0.299 0.449
(0.443) (0.492)
Identify digits 11-20 1 1 0.192 0.349
(0.371) (0.457)
Identify numbers 21-99 1 1 0.103 0.163
(0.286) (0.339)
Single digit addition 1 1 0.127 0.266
(0.333) (0.442)
Double digit addition 1 1 0.101 0.207
(0.302) (0.405)
Single digit subtraction 1 1 0.0781 0.151
(0.268) (0.358)
Double digit subtraction 2 2 0.0865 0.124
(0.407) (0.483)
Tell time: 10:30 * 0.5 0.5 0.117
(0.212)
Tell time: 1:40 * 0.5 0.5 0.0826
(0.186)
Dial a number read out loud * 1 1 0.238
(0.426)
Numeracy score 14 14 3.096 2.863
(3.483) (3.075)
Notes:
Columns 1 and 2 display the weights used in aggregating the test questions.
* Denotes that the question appeared only on the mother test.

51
Appendix Table 3: Mother Question-wise Treatment Effects--Language
Baseline Mean Endline Mean OLS: Impact of treatment in endline
All Obs Control ML CHAMP ML-CHAMP N
(1) (2) (3) (4) (5) (6)
Identify Pictures 0.747
[0.194]
0.775
[0.186]
0.00275
[0.00477]
0.00759
[0.00471]
0.0116**
[0.00450]
8552
Read Letters 0.196
[0.356]
0.173
[0.338]
0.0351***
[0.00593]
0.00927
[0.00580]
0.0474***
[0.00609]
8552
Read simple words 0.146
[0.341]
0.115
[0.308]
0.0165***
[0.00472]
0.0117**
[0.00486]
0.0244***
[0.00499]
8552
Read complex words 0.131
[0.327]
0.0922
[0.278]
0.00540
[0.00436]
0.00973**
[0.00460]
0.0108**
[0.00432]
8552
Read paragraph 0.0985
[0.298]
0.0776
[0.268]
0.00243
[0.00421]
0.00714
[0.00507]
0.00334
[0.00443]
8552
Read story 0.0627
[0.242]
0.00303
[0.00968]
0.0141
[0.0112]
0.00571
[0.00986]
8580
Write own name 0.565
[0.496]
0.556
[0.497]
0.0794***
[0.0145]
0.00835
[0.0134]
0.0907***
[0.0143]
8552
Write child's name 0.117
[0.321]
0.105
[0.306]
0.0212***
[0.00668]
0.00537
[0.00615]
0.00571
[0.00986]
8551
Write name of village 0.0856
[0.280]
0.00843
[0.0113]
0.0136
[0.0133]
0.0159
[0.0116]
8580
Notes:
Columns 3, 4 and 5 display estimated coefficients of a regression of the outcome in each row on
treatment group dummies, controlling for stratification unit dummies and baseline values (where
available).
Standard errors are clustered at the village level.
* denotes significance at 0.10; ** at 0.05; *** at 0.01

52
Appendix Table 4: Mother Question-wise Treatment Effects--Math
Mean Endline Mean OLS: Impact of treatment in endline
All Obs Control ML CHAMP ML-CHAMP N
(1) (2) (3) (4) (5) (6)
Read digits 1-9 0.593
[0.471]
0.627
[0.460]
0.0967***
[0.0134]
0.0457***
[0.0129]
0.140***
[0.0128]
8552
Identify digits 1-9 0.448
[0.459]
0.469
[0.460]
0.0661***
[0.0103]
0.0304***
[0.0100]
0.109***
[0.0108]
8552
Read digits 11-20 0.299
[0.443]
0.298
[0.442]
0.0677***
[0.00997]
0.0204**
[0.00965]
0.0779***
[0.0101]
8552
Identify digits 11-20 0.192
[0.371]
0.182
[0.361]
0.0228***
[0.00677]
0.0130*
[0.00737]
0.0399***
[0.00752]
8552
Identify numbers 21-99 0.103
[0.286]
0.0964
[0.276]
0.0140***
[0.00435]
0.00636
[0.00441]
0.0147***
[0.00439]
8552
Single digit addition 0.127
[0.333]
0.129
[0.335]
0.0124
[0.00752]
0.0134*
[0.00727]
0.0321***
[0.00762]
8552
Double digit addition 0.101
[0.302]
0.0781
[0.268]
0.00200
[0.00550]
0.00555
[0.00592]
0.0137**
[0.00565]
8552
Single digit subtraction 0.0781
[0.268]
0.0692
[0.254]
0.00651
[0.00574]
0.00445
[0.00580]
0.00592
[0.00570]
8551
Double digit subtraction 0.0432
[0.203]
0.0580
[0.234]
0.0127*
[0.00674]
0.0134*
[0.00689]
0.00608
[0.00615]
8552
Double digit subtraction with carryover 0.0355
[0.185]
0.00662
[0.00735]
0.0147*
[0.00882]
0.00253
[0.00728]
8580
Subtraction word problem 0.402
[0.490]
0.240
[0.427]
0.0239
[0.0149]
0.0238
[0.0160]
0.0381***
[0.0145]
8552
Division word problem 0.228
[0.420]
0.134
[0.340]
0.0264**
[0.0110]
0.0271**
[0.0115]
0.0238**
[0.0115]
8552
Tell time at 10:30 0.233
[0.423]
0.252
[0.434]
0.00952
[0.0111]
0.00460
[0.0129]
-0.00427
[0.0124]
8552
Tell time at 1:40 0.165
[0.371]
0.0767
[0.266]
0.0107
[0.00771]
0.00830
[0.00773]
-0.00331
[0.00765]
8552
Dial a number that is read out to her 0.238
[0.426]
0.261
[0.440]
0.0287**
[0.0111]
0.00522
[0.0119]
0.0283**
[0.0112]
8552
Notes:
Columns 3, 4 and 5 display estimated coefficients of a regression of the outcome in each row on treatment
group dummies, controlling for stratification unit dummies and baseline values (where available).
Standard errors are clustered at the village level.
* denotes significance at 0.10; ** at 0.05; *** at 0.01

53
Appendix Table 5: Child Question-wise Treatment Effects--Language
Baseline Mean Endline Mean OLS: Impact of treatment in endline
All Obs Control ML CHAMP ML-CHAMP N
(1) (2) (3) (4) (5) (6)
Identify Pictures 0.729
[0.283]
0.758
[0.285]
0.000473 0.0104*
[0.00633] [0.00625]
0.00966
[0.00603]
18282
Read Letters 0.345
[0.419]
0.387
[0.430]
0.00110 0.0146
[0.00892] [0.00917]
0.0272***
[0.00894]
18282
Read simple words 0.251
[0.416]
0.271
[0.421]
-0.00517 0.0124
[0.00826] [0.00862]
0.0121
[0.00818]
18282
Read complex words 0.214
[0.393]
0.175
[0.352]
0.00116 0.00983
[0.00642] [0.00633]
0.0122**
[0.00618]
18282
Read paragraph 0.125
[0.331]
0.117
[0.321]
-0.00211 0.00215
[0.00620] [0.00621]
0.0134**
[0.00611]
18282
Read story 0.0757
[0.265]
0.00713 0.00749
[0.00875] [0.00838]
0.0101
[0.00823]
18282
Notes:
Columns 3, 4 and 5 display estimated coefficients of a regression of the outcome in each row on
treatment group dummies, controlling for stratification unit dummies and baseline values (where
available).
Standard errors are clustered at the village level.
* denotes significance at 0.10; ** at 0.05; *** at 0.01

54
Appendix Table 6: Child Question-wise Treatment Effects--Math
Mean Endline Mean OLS: Impact of treatment in endline
All Obs Control ML CHAMP ML-CHAMP N
(1) (2) (3) (4) (5) (6)
Read digits 1-9 0.626
[0.466]
0.652
[0.459]
0.0249***
[0.00938]
0.0227**
[0.00925]
0.0397***
[0.00885]
18282
Identify digits 1-9 0.529
[0.474]
0.560
[0.474]
0.0203**
[0.00856]
0.0385***
[0.00876]
0.0399***
[0.00861]
18282
Read digits 11-20 0.449
[0.492]
0.487
[0.496]
0.0195*
[0.0101]
0.0275***
[0.0102]
0.0482***
[0.00974]
18282
Identify digits 11-20 0.349
[0.457]
0.387
[0.470]
0.00338
[0.00936]
0.0189*
[0.00987]
0.0332***
[0.00887]
18282
Identify numbers 21-99 0.163
[0.339]
0.200
[0.367]
0.00104
[0.00724]
0.00285
[0.00713]
0.00800
[0.00692]
18282
Single digit addition 0.266
[0.442]
0.311
[0.463]
0.0130
[0.0104]
0.0254**
[0.0104]
0.0192*
[0.0102]
18282
Double digit addition 0.207
[0.405]
0.196
[0.397]
0.0231**
[0.00946]
0.00822
[0.00914]
0.00790
[0.00880]
18282
Single digit subtraction 0.151
[0.358]
0.171
[0.377]
0.00757
[0.00838]
0.0193**
[0.00896]
0.0143*
[0.00842]
18282
Double digit subtraction 0.0622
[0.241]
0.133
[0.339]
0.0132
[0.00912]
0.0153*
[0.00914]
0.0131
[0.00918]
18282
Double digit subtraction with carryover
0.0579
[0.234]
0.0150*
[0.00779]
0.00115
[0.00742]
0.00637
[0.00693]
18282
Notes:
Columns 3, 4 and 5 display estimated coefficients of a regression of the outcome in each row on treatment
group dummies, controlling for stratification unit dummies and baseline values (where available).
Standard errors are clustered at the village level.
* denotes significance at 0.10; ** at 0.05; *** at 0.01