the impact of modernization of justice on court …. sviatschi...the impact of modernization of...
TRANSCRIPT

The Impact of Modernization of Justice on Court
Efficiency in Costa Rica
Yuri Soares and Maria Micaela Sviatschi1
Abstract
Over the last years, there has been growing awareness regarding the
importance of transparent and effective courts to achieve economic
development. However, many Latin American countries find that their
judicial system have important deficiencies in terms of access and
efficiency. This paper studies the effect of court modernization on caseload
clearance rates in Costa Rica. The analysis exploits the fact that the
modernization occurred at different points in time. This observed variation
in the allocation of the program across time and space provides a potential
instrument to identify the causal effect of the modernization on courts
efficiency. We find that the program is associated with an increase of 5
percent in clearance rates and with a reduction of 75 dollars per case
disposed. The results are robust to alternative specifications.
1 Yuri Soares is Evaluation Economist at the Inter-American Development Bank’s Office of Evaluation
and Oversight (OVE). Maria Micaela Sviatschi is a Research Fellow at the Inter-American Development Bank’s Office of Evaluation and Oversight (OVE).
I. Introduction
Many studies have recognized the importance of transparent and effective courts to
achieve economic development.2 A well functioning judicial system that can enforce contracts and
protect property rights equitably and efficiently will also encourage investment, an important factor
for economic development. However, many Latin American countries find that their judicial
systems have important deficiencies in terms of access and efficiency. One important barrier is the
high rate of case backlogs that affect the rule of law and the ability to enforce human rights. In
some countries, it can take months or even years to achieve an outcome via the courts, increasing
the costs of access and encouraging informal means of resolution. This problem is exacerbated in
rural areas where judges have heavy workloads and lack equipment and assistance. According to a
survey in Ecuador, 95 percent of respondents consider the legal process to be slow and
complicated. The same problem exists in Peru, where an ordinary case takes approximately three
years to reach a resolution, even though the code of civil procedure defines a maximum length of
300 days.3
In order to solve these problems, during the 1990’s many Latin American countries have
implemented significant judicial reforms. Most of these have included modernizing judicial
procedures, designing outreach programs, providing legal education, expanding the geographical
coverage of judicial institutions and promoting alternative resolution mechanisms. In this paper we
will study the impact of the Program for the Modernization of the Administration of Justice in
Costa Rica that was implemented jointly with the IDB in 1996. The objective of the program was
to improve the management of judicial offices and public services by building a modern system of
administration that included the development of a computerized legal-data system.
The justice sector in Costa Rica is made up the Judiciary, the Ministry of Justice, The
Office of the Attorney General of the Republic and the Community Defense Office. The Judiciary
is composed of justices of the peace, ordinary and appellate courts, and various chambers of the
Supreme Court of Justice.4 The case of Costa Rica is especially important since, contrary to most
Latin American countries, it has maintained a democratic tradition and a broad sense of social
justice, providing its inhabitants with a reliable and credible judicial system. According to
Kauffman’s governance indicators, Costa Rica is among the highest ranked Latin American
2 Sherwood et al (1994) and Levine (1998) have considered the quality of the judicial system as an important
influence on economic development. In the same vein, Buscaglia et al (1999) have pointed out the importance of solving cases in a fair and timely manner for economic development. 3 World Bank (1999). “Court Performance around the World” 4 The Supreme Court is the highest judicial body in Costa Rica, composed of 22 judges that are chosen by the
Legislative assembly for an eight-year term. The appellate courts (tribunals) are divided in eight judicial districts: San José, Alajuela, Cartago, Heredia, Guanacaste, Puntarenas, Zona Sur and Zona Atlantica. The Courts of first judgment (juzgados) are the lower courts and are territorially distributed over the 81 cantons. The Justices of Peace are local courts that handle minor cases (contravencionales y de menor cuantia) and are territorially spread over the districts in which the cantons are divided.

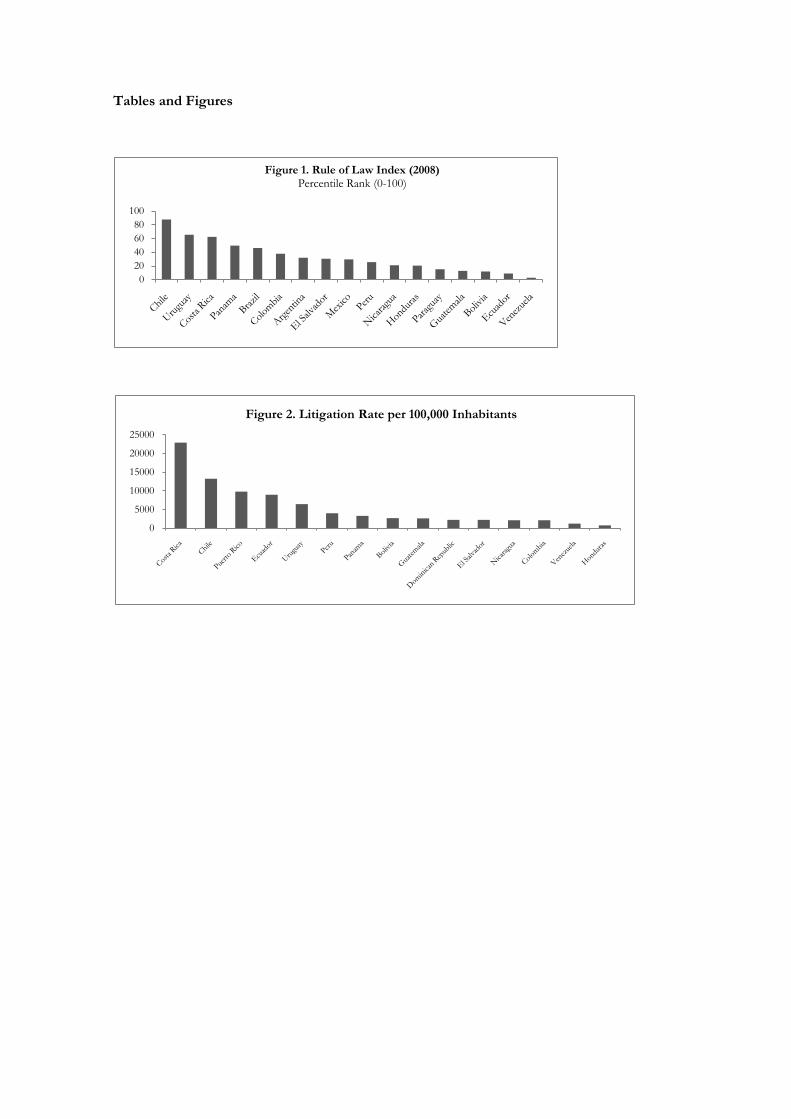
countries in the Rule of Law Index (see Figure 1).5 In addition, the Judiciary is composed of 17
judges per 100,000 inhabitants, placing the country among the highest in the region for this
indicator (see Figure A1 in the appendix).
Despite the fact that Costa Rica has good governance indicators in comparison with other
Latin American countries, its judicial system has a high incidence of backlogs and congestion in
courts that impede effective access to justice. At the beginning of the 1990’s, an ordinary
commercial or civil case could take up to seven years, and a simple executive judgment around
three years.6 The potential causes of this inefficiency are the centralization of the administrative
operations in San Jose, the lack of technology for administering resources, the formalism of judicial
procedures, the inefficiency of the judicial offices and the lack of knowledge on behalf of the
judges. According to citizen perception surveys about the judicial system, only 25 percent trusts on
the speed of the judicial system.
The purpose of this paper is to analyze the effectiveness of the judicial modernization program
on courts efficiency. In particular, we will investigate the effect of the automated system on
caseload clearance rates and on expenditure per case disposed. The expected effect of the program
on productivity is not evident. One might expect that since the program was intended to facilitate
and reduce time of administrative operations, we would find an increase in the proportion of cases
filed per year that are disposed during the same year. However, many studies suggest that the
adoption of new technology could have some negative effects that might offset the improvements
in productivity, such as the change in the ratio of winners-losers due to the modernization.7 Blair et
al (1994) has pointed out that inefficiencies in court procedures and management can provide
opportunities for rent-seeking attorneys and judges, making this group reluctant to accept the
reform. In addition, Tomlinson (2006) has suggested that there may be negative effects on
productivity and performance at early stages of the implementation of an electronic filing system.
According to surveys, these negative effects could be caused by staff being unfamiliar with
utilization of new systems, changes in the organizational structure of courts and the duplication of
work in the transition between paper and electronic records.
This paper attempts to find the causal effect of the program, using detailed judicial caseload
data in every court from 2001 to 2008. It provides an important contribution to the literature
addressing the impact of technology on court productivity. While there are many programs that
attempt to improve the efficiency of courts, there is little empirical evidence on the impact of such
programs. In particular, we provide a rigorous empirical assessment to estimate the impact of
5 The same results are found with the indexes: Voice and Accountability, Political and Stability, and Government Effectiveness. 6 Inter American Development Bank (1994). “Proposal for a loan for the modernization of the
administration of justice”
7 Bertschek and Kaiser (2004). “Productivity Effects of Organizational Change”. Management Science 50(3),
pp. 394-404.

Modernization Program on court efficiency in Costa Rica. Since the modernization of the system
was implemented in different judicial offices at different moments in time, we can exploit the
variation in time and space in order to estimate a causal effect. Accordingly, we propose a
difference-in-differences model that controls time and court fixed effect. We also employ
propensity score reweighting techniques in order to obtain the most similar comparison group.8
One important point to emphasize for our identification strategy is that in the case of Costa Rica it
is not necessary to control for all components of the judicial reform or laws which may be
simultaneously operating to improve efficiency, because most of them are all national and therefore
any effect arising from these laws would be captured by the time effect. The only component that
might affect our estimation is the creation of mega-offices that change the number of judicial
matters per court and time spent on each matter. In order to control for this component, we
include as a control the number of judicial matters per court.
The main findings are that court modernization is associated with an increase of 5 percent of
the clearance rates and that it reduces the cost per case disposed by 75 dollars. These results hold
when testing different specifications, suggesting the existence of a causal effect.
The rest of the paper proceeds as follows: Section II presents a brief summary of Costa Rica
Judicial Reform, Section III provides a literature review, Section IV describes the data, Section V
presents the estimation strategy; and Section VI, the results. Finally, Section VII concludes.
II. Review of Costa Rica Judicial Reform
Since the beginning of the 1990s, Costa Rica has embarked on a judicial reform process
that has been characterized by the commitment of different political actors such as the state
powers, the private sector and many civil societies. The objective of this reform has been to
enhance the access to justice and its efficiency, and mostly consisted of the following elements: the
introduction of orality in penal processes, the nation-wide implementation of a new criminal
procedure, the promotion of alternative dispute resolution mechanisms, the establishment of a
unique number per case, the modernization of courts through technology and the creation of
“mega-offices.”
Costa Rica is among the first countries in the region to introduce reforms in its criminal
prosecution system. In 1973, the country introduced orality and a mixed system in the criminal
procedure, which divided the process into two stages: the instruction and the oral and public trial.
This change in the judicial process from written to oral procedure promoted judicial transparency
and efficiency. In 1998, it was also implemented a new Criminal Procedure Code that restructured
administratively the Judiciary and the Public Ministry, transferring the functions of investigation
and prosecution of crimes to the latter.
8 Throughout the paper we will use the term “judicial offices” as a synonym of courts since the number of tribunals in the database is not very large.

Another central component of reform was the implementation of the Law for Alternative
Conflict Resolution Mechanisms, which included arbitration and conciliation as alternative ways for
solving conflicts. This law is especially important in the case of Costa Rica, where citizens
traditionally resort to courts in order to solve many conflicts that do not need to be assessed by
judges, causing a high rate of litigiousness, congestion and a negative public perception about the
administration of justice. According to a report by Cejamericas, Costa Rica is among the countries
in the region with the highest litigation rates (see Figure 2).
In 1998, the Supreme Court approved the creation of “mega-offices” that consisted of the
clustering of services for courts of the same instance into a single office. The mega-offices
introduced many technological improvements, such as computers, Internet access, Intranet and
centralized notification services. There was also a specialization of functions achieved by separating
the offices of family, child support and domestic violence. Another significant change was the
establishment of the Unique Number per Case (Número Unico de Expediente) in which all the cases
were codified with a unique and unrepeatable number which remains the same during the whole
judicial process, allowing the monitoring of court processes.
III. Literature Review
Many programs were implemented in many Latin American countries in order to reduce the
low clearance rates and the large backlog of cases. Programs centered on changing from a manual
to an automated system to record cases, merit based promotions, legal training, active case-
management style and judge’s specialization of tasks.
According to previous studies evaluating the impact of modernization programs, scarce
empirical evidence exists to support their benefits. Most of the evidence is based on case studies
that provide extensive observational research of the reforms. The most common approach found in
this literature is to ask judicial actors about their views and how the reform has affected their work.
Ravinovich (2008) has analyzed the computerization of Israeli courts and pointed out the
advantages and disadvantages of introducing modernized techniques; however, there is no empirical
evidence of the impact on court productivity indicators. In the same vein, Domino (1995) has also
studied, through perception surveys of jury administrators, the impact of the introduction of
technology on jury selection and has found that 91 percent of the respondents believe that
automation has enabled their court to process jurors more efficiently by reducing the time and cost.
The U.S. National Center for State Courts has also provided evidence of the most recent
advances in court technology improvements. Using the survey method, Holbrooks (2001), has
showed how the implementation of an automated case management system would improve
productivity and efficiency in a court in Missouri.9 Since the automated system allows queries by file
9 This system was developed in the information retrieval system since it was very time intensive to locate files and information. The manual system consisted of index cards alphabetically filed containing limited information. A request of information from attorneys and government agencies could last up to thirty

name, file number and attorney name, it reduces the time spent on information requests, allowing
the clerks to concentrate on their judicial duties. Similarly, Webster (1996) has suggested multiple
benefits from an automated court support system such as the reduction of repetitive tasks, the
increase of information accessibility and organization integration and enhanced statistics.
Tomlinson (2006), based on data from opinion surveys, has studied the impact of electronic filing
processes in trial courts and has suggested negative effects on productivity and performance at early
stages of the implementation of the system.
A study done by Buscaglia et al (1999) has provided an extensive qualitative assessment of the
judicial reforms in several countries. This study suggests that Chile, Peru, Panama, France and
Singapore have experienced positive results in terms of efficiency from their reforms. In the case of
France, where the reform consisted of the separation of judicial and administrative tasks, the study
states that since the judges do not spend time on administrative tasks such as filing cases, they are
not overburdened by new cases. In the case of Panama, where the reform has established a merit-
based competition in order to assign judicial positions and an increase in the capital budget, the
authors found a positive effect on court efficiency. In the case of Peru, they suggest that the
reform, which consisted in purchasing new computers for Lima, creating new judicial institutions
and changing the assignment of tasks, reduced the time judges spent on administrative tasks and
increased the caseload clearance rates. The same is found in the case of Singapore, where the
introduction of Technology Court (a videoconferencing system that allows lawyers to examine
witnesses outside the courtroom) and the separation of administrative responsibilities from judges
increased court efficiency. This study has also analyzed the factors that most affect the performance
of the court system measured by clearance rates, procedural times and cost elasticity of supply of
court services. Surveying a representative sample of judges, they find that the use of technology to
track cases and the budget allocated to capital investments for each court have a positive and
significant effect on clearance rates. They suggest that countries with inefficient court performance
should concentrate on increasing the capital investment in infrastructure and information
technology rather than increasing staff sizes and salaries since these do not have an impact on
clearance rates.
In conclusion, while many papers present a qualitative analysis of different judicial reforms,
none of them provides empirical and rigorous evidence of the effects associated.
IV. Data
The data consists on a panel of observations of 264 judicial offices for the period 2000-2008
covering 67 cantons.10 Two different sets of data are used: judicial office-level data on disposed,
minutes with the manual system. With the automated system each case has an easily locatable identification number, eliminating the constant need to transfers files among staff. The clerk only enters the data upon initiation of the case and then easily tracks the information by an identification number. 10 Costa Rica is composed of seven provinces and the provinces are divided into 81 cantons.
filed, pending cases and courts expenditure, and information on the dates in which the judicial
offices were modernized.
The information about the dates of treatment of each judicial office was obtained from the
project executor unit. In every office the modernization process was quite similar; it consisted on
the specialization of functions, the clustering of work on the same judicial matter and the setting up
of microcomputer networks and automated word processing and case flow management. With this
information we construct our treatment variable which is a dummy indicating if the judicial office
was modernized or not. Table A1 from the appendix describes the year in which each office was
treated. Over the analyzed period, most of the judicial offices were modernized at different
moments. This variation in time and space is used to identify the causal effect of the program on
court efficiency.
The judicial office-level data set comes from the Planning Department of the Judiciary.11 It
includes 121 treated judicial offices and 143 control judicial offices. This data is used to construct
two court efficiency outcome indicators: the caseload clearance rates and the expenditure per
disposed case in each judicial office. We define the caseload clearance rates as the ratio between the
number of disposed cases and the sum of new filed cases, re-filed cases and pending cases from the
last year. One important limitation of this study is the lack of data on judicial process duration
available to calculate a third efficiency indicator of interest: case resolution duration. Table 1
presents summary statistics for these judicial indicators. A total of 5,060 observations are available
for estimation and variability exists across courts and time in these outcomes.
In Costa Rica, the Judicial jurisdiction is divided into 8 areas: Agrarian Law, Penal, Civil,
Juvenile (Penal Juvenile), Labor, Administrative, Family and Notary discipline. Table 2 presents the
clearance rates disaggregated by judicial matter. The courts with smaller clearance rates are those
that solve civil, administrative and child support matters.
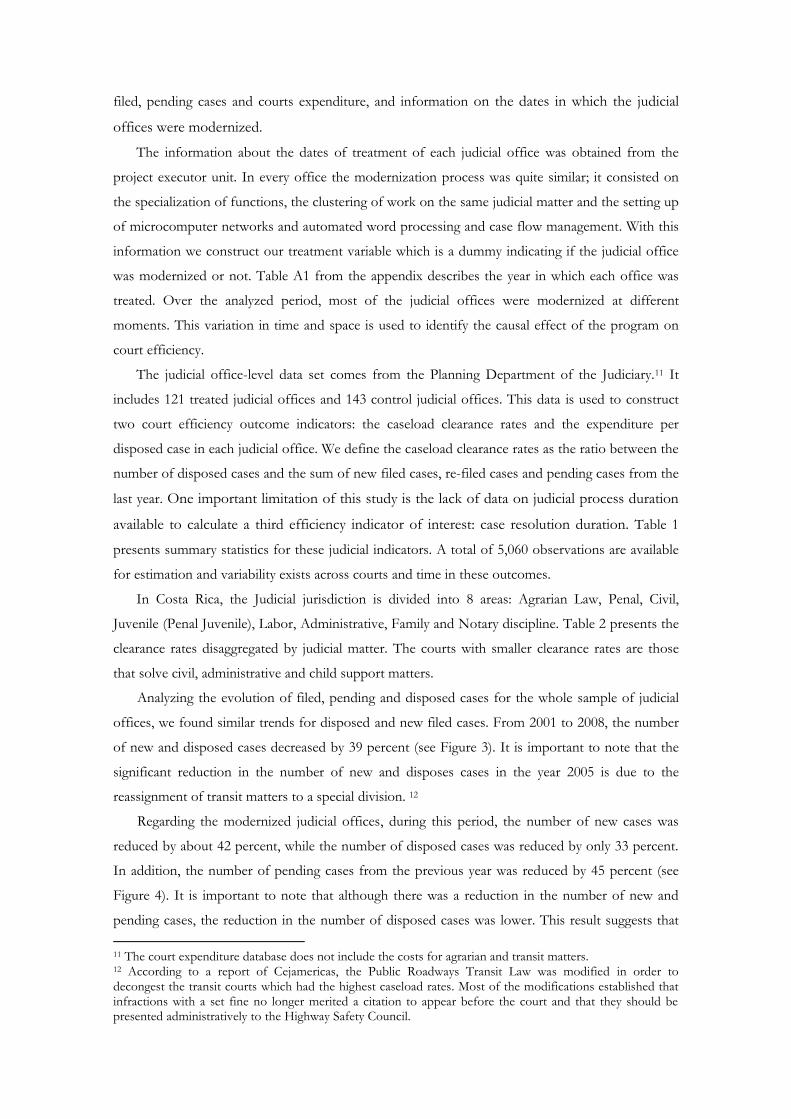
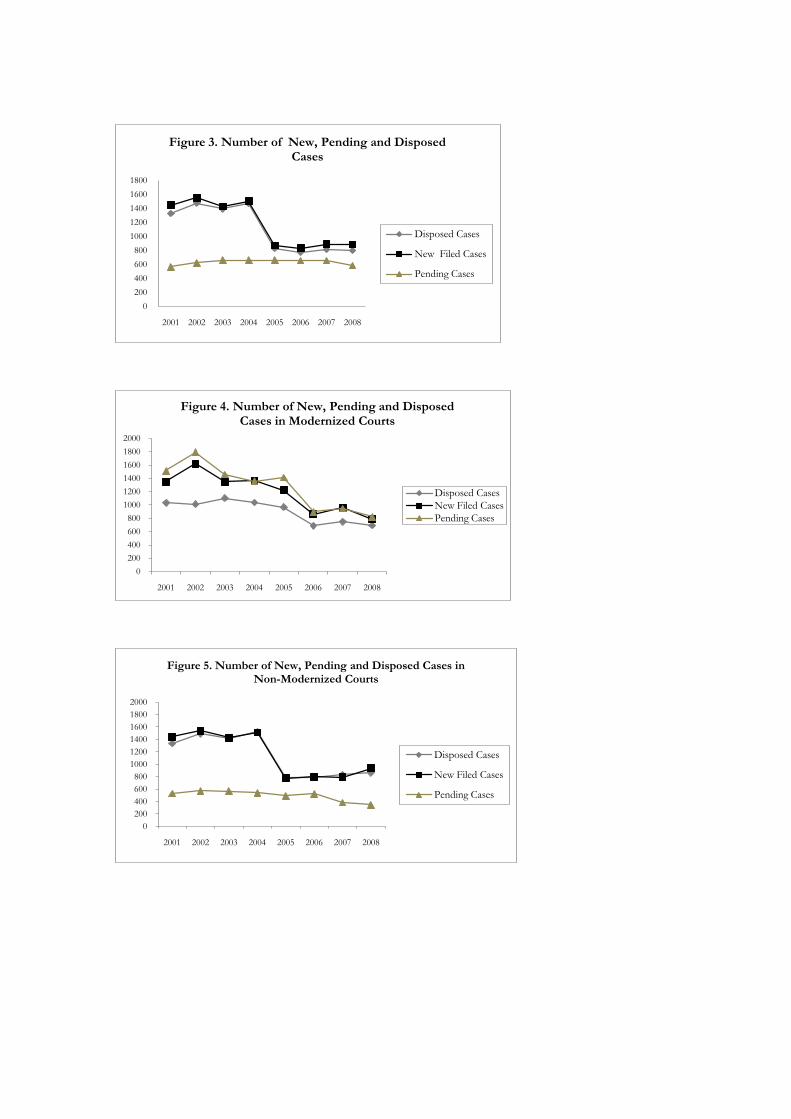
Analyzing the evolution of filed, pending and disposed cases for the whole sample of judicial
offices, we found similar trends for disposed and new filed cases. From 2001 to 2008, the number
of new and disposed cases decreased by 39 percent (see Figure 3). It is important to note that the
significant reduction in the number of new and disposes cases in the year 2005 is due to the
reassignment of transit matters to a special division. 12
Regarding the modernized judicial offices, during this period, the number of new cases was
reduced by about 42 percent, while the number of disposed cases was reduced by only 33 percent.
In addition, the number of pending cases from the previous year was reduced by 45 percent (see
Figure 4). It is important to note that although there was a reduction in the number of new and
pending cases, the reduction in the number of disposed cases was lower. This result suggests that
11 The court expenditure database does not include the costs for agrarian and transit matters. 12 According to a report of Cejamericas, the Public Roadways Transit Law was modified in order to decongest the transit courts which had the highest caseload rates. Most of the modifications established that infractions with a set fine no longer merited a citation to appear before the court and that they should be presented administratively to the Highway Safety Council.
there was an increase in court productivity during the period. On the other hand, if we analyze the
non-treated judicial offices, we find that the reduction in disposed and new cases is the same.
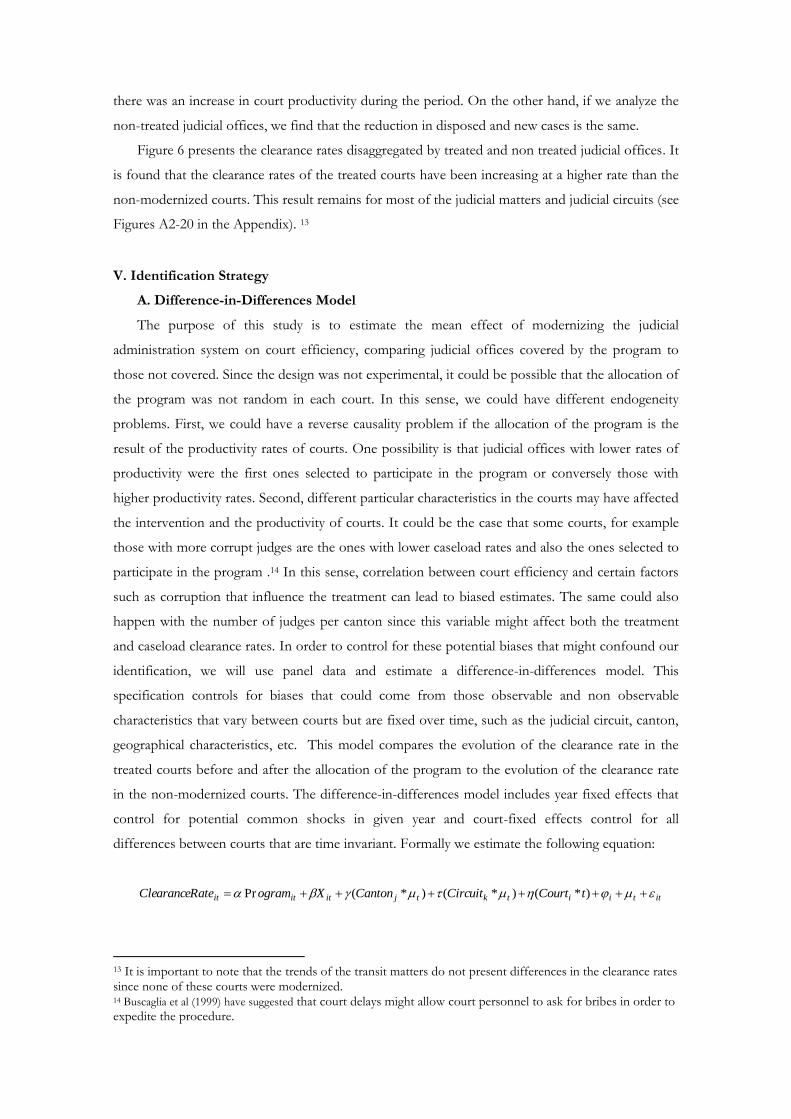
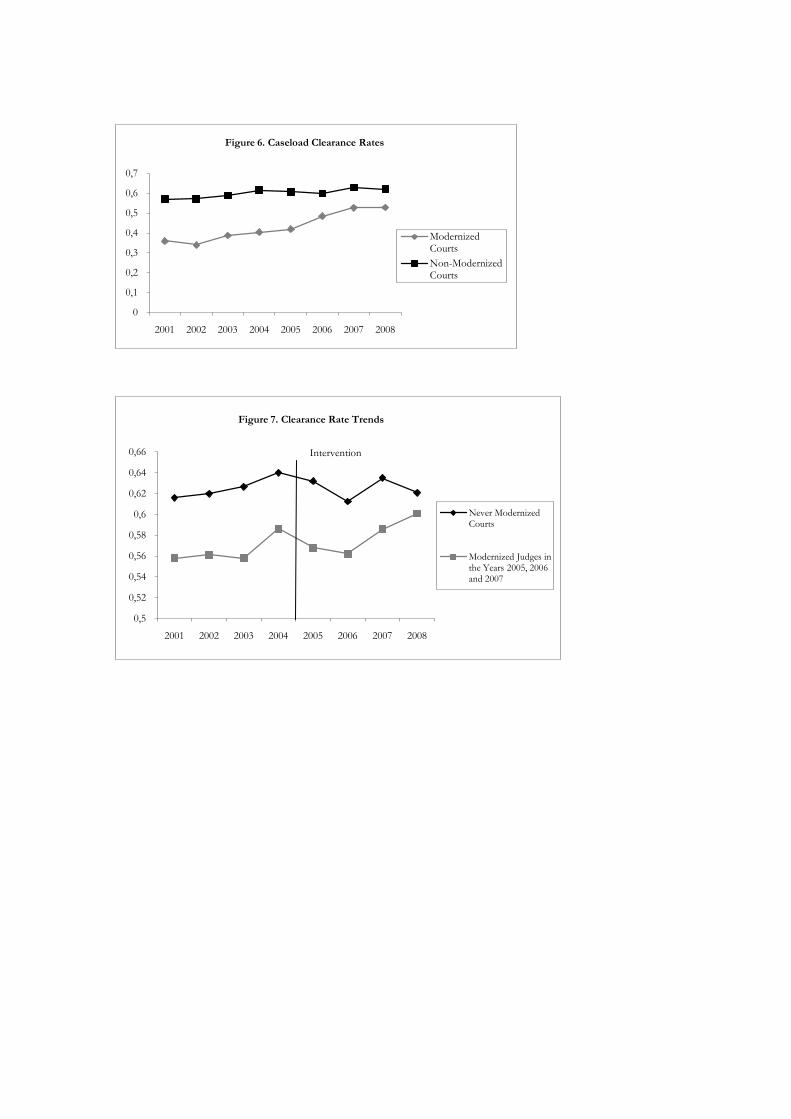
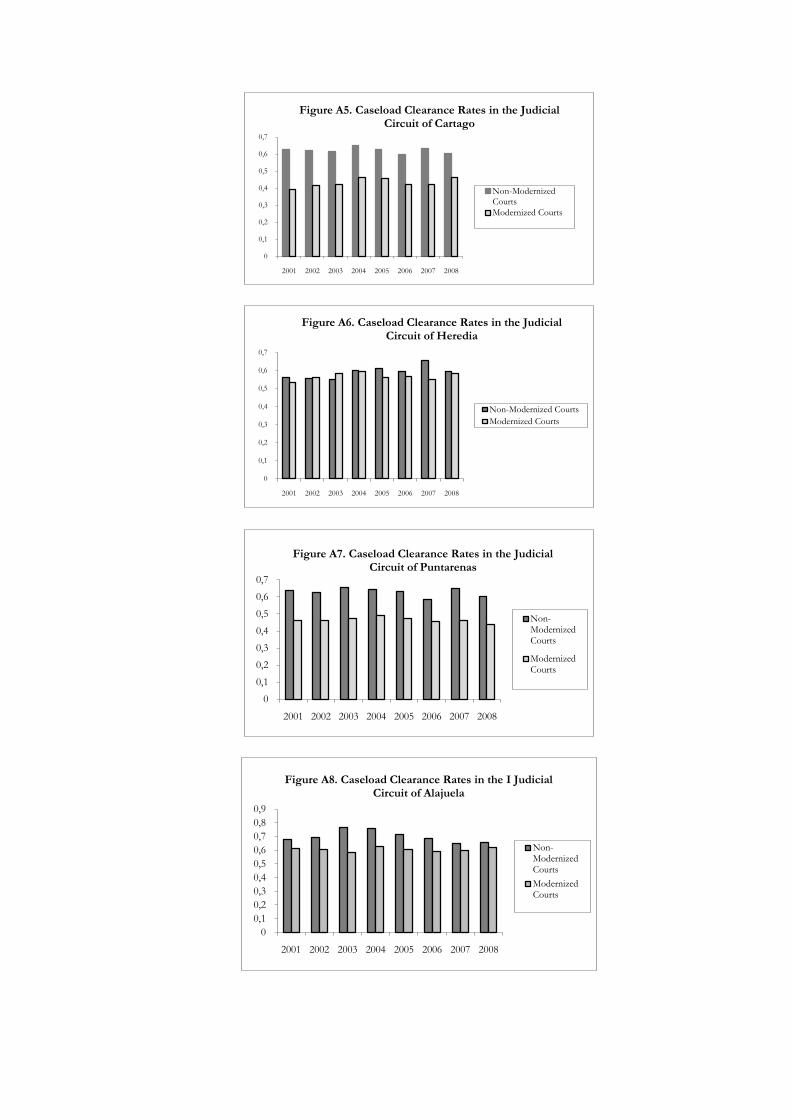
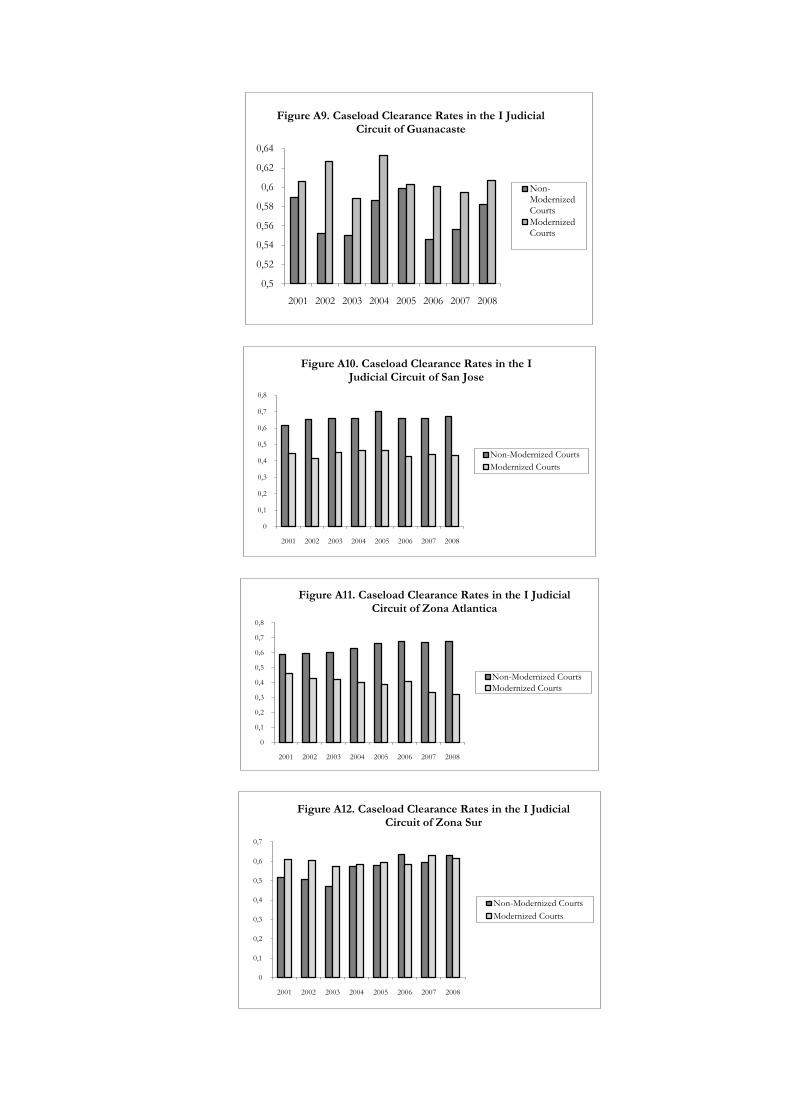
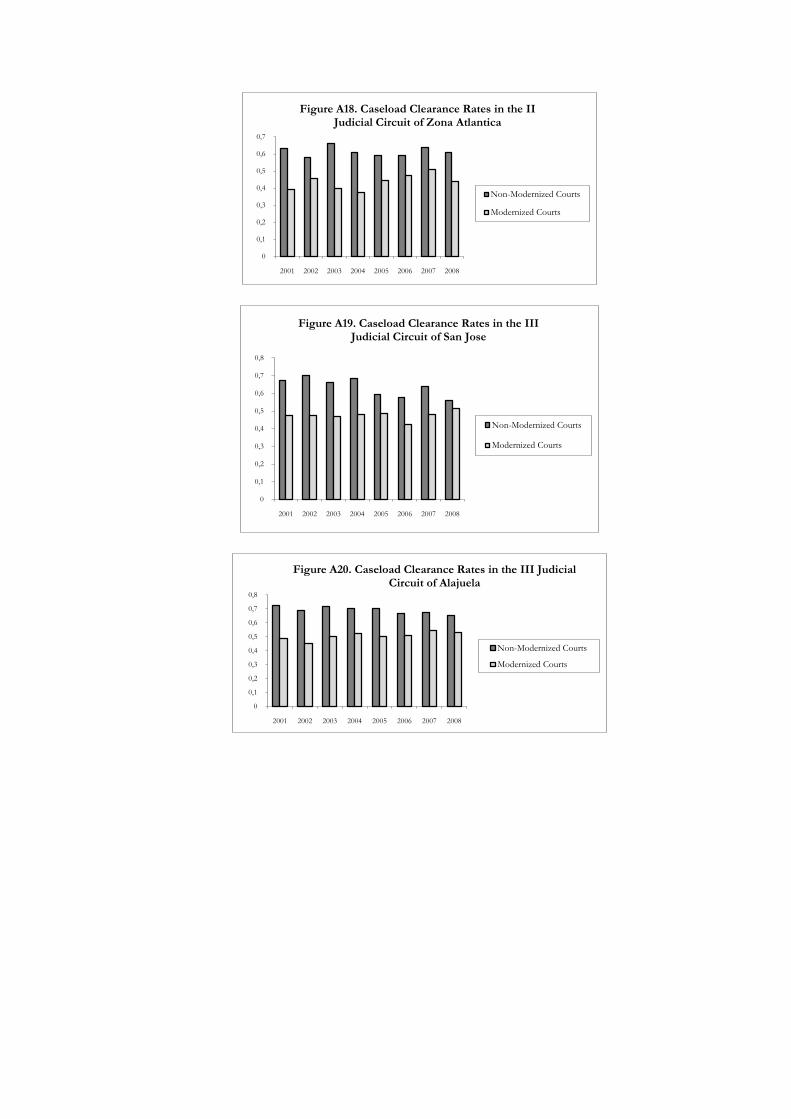
Figure 6 presents the clearance rates disaggregated by treated and non treated judicial offices. It
is found that the clearance rates of the treated courts have been increasing at a higher rate than the
non-modernized courts. This result remains for most of the judicial matters and judicial circuits (see
Figures A2-20 in the Appendix). 13
V. Identification Strategy
A. Difference-in-Differences Model
The purpose of this study is to estimate the mean effect of modernizing the judicial
administration system on court efficiency, comparing judicial offices covered by the program to
those not covered. Since the design was not experimental, it could be possible that the allocation of
the program was not random in each court. In this sense, we could have different endogeneity
problems. First, we could have a reverse causality problem if the allocation of the program is the
result of the productivity rates of courts. One possibility is that judicial offices with lower rates of
productivity were the first ones selected to participate in the program or conversely those with
higher productivity rates. Second, different particular characteristics in the courts may have affected
the intervention and the productivity of courts. It could be the case that some courts, for example
those with more corrupt judges are the ones with lower caseload rates and also the ones selected to
participate in the program .14 In this sense, correlation between court efficiency and certain factors
such as corruption that influence the treatment can lead to biased estimates. The same could also
happen with the number of judges per canton since this variable might affect both the treatment
and caseload clearance rates. In order to control for these potential biases that might confound our
identification, we will use panel data and estimate a difference-in-differences model. This
specification controls for biases that could come from those observable and non observable
characteristics that vary between courts but are fixed over time, such as the judicial circuit, canton,
geographical characteristics, etc. This model compares the evolution of the clearance rate in the
treated courts before and after the allocation of the program to the evolution of the clearance rate
in the non-modernized courts. The difference-in-differences model includes year fixed effects that
control for potential common shocks in given year and court-fixed effects control for all
differences between courts that are time invariant. Formally we estimate the following equation:
ittiitktjititit tCourtCircuitCantonXogramateClearanceR )*()*()*(Pr
13 It is important to note that the trends of the transit matters do not present differences in the clearance rates since none of these courts were modernized. 14 Buscaglia et al (1999) have suggested that court delays might allow court personnel to ask for bribes in order to expedite the procedure.

where itateClearanceR is the caseload clearance rate for court i in year t ; itogramPr is a dummy
variable which takes the value of 1 if the court was modernized and 0 otherwise; Xit is the number
of judicial matters and expenditures that vary across time and per court; t is the time effect
common to all the courts; i is a court fixed effect; tjCanton * is an interaction of the canton
fixed effect and the time fixed effect, controlling for all the variables that vary in time and per
canton but affect equally all the courts that are part of the canton; tkCircuit * controls for all
circuit fixed effects and for all variables that vary in time and per judicial circuit and affect equally
all the courts that are part of the circuit; )*( tCourti is the specific trend per court.
We include two important covariates: the number of judicial matters and the expenditures of
courts which vary across courts and time. By including the number of judicial matters we are
controlling for the specialization and clustering of judicial matters that was also part of the judicial
reform via the creation of mega-offices. The variable that controls for the expenditures is used as a
proxy of the capital budget resources allocated to each court and judge salaries. It is reasonable
to argue that an increase in investment in court equipment and infrastructure and in judge’s
salaries might tend to increase the clearance rate. Many studies, such as Contini et al. (2007) have
suggested that one of the most common factors attributed to the excessive duration of trials or
inefficiencies is the lack of resources.
We do not include a proxy for corruption since we can argue that although the corruption rates
might differ between courts, they might also be fixed in time as many institution related variables.
The error it is a canton time-varying error which is generally assumed to be independent across
time and space; however, as the analysis uses panel data, the errors could be correlated across time
in the same canton. In addition, since our data is at the court level it also is possible that the errors
of courts that belong to the same canton are correlated. In the case of a positive correlation, the
standard errors could be computed smaller and the null hypothesis could be over rejected. To avoid
potential biases in their estimation, standard errors are clustered at the canton level, allowing an
arbitrary covariance structure within cantons over time.15
One key assumption of this model is that the evolution of control courts (those that were not
part of the program) is an unbiased estimator of what would have happened to the treated courts in
the absence of the program. Although this assumption cannot be tested directly, we can analyze the
pre-program trends of both groups. If in the pre-intervention period the trends are not different,
then it is plausible to assume that in the absence of treatment the trends would remain the same in
the post-intervention period. In order to test the similarity of the previous trends we take two
approaches. First, following Galiani (2006), using only observations for the pre-intervention period
we estimate a modified version of equation (1) which instead of the treatment variable includes an
interaction between the year dummy and a dummy variable that takes the value of 1 if the court will
15 See Bertrand et al. (2004).
be eventually treated and 0 if the court will never be treated. We find that the null hypothesis that
the pre-intervention year dummies are the same for the eventually treated and control courts cannot
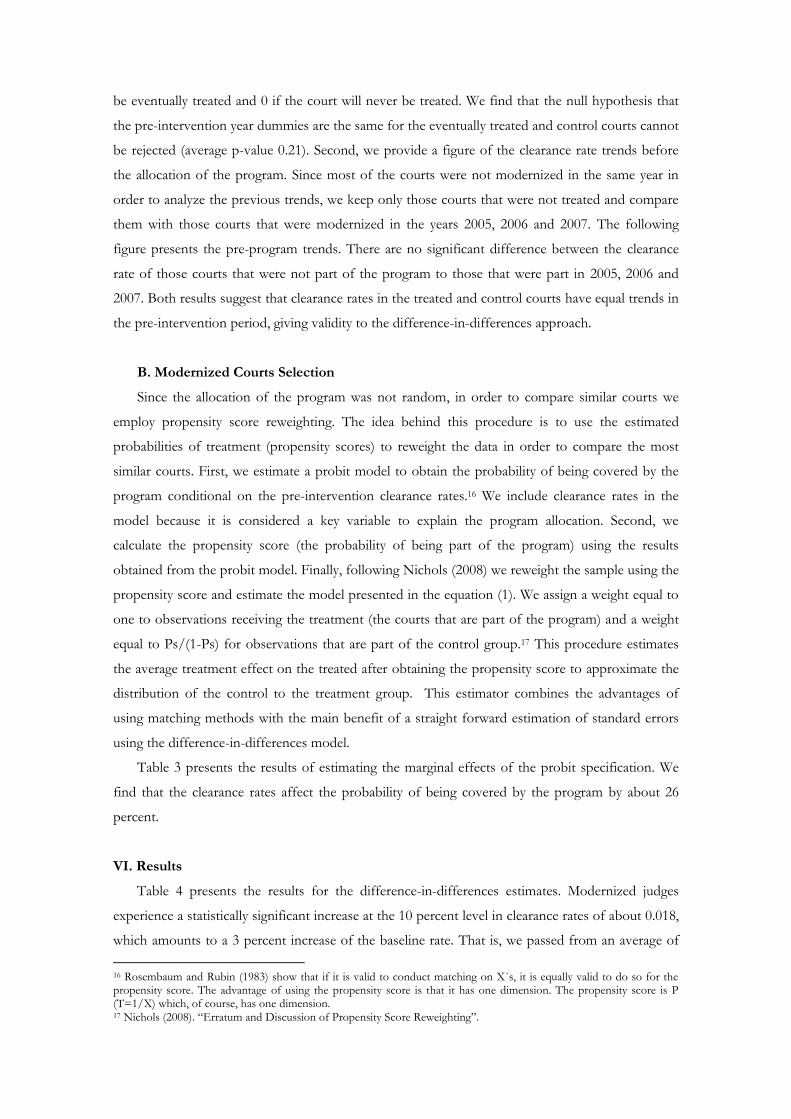
be rejected (average p-value 0.21). Second, we provide a figure of the clearance rate trends before
the allocation of the program. Since most of the courts were not modernized in the same year in
order to analyze the previous trends, we keep only those courts that were not treated and compare
them with those courts that were modernized in the years 2005, 2006 and 2007. The following
figure presents the pre-program trends. There are no significant difference between the clearance
rate of those courts that were not part of the program to those that were part in 2005, 2006 and
2007. Both results suggest that clearance rates in the treated and control courts have equal trends in
the pre-intervention period, giving validity to the difference-in-differences approach.
B. Modernized Courts Selection
Since the allocation of the program was not random, in order to compare similar courts we
employ propensity score reweighting. The idea behind this procedure is to use the estimated
probabilities of treatment (propensity scores) to reweight the data in order to compare the most
similar courts. First, we estimate a probit model to obtain the probability of being covered by the
program conditional on the pre-intervention clearance rates.16 We include clearance rates in the
model because it is considered a key variable to explain the program allocation. Second, we
calculate the propensity score (the probability of being part of the program) using the results
obtained from the probit model. Finally, following Nichols (2008) we reweight the sample using the
propensity score and estimate the model presented in the equation (1). We assign a weight equal to
one to observations receiving the treatment (the courts that are part of the program) and a weight
equal to Ps/(1-Ps) for observations that are part of the control group.17 This procedure estimates
the average treatment effect on the treated after obtaining the propensity score to approximate the
distribution of the control to the treatment group. This estimator combines the advantages of
using matching methods with the main benefit of a straight forward estimation of standard errors
using the difference-in-differences model.
Table 3 presents the results of estimating the marginal effects of the probit specification. We
find that the clearance rates affect the probability of being covered by the program by about 26
percent.
VI. Results
Table 4 presents the results for the difference-in-differences estimates. Modernized judges
experience a statistically significant increase at the 10 percent level in clearance rates of about 0.018,
which amounts to a 3 percent increase of the baseline rate. That is, we passed from an average of
16 Rosembaum and Rubin (1983) show that if it is valid to conduct matching on X´s, it is equally valid to do so for the propensity score. The advantage of using the propensity score is that it has one dimension. The propensity score is P (T=1/X) which, of course, has one dimension. 17 Nichols (2008). “Erratum and Discussion of Propensity Score Reweighting”.
54 annually disposed cases per 100 filed cases to 57 annually disposed cases with the court
modernization program.
Column (2) presents the results including dummies for the interaction of canton and year fixed
effects, judicial circuit and year fixed effect and courts trends. We found that the results and
significance increased to 6 percent.
One concern regarding the difference-in-differences model is that some characteristics that
vary over time and across courts can be correlated with the clearance rates and the allocation of the
program. To address this issue in column (3), we include the expenditures per court since we could
argue that the most efficient cantons are the ones that spend more resources in courts. We found
that results do not change under this specification.
The results from the re-weighted difference-in-differences model are presented in columns (4)-
(6)(we include also all the controls that were included in the difference-indifferences model).
Results are almost unaltered (an increase of about 5 percent is found and is significant at the 1
percent level).
Overall, these results suggest that the modernization of courts generates a significant increase
in the clearance rates. The parameter estimates for caseload clearance rates are remarkably stable,
both across specifications, and, more importantly, between specifications.
We also analyze a second efficiency indicator using courts expenditure data. We use this data to
calculate the average cost of disposed cases per court. These results are presented in Table 5. We
found that modernization of courts reduces the cost per case disposed by about 75 dollars, which
amounts to a 10 percent reduction of the baseline rate (we use as the baseline rate the average cost
per case resolved of the treated courts in the pre-program period which is of about $767.24). Since
an average of 1,000 cases is solved per court annually, we estimate a reduction of about $75,000 per
year in each court.
A. Regarding Potential Negative Effects
In this section, we will test two hypotheses. First, we will analyze whether the clearance rates
have been increasing over the years of implementation of the program. We would expect an
increase in the clearance rates for those judges in courts that have been modernized for a longer
period of time since there is a learning process in the use of the program. Second, we test whether
in the first year of the program the existence of a transitional negative effect could offset the
improvements of the modernization. In this regard, we would expect to see small or null effects
during the first year of implementation.
In order to test the first hypotheses, we construct a variable that measures the years of
implementation for each court and estimate the model presented in equation (1), replacing the
treatment variable for the variable years of implementation. Table A2 in the appendix presents the
results and it is found that there is no statistical evidence that over the years there is an increase in

clearance rates. This could be due to the fact that the learning may only increase over a short initial
period and not indefinitely. 18
In order to test the second hypothesis, we follow two approaches. The first one considers the
differences in the same courts of the impact of the treatment in the first year of implementation to
the following years. We construct the variable “treatment in year 1” that takes the value of 1 only in
the first year of the implementation and 0 in the other years, and the variable “treatment from the
second year” that takes the value of 1 from the second year of implementation onwards. Table 6
presents the results. In column (1) and (3), it is found that the effects of the modernization are
smaller in the first year of the program, suggesting the existence of negative transitional effects that
reduce the positive effects. In the first year, we find an improvement in the caseload clearance rates
of about 2 percent while from the second year onwards this effect more than duplicates (about 5
percent). However, in column (4), when we introduce the weights the effect from the second year
onwards lose statistical significance.
The second approach divides the data in groups of courts by taking into account the years of
implementation. We first estimate the equation (1) only comparing those courts that have one year
of implementation with those that are not covered by the program and second we estimate the
same equation for a subgroup of courts that have been with the program for more than two years.
Table 7 and Table 8 present the results. We find that while the courts that are in the first year of the
program experience negative effects in the clearance rates, the courts that have two or more years
of program implementation experience positive effects. Furthermore, the magnitude of the effect
for this last group of courts is even higher than the average effect found using the whole sample of
courts.
B. Falsification Tests
In this section we exploit the timing of the allocation of the program to construct placebo
treatments. In order to do so, we keep pre-treatment observations and we assign the treatment
before it was actually assigned. If the model presented in the previous section is correctly specified,
the allocation of the modernization program should not affect the clearance rates between the years
in which it did not exist. We test this for several false treatments: if the treatment was assigned one,
two, three and four years before it was actually assigned. The results are presented in Table 9.
Clearly, the program did not affect the caseload clearance rates in these years, discarding the
possibility of the results being product of spurious correlation in the data, thus giving validity to our
previous results.
18 Results do not change if instead of including a linear specification we include dummy interactions for each year of implantation.
C. Impact by Poverty Regions
The judicial backlog and congestion of courts in Costa Rica have particularly inhibited the
provision of justice to the poorer segments of the society. According to a survey done by the
program executing unit, only 17 percent of the respondents with elementary education resolved
their conflicts with the judicial system. In this sense, we found important to test if there is any
differential effect in terms of efficiency and access by type of region. We define the indicator of
access as the number of new cases filed per 100,000 inhabitants. In order to test this hypothesis, we
use data of the extreme poverty levels using the statistics division of the regions from the National
Institute of Statistics and Census. Since the regions of Brunca, Chorotega and Pacifico Central present
the higher levels of extreme poverty, first we generate a dummy which takes the value of one if the
justice offices are part of these regions and zero otherwise (if they are part of the Central, Huetar
Norte and Huetar Atlántica regions).19 Second, we estimate equation (1) restricting the sample to the
poorer regions. We expected to find that by reducing the transaction costs, the program would have
increased the access to justice for these regions. In the case of the caseload clearance rates, we
found that the program has only significant effects for the regions with higher levels of poverty.
This result may be related to the fact that access to technology, an important component of the
program, should be easier in rich regions rather than in poverty ones where besides of the program
the access is difficult to find. Finally, for the outcome of access we found that there are no
significant effects for both groups.20
We check the robustness of this result using data at the level of canton of extreme poverty
levels; we divide the sample by extreme poverty quantile categories (we use four quantiles) and
estimate equation (1) for each quantile. We found that there are only significant effects in those
cantons that are at the higher quantile of poverty. This result holds for other definitions of poverty.
VII. Conclusions
This paper shows that the program of Modernization for the Administration of Justice in
Costa Rica increased court efficiency. It provides evidence that training, giving computers and
other resources to courts can have important results in case backlogs and costs per case
disposed. Using a combination of methods, we found that modernized courts experience on
average an increase of about 6 percent in clearance rates and an annual reduction of about
$75,000 in disposed cases.
This study suggests one way to increase court efficiency in the context of developing
countries, where the backlogs of cases have been increasing substantially over the last years.
Although there is general recognition of the importance of judicial reform for development,
little is known about the impact of improvements in this area. While the previous literature has
19 About a 60 percent of the courts that are modernized are in non-poverty regions. 20 Regression results are available upon request.
focused on case studies, this paper is among the first to provide empirical evidence of the
impact of a court modernization program.
Many factors suggest that the relation between the program and the case management of
the courts may be causal. First, the treatment and the control group exhibited similar time
trends in the pre-intervention period, validating the difference-in-differences identification
strategy. Second, the model includes court and time fixed effects and the conclusions are
robust to the inclusion of time-varying covariates that may affect the allocation of the program
and may also influence clearance rates. Results remain after controlling for heterogeneous
courts, reweighting the control and treatment groups according to each court’s propensity
score. Furthermore, the falsification test suggests that any other plausible explanation of the main
estimates can be eliminated and strengthens the causal interpretation.
One important limitation of this study is the lack of data on judicial process duration
available to calculate a third efficiency indicator of interest: case resolution duration.
Nevertheless, since we find that the number of disposed cases increased, it is reasonable to
think that this result was achieved via a reduction in the time used to dispose each case.
Future research should analyze the impact of these modernization programs by developing
a more detailed analysis, differentiating by type of judicial matter (civil, penal, labor, etc.) In this
paper, we could not address this analysis because there was not enough statistical power to do a
rigorous study in each subsample of matters.
This study sheds light on the effect of court modernization programs. We found significant
and positive impacts on clearance rates. It is important to note that one significant feature that
contributes to this result is the general consensus and commitment that existed in Costa Rica
among political actors to reform the judicial system. As Blair et al (1994) mentioned: consensus
for judicial reform is an essential pre-existing condition in order to get positive results from
modernization programs. In this sense, it is important to take into account the context of each
country in order to externalize the results.
Our future research will consider the relationship between the increase in the clearance
rates and crime indicators. This is also another important outcome, especially since over the
last years delinquency rates have been increasing in Costa Rica.
Tables and Figures
0
20
40
60
80
100
Figure 1. Rule of Law Index (2008)Percentile Rank (0-100)
0
5000
10000
15000
20000
25000
Figure 2. Litigation Rate per 100,000 Inhabitants
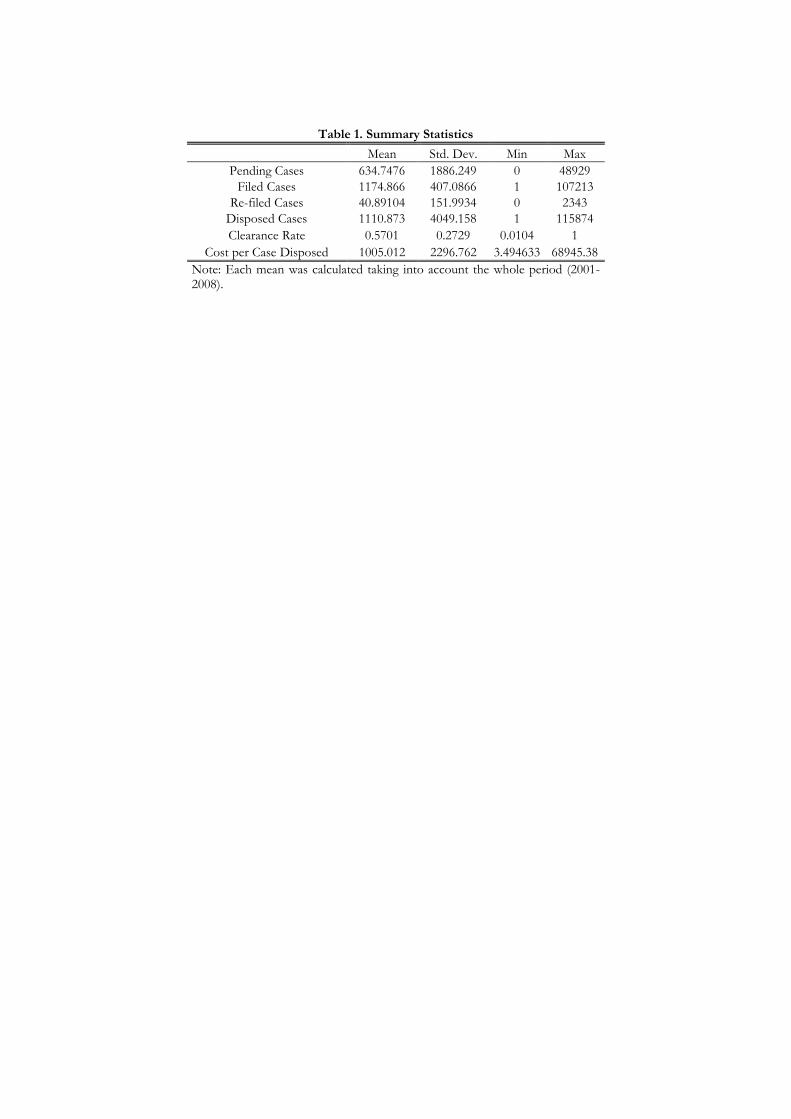
Table 1. Summary Statistics
Mean Std. Dev. Min Max
Pending Cases 634.7476 1886.249 0 48929
Filed Cases 1174.866 407.0866 1 107213
Re-filed Cases 40.89104 151.9934 0 2343
Disposed Cases 1110.873 4049.158 1 115874
Clearance Rate 0.5701 0.2729 0.0104 1
Cost per Case Disposed 1005.012 2296.762 3.494633 68945.38
Note: Each mean was calculated taking into account the whole period (2001-2008).

Table 2. Filed, Re-filed, Pending, Disposed Cases and Caseload Clearance Rates for all the Judicial Circuits per Type of Matter (mean for the period 2001-2008)
Type of Matter
New Filed Cases
Pending Cases from Last Year
Re-filed Cases
Disposed Cases
Clearance Rate
Agrarian Law 297.78 412.80 3.62 245.48 0.34
Civil 729.11 819.07 12.51 438.22 0.28
Administrative 6700.63 10283.77 84.23 4005.40 0.23
Faltas y Contravenciones 667.20 371.84 5.65 680.59 0.65
Family 896.13 592.69 6.27 801.05 0.54
Labor 256.38 307.50 20.35 275.55 0.47
Notary Discipline 18.88 3.63 0.20 18.63 0.82
Other 68.75 8.94 1.25 67.94 0.86
Penal 1986.80 627.55 178.55 2148.20 0.77
Juvenile 484.18 173.14 95.91 559.36 0.74
Child Support 312.64 1041.40 - 144.65 0.11
Transit 5472.50 938.09 30.71 5559.18 0.86
Domestic Violence 639.25 131.58 2.56 663.44 0.86
Constitutional 15045.13 2566.63 7.71 14921.75 0.85
0
200
400
600
800
1000
1200
1400
1600
1800
2001 2002 2003 2004 2005 2006 2007 2008
Figure 3. Number of New, Pending and Disposed Cases
Disposed Cases
New Filed Cases
Pending Cases
0
200
400
600
800
1000
1200
1400
1600
1800
2000
2001 2002 2003 2004 2005 2006 2007 2008
Figure 4. Number of New, Pending and Disposed Cases in Modernized Courts
Disposed Cases
New Filed Cases
Pending Cases
0
200
400
600
800
1000
1200
1400
1600
1800
2000
2001 2002 2003 2004 2005 2006 2007 2008
Figure 5. Number of New, Pending and Disposed Cases in Non-Modernized Courts
Disposed Cases
New Filed Cases
Pending Cases
0
0,1
0,2
0,3
0,4
0,5
0,6
0,7
2001 2002 2003 2004 2005 2006 2007 2008
Figure 6. Caseload Clearance Rates
Modernized Courts
Non-Modernized Courts
0,5
0,52
0,54
0,56
0,58
0,6
0,62
0,64
0,66
2001 2002 2003 2004 2005 2006 2007 2008
Figure 7. Clearance Rate Trends
Never Modernized Courts
Modernized Judges in the Years 2005, 2006 and 2007
Intervention

Table 3. Probit Estimates of Allocation of the Program (marginal effects)
Clearance Rates -0.26040*** (0.02836) Observations 3843
Note: Standard errors are in parenthesis. * Statistically different from zero at the .1 level of significance. ** Statistically different from zero at the .05 level of significance. *** Statistically different from zero at the .01 level of significance.

Table 4. Justice Modernization Program and Court Efficiency
Difference-in-Differences Model
Re-weighted Difference-in-Differences Model
(1) (2) (3) (4) (5) (6)
Justice Program (=1) 0.01843* 0.03194** .029459* 0.02001** 0.02640* .027964** (0.00976) (0.01401) (.0152566) (0.00912) (0.01359) (.0130855)
Number of Judicial Matters
0.01722 (0.01127)
0.04164*** (0.01097)
.0628217*** (.0116389)
0.01184 (0.00923)
0.04319*** (0.01101)
0676693*** (.0146485)
Expenditures per Court -3.16e-09 -3.92e-09
(3.37e-09) (3.08e-09)
% in Clearance Rates 3.41 5.91 5.44 3.70 4.88 4.88
Observations 4893 4877 3725 4747 4747 3601 R-squared 0.002 0.054 0.0036 0.0037 0.054 0.0045 Number of courts 264 263 219 251 251 208
Note: Each column reports the estimated coefficients of a regression model in which the dependent variable is the caseload clearance rate. Standard errors clustered at the “canton” level are in parenthesis. Columns (1) and (4) include year fixed effects and the number of judicial matters per court. Column (2) and (5) include dummies for the interaction of canton and year fixed effects, judicial circuit and year fixed effect and courts trends. Column (3) and (6) include the expenditures per court. * Statistically different from zero at the .1 level of significance. ** Statistically different from zero at the .05 level of significance. *** Statistically different from zero at the .01 level of significance.

Table 5. Justice Modernization Program and Court Expenditure per Disposed Case
Difference-in-Differences Model
Re-weighted Difference-in-Differences Model
Justice Program (=1) -89.90631** -75.17066** (38.54641) (35.13216) Number of Judicial Matters 7.134304 18.81995 (65.03802) (80.02514)
% in Cost per Case Disposed
11.7 9.7
Observations 3580 3403 R-squared 0.0767 0.0769 Number of courts 210 198
Note: Each column reports the estimated coefficients of a regression model in which the dependent variable is the cost per case disposed. Standard errors clustered at the “canton” level are in parenthesis. The model includes year fixed effects, the number of judicial matters per court, dummies for the interaction of canton and year fixed effects and courts trends. * Statistically different from zero at the .1 level of significance. ** Statistically different from zero at the .05 level of significance. *** Statistically different from zero at the .01 level of significance.

Table 6. Justice Modernization Program and Court Efficiency Differentiating the First Year of Treatment
Difference-in-Differences Model
Re-weighted Difference-in-Differences Model
(1) (2) (3) (4)
Justice Program in Year 1 (=1) .0111457 .034503** .0123064 .030464** (.0103193) (.0131341) (.0097993) (.0133736) Justice Program from Year 2 Onwards (=1)
.0240141** (.0117619)
.0412392* (.0230006)
.0272956** (.01139)
.0369374 (.022618)
% in Treatment Year 1 2.06 6.38 2.27 5.64
% in Treatment from Year 2 4.45 7.63 5.05 6.84
Observations 4893 4893 4747 4747 R-squared 0.0018 0.0058 0.0050 0.0076 Number of courts 264 264 251 251
Note: Each column reports the estimated coefficients of a regression model in which the dependent variable is the caseload clearance rate. Standard errors clustered at the “canton” level are in parenthesis. Columns (1) and (3) include year fixed effects and the number of judicial matters per court. Column (2) and (4) include dummies for the interaction of canton and year fixed effects and courts trends. * Statistically different from zero at the .1 level of significance. ** Statistically different from zero at the .05 level of significance. *** Statistically different from zero at the .01 level of significance.
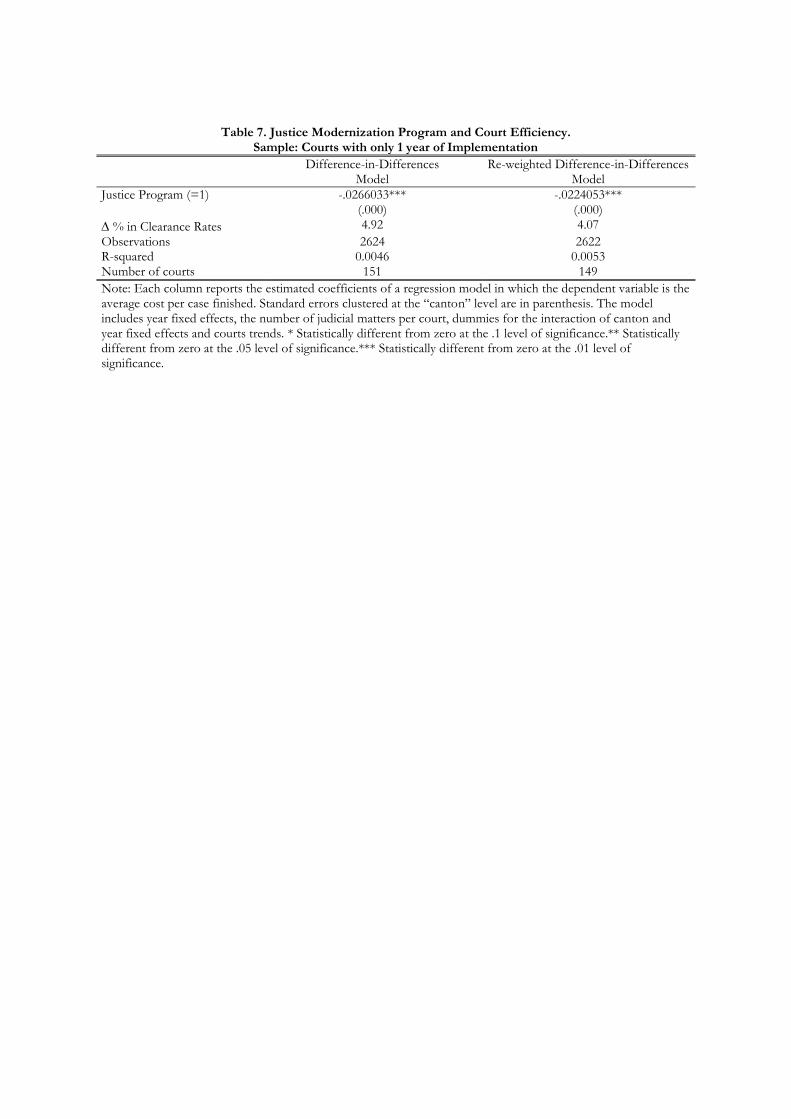
Table 7. Justice Modernization Program and Court Efficiency. Sample: Courts with only 1 year of Implementation
Difference-in-Differences Model
Re-weighted Difference-in-Differences Model
Justice Program (=1) -.0266033*** (.000)
-.0224053*** (.000)
% in Clearance Rates 4.92 4.07
Observations 2624 2622 R-squared 0.0046 0.0053 Number of courts 151 149
Note: Each column reports the estimated coefficients of a regression model in which the dependent variable is the average cost per case finished. Standard errors clustered at the “canton” level are in parenthesis. The model includes year fixed effects, the number of judicial matters per court, dummies for the interaction of canton and year fixed effects and courts trends. * Statistically different from zero at the .1 level of significance.** Statistically different from zero at the .05 level of significance.*** Statistically different from zero at the .01 level of significance.
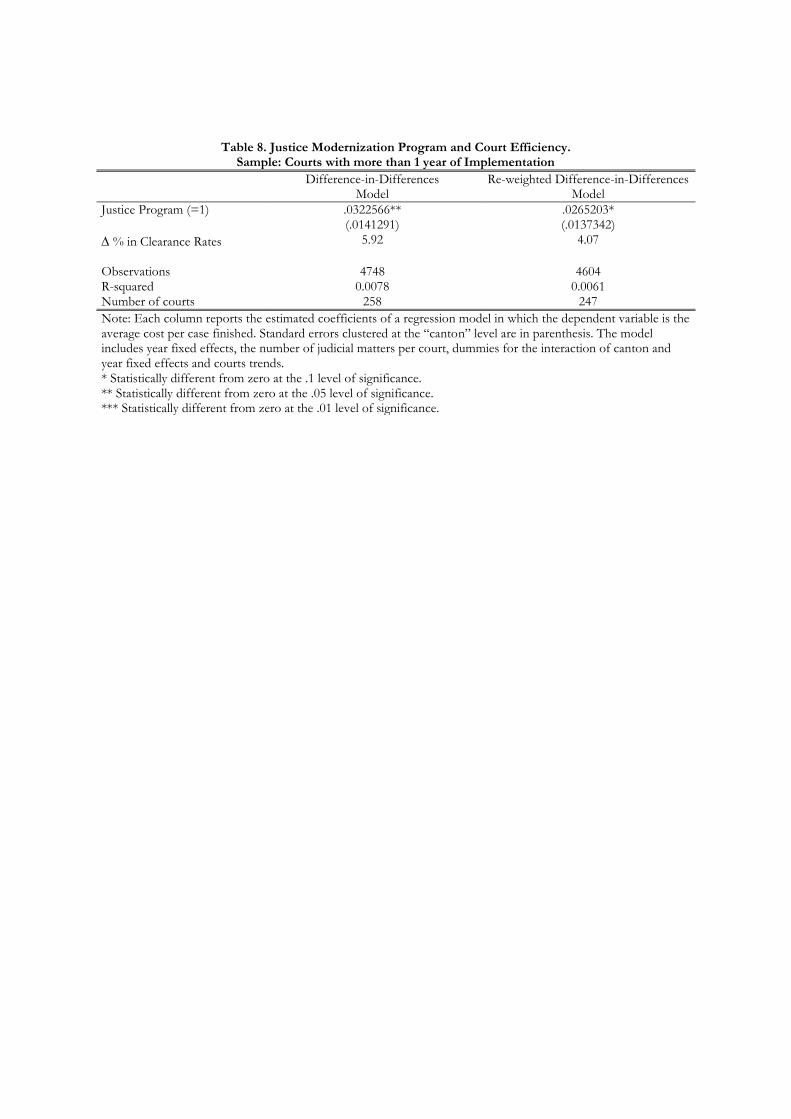
Table 8. Justice Modernization Program and Court Efficiency.
Sample: Courts with more than 1 year of Implementation
Difference-in-Differences Model
Re-weighted Difference-in-Differences Model
Justice Program (=1) .0322566** .0265203* (.0141291) (.0137342)
% in Clearance Rates 5.92 4.07
Observations 4748 4604 R-squared 0.0078 0.0061 Number of courts 258 247
Note: Each column reports the estimated coefficients of a regression model in which the dependent variable is the average cost per case finished. Standard errors clustered at the “canton” level are in parenthesis. The model includes year fixed effects, the number of judicial matters per court, dummies for the interaction of canton and year fixed effects and courts trends. * Statistically different from zero at the .1 level of significance. ** Statistically different from zero at the .05 level of significance. *** Statistically different from zero at the .01 level of significance.
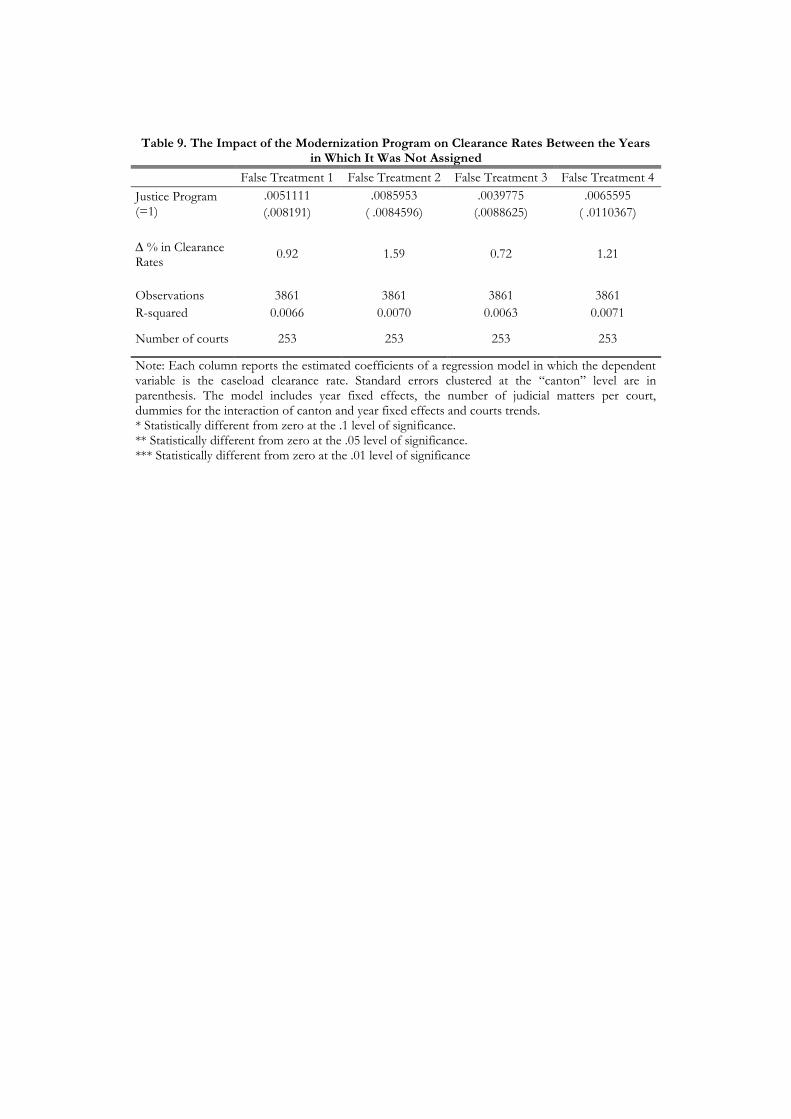
Table 9. The Impact of the Modernization Program on Clearance Rates Between the Years in Which It Was Not Assigned
False Treatment 1 False Treatment 2 False Treatment 3 False Treatment 4
Justice Program (=1)
.0051111 .0085953 .0039775 .0065595
(.008191) ( .0084596) (.0088625) ( .0110367)
% in Clearance Rates
0.92 1.59 0.72 1.21
Observations 3861 3861 3861 3861
R-squared 0.0066 0.0070 0.0063 0.0071
Number of courts 253 253 253 253
Note: Each column reports the estimated coefficients of a regression model in which the dependent variable is the caseload clearance rate. Standard errors clustered at the “canton” level are in parenthesis. The model includes year fixed effects, the number of judicial matters per court, dummies for the interaction of canton and year fixed effects and courts trends. * Statistically different from zero at the .1 level of significance. ** Statistically different from zero at the .05 level of significance. *** Statistically different from zero at the .01 level of significance

Appendix
02468
101214161820
Figure A1. Judges and Magistrates per 100.000 Inhabitants
0,6
0,62
0,64
0,66
0,68
0,7
0,72
0,74
2001 2002 2003 2004 2005 2006 2007 2008
Figure A2. Clearance Rates in Penal Matters
Non-modernized Courts
Modernized Courts
0,3
0,35
0,4
0,45
0,5
0,55
2001 2002 2003 2004 2005 2006 2007 2008
Figure A3. Clearance Rates in Civil Matters
Non-modernized Courts
Modernized Courts
0,3
0,35
0,4
0,45
0,5
0,55
0,6
0,65
2001 2002 2003 2004 2005 2006 2007 2008
Figure A4. Clearance Rates in Labor Matters
Non-modernized Courts
Modernized Courts
0
0,1
0,2
0,3
0,4
0,5
0,6
0,7
2001 2002 2003 2004 2005 2006 2007 2008
Figure A5. Caseload Clearance Rates in the Judicial Circuit of Cartago
Non-Modernized Courts
Modernized Courts
0
0,1
0,2
0,3
0,4
0,5
0,6
0,7
2001 2002 2003 2004 2005 2006 2007 2008
Figure A6. Caseload Clearance Rates in the Judicial Circuit of Heredia
Non-Modernized Courts
Modernized Courts
0
0,1
0,2
0,3
0,4
0,5
0,6
0,7
2001 2002 2003 2004 2005 2006 2007 2008
Figure A7. Caseload Clearance Rates in the Judicial Circuit of Puntarenas
Non-Modernized Courts
Modernized Courts
0
0,1
0,2
0,3
0,4
0,5
0,6
0,7
0,8
0,9
2001 2002 2003 2004 2005 2006 2007 2008
Figure A8. Caseload Clearance Rates in the I Judicial Circuit of Alajuela
Non-Modernized Courts
Modernized Courts
0,5
0,52
0,54
0,56
0,58
0,6
0,62
0,64
2001 2002 2003 2004 2005 2006 2007 2008
Figure A9. Caseload Clearance Rates in the I Judicial Circuit of Guanacaste
Non-Modernized Courts
Modernized Courts
0
0,1
0,2
0,3
0,4
0,5
0,6
0,7
0,8
2001 2002 2003 2004 2005 2006 2007 2008
Figure A10. Caseload Clearance Rates in the I Judicial Circuit of San Jose
Non-Modernized Courts
Modernized Courts
0
0,1
0,2
0,3
0,4
0,5
0,6
0,7
0,8
2001 2002 2003 2004 2005 2006 2007 2008
Figure A11. Caseload Clearance Rates in the I Judicial Circuit of Zona Atlantica
Non-Modernized Courts
Modernized Courts
0
0,1
0,2
0,3
0,4
0,5
0,6
0,7
2001 2002 2003 2004 2005 2006 2007 2008
Figure A12. Caseload Clearance Rates in the I Judicial Circuit of Zona Sur
Non-Modernized Courts
Modernized Courts

0
0,1
0,2
0,3
0,4
0,5
0,6
0,7
2001 2002 2003 2004 2005 2006 2007 2008
Figure A13. Caseload Clearance Rates in the II Judicial Circuit of Zona Sur
Non-Modernized Courts
Modernized Courts
0,5
0,52
0,54
0,56
0,58
0,6
0,62
0,64
0,66
2001 2002 2003 2004 2005 2006 2007 2008
Figure A15. Caseload Clearance Rates in the II Judicial Circuit of Alajuela
Non-Modernized Courts
Modernized Courts
0
0,1
0,2
0,3
0,4
0,5
0,6
0,7
2001 2002 2003 2004 2005 2006 2007 2008
Figure A16. Caseload Clearance Rates in the II Judicial Circuit of Guanacaste
Non-Modernized Courts
Modernized Courts
0
0,1
0,2
0,3
0,4
0,5
0,6
0,7
0,8
0,9
2001 2002 2003 2004 2005 2006 2007 2008
Figure A17. Caseload Clearance Rates in the II Judicial Circuit of San Jose
Non-Modernized Courts
Modernized Courts
0
0,1
0,2
0,3
0,4
0,5
0,6
0,7
2001 2002 2003 2004 2005 2006 2007 2008
Figure A18. Caseload Clearance Rates in the II Judicial Circuit of Zona Atlantica
Non-Modernized Courts
Modernized Courts
0
0,1
0,2
0,3
0,4
0,5
0,6
0,7
0,8
2001 2002 2003 2004 2005 2006 2007 2008
Figure A19. Caseload Clearance Rates in the III Judicial Circuit of San Jose
Non-Modernized Courts
Modernized Courts
0
0,1
0,2
0,3
0,4
0,5
0,6
0,7
0,8
2001 2002 2003 2004 2005 2006 2007 2008
Figure A20. Caseload Clearance Rates in the III Judicial Circuit of Alajuela
Non-Modernized Courts
Modernized Courts
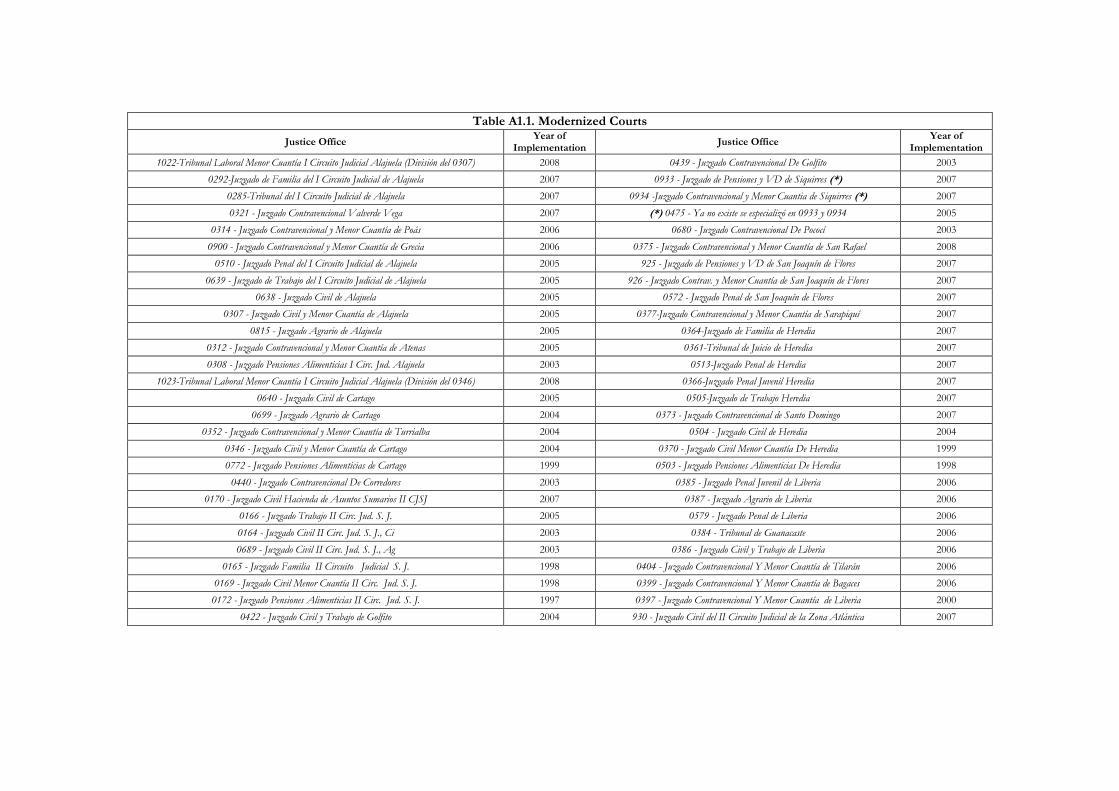
Table A1.1. Modernized Courts
Justice Office Year of
Implementation Justice Office
Year of Implementation
1022-Tribunal Laboral Menor Cuantía I Circuito Judicial Alajuela (División del 0307) 2008 0439 - Juzgado Contravencional De Golfito 2003
0292-Juzgado de Familia del I Circuito Judicial de Alajuela 2007 0933 - Juzgado de Pensiones y VD de Siquirres (*) 2007
0285-Tribunal del I Circuito Judicial de Alajuela 2007 0934 -Juzgado Contravencional y Menor Cuantia de Siquirres (*) 2007
0321 - Juzgado Contravencional Valverde Vega 2007 (*) 0475 - Ya no existe se especializó en 0933 y 0934 2005
0314 - Juzgado Contravencional y Menor Cuantía de Poás 2006 0680 - Juzgado Contravencional De Pococí 2003
0900 - Juzgado Contravencional y Menor Cuantía de Grecia 2006 0375 - Juzgado Contravencional y Menor Cuantía de San Rafael 2008
0510 - Juzgado Penal del I Circuito Judicial de Alajuela 2005 925 - Juzgado de Pensiones y VD de San Joaquín de Flores 2007
0639 - Juzgado de Trabajo del I Circuito Judicial de Alajuela 2005 926 - Juzgado Contrav. y Menor Cuantía de San Joaquín de Flores 2007
0638 - Juzgado Civil de Alajuela 2005 0572 - Juzgado Penal de San Joaquín de Flores 2007
0307 - Juzgado Civil y Menor Cuantía de Alajuela 2005 0377-Juzgado Contravencional y Menor Cuantía de Sarapiquí 2007
0815 - Juzgado Agrario de Alajuela 2005 0364-Juzgado de Familia de Heredia 2007
0312 - Juzgado Contravencional y Menor Cuantía de Atenas 2005 0361-Tribunal de Juicio de Heredia 2007
0308 - Juzgado Pensiones Alimenticias I Circ. Jud. Alajuela 2003 0513-Juzgado Penal de Heredia 2007
1023-Tribunal Laboral Menor Cuantía I Circuito Judicial Alajuela (División del 0346) 2008 0366-Juzgado Penal Juvenil Heredia 2007
0640 - Juzgado Civil de Cartago 2005 0505-Juzgado de Trabajo Heredia 2007
0699 - Juzgado Agrario de Cartago 2004 0373 - Juzgado Contravencional de Santo Domingo 2007
0352 - Juzgado Contravencional y Menor Cuantía de Turrialba 2004 0504 - Juzgado Civil de Heredia 2004
0346 - Juzgado Civil y Menor Cuantía de Cartago 2004 0370 - Juzgado Civil Menor Cuantía De Heredia 1999
0772 - Juzgado Pensiones Alimenticias de Cartago 1999 0503 - Juzgado Pensiones Alimenticias De Heredia 1998
0440 - Juzgado Contravencional De Corredores 2003 0385 - Juzgado Penal Juvenil de Liberia 2006
0170 - Juzgado Civil Hacienda de Asuntos Sumarios II CJSJ 2007 0387 - Juzgado Agrario de Liberia 2006
0166 - Juzgado Trabajo II Circ. Jud. S. J. 2005 0579 - Juzgado Penal de Liberia 2006
0164 - Juzgado Civil II Circ. Jud. S. J., Ci 2003 0384 - Tribunal de Guanacaste 2006
0689 - Juzgado Civil II Circ. Jud. S. J., Ag 2003 0386 - Juzgado Civil y Trabajo de Liberia 2006
0165 - Juzgado Familia II Circuito Judicial S. J. 1998 0404 - Juzgado Contravencional Y Menor Cuantía de Tilarán 2006
0169 - Juzgado Civil Menor Cuantía II Circ. Jud. S. J. 1998 0399 - Juzgado Contravencional Y Menor Cuantía de Bagaces 2006
0172 - Juzgado Pensiones Alimenticias II Circ. Jud. S. J. 1997 0397 - Juzgado Contravencional Y Menor Cuantía de Liberia 2000
0422 - Juzgado Civil y Trabajo de Golfito 2004 930 - Juzgado Civil del II Circuito Judicial de la Zona Atlántica 2007

0679- Juzgado de Trabajo del I C J Zona Atlántica 2007 0300- Juzgado Penal Juvenil y Familia II Circ. Jud. Alajuela 2007
0473 - Juzgado Menor Cuantía I Circ. Jud. De La Zona Atlántica 2004 0511 - Juzgado Penal de San Carlos 2007
0678 - Juzgado Civil I Circ. Jud. De La Zona Atlántica 2004 0318 - Juzgado Contravencional II Circuito Judicial De Alajuela 2003
0859 - Juzgado de Pensiones Alimentarias de Limón 2003 0521 - Juzgado Contravencional y Menor Cuantía de Alajuelita 2008
0868 - Juzgado Civil y de Trabajo de Nicoya (* antes 0390) 2007 0242 - Juzgado Contravencional y Menor Cuantía de Santa Ana 2007
0869 - Juzgado de Familia, Penal Juvenil y Violencia Domestica de Nicoya (* antes 0390) 2007 0891 - Juzgado Pensiones Alimentarias y VD de Pavas 2007
0577 - Tribunal de Juicio de Nicoya 2006 0891 - Juzgado Contravencional de Pavas 2007
0581 - Juzgado Penal de Nicoya 2006 0958 - Juzgado Concursal de San José 2007
0390 - Ya no existe se especializó en 0868 y 0869 2005 0250 - Juzgado Contravencional y Menor Cuantía de San Sebastián 2006
0872 - Juzgado Contravencional y Pensiones de Nicoya 2003 0241 - Juzgado Contravencional y Menor Cuantía de Puriscal 2006
0873 - Juzgado de Menor Cuantía y Transito de Nicoya 2003 0916 - Juzgado de Pensiones y Violencia Doméstica de Escazú 2006
0444-Juzgado Contravencional y Menor Cuantía de Buenos Aires 2007 0917 - Juzgado Contravencional y Menor Cuantía de Escazú 2006
0919-Juzgado de Familia y Penal Juvenil de Pérez Zeledón 2007 0240 - Juzgado Contravencional y Menor Cuantía de Mora 2006
0508 - Juzgado Penal de Pérez Zeledón 2006 0236 - Juzgado Contravencional y Menor Cuantía de Aserrí 2006
0030 - Tribunal de la Zona Sur, sede Pérez Zeledón 2006 0239 - Juzgado Contravencional y Menor Cuantía de Hatillo 2006
0188 - Juzgado Civil y Trabajo de Pérez Zeledón 2006 0532 - Juzgado Penal I Circ. Jud. S. J. 2005
0856 - Juzgado Contravencional de Pérez Zeledón 2000 0186 - Juzgado Primero de Familia I Circ. Jud. S. J. 2005
0857 - Juzgado Civil de Menor Cuantía de Pérez Zeledón 2000 0187 - Juzgado Segundo de Familia I Circ. Jud. S. J. 2005
0432 - Juzgado de Menor Cuantía de Puntarenas 2006 0185 - Juzgado 6 Civil I Circ. Jud. S. J. 2004
0642 - Juzgado Civil de Puntarenas 2006 0184 - Juzgado 5 Civil I Circ. Jud. S. J. 2004
0643 - Juzgado de Trabajo de Puntarenas 2006 0183 - Juzgado 4 Civil I Circ. Jud. S. J. 2004
0443 - Juzgado Contravencional y Menor Cuantía de Aguirre-Parrita 2006 0180 - Juzgado 1 Civil I Circ. Jud. S. J. 2004
0315 - Juzgado Contravencional y Menor Cuantía de Orotina 2006 0182 - Juzgado 3 Civil I Circ. Jud. S. J. 2004
0437 - Juzgado Contravencional y Menor Cuantía de Esparza 2005 0181 - Juzgado 2 Civil I Circ. Jud. S. J. 2003
0433 - Juzgado I Contravencional De Puntarenas 2000 0225 - Juzgado 6 Civil Menor Cuantía I Circ. Jud. S. J. 2003
0434 - Juzgado II Contravencional De Puntarenas 2000 0224 - Juzgado 5 Civil Menor Cuantía I Circ. Jud. S. J. 2002
0288 - Tribunal de Juicio II Circ. Jud. Alajuela 2007 0223 - Juzgado 4 Civil Menor Cuantía I Circ. Jud. S. J. 2002
0298 - Juzgado Agrario II Circ. Jud. Alajuela 2007 0222 - Juzgado 3 Civil Menor Cuantía I Circ. Jud. S. J. 2002
0221 - Juzgado 2 Civil Menor Cuantía I Circ. Jud. S. J. 2002 0551 - Juzgado Penal de San Ramón 2007
0220 - Juzgado 1 Civil Menor Cuantía I Circ. Jud. S. J. 2002 0688 - Juzgado de Familia Violencia Domestica y PJ de San Ramón 2007
0256 - Juzgado Contravencional De Desamparados 1999 0296 - Juzgado Civil Y Trabajo San Ramón 2004
0625 - Juzgado Pensiones Alimenticias I Circ. Jud. S. J. 1998 0693 - Juzgado Contravencional De San Ramón, Materia Pa 2003
0310 - Juzgado Contravencional y Menor Cuantía de Naranjo 2008 0691 - Juzgado Civil de Menor Cuantía de San Ramón 2003
0319-Juzgado Contravencional y Menor Ctia de Palmares 2007 0401 - Juzgado Contravencional Y Menor Cuantía de Carrillo 2006
0548-Tribunal de Juicio de San Ramón 2007 0400 - Juzgado Contravencional Y Menor Cuantía De Santa Cruz 2003
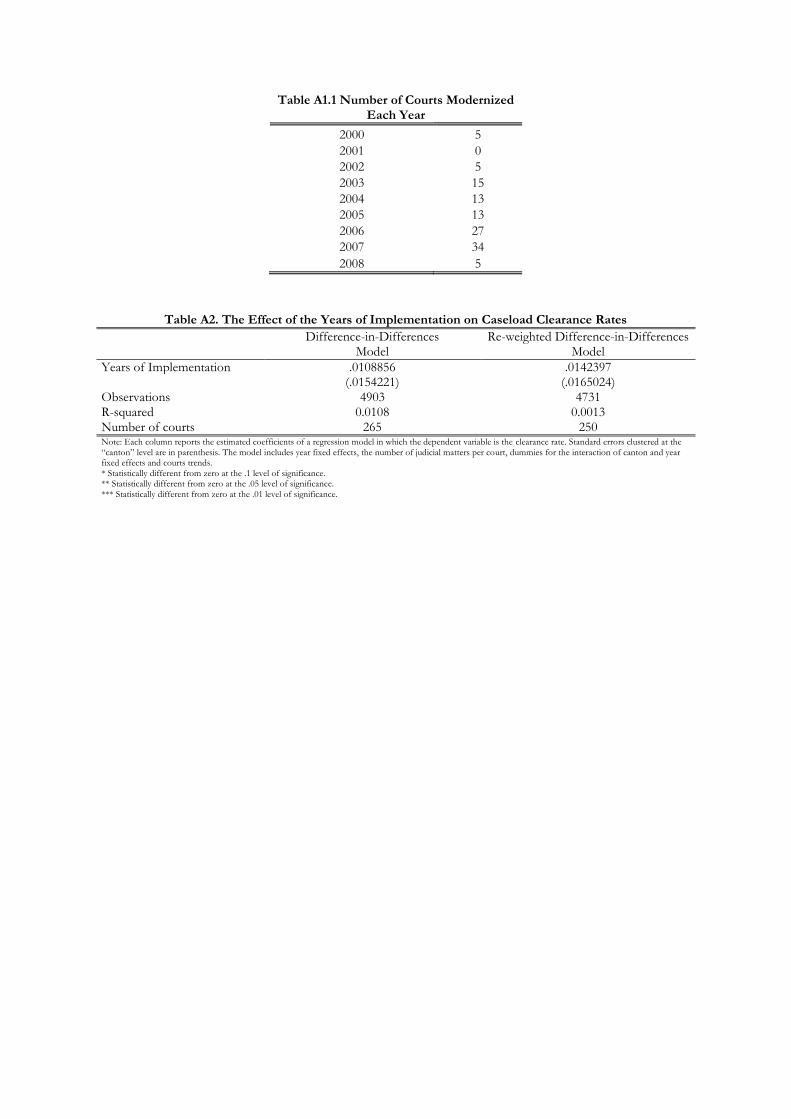
Table A1.1 Number of Courts Modernized Each Year
2000 5
2001 0
2002 5
2003 15
2004 13
2005 13
2006 27
2007 34
2008 5
Table A2. The Effect of the Years of Implementation on Caseload Clearance Rates
Difference-in-Differences Model
Re-weighted Difference-in-Differences Model
Years of Implementation .0108856 .0142397 (.0154221) (.0165024) Observations 4903 4731 R-squared 0.0108 0.0013 Number of courts 265 250 Note: Each column reports the estimated coefficients of a regression model in which the dependent variable is the clearance rate. Standard errors clustered at the “canton” level are in parenthesis. The model includes year fixed effects, the number of judicial matters per court, dummies for the interaction of canton and year fixed effects and courts trends. * Statistically different from zero at the .1 level of significance. ** Statistically different from zero at the .05 level of significance. *** Statistically different from zero at the .01 level of significance.

References
Bertschek and Kaiser (2004). “Productivity Effects of Organizational Change”. Management
Science 50(3), pp. 394-404.
Blair, H. and Gary H. (1994). “Weighing on the Scales of Justice: Strategic Approaches for Donor-
Supported Rule of Law Programs”. Program and Operations Assessment Report 7. U.S. Agency for
International Development, Washington, D .C.
Buscaglia, E. (2001). “Investigating the Links between Access to justice and Governance Factors:
An Objective Indicator’s Approach.” Paper presented at the World Bank Conference on Justice, St.
Petersburg, Russia.
Buscaglia, E. and Dakolias, M. (1999). “Comparative International Study of Court Performance.”
World Bank publication.
Correa Sutil, J. (2000). “Access to justice and judicial reforms in Latin America. Any hope of
equality?” Revista Jurídica de la Universidad de Palermo, Buenos Aires, pp.293-308.
Holbrooks, R. (2001). “Developing an Automated Information Retrieval System for the Missouri
Twenty-Second Judicial Circuit Probate Court”. Institute for Court Management, National Center
for State Courts.
Inter American Commission on Human Rights (2008). “Barreras para el Acceso a la Justicia en
America Latina”.
Inter American Development Bank (1994). “Proposal for a loan for the modernization of the
administration of justice”.
Inter American Development Bank (2000). “Acceso a la justicia y equidad. Estudio en siete países
de America Latina”.
Inter American Development Bank (2003). “Informe de terminación de operaciones. Costa Rica:
Programa de Modernización Administración de Justicia”.
Messick, R. (1999). “Judicial Reform and Economic Development: A Survey of the Issues.” The
World Bank Research Observer, Vol. 14, No. 1, pp. 117-136.
Sherwood R., Shepherd G. and De Souza C.(1994). “Judicial Systems and Economic Performance.”
The Quarterly Review of Economics and Finance, Vol. 34, pp. 01- 16.
Tomlinson, A. (2006). “Electronic Case Filing in the Appellate Courts: Evaluating the Impact of
Electronic Case Filing Technology on Clerk’s Office Operations in the United States Court of
Appeals”. Institute for Court Management, National Center for State Courts.
Webster, L. (1996). “Automating Court Systems”. Institute for Court Management, National Center
for State Courts.
World Bank (1999). “Court Performance around the World.”