the impact of migration: a review of the economic evidenceuctpb21/reports/wa_final_final.pdf · the...
TRANSCRIPT

1
The impact of migration: a review of the economic evidence
File No.102 Contract No 36/2006
Final Report, November 2007
Christian Dustmann, Tommaso Frattini and Albrecht Glitz
Centre for Research and Analysis of Migration (CReAM),
Department of Economics, University College London, and EPolicy LTD

2
Executive Summary ................................................................................................................... 3 Part 1: The Impact of Migration: Theory and Evidence ............................................................ 7
1.1 The impact of immigration – economic theory ................................................................ 7 1.1.1 One output, skilled and unskilled labour ................................................................. 10 1.1.2 Multiple outputs, skilled and unskilled labour ........................................................ 15
1.2 Measuring the immigrant impact on the labour market ................................................. 17 1.2.1 The spatial correlation approach ............................................................................. 17 1.2.2 Simulation based approaches .................................................................................. 24 1.2.3 The skill cell correlation approach .......................................................................... 25
1. 3 Empirical findings: A survey of the literature .............................................................. 27 1.3.1 Estimating production functions ............................................................................. 28 1.3.2 Using spatial correlations ........................................................................................ 29 1.3.3 Simulation based approaches .................................................................................. 33 1.3.4 Recent developments in the literature ..................................................................... 37 1.3.5 Studies for countries outside the U.S. ..................................................................... 40 1.3.6 Native migratory responses ..................................................................................... 51 1.3.7 Industry and technology adjustments ...................................................................... 54 1.3.8 Other approaches and perspectives ......................................................................... 57
1. 4 Macroeconomic perspectives on the impact of immigration ........................................ 61 1.4.1 Growth ..................................................................................................................... 62 1.4.2 Inflation ................................................................................................................... 62 1.4.3 Housing ................................................................................................................... 63 1.4.4 Fiscal effect ............................................................................................................. 65 1.4.5 Are earnings spent locally or returned to family members in the originating country? ............................................................................................................................ 68
Part 2: Immigration to Wales ................................................................................................... 73 2.1 Location Choice of Immigrants in Wales and their type of employment ...................... 73 2.2 Factors that influence the decision whether and where to migrate ................................ 81 2.3 Characteristics of EU and other migrants into Wales and the UK ................................. 90 2.4 Evidence of ethnic differences in economic outcomes .................................................. 94
Part 3: Discussion and Conclusion ........................................................................................... 97 References .............................................................................................................................. 102

3
Executive Summary
This report has been commissioned by The National Assembly for Wales, on behalf of the
Welsh Assembly Government to (i) to provide a comprehensive review of the economic
literature on the socio-economic impact of migration; (ii) to assess this evidence base in the
context of significant migration from the new EU states; (iii) to summarise what is known
about the characteristics of migrants to the UK and Wales; and (iv) to consider the likely
policy implications for Wales.
Assessing the overall net gain or loss to the economy from immigration is a challenging task
both from a theoretical and an empirical point of view. In part 1 of this report we provide a
comprehensive overview of the economic literature on the socio-economic impact of
migration and assess the evidence base in the context of significant migration from the new
EU states. In part 2, we summarise characteristics of immigrants in the UK with a particular
focus on Wales.
• Our literature review discusses a large variety of channels by which immigration
can affect the receiving economy. The most important ones are through (i) wages
or employment effects on native workers, (ii) changes in output structure,
technology and competitiveness (iii) fiscal effects, through benefit claims and
contributions to the tax or welfare system, (iv) effects on house prices, (v) effects
through the creation of new jobs and opportunities, by self-employment or
managerial activities of immigrants, and (vi) complementarities and additions to
the skill base.

4
• The most analysed adjustment channel is through wages. In the simplest possible
model, and if capital prices are set on world markets (which means that capital
supply is perfectly elastic), and immigrants are different in their skill composition
from native workers, immigration will put downward pressure on wages of native
workers who are competing with immigrants, and increase wages of native
workers who are complements. The effect on average wages will be zero or
slightly positive. The reason is that immigration generates a “surplus” which, in
the case of perfectly elastic capital supply, is going to native workers.
• If capital supply is inelastic, then, again, immigration will be more detrimental to
those who compete with immigrants, but the overall average effect on wages may
now be negative. The reason is that in this case it is capital owners who gain most
from immigration.
• The empirical evidence overwhelmingly suggests that there are zero or small
negative effects of immigration on wages. Some papers find positive effects. The
studies for the UK do not find negative wage effects.
• Economies can also adjust through their output mix, i.e. in the relative composition
of output goods produced. This may happen in small open economies, where the
prices for tradable goods are set on international markets. In this case immigration
may lead to an expansion of those industries that use immigrant labour most
intensively, without affecting (relative) wages.

5
• Alternatively, economies can adjust through technology, by adopting technologies
that employ more of those skills which immigrants bring with them.
• A series of recent papers for the US suggest that there is some adjustment of the
economy through output mix. Adjustment through technology, however, plays a
more important role in absorbing immigrant inflows.
• In part 2 of this report we offer an overview of the characteristics of the immigrant
population in the UK and, particularly, in Wales.
• According to the LFS, the percentage of foreign born in the total working age
population in Wales has increased from 2.9% in 1992 to 4.6% in 2005. In 2005,
the national GB average was 11.5%.
• Within Wales immigrants are overall similarly distributed across counties as
natives with the exception of Mid and South Glamorgan where they are
significantly under- and over-represented, respectively.
• Immigrants in Wales are more educated than natives but experience lower
employment and participation rates. In comparison to other areas in the UK, Wales
has a large share of immigrants originating from Western Europe but has received
relatively few immigrants from the new EU accession countries since 2004. The
ones who did settle in Wales, however, fared substantially better than their
counterparts in other parts of the UK with an employment rate of 84.5% compared
to only 58% in London and 64.2% nationwide.

6
• Within Great Britain, immigrants tend to go to regions with higher wage growth.
However, there seems to be no relationship between changes in employment rates
and immigrant inflows.
• According to the LFS, in 2002-2005 almost 32% of immigrants in Wales were
from Western Europe. This figure is above the national GB average of 21%, and
the figure for London (16.5%).
• Only 4% of immigrants in Wales are from the new EU accession countries, while
the corresponding figure for GB and London are respectively 7.7% and 9.3%. The
most recent inflows are very similar in composition to the pre-existing immigrant
population.
• In Wales, and in the rest of Britain, non-white immigrants tend to have
considerably lower employment rate than white immigrants. However, average
wages for white and non-white foreigners in Wales are almost the same. This is in
contrast to the rest of Britain where whites have higher average wages.

7
Part 1: The Impact of Migration: Theory and Evidence
The first part of this report surveys the literature on the impact of migration. We commence in
section 1.1 with giving a brief account of what economic theory would predict happens when
immigration occurs. We explain within a very simple model which consequences one may
expect from immigration for wages and employment (under different assumptions about e.g.
the openness of the economy, or the supply elasticity of capital), and which distributional
consequences may follow. We then turn to the difficulties and challenges researchers face
when attempting to quantify effects of immigration on resident worker’s outcomes in the
receiving country. Section 1.3 is a survey of the literature. Most of the empirical literature is
for the US, and our discussion reflects that. Finally, in section 1.4 we discuss macroeconomic
perspectives on the impact of immigration.
1.1 The impact of immigration – economic theory
One of the key questions on migration concerns its benefits and costs for the receiving
economies. Fears that migration may, at least in the short run, have adverse effects on labour
market opportunities of the resident working population are a main reason for opposition to
more liberal migration policies. In this report we will focus on the possible mechanisms by
which immigration may affect wages and employment of the native resident work force. We
will explain some of the mechanisms, which may lead to negative employment and wage
effects of migration, and the circumstances under which adverse effects may not occur.
The first question that arises is how to model immigration and immigrants. Some early papers
assume a closed economy, with only one skill type, and capital complementary to labour. In
8
these papers, immigrants are considered as a distinct factor of labour (see e.g. Grossman
1982). Such models give valuable insights into the effects of immigration on wages and
returns to capital. However, much of the debate on immigration is about whether immigrants
are skilled or unskilled, and how the inflow of immigrants of particular skill endowments
affects economic outcomes of skill groups in the resident population. It seems therefore
natural to distinguish between different skill groups when modelling the impact of
immigration.
Much of the later literature has taken this into account, by distinguishing between different
types of labour. Grossman’s idea that immigrants and natives may be different factors of
production has been taken up again in the latest literature, which assumes that immigrants and
natives are imperfect substitutes within skill groups (see e.g. Borjas 2003 and Ottaviani and
Perri 2006).
In what follows, we discuss a simple model framework and extend it in directions that seem
important for studying the possible labour market effects of immigration. We distinguish
between skilled and unskilled workers who may be natives (born in the destination economy)
or immigrants (born in a country other than the destination economy). We commence by
assuming that immigrants and natives within a particular skill group are perfect substitutes,
i.e. they are exchangeable. Finally, we assume throughout that capital supply is perfectly
elastic. This means that firms obtain capital at a fixed interest rate, which could be thought of
as being set on an international market. We thus exclude from our consideration possible
redistributional effects of migration from workers to capital owners (see Borjas 1995 for
discussion), but concentrate on possible redistribution between skilled and unskilled labour.

9
Suppose now that such an economy experiences immigration. Immigrants could be either
skilled, or unskilled, or both. A first key observation is that immigration only affects
economic outcomes of resident workers if it changes the skill mix of the economy. Obviously,
immigration inflows affect the skill composition of the labour force of the immigration
country only if the skill composition of immigrants differs from the skill composition of
natives. For example, suppose that before immigration, 50 percent of the native workforce is
skilled and 50 percent unskilled. Immigration of only unskilled workers would shift the
composition of the total workforce towards the unskilled.
Suppose further the economy is in labour market equilibrium before immigration in the sense
that all workers are fully employed at equilibrium wages, which may differ for the skilled and
the unskilled. If now immigration occurs, and immigrants differ in their skill composition
from native workers, any change in the skill composition as a result of immigration will lead
to disequilibrium between supply of and cost-minimizing demand for different labour types at
existing wages and output levels. If for example all immigrants are unskilled, there will be an
excess supply of unskilled workers at the going wage rate. Absorption of these new workers
into the economy, and restoration of equilibrium will therefore almost certainly involve short-
run changes in wages and employment levels of different skill types. Whether effects on
wages and employment are permanent or only temporary depends on some other
characteristics of our economy which we have not yet discussed. In particular, it depends on
the different possibilities of the economy to adjust to the labour supply shock induced by
immigration and the consequent changes in relative supply of skilled and unskilled workers.
In the simplest case the economy produces one good only, and any adjustment to a change in
the skill composition of the labour force through immigration will be through wages. In more
realistic cases, where the economy consists of multiple sectors, adjustment can also take place
by changing the output mix.
10
For illustration, we compare below the effects of immigration on an economy with only one
output good with that on an economy with multiple traded output goods. Technical details can
be found in Dustmann, Fabbri and Preston (2005) or Dustmann and Preston (2006). See also
Altonji and Card (1991), Borjas (1995), Friedberg and Hunt (1995), Borjas (1999a), Gaston
and Nelson (2000), Card (2001) and Glitz (2006) for related discussions.
Before we discuss these cases, we would like to emphasize that in the economy characterized
above, wage- and possibly employment effects occur only if the skill distribution of
immigrants differs from that of the native work force and therefore changes the relative
supply of different skill groups in the economy (always maintaining our assumption of free
international flow of capital). If the skill distribution of immigrants is equal to that of natives
(for our example, this would mean that 50 percent of immigrants are skilled, and 50 percent of
immigrants are unskilled), immigration will not change the structure of wages, as it does not
affect the relative supply of skills. Output will increase, but no effects on wages and
employment are to be expected in this case.
1.1.1 One output, skilled and unskilled labour
The simplest case is one where the economy produces only one output good with a constant
returns to scale technology. A constant return to scale technology is a technology where
output is doubled if all factors of production are doubled. The three factors of production used
in our economy are capital, skilled labour, and unskilled labour. Assume that the rate of return
to capital (the interest rate) is set by the world market, and supply of capital is therefore
perfectly elastic. Furthermore, assume that labour supply of both skill groups is completely
inelastic. This means that workers are willing to work at whatever wage is offered to them.
11
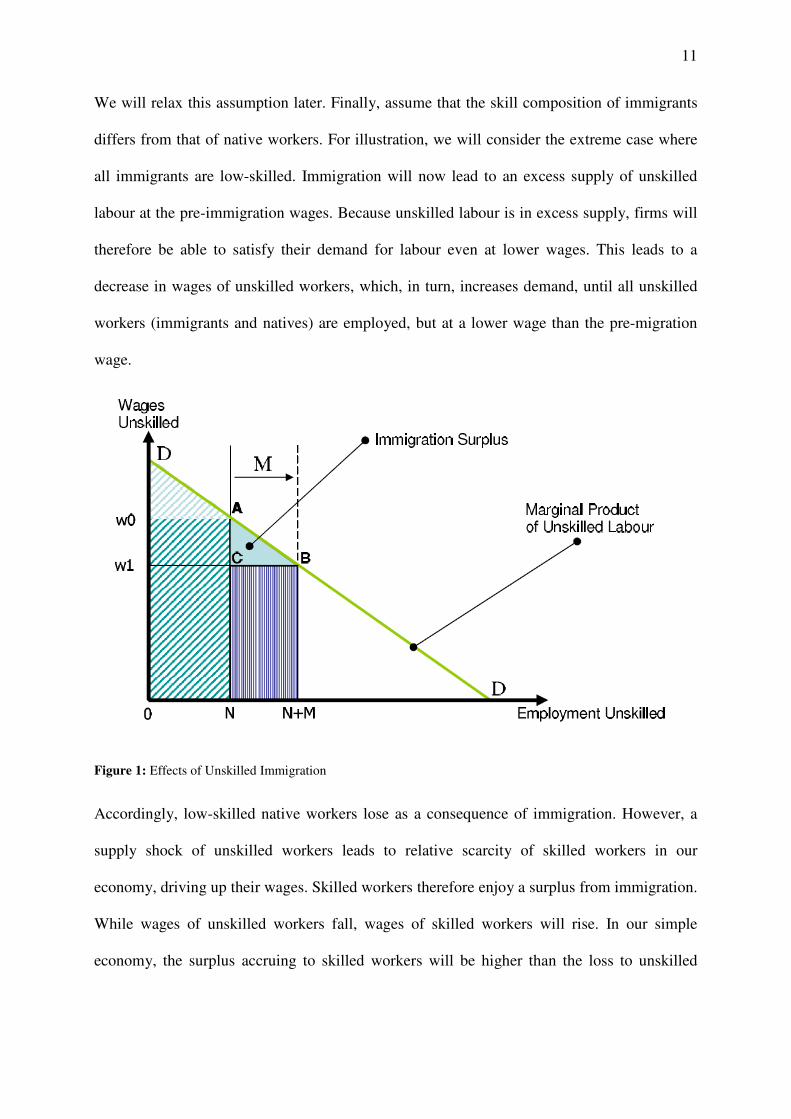
We will relax this assumption later. Finally, assume that the skill composition of immigrants
differs from that of native workers. For illustration, we will consider the extreme case where
all immigrants are low-skilled. Immigration will now lead to an excess supply of unskilled
labour at the pre-immigration wages. Because unskilled labour is in excess supply, firms will
therefore be able to satisfy their demand for labour even at lower wages. This leads to a
decrease in wages of unskilled workers, which, in turn, increases demand, until all unskilled
workers (immigrants and natives) are employed, but at a lower wage than the pre-migration
wage.
Figure 1: Effects of Unskilled Immigration
Accordingly, low-skilled native workers lose as a consequence of immigration. However, a
supply shock of unskilled workers leads to relative scarcity of skilled workers in our
economy, driving up their wages. Skilled workers therefore enjoy a surplus from immigration.
While wages of unskilled workers fall, wages of skilled workers will rise. In our simple
economy, the surplus accruing to skilled workers will be higher than the loss to unskilled

12
workers (with the difference often referred to as “immigration surplus”).1 We have
demonstrated this in Figure 1, concentrating on unskilled workers only. On the vertical axis
we have wages, and on the horizontal axis employment. In the pre-migration period, all native
workers (N) are employed at wages 0w , and the pre-migration equilibrium is in point A.
Immigration of size M leads to a shift in the (perfectly inelastic) labour supply schedule. As
skilled labour remains constant, this leads to a relative excess supply of unskilled labour, thus
driving wages down the marginal product curve. The new equilibrium is in point B, where
wages have decreased to 1w . In this new situation, the total output share that goes to unskilled
workers has decreased by an amount reflected by the area of the rectangle ( 0w – 1w – A – C).
This share of output falls now to skilled labour. As all unskilled workers including
immigrants work at a wage that is equal to the marginal product of the last immigrant,
immigrants create an additional surplus, which is given by the area (A – B – C) and which
also falls to skilled native workers.
1 Note that the owners of capital will neither lose nor win, as the interest rate is assumed to be set on international markets and, thus, capital will be supplied perfectly elastically.
13
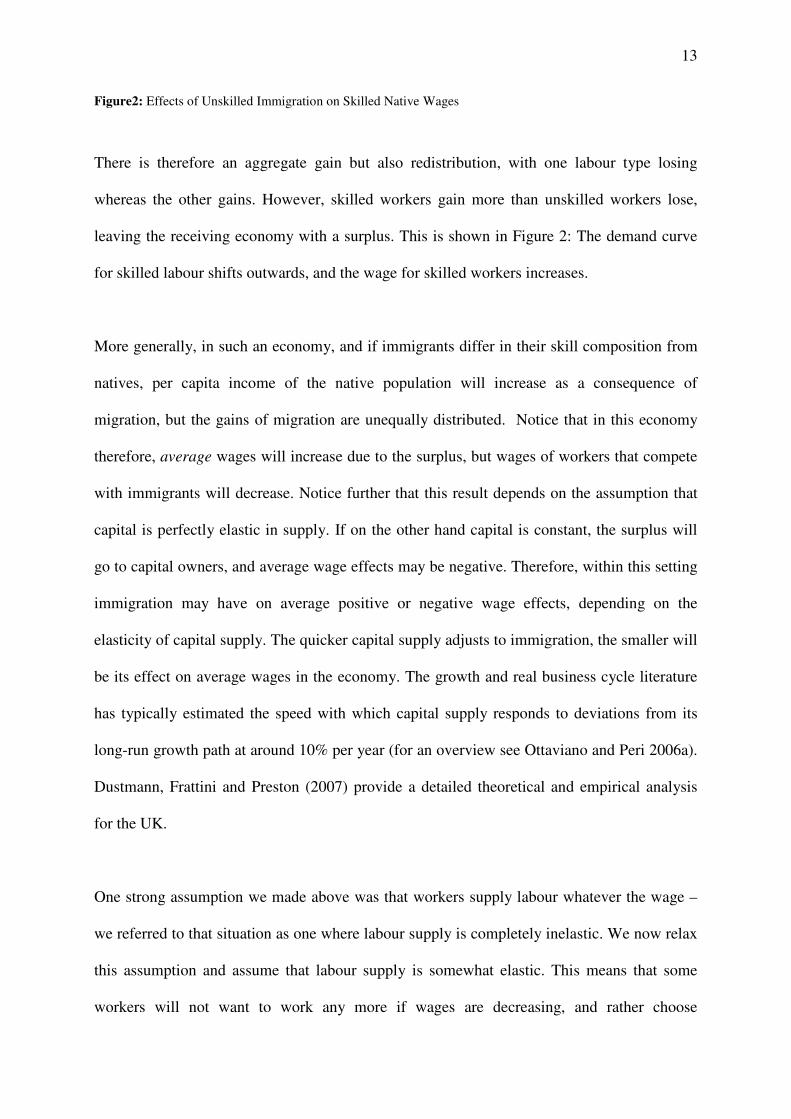
Figure2: Effects of Unskilled Immigration on Skilled Native Wages
There is therefore an aggregate gain but also redistribution, with one labour type losing
whereas the other gains. However, skilled workers gain more than unskilled workers lose,
leaving the receiving economy with a surplus. This is shown in Figure 2: The demand curve
for skilled labour shifts outwards, and the wage for skilled workers increases.
More generally, in such an economy, and if immigrants differ in their skill composition from
natives, per capita income of the native population will increase as a consequence of
migration, but the gains of migration are unequally distributed. Notice that in this economy
therefore, average wages will increase due to the surplus, but wages of workers that compete
with immigrants will decrease. Notice further that this result depends on the assumption that
capital is perfectly elastic in supply. If on the other hand capital is constant, the surplus will
go to capital owners, and average wage effects may be negative. Therefore, within this setting
immigration may have on average positive or negative wage effects, depending on the
elasticity of capital supply. The quicker capital supply adjusts to immigration, the smaller will
be its effect on average wages in the economy. The growth and real business cycle literature
has typically estimated the speed with which capital supply responds to deviations from its
long-run growth path at around 10% per year (for an overview see Ottaviano and Peri 2006a).
Dustmann, Frattini and Preston (2007) provide a detailed theoretical and empirical analysis
for the UK.
One strong assumption we made above was that workers supply labour whatever the wage –
we referred to that situation as one where labour supply is completely inelastic. We now relax
this assumption and assume that labour supply is somewhat elastic. This means that some
workers will not want to work any more if wages are decreasing, and rather choose

14
unemployment. In this situation, there are equilibrium employment effects. Immigration may
cause (voluntary) unemployment among those native workers whose wages fall.
We illustrate this in Figure 3. Here the labour supply curve is upward sloping, and an increase
in labour supply through migration leads to some native workers not being prepared any more
to work at the new, lower equilibrium wage. These workers (N0-N1 in Figure 3) remain
therefore voluntarily unemployed.
Figure 3: Employment Effects of immigration
Our example focused on the case where all immigration is unskilled, thus changing the skill
composition towards unskilled labour. Of course, if we assume the other extreme case
(namely that all immigrants are skilled), it will be unskilled wages that rise, and skilled wages
that fall, creating a redistribution and a surplus that favours unskilled rather than skilled
labour. More generally, in this simple setting, the beneficiary of immigration will always be
that skill group whose relative supply has decreased as a consequence of immigration. As we
15
stress above, no effects are to be expected if the skill composition of immigrants resembles
that of the native population.
The model we have outlined above is the basis for much of the empirical work done in the
area. It is attractive because of its simplicity and clear-cut implications. However, it does not
capture all the aspects of adjustment of the receiving economy to an inflow of immigrants,
and we will discuss a simple extension below.
1.1.2 Multiple outputs, skilled and unskilled labour
The economy we have characterized above is a one-sector economy, where only one output
good is produced. Such an economy can only react to a change in the composition of its
workforce (by e.g. immigration) through changes in the wage structure. Now assume a multi-
sector economy, where each sector produces one output good. Assume also that all output
goods can be traded, with output prices fixed on world markets. Such an economy has an
additional way to adjust to changes in the skill composition of its workforce, namely by
adjusting the mix of output goods it is producing. We discuss in the next paragraph how that
works.
To focus ideas, we will again assume that labour supply is inelastic, i.e. that all workers will
supply their labour whatever the wage level is. Again, we will relax this assumption below.
We assume also that there are only two sectors, one being intensive in the use of unskilled
labour, and one being intensive in the use of skilled labour. These two sectors produce two
output goods, both traded on world markets. Furthermore, assume, as above, that all
immigration is unskilled. Holding the output ratio fixed, immigration would, as before, drive
down wages of unskilled workers (and increase wages of skilled workers). This however
16
drives up profits in that sector which uses unskilled labour more intensively. As a
consequence, this sector will expand production, which, in turn, pushes up demand for
unskilled labour. This will then again increase unskilled wages. Accordingly, while the
immediate impact of immigration is to lower wages of unskilled workers, in the longer run
wages will increase again. Assuming the eventual equilibrium continues to involve positive
production in all traded goods sectors, wages should return to the initial pre-immigration
equilibrium. Leamer and Levinsohn (1995) refer to this as the hypothesis of factor price
insensitivity. In the context of the discussion on immigration, this is sometimes referred to as
the structural hypothesis – meaning that immigration changes the industry structure, rather
than the wage structure.2
What is different in this economy that leads to different effects of immigration compared to an
economy with only one output good? Remember that there are multiple goods produced in
this extended economy, as compared to one good only in the economy we discussed above.
Rather than impacting on wages, long-run effects of immigration are felt in the output mix
with production of output goods expanding that use unskilled labour relatively intensively. In
other words, the economy reacts to an inflow of unskilled workers by expanding production in
that sector that uses unskilled workers more intensively.
Again, and as before, if labour supply is elastic, there may be both employment and wage
effects in the short run, before the output mix can fully adjust. As in the one output case, no
effects of migration on wages and employment are to be expected (neither in the short- nor in
2 In the extreme case, and for sufficiently large scale immigration of unskilled labour, the economy may
specialize in producing only the good that uses the immigrating factor more intensively (see Bhagwati and Srinivasan, 1983). Obviously, in such a case there will be factor price effects, that is effects on skill-specific wages, for the obvious reason that once one good ceases production, the economy (for our example) behaves like a one-sector economy.

17
the long run) if the composition of migrant labour resembles that of the resident pre-migration
population.
These results can be generalised to multiple factors and multiple outputs, and it can be
extended to the case of non-traded goods, with the relevant algebra being detailed in trade
theory models (see for example Ethier 1984 and Woodland 1982). Important is that there are
more traded goods in the economy than factors of production, to allow the economy to react
through flexibility in its output mix.
A further adjustment mechanism is through technology. While above the economy adjusts to
changes in the skill composition (induced through immigration) by adjusting the output mix,
adjustment could also take place through technology changes, in the way that technology
adjusts so that the relatively more abundant type of labour is used more intensively. Lewis
(2004) emphasises this possible way of adjustment and provides empirical evidence for his
hypothesis for the US. We will discuss his study below.
1.2 Measuring the immigrant impact on the labour market
How can the effect of immigration on native employment and wages be estimated, what are
the problems of empirical assessment, and what is the empirical evidence on the effects of
immigration on wages and employment of resident workers? In this section we discuss the
problems that may arise in the empirical analysis, and the methods that are used to address
them.
1.2.1 The spatial correlation approach

18
The usual approach in the literature is motivated by the following thought experiment.
Consider an economy that can be divided into two regional labour markets R1 and R2, both
identical to each other. Now suppose immigration takes place, and all immigrants are sent to
labour market R1. The effect of immigration on wages and employment could now be
measured by comparing wages (and employment) between labour market R1 and labour
market R2, and relate it to the relative magnitude of immigration. In this example, labour
market R2 serves as the counterfactual: it represents labour market R1 in the absence of
immigration.
Following this thought experiment, and extending it to more than 2 regions, an empirical
implementation would then regress a measure of employment or wages of resident workers in
a given area on the relative quantities of immigrants in that particular locality and appropriate
controls. This approach is often referred to as the spatial correlation approach. Spatial units
are intended to correspond to geographical labour markets. In the U.S. context, the spatial
units usually used for empirical analysis are standard metropolitan statistical areas. Work by
Dustmann, Fabbri and Preston (2005) for the UK for example uses UK regions.
Permanent effects
If implementing this approach, however, the analyst makes a number of assumptions. Most
importantly, it is assumed that the allocation of immigrants is random and independent of
permanent labour market conditions in the respective region. However, pre-migration
conditions in local labour markets are usually not identical (e.g. Greater London is
economically more successful than the South-West of the UK), and the allocation of
immigrants to local labour markets is a choice of immigrants. Typically, immigrants will
choose the local labour market that provides the best economic prospects. Immigrant

19
populations may also be concentrated in areas of enduring low or high economic prosperity as
a consequence of historic settlement patterns and policies. This may lead to a positive or
negative statistical correlation between immigrant concentration and economic outcomes
(depending on whether immigrants tend to settle in areas with persistently low or high
economic performance), even in the absence of any genuine effects of immigration on
outcomes of native workers. In other words, the levels of immigrant shares and levels of
labour market outcomes may be spatially correlated because of common fixed influences.
The way to deal with this problem is to estimate models that remove any such “fixed effects”.
Two approaches to this are common. One is to estimate the relationship using differences,
which is to say to relate the changes in immigrant concentration between two points in time to
changes in economic outcomes. Taking differences eliminates any persistent effects present in
all periods. Following our example above, we would relate the change in economic outcomes
of the resident population (such as employment or wages) to the change in the concentration
of immigrants in R1 relative to R2. A similar approach, known as within groups estimation, is
equivalent to including a full set of dummy variables for the relevant spatial units.
The idea of this approach is that the additional variation within regions (by observing
outcomes as well as immigrant ratios at two points in time) allows for conditioning on region
specific fixed effects. In the absence of longitudinal data, other approaches are possible to
eliminate such permanent region specific effects if additional variation within regions is
available. Card (2001) for example allocates immigrants and natives to six different skill
groups, assuming that within each skill group, immigrants and natives are perfect substitutes.
His data is based on the 1990 census and he distinguishes 175 local labour markets. As he
observes in each of these labour markets six different occupation groups, he can condition on
region specific fixed effects. We will discuss Card’s study in more detail below.

20
Simultaneity
However, this within groups and difference approach is problematic, too. Suppose that there
are two periods, and economic conditions are identical in both regions at the start of period 1.
At the end of period 1, a positive shock hits region R2. Immigrants enter the economy at the
start of period 2. They are free to choose the region of residence, and they observe the shock
before they decide about where to settle. Obviously, it is likely that they will choose region
R2 over region R1.
The direction of causality between immigrant inflows and labour market outcomes is
therefore not necessarily clear-cut, even if we relate differences in economic outcomes to
differences in the immigrant concentration. Immigrants may be attracted to those areas that
are enjoying current economic success. In this case not only may immigrant inflows drive
labour market changes, but labour market changes are driving inflows. This selective
settlement would lead to an upwardly biased estimate of the effects of immigrants'
concentration on labour market outcomes. Specifically, any depressive impact of immigration
on wages could be masked by the fact that the inflows of immigrants occur most strongly in
regions where the effect is offset by positive economic shocks.
One way to address this problem empirically is based on the following thought experiment.
Suppose the decision of immigrants about where to settle is based on two factors. First,
immigrants may take the relative economic prosperity of an area, induced by transitory
economic shocks, as one reason for settlement - this is what creates the problem. They may
however also take account of other aspects of an area, such as existing networks and the
presence of individuals with the same culture and language as themselves. Thus, besides
possibly choosing areas that were subject to favourable recent economic shocks, immigrants

21
may tend to settle in areas with already high immigrant concentrations. Ann Bartel (1989) was
the first to empirically show this tendency of new immigrants to move to enclaves established
by older immigrant cohorts of the same origin or ethnicity. In fact, her analysis suggests that
the existing ethnic concentration in a locality is the most important factor in the locational
choice of new immigrants. Pre-existing immigrant concentrations are now unlikely to be
correlated with current economic shocks if measured with a sufficient time lag. Therefore,
historic settlement patterns may help to solve the simultaneity problem and identify the effects
of the inflow of immigrants on economic outcomes. A number of empirical studies follow this
approach (see, for instance, Altonji and Card 1991, Hunt 1992, Card 2001, Card and Lewis
2005, Dustmann et al. 2003). The idea of estimation in this case is to utilise the variation in
the regional allocation of immigrants that can be solely explained by variation in existing
networks (which is uncorrelated with current economic shocks) to estimate the effect of
migration after differencing out permanent regional differences. This technique is called
instrumental variables regression and historic settlement patterns are in this case the
instrument. The approach amounts to regressing differences in regional economic outcomes
on differences in immigrant/resident ratios, using past immigrant densities as an instrument
for the latter.
It has to be stressed that the assumption that lagged values of immigrant stocks are correlated
with employment changes only through their relation with immigrant inflows is an identifying
assumption that is not testable. It could be problematic if local economic shocks were
persistent and instruments were insufficiently lagged. The strength of correlation between
lagged concentrations and current inflows is observable in the data and can therefore be
assessed.
Measurement error
22
A further problem is directly related to the poor data quality often encountered by researchers,
in particular for countries where estimation depends on survey information. Measures of
immigrant concentrations may suffer from measurement error due to small sample sizes.3
Furthermore, the consequences of any measurement error in measures of regional
concentration of immigrants are aggravated when using methods proposed above for
eliminating the problem of fixed effects, since these tend to magnify the importance of the
measurement error relative to the informative variation in the data. Measurement error leads
to a tendency towards finding no effect even when one is present in reality. The mismeasured
inflows will be less strongly associated with labour market outcomes than the true inflows,
and the estimated effects may therefore be biased towards zero. This is known as attenuation
bias. It will typically be a minor problem where sample sizes used to derive measures of
immigrant inflows are large (for instance when large sub-samples from national censuses are
used), but may be more serious where smaller data sources are employed (see Abdurrahman
and Borjas (2006) for a discussion).
One solution to this problem is the same as to simultaneity – instrumental variable estimation.
As long at the effect of immigrant concentration on economic outcomes of the resident
population is linear, the instrumental variable estimator discussed in the previous section will
remedy both problems. Other examples of instruments in the context of measurement error
would be alternative measures of immigrant flows from other surveys, or variables believed to
exert a causal influence on the true immigrant flows, and which are measured with
uncorrelated measurement error.
Out-migration of natives
3 Measurement error due to sampling imprecision will be zero on average. It is therefore not to be thought of as similar to the sort of systematic measurement error which could arise through misreporting, poor data definition and so on.

23
A further problem arises from the fact that local labour markets are not closed economies and
workers are free to move in or out. If immigration does drive down local wages for certain
skill groups then one would expect there to be pressure for currently resident workers of that
skill type to move elsewhere to gain high wages. This will tend to disperse the wage impact of
immigration through the national economy and undermine the ability to identify the wage
impact from looking at effects within localities. This leads to estimates of the effect of
immigration on wages or employment of workers currently resident in local labour markets
that are not as negative as the effects which one would obtain without internal migration
responses. This point has been stressed in numerous contributions. The U.S. literature
contains conflicting opinions on the seriousness of the problem. Filer (1992), Frey (1995,
1996), and Borjas (1999, 2003) for example, regard it as more serious than Card and DiNardo
(2000) or Card (2001).
There are several ways the literature has responded to this problem. One is to address it in two
stages. If one could establish in a first step that out-migration of native workers as a reaction
to immigration into a particular spatial unit is unimportant, then the problem can in principle
be ignored when estimating the effects of immigration on employment and wages. As
mentioned, there is dispute in the literature whether out-migration is in fact modest or not. In
a number of recent papers Card and co-authors finds little to no evidence of this for U.S. data
(Card and DiNardo 2000, Card 2001). However, others (such as Borjas, Freeman and Katz
1997 and Borjas 2003) consider out-migration of natives as a result of wage-depressing
effects of immigrants a far more important factor, leading to a bias towards zero when
estimating the effects using the spatial correlation approach.

24
Another way to remedy this problem is to consider the econometric problem arising as one of
an omitted term in the estimated equation. One obvious solution to this is to measure outflows
of residents and incorporate them directly into the estimation. However such outflows are
likely to be correlated with shocks to local economic conditions for the same reasons as
immigrant flows, discussed above, creating a further simultaneity issue. These outflows
therefore also need instrumenting and it is theoretically less clear what would serve as a
suitable instrument; lags are one option. This approach has been taken by Dustmann, Fabbri
and Preston (2005).
Finally, the problem may be more severe when using small spatial units, like (in the UK
context) wards. Using larger spatial units may lead to internalisation of possible native
migration responses. For example, if natives react to immigration for instance to South
London, it is likely that they will not move to Manchester, but to say North London instead.
1.2.2 Simulation based approaches
Simulation based approaches are aimed at avoiding identification of the effects of
immigration from local labour market information only. The counterfactual – the labour
market conditions in the absence of immigration – is constructed by simulation (see Borjas,
Freeman and Katz 1997). The basic idea of what these authors call the aggregate factor
proportions approach is a comparison of the actual supplies of workers in particular skill
groups to those that would prevail in the absence of immigration. These changed factor
proportions due to immigration will lead to different wages and employment situations for
native skilled and unskilled workers.

25
This approach is creating the counterfactual situation based on a structural economic model
and pre-estimated parameters rather than on direct estimation. Therefore, it creates estimates
that are sensitive to the chosen model structure, as well as these underlying parameters that
are used for simulation. A key parameter is the responsiveness of relative wages to relative
skill supplies, the elasticity of substitution. An advantage is that it allows additional insight
into the way immigration relates to e.g. trade (see Borjas, Freeman and Katz 1997). The
model excludes factor price equalisation, which we have discussed above, and which may
lead to adjustment through output mix rather than factor prices.
The simulation approach relies on a few crucial assumptions. Most importantly, it is not clear
what the counterfactual situation looks like, for instance what the trend in relative demand for
different skill groups during the period of analysis has been. This uncertainty is reflected in
the choice of the elasticity of substitution between skilled and unskilled labour, which
translates the changes in relative labour supply into wage and employment effects, and which
is very much driving the results for the immigrant impact on native outcomes. Also, as Rachel
Friedberg and Jennifer Hunt (1995) point out, the increase in relative supply of unskilled
workers on wages is by construction constrained to be the same independent of whether the
increase occurred due to immigrants or natives. For that reason an important assumption for
obtaining unbiased results is that natives and immigrants are perfect substitutes within each
skill group.
1.2.3 The skill cell correlation approach
In a recent paper George Borjas (2003) suggests an alternative estimation method to retrieve
possible wage- and employment effects. Arguing that the spatial correlation approach may
lead to an underestimation of wage- and employment effects, he suggests using an analysis

26
that is based on the national level and therefore robust to the problem of out-migration or, for
that matter, other ways of adjustment of local labour markets. Borjas argues that workers are
not necessarily perfect substitutes within education groups, as labour market experience is
adding another important component of human capital, thus leading workers to become
distinct even in the same education group according to the human capital they have
accumulated. Following this argument he defines skill groups as education-experience cells
and assumes that workers within education-experience groups are perfect substitutes.
Consequently, immigrants in the lowest education group compete only with workers in their
experience cell. The impact of immigration on native employment and wages is then
estimated by regressing the cell-specific native outcomes on the immigrant share in the
respective education-experience group. A recent study by Sarit Cohen-Goldner and Daniele
Paserman (2004) uses similar cell definitions in an analysis for Israel.
This cell correlation approach is not dissimilar to the idea in Card (2001) who distinguishes
between six skill groups, in that it creates additional variation that can be used for estimation.
For a sufficiently large number of cells, and additional time variation, estimation does not
need to rely on variation obtained from spatial segregation.
In his study Borjas (2003) uses data over four decades. He has therefore variation over time,
and across education- and experience groups. While the key identification assumption in the
spatial approach that uses data over time and conditions on region- and time effects is that the
impact of migration can be identified from changes within spatial units over time, Borjas’s
identifying assumption in this approach is that the impact of immigration can be identified
from changes within education-experience cells over time. In particular, it excludes the
possibility that immigrants select into those skill cells where economic conditions are better,
27
or that immigrants are for some reasons forced into particular cells, that is “downgraded” in
the host economy’s labour market.
An important assumption underlying the skill cell correlation approach is the perfect
substitutability between natives and immigrants within skill cells. Two recent studies by
Marco Manacorda, Alan Manning, and Jonathan Wadsworth (2006) and Gianmarco Ottaviano
and Giovanni Peri (2006a) analyse in how far this assumption is valid for the UK and the
U.S., respectively. Both studies find that immigrants are not perfect substitutes for natives
even within narrowly defined skill groups but partly complement their skills, so that their
effect on native wages is substantially smaller than previously estimated. With imperfect
substitutability of natives and immigrants within skill cell, the group most affected by new
immigrant inflows are according to both studies previous immigrants.
An additional important prerequisite of the skill cell correlation approach is that immigrants
can be allocated to skill groups based on their observable characteristics. This, however, may
be very difficult, as immigrants downgrade just after arrival, and improve their economic
position in the years after arrival. That may therefore make pre-allocation difficult. Dustmann,
Frattini and Preston (2007) provide evidence for the UK that downgrading is substantial.
1. 3 Empirical findings: A survey of the literature
We provide here a brief survey of empirical findings, highlighting the different empirical
approaches along the discussion in the previous section. Other earlier surveys include, for
instance, Friedberg and Hunt (1995) and Gaston and Nelson (2002).4 Although an increasing
number of studies have been conducted over the last years for countries other than the US,
4 Gaston and Nelson (2002) provide a comprehensive survey of the empirical literature, emphasizing in particular the distinction between labour- and trade-theoretic approaches to migration.

28
most analyses on the impact of migration that can be found in the literature are for the US.
Much of our survey will therefore naturally draw on US evidence.
1.3.1 Estimating production functions
Some of the first papers in the literature trying to empirically assess the impact of immigration
on wages and employment in the host economy were guided by neoclassical input demand
theory, estimating production functions and distinguishing between different labour inputs
and capital. The estimated parameters from these models inform about the substitutability or
complementarity between the different factors and thus allow assessing which effects changes
in their relative supply might have.
Jean Grossman (1982) was among the first to estimate such models. In her study she estimates
a translog production function for the U.S. to obtain elasticities of factor complementarity
between natives, second generation natives, foreign-born workers and capital.5 Estimations
are based on 19 SMSAs (Standard Metropolitan Statistical Areas), using data from the
National Origin and Language Subject Report, the County and City Data Book, U.S. Census
1970, the Census of Manufacturing, and the Annual Survey of Manufacturing. Among her
main findings are that, first, second generation workers and foreign-born workers are both
substitutes for native workers in production, with the former being more highly substitutable
for natives than the latter. Second, foreign-born workers substitute for second generation
workers more easily than for natives. Finally, capital is complementary with all types of
labour, but strongest with foreign-born and weakest with native workers. With regard to the
impact of immigration, she finds small but non-negligible effects on employment and
(absolute) wages of natives and other immigrants which vary with the maintained assumption
on wage flexibility in the economy.
5 For a detailed discussion of factor substitutability and complementarity in production see Hamermesh (1993).
29
George Borjas (1987) argues that Grossman’s analysis may mask important channels by
which immigration can affect wages and employment in that it neglects race-specific
differences. He extends the analysis, by choosing a generalised Leontief technology and
distinguishing between immigrants’ race and ethnic origins. Based on 1980 U.S. Census data
and data on the capital stock for 84 SMSAs from the Census of Manufactures and the Annual
Survey of Manufactures, he finds that immigrants are substitutes for some labour market
groups (e.g. native white men) and complements for others (black native-born men).
Furthermore, all numerical effects of an increase in immigrant supply on the (absolute)
earnings of native-born men are small. His analysis also confirms non-trivial effects on wages
of resident immigrants, leading to the conclusion that immigrants’ main competitors in the
labour market are other immigrants.
In contrast to the previous two studies, Ira Gang and Francisco Rivera-Batiz (1994) do not
consider immigrants and natives as different factors in production, but distinguish between
education, unskilled labour and experience inputs. In a first step they estimate a translog
production function from which they obtain factor price elasticities between these three
inputs. Both for the U.S. and Europe, their results imply that education, unskilled labour and
experience are complementary inputs. They then proceed by calculating composite elasticities
of complementarity between natives and immigrants using their average human capital
characteristics. Based on these results, the simulated impact of immigration on native
residents is found to be very small.
1.3.2 Using spatial correlations
One of the most influential papers on the impact of immigration on local labour markets is by
David Card (1990), who uses a natural experiment to investigate this issue. He evaluates the
30
effects of the Mariel boatlift on wages and unemployment rates of less-skilled workers. After
an extraordinary sequence of events, the Cuban president Castro allowed all Cubans who
wished to do so to emigrate to the United States from the harbour of Mariel. As a result, some
125,000 Cuban immigrants arrived in Miami between May and September 1980, increasing
Miami’s labour force by 7 %. It is not unreasonable to assume that this inflow of low-skilled
immigrants was exogenous to the local labour market conditions in Miami. Card compares
absolute and relative wages, employment and unemployment in the pre-migration situation
with those occurring after the Mariel boatlift, controlling for common trends by comparing
the outcomes in Miami with those of four other major cities: Atlanta, Houston, Los Angeles
and Tampa-St. Petersburg. In his analysis, which is based on Current Population Survey
(CPS) data, he distinguishes between effects on whites, blacks, Cubans and Hispanics. Maybe
somewhat surprisingly the empirical results of this study show neither an effect of the Cuban
immigrant inflow on the wage rates nor on the unemployment rate of the less-skilled non-
Cuban population in Miami. This suggests a rapid absorption of immigrants into the labour
force. Card points out, however, that the Miami labour market may be atypical of other local
labour markets in the U.S., in the sense that Miami’s industry structure, with a high
concentration of apparel and textile industries, was particularly well-suited to incorporate
low-skill immigrants. Also, the high existing concentration of Hispanics could have facilitated
integration. Finally, domestic native and earlier immigrant migration into Miami slowed down
significantly after the Boatlift, hence the Mariels may have partly displaced potential other
migrants.
In a different study, Joseph Altonji and David Card (1991) use the spatial correlation
approach to examine the effect of changes in immigrant density across 120 SMSAs on the
labour market outcomes of the native population. Their analysis focuses on less-skilled
natives (male native high school dropouts, black males and females and white females with
31
high school education or less), arguing that these groups are likely to be most affected by
immigrant inflows. The authors base their estimation equation on a model similar to the one
that we have discussed above, where factors of production are capital, skilled labour and
unskilled labour. In their paper, they first investigate whether immigrant inflows have
displaced less-skilled natives from particular industries. For this purpose they calculate an
index of competition between immigrants and the different native groups which reflects the
overlap in their respective industry distributions. They then estimate the effect of immigration
on various labour market outcomes of native unskilled workers. In these estimations, which
are based on U.S. Census data for 1970 and 1980, they use the stock of immigrants in 1970
as an instrument for the change in the fraction of immigrants in the population between 1970
and 1980 to control for the endogenous immigrant choice of region (see our discussion
above). This instrumental variable approach uses the fact that immigrants tend to go where
earlier immigrant cohorts have already established immigrant enclaves (see Bartel 1989).
Altonji and Card find some evidence of native displacement out of low-wage immigrant-
intensive industries. The estimated effects on (absolute) wages and employment are relatively
small. A 1 percentage point increase in the fraction of immigrants in an SMSA reduces the
number of natives who worked in the previous year by 0.25 percentage points and reduces
their wages by 1.2% at most. They do not find a significant effect on the labour force
participation rate or the employment/population rate. They conclude that the degree of
competition between immigrants and less-skilled natives is modest.
For the same time period, Robert LaLonde and Robert Topel (1991) use the changes in the
immigrant supply in 119 SMSAs in the U.S. between 1970 and 1980 to identify the wage
effects on natives and immigrants of older cohorts. The distinctive feature in this study is that
different cohorts of immigrants are treated as different inputs within local labour markets. The
analysis focuses then on the effect of newly arriving immigrants on all the other immigrant
32
cohorts, which, they argue, serves as an upper bound for the impact on native workers. As
expected and consistent with the assimilation of immigrants over time, new immigrants
reduce earnings of other new immigrants the most relative to natives and this effect dissipates
with increasingly older immigrant cohorts. Thus the best substitute for an immigrant is
another immigrant of the same cohort, whereas the substitutability between an immigrant
cohort and native workers increases with the cohort’s time spent in the country. Overall they
conclude that the effect on natives appears to be quantitatively unimportant.
A further paper based on the spatial correlation approach by Kristin Butcher and David Card
(1991) deals with the question whether the decline in the earnings of the least-skilled workers
in the U.S. in the 1980s can be related to immigration. For that reason, Butcher and Card look
at changes in the lower tail of the wage distribution, in particular of the 10th percentile of
wages, in 24 major cities during the period 1979-1989 and how they correlate with changes in
immigrant densities. Using data from the CPS (Current Population Survey) for the years 1979
– 1980 and 1988 – 1989 and the U.S. Census for 1980, they find that there is no evidence of
any effect of immigration on the level of wages across cities in 1979-1980. Furthermore,
wages in the upper end of the wage distribution grew significantly faster than those in the
lower end during the 1980s. Although the rise in wage inequality was bigger in cities with
bigger immigrant inflows, this is due to a more rapid increase in the 90th percentile of wages,
rather than a decline in the 10th percentile. They thus find no evidence of a significant adverse
effect of immigration on wages.
In a more recent paper, Card (2001) examines the impact of immigration on the relative
labour market outcomes of individuals in specific skill groups in 175 metropolitan statistical
areas (MSAs), using U.S. Census data from 1990. In the underlying theoretical model, six
different labour inputs are defined according to occupational groups, within which immigrants
33
and natives are perfect substitutes.6 In this model the effect of immigration then arises through
the induced changes in the relative supply of different labour inputs, in particular an increase
in the supply of workers in low-skill occupation groups. Unobserved demand and productivity
shocks which would render the immigrant inflows into a specific region-occupation group
endogenous are instrumented with the so called supply-push component, which is the
expected inflow rate into an occupation on the basis of earlier immigrant settlement patterns.
The results of the empirical analysis show again that the effects on native relative wages and
employment are small: a 10 % increase in the population share of a particular skill group
through immigration reduces the employment/population rate of that group by 1 – 1.5
percentage points and the relative wage of that group by around 1.5 %. Furthermore Card
does not find evidence that inflows of new immigrants lead to offsetting mobility flows of
natives or earlier immigrants which would lead to an underestimation of the effect of
immigration on wages and employment.
1.3.3 Simulation based approaches
As pointed out earlier, instead of estimating the effects of immigration by means of spatial
correlation analyses, an alternative approach has been put forward: the simulation or factor
proportions approach.
In a first paper following this approach, George Borjas, Richard Freeman and Lawrence Katz
(1992) analyse how immigration and trade have affected the – for the case of trade implicit –
aggregate supply of workers in particular skill groups in the U.S. economy between 1980 and
1988 using CPS data and the 1980 U.S. Census. They then compare the prevailing wages and
employment outcomes to the case which would have occurred in the absence of immigration
6 In an earlier version of this paper (Card 1997) skill groups are defined by estimating a wage distribution and stratifying individuals into deciles of that distribution. Hence there are 10 different labour inputs within which natives and immigrants are again treated as perfect substitutes.

34
or trade, using an economy-wide estimated elasticity of substitution to simulate the
counterfactual outcomes. As in the paper by Butcher and Card (1991), the motivation for this
study is to investigate whether immigration and trade are possible reasons for the increasing
wage inequality in the U.S. over the 1980s. They observe that both immigration and trade
increase the factor which is relatively scarce in the U.S., unskilled labour, whereupon the
annual increase in implicit labour supply due to trade is larger than the one due to immigrants.
Overall they conclude that immigration had only a small effect on the college/high school
wage differential in the 1980s but a substantial negative effect on the relative earnings and
employment opportunities of the least-skilled workers (high school dropouts). The changes in
relative skill endowments induced by trade and immigration together can explain over 40
percent of the relative wage earnings decline of high school dropouts during the 1980s.
Revisiting their previous work, Borjas, Freeman and Katz (1996) directly compare the results
from their factor proportions approach with estimates obtained from a spatial correlation
model, using U.S. Census data for 1980 and 1990. For their spatial correlation analysis they
examine the effect of the immigrant/native ratio and changes thereof, both overall and within
education groups, on the weakly earnings of an individual. In an interesting experiment they
use increasingly larger geographic areas as the units for their estimations. Controlling for
local labour market conditions and education fixed effects and taking first differences, they
obtain different estimates of the effect of immigration on absolute and relative native
earnings, dependent on the regional unit of analysis. The estimated coefficient on the
immigrant/native ratio tends to become more negative the larger the area of analysis: It is
0.0012 for metropolitan areas, -0.0369 for states and -0.0432 for even larger regions. For this
phenomenon they offer two explanations: Native out-migration and the re-allocation of capital
as a response to immigrant inflows. They then turn towards the factor proportions analysis,
following a similar strategy as in their previous paper to estimate how immigration and trade

35
have changed the national supply of different skill groups. Since this approach looks at
nationwide changes in relative supplies and translates these into changes in relative earnings,
it is not affected by neither native migratory responses to immigration nor changes in the
allocation of capital. As before, they conclude that immigration has been important in
reducing the pay of high-school dropouts, while immigration and trade have contributed only
modestly to the falling pay of high-school equivalent workers.
In another paper on this issue a year later, Borjas, Freeman and Katz (1997) extend their work
in various directions. Most importantly they study a longer time horizon using data from the
Public Use Microdata Samples (PUMS) of the Census for 1960, 1970, 1980 and 1990. Again
they first perform a spatial correlation analysis separately for each decade. Their findings
show that the correlation between changes in immigrant shares and changes in wages by state
switches from +0.591 in 1960-1970 to -0.103 in 1980-1990 for men, and from +0.203 to -
0.022 for women, respectively. They conclude from these results that in using a spatial
correlation approach, one’s inferences about the impact of immigration will differ according
to which period is analysed. They argue that unobserved structural forces, which have little to
do with immigration, are the main drivers of the regional wage structure and that they
dominate any effect immigrants might have on native wages and employment. They conclude
that a spatial correlation approach is therefore not suitable to identify the causal impact of
immigration on native labour market outcomes. They then proceed by investigating whether
immigrant inflows into a labour market induce native outflows. In their estimations for the
period 1970 – 1990 they also include pre-1970 demographic trends, basically estimating a
difference in difference specification, in order to control for the growth trend in a labour
market before immigration occurs. While their initial findings show a positive correlation
between immigrant inflows and native inflows, this specification reveals a significant
negative effect of immigration on the growth trend of the native population, suggesting a

36
considerable displacement of native workers. These results are compatible with the hypothesis
that the impact of immigration is diffused across the country through native migration flows.
As before they then turn towards the factor proportions approach, basically confirming their
earlier results: Immigration has had a strong negative impact on the relative wage of high
school dropouts, explaining between 44 to 55% of the decline in the relative wages of high
school dropouts over the period 1980-1995. Trade on the other hand can explain less than 10
percent of that decline. Finally, neither immigration nor trade seem to explain much of the
increase in the college-high school wage differential.
In a study based on PUMS data from 1980 and 1990, David Jaeger (1996) estimates a nested
production function in which natives and immigrants are disaggregated by sex and
educational attainment to obtain elasticities of substitution between natives and immigrants of
the same sex and with similar skills. In this analysis he adjusts the relative quantities of
supplied labour for changes in relative average productivity of immigrants and natives and
furthermore takes account of potential measurement error in the relative size of the immigrant
to the native population and the relative wages which would bias the elasticity of substitution
upwards by instrumenting with the real relative population changes taken from the 1980 and
1990 Censuses. The important finding of this first part of the study is that immigrants and
natives are essentially perfect substitutes in production within sex-skill groups. Using this
result, Jaeger then proceeds to estimate the impact of immigration on native wages by
assuming an aggregate nationwide production function, which is nested such that dropouts
and high-school graduates form a low-skill, and those with some college education form a
high-skill labour aggregate. He then simulates the wage effects of the immigrant inflow with
various values for the elasticities of substitution between high- and low-skill workers on the
one hand, and dropouts and high school graduates on the other. The results imply that
immigration lowered the native dropout wage by up to 3%, accounting for up to one third of
37
its decline during the 1980s. It also reduced the wage of high school graduates by about 1%
and increased the wage of college equivalents by about 1%. Finally, according to these
results, immigration accounts for approximately 15-25% of the increase in the relative wage
gap between low- and high-skill workers during the 1980s.
1.3.4 Recent developments in the literature
In the last few years renewed attempts have been made to identify the causal impact of
immigration on the labour market, which partly make use of new strategies to avoid some of
the problems encountered in earlier studies.
In a recent skill cell correlation analysis, George Borjas (2003) uses U.S. Census data for the
years 1960-1990 and CPS data for 1998-2001 and exploits variation in supply shifts across
education-experience groups in the economy. The underlying assumption is that individuals
with similar education but different experience are not perfect substitutes but separate labour
inputs. Skill groups are then defined in terms of education and work experience. Changes in
relative supplies of these skill groups are observed on the national level, hence avoiding the
problem of migratory responses of natives. By incorporating these assumptions into a three
level CES production function, Borjas then proceeds to estimate both own and cross factor
price elasticities which are subsequently used to calculate the wage impact of the actual
immigrant inflow into the U.S. between 1980 and 2000. His empirical results imply that a
10% increase in the immigrant share reduces the wages of competing native workers by 3-4%.
The actual immigrant inflow between 1980 and 2000, which increased the labour supply of
working men by 11%, reduced the (absolute) wages of the average native by 3.2%, the high-
school dropouts by 8.9%, the college graduates by 4.9% and the high school graduates by
2.6% and barely changed the wages for workers with some college. Overall these estimates

38
imply that the immigration of the 1980s and 1990s has substantially worsened the labour
market opportunities for most groups of natives.
Using data from the U.S. Censuses 1960 to 2000, George Borjas, Jeffrey Grogger and Gordon
Hanson (2006) specifically turn the attention to the immigrant impact on the wages and
employment rates of African-Americans (see also Borjas 1987, Altonji and Card 1991, and
LaLonde and Tope 1991) and link immigrant inflows to black incarceration rates. In their
model, a reduction in wages induces natives to exit the labour force and either shift to leisure
or into illegal activities. Their empirical results show that a 10% increase in skill-specific
labour supply due to immigration lowers the corresponding black wage rate by 4%, lowers the
employment rate of black men by 3.5 percentage points and increases the incarceration rate of
blacks by about 0.8 percentage points. While the wage elasticity is similar for whites, the
effects of immigration on employment and incarceration are significantly larger for blacks
than for whites. With these results being potentially highly controversial, the authors
emphasise that although the immigrant effect seems to be numerically important, much of the
decline in employment and increase in incarceration in the black population between 1960
and 2000 still remains unexplained.
While most of the emphasis in the literature is on the immigrant impact on low-skilled
natives, Borjas (2006a) turns towards the high-skill sector and investigates the effect of
foreign student inflows on the earnings of doctorates in the U.S. using data from the Survey of
Earned Doctorates and the Survey of Doctoral Recipients for the years 1993 to 2001. Defining
skill groups by 22 doctoral fields in science and engineering and by the year of graduation, he
uses variation in the supply shock to these groups at different points in time caused by the
influx of foreign students to identify the wage impact of immigration on high-skilled workers.
The estimated wage elasticities imply that a 10% increase in the supply of doctorates due to

39
immigration lowers the wages of competing native doctorates by 3 to 4%, with about half of
this wage effect being explained by an increased prevalence of post-doctoral appointments in
fields that are subjected to immigration. Overall, the inflow of foreign students between 1993
and 2001 increased the supply of doctorates by 13.9% and reduced the wage of the average
doctorate in science and engineering by around 3.6%, although there are some fields that
experienced substantially larger wage losses of up to 10% such as computer science and
mechanical engineering. The author points out though, that these simulation results are based
on the assumption that there are no spill-overs between different doctorate fields, for instance
by students moving to other departments in response to the inflow of foreign students, and
that all other factors such as the demand of firms for doctorate students and the supply of
native students are held constant. Therefore, the results are best interpreted as the short-run
impact of high-skill immigration before any additional adjustments to immigration have taken
place.
Gianmarco Ottaviano and Giovanni Peri (2006a) claim that the assumption of perfect
substitutability within experience-education cells, as assumed by Borjas, may be
inappropriate. They set up a general equilibrium framework in which they allow for imperfect
substitutability between natives and immigrants within skill cells as well as short- and long-
run responses of physical capital. Defining skill groups by education and experience and
using U.S. Census data for the period 1960 to 2000 and the American Community Survey
sample for 2004, their results substantially revise earlier estimates about the impact of
immigration on native wages. Accordingly, the average wage rate of all U.S.-born workers
experienced a significant increase of 1.8% as a consequence of immigration during the 1990
to 2004 period. The only native group suffering a negative wage effect are the least educated
workers with a long-run real wage decline of moderate 1.1%. All other native groups gained
from immigration with wage increases between 0.7% and 3.4%. The groups most negatively
40
affected are previous cohorts of immigrants, confirming earlier results in the literature of, for
instance, Borjas (1987) and LaLonde and Topel (1991). These groups suffered substantial
wage decreases of around 20%.
1.3.5 Studies for countries outside the U.S.
Apart from the studies above, which were all conducted for the U.S. labour market, there is a
substantial literature for other countries which tries to answer the same question about the
effect of immigration on native labour market outcomes in the context of their country-
specific labour markets and immigration experiences, the most important of which we will
now present.
One of the first papers for a European country was a study by Jennifer Hunt (1992) which
analyses the impact of a large immigrant inflow from Algeria into the French labour market as
a consequence of Algeria’s independence from France in 1962. Within the space of a year,
900,000 people of European origin, called repatriates, returned from Algeria to France,
constituting a significant labour supply shock to the economy. In her study, which uses
French Census data for 1962 and 1968, Hunt uses regional variation in the proportion of
immigrants and changes thereof for 88 regions to evaluate the effect of the repatriates on
(absolute) wages, unemployment and labour force participation of non-repatriates, and the
migration decisions of other groups. She argues that the immigrant inflow after Algeria’s
independence can be viewed as a natural experiment since the timing of the inflows does not
depend on economic conditions in France. Furthermore, since basically everyone of European
origin returned to France, selection of immigrants does not seem to be an issue in this case.
Finally, observing that the location choice of the repatriates is driven by cultural and climatic
factors, she uses the average temperature and the stock of pre-1962 repatriates in a region as
41
instruments for the change in the immigrant share. The empirical results imply that a 1
percentage point increase in the immigrant share of the labour force reduced the average wage
in a region by at most 0.8% and increased the unemployment rate of natives by 0.2 percentage
points, which compared to U.S. studies (e.g. Altonji and Card 1991) shows more adjustment
through employment than through earnings which might be due to France’s strong wage
setting institutions. Also, there is no evidence that potential immigrants from abroad and
migrants within France were discouraged from moving to areas with many repatriates. Hunt
concludes that the inflow of repatriates to France after 1962 had little impact on the labour
market outcomes of the native population.
In a similar case study for Portugal, William Carrington and Pedro de Lima (1996) evaluate
the effects of the inflow of repatriates from Mozambique and Angola to Portugal in the
aftermath of Portugal’s loss of its African colonies in 1974-1976. During these years around
600,000 immigrants came to Portugal, increasing its labour force by some 10%. In order to
identify their effect on wages, unemployment and the employment/population rate, Carrington
and de Lima choose two different approaches. First, they use Spain and France as the
comparison group, arguing that in particular Spain was in a similar situation to Portugal
before the immigrant shock occurred. Second, they look at spatial correlations between the
repatriate density and changes in the daily wages in the construction industry within
Portugal’s 18 regions. In one specification they use the fraction of repatriates in 1981 as an
instrument for the change in a district’s population which itself drives the changes in daily
wages in construction in a region. From their time-series comparison with Spain and France,
they conclude that the immigration of repatriates did cause some short-run unemployment but
this effect is overshadowed by European-wide increases in unemployment. In the spatial
correlation analysis, high immigration districts showed much slower wage growth in the

42
decade after the immigration than before. However, the timing and persistence of the wage
effects raise the question whether the immigrants were the causal reason for this downturn.
In a panel analysis for Germany for the period 1984-1989, John De New and Klaus
Zimmermann (1994) examine in how far immigrant concentrations in an industry affect
native wages. Using individual level data from the German Socio-Economic Panel (GSOEP),
they distinguish two labour inputs, blue and white collar workers, within which immigrants
and natives are substitutes and use the variation in the immigrant share across industries to
identify the wage effect of immigration. In order to control for the endogenous choice of the
industry sector, the authors use industry dummies, industry growth rates and overall and
industry specific time trends as instruments. Their estimates imply that a 1 percentage point
increase in the overall share of immigrants reduces the overall hourly wage by 5.9% for blue
collar workers and increases the wage of low-experience white collar workers by 3.5%. In a
similar study, using the same framework and data, Haisken-De New and Zimmermann (1995)
identify the effect of immigrants on native wages using regional variation in the foreign share
in an industry. Contrary to the results of their previous work, their estimates point towards
complementarity between immigrants and natives with no significant wage effects for native
white collar workers and positive effects on experienced native blue collar workers.
In another study for Germany, Jörn-Steffen Pischke and Johannes Velling (1997) look at
spatial correlations between the immigrant share and native employment in 167 German
regions between 1985 and 1989 using aggregate data from the German Federal Statistical
Office and the Bundesforschungsanstalt für Landeskunde und Raumordnung, the Federal
Institute for Regional Planning in Germany. They observe that the unemployment rate in
Germany does not follow a random walk but is strongly mean reverting over the period 1985-
1989. Therefore the use of lagged levels of immigrant shares as an instrument as proposed by
43
Altonji and Card (1991) is unsuitable for the German context. Instead they use previous
labour market outcomes as instruments for potential immigrant selection into local labour
markets. To check whether native migratory responses to immigration might have diffused the
effect on wages, they also regress internal migration rates of Germans on contemporaneous
migration flows of foreigners from abroad and other regions in Germany. They find no effect
of increased immigration on the unemployment rate and some evidence that a larger inflow of
foreigners lowers the employment rate for natives: A change in the foreign share of 1
percentage point reduces the employment/population rate of Germans by 0.44 percentage
points. Furthermore they do not find evidence that foreign immigration affects native
migration patterns. They conclude that there are no significant displacement effects due to
immigration in the German labour market.
Instead of using regional or industry variation in the immigrant share for the empirical
analysis, Thomas Bauer (1998) follows Grossman (1982) in estimating a translog production
function to obtain elasticities of complementarity between natives and immigrants of different
skill levels in Germany, using data from the German Labour Force Survey for 1990. Under
the assumption of separability between capital and labour inputs, the empirical results show
that white collar immigrants are substitutes for low skill blue collar and white collar natives
with factor price elasticities of -0.02 and -0.008 respectively. Furthermore, low skill blue
collar immigrants detrimentally affect high skill blue collar natives (factor price elasticity -
0.008). All other groups of immigrants and natives are complements. Bauer concludes that
overall the wage effects of immigrants on different native skill groups are small.
In a couple of studies Rudolf Winter-Ebmer and Josef Zweimüller (1996, 1999) examine the
Austrian case. Using data from the Austrian Social Security Records, they estimate the impact
of immigration on the earnings of young male native blue collar workers by regressing the

44
logarithmic monthly earnings of natives on the immigrant share in either 93 labour market
regions or in 78 industries for the period 1988-1991 (Winter-Ebmer and Zweimüller 1996).
The endogenous immigrant share in a region (or industry) is instrumented with the lagged
foreign share and the average wage among immigrants, as well as the employment growth,
the share of women and the share of blue-collar workers. In contrast to other studies (e.g. De
New and Zimmermann 1994), nearly all regressions show a positive and significant effect of
the immigrant share on the native earnings: at the regional level, a 1 percentage point increase
in the share of foreign workers increases (absolute) native male blue-collar earnings by 2.1-
3.7%, on the industry level by 0.2-1.0%. These results are not reconcilable with the
expectation of substitutability between natives and immigrants. For that reason the authors
proceed by presenting a two-tier bargaining model which can explain a positive wage impact
of increased immigration even if natives and migrants are substitutes. Using firm level data
they then estimate a simultaneous-equation system of the joint determination of the natives’
wage rate and the share of foreigners in the firm’s work force. The results confirm the earlier
finding that natives seem to be able to exploit the presence of foreigners in a two-tier wage
system – employing more foreigners at a lower wage increases the firm’s profit, of which
natives can benefit through bargaining.
In a second paper for the same period, Winter-Ebmer and Zweimüller (1999) turn their
attention to the displacement risk of young natives arguing that it measures the “first-round
effect” of increased immigration. They estimate a probit model that relates the experience of
unemployment to the immigrant share in 76 regions or 46 industries, focusing on young
native workers below the age of 35. As in their earlier study they use variables describing the
structure of employment as instruments for the endogenous immigrant share in a sector
(region). The estimation results indicate no effect of the immigrant share on the
unemployment risk on the regional level. For certain subgroups on the sectoral level such as

45
seasonal workers and foreign employees, however, the effects of immigrant density on the
unemployment probability are quantitatively large.
An interesting feature offers a study by Alessandra Venturini (1999) who examines the Italian
case. In her empirical analysis she focuses on the effect of illegally working immigrants on
native Italians’ legal employment, using Central Statistical Office figures for the period 1980
to 1995. Based on a production function with three labour inputs – regular, non-regular
natives and non-regular foreigners – she estimates elasticities of labour demand which
provide evidence of the relationship between these types of labour. The results imply that
non-regular labour, both of natives and immigrants, has a small adverse effect on legal
employment. The estimated long-run elasticities vary between -0.02 and -0.01 meaning that
an inflow of illegal workers by 10% reduces labour demand for legal employment by 0.2%.
These results vary significantly according to the economic sector in question with strong
negative effects particularly in the agricultural sector and complementarity in the non-tradable
services sector. Overall, however, the conclusion is that non-regular foreign workers do not
seem to have displaced native workers in any significant way.
Israel experienced an enormous immigrant inflow in the 1990s, predominantly from the
former Soviet Union, increasing its population by 18%. Rachel Friedberg (2001) analyses the
effects this inflow had on the national Israeli labour market in the years 1990 to 1994, using
variation in immigrant inflows across occupations. To control for the selection of immigrants
into specific occupation, she uses the immigrants’ former occupations abroad as instruments.
For her estimations which are performed both on an individual- and on an aggregate-
occupation level, she uses data from three different sources: The Israeli Immigrant
Employment Survey (IES), the Israeli Income Surveys (IS), and the Labor Force Surveys
(LFS) 1989 and 1994. As for the case of the French repatriates (Hunt 1992) and the Mariel
46
immigrants (Card 1990), the immigration to Israel in the early 1990s can be seen as
exogenous due to the lifting of emigration restrictions in the Soviet Union. In contrast to the
Mariel immigrants, however, the immigrant labour force in Israel was highly skilled and had
substantial labour market experience. In a first result based on OLS estimations, Friedberg
finds that natives in occupations which received more immigrants experienced lower wage
growth. However, controlling for the endogeneity of the occupational choice, the hypothesis
that the Russian immigration did not affect the earnings or employment of native Israelis
cannot be rejected. At the individual level the effect of immigration on wage growth of
natives is significantly positive which could indicate complementarity between immigrants
and native workers. The effects on employment are not significantly different from zero. The
IV results imply that the negative effects which are initially found in the OLS specification
are due to the fact that immigrants enter occupations with low wages, low wage growth and
contracting employment as opposed to a genuine causal effect of immigration on native
labour market outcomes.
In another paper on the immigrant inflows to Israel of the early 1990s, Sarit Cohen and
Chang-Tai Hsieh (2001) choose a different approach. They look at national level time series
of unemployment rates, wages and labour force participation rates and focus in particular on
the mechanisms by which the Israeli economy adjusted to the very significant supply shock.
They set up a standard neoclassical model with an aggregate production function, competitive
markets, adjustment costs of labour and capital, and standard preferences over consumption
and labour supply, to examine whether the immigration shock induced capital accumulation in
Israel. They find that this model explains very well both the short- and the medium-run
response of the Israeli economy to the Russian supply shock: initially the average effective
wages of native Israelis fell by 20% between 1990 and 1991, while the return to capital
increased sharply. By 1997, however, both average wages and the return to capital had

47
returned to pre-immigration levels because of an externally funded investment boom.
Furthermore, Rybczynski-type changes in the product-mix do not seem to explain the
absorption of the Russian immigrants; the primary reason for this phenomenon is the increase
in the relative utilisation of skilled natives and immigrants within industries (see also Lewis
2004). An important factor in this context which prevented a reduction of the skill-premia for
native Israelis despite the high educational levels of the Russian Jews was their substantial
occupational downgrading on the Israeli labour market. Cohen and Hsieh conclude that the
Russian immigration has been a classical labour endowment shock with a large short-run
effect on wages of all native Israelis, which did, however, not exert a downward pressure on
the skill-premia of native Israelis despite the high educational levels of the Russian
immigrants.
Joop Hartog and Aslan Zorlu (2002) estimate wage elasticities in The Netherlands, the UK
and Norway, relating ethnicity-specific immigrant shares in geographical areas to wages of
natives and other immigrants in each country, using micro-level data. They incorporate three
different types of labour inputs, and distinguish between wage effects for the low, medium
and high skilled workers. However, they do not control for region-specific fixed effect due to
data limitations. They find relatively small effects on (absolute) wages with no dominant
robust pattern of complementarity or substitutability between immigrants and natives of
different skill levels. Immigrants seem to be substitutes for low skilled natives in The
Netherlands (with an elasticity of -0.036) but complements in Norway (with an elasticity of
0.070). For the UK the estimated parameters are not significant. The effects on wages of
earlier immigrant are generally larger but less precise. As the authors acknowledge, one
potential problem in their estimations is the lack of information on the actual skill
composition of the immigrant population in each country.
48
In a recent study which focuses on the UK, Christian Dustmann, Francesca Fabbri, and Ian
Preston (2005) examine how the immigrant share and changes thereof in 17 regions affect
native wages (for 1992-2000), employment, participation, and unemployment (1983-2000),
using panel data taken from the Labour Force Surveys between 1983 and 2000. They first
point out that in the UK, and in contrast to many other European countries, the educational
structure of resident immigrants as well as recent immigrants resembles very much that of
natives, suggesting that immigration may lead to more modest changes in the overall skill
distribution. In their empirical work they instrument changes in the immigrant share in a
region with the lagged immigrant share, making use of the idea that immigrants move where
earlier immigrants of the same nationality have already settled. Their empirical results show
no evidence of significant overall adverse effects of immigration on native outcomes, but
suggest that effects are different for different educational groups.
In a new study, Christian Dustmann, Tommaso Frattini and Ian Preston (2007) use 1997-2005
LFS and ASHE data to study the impact of immigration on natives’ wages and the wage
distribution in the UK. They first present a theoretical model where they show that if capital is
supplied at a price fixed on international markets, immigration will have on average a positive
wage effect, as long as immigrants differ from natives in their skill composition. This is a
direct consequence of the immigration surplus being allocated to native workers in this case.
However, along the distribution of wages, some workers will lose, while others will gain.
They propose an estimation method along the distribution of wages that does not necessitate
pre-allocation of immigrants to particular skill groups. In accordance with the implications of
their theory, they find evidence of an overall positive wage effect of immigration over the
period of study. Their estimates suggest a magnitude that would associate an increase in the
immigrant population by 1% of the native population with an increase in (absolute) native
wages of between 0.3 and 0.4%. Their investigation of the effects of immigration along the

49
distribution of wages of non-immigrant workers suggests that there are clear and significant
differences. Non-immigrants in the middle of the wage distribution gain from immigration,
while individuals at the bottom of the distribution lose in terms of wages. This is compatible
with evidence on the relative location of recent immigrants in the non-immigrant wage
distribution. Over the period 1997 to 2005, immigrants tended to be more concentrated than
natives below the first quartile of the native wage distribution, exactly where the authors find
evidence that wages were held back, and less concentrated from there on upwards, where they
find positive wage effects. Christian Dustmann, Tommaso Frattini and Ian Preston (2007) also
demonstrate that there is substantial downgrading of recent immigrants in the UK labour
market, which would make pre-allocation of immigrants to particular skill groups
questionable.
Following the skill cell correlation approach and allowing for imperfect substitutability
between immigrants and natives within the same skill group, Marco Manacorda, Alan
Manning and Jonathan Wadsworth (2006) investigate for the UK in how far the immigrant
inflows over the period 1975 to 2005 have affected both native and immigrant relative wages.
Using data from the Labour Force Survey (LFS) as well as the General Household Survey
(GHS) and starting from a multi-level CES production function, they first estimate elasticities
of substitution between immigrants and natives and between workers in different age and
education groups. They then proceed by simulating the effect of immigration to the UK
between 1975 and 2005 on the return to education among natives and the overall native-
migrant wage differential. Similar to Ottaviano and Peri (2006a), they find evidence that
natives and immigrants are imperfect substitutes within the same age-education cell. Their
empirical findings then show that immigration has raised the return to education for natives
by a very modest 0.4% but has increased the native-migrant wage differential by 5.5%. They
conclude that the immigrant impact on the wage distribution of the native population is small
50
and that immigration in the UK primarily impacts the wages of immigrants who are already in
the country.
On 1 May 2004, eight countries from Central and Eastern Europe plus Cyprus and Malta
joined the European Union. As opposed to most other old EU member states, the UK (as well
as Ireland and Sweden) granted all workers from the new accession countries free access to
the UK labour market. Between May 2004 and September 2005, around 300,000 individuals,
mostly from Poland (58%), Lithuania (14%) and Slovakia (11%), registered on the Worker
Registration Scheme (WRS) to work in the UK, equivalent to roughly 1% of total
employment in the UK.7 During the same period, claimant unemployment in the UK rose by
over 90,000. Using variation in the proportion of migrants from the new accession countries
across local authority districts, Nicola Gilpin, Matthew Henty, Sara Lemos, Jonathan Portes
and Chris Bullen (2006) investigate in detail in how far the immigrant inflows are part of the
explanation for this rise in unemployment. Combining data on claimant unemployment with
data from the WRS and the LFS, the authors estimate a comprehensive set of regression
models for various groups of workers. In all specifications, the presence of new accession
migrants has a small and insignificant effect on the claimant count rate of UK natives. The
inflow of immigrants from the new EU member states since May 2004 does therefore not
seem to cause the rise in claimant unemployment in the UK.
In a related study, David Blanchflower, Jumana Saleheen and Chris Shadforth (2007) analyse
the impact of immigration from Eastern Europe to the UK between May 2004 and late 2006
from a macro-economic perspective. During those years, approximately 500,000 migrants
from the new accession countries came to work in the UK, half of which are likely to have
7 Since there is no requirement to de-register from the WRS, this number reflects gross inflows only and does not take into account migrants who worked in the UK for only a short period. According to data from the Labour Force Survey, the stock of migrants from the new accession countries aged 16 and over increased by around 120,000 between spring 2004 and summer 2005.

51
already returned to their country of origin by the time the analysis was carried out. Based on
descriptive evidence, the authors argue that the recent immigrant inflows have increased
supply by more than demand in the UK economy due to their high productivity in the labour
market and their lower propensity to consume while resident in the UK compared to domestic
workers. Through this differential effect on supply and demand, recent immigration to the UK
has acted to reduce inflationary pressures and, by lowering the wage bargaining power of
native workers, the natural rate of unemployment.
Finally, in a recent paper for Spain, Raquel Carrasco, Juan F. Jimeno and Carolina Ortega
(2007) also use the skill cell correlation methodology and estimate the impact of both legal
and illegal immigration flows on the employment rates and wages of native workers between
1991 and 2002. To obtain the required data they use three different sources: The Census of
Population for 1991 and 2001 which includes both legal and illegal immigrants, the Register
of Work Permits for 1993 to 1999 and the Wage Structure Survey for 2002. Their results
show overall no evidence of a significant negative effect of immigration on neither
employment rates nor wages of native workers.
1.3.6 Native migratory responses
The overwhelmingly small estimated effects of immigration on native labour market
outcomes in spatial correlation studies have lead to the question of how local labour markets
are able to absorb the in some cases very significant immigrant inflows. Two explanations in
particular have been put forward: First it could be that natives respond to immigrant inflows
by moving out of a labour market, thus compensating for the relative supply changes induced
by immigrants. Second, in a multi-sector economy, the industry structure and the output-mix
could adjust to changes in the skill composition of its labour force. In the case of unskilled

52
immigration, this would mean an expansion of production in those sectors which use
unskilled labour more intensively. There are a number of studies which directly aim at
evaluating the validity of these explanations.
In an important study for the period 1975 to 1980, Randall Filer (1992) examines whether the
arrival of immigrants in a local labour market in the U.S. induces native migration responses.
Using U.S. Census data from 1980, the author presents both simple correlations between
natives and immigrant locational decisions, and regression results where native mobility
patterns are related to immigrant arrival rates. Besides estimating by OLS, three-stage least
squares estimations are performed to account for the endogeneity of the locational choice of
immigrants. The results from this analysis show that the arrival of immigrants both reduced
native in-migration and at the same time increased native out-migration so that overall the
natives’ migratory response more than offset the arrival of immigrants. In particular, the
mobility responses seem to be concentrated among low-skilled natives and stronger among
whites than other minorities. Filer concludes that a high concentration of recent immigrants
has a negative impact on the attractiveness of an area for native workers, which may partly be
attributed to psychological reasons. A similar conclusion is reached in studies by Frey (1995),
who evaluates immigration-induced out-migration of natives from California, and Walker,
Ellis and Barff (1992). In a recent study for the UK, using data for the 12 regions in the UK,
Hatton and Tani (2003) find a correlation between immigrant inflow and native outflows, in
particular for the Southern UK regions.
However, the conclusion that immigrant inflows lead to net native outflows is controversial.
In an empirical study by Richard Wright, Mark Ellis and Michael Reibel (1997), no evidence
for a native response to the presence of immigrants in a local labour market could be found.
Using PUMS data for 1980 and 1990 and distinguishing between five categories of education

53
in the native-born labour force, the authors use a model in which the effect of immigration
and the effect of metropolitan area size are separated. Their results show that the net
migration loss of unskilled native workers from metropolitan areas is likely to be a function of
those cities’ population size rather than immigrant inflows. They then proceed by checking
the consistency of these results by using different samples of metropolitan areas and
excluding high immigration cities from the estimation (especially New York and Los
Angeles). From these robustness checks it becomes clear that model specification plays a
critical role in assessing the relationship between immigration and internal migration.
More recently, David Card and John DiNardo (2000) analyse in how far immigrant inflows
have changed the skill distribution across cities between 1980 and 1990. Their approach is to
examine the correlation of the relative movements of native workers in different skill groups
with the relative inflow rates of immigrants. They test the alternative scenarios of
“demographic balkanization”, in which natives move out of the labour markets as a response
to immigration, against the case of no such migratory response. To control for the
endogeneity of immigrants’ location choice, the authors use the past fraction of Mexican
immigrants in a city as an instrument. Their empirical results, which are based on US census
data for 1970, 1980, and 1990 and 119 larger MSAs, show that there is not much of a native
out-migration as a response to immigration. Quite the contrary, increases in the immigrant
population in a skill group seem to lead to slight increases of the native-born population.
Therefore, immigration did have quite a significant effect on the skill distribution of some
MSAs. Card and DiNardo thus conclude that the small measured effects of immigration on
the labour market outcomes of the native population in spatial correlation studies are
mitigated by other adjustment mechanisms, such as endogenous shifts in the local industry
structure, rather than by a compensating native migration response.

54
Rather than looking for evidence of native out-migration or the absence thereof separately,
Borjas (2006b) models the influence of immigrant supply shocks on the joint determination of
wages and internal migration decisions in local labour markets using data from the 1960 to
2000 U.S. Censuses. In this model, immigration leads to an immediate wage effect upon
which native workers base their future internal migration decisions. The theoretical model
predicts that the factor price elasticity that measures the wage impact of immigration on the
national level can be obtained from the elasticity estimated from cross-region wage
regressions by scaling the latter by a factor that incorporates the relationship between in-
migration of immigrants and net out-migration of natives. The empirical analysis reveals that
immigration is associated with lower wages, lower in-migration rates and higher out-
migration rates and thus with a decline in the growth rate of the native workforce.
Accordingly, for every 10 immigrants who enter a particular state 2 fewer natives choose to
live in that area and for every 10 immigrants that enter a particular metropolitan area between
3 and 6 natives will choose not to live there. Depending on the geographic definition of a
local labour market, the results furthermore imply that native migratory responses attenuate
the measured wage impact of immigration in spatial correlation studies and can account for 40
to 60% of the difference in the measured impact between analyses carried out on the national
and analyses carried out on the local level.
1.3.7 Industry and technology adjustments
The potential adjustment to immigrant-induced changes in the labour supply in a local labour
market through adjustments of the industry structure has been thoroughly investigated by
Ethan Lewis (2004a). In his original analysis he evaluates two possible explanations for the
surprisingly small effects of immigration on relative labour market outcomes in the literature:
1. interregional trade that mitigates the impact of supply shocks through immigration, and 2.
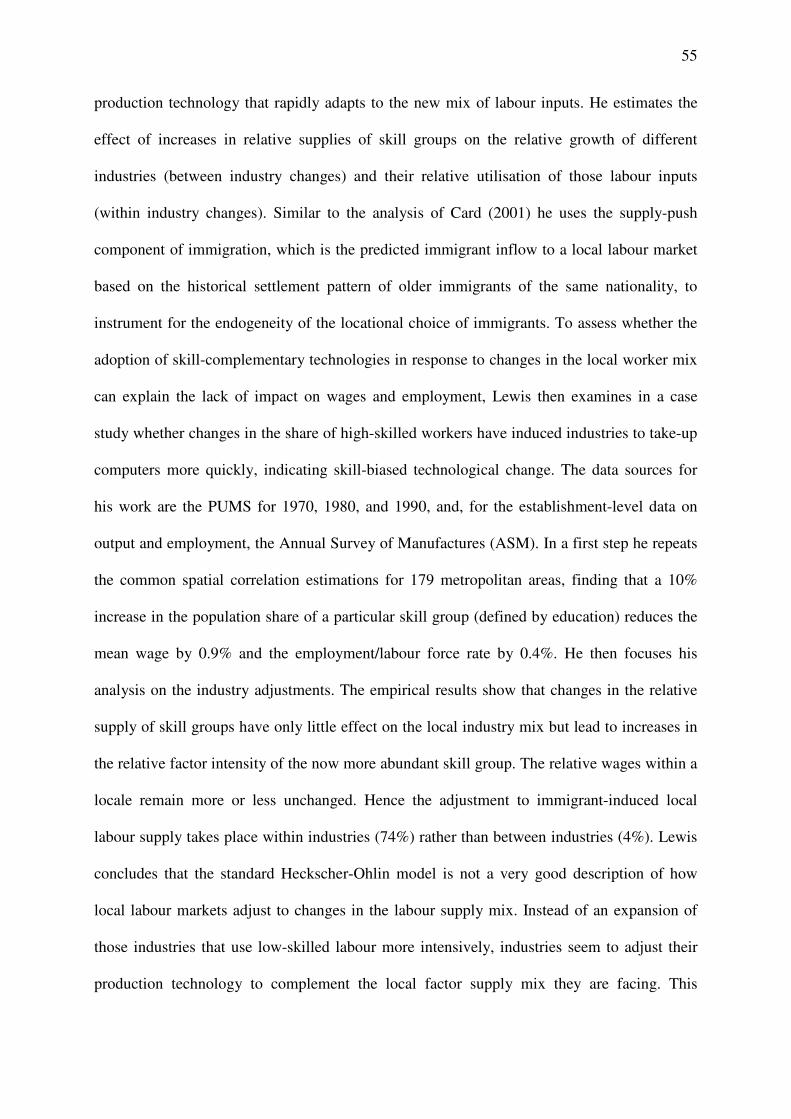
55
production technology that rapidly adapts to the new mix of labour inputs. He estimates the
effect of increases in relative supplies of skill groups on the relative growth of different
industries (between industry changes) and their relative utilisation of those labour inputs
(within industry changes). Similar to the analysis of Card (2001) he uses the supply-push
component of immigration, which is the predicted immigrant inflow to a local labour market
based on the historical settlement pattern of older immigrants of the same nationality, to
instrument for the endogeneity of the locational choice of immigrants. To assess whether the
adoption of skill-complementary technologies in response to changes in the local worker mix
can explain the lack of impact on wages and employment, Lewis then examines in a case
study whether changes in the share of high-skilled workers have induced industries to take-up
computers more quickly, indicating skill-biased technological change. The data sources for
his work are the PUMS for 1970, 1980, and 1990, and, for the establishment-level data on
output and employment, the Annual Survey of Manufactures (ASM). In a first step he repeats
the common spatial correlation estimations for 179 metropolitan areas, finding that a 10%
increase in the population share of a particular skill group (defined by education) reduces the
mean wage by 0.9% and the employment/labour force rate by 0.4%. He then focuses his
analysis on the industry adjustments. The empirical results show that changes in the relative
supply of skill groups have only little effect on the local industry mix but lead to increases in
the relative factor intensity of the now more abundant skill group. The relative wages within a
locale remain more or less unchanged. Hence the adjustment to immigrant-induced local
labour supply takes place within industries (74%) rather than between industries (4%). Lewis
concludes that the standard Heckscher-Ohlin model is not a very good description of how
local labour markets adjust to changes in the labour supply mix. Instead of an expansion of
those industries that use low-skilled labour more intensively, industries seem to adjust their
production technology to complement the local factor supply mix they are facing. This
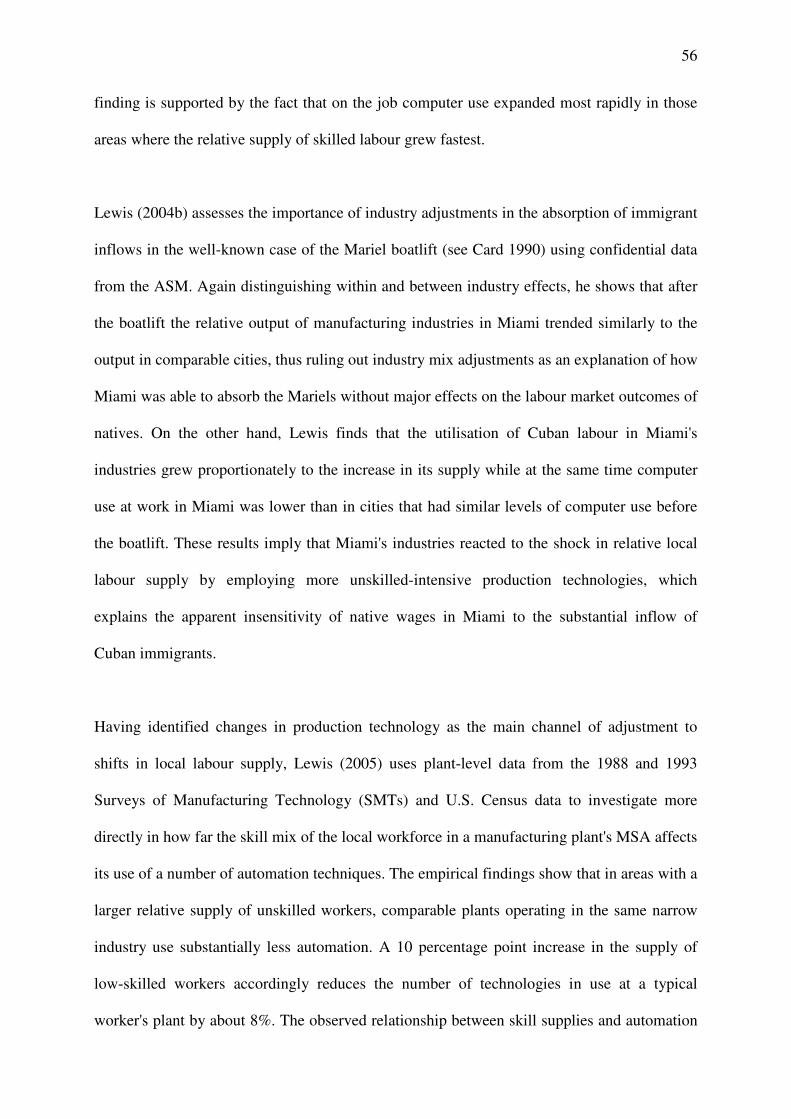
56
finding is supported by the fact that on the job computer use expanded most rapidly in those
areas where the relative supply of skilled labour grew fastest.
Lewis (2004b) assesses the importance of industry adjustments in the absorption of immigrant
inflows in the well-known case of the Mariel boatlift (see Card 1990) using confidential data
from the ASM. Again distinguishing within and between industry effects, he shows that after
the boatlift the relative output of manufacturing industries in Miami trended similarly to the
output in comparable cities, thus ruling out industry mix adjustments as an explanation of how
Miami was able to absorb the Mariels without major effects on the labour market outcomes of
natives. On the other hand, Lewis finds that the utilisation of Cuban labour in Miami's
industries grew proportionately to the increase in its supply while at the same time computer
use at work in Miami was lower than in cities that had similar levels of computer use before
the boatlift. These results imply that Miami's industries reacted to the shock in relative local
labour supply by employing more unskilled-intensive production technologies, which
explains the apparent insensitivity of native wages in Miami to the substantial inflow of
Cuban immigrants.
Having identified changes in production technology as the main channel of adjustment to
shifts in local labour supply, Lewis (2005) uses plant-level data from the 1988 and 1993
Surveys of Manufacturing Technology (SMTs) and U.S. Census data to investigate more
directly in how far the skill mix of the local workforce in a manufacturing plant's MSA affects
its use of a number of automation techniques. The empirical findings show that in areas with a
larger relative supply of unskilled workers, comparable plants operating in the same narrow
industry use substantially less automation. A 10 percentage point increase in the supply of
low-skilled workers accordingly reduces the number of technologies in use at a typical
worker's plant by about 8%. The observed relationship between skill supplies and automation

57
use points towards an endogenous adoption of production technologies by firms as suggested
by Paul Beaudry and David Green (2003, 2005). Such
technology adoption could then explain why in many impact analyses relative wages do not
respond negatively to labour supply shocks caused by immigration.
Paul Beaudry, Mark Doms and Ethan Lewis (2006) take up this last point in more detail and
specifically examine cross-city differences in PC-adoption, relative wages and changes in
relative wages over the period 1980 to 2000 using U.S. Census data and establishment-level
data which include information on the use of technologies. Within the framework of a
neoclassical model of endogenous technological adoption, which links the supply of skill, the
returns to skill, technology adoption, and changes in the return to skill, the authors derive a set
of predictions which they then test empirically on a sample of 230 U.S. cities. Consistent with
these predictions, in regions with a relatively large and thus cheap skilled workforce, the
adoption of PCs took place more aggressively than in regions with a relatively small and
expensive skilled workforce. As a result, the returns to skills increased the most in those
regions in which PCs were most intensively implemented, however, not so much as to create a
positive association between the relative supply of skills (or the PC intensity) and the return to
skill. Overall, their results support the existence of endogenous technology adoption of firms
in response to local factor supply conditions.
1.3.8 Other approaches and perspectives
Besides the more standard spatial correlation and simulation approaches, a number of studies
have chosen alternative ways and perspectives to look at the impact of immigrants on the
labour market.

58
Joshua Angrist and Adriana Kugler (2003), for instance, investigate how the native
employment rates across 18 Western European countries are related to the respective
immigrant shares in those countries, using Eurostat data for the period 1983 to 1999, which is
compiled from country-specific labour force surveys. In particular, they examine whether the
employment consequences vary with labour market institutions in each country which could
affect labour market flexibility. These could be, for example, employment protection
legislation, high replacement rates or business entry costs. The initial empirical results imply
that a 10% increase in the foreign share reduces native employment by 0.2 to 0.7 percentage
points with OLS estimates at the low end and IV mostly larger. As instruments for the
potentially endogenous immigrant flows the authors use the distance from Sarajevo and
Pristina interacted with year dummies, making use of the significant immigration from
Yugoslavia in the 1990s. Turning towards the central issue of the influence of labour market
institutions, they estimate their model introducing interactions between the immigrant share in
a country and three institutional indicators: an index of labour standards (employment
protection, administrative and union oversight in hiring and firing decisions, minimum wages,
restrictions of work hours and employment contracts), the average replacement rate, and a
measure of business entry costs. The estimates from these regressions show larger adverse
immigration effects when the labour market flexibility in a country is low, and replacement
rates and entry costs are high. These findings suggest that reduced labour market flexibility
and restrictive institutions fail to protect natives from job losses due to immigration, and may
even make immigration-related job losses worse.
In a couple of recent papers looking at Israel, the dynamic aspect of the impact of immigration
on the host economy’s labour market has moved into the centre of attention. In the first
instance, Zvi Hercowitz and Eran Yashiv (2002) look at Israel’s mass immigration experience
from the former USSR between 1990 and 1999 from a macroeconomic open economy

59
perspective. They try to identify the dynamic effects this inflow might have had on native
employment. Key to their approach is the modelling of dynamic effects of immigration on not
only labour supply but also labour demand via the immigrants’ participation in the local
goods market. Most importantly they allow for differential entry of immigrants into the goods
and the labour market at different points in time. They estimate their dynamic model of two
equations, one for the native employment rate and one for the relative price of domestic
goods, using data from Israeli Labour Force Surveys. The empirical results show that in early
stages of immigration, immigrants tend to participate more in the goods market relative to the
labour market, increasing the relative prices of domestic goods which in turn leads to
increases in labour demand and native employment. Negative employment effects only appear
with a delay of about a year after arrival, when the immigrants’ relative participation in the
goods market declines and the direct substitution effect of immigrants for natives dominates
the labour demand effect.
In a different study, Sarit Cohen-Goldner and Daniele Paserman (2004) evaluate the dynamic
impact of immigration using a cell correlation approach. In particular they try to distinguish
between short- and long-run effects of immigrant inflows. Looking at the period of mass
immigration to Israel between 1989 and 1999 using Income and Labor Force Survey data,
they first set up a dynamic model in which immigrants with different local experience in the
labour market can have different effects on native wages and employment. In this way they
avoid making the assumption of homogeneous immigration effects over time which is
common in most other studies. Their empirical results from this model then enable the authors
to assess opposing hypotheses about the substitutability of natives and immigrants at the time
of arrival and over time. Controlling for immigrant cohort effects and the selection of
immigrants into low wage or low wage growth segments, they find that immigration did have
a short-run adverse effect on native wages: a 10% point increase in the share of immigrants

60
reduced native wages by 1.2 to 5.7%. However, this effect was dying out after 5 to 7 years. In
contrast, they find no evidence of any immediate or delayed detrimental effect on native
employment. On the basis of these results they conclude that within occupation-based
segments immigrants and natives are close substitutes in the short run until the labour market
adjusts to the changes in labour supply through changes in other factors of production, such as
capital or technology.
In a recent paper Simonetta Longhi, Peter Nijkamp and Jacques Poot (2004) make use of the
various studies that look at the effect of immigration on the labour market by performing a
meta-analysis using a sample of eighteen papers. They relate the estimated coefficient of the
immigrant share of those studies, 344 overall, to various parameters of the research design
such as approach chosen (factor proportions approach, spatial correlation approach), country,
size of the labour market, affected group, type of immigrants, definition of wages etc. They
also explicitly account for study quality and publication bias which arises due to the tendency
of authors and editors to favour the publication of statistically significant results. Their
finding suggests an overall small effect of the proportion of immigrants in the labour force on
wages: a 1 percentage point increase of the former lowers wages across the investigated
studies by 0.12%. More specifically, the negative impact seems to be larger in EU countries
than in the US and immigrants appear to be more in competition with each other than with
natives. Their overall finding seems to confirm the broad conclusion in the literature: that the
impact of immigration on wages is, if statistically significant, quantitatively small.
Robert W. Fairlie and Bruce D. Meyer (2003) turn the attention towards the effect of
immigration on native self-employment. They first set up a general equilibrium model of self-
employment and wage/salary work that predicts small negative effects of immigration on
native self-employment rates and earnings for a range of plausible parameter values. Using
61
PUMS data for 1980 and 1990, they then examine the relationship between changes in
immigration and native self-employment rates and earnings exploiting variation in the
immigrant share across the 132 largest metropolitan areas in the U.S.. Their empirical results
from a first-difference specification indicate a large negative effect of immigration on the
probability of self-employment among native non-blacks. The estimates imply that for each
self-employed immigrant, 0.37 to 0.85 self-employed native men and 0.09 to 0.19 self-
employed native women are displaced. The large magnitude of these effects stands somewhat
in contrast to the predictions of their theoretical model as well as the results of previous work
on black self-employment. However, overall native self-employment in the U.S. was on the
rise between 1980 and 1990, leading the authors to the conclusion that at the national level
immigrants may have primarily taken away opportunities for natives to start new businesses
rather than actually pushing self-employed natives out of business. Also contrary to the
theoretical predictions, the results for the effects of immigration on native self-employment
earnings indicate a positive effect which, as the authors point out, could be explained by
immigrants primarily displacing marginal or low-income self-employed natives.
1. 4 Macroeconomic perspectives on the impact of immigration
Like the analysis on the labour market impact of immigration, empirically assessing its
macroeconomic impact, faces similar difficulties. Again, the reason is the absence of an
obvious counterfactual situation (compare section 1.2), that is how the macroeconomic
situation of a particular country would be in the absence of immigration. This situation will
have to be constructed somehow. In the following we will point out some efforts that have
been made in this direction. The overall empirical evidence, however, on the macroeconomic
impact of immigration is quite limited.

62
1.4.1 Growth
There is a relatively broad theoretical literature that investigates the impact of immigration on
the economic growth of the host country. Stephen Drinkwater, Paul Levine, Emanuela Lotti
and Joseph Pearlman (2002) survey the different models that are being used and identify three
broad approaches which in turn emphasise one of three engines of economic growth that are
affected by migration: Capital accumulation (e.g. Pietro Reichlin and Aldo Rustichini (1998)),
human capital accumulation (e.g. Uwe Walz (1996) or Nadeem U. Haque and Se-Jik Kim
(1995)) or innovation and technology (e.g. Per Lundborg and Paul S. Segerstrom (1998, 2000)
or Lucas Bretschger (2001)). The predictions from these models are mixed and depend on a
variety of assumptions about, for example, the skill composition of migrants, capital mobility
and the existence of economies of scale in the host economy. There is, however, some general
agreement in the literature that there is probably a small positive effect on GDP per capita
from immigration. For instance, a general equilibrium study by Jacques Poot, Ganesh Nana
and Bryan Philpott (1988) for New Zealand found that a net inflow of 15,000 people increases
GDP per capita by 0.2 percent per year and GDP per worker by 0.15 percent per year.
Similarly for the U.S., George Borjas (1995) estimates the economic gains of immigration
accruing to natives to be relatively small, of the order of 0.1 percent of GDP while Robert
Barro and Xavier Sala-i-Martin’s (1992) results suggest that a 1 percentage point higher net
migration rate in the U.S. is associated with a 0.1% higher growth rate.
1.4.2 Inflation
There is a general perception that immigration helps keeping inflation low in an economy by
restraining wage growth which would otherwise have been passed on by employers to
consumers. The empirical evidence on this issue, however, is scarce. In a recent paper,
Patricia Cortes (2006) uses PUMS data for 1980, 1990 and 2000 and exploits regional

63
variation in immigrant concentrations in the U.S. to analyse the impact of immigration on the
prices of goods and services. Her results show that a 10% increase in the share of low-skilled
immigrants in the labour force reduces the prices of immigrant-intensive services such as
housekeeping and gardening by 1.3% and those of other non-traded goods by 0.2%. The main
channel through which these price changes come about is through a negative effect of low-
skilled immigration on the wages of low-skilled workers, in particular of low-skilled
immigrant workers. The author estimates that a 10% increase in the share of low-skilled
immigrants reduces wages of other low-skilled immigrants by 8.0% and those of low-skilled
natives by 0.6%. These wage reductions are then passed on to the consumer in the form of
lower prices of non-traded goods and services. The different impact of immigration on other
immigrants compared to natives supports the recently promoted view that even within the
same skill group, immigrants and natives are imperfect substitutes (compare Ottaviano and
Peri (2006a) and Manacorda et al. (2006)).
In an earlier study and using a similar empirical methodology, Khananusapkul (2004) also
explores the effect of low-skilled immigration on the prices of immigrant-intensive services.
Her results imply that a one percentage point increase in the proportion of low-skilled female
immigrants in a metropolitan area raises the proportion of private household workers by 6
percentage points and lowers their wages by 3%.
An additional and very important mechanism through which immigration can affect inflation
is through its effect on house prices and we will summarise a few studies that have tried to
address this issue in the next section.
1.4.3 Housing
Exploiting the immigration shock to Miami in the aftermath of the Mariel boatlift in 1980
(compare Card (1990)) which increased Miami’s renter population by 9%, Albert Saiz (2003)
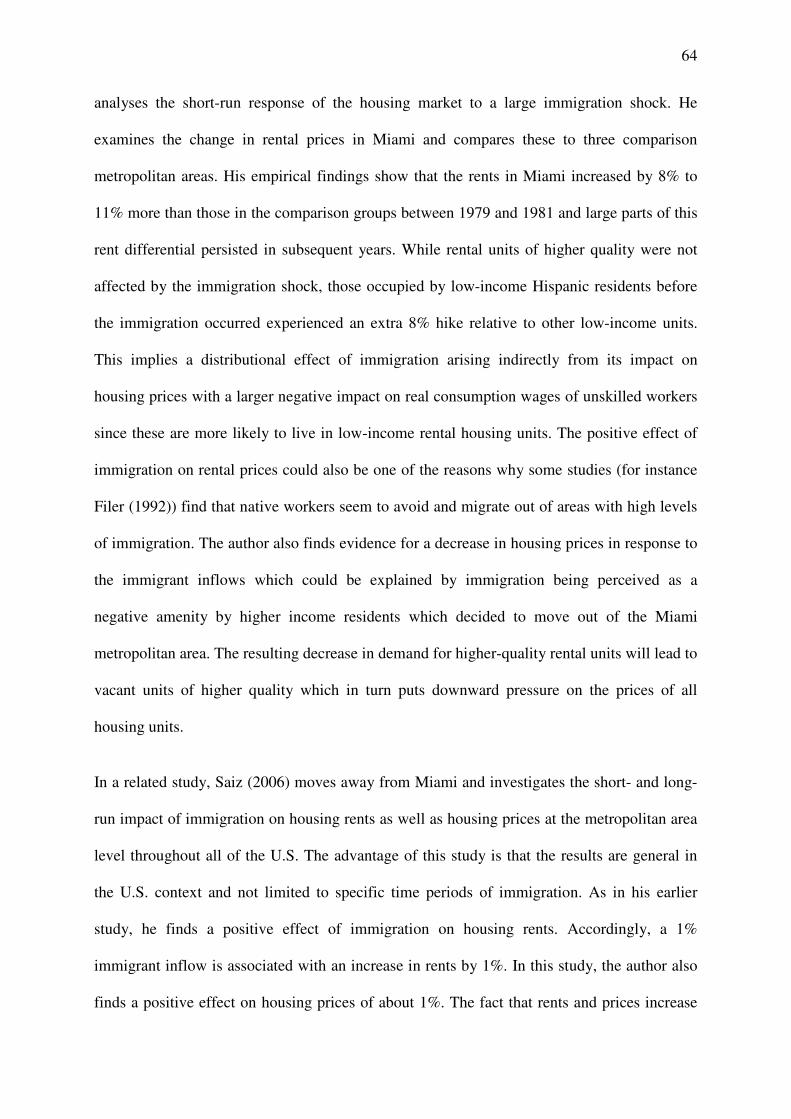
64
analyses the short-run response of the housing market to a large immigration shock. He
examines the change in rental prices in Miami and compares these to three comparison
metropolitan areas. His empirical findings show that the rents in Miami increased by 8% to
11% more than those in the comparison groups between 1979 and 1981 and large parts of this
rent differential persisted in subsequent years. While rental units of higher quality were not
affected by the immigration shock, those occupied by low-income Hispanic residents before
the immigration occurred experienced an extra 8% hike relative to other low-income units.
This implies a distributional effect of immigration arising indirectly from its impact on
housing prices with a larger negative impact on real consumption wages of unskilled workers
since these are more likely to live in low-income rental housing units. The positive effect of
immigration on rental prices could also be one of the reasons why some studies (for instance
Filer (1992)) find that native workers seem to avoid and migrate out of areas with high levels
of immigration. The author also finds evidence for a decrease in housing prices in response to
the immigrant inflows which could be explained by immigration being perceived as a
negative amenity by higher income residents which decided to move out of the Miami
metropolitan area. The resulting decrease in demand for higher-quality rental units will lead to
vacant units of higher quality which in turn puts downward pressure on the prices of all
housing units.
In a related study, Saiz (2006) moves away from Miami and investigates the short- and long-
run impact of immigration on housing rents as well as housing prices at the metropolitan area
level throughout all of the U.S. The advantage of this study is that the results are general in
the U.S. context and not limited to specific time periods of immigration. As in his earlier
study, he finds a positive effect of immigration on housing rents. Accordingly, a 1%
immigrant inflow is associated with an increase in rents by 1%. In this study, the author also
finds a positive effect on housing prices of about 1%. The fact that rents and prices increase

65
due to immigration is consistent with the idea that immigrants do not displace natives one-for-
one, since in that case housing demand would remain unchanged and so should prices. The
authors show theoretically that the impact of immigration is lower in the long run than in the
short run due to new supply of housing and the potential out-migration of natives. Generally,
the impact is higher in cities with inelastic housing supply and lower in cities with high price
elasticity of housing demand or a mobile native population.
The findings of Saiz are supported by a study carried out by Gianmarco Ottaviano and
Giovanni Peri (2006b) who also find a strong positive association between immigration and
house prices of native individuals across the U.S. Because immigrants have lower house
ownership rates than natives across all skill levels, the house price increases caused by
immigration act, on average, as an income transfer from immigrants to natives both in the
short and in the long run. In all reasonable simulations the authors find that the overall wage
plus housing income effect of immigration is positive for natives of all skill levels. In
particular even for the average native low-skilled worker, the small negative wage effect from
immigration is more than offset by the positive effect on housing prices which they can reap
due to their higher house ownership rates. Those most negatively affected from immigration
are thus low-skilled natives that are renting and do not own any equities in housing, since for
them wages fall while rental rates increase.
1.4.4 Fiscal effect
Estimating the net fiscal effect of immigration is quite intricate. While earlier studies have
computed the instantaneous net government surplus for a particular year using a cross section
of immigrants residing in the host country (e.g. Donald Huddle (1993) and George Borjas
(1994)), more recent studies have adopted a dynamic approach by considering the fiscal

66
impact of immigrants over time. Adding a dynamic perspective is important due to the age-
dependency of tax and expenditure programs, and the necessity to include future descendants
of immigrants in the calculations. Using the methodology of generational accounting (see
Alan J. Auerbach, Jagadeesh Gokhale and Laurence J. Kotlikoff (1994)) in which the
discounted net tax contribution (taxes net of transfer payments received) of a representative
individual in his/her lifetime is calculated, a number of studies have assessed the dynamic
effects of immigration on the fiscal balance in a variety of countries.
Based on a calibrated general equilibrium overlapping generations model, Kjetil Storesletten’s
(2000) findings for the U.S. show that the discounted net government gain from immigration
varies substantially across age and skill levels of new immigrants. For all groups, the net
present value of new immigrants’ contribution is found to be hump-shaped over their life
cycle and peaking between the ages 35 and 44. Using the composition of current new
immigrants in the U.S., the net gain of a representative legal immigrant is calculated at
$7,400. Distinguishing by skill level, the corresponding gains of a representative high-,
medium-, and low-skilled immigrant are calculated to be $96,000, -$2000, and -$36,000,
respectively. The discounted government cost of new illegal immigrants can be as large as
$54,000 per immigrant, compared to $36,000 for legal low-skilled immigrants. If immigrants
bring existing children with them when immigrating, these net contributions are reduced due
to the associated government transfers to these children. The author thus concludes that if the
aim was to maximise the public coffer contribution per immigrant, the government should
target high-skilled immigrants, preferably without children and aged between 40 and 44 years.
Consistent with these findings, Alan Auerbach and Philip Oreopoulos (1999) find very small
fiscal effects of current immigration relative to the size of the overall fiscal imbalance in the
U.S., so that, in their view, immigration should be viewed as neither a source nor a solution to
the existing imbalance in the U.S. Following an approach similar to Storesletten (2000),

67
Ronald Lee and Timothy Miller (2000) find a larger net present value of immigrants’
contributions to the fiscal system of around $99,000. Their results suggest that a policy of
admitting only highly-skilled immigrants could be particularly beneficial. However, they also
conclude that overall the fiscal impact of immigration is quite small.
In a recent study for Germany, Holger Bonin (2006) calculates the net contribution of
foreigners to the public coffers in Germany in the fiscal year 2004. His findings show that in
that year tax revenues exceeded transfer payments by 2,000 Euros per foreigner. This
contribution stays positive even after accounting for demographic aging in the future with an
expected rest-of-life net government gain of 11,600 Euros per capita in present value terms.
Dolores Collado, Inigo Iturbe-Ormaetxe and Guadalupe Valera (2004) use data from the
European Community Household Panel Survey (ECHP) in order to analyse the impact of
immigration on the Spanish welfare state. Employing the generational accounting approach,
they simulate the effects of a number of different immigration policies. Their calculations
reveal a positive net contribution of immigrants with a present value of around 98,000 Euros
for a representative male immigrant and a corresponding 43,000 Euros for a female immigrant
in 2000.
Finally, using a static approach, a home office report by Ceri Gott and Karl Johnston (2002)
estimated a net direct fiscal contribution (taxes and contributions paid minus benefits received
and public services consumed) of first generation immigrants in the UK in 1999/2000 of £2.5
billion. The authors emphasise that immigrants are heterogeneous and that those who are
economically particularly successful are the biggest contributors by paying more taxes and
national insurance contributions and receiving less publicly provided services and benefits.
Economic outcomes in turn are influenced by characteristics such as age, skills, qualifications
and English language proficiency so that policies designed to improve these characteristics

68
are likely to improve fiscal outcomes. Due to its static nature, there are a number of
limitations in this analysis so that the authors are quite cautious in the interpretation of their
results. Most importantly, the fiscal effect of immigration should be considered over the
immigrants’ life cycle. Since at present immigrants in the UK are younger than natives, their
instantaneous net contribution is likely to be positive but will turn negative once they retire.
Other factors not considered are the effects of immigrants on natives. If immigrants push
natives into unemployment and lower wages, then the tax income from natives will decline
and benefits expenditures to natives will increase, leading to an indirect negative fiscal impact
of immigration. Furthermore, infrastructure expenditures to accommodate the immigrants
such as additional health facilities, schools and housing have not been taken into account in
this study. Finally, the period of analysis, 1999/2000, was a particularly good year in terms of
macroeconomic conditions so that the estimated contribution from immigrants is likely to be
an upper bound of their actual annual contribution.
1.4.5 Are earnings spent locally or returned to family members in the originating country?
How much of their earnings do immigrants spent in the UK, and how much do they spend in
their country of origin, in form of remittances? In this section we will briefly discuss some
basic considerations about immigrants’ remittance behaviour, and how it relates to observable
characteristics of immigrants and particular forms of migration. For the UK, no data on
remittances is available.
Remittances are an important source of external funding for developing countries. They rank
only behind foreign direct investment (FDI), and are much higher in magnitude than total
official development assistance and private non-FDI flows (see Ratha, 2003). Remittances

69
have several advantages compared to other sources of external financing. First, they are more
stable than private capital flows. While private capital flows often move pro-cyclically,
remittances help to buffer recipient countries from the impact of negative shocks. Second,
remittances are directed to households and individuals, while other sources of external
financing such as foreign aid goes to public agencies in receiving countries. Its effectiveness
may therefore be hindered by corruption of government officials (see Kapur, 2005).
Both due to their scale and effectiveness in reaching households, one should therefore
expect remittances to have a greater impact on growth and poverty reduction than foreign aid.
In a recent paper, Adams and Page (2005) find empirical confirmation of a statistically
significant impact of remittances on poverty. Their estimates show that a 10% increase in per
capita official remittances has lead to a 3.5% decline in the share of people living in poverty.
A large literature has developed on the subject, see Rapoport and Docquier (2005) for an
excellent survey. Some of the key issues in the debate on migration are to understand which
migrant populations remit, for which purposes, and what determines the amount of
remittances. On the determinants of remittances, a number of papers (see e.g. Lucas and Stark
(1985,1988), Funkhouser (1995), Faini (2006), Osili (2007), Amuedo-Dorantes (2006) among
others) develop models on the different motives that may trigger remittances, and explore
some of their empirical implications.
One can distinguish a number of motives for remittances. First, remittances due to altruistic
motives. In principle, this motive for remittances can be viewed simply as an intra-family
transfer across national borders. Remittances that follow this motivation are dependent on the
way the immigrant's family is spread across national borders. Second, remittances that are
intended to create assets in the home country. Remittances in this category are not different

70
from an intertemporal allocation of consumption, or investment into durable consumption
goods across national borders. Finally, remittances that respond to family and social
commitments. This motive is in its essence a simple exchange: some transfers to extended
family and the home community are a price to be paid for the option to return back home at a
later stage. One reason for why migrants may want to agree to remit for this motive is that
there is a positive probability that the migration is terminated, either by choice, or by
unforeseen events. Little is known about the relative magnitude of these different motives,
and how they contribute to the overall remittance flows we observe. Even less is known about
how permanency of migrations affects the different channels of remittance behaviour.
In a recent study, Dustmann and Mestres (2007) use panel data for Germany on remittance
behaviour of immigrants to investigate this issue in detail. They focus on one particular
aspect: the way the temporary or permanent character of a migration interacts with the
magnitude of remittance flows, and with the different purposes of remittances. In their study,
they find that temporary immigrants have a 18 percent higher probability to remit, conditional
on individual and household characteristics. In addition, the overall amount remitted is about
25-50 percent higher for those migrants who want to return to their home countries. Their
analysis distinguishes between remittances for family support, savings and other remittances
and relates them to individual and household characteristics both at home and host country.
They find that the support to family and friends via remittances has a non-altruistic
component of insurance or exchange after controlling for individual unobserved fixed effects
and the potential endogeneity of temporary migration. In addition, they investigate migrants’
asset accumulation and show that migrants’ intention to return modifies the property
accumulation patterns both in the host and home countries, as well as the investments made in
the home country. Overall, their study shows the importance of accounting for the potential
temporary nature of migration and its effects on remittances, savings and asset accumulation.
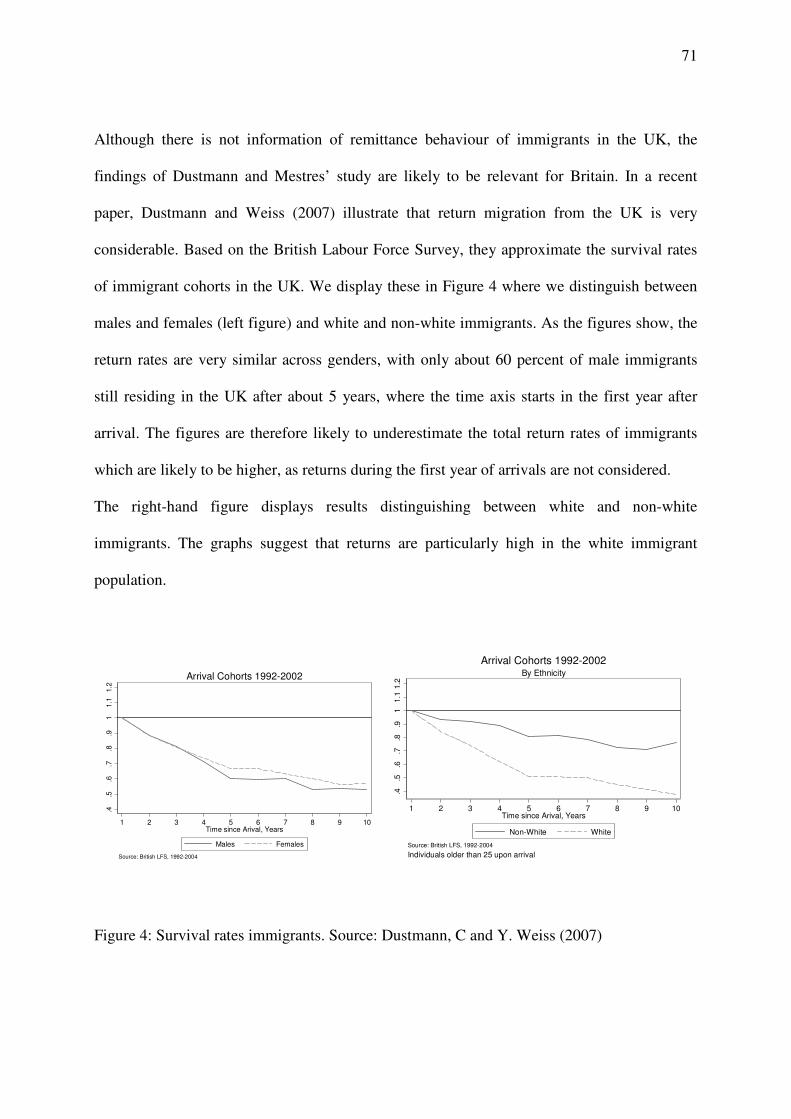
71
Although there is not information of remittance behaviour of immigrants in the UK, the
findings of Dustmann and Mestres’ study are likely to be relevant for Britain. In a recent
paper, Dustmann and Weiss (2007) illustrate that return migration from the UK is very
considerable. Based on the British Labour Force Survey, they approximate the survival rates
of immigrant cohorts in the UK. We display these in Figure 4 where we distinguish between
males and females (left figure) and white and non-white immigrants. As the figures show, the
return rates are very similar across genders, with only about 60 percent of male immigrants
still residing in the UK after about 5 years, where the time axis starts in the first year after
arrival. The figures are therefore likely to underestimate the total return rates of immigrants
which are likely to be higher, as returns during the first year of arrivals are not considered.
The right-hand figure displays results distinguishing between white and non-white
immigrants. The graphs suggest that returns are particularly high in the white immigrant
population.
.4.5
.6.7
.8.9
11.1
1.2
1 2 3 4 5 6 7 8 9 10Time since Arival, Years
Males Females
Source: British LFS, 1992-2004
Arrival Cohorts 1992-2002
.4.5
.6.7
.8.9
11.1
1.2
1 2 3 4 5 6 7 8 9 10Time since Arival, Years
Non-White White
Source: British LFS, 1992-2004
Individuals older than 25 upon arrival
By Ethnicity
Arrival Cohorts 1992-2002
Figure 4: Survival rates immigrants. Source: Dustmann, C and Y. Weiss (2007)

72
According to these figures, return migrations to Britain are frequent; this suggests, according
to the study by Dustmann and Mestres (2007) that a significant fraction of immigrants’
earnings in the UK are remitted back home.

73
Part 2: Immigration to Wales
2.1 Location Choice of Immigrants in Wales and their type of employment
In this section we will investigate the settlement patterns of immigrants in Wales. Our
analysis is based on data from the 1991 and 2001 Census as well as the LFS.
Table 2.1.1 shows the percentage of all working age (16-65) immigrants (columns 1-3) and
recent immigrants (columns 4-6) in the total working age population in Wales (columns 1 and
4), Greater London (columns 2 and 5), and in the whole of Britain (columns 3 and 6) for years
1992-2005. We define as “recent” immigrants who have arrived in the UK in the year they are
interviewed or in the previous year.
The share of immigrants in the total Welsh population is not only well below the
corresponding share in London, which is the area with the highest immigrant concentration in
Britain, but also below the national GB average. In 2005, 4.6% of the Welsh population,
37.1% of the London population, and 11.5% of the British population was foreign born.
However, the share of immigrants in Wales has increased much faster than the national
average between 1992 and 2005. In 1992, only 2.9% of the Welsh population were
immigrants, while by 2005 this had increased to 4.6%, a 60% increase. The corresponding
increase was 32% for London and 35% for Britain. The share of immigrants who have not
been in the UK for more than two years on the total population in 2005 was 0.6% in Wales,
3.7% in London, and 1.3% in Britain as a whole.

74
Table 2.1.1 – Percentage of immigrants in total population and percentage of recent immigrants in total population, Wales – Greater London – Britain
Immigrants / total population
Recent immigrants / total population
Sample size
Wales London GB Wales London GB Wales London GB
1992 2.87 28.12 8.47 0.24 1.84 0.47 19,494 44,190 392,592 1993 3.34 27.89 8.36 0.20 1.70 0.47 19,274 43,899 388,873 1994 2.88 27.94 8.42 0.24 1.86 0.52 18,942 42,626 374,334 1995 3.12 27.78 8.30 0.36 2.01 0.57 18,991 41,993 372,405 1996 3.16 27.67 8.38 0.36 2.31 0.60 18,785 41,304 366,482 1997 3.11 30.19 8.70 0.15 2.17 0.60 17,839 39,886 355,360 1998 3.08 30.22 9.00 0.26 2.53 0.73 17,428 39,494 351,639 1999 3.06 30.21 9.09 0.28 2.67 0.74 16,869 39,022 344,115 2000 3.18 32.32 9.40 0.25 3.22 0.89 16,679 37,260 330,665 2001 3.43 33.25 9.75 0.21 3.28 0.92 17,061 38,025 332,338 2002 3.81 34.56 10.19 0.33 3.35 1.02 16,931 36,935 325,615 2003 4.26 35.22 10.45 0.42 2.80 0.95 15,878 34,824 312,350 2004 4.09 36.43 10.89 0.52 3.59 1.11 15,296 33,294 303,302 2005 4.62 37.14 11.50 0.61 3.68 1.31 14,905 32,200 297,145
Entries are the percentage of working age (16-65) immigrants or new arrivals on the total working age population of each region in each year Recent immigrants are defined as immigrants arrived in the interview year, or the previous year The last columns report the sample size for each year. Source: LFS, various years
In table 2.1.2 we report the distribution of immigrants within Welsh counties in 1991 and
2001, and the difference between the two years (columns 1/3).8 For reference we display also
the distribution of natives in 1991 and 2001 (columns 4 and 5). Finally we report the share of
immigrants in the total population for each county in 1991 and 2001 (columns 6 and 7). The
last rows report the total number of immigrants and natives in Wales in the two years
(columns 1-5) and the share of immigrants in the total population in Wales (columns 6 and 7).
The distribution of the immigrant population within Wales tends to mirror the distribution of
natives, although immigrants are more concentrated in South Glamorgan than natives: in 2001
almost 30% of immigrants and about 15% of natives were living there. Immigrants were 6.5%
of the total population in South Glamorgan in 2001 (over 5% in 1991), while they were
slightly less than 3% of the total population in all other counties except in Mid Glamorgan.
The immigrant distribution has remained quite constant over time, although between 1991 and
8 County boundaries are held fixed as they were in 1991.

75
2001 the concentration of immigrants has tended to decrease in Clwyd and Gwent and
increase in South Glamorgan. The ratio of immigrants to total population, on the other hand
has increased in all counties between 1991 and 2001.
Table 2.1.2 – Settlement patterns of Immigrants within Wales, 1991-2001, and percentage of Immigrants in the total population by county
County Immigrants Natives
Immigrants/total population
1991 2001 Increase
1991-2001 1991 2001 1991 2001
Clwyd 12.60 10.33 -2.28 14.44 12.83 2.35 2.57
Dyfed 11.97 11.47 -0.50 12.12 12.50 2.65 2.92
Gwent 13.71 12.28 -1.43 15.65 13.22 2.35 2.96
Gwynedd 8.13 9.21 1.08 8.31 10.13 2.62 2.90 Mid
Glamorgan 11.70 12.02 0.32 19.04 20.46 1.66 1.89
Powys 3.44 3.55 0.11 4.16 4.38 2.22 2.59 South
Glamorgan 26.76 29.84 3.07 13.50 14.13 5.17 6.48
West
Glamorgan 11.69 11.31 -0.38 12.78 12.36 2.46 2.92
All Wales 2.68 3.18
All Wales
(count) 75,938 92,263 16,325 2,759,135 2,810,822
Entries in rows 1-8 are the percentage of the total immigrant population in Wales in each Welsh county (as in 1991) in 1991 and 2001 (column 1 and 2), and the changes between 1991 and 2001 (column 3). Columns 4 and 5 show the distribution of natives in Welsh counties in 1991 and 2001 The last two columns report the ratio of immigrants to total population in each Welsh county (rows 1-8) and in Wales as a whole (row 9) in 1991 and 2000. Row 10 reports the number of foreign and native born individuals in the whole Wales in 1991 and 2001, and changes thereof (column 3) For 2001 unitary authorities have been aggregated to match 1991 county boundaries. Source: Census 1991, 2001
Table 2.1.3 shows that immigrants tend to have a lower employment (the ratio of employed
individuals to the working age population) and participation (the ratio of individuals
employed or actively seeking job to the working age population) rate than natives, in Wales
and in Britain as a whole, as reported in table 2.1.3. However, immigrants in Wales have an
employment rate above the average employment rate for immigrants in Britain: 66.1% versus
63.8%. On the other hand, the participation rate of immigrants in Wales and in Britain is very
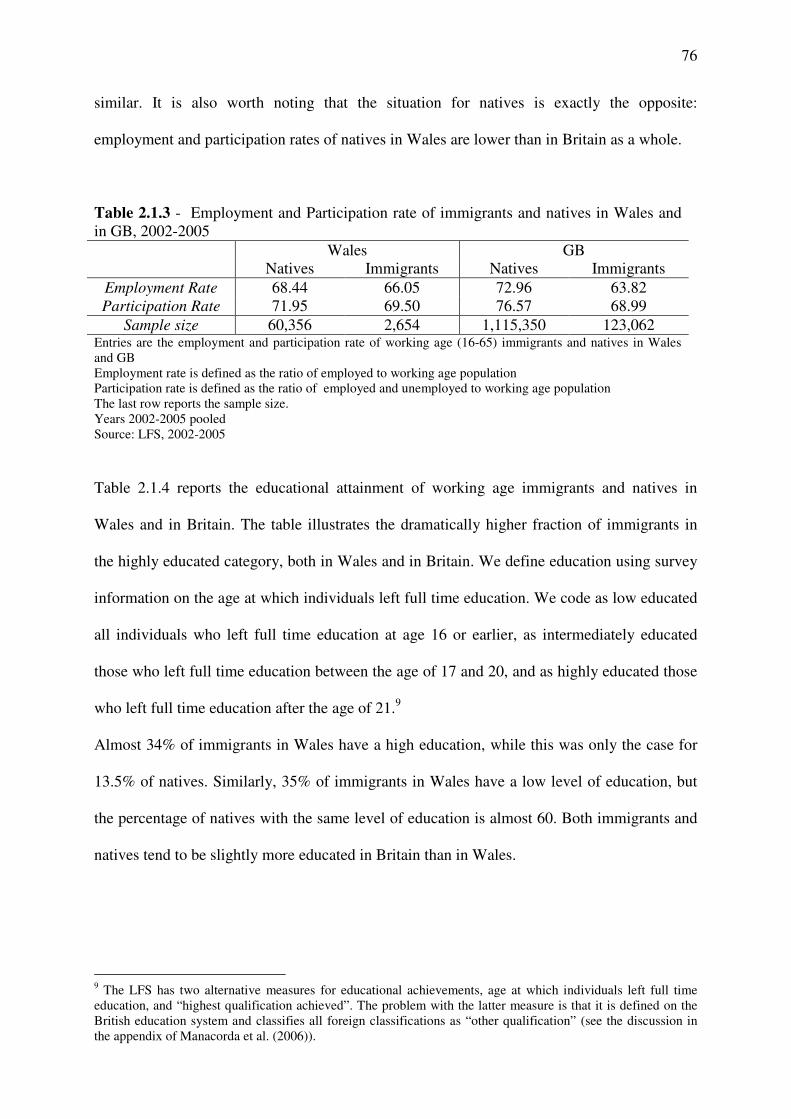
76
similar. It is also worth noting that the situation for natives is exactly the opposite:
employment and participation rates of natives in Wales are lower than in Britain as a whole.
Table 2.1.3 - Employment and Participation rate of immigrants and natives in Wales and in GB, 2002-2005
Wales GB Natives Immigrants Natives Immigrants
Employment Rate 68.44 66.05 72.96 63.82 Participation Rate 71.95 69.50 76.57 68.99
Sample size 60,356 2,654 1,115,350 123,062 Entries are the employment and participation rate of working age (16-65) immigrants and natives in Wales and GB Employment rate is defined as the ratio of employed to working age population Participation rate is defined as the ratio of employed and unemployed to working age population The last row reports the sample size. Years 2002-2005 pooled Source: LFS, 2002-2005
Table 2.1.4 reports the educational attainment of working age immigrants and natives in
Wales and in Britain. The table illustrates the dramatically higher fraction of immigrants in
the highly educated category, both in Wales and in Britain. We define education using survey
information on the age at which individuals left full time education. We code as low educated
all individuals who left full time education at age 16 or earlier, as intermediately educated
those who left full time education between the age of 17 and 20, and as highly educated those
who left full time education after the age of 21.9
Almost 34% of immigrants in Wales have a high education, while this was only the case for
13.5% of natives. Similarly, 35% of immigrants in Wales have a low level of education, but
the percentage of natives with the same level of education is almost 60. Both immigrants and
natives tend to be slightly more educated in Britain than in Wales.
9 The LFS has two alternative measures for educational achievements, age at which individuals left full time education, and “highest qualification achieved”. The problem with the latter measure is that it is defined on the British education system and classifies all foreign classifications as “other qualification” (see the discussion in the appendix of Manacorda et al. (2006)).
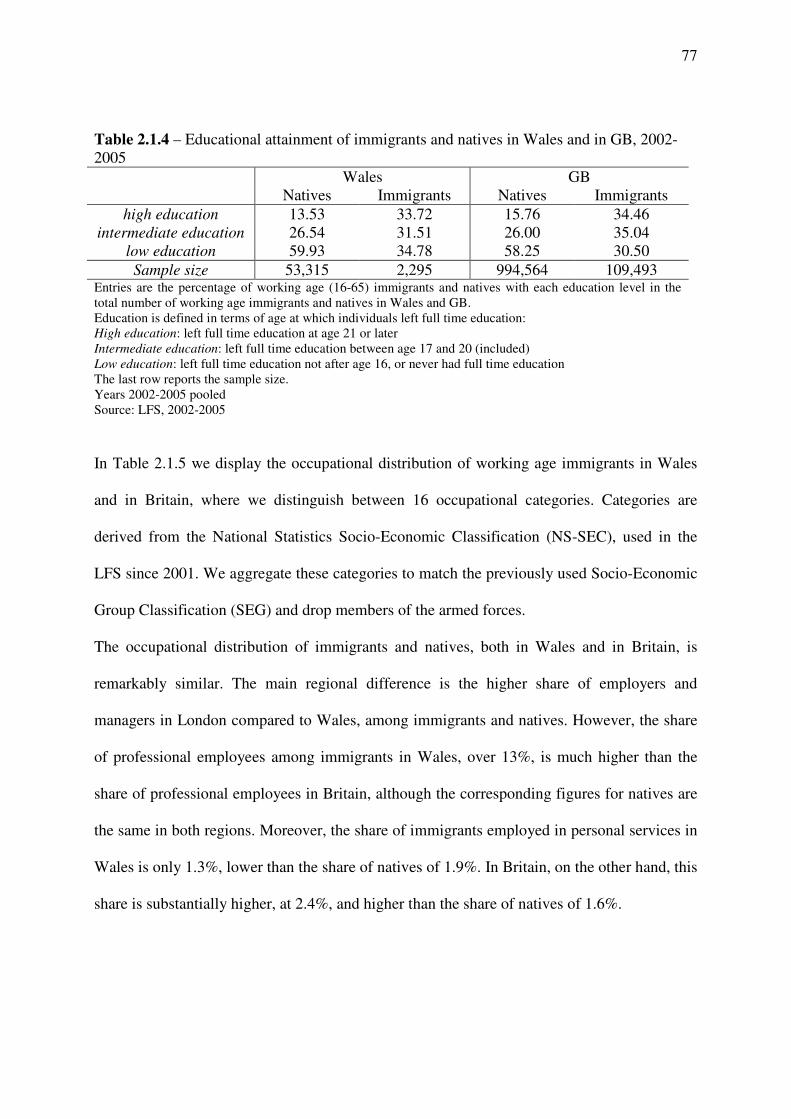
77
Table 2.1.4 – Educational attainment of immigrants and natives in Wales and in GB, 2002-2005
Wales GB Natives Immigrants Natives Immigrants
high education 13.53 33.72 15.76 34.46 intermediate education 26.54 31.51 26.00 35.04
low education 59.93 34.78 58.25 30.50
Sample size 53,315 2,295 994,564 109,493 Entries are the percentage of working age (16-65) immigrants and natives with each education level in the total number of working age immigrants and natives in Wales and GB. Education is defined in terms of age at which individuals left full time education: High education: left full time education at age 21 or later Intermediate education: left full time education between age 17 and 20 (included) Low education: left full time education not after age 16, or never had full time education The last row reports the sample size. Years 2002-2005 pooled Source: LFS, 2002-2005
In Table 2.1.5 we display the occupational distribution of working age immigrants in Wales
and in Britain, where we distinguish between 16 occupational categories. Categories are
derived from the National Statistics Socio-Economic Classification (NS-SEC), used in the
LFS since 2001. We aggregate these categories to match the previously used Socio-Economic
Group Classification (SEG) and drop members of the armed forces.
The occupational distribution of immigrants and natives, both in Wales and in Britain, is
remarkably similar. The main regional difference is the higher share of employers and
managers in London compared to Wales, among immigrants and natives. However, the share
of professional employees among immigrants in Wales, over 13%, is much higher than the
share of professional employees in Britain, although the corresponding figures for natives are
the same in both regions. Moreover, the share of immigrants employed in personal services in
Wales is only 1.3%, lower than the share of natives of 1.9%. In Britain, on the other hand, this
share is substantially higher, at 2.4%, and higher than the share of natives of 1.6%.

78
Table 2.1.5 – Occupational choice of immigrants and natives in Wales and GB, 2002-2005
Wales GB Natives Immigrants Natives Immigrants
employers and managers (large
establishments) 4.03 4.06 5.42 5.49
employers and managers (small
establishments) 8.39 8.95 9.53 9.37
Professional workers (self-employed) 0.87 1.83 1.09 1.75 professional workers (employees) 4.08 13.21 4.37 7.84 intermediate non-manual workers 21.65 23.69 22.66 24.51
junior non-manual workers 17.25 15.24 19.05 14.59 personal service workers 1.87 1.31 1.63 2.42
foreman and supervisors (manual) 9.54 7.40 8.08 6.61 skilled manual workers 8.75 5.24 8.25 4.78
semi skilled manual workers 10.72 11.53 8.03 11.04 unskilled manual workers 4.61 1.72 4.07 3.85
own account workers 6.34 5.52 7.00 7.55 farmers (employers & managers) 0.19 0.00 0.10 0.03
farmers (own account) 1.34 0.16 0.35 0.08
agricultural workers 0.38 0.12 0.35 0.10
Sample size 40,355 1,705 799,161 78,273
Entries are the percentage of working age (16-65) immigrants and natives in each occupation on the total working age immigrant and native population in Wales and GB. Occupation is defined according to the Socio-Economic Group Classification (SEG) The last row reports the sample size. Years 2002-2005 pooled Source: LFS, 2002-2005
In terms of occupational mobility, the available data does unfortunately not allow us to
investigate the career pattern of individual workers nor to look at Wales separately due to a
lack of observations. To get an idea of the career pattern of migrant workers in the UK, table
2.1.6 shows the occupational distribution of the immigrant cohort that arrived in Great Britain
between 1995 and 1998, over time. Notice that, as we can not identify individuals over time,
the patterns we report in the table may be due to occupational changes, or to out-migration.
The figures show that while the shares of immigrants working as employers and managers
and professional workers drop substantially in the first seven years after arrival, the shares of
intermediate non-manual workers, foremen and supervisors and semi skilled manual workers

79
increase. Interestingly, the share of immigrants working in low-paying personal services jobs,
which are arguably relatively easy to obtain upon arrival, also decreases significantly from
13.3% in the first year to 2.1% after seven years in Great Britain, pointing towards an
occupational upgrading of these individuals.10
Occupations differ not only in the type of tasks they require, but also in their average wages.
Table 2.1.7 shows the average wage of immigrants and natives by occupation in both Wales
and the UK. Employers and managers, professionals, and intermediate non-manual workers
are the highest paid occupations, while unskilled manual workers, personal service workers,
10 As said above, the figures in table 2.1.6 do not take account of selective out-migration of immigrants which could be particularly significant for high-skilled workers who spend a few years in the UK before returning home. See Dustmann and Weiss (2007) for a discussion.
Table 2.1.6 – Occupational distribution of immigrants of the 1995/1998 arrival cohort by years in Great Britain
Years in Britain
1 3 5 7
employers and managers (large
establishments) 10.06 8.09 6.60 5.92
employers and managers (small
establishments) 6.05 6.12 7.67 8.50
Professional workers (self-employed) 1.70 1.35 1.27 0.86 professional workers (employees) 14.18 12.98 9.20 10.31 intermediate non-manual workers 19.47 20.37 21.74 24.30
junior non-manual workers 16.53 16.87 14.78 13.78 personal service workers 13.27 8.55 6.45 2.10
foreman and supervisors (manual) 1.50 2.72 5.69 7.27 skilled manual workers 3.12 4.57 4.27 4.67
semi skilled manual workers 6.23 9.66 11.86 11.21 unskilled manual workers 4.31 4.65 4.65 4.45
own account workers 2.83 3.66 5.82 6.64 farmers (employers & managers) 0.12 0.07 0.00 0.00
farmers (own account) 0.05 0.00 0.00 0.00 agricultural workers 0.58 0.32 0.00 0.00
Sample size 3782 2831 2137 1918 Entries are the share of working age (16-65) immigrants in Great Britain of both sexes that arrived between 1995
and 1998 in each occupation group after one, three, five, and seven years from arrival.
The last row reports the sample size.
Source: LFS, various years
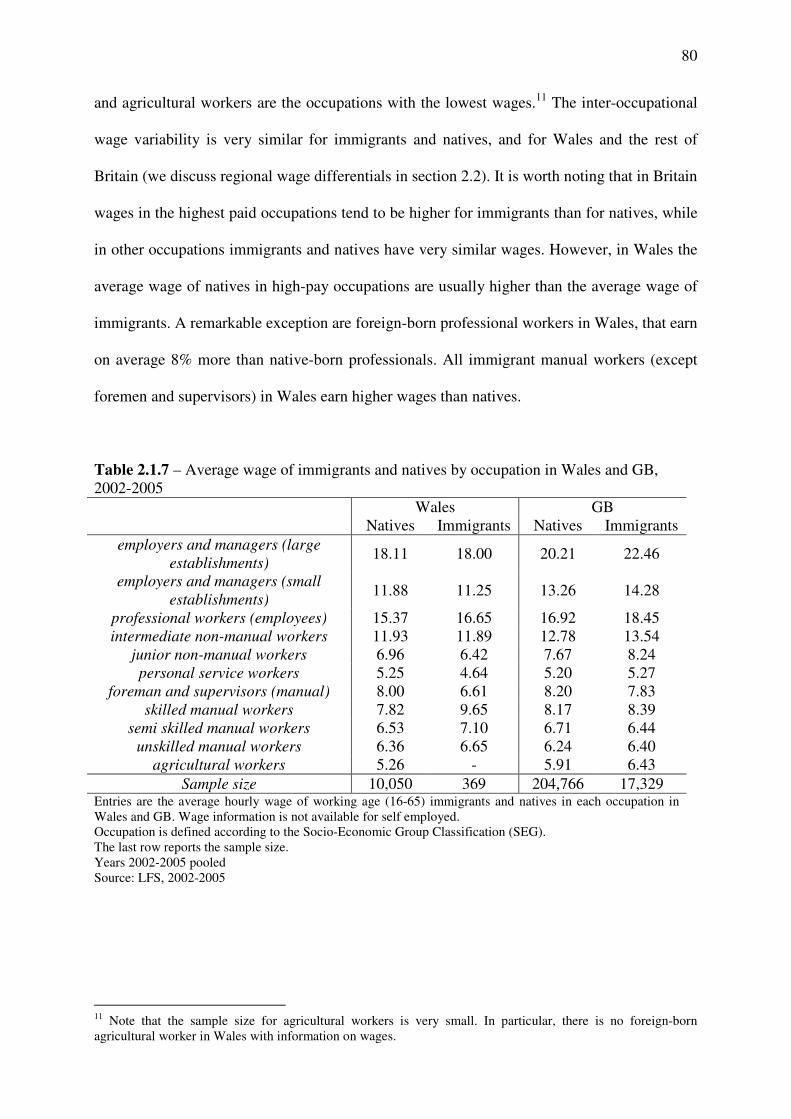
80
and agricultural workers are the occupations with the lowest wages.11 The inter-occupational
wage variability is very similar for immigrants and natives, and for Wales and the rest of
Britain (we discuss regional wage differentials in section 2.2). It is worth noting that in Britain
wages in the highest paid occupations tend to be higher for immigrants than for natives, while
in other occupations immigrants and natives have very similar wages. However, in Wales the
average wage of natives in high-pay occupations are usually higher than the average wage of
immigrants. A remarkable exception are foreign-born professional workers in Wales, that earn
on average 8% more than native-born professionals. All immigrant manual workers (except
foremen and supervisors) in Wales earn higher wages than natives.
Table 2.1.7 – Average wage of immigrants and natives by occupation in Wales and GB, 2002-2005
Wales GB Natives Immigrants Natives Immigrants
employers and managers (large
establishments) 18.11 18.00 20.21 22.46
employers and managers (small
establishments) 11.88 11.25 13.26 14.28
professional workers (employees) 15.37 16.65 16.92 18.45 intermediate non-manual workers 11.93 11.89 12.78 13.54
junior non-manual workers 6.96 6.42 7.67 8.24 personal service workers 5.25 4.64 5.20 5.27
foreman and supervisors (manual) 8.00 6.61 8.20 7.83 skilled manual workers 7.82 9.65 8.17 8.39
semi skilled manual workers 6.53 7.10 6.71 6.44 unskilled manual workers 6.36 6.65 6.24 6.40
agricultural workers 5.26 - 5.91 6.43
Sample size 10,050 369 204,766 17,329 Entries are the average hourly wage of working age (16-65) immigrants and natives in each occupation in Wales and GB. Wage information is not available for self employed. Occupation is defined according to the Socio-Economic Group Classification (SEG). The last row reports the sample size. Years 2002-2005 pooled Source: LFS, 2002-2005
11 Note that the sample size for agricultural workers is very small. In particular, there is no foreign-born agricultural worker in Wales with information on wages.

81
2.2 Factors that influence the decision whether and where to migrate
In this section we will first provide some brief background on the decisions of immigrants
whether and where to migrate, and what the underlying determinants are. Based on the LFS,
we will relate changes in migration inflows between 1992-1995 and 2002-2005 from abroad
into different UK regions to changes in economic indicators (like employment and wages),
using the LFS.
Table 2.2.1 reports the average wage of working age natives and immigrants in 1992/1995
and 2002/2005 for different regions in Britain12, expressed in 2005 prices.13
Table 2.2.1 – Average hourly real wage of immigrants and natives
Region 1992-1995 2002-2005
Natives Immigrants Natives Immigrants % Difference Wage Sample Wage Sample Wage Sample Wage Sample
Tyne & Wear 7.25 2,241 8.42 36 8.92 4,726 9.67 149 8.41 Rest of Northern Region 7.35 4,477 7.19 83 9.10 7,893 9.28 218 1.98 South Yorkshire 7.32 2,642 7.01 57 9.04 5,411 10.36 200 14.60 West Yorkshire 7.79 4,398 7.90 203 9.59 9,183 8.53 636 -11.05 Rest of Yorks.& Humberside 7.19 3,622 8.33 86 9.34 6,825 9.81 290 5.03 East Midlands 7.64 8,511 8.18 349 9.46 16,929 9.66 994 2.11 East Anglia 7.64 4,652 8.89 266 9.86 7,915 10.93 588 10.85 Greater London 10.48 9,248 10.11 2,509 13.97 14,528 12.41 6,063 -11.17 Rest of South East 9.13 22,077 9.58 1,494 11.5 46,022 12.01 4,287 4.43 South West 7.67 9,265 8.03 411 9.57 20,391 10.08 1,280 5.33 West Midlands (metropolitan
counties) 7.44 4,318 6.99 363 9.41 8,095 9.16 827 -2.66
Rest of West Midlands 7.65 5,621 7.94 197 9.6 11,472 9.84 460 2.50 Greater Manchester 7.77 4,531 7.69 212 9.55 8,546 9.42 486 -1.36 Merseyside 7.60 2,268 9.47 65 9.27 4,009 8.97 126 -3.24 Rest of North West 8.09 4,990 8.74 142 9.71 9,117 9.85 355 1.44 Wales 7.27 5,132 9.54 123 9.29 10,474 10.42 390 12.16 Scotland 7.80 10,575 9.58 269 9.74 21,685 10.54 842 8.21
Great Britain 8.20 108,568 9.25 6,865 10.32 213,22
1 11.34 18,191 9.88
Entries are the average hourly wage of working age (16-65) immigrants and natives in each region and in GB in years 1992-1995 pooled and 2002-2005 pooled, and the sample size for each group. The last column reports, for 2002-2005 only, the percentage difference between immigrants and natives hourly wage. Wages are expressed in 2005 terms. Source: LFS, various years
12 The LFS originally identifies 19 regions in Britain. We unify Inner and Outer London into Greater London, and Strathclyde and the Rest of Scotland into Scotland, to create territorially homogeneous regions. 13 We discount wages using the 2005-based CPI.
82
London and the South East stand out in both periods as the regions with highest real wages for
immigrants and natives. Wales, on the other hand, was in the first period the region with the
third lowest natives’ wages, while in the most recent period it had the fifth lowest wages for
natives. However, despite the low natives’ wages, immigrants in Wales greatly outperform
natives in both periods. Indeed, immigrants’ wages in Wales are among the highest in Britain:
only London, the South East, Scotland, and East Anglia (in the second period only) have
higher average immigrants’ wages. Even more remarkable is the relative immigrant-native
wage differential: in 2002-2005 wages of immigrants in Wales were on average over 12%
higher than wages of natives. This is the second largest wage differential, after South
Yorkshire. The national average is below 10%. These figures, together with those reported in
tables 2.1.2, 2.1.3, 2.1.5 and 2.1.7 seem to suggest that immigrants to Wales are somehow
“better selected” than immigrants in other regions. They tend to move to Wales because they
have a well paid job, rather than in order to look for a job. To give an example, we know from
table 2.1.5 and 2.1.7 that the share of the foreign-born working as professionals in Wales is
three times higher than the corresponding share of the native-born and that, at the same time,
they earn on average 8% more than their native-born counterparts. The opposite seems to be
true for London, where immigrants tend to cluster regardless of the availability of a specific
job. This is presumably because the number of job opportunities there is higher, and the pre-
existing ethnic networks stronger than anywhere else in Britain.
Tables 2.2.2.a and 2.2.2.b show the real average wage broken down by age groups in
1992/1995 (table 2.2.2.a.) and in 2002/2005 (table 2.2.2.b). For each age group and time
period the regional distribution of wages is similar to the overall average. However it is worth
noting that Wales has in the first period 1992/1995 the highest wages for immigrants over 45.
Wales is also one of the few regions, in which average wage levels of immigrants peak at the
age of 46 to 55. The only other regions where this is the case in 2002/2005 are Tyne & Wear,
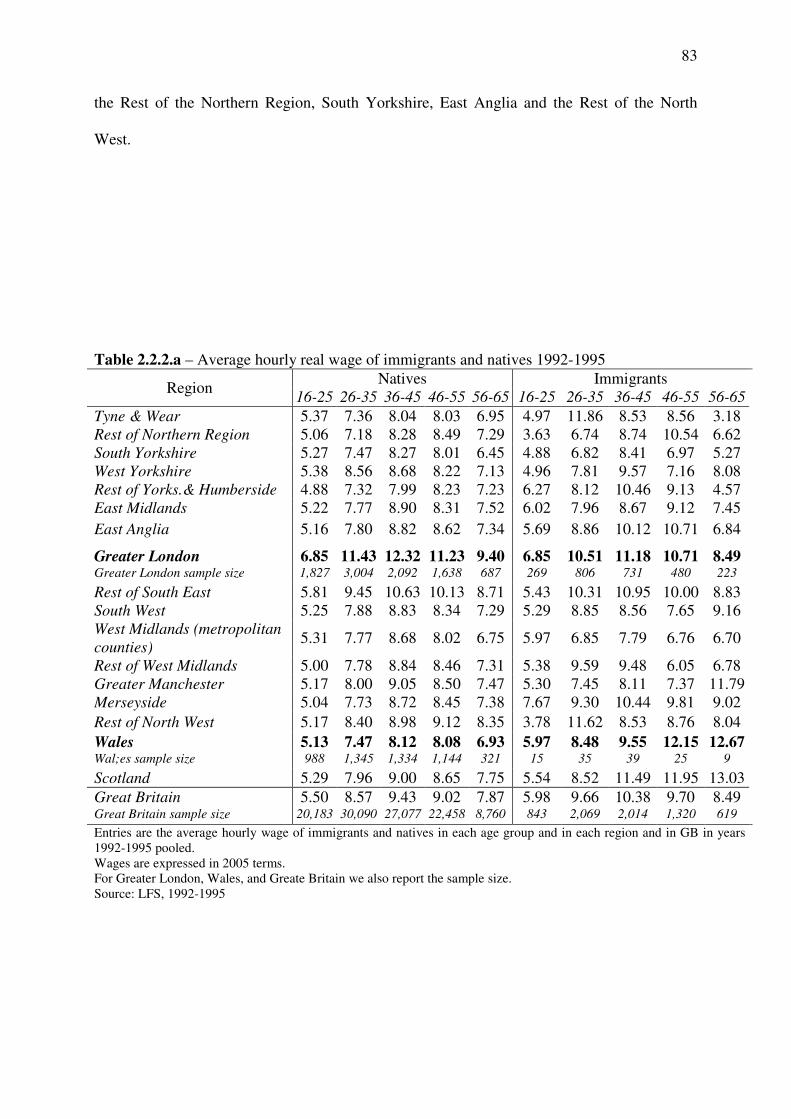
83
the Rest of the Northern Region, South Yorkshire, East Anglia and the Rest of the North
West.
Table 2.2.2.a – Average hourly real wage of immigrants and natives 1992-1995
Region Natives Immigrants
16-25 26-35 36-45 46-55 56-65 16-25 26-35 36-45 46-55 56-65
Tyne & Wear 5.37 7.36 8.04 8.03 6.95 4.97 11.86 8.53 8.56 3.18 Rest of Northern Region 5.06 7.18 8.28 8.49 7.29 3.63 6.74 8.74 10.54 6.62 South Yorkshire 5.27 7.47 8.27 8.01 6.45 4.88 6.82 8.41 6.97 5.27 West Yorkshire 5.38 8.56 8.68 8.22 7.13 4.96 7.81 9.57 7.16 8.08 Rest of Yorks.& Humberside 4.88 7.32 7.99 8.23 7.23 6.27 8.12 10.46 9.13 4.57 East Midlands 5.22 7.77 8.90 8.31 7.52 6.02 7.96 8.67 9.12 7.45
East Anglia 5.16 7.80 8.82 8.62 7.34 5.69 8.86 10.12 10.71 6.84
Greater London 6.85 11.43 12.32 11.23 9.40 6.85 10.51 11.18 10.71 8.49 Greater London sample size 1,827 3,004 2,092 1,638 687 269 806 731 480 223
Rest of South East 5.81 9.45 10.63 10.13 8.71 5.43 10.31 10.95 10.00 8.83 South West 5.25 7.88 8.83 8.34 7.29 5.29 8.85 8.56 7.65 9.16 West Midlands (metropolitan
counties) 5.31 7.77 8.68 8.02 6.75 5.97 6.85 7.79 6.76 6.70
Rest of West Midlands 5.00 7.78 8.84 8.46 7.31 5.38 9.59 9.48 6.05 6.78 Greater Manchester 5.17 8.00 9.05 8.50 7.47 5.30 7.45 8.11 7.37 11.79 Merseyside 5.04 7.73 8.72 8.45 7.38 7.67 9.30 10.44 9.81 9.02
Rest of North West 5.17 8.40 8.98 9.12 8.35 3.78 11.62 8.53 8.76 8.04
Wales 5.13 7.47 8.12 8.08 6.93 5.97 8.48 9.55 12.15 12.67 Wal;es sample size 988 1,345 1,334 1,144 321 15 35 39 25 9
Scotland 5.29 7.96 9.00 8.65 7.75 5.54 8.52 11.49 11.95 13.03
Great Britain 5.50 8.57 9.43 9.02 7.87 5.98 9.66 10.38 9.70 8.49 Great Britain sample size 20,183 30,090 27,077 22,458 8,760 843 2,069 2,014 1,320 619
Entries are the average hourly wage of immigrants and natives in each age group and in each region and in GB in years 1992-1995 pooled. Wages are expressed in 2005 terms. For Greater London, Wales, and Greate Britain we also report the sample size. Source: LFS, 1992-1995
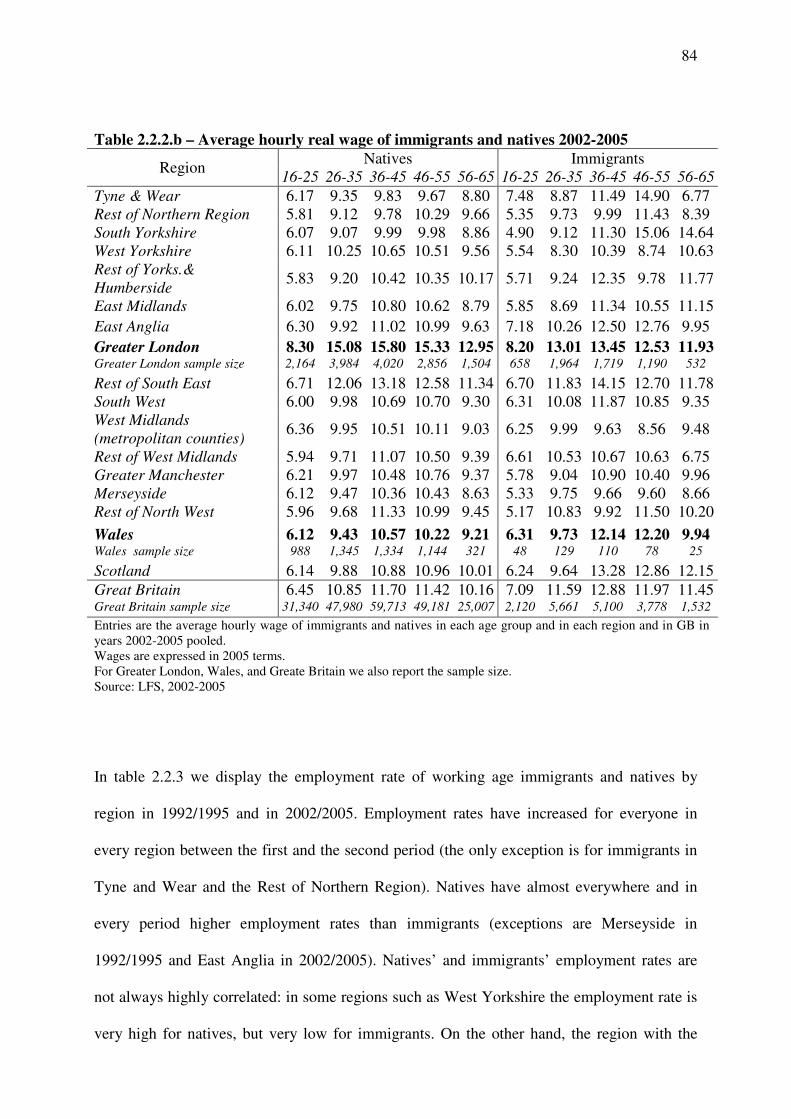
84
Table 2.2.2.b – Average hourly real wage of immigrants and natives 2002-2005
Region Natives Immigrants
16-25 26-35 36-45 46-55 56-65 16-25 26-35 36-45 46-55 56-65
Tyne & Wear 6.17 9.35 9.83 9.67 8.80 7.48 8.87 11.49 14.90 6.77 Rest of Northern Region 5.81 9.12 9.78 10.29 9.66 5.35 9.73 9.99 11.43 8.39 South Yorkshire 6.07 9.07 9.99 9.98 8.86 4.90 9.12 11.30 15.06 14.64 West Yorkshire 6.11 10.25 10.65 10.51 9.56 5.54 8.30 10.39 8.74 10.63 Rest of Yorks.&
Humberside 5.83 9.20 10.42 10.35 10.17 5.71 9.24 12.35 9.78 11.77
East Midlands 6.02 9.75 10.80 10.62 8.79 5.85 8.69 11.34 10.55 11.15
East Anglia 6.30 9.92 11.02 10.99 9.63 7.18 10.26 12.50 12.76 9.95
Greater London 8.30 15.08 15.80 15.33 12.95 8.20 13.01 13.45 12.53 11.93 Greater London sample size 2,164 3,984 4,020 2,856 1,504 658 1,964 1,719 1,190 532
Rest of South East 6.71 12.06 13.18 12.58 11.34 6.70 11.83 14.15 12.70 11.78 South West 6.00 9.98 10.69 10.70 9.30 6.31 10.08 11.87 10.85 9.35 West Midlands
(metropolitan counties) 6.36 9.95 10.51 10.11 9.03 6.25 9.99 9.63 8.56 9.48
Rest of West Midlands 5.94 9.71 11.07 10.50 9.39 6.61 10.53 10.67 10.63 6.75 Greater Manchester 6.21 9.97 10.48 10.76 9.37 5.78 9.04 10.90 10.40 9.96 Merseyside 6.12 9.47 10.36 10.43 8.63 5.33 9.75 9.66 9.60 8.66 Rest of North West 5.96 9.68 11.33 10.99 9.45 5.17 10.83 9.92 11.50 10.20
Wales 6.12 9.43 10.57 10.22 9.21 6.31 9.73 12.14 12.20 9.94 Wales sample size 988 1,345 1,334 1,144 321 48 129 110 78 25
Scotland 6.14 9.88 10.88 10.96 10.01 6.24 9.64 13.28 12.86 12.15
Great Britain 6.45 10.85 11.70 11.42 10.16 7.09 11.59 12.88 11.97 11.45 Great Britain sample size 31,340 47,980 59,713 49,181 25,007 2,120 5,661 5,100 3,778 1,532
Entries are the average hourly wage of immigrants and natives in each age group and in each region and in GB in years 2002-2005 pooled. Wages are expressed in 2005 terms. For Greater London, Wales, and Greate Britain we also report the sample size. Source: LFS, 2002-2005
In table 2.2.3 we display the employment rate of working age immigrants and natives by
region in 1992/1995 and in 2002/2005. Employment rates have increased for everyone in
every region between the first and the second period (the only exception is for immigrants in
Tyne and Wear and the Rest of Northern Region). Natives have almost everywhere and in
every period higher employment rates than immigrants (exceptions are Merseyside in
1992/1995 and East Anglia in 2002/2005). Natives’ and immigrants’ employment rates are
not always highly correlated: in some regions such as West Yorkshire the employment rate is
very high for natives, but very low for immigrants. On the other hand, the region with the
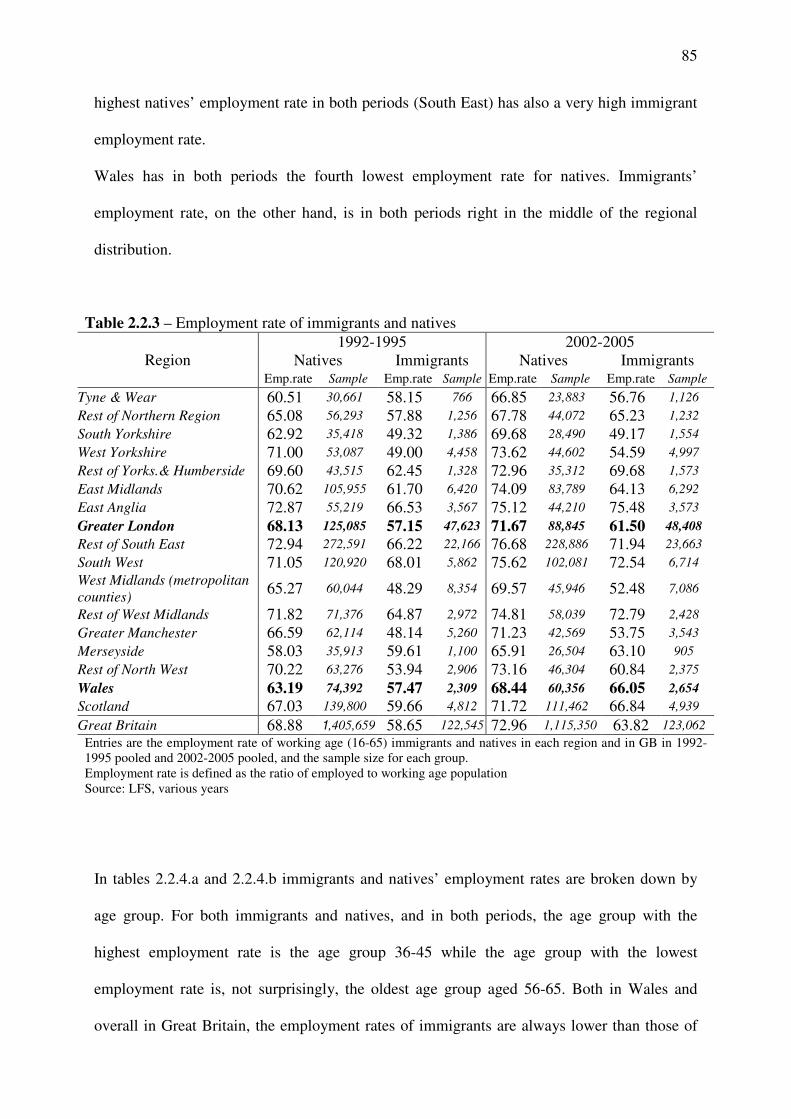
85
highest natives’ employment rate in both periods (South East) has also a very high immigrant
employment rate.
Wales has in both periods the fourth lowest employment rate for natives. Immigrants’
employment rate, on the other hand, is in both periods right in the middle of the regional
distribution.
Table 2.2.3 – Employment rate of immigrants and natives
Region 1992-1995 2002-2005
Natives Immigrants Natives Immigrants Emp.rate Sample Emp.rate Sample Emp.rate Sample Emp.rate Sample
Tyne & Wear 60.51 30,661 58.15 766 66.85 23,883 56.76 1,126
Rest of Northern Region 65.08 56,293 57.88 1,256 67.78 44,072 65.23 1,232
South Yorkshire 62.92 35,418 49.32 1,386 69.68 28,490 49.17 1,554
West Yorkshire 71.00 53,087 49.00 4,458 73.62 44,602 54.59 4,997
Rest of Yorks.& Humberside 69.60 43,515 62.45 1,328 72.96 35,312 69.68 1,573
East Midlands 70.62 105,955 61.70 6,420 74.09 83,789 64.13 6,292
East Anglia 72.87 55,219 66.53 3,567 75.12 44,210 75.48 3,573
Greater London 68.13 125,085 57.15 47,623 71.67 88,845 61.50 48,408
Rest of South East 72.94 272,591 66.22 22,166 76.68 228,886 71.94 23,663
South West 71.05 120,920 68.01 5,862 75.62 102,081 72.54 6,714
West Midlands (metropolitan
counties) 65.27 60,044 48.29 8,354 69.57 45,946 52.48 7,086
Rest of West Midlands 71.82 71,376 64.87 2,972 74.81 58,039 72.79 2,428
Greater Manchester 66.59 62,114 48.14 5,260 71.23 42,569 53.75 3,543
Merseyside 58.03 35,913 59.61 1,100 65.91 26,504 63.10 905
Rest of North West 70.22 63,276 53.94 2,906 73.16 46,304 60.84 2,375
Wales 63.19 74,392 57.47 2,309 68.44 60,356 66.05 2,654
Scotland 67.03 139,800 59.66 4,812 71.72 111,462 66.84 4,939
Great Britain 68.88 1,405,659 58.65 122,545 72.96 1,115,350 63.82 123,062
Entries are the employment rate of working age (16-65) immigrants and natives in each region and in GB in 1992-1995 pooled and 2002-2005 pooled, and the sample size for each group. Employment rate is defined as the ratio of employed to working age population Source: LFS, various years
In tables 2.2.4.a and 2.2.4.b immigrants and natives’ employment rates are broken down by
age group. For both immigrants and natives, and in both periods, the age group with the
highest employment rate is the age group 36-45 while the age group with the lowest
employment rate is, not surprisingly, the oldest age group aged 56-65. Both in Wales and
overall in Great Britain, the employment rates of immigrants are always lower than those of

86
their native counterparts of the same age with the only exception of age group 56-65 in Wales,
where immigrants have on average a 2 percentage point higher employment rate than natives.
For all age groups, the regional distribution is very similar to the overall distribution.
Table 2.2.4.a – Employment rate of immigrants and natives by age group1992-1995
Region Natives Immigrants
16-25 26-35 36-45 46-55 56-65 16-25 26-35 36-45 46-55 56-65
Tyne & Wear 57.72 69.98 73.1 64.62 29.95 57.24 62.88 67.05 60.36 24.02
Rest of Northern
Region 63.02 73.11 77.98 70.72 32.72 49.40 70.87 69.62 53.75 34.57
South Yorkshire 57.78 70.40 76.88 71.14 30.13 35.24 57.18 67.23 55.59 26.42
West Yorkshire 63.71 79.16 83.75 78.60 41.78 35.45 50.89 62.52 57.66 30.07
Rest of Yorks.&
Humberside 66.39 75.95 81.15 77.31 41.33 40.92 66.64 73.88 73.23 48.62
East Midlands 63.75 77.28 82.21 79.48 42.95 47.85 67.48 73.63 70.67 34.01
East Anglia 68.34 78.44 83.11 80.01 47.02 62.00 73.50 71.52 72.45 41.84
Greater London 59.28 75.08 77.17 75.75 46.44 42.73 60.61 66.02 63.92 41.20
Greater London sample 28,709 35,321 24,768 19,903 16,384 6,502 13,028 12,360 8,818 6,915
Rest of South East 67.10 78.54 82.96 80.24 48.69 55.90 72.86 74.32 71.89 44.86
South West 65.89 77.16 82.61 78.71 44.63 56.67 74.85 77.93 75.15 49.50
West Midlands
(met. counties) 56.79 72.47 77.97 73.96 41.18 34.03 52.30 60.13 55.15 30.13
Rest of West
Midlands 67.66 78.63 82.90 78.58 43.52 49.60 65.83 81.60 76.25 38.07
Greater Manchester 59.48 74.72 79.78 72.98 37.60 36.55 53.89 58.59 51.94 30.91
Merseyside 50.94 67.12 70.78 64.02 32.73 40.33 70.21 68.11 69.42 45.83
Rest of North West 65.10 77.80 83.34 77.22 39.75 45.65 55.06 64.61 62.01 32.49
Wales 58.63 72.29 76.06 70.45 31.59 45.06 62.67 71.68 67.74 33.4 Wales sample size 14,944 16,224 15,952 15,145 12,127 383 613 551 363 399
Scotland 63.76 75.12 78.33 72.35 38.36 51.29 62.01 69.37 70.09 37.42
Great Britain 63.06 75.89 80.33 76.12 41.73 46.21 63.18 68.41 65.50 39.34 Great Britain sample 281,789 334,371 299,179 271,490 218,830 17,821 31,631 31,849 22,289 18,955
Entries are the employment rate of immigrants and natives in each age group and in each region and in GB in 1992-1995 pooled. For Greater London, Wales, and Greate Britain we also report the sample size. Employment rate is defined as the ratio of employed to working age population Source: LFS, 1992-1995

87
Table 2.2.4.b – Employment rate of immigrants and natives by age group 2002-2005
Region Natives Immigrants
16-25 26-35 36-45 46-55 56-65 16-25 26-35 36-45 46-55 56-65
Tyne & Wear 61.09 77.56 78.87 74.59 36.84 46.15 63.39 58.94 66.80 28.21
Rest of Northern
Region 61.45 76.24 81.24 75.57 40.40 54.75 76.26 69.06 70.94 26.17
South Yorkshire 61.77 78.57 81.63 76.29 45.22 35.40 58.73 57.29 52.59 32.09
West Yorkshire 62.31 82.77 85.04 81.07 51.63 43.56 58.09 63.40 59.06 39.28
Rest of Yorks.&
Humberside 65.64 80.74 84.49 81.54 49.58 52.65 73.46 85.31 75.27 42.27
East Midlands 65.28 81.89 85.39 81.53 52.33 51.61 66.42 72.99 75.42 40.91
East Anglia 67.53 82.11 85.58 82.44 55.04 63.08 75.25 83.83 84.32 65.16
Greater London 54.16 82.27 80.45 80.18 55.04 45.29 68.90 67.24 66.94 44.26 Greater London sample 18,541 21,213 21,284 15,335 12,472 7,073 14,013 12,276 8,973 6,073
Rest of South East 68.60 83.75 85.20 84.64 56.69 57.19 76.17 79.93 78.65 53.98
South West 69.46 83.45 85.85 83.99 53.18 58.14 80.45 78.59 79.38 54.49
West Midlands
(met. counties) 57.39 77.31 81.62 79.55 49.36 37.04 55.23 63.00 60.31 34.98
Rest of West
Midlands 67.73 83.18 85.62 81.52 52.83 61.74 77.12 81.54 82.97 44.01
Greater Manchester 61.97 81.06 82.51 79.06 46.72 38.32 61.02 57.83 64.26 34.14
Merseyside 57.60 76.65 75.49 75.26 39.83 39.06 66.74 82.80 69.04 41.41
Rest of North West 65.70 83.17 85.20 79.94 48.45 52.02 70.13 74.05 57.05 29.48
Wales 60.55 78.84 81.88 76.03 43.12 52.28 73.88 76.11 70.77 45.57 Wales sample size 10,786 11,251 13,606 12,422 12,291 448 717 648 469 372
Scotland 65.21 80.4 82.44 78.33 47.21 53.03 70.64 73.30 79.51 48.41
Great Britain 63.80 81.59 83.51 80.76 50.73 48.82 69.70 71.07 70.45 45.34 Great Britain sample size 197,249 215,066 263,755 231,389 207,891 18,063 33,733 30,953 24,193 16,120
Entries are the employment rate of immigrants and natives in each age group and in each region and in GB in 2002-2005 pooled. For Greater London, Wales, and Greate Britain we also report the sample size. Employment rate is defined as the ratio of employed to working age population Source: LFS, 2002-2005
Table 2.2.5 shows the share of immigrants in the whole working age population of each
region in 1992/1995 and in 2002/2005, and the difference between the two periods.
The immigrant share has increased in almost all regions over the ten year interval. The region
with the highest immigrant concentration, and with the largest increase in the share, is
London. West Midlands, West Yorkshire, and the South East also have a very high share of
immigrants, and the latter two regions have experienced a sizeable increase in their share
during the period considered.

88
Table 2.2.5 – Percentage of immigrants in the total population
Region 1992-1995 2002-2005 Difference
between periods
% immigrants
Sample
size
% immigrants
Sample
size
Tyne & Wear 2.51 31,427 4.55 25,009 2.04
Rest of Northern Region 2.15 57,549 2.83 45,304 0.68
South Yorkshire 3.83 36,804 5.20 30,044 1.37
West Yorkshire 7.75 57,545 10.09 49,599 2.34
Rest of Yorks.& Humberside 2.96 44,843 4.32 36,885 1.36
East Midlands 5.80 112,375 7.06 90,081 1.26
East Anglia 6.23 58,786 7.71 47,783 1.48
Greater London 27.93 172,708 35.85 137,253 7.92
Rest of South East 7.53 294,757 9.57 252,549 2.04
South West 4.61 126,782 6.19 108,795 1.58
West Midlands (metropolitan
counties) 12.16 68,398 13.54 53,032 1.38
Rest of West Midlands 3.99 74,348 4.04 60,467 0.05
Greater Manchester 7.94 67,374 7.88 46,112 -0.06
Merseyside 2.98 37,013 3.29 27,409 0.31
Rest of North West 4.38 66,182 4.87 48,679 0.49
Wales 3.05 76,701 4.19 63,010 1.14
Scotland 3.35 144,612 4.38 116,401 1.03
Great Britain 8.39 1,528,204 10.76 1,238,412 2.37 Entries are the percentage of immigrants in the total working age (16-65) population in each region and in GB in 1992-1995 pooled and 2002-2005 pooled, and the difference between the shares. We also report the sample size for each year and region. Source: LFS, various years
Figure 2.2.1 relates changes in regional average wages (on the vertical axis) to changes in the
regional share of immigrants (on the horizontal axis) between 1992/1995 and 2002/2005. The
figure shows a positive relationship between the two changes, which suggests that immigrants
tend to go to regions where wages are rising faster.14
In figure 2.2.2 we have plotted changes in the regional employment rate (on the vertical axis)
versus changes in the regional share of immigrants (on the vertical axis). In this case no strong
relationship between the two changes is apparent from the figure.
14 Without the outlier representing London, the relationship is still positive but not statistically significant, largely due to the small number of observations.

89
Figure 2.2.1 Average wages, population (natives and immigrants)
1.5
22
.53
Cha
ng
e in
avera
ge
wag
es
0 .02 .04 .06 .08Change in share of immigrants
Change between years 1992-1995 pooled and years 2002-2005 pooled
Source: LFS, various years
Changes in average wage vs. changes in immigrant share - 1992-1995 / 2002-2005
Figure 2.2.2 Employment rate, population (natives and immigrants)
.02
.04
.06
.08
Cha
ng
e in
em
plo
ym
ent ra
te
0 .02 .04 .06 .08Change in share of immigrants
Change between years 1992-1995 pooled and years 2002-2005 pooled
Source: LFS, various years
Changes in employment rate vs. changes in immigrant share - 1992-1995 / 2002-2005
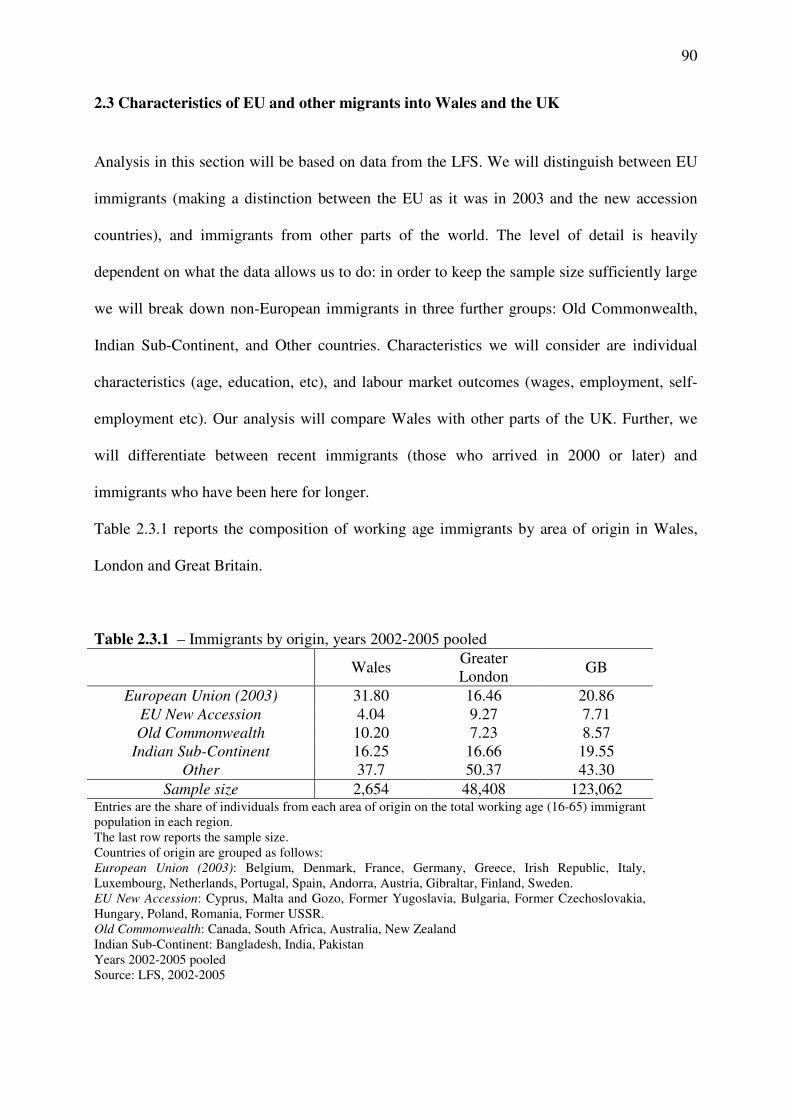
90
2.3 Characteristics of EU and other migrants into Wales and the UK
Analysis in this section will be based on data from the LFS. We will distinguish between EU
immigrants (making a distinction between the EU as it was in 2003 and the new accession
countries), and immigrants from other parts of the world. The level of detail is heavily
dependent on what the data allows us to do: in order to keep the sample size sufficiently large
we will break down non-European immigrants in three further groups: Old Commonwealth,
Indian Sub-Continent, and Other countries. Characteristics we will consider are individual
characteristics (age, education, etc), and labour market outcomes (wages, employment, self-
employment etc). Our analysis will compare Wales with other parts of the UK. Further, we
will differentiate between recent immigrants (those who arrived in 2000 or later) and
immigrants who have been here for longer.
Table 2.3.1 reports the composition of working age immigrants by area of origin in Wales,
London and Great Britain.
Table 2.3.1 – Immigrants by origin, years 2002-2005 pooled
Wales Greater London
GB
European Union (2003) 31.80 16.46 20.86 EU New Accession 4.04 9.27 7.71 Old Commonwealth 10.20 7.23 8.57
Indian Sub-Continent 16.25 16.66 19.55 Other 37.7 50.37 43.30
Sample size 2,654 48,408 123,062 Entries are the share of individuals from each area of origin on the total working age (16-65) immigrant population in each region. The last row reports the sample size. Countries of origin are grouped as follows: European Union (2003): Belgium, Denmark, France, Germany, Greece, Irish Republic, Italy, Luxembourg, Netherlands, Portugal, Spain, Andorra, Austria, Gibraltar, Finland, Sweden. EU New Accession: Cyprus, Malta and Gozo, Former Yugoslavia, Bulgaria, Former Czechoslovakia, Hungary, Poland, Romania, Former USSR. Old Commonwealth: Canada, South Africa, Australia, New Zealand Indian Sub-Continent: Bangladesh, India, Pakistan Years 2002-2005 pooled Source: LFS, 2002-2005

91
Western European migrants (EU 2003) are about one third of the total foreign population in
Wales. This proportion is much higher than the corresponding for London, 16.5%, and
Britain, 20.9%. On the other hand, while more than 9% of immigrants in London, and almost
8% of immigrants in Britain are from an EU new accession country, this share is only 4% in
Wales. 10.2% of immigrants in Wales are from the Old Commonwealth countries: this share
is larger than in London (7.2%) and Britain (8.6%). The proportion of immigrants from the
Indian Sub-Continent is very similar in the three regions.
Table 2.3.2 looks at the area of origin of recent immigrants only (those who have arrived in
the UK since 2000) in Wales, London, and Britain.
Table 2.3.2 –Recent Immigrants by origin, years 2002-2005 pooled
Wales Greater London
GB
European Union (2003) 25.22 15.70 15.23 EU New Accession 5.42 14.35 12.57 Old Commonwealth 8.73 14.29 12.48 Indian Sub-Continent 12.61 12.15 13.85 Other 48.02 43.51 45.88
Sample size 644 10,498 27,551 Entries are the share of recent arrivals on total working age (16-65) population from each area of origin in each region. Recent immigrants are defined as all immigrants arrived in 2000 or later. The last row reports the sample size. Countries of origin are grouped as follows: European Union (2003): Belgium, Denmark, France, Germany, Greece, Irish Republic, Italy, Luxembourg, Netherlands, Portugal, Spain, Andorra, Austria, Gibraltar, Finland, Sweden. EU New Accession: Cyprus, Malta and Gozo, Former Yugoslavia, Bulgaria, Former Czechoslovakia, Hungary, Poland, Romania, Former USSR. Old Commonwealth: Canada, South Africa, Australia, New Zealand Indian Sub-Continent: Bangladesh, India, Pakistan Years 2002-2005 pooled Source: LFS, 2002-2005
In each region, the composition of the recent immigrant population is very similar to that of
the whole immigrant population, although everywhere the share of EU new accession
countries is larger, and the share EU Western countries is smaller. The only notable difference
in the comparative analysis of table 2.3.1 and 2.3.2 is that the share of recent Old
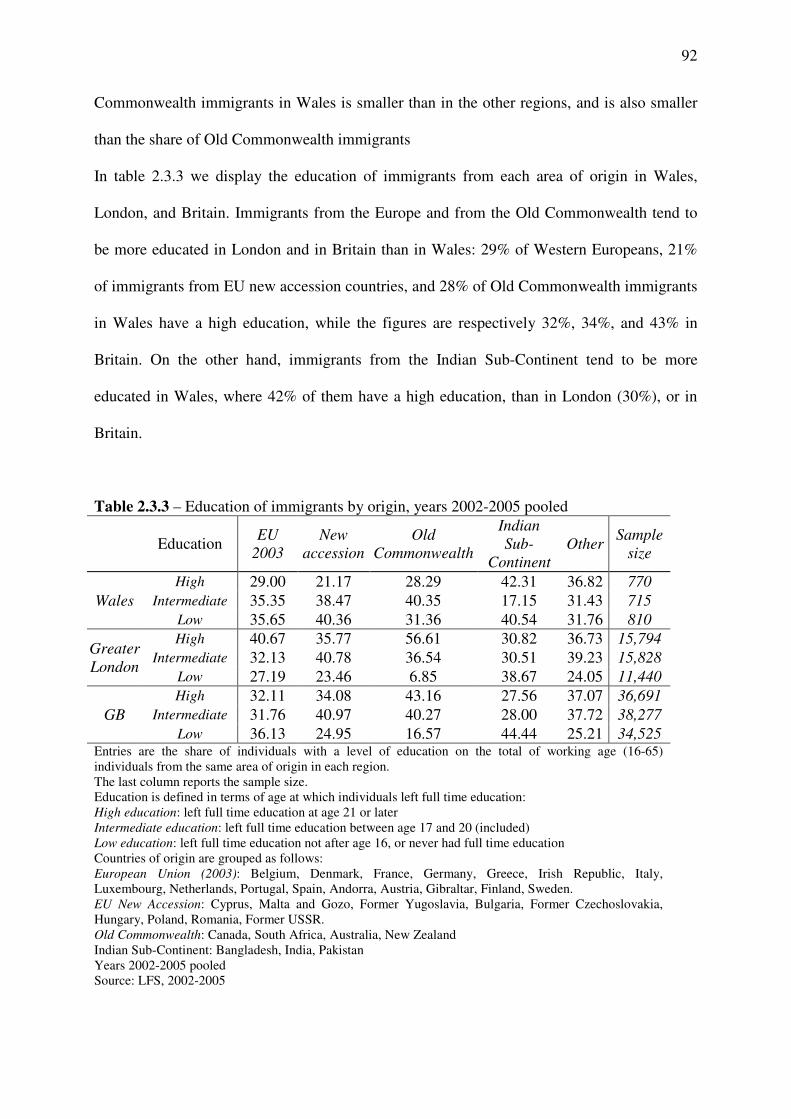
92
Commonwealth immigrants in Wales is smaller than in the other regions, and is also smaller
than the share of Old Commonwealth immigrants
In table 2.3.3 we display the education of immigrants from each area of origin in Wales,
London, and Britain. Immigrants from the Europe and from the Old Commonwealth tend to
be more educated in London and in Britain than in Wales: 29% of Western Europeans, 21%
of immigrants from EU new accession countries, and 28% of Old Commonwealth immigrants
in Wales have a high education, while the figures are respectively 32%, 34%, and 43% in
Britain. On the other hand, immigrants from the Indian Sub-Continent tend to be more
educated in Wales, where 42% of them have a high education, than in London (30%), or in
Britain.
Table 2.3.3 – Education of immigrants by origin, years 2002-2005 pooled
Education EU
2003
New
accession
Old
Commonwealth
Indian
Sub-
Continent
Other Sample
size
Wales
High 29.00 21.17 28.29 42.31 36.82 770
Intermediate 35.35 38.47 40.35 17.15 31.43 715
Low 35.65 40.36 31.36 40.54 31.76 810
Greater
London
High 40.67 35.77 56.61 30.82 36.73 15,794
Intermediate 32.13 40.78 36.54 30.51 39.23 15,828
Low 27.19 23.46 6.85 38.67 24.05 11,440
GB
High 32.11 34.08 43.16 27.56 37.07 36,691
Intermediate 31.76 40.97 40.27 28.00 37.72 38,277
Low 36.13 24.95 16.57 44.44 25.21 34,525 Entries are the share of individuals with a level of education on the total of working age (16-65) individuals from the same area of origin in each region. The last column reports the sample size. Education is defined in terms of age at which individuals left full time education: High education: left full time education at age 21 or later Intermediate education: left full time education between age 17 and 20 (included) Low education: left full time education not after age 16, or never had full time education Countries of origin are grouped as follows: European Union (2003): Belgium, Denmark, France, Germany, Greece, Irish Republic, Italy, Luxembourg, Netherlands, Portugal, Spain, Andorra, Austria, Gibraltar, Finland, Sweden. EU New Accession: Cyprus, Malta and Gozo, Former Yugoslavia, Bulgaria, Former Czechoslovakia, Hungary, Poland, Romania, Former USSR. Old Commonwealth: Canada, South Africa, Australia, New Zealand Indian Sub-Continent: Bangladesh, India, Pakistan Years 2002-2005 pooled Source: LFS, 2002-2005

93
Table 2.3.4 reports the employment rate of working age immigrants by area of origin in
Wales, London, and Britain. The employment rate of Western Europeans (EU 2003) is quite
constant at around 70% in the three regions. The employment rate of immigrants from new
accession countries, on the other hand, is very high in Wales, at almost 85%, but much lower
in London and Britain, at 58% and 64% respectively. Immigrants from the Old
Commonwealth countries have very high employment rates, above 80% in all the regions
considered, while immigrants from the Indian Sub-Continent have a very low employment
rate at around 52-53% in all regions.
Table 2.3.4 – Employment rate of immigrants by origin, years 2002-2005 pooled
Wales Greater London
GB
EU 2003 68.85 69.7 70.07 New accession 84.56 58.13 64.23
Old Commonwealth 81.79 87.86 82.91 Indian Sub-Continent 53.30 52.07 52.34
Other 62.95 58.78 62.14
Sample size 2,654 48,408 123,062 Entries are the share of employed on the total working age (16-65) population from each country of origin in each region. The last row reports the sample size. Countries of origin are grouped as follows: European Union (2003): Belgium, Denmark, France, Germany, Greece, Irish Republic, Italy, Luxembourg, Netherlands, Portugal, Spain, Andorra, Austria, Gibraltar, Finland, Sweden. EU New Accession: Cyprus, Malta and Gozo, Former Yugoslavia, Bulgaria, Former Czechoslovakia, Hungary, Poland, Romania, Former USSR. Old Commonwealth: Canada, South Africa, Australia, New Zealand Indian Sub-Continent: Bangladesh, India, Pakistan Years 2002-2005 pooled Source: LFS, 2002-2005
We have reported in table 2.3.5 the share of self-employed individuals from each area of
origin in Wales, London and Britain.
Wales tends to have the lowest share of self-employed, compared to London and Britain. The
highest regional variation in self-employment rates is for immigrants from EU new accession
countries: less than 8% of immigrants from new accession countries in Wales are self-
employed, while almost 25% of those who are in London, and over 15% of those in Britain.
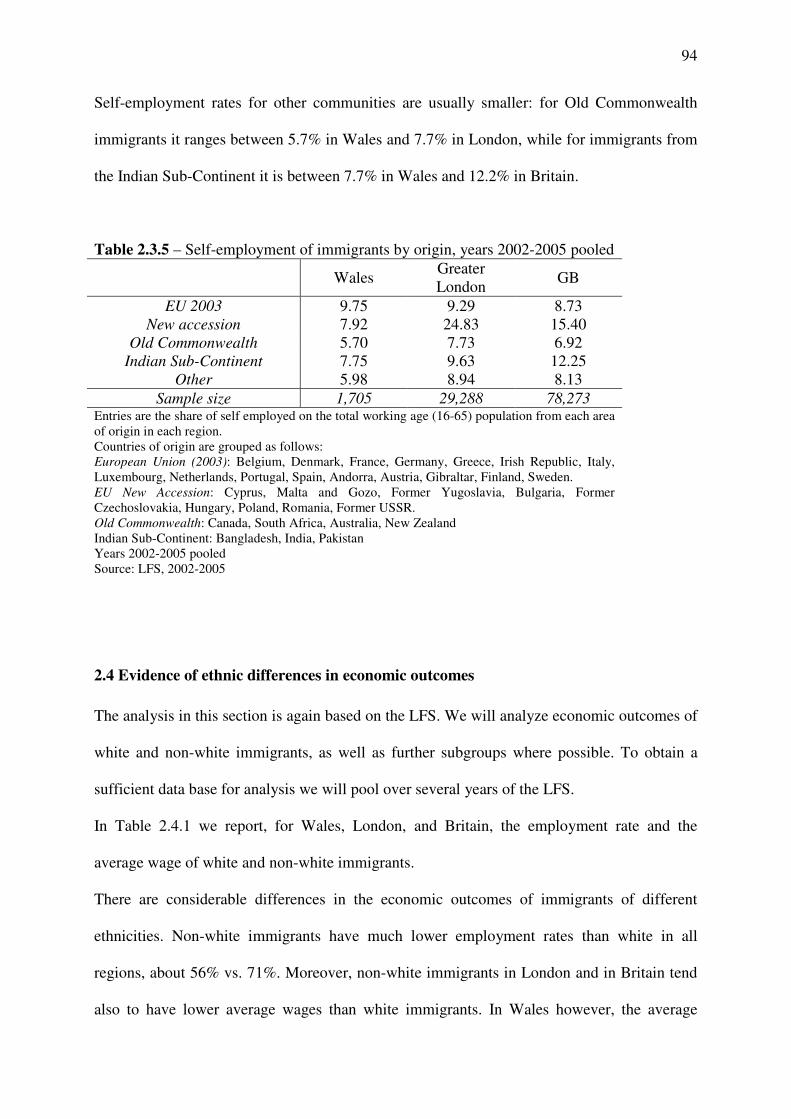
94
Self-employment rates for other communities are usually smaller: for Old Commonwealth
immigrants it ranges between 5.7% in Wales and 7.7% in London, while for immigrants from
the Indian Sub-Continent it is between 7.7% in Wales and 12.2% in Britain.
Table 2.3.5 – Self-employment of immigrants by origin, years 2002-2005 pooled
Wales Greater London
GB
EU 2003 9.75 9.29 8.73 New accession 7.92 24.83 15.40
Old Commonwealth 5.70 7.73 6.92 Indian Sub-Continent 7.75 9.63 12.25
Other 5.98 8.94 8.13
Sample size 1,705 29,288 78,273 Entries are the share of self employed on the total working age (16-65) population from each area of origin in each region. Countries of origin are grouped as follows: European Union (2003): Belgium, Denmark, France, Germany, Greece, Irish Republic, Italy, Luxembourg, Netherlands, Portugal, Spain, Andorra, Austria, Gibraltar, Finland, Sweden. EU New Accession: Cyprus, Malta and Gozo, Former Yugoslavia, Bulgaria, Former Czechoslovakia, Hungary, Poland, Romania, Former USSR. Old Commonwealth: Canada, South Africa, Australia, New Zealand Indian Sub-Continent: Bangladesh, India, Pakistan Years 2002-2005 pooled Source: LFS, 2002-2005
2.4 Evidence of ethnic differences in economic outcomes
The analysis in this section is again based on the LFS. We will analyze economic outcomes of
white and non-white immigrants, as well as further subgroups where possible. To obtain a
sufficient data base for analysis we will pool over several years of the LFS.
In Table 2.4.1 we report, for Wales, London, and Britain, the employment rate and the
average wage of white and non-white immigrants.
There are considerable differences in the economic outcomes of immigrants of different
ethnicities. Non-white immigrants have much lower employment rates than white in all
regions, about 56% vs. 71%. Moreover, non-white immigrants in London and in Britain tend
also to have lower average wages than white immigrants. In Wales however, the average

95
wage of white and non-white immigrants is almost the same with a statistically insignificant
difference of around 2%.
Table 2.4.1 – Employment and average wage of immigrants by ethnicity, years 2002-2005 pooled
Wales Greater London GB
Employment Average
Wage Employment
rate Average
Wage Employment
rate Average
Wage
% Sample
size Wage
Sample
size %
Sample
size Wage
Sample
size %
Sample
size Wage
Sample
size
Non-white 56.98 1,056 10.59 119 55.90 29,999 10.54 3,484 56.75 65,048 9.98 8,155
White 71.61 1,583 10.36 269 70.21 18,321 14.78 2,566 71.94 57,820 12.53 10,014
Entries are the employment rate and average wage of white and non-white working age (16-65) immigrants in each region, we also report the sample size for each group and variable Years 2002-2005 pooled. Source: LFS, 2002-2005
In table 2.4.2 we examine in more detail differences in economic outcomes by ethnicity in
Wales, London, and Britain.
Table 2.4.2 – Employment and average wage of immigrants by ethnicity, years 2002-2005 pooled
Wales Greater London GB
Employment Average Wage
Employment Average Wage
Employment Average Wage
% Sample
size Wage
Sample
size %
Sample
size Wage
Sample
size %
Sample
size Wage
Sample
size
White 71.61 1,583 10.36 269 70.21 18,321 14.78 2,566 71.94 57,820 12.53 10,014
Black – Caribbean
47.94 19 7.05 3 64.92 2,553 10.28 353 64.73 4,479 9.59 653
Black – African
38.42 104 13.63 9 53.08 6,195 9.32 673 55.71 9,381 9.07 1,230
Indian 65.26 194 11.69 26 68.94 6,244 11.74 968 68.46 14,853 11.10 2,255
Pakistani 53.21 106 12.19 8 44.98 1,915 9.78 147 42.28 9,046 8.73 667
Bangladeshi 47.22 125 5.03 9 36.81 2,492 8.72 141 38.21 4,090 7.90 258
Chinese 59.80 134 13.52 13 55.43 1,303 12.12 148 56.02 4,012 10.97 487
Other – Mixed
61.64 374 10.10 51 54.08 9,297 10.56 1,054 57.18 19,187 9.97 2,605
Entries are the employment rate and average wage of white and non-white working age (16-65) immigrants in each region, we also report the sample size for each group and variable. Years 2002-2005 pooled. Source: LFS, 2002-2005

96
Among non-white immigrants, Indians are those with highest employment rate in Wales,
London, and Britain. Black Africans are the group with the lowest employment rate in Wales,
while Bangladeshis have the lowest employment rates in London and Britain.
In all regions Bangladeshis have the lowest average wages, while the group with highest
wages is different in every region. In Wales Black Africans, Chinese, Pakistanis, and Indians
have higher wages than white immigrants. In London and Britain white immigrants have
higher wages than non-whites, and the Chinese and Indians have the highest wages among the
non-whites.

97
Part 3: Discussion and Conclusion
To assess the overall net gain or loss to the economy from immigration is a challenging task
both from a theoretical and an empirical point of view. In part 1 of this report we provide a
comprehensive overview of the economic literature on the socio-economic impact of
migration and assess the evidence base in the context of significant migration from the new
EU states. In part 2, we summarise characteristics of immigrants in the UK with a particular
comparative focus on Wales.
Our literature review discusses a large variety of channels by which immigration can affect
the receiving economy. The most important ones are through (i) wages or employment effects
on native workers, (ii) changes in output structure, technology and competitiveness (iii) fiscal
effects, through benefit claims and contributions to the tax or welfare system, (iv) effects on
house prices, (v) effects through the creation of new jobs and opportunities, by self-
employment or managerial activities of immigrants, and (vi) complementarities and additions
to the skill base.
Most papers concentrate on the analysis of one single channel. As our survey suggests, this is
already a difficult task which involves a number of challenging empirical issues. To bring all
these different channels together to assess the overall impact of migration is obviously even
more difficult, and a large research project in its own right. In this context and with a view to
future research, we would here like to discuss a number of aspects that seem relevant to us.
Most importantly, there is an intertemporal aspect to all the issues related to the labour market
impact of immigration. Much of the work so far is done in a static framework, with little
consideration of the intertemporal and intergenerational implications. For instance, to date

98
most of the literature on employment- and wage effects is non-dynamic, which is mostly due
to lack of good data. Also, studies that consider the fiscal effects of immigration usually
neglect intergenerational issues, as well as changes of the relative position of immigrants in
the earnings distribution over the life cycle.
To arrive at an overall assessment one furthermore needs to specify exactly which aspects of
immigration should and should not be considered. For instance, one aspect which is not
included in our list is the education and skill that is embedded in newly arriving immigrants
and that has been financed in part by the country of origin. This is often not counted as a
benefit, but likely to be substantial in magnitude. Also, spending patterns of immigrants and
their effect on aggregate demand (as discussed in the section on remittances) are often
neglected. On the other hand, possible adverse long-term consequences are difficult to assess
and to measure.
It seems important to stress again that the effects immigration has for the receiving country in
all the dimensions listed above depends on the particular migration that is under
consideration, as well as on the particularities of the receiving economy. The empirical
evidence that we present in our literature survey clearly shows that results obtained from one
country through careful research can and should not be generalised to other countries. For
instance, we have shown above that the effects immigration has on wages and inequality
depends on the type of immigrants. Australia, which runs a high-skill migration policy, is
likely to face different consequences than the U.S., where migration is much more low-
skilled. Also, even if immigration was the same in terms of the skill structure for the two
countries, consequences are likely to differ, because the skill mix of the receiving country is
different. Similar considerations hold for any other aspects of what immigration may do to the
receiving country.
99
Finally, it is not always clear-cut what is beneficial and what is detrimental. For instance, in
the UK, the governor of the Bank of England suggested in a number of speeches and
comments that he views immigration as having an anti-inflationary impact on the UK
economy. These can only work through wages, which implies that immigration depresses
wages in the first place – which on the other hand is seen as detrimental by employees. (As
we discuss above there is no evidence that immigration decreases average wages in the UK,
though). Also, immigration may lead to an increase in housing prices – which clearly
enhances wealth of natives who own property, but may be seen as negative by those who have
not yet made the first step on the property ladder.
In our view, evaluations of the possible net effect of migration need to be assessed with much
care, and generalisations should be avoided.
In part 2 of this report we offer an overview of the characteristics of the immigrant population
in the UK and, particularly, in Wales. Although the share of immigrants in the working age
population in Wales is relatively low compared to the rest of the UK, it has increased
substantially between 1992 and 2005 from 2.9% to 4.6%. Within Wales immigrants are
overall similarly distributed across counties as natives with the exception of Mid and South
Glamorgan where they are significantly under- and over-represented, respectively.
Interestingly, and opposed to many other countries, immigrants in Wales are more educated
than natives but experience lower employment and participation rates. In comparison to other
areas in the UK, Wales has a large share of immigrants originating from Western Europe but
received relatively few immigrants from the new EU accession countries since 2004. The
ones who did settle in Wales, however, fared substantially better than their counterparts in
other parts of the UK with an employment rate of 84.5% compared to only 58% in London
100
and 64.2% nationwide. As in the rest of the UK, non-white immigrants have considerable
lower employment rates than white immigrants in Wales but, as opposed to the rest of the
UK, average wages of these two groups are almost the same.
Immigration policy plays an important role in obtaining migrant populations that are
enhancing the welfare of the receiving population the most. It is indeed perceived as a key
issue in most OECD countries, and common trends can be identified in the main immigration-
receiving countries. The annual OECD publication International Migration Outlook,
previously called Trends in International Migration (OECD, various years), offers a review of
the different migratory policies in place in different countries, and of its most recent
developments.
According to this, an increasing number of countries have in recent years moved towards
selective migration policies, in an effort to attract highly skilled immigrants. Such policies
have been in place for many years in Australia and Canada, and are now being adopted in
different forms by several European OECD countries, such as Ireland, the Netherlands, and
the Czech Republic (OECD, 2006). The United Kingdom is also moving from the existing
two-tier work permit system to a five-tier system in which great importance is given to high
skilled migration.
Another key migration policy area is directed to manage the need for temporary low-skilled
immigration. Low-skilled immigration is thought to serve the purpose of filling temporary,
often seasonal, labour shortages. Programs designed to facilitate the entry of temporary
agricultural worker have recently been introduced in countries such as Finland, Greece, and
Hungary.
101
Finally, a growing number of countries are now directing their attention towards the regional
distribution of immigrants (OECD, 2004), with a bigger role being given to local authority in
managing migration flows in accordance to local labour market needs. A regional
management of immigration is believed to facilitate immigrants’ integration in the host
country, avoiding segregation and isolation.
It remains to be seen how the recent changes in the UK immigration policy with a focus on
more high-skilled immigration will affect the Welsh labour market. Overall, immigrants in
Wales are doing quite well, both compared to other immigrants in the UK and relative to the
native population in Wales. With a relatively low immigrant share, part of the explanation
could be that those immigrants who decide to settle in Wales are positively selected. Whether
this would continue if immigration to Wales was to increase depends on the job opportunities
in Wales and the ability to attract the most productive immigrants to the region.
102
References
Abdurrahman, A. and Borjas, G. J. (2006) “Attenuation Bias in Measuring the Wage Impact
of Immigration”, Harvard University Working Paper.
Adams, R.H. & J. Page, (2005), “Do International Migration and Remittances Reduce Poverty
in Developing Countries”, World Development , vol. 33, n° 10, pp. 1645-1669.
Amuedo-Dorantes, C. & Pozo, S. (2006), “Remittances as Insurance: Evidence from Mexican Immigrants”, Journal of Population Economics 19(2), 227-254. Altonji, J. G. and Card, D. (1991) “The Effects of Immigration on the Labor Market
Outcomes of Less-skilled Natives” in Abowd, J. M. and Freeman, R. B. (eds), Immigration,
Trade and the Labor Market, Chicago: University of Chicago Press.
Angrist, J. D. and Kugler, A. D. (2003) “Protective or Counter-productive? Labour Market
Institutions and the Effect of Immigration on EU Natives”, Economic Journal, Vol. 113 (488),
F302-F331.
Auerbach, A. J., Gokhale, J., and Kotlikoff, L. J. (1994) “Generational Accounting: A
Meaningful Way to Evaluate Fiscal Policy”, Journal of Economic Perspectives, Vol. 8 (1),
73-94.
Auerbach, A. J. and Oreopoulos, P. (1999) “Analyzing the Fiscal Impact of U.S.
Immigration”, American Economic Review Papers and Proceedings, Vol. 89 (2), 176-180.
Barro, R. and Sala-i-Martin, X. (1992) “Regional Growth and Migration: A Japan-United
States Comparison”, Journal of the International and Japanese Economies, Vol. 6 (4), 312-
346.
Bartel, A. P. (1989) “Where Do the New United-States Immigrants Live”, Journal of Labor
Economics, Vol. 7 (4), 371-391.
Bauer, T. (1998) “Do Immigrants Reduce Natives’ Wages? Evidence from Germany”,
Departmental Working Papers 1998/02, Rutgers University.

103
Beaudry, P., Doms, M. and Lewis, E. G. (2006) “Endogenous Skill Bias in Technology
Adoption: City-level Evidence from the IT Revolution”, Federal Reserve Bank of San
Francisco Working Paper No. 06-24.
Beaudry, P. and Green, D. A. (2003) “Wages and Employment in the United States and
Germany: What explains the differences?”, American Economic Review, Vol. 93 (3), 573-
602.
Beaudry, P. and Green, D. A. (2005) “Changes in U.S. Wages, 1976-2000: Ongoing Skill
Bias or Major Technological Change?”, Journal of Labor Economics, Vol. 23 (3), 609-648.
Bhagwati, J. N. and Brecher R. A. (1980) “National Welfare in the Open Economy in the
Presence of Foreign-owned Factors of Production”, Journal of International Economics, Vol.
10 (1), 103-115.
Bhagwati, J. N. and Rodriguez, C. (1976) “Welfare-theoretical Analyses of the Brain Drain”,
in: Bhagwati, J. N. (ed), The Brain Drain and Taxation: Theory and Empirical Analysis,
North Holland: Amsterdam, Chapter 5, 85-111.
Blanchflower, D., Saleheen, J., and Shadforth, C. (2007) “The Impact of the Recent Migration
from Eastern Europe on the UK Economy”, IZA Discussion Paper No. 2615.
Bonin, H. (2006) “Der Finanzierungsbeitrag der Ausländer zu den deutschen Staatsfinanzen:
Eine Bilanz für 2004”, IZA Discussion Paper No. 2444.
Borjas, G. J. (1987) “Immigrants, Minorities, and Labor Market Competition”, Industrial &
Labor Relations Review, Vol. 40 (3), 382-392.
Borjas, G. J. (1994) “The Economics of Immigration”, Journal of Economic Literature, Vol. 32 (4), 1667-1717.
Borjas, G.J. (1995), “The Economic Benefits from Immigration”, Journal of Economic
Perspectives, Vol. 9 (2), 3-22.

104
Borjas, G. J. (1999a) Heaven's Door: Immigration Policy and the American Economy,
Princeton: Princeton University Press.
Borjas, G. J. (1999b) “The Economic Analysis of Immigration” in: Ashenfelter, O. C. and
Card, D. (eds), Handbook of Labor Economics, Vol. 3A, North-Holland, Chapter 28, 1697-
1760.
Borjas, G. J. (2003) “The Labor Demand Curve is Downward Sloping: Reexamining the
Impact of Immigration on the Labor Market”, Quarterly Journal of Economics, Vol. 118 (4),
1335-1374.
Borjas, G. J. (2006a) “Immigration in High-skill Labor Markets: The Impact of Foreign
Students on the Earnings of Doctorates”, NBER Working Paper No. 12085.
Borjas, G. J. (2006b) “Native Internal Migration and the Labor Market Impact of
Immigration”, Journal of Human Resources, Vol. 41 (2), 221-258.
Borjas, G.J., Freeman, R.B. and Katz, L. F. (1992) “On the Labor Market Effects of
Immigration and Trade” in: Borjas, G. J. and Freeman, R.B. (eds), Immigration and the Work
Force: Economic Consequences for the United States and Source Areas, Chicago: University
of Chicago Press, 213-244.
Borjas, G. J., Freeman, R.B. and Katz, L.F. (1996) “Searching for the Effect of Immigration
on the Labor Market”, American Economic Review, Vol. 86 (2), 246-251.
Borjas, G. J., Freeman, R.B. and Katz, L.F. (1997) “How Much Do Immigration and Trade
Affect Labor Market Outcomes?”, Brookings Papers on Economic Activity, Vol. 1997 (1), 1-
90.
Borjas, G. J., Grogger, J.J. and Hanson, G.H. (2006) “Immigration and African-American
Employment Opportunities: The Response of Wages, Employment, and Incarceration to
Labor Supply Shocks”, NBER Working Paper No. 12518.
Bretschger, L. (2001) “Labor Supply, Migration, and Long-term Development”, Open

105
Economies Review, Vol. 12 (1), 5-27.
Butcher, K. F. and Card, D. (1991) “Immigration and Wages - Evidence from the 1980s”,
American Economic Review, Vol. 81 (2), 292-296.
Card, D. (1990) “The Impact of the Mariel Boatlift on the Miami Labor-Market”, Industrial &
Labor Relations Review, Vol. 43 (2), 245-257.
Card, D. (1997) “Immigrant Inflows, Native Outflows, and the Local Labor Market Impacts
of Higher Immigration”, Working Paper No. 5927, Cambridge, MA, National Bureau of
Economic Research.
Card, D. (2001) “Immigrant Inflows, Native Outflows and the Local Labor Market Impacts of
Immigration”, Journal of Labor Economics, Vol. 19 (1), 22-64.
Card, D. (2005) “Is the New Immigration Really So Bad?”, Economic Journal, Vol. 115
(507), F300-F323.
Card, D. and DiNardo, J. (2000) “Do Immigrant Inflows Lead to Native Outflows?” American
Economic Review, Vol. 90 (2), 360-367.
Card, D. and Lewis, E. (2005) “The Diffusion of Mexican Immigrants during the 1990s:
Explanations and Impacts”, NBER Working Paper No. 11552.
Carrasco, R., Jimeno J. F., and Ortega, A. C. (2007) “The Effect of Immigration on the Labor
Market Performance of Native-Born Workers: Some Evidence for Spain”, forthcoming
Journal of Population Economics.
Carrington, W. J. and de Lima, P. J. F. (1996) “The Impact of 1970s Repatriates from Africa
on the Portuguese Labor Market”, Industrial & Labor Relations Review, Vol. 49 (2), 330-347.
Cohen, S.and Hsieh, C. T. (2001) “Macroeconomic and Labor Market Impact of Russian
Immigration in Israel”, Bar IIan University, Department of Economics Working Papers.

106
Cohen-Goldner S. and Paserman M. D. (2004) “The Dynamic Impact of Immigration on
Natives' Labor Market Outcomes: Evidence from Israel”, IZA Discussion Paper No. 1315.
Collado, M. D., Iturbe-Ormaetxe, I., and Valera, G. (2004) “Quantifying the Impact of
Immigration on the Spanish Welfare State”, International Tax and Public Finance, Vol. 11
(3), 335-353.
Cortes, P. (2006) “The Effect of Low-skilled Immigration on US Prices: Evidence from CPI
Data”, MIT Working Paper.
DeNew, J. P. and Zimmermann, K.F. (1994) “Native Wage Impacts of Foreign Labor - A
Random Effects Panel Analysis”, Journal of Population Economics, Vol. 7 (2), 177-192.
Djajic, S. (1986) “International Migration, Remittances and Welfare in a Development
Economy”, Journal of Development Economics, Vol. 21 (2), 229-234.
Drinkwater, S., Levine, P., Lotti, E., and Pearlman, J. (2002) “The Economic Impact of
Migration: A Survey”, prepared for the Second Workshop of the Fifth Framework Programme
Project European Enlargement: The Impact of East West Migration on Growth and
Employment, 6-7 December, Vienna. <http://www.eastwestmigration.org/migsurvey6.pdf>
Dustmann, C., Fabbri, F., Preston, I., and Wadsworth, J. (2003) “The Local Labour Market
Effects of Immigration in the UK”, Home Office Report.
Dustmann, C., Fabbri, F., and Preston, I. (2005) “The Impact of Immigration on the British
Labour Market”, Economic Journal, Vol. 115 (507), 324-341.
Dustmann, C., and Preston, I. (2006) “Is Immigration Good or Bad for the Economy?
Analysis of Attitudinal Responses”, Research in Labor Economics, Vol. 24, 3-34.
Dustmann, C., Frattini, T. and I. Preston (2007) “A Study of Migrant Workers and the
National Minimum Wage and Enforcement Issues that Arise”, Report for the Low Pay
Commission.

107
Dustmann, C. and Weiss, Y. (2007) “Return Migration: Theory and Empirical Evidence from
the UK”, British Journal of Industrial Relations, 45, pp. 236-256
Dustmann, C. and Mestres, J. (2007) “Return Migration, Savings, and Remittances”, mimeo,
University College London
Ethier, W. J. (1984) “Protection and Real Incomes Once Again”, Quarterly Journal of
Economics, Vol. 99 (1), 193-200.
Faini, R. (2006), “Remittances and the brain drain”, IZA Discussion Paper (2155).
Fairlie, R. W. and Meyer, B. D. (2003) “The Effect of Immigration on Native Self-
Employment”, Journal of Labor Economics, Vol. 21 (3), 619-650.
Filer, R. K. (1992) “The Effect of Immigrant Arrivals on Migratory Patterns of Native
Workers” in: Borjas, G. J. and Freeman, R. B. (eds), Immigration and the Work Force:
Economic Consequences for the United States and Source Areas, Chicago: University of
Chicago Press, 245-269.
Friedberg, R. M. and Hunt, J. (1995) “The Impact of Immigration on Host Country Wages,
Employment and Growth”, Journal of Economic Perspectives, Vol. 9 (2), 23-44.
Friedberg, R. M. (2001) “The Impact of Mass Migration on the Israeli Labor Market”,
Quarterly Journal of Economics, Vol. 116 (4), 1373-1408.
Frey, W. H. (1995) “Immigration and Internal Migration Flight - A California Case Study”,
Population and Environment, Vol. 16 (4), 353-375.
Frey, W. H. (1996) “Immigration, Domestic Migration, and Demographic Balkanization in
America: New Evidence for the 1990s”, Population and Development Review, Vol. 22 (4),
741-763.
Funkhouser, E. (1995), “`Remittances from international migration: A comparison of El Salvador and Nicaragua “, The Review of Economics and Statistics 77(1), 137-146.

108
Gang, I. and Rivera-Batiz, F. (1994) “Labor Market Effects of Immigration in the United
States and Europe: Substitution vs. Complementarity”, Journal of Population Economics,
Vol. 7 (2), 157-175.
Gaston, N. and Nelson, D. (2000) “Immigration and Labour-market Outcomes in the United
States: A Political-economy Puzzle”, Oxford Review of Economic Policy, Vol. 16 (3), 104-
114.
Gaston, N. and Nelson, D. (2002) “The Employment and Wage Effects of Immigration: Trade
and Labour Economics Perspectives” in: Greenaway, D., Upward, R., and Wakelin, K. (eds),
Trade, Investment, Migration and Labour Market Adjustment, Palgrave, 201-235.
Gilpin, N., Henty, M., Lemos, S., Portes, J., and Bullen, C. (2006) “The Impact of Free
Movement of Workers from Central and Eastern Europe on the UK Labour Market”,
Department of Work and Pensions Working Paper No. 29.
Gott, C. and Johnston, K. (2002) “The Migrant Population in the UK: Fiscal Effects”, RDS
Home Office Report.
Grossman, J. B. (1982) “The Substitutability of Natives and Immigrants in Production”,
Review of Economics and Statistics, Vol. 64 (4), 596-603.
Hamermesh, D. S. (1993) Labor Demand, Princeton: Princeton University Press.
Haisken-DeNew, J. P. and Zimmermann, K. F. (1995) “Wage and Mobility Effects of Trade
and Migration”, CEPR Discussion Paper No. 1318.
Haque, N. U. and Kim, S. (1995) “Human Capital Flight: Impact of Migration on
Income and Growth”, IMF Staff Papers, Vol. 42 (3), 577-607.
Hartog, J. and Zorlu, A. (2002) “The Effect of Immigration on Wages in Three European
Countries”, Journal of Population Economics, Vol. 18 (1), 113-151.

109
Hatton, T. and Tani M. (2003) “Immigration and Inter-Regional Mobility in the UK, 1982-
2000”, Economic Journal, Vol. 115 (507), F342-F358.
Hercowitz Z. and Yashiv E. (2002) “A Macroeconomic Experiment in Mass Immigration”,
IZA Discussion Paper No. 475.
Huddle, D. (1993) “The Net National Cost of Immigration”, Manuscript, Houston: Rice University.
Hunt, J. (1992) “The Impact of the 1962 Repatriates from Algeria on the French Labor-
market”, Industrial & Labor Relations Review, Vol. 45 (3), 556-572.
Jaeger, D. A. (1996) “Skill Differences and the Effects of Immigrants on the Wages of
Natives”, Bureau of Labor Statistics Economic Working Paper No.273.
Kapur, D. (2005). Remittances: The new development mantra? In S. Maimbo and D. Ratha (Eds.), Remittances Development Impact and Future Prospects. The World Bank.
Kenen, P.B. (1971) “Migration, the Terms of Trade, and Economic Welfare in the Source
Country” in: Bhagwati, J. N., Jones, R., Mundell, R., and Vanek, J. (eds), Trade, Balance of
Payments and Growth: Papers in International Economics in Honor of Charles P.
Kindleberger, North Holland, Amsterdam.
LaLonde, R. J. and Topel, R. H. (1991) “Labor Market Adjustments to Increased
Immigration” in: Abowd, J. M. and Freeman, R. B. (eds), Immigration, Trade and the Labor
Market, Chicago: University of Chicago Press, 167-199.
Leamer, E. E. and Levinsohn, J. (1995) “International Trade Theory: The Evidence”, in:
Grossman, G. and Rogoff, K. (eds), Handbook of International Economics, Vol. 3, North-
Holland, 1339-1394.
Lee, R. D. and Miller, T. W. (2000) “Immigration, Social Security, and Broader Fiscal
Impacts”, American Economic Review Papers and Proceedings, Vol. 90 (2), 350-354.
Lewis, E. G. (2004a) “Local Open Economies within the US: How Do Industries Respond to
Immigration”, Federal Reserve Bank of Philadelphia Working Paper No. 04-1.

110
Lewis, E. G. (2004b) “How Did the Miami Labor Market Absorb the Mariel Immigrants?”,
Federal Reserve Bank of Philadelphia Working Paper No. 04-3.
Lewis, E. G. (2005) “Immigration, Skill Mix, and the Choice of Technique”, Federal Reserve
Bank of Philadelphia Working Paper No. 05-8.
Longhi, S., Nijkamp, P. and Poot, J. (2004) “A Meta-analytic Assessment of the Effect of
Immigration on Wages”, Journal of Economic Surveys, Vol. 19 (3), 451-477.
Lucas, R. E. B. and Stark, O. (1988), “Migration, Remittances, and the Family”, Economic
Development and Cultural Change 36(3), 465-481.
Lundborg, P. and Segerstrom, P. S. (1998) “The Growth and Welfare Effects of International
Mass Migration”, Trade Union Institute for Economic Research, Stockholm, Working Paper
No. 146.
Lundborg, P. and Segerstrom, P. S. (2000) “International Migration and Growth in
Developed Countries: A Theoretical Analysis”, Economica, Vol. 67 (268), 579-604.
Manacorda, M., Manning, A. and Wadsworth, J. (2006) “The Impact of Immigration on the
Structure of Male Wages: Theory and Evidence from Britain”, IZA Discussion Paper, No.
2352.
OECD (2001) “Trends in International Migration”, Paris.
OECD (2004) “Trends in International Migration”, Paris.
OECD (2006) “International Migration Outlook”, Paris.
OECD (2007) “International Migration Outlook”, Paris.
Ottaviano, G. I. P. and Peri, G. (2006a) “Rethinking the Effects of Immigration on Wages”,
NBER Working Paper No. 12497.
111
Ottaviano, G. I. P. and Peri, G. (2006b) “Wages, Rents and Prices: The Effects of
Immigration on U.S. Natives”, Working Paper.
Pischke, J. S. and Velling, J. (1997) “Employment Effects of Immigration to Germany: An
Analysis Based on Local Labor Markets”, Review of Economics and Statistics, Vol. 79 (4),
594-604.
Okonkwo Osili, U. (2007), “Remittances and savings from international migration: Theory and evidence using a matched sample”, Journal of Development Economics 83(2), 446-465.
Poot, J., Nana, G., and Philpott, B. (1988) International Migration and the New Zealand
Economy: A Long-run Perspective, Wellington: Victoria University Press for the Institute of
Policy Studies.
Quibria, M.G. (1988) “A Note on International Migration, Non-traded Goods and Economic
Welfare in the Source Country”, Journal of Development Economics, Vol. 28 (3), 377-387.
Quibria, M.G. (1989) “International Migration and Real Wages: Is There Any Neo-classical
Ambiguity?”, Journal of Development Economics, Vol. 31 (1), 177-183.
Quibria, M.G., and Rivera-Batiz, F. (1989) “International Migration and Real Wages: A
Resolution Note”, Journal of Development Economics, Vol. 31 (1), 193-194.
Ratha, D. (2003), “Workers remittances: An important and stable source of external development finance”, Global Development Finance, The World Bank.
Reichlin, P. and Rustichini, A. (1998) “Diverging Patterns with Endogenous Labor
Migration”, Journal of Economic Dynamics and Control, Vol. 22 (5), 703-728.
Rivera- Batiz, F. (1982) “International Migration, Non-traded Goods and Economic Welfare
in the Source Country”, Journal of Development Economics, Vol. 11 (1), 81-90.
Rivera-Batiz, F. (1984) “International Migration, Non-traded Goods and Economic Welfare in
a Two-class Economy: A reply”, Journal of Development Economics, Vol. 16 (3), 325-330.

112
Rivera-Batiz, F. (1989) “The Impact of International Migration on Real Wages: Another
Look”, Journal of Development Economics, Vol. 31 (1), 185-192.
Rybczinski, T.M. (1955) “Factor Endowments and Relative Commodity Prices”, Economica,
Vol. 22, 336-341.
Saiz, A. (2003) “Room in the Kitchen for the Melting Pot: Immigration and Rental Prices”,
Review of Economics and Statistics, Vol. 85 (3), 502-521.
Saiz, A. (2006) “Immigration and Housing Rents in American Cities”, IZA Discussion Paper
No. 2189.
Stolper, W. F. and Samuelson, P. A. (1941) “Protection and Real Wages”, Review of
Economic Studies, Vol. 9 (1), 58-73.
Storesletten, K. (2000) “Sustaining Fiscal Policy through Immigration”, Journal of Political
Economy, Vol. 108 (2), 300-323.
Thompson, H. (1984) “International Migration, Non-traded Goods and Economic Welfare in
the Source Country: A Comment”, Journal of Development Economics, Vol. 16 (3), 321-324.
Venturini, A. (1999) “Do Immigrants Working Illegally Reduce the Natives’ Legal
Employment? Evidence from Italy”, Journal of Population Economics, Vol. 12 (1), 135-154.
Walker, R., Ellis, M., and Barff, R. (1992) “Linked Migration Systems – Immigration and
Internal Labor Flows in the United States”, Economic Geography, Vol. 68 (3), 234-248.
Walz, U. (1996) “Growth (Rate) Effects of Migration”, Zeitschrift fuer Wirtschafts- und
Sozialwissenschaften, Vol. 116 (2), 199-221.
Winter-Ebmer, R. and Zweimueller, J. (1996) “Immigration and the Earnings of Young
Native Workers”, Oxford Economic Papers, Vol. 48 (3), 473-491.
Winter-Ebmer, R. and Zweimueller, J. (1999) “Do Immigrants Displace Young Native
Workers: The Austrian Experience”, Journal of Population Economics, Vol. 12 (2), 327-340.

113
Woodland, A. (1982) International Trade and Resource Allocation, North-Holland.
Wright, R. A., Ellis, M., and Reibel, M. (1997) “The Linkage Between Immigration and
Internal Migration in Large Metropolitan Areas in the United States”, Economic Geography,
Vol. 73 (2), 234-254.