the impact of macroeconomic factors on firm performance
TRANSCRIPT

i
UNIVERSITY OF GHANA
DEPARTMENT OF ECONOMICS
THE IMPACT OF MACROECONOMIC FACTORS ON
FIRM PERFORMANCE
BY
DANIEL KWEKU OBENG-KRAMPAH
(10309576)
A THESIS SUBMITTED BY DANIEL KWEKU OBENG-KRAMPAH TO THE
UNIVERSITY OF GHANA, LEGON IN PARTIAL FULFILLMENT OF THE
REQUIREMENTS FOR THE AWARD OF A MASTER OF PHILOSOPHY
(ECONOMICS) DEGREE.
JULY, 2018
University of Ghana http://ugspace.ug.edu.gh

ii
DECLARATION This is to certify that this thesis is the result of research undertaken by Daniel Kweku Obeng-
Krampah towards the award of a Master of Philosophy (MPHIL) degree in Economics in the
Department of Economics, University of Ghana.
....................................................... …………………….
DANIEL KWEKU OBENG-KRAMPAH DATE
(10309576)
………………………… …………………………………………….
PROF. ERIC OSEI-ASSIBEY DR. MONICA LAMBON-QUAYEFIO
(SUPERVISOR) (SUPERVISOR)
……………………….. ………………..
DATE DATE
University of Ghana http://ugspace.ug.edu.gh

iii
ABSTRACT
The role of macroeconomics on firm performance has attracted attention of economists for decades
due to the complexity in formulating corporate policies in achieving success among many
organizations. This study aims to examine the relationship between macroeconomics and
performance of firms listed on the Ghana Stock Exchange (GSE). Following literature, ROE and
ROA were selected as proxy for firm performance and suggested independent variables included
were growth in the sales of the firms, total assets, leverage, dividend pay-out, and key
macroeconomic variables (GDP, inflation, interest, and exchange rates) using a panel data running
from 2007 to 2015. The study significantly established a suitable link existing between
macroeconomic variables and firm performance and further argued that macroeconomic variables
alone lack enough explanatory power to explain variations within firm performance but integrating
with financial indicators like firms’ dividend pay-out, growth in company sales, leverage, and total
assets provide a considerable explanatory power. The study further found that whilst inflation
negatively affects ROA, interest rate also negatively affects ROE. The study further establish that
dividend pay-out induces firm performance (both ROE and ROA). The study also finds that
leverage affects firm performance (ROE) negatively whilst it affects ROA positively. Again, the
study found that growth in company sales positively affects firm performance (ROE and ROA).
The number of total assets (SIZE) owned by a company significantly affect its performance
(ROA). The study therefore concluded that macroeconomic variables especially inflation and
interest rates are significant drivers for financial performance among Ghanaian firms and thus, any
variable that affects inflation and/or interest rates will also likely affect firm performance. The
study finally recommends Ghanaian firms to employ relevant information from the domestic and
global economy necessary for designing policies that enhance their performance.
University of Ghana http://ugspace.ug.edu.gh

iv
DEDICATION Great is thy faithfulness! This piece of research work is dedicated to God Almighty, for His
unfailing love towards me. I also dedicate this work to my entire family and friends.
University of Ghana http://ugspace.ug.edu.gh

v
ACKNOWLEDGEMENTS I will like to show appreciation to God almighty for His great mercies in seeing me through as
far as education is concerned. I am forever grateful.
Also, I am very appreciative to my supervisors, Prof. Eric Osei-Assibey and Dr. Monica
Lambon-Quayefio for their immense guidance and aid in seeing this work finally come to
completion.
Lastly, I express my gratitude to my parents for the moral support when the going got tough and
for believing in me enough to support my dream.
University of Ghana http://ugspace.ug.edu.gh

vi
TABLE OF CONTENTS
COVER PAGE …………………………………………………………………………………..i
DECLARATION........................................................................................................................... ii
ABSTRACT ................................................................................................................................. iiii
DEDICATION.............................................................................................................................. iv
ACKNOWLEDGEMENTS ......................................................................................................... v
TABLE OF CONTENTS ........................................................................................................... vii
LIST OF TABLES .................................................................................................................... viiii
LIST OF FIGURES ..................................................................................................................... ix
LIST OF ABBREVIATIONS ...................................................................................................... x
CHAPTER ONE ........................................................................................................................... 1
INTRODUCTION......................................................................................................................... 1
CHAPTER TWO ........................................................................................................................ 12
LITERATURE REVIEW .......................................................................................................... 12
Figure 2.1: Conceptual Framework of Firm Performance ..................................................... 25
CHAPTER THREE .................................................................................................................... 56
OVERVIEW OF FIRM PERFORMANCE IN THE GSE AND MACROECONOMIC
DEVELOPMENT IN GHANA .................................................................................................. 56
Figure 3.1: real GDP growth rates, 1960-2012 (%) ................................................................. 64
Table 3.1: Sectoral Growth Rates and Composition of GDP, 1984-2012 (%)....................... 67
CHAPTER FOUR ....................................................................................................................... 71
DATA AND METHODOLOGY ............................................................................................... 71
Figure 4.1: Framework of Organizational Climate in the GSE ............................................. 73
Table 4.1: Variables of the Models ............................................................................................ 75
University of Ghana http://ugspace.ug.edu.gh

vii
CHAPTER FIVE ........................................................................................................................ 85
PRESENTATION AND DISCUSSIONS OF RESULTS ........................................................ 85
Table 5.1: Descriptive Statistics ................................................................................................. 86
Table 5.2: Correlation Matrix of Variables .............................................................................. 89
Table 5.3: Hausman test for the ROE model ........................................................................... 91
Table 5.4: Hausman test for the ROA model ........................................................................... 92
Table 5.5: Results of Multicollinearity tests ............................................................................. 94
Table 5.6: Results of Multicollinearity Tests after Removing Variables ............................... 95
Table 5.7: Results of Panel Unit Root tests for Variables ...................................................... 96
Table 5.8: Results of Pedroni Co-integration tests .................................................................. 97
Table 5.9: Model Summary and ANOVA F-test ...................................................................... 98
Table 5.10: Coefficient Estimates .............................................................................................. 99
Table 5.11: Model Summary for the Partial Regression ....................................................... 100
Table 5.12: Wald Causality Results ........................................................................................ 102
CHAPTER SIX ......................................................................................................................... 103
SUMMARY, CONCLUSIONS AND POLICY RECOMMENATION ............................... 103
REFERENCES .......................................................................................................................... 108
University of Ghana http://ugspace.ug.edu.gh

viii
LIST OF TABLES
Table 3.1: Sectoral Growth Rates and Composition of GDP, 1984-2012 (%) ............................. 67
Table 4.1: Variables of the Models ............................................................................................... 77
Table 5.1: Descriptive Statistics ................................................................................................... 88
Table 5.2: Correlation Matrix of Variables................................................................................... 91
Table 5.3: Hausman test for the ROE model ................................................................................ 93
Table 5.4: Hausman test for the ROA model ................................................................................ 94
Table 5.5: Results of Multicollinearity tests ................................................................................. 96
Table 5.6: Results of Multicollinearity Tests after Removing Variables ..................................... 97
Table 5.7: Results of Panel Unit Root tests for Variables ........................................................... 98
Table 5.8: Results of Pedroni Co-integration tests ....................................................................... 99
Table 5.9: Model Summary and ANOVA F-test ........................................................................ 100
Table 5.10: Coefficient Estimates ............................................................................................... 101
Table 5.11: Model Summary for the Partial Regression............................................................. 102
Table 5.12: Wald Causality Results ............................................................................................ 104
University of Ghana http://ugspace.ug.edu.gh

ix
LIST OF FIGURES
Figure 2.1: Conceptual Framework of Firm Performance ............................................................ 25
Figure 3.1: real GDP growth rates, 1960-2012 (%) ...................................................................... 66
Figure 4.1: Framework of Organizational Climate in the GSE .................................................... 75
University of Ghana http://ugspace.ug.edu.gh

x
LIST OF ABBREVIATIONS
CARs Cumulative Abnormal Returns
CCS Cost per Client Served
COC Cost of Capital
CPSP Cost Per Service Provided
CROA Critical Business Return on Asset
CTA Cash to Assets
DY Dividend Payment
EPS Earnings Per Share
ETA Expense to Assets
ETS Expense to Sales
GRO Growth in Sales
GSE Ghana Stock Exchange
LP Labour Productivity
MM Miller and Modigliani
MTBV Market-to-Book Value
MVA Market Value Added
NVM Non-Value Maximizing
OCS Operating Cash Flow
OP Operating Profit
OPS Output Per Staff
PE Price Earnings Ratio
PM Profit Margin
University of Ghana http://ugspace.ug.edu.gh

xi
PPE Profit per Employee
ROA Return on Assets
ROCE Return on Capital Employed
ROE Return on Equity
ROFA Return on Fixed Assets
ROI Return on investment
ROR Return on Revenue
ROS Return on Sales
SPE Sales Per Employee
STS Sales to Assets
University of Ghana http://ugspace.ug.edu.gh

1
CHAPTER ONE
INTRODUCTION
1.0 Background of the Study
In business and financial economics, instances of expansion, contraction, and recession are
experienced in a continuous repeated cycle. Across the globe, financial experts and
economists have created models and hypotheses to establish the effect of the cycle on firm
performance and the need to reduce the cycle process. However, they have neglected to
wipe out the cycle which will eventually, keep the current economies from falling into
scenes of emergency.
Microeconomic and macroeconomic factors both influence the performance of an
organization (Issah & Antwi, 2017). Hence, it is basic that organizations have knowledge
about these factors to control their effect on future performance.
The good thing is, Microeconomic factors are controllable, and their impact can, without
much of a stretch, be expected and controlled. However, macroeconomic factors such as
corporate tax rate, inflation, interest rate, exchange rate, and gross domestic product on the
other hand are beyond what an organization can control. Therefore, as suggested by
(Broadstock et al, 2011), it is prudent for organizations to anticipate the heterogeneous
impact of these factors on their future performances
According to (Brown & Ball, 1967; McNamara & Duncan, 1995; Boyd, et al., 2005; Stock
& Watson, 2008; Broadstock et al., 2011; Bailey et al., 2016), Macroeconomics has a
strong impact on the financial situation of firms.
University of Ghana http://ugspace.ug.edu.gh

2
That said, Macroeconomic conditions can affect future performance of firms and so should
be included in predicting firm performance. But organizations should be wary of this since
the importance of macroeconomic factors may vary from industry to industry and may not
generally anticipate future performance for specific firms (Broadstock, et al., 2011) and we
can see this in the following two paragraphs:
In recent times, the economy of Ghana has been experiencing an exponential growth with
Gross Domestic Product (GDP) surging higher and expected to top the African economy
in 2018 (World Bank, 2017). However, the strong GDP is influenced by many competitive
and robust industries including finance and insurance.
(Ismail et al. 2018) argue that Gross Domestic Product (GDP) and Interest Rate (IR)
strongly affect firm performance while Consumer Price Index (CPI) gives less impact
towards firm performance.
Aside microeconomic and macroeconomic factors, the issue of dividend pay-out is one of
the exceptionally fundamental components in financial economics that can hardly be
ignored.
Dividend pay-out defines the directions and rules that an organization depend upon in
settling on decisions concerning investors’ dividend (Nissim & Ziv, 2001).
Also, Dividend pay-out can be thought of as comprising the essential components that
constitute the policies firms use in disbursing investment profits.
Furthermore, dividend, which is basically the upside of investors as a by-product of the
associated risk is dictated by different components. Fundamentally, these elements
University of Ghana http://ugspace.ug.edu.gh
3
assimilate: Financing constraints, Investment shots and decisions, Firm size, Weight from
shareholders and Administrative regulations.
Notwithstanding, the dividend pay-out of a firm not just fills in as the fountainhead of
income to shareholders but also provides data pinpointing present and future performance
of the firm.
(Pandey, 2005) asserts that Improving shareholders' resources and benefits are the
significant destinations firms.
According to (Azhagaiah & Priya, 2008), Shareholder’s resources is principally impacted
by development in deals, change in net revenue, capital investment decisions and capital
structure decisions. For this situation, the potency of a firm to improve its shareholders'
resources and the ability of a firm to produce dividend from the capital contributed by
shareholders determines its performance level. The dividend pay-out can influence firm
performance and subsequently, the abundance of shareholders (Baker, 2007).
Dividend decision is one of the four essential judgement areas that figure out how much
funds flow to investors and how much is reserved for the firm (Ross, et al., 2002). In this
way, they give data to partners regarding the organization's performance. The cost of
capital, future incomes and key dividends are influenced by investments made firms.
(Foong, et al., 2007).
Dividend pay-out is consequently, thought to be a standout amongst the most vital financial
related decisions that corporate administrators experience (Baker, 2007).
University of Ghana http://ugspace.ug.edu.gh

4
As per (Omran and Pointon, 2004). It has key ramifications at share costs and thus comes
back to investors, development financing and the value base via maintenances in addition
to use and adaption.
There is a developing agreement that there exists not a singular clarification of dividends.
(Brook et al., 1998) indicate that numerous determinants of macroeconomics exist.
(Frankfurtet and McGoun, 2000) argues that dividend pay-out highlights the issue of
management as a standout amongst the most difficult themes of current financial matters.
(Mizuno, 2007) consents to the way that a firm should pay dividends to shareholders on
the off chance that it fails to recognize reasonable investments which would bring higher
returns to shareholders.
Dividend pay-out to shareholders fluctuates in real financial sense regardless of whether to
pay financial dividend or issue additional offers depending on the terms of the investment
provided by the organization. Dividend pay-out is normally met by the organization from
its cash flow and income (Ahmed and Javid, 2009).
The extent of dividend paid to the aggregate income is alluded to as pay-out proportion. A
high pay-out quota indicates the faith of the administration of the firm in the fortitude and
growth of income in the future whereas a low pay-out quota recommends that
administration is uncertain of the security governing the investment (Arnott and Asness,
2003).
University of Ghana http://ugspace.ug.edu.gh

5
The bigger the extent of dividend paid, the less finances are held for investments and the
more the organization should move to alternative wellsprings of assets, for example, issue
of extra offers and additional funds to feasible activities (Sindhu, 2014).
Consequently, the decision between paying dividend and holding income is considered
important by the two financial specialists and administration and has been the subject of
extensive research by market analysts for a few years back (John and Muthusamy, 2013).
And here’s how the question concerning the relationship between dividends and firm
performance was answered.
Numerous studies have demonstrated differences in perspective of whether dividend pay-
out really influences firm performance and long-term share costs. (Dhanani, 2005) utilized
a “survey approach” and found that dividend pay-out serves to improve performance of
firms.
In any case, some contend that empirical findings that exist to establish a causal
relationship between firm performance and dividends are conducted depending on brief
timeframes and are along these lines deluding to key investors (Farsio, Geary and Moser,
2004). Henceforth, dividends have no informative energy to anticipate future performance.
1.1 Statement of the Problem
Firm performance as an area of study has undergone extensible study by many economists
and finance scholars with attempts to establish theories and models that promise to provide
an accurate estimate. However, loopholes still exist.
University of Ghana http://ugspace.ug.edu.gh

6
Considerable empirical studies have been done to find the relationship between firm
performance and macroeconomic factors (Ali, Klein, and Rosenfeld, 1992; Barakat,
Elgazzar and Hanafy, 2016; Broadstock et al., 2011; Caird and Emanuel, 1981; Clare and
Thomas, 1994; Ibrahim and Aziz, 2003; Kandir, 2008; McNamara and Duncan, 1995;
Stock and Watson, 2008).
Nevertheless, as stated by (Abor and Bokpin, 2010), discoveries of these studies have not
been able to form any clear link concerning this issue. Nearly all these studies lean to
developed markets with very little focus on how macroeconomic factors influence firm’s
performance in markets that are coming to the fore.
It was observed from these studies that firms in emerging markets exhibit different
behaviour from those of developed markets (Black and Scholes, 1974; Frankfurter et al.,
2002; Amidu, 2007).
This may be born out of the vast dissimilarities in efficiency level and institutional
arrangements of developed and emerging markets. As a result, it is convenient to
ameliorate our comprehension of the matter from the position of emerging markets (Abor
& Bokpin, 2010).
(Aivazian, Booth and Clearly, 2003) postulate that firms found in emerging markets tend
to have high financial constraints and therefore are highly reactive to some macroeconomic
indicators that are proposed by research in developed markets. With this conception, it is
critical to scrutinize the overview of firm performance in emerging markets in the macro
economical context.
University of Ghana http://ugspace.ug.edu.gh

7
Despite the contradicting views on the relationship between macroeconomics and firms’
performance globally, few empirical evidence exist in Ghana and even those that exist are
limited to few firms such as banking and manufacturing firms (Amidu & Abor, 2006;
Amidu, 2007).
Moreover, most of these studies develop their models with a focus on internal factors using
ratio analysis to interpret and evaluate financial statements to make investment decisions
and measure the performance of the firms (Lev, 1974; Molinero, Bishop and Turner, 2005;
Altman, 1968; Altman, Haldeman and Narayanan, 1977; Beaver, 1966; Bunyaminu and
Issah, 2012; Ohlson, 2012; 1980, Wang and Campbel, 2010).
These studies have therefore endeavoured to establish the relationship between the return
of assets to the internal rate of return (Solomon, 1966; Vatter, 1966; Livingstone and
Salamon, 1970) and try to match the rate of performance equity with conventional concepts
of value (Brief and Lawson, 1992; Penman, 1991).
A recurrent feature of many past studies is that they fail to explicitly include external
information such as macroeconomic indicators’ influence. It is possible that the
disaggregation of the results in components identifies, in a minimized form, the links with
these external factors of the profitability of the companies. Nevertheless, (Li, Richardson
and Tuna, 2012), are of the view that they are not explicit regarding these external factors.
Essentially, the relationship between firm performances should be based on an integrated
model which include both key external factors (macroeconomic factors) and internally
related factors (financial related factors) that anticipate an upward adjustment toward future
performance.
University of Ghana http://ugspace.ug.edu.gh

8
By this, the study seeks to examine the relationship between macroeconomics and firms’
performances by considering data from 2007 to 2015 which were gathered from important
macroeconomic factors from the Ghana Stock Exchange (GSE) bearing in mind all types
of firms and industries on the Ghana Stock Exchange (GSE).
It will also attempt to fill the gap that happens to be present in establishing the link between
macroeconomics and performance of firms in Ghana, an emerging market as few studies
have considered.
1.2 Research Objectives
The study aims at investigating the impact of macroeconomic factors and dividend pay-out
on performance of firms listed on the GSE. It will also look at whether the effect can help
predict future performance with a focus on absolute values.
To wholly address the overall goal of the study, the following intents will be specifically
investigated:
University of Ghana http://ugspace.ug.edu.gh

9
1. Determining the relationship that exists between firm performance and key
macroeconomic variables such as corporate tax rate, inflation, interest rate, exchange
rate, and gross domestic product
2. Determining the effect of dividend pay-out on firm performance
3. Exploring the causality between firm performance and significant macroeconomic
variables;
1.3 Research Questions
In line with the objectives of the study, the pertinent questions that will need answers are
as follows:
1 What relationship exists between firm performance and key macroeconomic variables
such as corporate tax rate, inflation, interest rate, exchange rate, and gross domestic
product?
2 What is the effect of dividend pay-out on firm performance?
3 Is there a causality effect between firm performance and key significant
macroeconomic variables?
1.4 Research Hypotheses
H1: No meaningful relationship exists between key macroeconomic variables and
performance of firms listed on the GSE
H2: Dividend pay-out has no significant effect on performance of firms listed on the GSE
University of Ghana http://ugspace.ug.edu.gh

10
H3: No significant causality effect exists between performances of firms listed on the GSE
against key macroeconomic variables
1.5 Scope of the study
The purpose of the study is to examine the relationship between macroeconomic factors
and performance firms listed on the GSE. Thus, macroeconomic factors and firms’
performances will be the focus of this study. It will also be limited to only selected firms
(from all the sectors) listed on the GSE.
1.6 Significance of the study
The outcome of this study significantly introduces a simple framework to identify and
exploit relationships between key macroeconomic factors and performance of firms listed
on the GSE. This will assist financial managers in developing economic policies in order
to predict future performance from current performance and trend in macroeconomic
conditions. It will also enable firms to be successful and retain businesses for a long term.
Additionally, this study will add up to literature in the field since it will serve as a pool of
information or reference point to policy makers, researchers, and other stakeholders in
attempt to study or formulate policies and regulations to improve the operations of firms
and industries in Ghana.
University of Ghana http://ugspace.ug.edu.gh

11
1.7 Organization of the study
The study is made up of six chapters. The first chapter, introduction, is devoted to:
Background to the study, Problem statement, Objective of the study, Research questions
Significance of the study and Organization of the study.
Chapter Two deals with: Literature review on concepts, Theories and Empirical evidences
relevant to the study.
The third chapter discusses an overview of firm performance in the GSE within the
economy of Ghana. The chapter presents the history and performance of the GSE and adds
up to the discussion, the role of the GSE in developing the economy of Ghana as well as
the effect of macroeconomics on performance of the GSE and concludes with a preview of
the performance of its listed firms.
Chapter Four elaborates on the methodology employed. It encompasses issues such as;
research design, sampling procedure and size, instrument and data collection tools, data
analysis and ethical issues.
Chapter Five presents the data, analysis and the discussions of the results.
The concluding chapter summarizes the findings of the study as well as conclusions and
recommendations.
University of Ghana http://ugspace.ug.edu.gh

12
CHAPTER TWO
LITERATURE REVIEW
2.0 Introduction
This chapter discusses previous studies conducted in line with the link between
macroeconomics and firm performance. The chapter begins by defining the concepts of
stock exchange and firm performance that illuminate the objectives developed for this
study.
It will then discuss the conceptual framework that serves the backbone of firm performance
and how vital it is to the success of a firm. The chapter further defines the determinants
and measurement of firm performance. It also goes on to analyse the factors that affect firm
performance.
Finally, empirical review of the subject matter is discussed upon which I have made a
contribution for further analysis.
2.1 Theoretical Review
In estimating firm performance, this study adopts a mix of theories underpinning the effect
of macroeconomic factors such as: Purchasing Power Parity theory, Arbitrage pricing
theory, Market Segmentation theory and Monetarism theory.
The second set of theories supporting the effect of dividend pay-out which will be
considered as well includes: Agency theory, Signaling theory, Bird in hand theory and
Dividend Irrelevance theory on firm performance.
University of Ghana http://ugspace.ug.edu.gh

13
2.1.1 Purchasing Power Parity Theory (PPP)
The above is a model which decides the exchange rate between various currencies. It
expresses that it is the adjustments in value levels in nations over a given timeframe that at
last decides the exchange rate between their currencies.
The theory can be referred as the inflationary theory of exchange rate because it spikes
changes in level of costs as the primary component of developments in exchange rate. The
PPP is categorized absolute or relative. Whiles Absolute PPP describes the scenario where
local money maintains the same purchasing power when exchanged to international money
according to (Coakley et al., 2005), (Coakley et al., 2005) also further contemplated that
local money ought to have the capacity to purchase same quantity of products across the
globe.
Relative PPP on the other hand, expresses that variety in national costs truly reflects
changes between countries.
In view of this, PPP was embraced in this study since most firms listed in the GSE are
affected by exchange rate changes.
2.1.2 Arbitrage Pricing Theory
Assets are normally priced with their associated risks; this theory explains how this is done.
The theory recommended by (Ross, 1976) has been one of the key theories of asset pricing.
As expressed by (Sharpe, 1964), APT appears as a capital asset price model (CAPM).
University of Ghana http://ugspace.ug.edu.gh

14
And so while the CAPM argues that firm performance are dictated by a single factor, APT
on the other hand, says that they are really decided by multiple factors which
macroeconomic factors are not exception.
The substance of this theory in straightforward terms, expresses that the performance of
firms relies upon numerous elements. However, APT does not express the exact associated
factors. For example, (Ross, 1976) analyzed the impact of four factors and in the end
recommended that APT ought not to be limited to these four factors because along these
lines, there have been a substantial group of exact investigations that have included a wide
range of factors.
In this study, four macroeconomic factors were incorporated to look at their effect on the
performance of GSE listed firms. Likewise, researchers address difficulties in
distinguishing factors that are significant determinants in clarifying vacillations of
organizations. (Chen and Scott, 2004) even back this when they say that “Indeed, even with
these difficulties, researchers can pick some factors, but their choice must be founded on a
tried and tested theory.”
2.1.3 Market Segmentation Theory
This is a modern theory that tries to explain interest rates phenomenon. It states that no
correlation exists whatsoever amid interest rates which are short and long in nature.
Markets which are short and long in time can be categorized into two diverse groups. So
University of Ghana http://ugspace.ug.edu.gh

15
in line with this, the yield curve will take its shape according to the supply and demand of
securities within each group, whether long or short.
This theory is also referred to as the "Segmented Markets Theory". This school of thought
presupposes that majority of investors already have an inclination with respect to length of
developments that they intend to invest in. This principle asserts that the participants in
each of the distinctive development lengths cannot be effortlessly substituted for each other
as they have different preferences.
An offshoot emanating from this theory advocates where an investor decides to put their
capital outside their preferred term, say from short to long, they must earn higher return for
taking on the additional risk. This is what has been called the Preferred Habitat Theory
which also throws light on the point that the worth of a security is always a function of the
present value of the future cash flows related to it.
Discounting the expected future cash flows; using a discounting rate from the market gives
you the present value of those cash flows expected to be generated in the future. Demand
and supply of money in the economy possess a direct connection with the rate in which it
discounts its securities and, with the current worth of cash flows.
According to (Sellin, 2005), demand and supply of money will ultimately influence the
prices of stock if the alteration in the demand and supply of money adjusts the anticipations
of investors about forthcoming policies - especially the ones relating to money. He argues
further that an encouraging supply of money will prompt investors to anticipate tighter
fiscal measures in the future. As a result, the interest rate goes up and so will the discount
rate. Furthermore, the present value of future earnings decline bringing down the stock
University of Ghana http://ugspace.ug.edu.gh

16
prices, as often noted, the level of economic activities declines as interest rates rise, further
depressing securities prices.
Another school of thought contends that a positive cash supply stun will push up the cost
of stocks. They argue that adjusting cash supply gives signal on cash request, which thus
is brought about by future yield anticipation, supply of money increase as a response to
increased demand and signaling an increase in commercial activity. Since with commercial
actions, cash flows increase and therefore pushes up the stock prices (Sellin, 2005).
Therefore, the value of stock prices is affected by money supply as it has a direct impact
on the interest rate.
What's more, this school of thought believes that real interest rate rises as money supply is
tightened. (Bernanke and Kuttner, 2005), say that interests rate triggers a rise in the
discount rate as well and in turn leads to decline the value of the stock. These experts trust
that a policy fixing the demand and supply of money aims at declining the rate of
commercial activity and therefore minimize the chances of firms to perform better.
2.1.4 Monetarism Theory
According to the monetarism theory, inflation defines a fiscal issue which is constantly
persistent. This theory additionally says that the measure of cash that exists will decide the
measure of cash that individuals spend. This is of the notion that cost of things will go up
just when the supply of goods is lower than its demand. Thus, the cost of things will
probably go down if the demand for goods is lower than its supply.
This theory further argues that the measure of spending is controlled by the measure of
cash available for use provided the demand for goods can be dictated by ascertaining the
University of Ghana http://ugspace.ug.edu.gh

17
measure of the available cash. Because of this theory, one could accept that if the measure
of available cash goes up so does the measure of spending depending on buyer demand.
Utilizing this theory, the main reason that costs would go up is when the measure of cash
available goes up.
2.1.5 Agency theory
This concept proposes that dividend falls under the control of costs coming from distinctive
proprietorship and control. Supervisors in general may not adopt a dividend plan that
simply favors investors but would pick one that amplifies their personal advantages.
Influencing dividend pay outs which decreases the free cash that managers have access to
would along these lines guarantee that investors get the most out of their investments as
opposed to utilizing the assets for their private advantages (DeAngelo and DeAngelo,
2006). During the time spent drawing in new value, firms keep themselves to the observing
and training of these business sectors.
The theory also expresses that administrators of firms are probably going to take part in
Non-Value Maximizing (NVM) conduct. (Jensen and Meckling, 1976) assert that should a
manager’s wealth be linked to the firm’s basic value cost, these expenses could be
decreased. In this way, administrative responsibility for (insider property) could fill in as a
cost decreasing instrument, expanding the estimation of the firm.
But then again, (Easterbrook, 1984) contends that dividends diminish the over venture
issue claiming the installment of dividends expands the recurrence with which firms need
to advertise, keeping in mind the end goal to raise extra capital. During the time spent
University of Ghana http://ugspace.ug.edu.gh

18
drawing in new value, firms bring themselves to the checking and teaching of these
business sectors because this brings down cost.
2.1.6 Signaling Theory
This philosophy recommends that dividend can be utilized as a key to inform investors
about a company's future performance expectations. Dividend declarations pass on
important data about the appraisal of a firm's future performance indicators which investors
have limited access to. Investors may accordingly price the cost of a company’s offer
utilizing this data.
Instinctually, this flies at the back of data inconsistency amongst directors and investors.
As (Al-Kuwari, 2009) puts it, dividend under this model is applicable where supervisors
have classified data about the present and future fortunes of the firm that investors have
limited access to.
Also, as per the data substance of dividend, firms may consistently pay dividends so as to
pull in more speculators (Amidu, 2007). In such an instance, there is a motivating force to
convey this information to the market.
As argued by (John and William, 1985), and (Miller and Rock, 1985), the fact that
investors may have differing data from that of firms may instigate a flagging part for
dividends. They demonstrate that dividend installments convey confidential data in a
completely noteworthy way. The most essential component of the theory is that
organizations need to pay dividends frequently. A declaration of dividends increment is
received as uplifting news and in like manner the offer cost responds positively, and as
well as for the other way around.
University of Ghana http://ugspace.ug.edu.gh
19
Similarly, firms can send signs of performance to the market through dividends. In this
way, a comparative thinking applies to intermittent offer purchases.
2.1.7 Bird in hand theory
With this model, experts acclaim that a relationship exists between firm performance and
dividend pay-out. This model explains that dividends are safer than additions to capital,
thus, investors would in this way favor dividends rather than additions to capital, (Amidu,
2007).
Additionally, the theory argues that investors favor a higher dividend strategy (Lintner,
1962; Gordon, 1963). Consequently, they will pick dividends over capital increases.
Assuming this is the case, investors would place high value on firms whose dividend pay-
out are high.
This theory has a fall on the basis that it is set in an entire and ideal market where investors
act as indicated by thoughts of reasonable practices (Miller and Modigliani, 1961;
Bhattacharya, 1979).
University of Ghana http://ugspace.ug.edu.gh

20
2.1.8 Dividend Irrelevance Theory
Investors do not really mind between dividends and maintenance-created capital increases.
Where money is needed, stocks can be offered and, in the event, that they have enough
money and want to invest, they can utilize dividends to purchase stock.
However, (Miller and Modigliani, 1961) suggested that dividend is unimportant to the
investor with the view that investor profit is unaltered when all parts of venture are settled
and any expansion in the present pay-out is financed by reasonably estimated stock deals.
This theory depends on improbable presumptions that the estimation of the firm is
unaffected by its policy in a universe of impeccable economic situations (Miller and
Modigliani, 1961), the authors thus concluded that the issue of dividend policy is not
relevant.
University of Ghana http://ugspace.ug.edu.gh

21
2.2 Definition of Concepts
2.2.1 Stock Exchange/Market
(Lins, 2014) defines Stock Exchange/Market as a controlled market which allows trading
of securities at prices aggregated by supply and demand. Fundamentally, stock exchanges
fill in as:
(1) Essential markets within which enterprises, governments, regions, and other bodies can
create capital by directing investors’ reserve funds into profitable endeavors; and
(2) Optional markets that create avenue for investors to pitch securities among themselves
for money, hence decreasing dangers of venture and keeping up liquidity within the
framework. Stock exchanges force strict guidelines, posting prerequisites, and statutory
necessities which are official on all parties listed.
Established exchanges are managed on the exchanging floor of the trade itself, by yelling
requests and guidelines (known as open objection framework).
Nowadays, exchanges are managed over phone or on the web. All exchanges are 'closeout
exchanges' where the place purchasers enter aggressive offers and dealers enter focused
requests through an exchanging day. Some European exchanges, be that as it may, utilize
'occasional sale' technique in which round-robin calls are made once on exchanging day.
Even though Amsterdam Stock Exchange which was the principal stock exchange opened
in 1602, the three biggest exchanges are the: New York Stock Exchange (NYSE), London
Stock Exchange (LSE) and Tokyo Stock Exchange (TSE).
University of Ghana http://ugspace.ug.edu.gh

22
2.2.2 Firm Performance
In recent times, performance of organizations is the first to be assessed by investors and
with the advent of globalization as one might say, trading can be done anywhere without
various boundaries existing in corporate exchange and financial venture. As a result,
organizations have a more extensive chance to develop.
In the same vein, with noteworthy spread of innovations in technology, people determined
to accomplish their goals anywhere in the world are motivated to seek after organizations
in any parts of the earth that have evidence of performing highly for investment. Hence,
performance of an organization is extremely critical in attracting investors (Kaid and
Hanim, 2014).
Financial performance indicates how great is the situation of a firm, and how effectively a
firm is utilizing its resources to gain a bigger number of incomes than to acquire cost and
grow its activities (Copisarow, 2000).
To (Rouf, 2011), what firms offer to investors is easily projected as the value of a firm and
this carries with it a lot of advantages. So, this is why the performance of a firm can be
identified from the organizations’ detailed financial statements.
Besides, an organization characterized by high performance will strengthen administration
for quality exposure as argued by (Herly and Sisnuhadi, 2011), hence diverse systems will
be utilized to quantify financial performance. Moreover, income from operational
exercises, add up to units sold so a piece of a firm’s pie can be a marker of performance.
University of Ghana http://ugspace.ug.edu.gh

23
As indicated by (Demsetz and Lehn, 1985) financial ratios figured by utilizing financial
statements are a decent method to assess financial performance consequently liquidity is
the most vital ratio used to assess the capacity of a firm to encounter financial challenges.
2.3 Conceptual Framework of Firm Performance
Firm performance is the ability of a firm to support its long-term benefit. There exists, two
viewpoints to such ability, general and intrinsic dimensions.
The general dimension alludes first to auxiliary components that characterize the
environment in which a firm operates (i.e., national level), for instance, the administrative
system of a given nation and level of global exchange.
A second segment of the general dimension is industry-related factors; for instance, the
level of venture on R&D in a specific area or the level of industry focus. The influence of
macroeconomic dimensions such as inflation, gross domestic product, interest rate, and
exchange rate are considered the third component of the general dimension.
The intrinsic dimension on the other hand also alludes to individual firm practices which
enable them to maintain their performance in the long term. These incorporate:
Governance, Organizational, Functional, Sustainability, Talent development and Digital
factors.
Governance here concerns every one of the practices, procedures and structures essential
for the successful administering of the firm; for instance, the satisfaction of the directorate
key part. The organizational factor proposes practices and procedures that take into
University of Ghana http://ugspace.ug.edu.gh

24
consideration the well-working of the administration of an organization, for instance,
capacity of the administration group to adjust the company's system to advertise changes.
The functional factor is identified with the association's operational procedures; for
instance, promoting techniques and advancement. The sustainability, talent advancement
and digital factors concerns forms that empower firms to guarantee the viability of its
governance, organizational and functional factors; for example, activities that empower
firms to develop a coordinated structure to stay competitive in the global market.
Figure 2.1 illustrates the conceptual framework of firm performance. Firm performance is
a result of structural, industry, macroeconomics and intrinsic factors. In other words, the
intrinsic factors incorporate the abilities of a specific firm, which in turn blends with the
structural, industry, and macroeconomic factors affect firms’ performance.
The relationship among these factors might be strong and this suggests that organizations
facing high competition must execute certain practices and build internal procedures which
strongly improve their performance.
University of Ghana http://ugspace.ug.edu.gh

25
Figure 2.1: Conceptual Framework of Firm Performance
2.4 Importance of Firm Performance
According to (Demirbag, et al, 2006), Performance measurement is basic and fundamental
for effective firm management. Such a procedure cannot be conceived without measuring
the expected results. Thus, firms need to utilize internal resources to improve their
performance (Gadenne and Sharma, 2002).
Dimensions
Firm
performance
Intrinsic
Dimensions
Organizational Factors
Industry Factors
Structural Factors
Sustainability Factors
Functional Factors
Governance Factors
Macroeconomic Factors
University of Ghana http://ugspace.ug.edu.gh

26
Again, the success of a firm is fundamentally clarified by its performance over a given
timeframe. Performance measurement empowers firms to compare their performance over
different timeframes. Nevertheless, no peculiar accurate measurement of performance has
been given till now due to the diverse dimension of firm's performance.
Studies have shown that firm performance is considerably affected by corporate
governance. Thus, where capacities are properly settled for the corporate governance
framework, it draws in investment and aides to improve the resources of firms, fortifying
the pillars of the firm to elevate performance of the firm.
In effect, a proper corporate governance shields against plausible financial constraints and
encourages striking development subsequently assuming a key role in growing firm
performance prompting its review on the overall success of firms as argued by (Ehikioya,
2009).
2.5 Measurement of Firm Performance
Having a yardstick to measure or determine the performance of a firm aids in gathering
firm progress reports, improving motivation and communication as well as pinpointing
problems in the firm.
Principally, the idea of performance constitutes the backbone of strategic management and
the utilization of business performance to review content on business management and this
has been the focus of most strategy studies. Numerous research devoted to management
University of Ghana http://ugspace.ug.edu.gh

27
structures and its connection with financial performance was exceptionally subject to
accounting-based indicators.
A significant number of methods have been presented to quantify financial performance
and among them are: Return on Assets (ROA), Return on Equity (ROE) Tobin-Q, Profit
Margin (PM), Earnings Per Share (EPS), Dividend Yield (DY), Price-Earnings Ratio (PE),
Return on Sales (ROS), Expense to Assets (ETA), Cash to Assets (CTA), Sales to Assets
(STS), Expenses to Sale (ETS).
Abnormal returns including: Annual Stock Return, (RET), Operating Cash Flow (OCF),
Return on Capital Employed (ROCE), Labor profitability (LP), Critical business Return on
Asset (CROA), Cost of Capital (COC), Market Value Added (MVA), Operation Profit
(OP), Return on Investment (ROI), Market-to-book esteem (MTBV), Log of market
capitalization, LOSS Growth in Sales (GRO), Stock Repurchases, Sales Per Employee
(SPE), Return on income (ROR), Output per staff (OPS), Cost Per Service Provided
(CPSP) and Cost per Client Served (CCS), Cumulative Abnormal Returns (CARs), Profit
per Employee (PPE) and Return on Fixed Assets (ROFA) among others.
2.5.1 Accounting Based Measurement
This type measures the organization's benefits as the business of the firms is contrasted
with benchmark rate of return equivalent to the risk involved.
These measurements point to the profitability of firms in the preceding years, example are:
(ROA), (ROE), (ROS), (PM), (ROI), (OCF), (EPS), (OP), (GRO), (ROCE), (ETA), (CTA),
(STS) and others are in this manner expounded.
University of Ghana http://ugspace.ug.edu.gh

28
When it comes to profitability, its measure is criticized for being backward looking and its
incomplete measurement of future instances with regards to devaluation and amortization.
Adding to it, profitability as the accountant measures is constrained by models set up by
the calling and is henceforth affected by numerous unique techniques employed in the
evaluation of well-defined and elusive resources by accountants as proposed by
(Kapopoulos and Lazaretou, 2007).
Likewise, Return on Assets (ROA), checks the working and financial performance of the
firm according to (Klapper and Love, 2002). The measurement is with the goal that a higher
ROA shows effective utilization of resources for the upside of investors in the view of
(Haniffa and Huduib, 2006) as well as mirrors the organization’s utilization of its
advantages in serving the fiscal interests of investors according to (Ibrahim and
AbdulSamad, 2011).
Accounting based performance measures is preferred over market-based measures when
the connection between firm performance and corporate management is examined as the
former exhibit results of management activities as per (Hutchinson and Gul, 2004) and
(Mashayekhi and Bazazb, 2008).
Subsequently, a negative performance shows disappointment of the arranged elite which
requires modification of plans to improve performance. The negative performance brings
about investors' misfortune. The organization in this manner needs to refresh its goals to
contend in the market, the opposite holds for a positive ROA as argued by (Nuryanah and
Islam, 2011).
University of Ghana http://ugspace.ug.edu.gh

29
Also, Returns on Equity is another accounting-based measurement which considers the
after tax profit over total equity shares issued.
Many studies including (Azam, et al, 2011; Khan, et al, 2011; Pandya, 2011; Najid and
Abdul Rahman, 2011; Shahab-u-Din and Javid, 2011; Bozcuk, 2011; Lin, 2011; Chiang
and Lin, 2011; Chahine and Safieddine, 2011) have employed this type of measurement.
2.5.2 Market Based Measurement
This second kind is the market-based measurement and it is classified in a long-term case
like Tobin's Q, (MVA), (MTBV), (RET), (DY) to mention but few.
The market-based measurement is described by its forward-looking viewpoint and its
impression of the desires for investors concerning the firm's future performance, which has
its premise on past or current performance according to (Wahla, et al, 2012; Shan and
McIver Ron, 2011; and Ganguli and Agrawal, 2009).
(Sánchez-Ballesta and García-Meca, 2007) propose that market-based desires for firm
performance may bring about administration motivation to alter their holdings based on
what they desire to achieve in the future as far as performance is concerned. Therefore,
where the organization's market-based performance exceeds the aftereffects of Tobin's Q,
this demonstrates that the organization is prevailing with regards to accomplishing its
arranged superior (Nuryanah and Islam, 2011).
Yet, in the event that it is not as much as Tobin's Q, at that point the organization needs to
amend its intends to improve its fleeting performance. The negative performance prompts
financial specialist's misfortune (nearby and remote) and consequently, it is essential for
University of Ghana http://ugspace.ug.edu.gh

30
the organization to refresh its targets occasionally in the event that it is covetous of
contending in the commercial center.
2.6 Factors Affecting Firm Performance
Admittedly, several factors work together to affect the performance of a firm but for this
study, this section focuses on discussing the influence of macroeconomic, microeconomic,
and financial factors on firm performance to investigate the key factors that affect
performance of firms.
2.6.1 Macroeconomic Factors
Macroeconomic factors constitute the uncontrollable external factors that affect firm
performance. Studies have shown that exchange rate, interest rate, gross domestic product,
and inflation are the key macroeconomic factors that affect firm performance
Exchange Rate
Prior to 1972, many trading nations operated a fixed regime in terms of exchange rates and
each country had affixed currency exchange rate to the US dollar. After 1972, the exchange
rate regime was liberalized i.e. no more fixed rate relative to the US dollar. This change
however, became a key sympathy toward the financial specialists, expert, supervisors and
shareholders as the exchange rates became fluid. This therefore meant that the cost of
monetary forms is controlled by free market activity of the cash in the open forex markets.
As the supply and demand of various currencies is a function of various outside and inward
variables, this new framework is dependable for wide currency fluctuations according to
University of Ghana http://ugspace.ug.edu.gh

31
(Abor, 2005). Firms therefore face foreign exchange risk because of these fluctuations.
Moreover, the world is becoming a global village and more economies are opened causing
more exposure to foreign exchange rate fluctuations.
Firms face three types of risks associated with foreign exchange which include; translation
exposure, transaction exposure and economic exposure (Eiteman et al., 2006).
Interest Rate
Liquidity theory takes the view that the interest rate is a coupon rewarded for the
inconvenience for having to part with an asset which is very liquid in this instance cash.
Since interest rate is sometimes seen as an element of pay, its essential part is to aid in
mobilizing financial resources into a pool and create an environment of efficient utilization
to promote economic growth and development (Ngugi, 2001).
Interest can also be the rent paid for money. It assesses the rate of return that is anticipated
by the money lenders for having given out their assets. The interest rate should therefore
incorporate all the data in regard to any future changes in the purchasing power and the
risk component.
As per (Crowley, 2007), interest rate is the cost at which the borrower pays for the
utilization of cash money borrowed from the intermediaries. In a way, it is the charge paid
for the utilization of obtained resources.
University of Ghana http://ugspace.ug.edu.gh

32
Fluctuations in interest rate expose firm’s financial position to this very real risk. Wild
fluctuations in interest rate pose very critical dangers to an association's profit and capital
base changes. It also increases by a huge percentage its functional expenses and higher
interest rates may also negatively influence the basic estimation of benefits, liabilities and
present estimation of future money streams that re discounted.
Inflation
Inflation refers to the change whether up or down in the overall price levels of goods and
services in an economy for a given period.
The changes in prices of goods and services directly and significantly affect the purchasing
power of money as well as the cost of production in the manufacture of the same goods
and services. The effects of inflation can be seen from two angles; the effect on the
aggregate demand and on the cost of production.
When the inflation rate is high, consumers who have fixed incomes have a lower
purchasing power as the value of money is reduced. This will ultimately lead reduced
demand for goods and services. On the other hand, inflation pushes up the cost of
production hence affecting the bottom line of firms. The nominal interest rate is made up
of real interest rate and the inflation rate and therefore change in line with changes in the
inflation rate. This is referred to as the Fisher effect.
University of Ghana http://ugspace.ug.edu.gh

33
(Pandey, 2009) on the other hand suggests that if capital markets operating within countries
were perfect, then even in different markets, investments with equal risk should ideally
offer equal return. This is as per the arbitrage principle, proposing development of assets
starting with one market then onto the next consistently until harmony is accomplished.
If the genuine return rates are the similar in two nations, then, according to the fisher
impact, the ostensible rates of intrigue would alter precisely for the adjustment in the
expansion rates.
(Vong and Chan, 2009) contend that exact confirmation on what lies amongst expansion
and productivity is uncertain therefore there is the need investigate it.
Gross Domestic Product (GDP)
Every economy in the world today experiences some cyclic fluctuations in their
performance as shown by periods of boom and recession. As per (Athanosoglou et al,
2005), in periods of booms, an economy is thriving and demand for credit is high and the
opposite is true during recession.
(Ongore and Kusa, 2013) in their banking sector report, argue that when the GDP growth
is declining, demand for credit falls significantly and this negatively affects the profitability
of banks.
But on the other hand, when the economy is witnessing positive and increasing GDP,
demand for credit increases substantially thereby leading to growth in profitability.
University of Ghana http://ugspace.ug.edu.gh

34
2.6.2 Microeconomic Factors
(Hunjra et al., 2014) utilised panel data analysis to determine the factors affecting firm
performance and realized that three microeconomic variables including Size, Age, and
Growth have considerable influence on how companies perform.
According to the authors, all three microeconomic factors have positive influence on firm
performance.
Firm age as a decent determinant of firm performance demonstrates the experience of the
firms and are able to find what they are great at and figure out how to wind up proficient
with time.
Firms institutionalize and accelerate their generation procedure by getting specialization
after some time (Ericson and Pakes, 1995). Hence with the progression of time, weakest
firms are killed from the market because of choice impact which happens because of rivalry
and other operational weight. As the quantity of firms diminish with time rest of the
organizations confront high market request which brings about the expanded profitability
level.
Status manage, and hierarchical memory is another idea which clarifies the connection
amongst age and performance. Workers with the status of position emerge with time which
crumbles the performance of the firm (Katz, 1982) and senior representatives get to take
advantage over the recently coming workers adding further to the crumbling.
As indicated by (Easterbrook and Fischel, 1999) as the age of the firm expands, it comes
about into high likelihood of takeover. Recently recorded firms begin small and this shields
University of Ghana http://ugspace.ug.edu.gh
35
them against showcase takeover. (Kipesha, 2013) postulates that age demonstrates
experience of organizations and it positively affects manageability, income level,
proficiency however negative effect on benefit.
And (Campa and Kedia, 2002), state that the connection amongst age and performance
likewise gets influenced by the expansion because age is emphatically identified with
broadening whereas adversely to performance.
What's more, firm size affects performance because of the points of interest and burdens
which firms face at a level of development. As said by (Yang and Chen, 2009), bigger
firms are effectively ready to get capital for venture because of their size of activities.
(Liargavas and Skandalis, 2008) established that size impacts the organizations
performance and so bigger firms are the better entertainers.
Likewise, investigations of (Prasetyantoko and Parmono, 2008) revealed that the size of
the firm is decidedly identified with gainfulness. As such, bigger firms are more productive
than smaller firms (Stierwald, 2009). Conversely, more established firms are much more
productive yet less gainful whereas more youthful firms are more beneficial though less
profitable (Majumdar and Chhibber, 1999).
As indicated by (Asimakopoulos et al., 2009) benefit of the firm is emphatically impacted
by the measure of the firm and its administrative proficiency although it is adversely
influenced by use. And according to (Yang and Chen, 2009), small firms confront less
organization issue and they are exemplified by more adaptable non-various leveled
structures.
University of Ghana http://ugspace.ug.edu.gh

36
Regarding the above, performance has dependably been a worry for budgetary supervisors
and it has been broadly contemplated. From earlier writings we see that there are several
components influencing performance.
(Liargovas and Skandalis, 2008) contemplated the elements influencing company's money
related performance. The outcomes demonstrated that the key determinants of money
related performance are use of monetary measures, send out movement, area, size and
administration fitness file.
(Asimakopoulos et al., 2009) estimated the variables which influence benefit of the firm.
It was seen that gainfulness is decidedly impacted by the extent of the firm and its
administrative proficiency though it is adversely influenced by use of monetary measures.
While deals development actuates more benefits for small firms yet is immaterial for vast
ones.
(Nagy, 2009) estimated the variables influencing association's productivity. Study
presumes that there are number of elements which incorporate deals, current proportion,
obligation to-value proportion, and net overall revenue.
(Almajali et al., 2012) discovered the components influencing the firm performance. They
discovered that liquidity, size, use of monetary measures and administration skill
significantly affects the organizations performance whereas age has no effect on the
organizations performance.
(Ching et al., 2011) recognized the components that influence the performance of the firm
and figured out which of the elements for the most part impact productivity. The
University of Ghana http://ugspace.ug.edu.gh

37
consequence of the investigation showed that firm size influences the most while monetary
obligation has slightest effect on the performance of the firm.
For that reason, elements affecting the ROA were observed to be gross net revenue and the
measure of value while use of monetary measures affected ROE. Use of monetary
measures influences the estimation of the firm. Budgetary trough's real goal is to expand
the estimation of the investors because of this reason it has been considered a great deal as
far as capital structure is concerned.
(Myers, 2001), states that obligation offers firm a duty shield and in this way, firms
endeavor to build obligation to get tax break. By so doing, duty advantage brings about
enhanced gainfulness. Alongside this preferred standpoint, it additionally has weaknesses
and one of the detriment is that more elevated amount of obligation expands the cost.
As indicated by (Pandey, 2008,) use brings about the changeability of the arrival offered
to the investors in this way it includes chance.
(Peswani, 2011) led research and found that a high utilized firm could give better profit for
value to its investors however the productivity of both the organizations was comparable.
(Akhtar et al., 2012) directed an exploration, discoveries of the investigation demonstrate
that a positive connection exists between the monetary use and money related performance
of the organizations. As indicated by the examination the organizations having higher
productivity can enhance the performance of the firm by taking higher use. From earlier
writing we see that firm development has variety.
University of Ghana http://ugspace.ug.edu.gh

38
As per (Markman and Gartner, 2002), development is utilized as a measure of firm
performance.
(Sexton et al., 2000) found that the benefit of the firm is decidedly connected with the
feasible development of the firm.
(Fitzsimmons et al., 2005) directed research and discovered that no relationship exists
amongst development and gainfulness when longitudinal nature of development is
considered.
(Vlachvei and Notta, 2008) directed an exploration and the consequences of the
examination demonstrate that the connection between development, size and period of
firms is extremely delicate as for the techniques for estimation and development and size
definitions.
2.6.3 Financial Factors
Debt leverage, liquidity, capitalization, and investment are the major financial drivers that
affect firm performance (Liargovas & Skandalis, 2010).
Debt leverage is estimated by the proportion of aggregate debt to value (debt/value
proportion). It reveals how much a business is utilizing acquired cash. Organizations that
over utilize this might be in danger of insolvency in cases where debt installments cannot
be made; they likewise may not be able to find new loan specialists later on yet it is not
generally terrible as a proper utilization of cash acquired can expand arrival on investors’
venture make great utilization of the expenses favorable to circumstances related with
obtaining them.
University of Ghana http://ugspace.ug.edu.gh

39
With the exchange off theory (TO), (Bradley, Jarrell and Kim, 1984; Harris and Raviv,
1991) propose that each firm has an ideal debt to-value proportion controlled by adjusting
the present estimation of expected minor advantages of leverage (ex. impose reserve funds
because of paid interests) against the present estimation of expected negligible expenses of
leverage. As per the theory, every organization gets a bit by bit move towards its ideal debt
value proportion, which thus expands its reasonable worth.
As argued by (Jensen, 1986) and (Zwiebel, 1996) expounded debt can diminish the
likelihood of an association's takeover by conferring administrators to a more productive
business system. Accordingly, it isn’t all negative with the impact leverage brings onto a
firm, there also are positives.
Liquidity alludes to how much debt commitments coming due in the following year can be
paid from money or assets that will be transformed into money. It is typically estimated by
the present assets for current liabilities (current proportion). It demonstrates the capacity to
change over a resource for money rapidly and mirrors the capacity of the firm to oversee
working capital when kept at typical levels.
In budgetary financial matters, a standard contention to legitimize the choice of a firm to
keep up abundance liquidity in its advantages identifies with both theoretical and
preparatory intentions. In such a situation, a firm can utilize fluid resources for funding its
exercises and ventures when outer back is not accessible, or it is too exorbitant.
Then again, higher liquidity would enable a firm to manage startling possibilities and to
adapt to its commitments amid times of low income as opined by (Opler et al., 1999; Myers,
1977; Kim et al., 1998). Rather than the above thinking, (Hvide and Moen, 2007),
University of Ghana http://ugspace.ug.edu.gh

40
considering a hypothetical model by (Evans and Jovanovic, 1989), propose that a direct
measure of liquidity may drive entrepreneurial performance, yet that a plenitude of
liquidity may accomplish more damage than great. Along these lines, the impact of
liquidity on firms' money related performance is equivocal.
The capitalization rate or the proportion of settled resources for adding up to resources,
measures the degree to which settled resources are financed with proprietors' value capital.
A high proportion demonstrates a wasteful utilization of working capital which diminishes
the association's capacity to convey records of sales and keep up stock and typically implies
a low money hold. This may frequently restrain the capacity of the firm to react to expanded
interest for items or administrations.
The settled advantages for adding up to resources proportion influences association's
gainfulness adversely (Notta O. what's more, Vlachvei A., 2007; Agiomirgiannakis et al.,
2006). This can be credited to the decreased level of current resources which could prompt
a lower level of offers, since the firm will be shy of the important materials, stocks and so
on with a lessened level of action.
Net venture (proportion of the net investment to the aggregate resources) alludes to a
movement of spending, which builds the accessibility of settled capital merchandise or
methods for creation. Net investment is the aggregate spending on new settled venture less
substitution venture, which basically replaces devalued capital merchandise. This
proportion gives a feeling of how much cash an organization is spending on capital things
utilized for activities, (for example, property, plants and gear).
University of Ghana http://ugspace.ug.edu.gh

41
Proceeded with interest in the capital of a firm is urgent in light of the fact that the valuable
existence of existing capital lessens after some time. The measure of net venture contrasted
with so much things as income will vary amongst enterprises and between organizations
relying upon how capital-escalated the business is. This proportion is emphatically
identified with firm performance since new theories grow the creation and the income
producing limit of the firm.
A key determinant of venture is profit and as firm performance can be estimated by the
income created by the organization as far as productivity, there is broad writing on the
connection between profit pay-out and benefit. Profits are vital to investors and key
investors in demonstrating the income that an organization is creating and furthermore
collecting to investors. Great or higher profits pay-outs in this manner demonstrate that
organizations are producing genuine income instead of cooking books (Barron, 2002).
An examination by (Zhou and Ruland, 2006) uncovered that high profit pay-out firms tend
to encounter solid future income yet moderately low past income development in spite of
market spectators having a repudiating view. The discoveries of another examination done
by (Arnott and Asness, 2003) likewise uncovered that future income development is related
with high as opposed to low profit pay-out. They presumed that authentic confirmation
emphatically recommends that normal future profit development is quickest when current
pay-out proportions are high and slowest when pay-out proportions are low.
Their proof negated the view that generous reinvestment of held profit would fuel speedier
future income development. Their examination was done to research whether profit pay-
out of the U.S. value showcase portfolio, estimates future profit development. The
University of Ghana http://ugspace.ug.edu.gh

42
investigation involved organizations in the S&P 500 which tend to be substantial and
entrenched firms in cutting edge economies (Zhou and Ruland, 2006).
Observational investigations should be done in creating capital markets or for recently
recorded organizations which tend to be, not so much beneficial but rather more
development situated. (Arnott and Asness, 2003) proposed that the positive connection
between current profit pay-out and future income development depends on the free income
theory.
Low profit bringing about low development might be because of problematic investment
and not as much as perfect undertakings by managers with abundance free money streams
available to them. This is unmistakable for firms with restricted development openings or
a propensity towards over-venture. Paying generous profits which thus would expect
administrators to raise stores from issuance of offers, may subject administration to more
investigation, diminish irreconcilable circumstances and hence reduce imperfect
investment (Arnott and Asness, 2003).
This depends on the presumption that problematic ventures establish the framework for
poor profit development later though teach and a minimization of contentions will upgrade
development of future income through painstakingly picked ventures. In this way, paying
profits to diminish the free money streams upgrades the performance of an organization
since supervisors will have less money streams accordingly maintaining a strategic distance
from problematic theories. This is likewise in accordance with the office cost theory.
Another clarification by (Arnott and Asness, 2003) for the positive connection between
profit pay-out and development in future income is that administrators are hesitant to cut
University of Ghana http://ugspace.ug.edu.gh

43
profits. A high pay-out proportion shows administration's trust in the strength and
development of future income and a low pay-out proportion proposes that administration
is not certain of the soundness of profit or manageability of income development (Arnott
and Asness, 2003). Supervisors accordingly pay low profits to maintain a strategic distance
from profit cuts when income drop.
The positive relationship is additionally determined by sticky profits joined with mean
inversion in more unpredictable income (Arnott and Asness, 2003). The impermanent
increments and abatements in income in this manner subjects the payout quota to be
emphatically linked with future profit development. Their strength checks for the mean
inversion of profit proposed that income appear to return to the mean yet may return most
firmly as far as their proportion to profits.
In any case, (Farsio, Geary, and Moser, 2004) argue that there is no explicative connection
amongst profits and income held over the long haul and proposed three situations that
would render the long-haul relationship of profits and future income immaterial.
Initially, they call attention to fact that an expansion in profits may prompt a decrease in
stocks that are to be reinvested by the firm. Firms that concentrate on high profits without
considering venture needs may in this way encounter a fall in future income (Farsio et al.,
2004). Along these lines, there is a negative connection between profit pay-out and future
income or development.
Furthermore, an expansion in profits in a quarter might be the aftereffect of the
administration's approach to keep investors fulfilled and keep them from offering the stock
now and again when future income is relied upon to decay or current misfortunes are
University of Ghana http://ugspace.ug.edu.gh

44
required to proceed with (Farsio et al., 2004). This is an instance of rising profits which
after is taken over by declining income.
In conclusion, an expansion in profits according to (Farsio et al., 2004) might be because
of good performance in previous periods which may proceed into the future. This is in line
with notion of a positive causal connection between current profits and future income
which brings development and higher benefit.
From these situations, they contend that the general long-haul relationship is irrelevant
since there is a positive connection amongst profits and future income in a few periods and
a negative relationship in different periods.
(Nissim and Ziv, 2001), demonstrated that profit increments were straightforwardly
identified with future increments in income in every one of the two years after profit
change. In any case, what happens when there is an enduring increment in profits for a
given number of years? (Nissim and Ziv, 2001) found that profit increments and declines
are not symmetric.
Rather, profit increments are related with future benefit for no less than two years after the
profit change, though profit diminishes are not identified with future productivity after
controlling for present and expected gainfulness. They propose that this absence of
affiliation can be clarified by bookkeeping conservatism. They in this manner infer that
there is a positive connection between profit pay-out and future income, yet the relationship
is more grounded for recorded organizations.
University of Ghana http://ugspace.ug.edu.gh

45
(Miller and Modigliani, 1961) proposes that under certain rearranging presumptions, the
profit choice does not influence the estimation of a firm and is, subsequently, immaterial.
However, conventional shrewdness with changed hypotheses advocates that an
appropriately overseen profit pay-out is crucial to investors since it can influence share
costs and investor's riches.
This though is dependent on two presumptions, which are; that there is no expense
weakness to a financial specialist getting profits, with the other being that organizations
can bring stocks up in capital markets for new ventures without bearing noteworthy
issuance costs. The sympathizers of the second school of thought feel that profits are awful
for the normal investor because of the assessment detriment they make, which brings about
lower value. At long last, there are those in a third gathering who contended that profits are
obviously great since investors like them.
In this manner, regardless of voluminous research on profits, corporate administrators and
budgetary business analysts still face what (Black, 1976) once depicted as a profit puzzler
with pieces that simply do not appear to fit.
2.7 Empirical Review
Considerable studies encompassing this area of concern that have been done seem to show
significant relationships between the four main macro-economic variables of exchange
rate, interest rate, inflation rate and GDP and the financial performance of firms in relation
University of Ghana http://ugspace.ug.edu.gh

46
to profitability and security returns. Below are conclusions drawn from some of these
studies:
(Stock & Watson, 2008) for instance compiled 59 macroeconomic variables upon which
(Issah & Antwi, 2017) applied the methods of Principal Component Analysis (PCA) and
Multiple Regression Analysis to predict the relationship between firm performance and
macroeconomic variables of UK’s public listed companies.
The study confirmed Real GDP, Adjusted Unemployment Rate, and Exchange Rate (Value
of Foreign Currency Relative to US Dollar) as the major macroeconomic variables that
significantly have predictive ability in predicting firm performance.
(Issah & Antwi, 2017) further argue that except Real GDP, both Adjusted Unemployment
Rate and Exchange Rate (Value of Foreign Currency Relative to US Dollar) predict an
increase in performance for UK listed companies. The outcome for Real GDP and Adjusted
Unemployment Rate is true regardless of the region where the business is operated but may
not be true for Exchange Rate (Value of Foreign Currency Relative to US Dollar) for
different regions since different regions have varying foreign currency exchange rates
relative to US Dollar.
In Ghana for example, Exchange Rate (Value of Foreign Currency Relative to US Dollar)
will more likely predict a reduction in performance because of the high Cedi to Dollar rate.
As indicated by (Zulfiqar and Din, 2015) who inspected the relationship between macro-
economic pointers and firm performance among material ventures in Pakistan, findings
University of Ghana http://ugspace.ug.edu.gh

47
recommend positive unimportant relationship between inflation rate and firm performance.
The examination approach was regression analysis.
(Limpanithiwat and Rungsombudpornkul, 2010), took a gander at the relationship between
expansion rate and stock return among organizations recorded in Thailand. Time
arrangement information for the period 2000 to 2010 was gathered for the study. Utilizing
the unit root to test for stationarity and vector auto relapse to test the relationship between
factors, the yield indicated next to no relationship between inflation rate and stock returns.
A standout amongst the most suitable investigates to this study was that of (Oleka, Sabina
and Ebue, 2015). They researched the relationship amongst expansion and firm
performance in Nigeria. They gathered Secondary information from yearly financial
related reports for the period 2000 to 2014. Playing out the conventional slightest squares
relapse examination, the result achieved demonstrated a positive yet not critical
relationship between both return on equity and income per share.
(Kumar, 2013), investigated the link between inflation and stock returns; an evidence from
Brazil, Russia, India, China and South Africa (BRICS) market. Quarterly secondary data
was collected for the period 2000 to 2013 from Brazil, India, Russia, China and South
Africa for the study.
Utilizing time series to examine the information, stationarity tests demonstrated that the
information was stationary in among the BRICS individuals. The confirmation likewise
indicated noteworthy long-haul relationship amongst returns and inflation rate. Connection
investigation attempted demonstrated that there was a positive noteworthy relationship
amongst return and inflation rate.
University of Ghana http://ugspace.ug.edu.gh

48
(Kairuthi, 2014) in a local study, examined the impact of inflation and loan fees on
securities exchange returns of firms listed at the NSE. The study utilized distinct time series
relationship. Month to month auxiliary data was gathered on stock returns, inflation rates,
trade rates and liquidity. Applying enlightening time series connection plan, the yield
appeared to propose negative reverse relationship between inflation rates and stock returns.
But, there was a positive noteworthy relationship between loan fee and stock returns.
In Namibia, (Eita, 2011) carried out a study on the influence of several macroeconomic
variables on stock performance and between the variables themselves. The study tried to
research the relationship between loan fee, inflation rate, cash supply and trade rates.
Utilizing the Vector Error Correction (VECM) model to break down the data, prove appear
to point a positive critical relationship between growth in securities exchange costs and
cash supply and monetary movement. Likewise noted was the converse relationship
between stock prices and inflation rate while loan cost demonstrated positive huge
association with stock performance.
(Barasa, 2014) similarly, examined the key financial performance pointers and stock
returns among firms operating at the NSE. This study embraced the exploratory research
framework, regression analysis utilized to inspect the direction of the relationship and
connection examination to gauge the quality of the relationship between stock returns and
key financial performance pointers. It was found that there is a positive noteworthy
relationship between inflation, financial development, loan fee and stock returns.
Conversely, there was a reverse relationship between swapping of currency rates and stock
returns.
University of Ghana http://ugspace.ug.edu.gh

49
(Lai & Roy, 2005) studied the effects of macro-economic news declarations on large stock
returns. Month to month auxiliary news was gathered on eight indicators which included;
GDP, genuine movement, utilization, venture, government consumption, net foreign sales,
cash supply and forward-looking pointers. The yield attained from the study demonstrated
that there was a negative critical relationship between GDP news declaration and mean
stock returns.
Finally, (Njoroge, 2013) examined the association between loan cost and firm performance
among licensed organizations at the NSE. Utilizing judgmental sampling system to choose
firms effectively exchanging somewhere around 2008 and 2013, the findings demonstrated
a positive however not critical relationship between loan fee and return on equity.
The behaviour of dividend pay-out is one of the most debated issues in the corporate
finance literature and keeps its prominent place both in developed and developing markets
(Hafeez & Attiya, 2009).
According to (Brealey and Myers, 2000), numerous studies have been carried out to expose
matters relating to the dividend dynamics and determinants of dividend pay-out, but still
do not have an acceptable explanation for the observed dividend behaviour of firms.
Dividend pay-out has been dissected for a long time, yet no all-round acknowledged
clarification for organizations' watched dividend conduct has been set up (Samuel and
Edward, 2011). It has for quite some time been an astounding in corporate finance.
(Velnampy, 2013) considered corporate administration and firm performance in Sri Lanka.
He inspected 28 producing organizations utilizing the information from 2007 – 2011 and
University of Ghana http://ugspace.ug.edu.gh

50
discovered that determinants of corporate administration were not connected to the
performance measures of the association.
Also, relapse utilized demonstrated that corporate administration does not influence
organizations' ROE and ROA and uncovered that corporate administration measures do not
correspond with performance measures.
(Velnampy and Nimalathasan, 2009) explored the relationship between authoritative
development and benefit of Commercial Bank Ltd in Sri Lanka over the time of 10 years
(1997 to 2006). They found that, deals were decidedly connected with benefit proportions
aside from working benefit, return on value and number of contributors was adversely
associated to the productivity proportions aside from working benefit and dividend for
value. So again, number of advances is likewise adversely related to the arrival by and
large investors' assets.
(Miller and Modigliani, 1961) contended that under certain rearranging presumptions, the
dividend choice does not influence the estimation of a firm and is, thus, irrelevant.
However, conventional knowledge with changed hypotheses advocates that an
appropriately overseen dividend pay-out is crucial to investors since it can influence share
costs and investor's riches. This contention depends on two suppositions; No duty snag to
getting dividends by financial experts, and Organizations can bring reserves up in capital
markets for new ventures without bearing noteworthy issuance costs.
Sympathizers of the second supposition feel that dividends are terrible for the normal
investor considering the duty disservice they make, which brings about lower value.
University of Ghana http://ugspace.ug.edu.gh

51
At last, there are those in a third gathering who contended that dividends are unmistakably
great since investors like them. Hence, regardless of immense study on dividends,
corporate directors and money related investors continue to face what Black (1976) once
portrayed as a dividend mystery with pieces that simply don't appear to fit.
(Amidu, 2007) identified that dividend pay-out influences firm performance particularly
the gainfulness estimated by the arrival on resources. The outcomes demonstrated a
positive and huge connection between return on resources, return on value, development
in deals and dividend pay-out. This demonstrated when a firm has an approach to pay
dividends, its gainfulness is affected. The outcomes additionally demonstrated a factually
huge connection amongst productivity and dividend payout proportion.
An investigation by (Howatt et al., 2009) likewise reasoned that positive changes in
dividends are related to positive future changes in mean genuine income per share.
(Nissim and Ziv, 2001) demonstrated that dividend increments were straightforwardly
identified with future increments in income in every one of the two years after the dividend
change in any case, (Zeckhauser and Pound, 1990) in a related report discovered that there
is no noteworthy contrast among dividend payouts with or without huge square investors.
(Kale and Noe, 1990) propose that dividend goes about as a flag of the dependability of
the company's future money streams. A study of the surviving writing uncover that the key
determinants of dividend choices incorporate liquidity, after expense income of the firm,
income contemplations, future dividend, past dividend hones, degrees of dividend ability,
legitimate prerequisites, development prospects, expansion and interest rates.
University of Ghana http://ugspace.ug.edu.gh

52
(Brigham, 1995) present that dividends give maybe the best and most dependable flag. As
per him, an expansion in dividend signals administration' certainty that future income will
be sufficiently solid to help new and higher dividend and the other way around. This view
is verified by (Foong, Zakaria and Tan, 2007) when they noticed that there is confirmation
to aid the notion that investors react to changes in dividend.
Be as it may, (Farsio et al., 2004) argue that no noteworthy connection amongst dividends
and income hold over the long haul and arguments that help this relationship depend on
brief periods and subsequently are deceptive to investors. They proposed three situations
that would render the long-haul relationship of dividends and future income immaterial.
To start with, they raise the fact that an expansion in dividends may prompt a decrease in
reserves that are to be reinvested by the firm. Firms that compensation high dividends
without considering venture needs may in this way encounter bring down future income
(Farsio et al., 2004). There is along these lines a negative connection between dividend
payout and future income.
(Zeckhauser and Pound, 1990) in a related report discovered that there is no huge
distinction among dividend payouts with or without expansive square investors. Moreover,
(Kouki and Guizani, 2009), and (Kumar, 2006) saw as well in their investigation that
administrative possession seems to have a noticeable and noteworthy impact on dividend
payout.
(Samuel Kwaku Agyei and Edward Marfo-Yiadom, 2011) analyzed the connection
between dividend pay-out and performance of banks in Ghana. The investigation utilized
University of Ghana http://ugspace.ug.edu.gh

53
board information built from the monetary proclamations of 16 business banks in Ghana
for a time of 5 years, from 1999-2003.
These budgetary explanations were acquired from the Banking Supervision division of
Bank of Ghana. STATA was utilized for the information investigation. Findings show that
banks pay dividend increase their performance. For the most part, the outcome is
demonstrated that dividend pay-out affects firm value.
(Timothy Mahalang'ang'a Murekefu Ochuodho Peter Ouma, 2010) uncovered what set up
the connection between dividend payout and firm performance among recorded firms in
the Nairobi Stock trade. Relapse investigation was done to set up the relationship there.
This investigation made utilization of both essential and optional information. Optional
information was acquired from the association's yearly reports, from the year 2002 to 2010.
The populace for this examination comprised of the organizations recorded on the Nairobi
Stock trade. The NSE grouped these organizations into ten parts. The discoveries showed
that dividend payout was a main consideration influencing firm performance. Their
relationship was additionally solid and positive.
In view of the discoveries of this exploration that dividend pay-out is important, managers
are advised to give satisfactory time in outlining a dividend pay-out that will upgrade firm
performance and along these lines investor value.
An examination by (Amidu, 2007) uncovered that dividend pay-out influences firm
performance as estimated by its productivity. The outcomes demonstrated a positive and
University of Ghana http://ugspace.ug.edu.gh

54
noteworthy connection between return on resources, return on value, development in deals
and dividend pay-out.
(Amidu, 2007), again, in an examination looking at whether dividend pay-out impacts firm
performance in the Ghana Stock Exchange, found out that dividend pay-out influences firm
performance particularly the gainfulness estimated by the arrival on resources. The
outcomes demonstrated a positive and huge connection between return on resources, return
on value, development in deals and dividend pay-out.
This demonstrated that when a firm has a strategy to pay dividends, its gainfulness is
affected. The outcomes additionally demonstrated a measurably noteworthy connection
amongst benefit and dividend payout proportion.
2.8 Contribution to Literature
Based on the argument of (Al-Yahyaee, Pham and Walter, 2010), it can be concluded that
different tax regimes and economic characteristics influence differences in firm
performance for different markets.
As a result, not only financial determinants but industry factors such as competition and
macro-economic factors such as GDP, economic growth, inflation, taxes, recession,
demand/supply, interest and exchange rates among others also influence firm performance
which previous studies have failed to explore in their models (Amidu & Abor, 2006;
Amidu, 2007; Asamoah, 2010).
(Hansen & Wernerfelt, 1989) confirms that both economic and organizational factors are
significant determinants of firm performance. However, according to (Hansen &
University of Ghana http://ugspace.ug.edu.gh

55
Wernerfelt, 1989), organizational factors explain about twice as much variance in
profitability as economic factors do. (Cubin & Geroski, 1987) and (Rumelt, 1991) argue
that economic factors do not significantly affect performance of firms. This conception
might have influenced the decision of recent studies on firm performance to consider only
organizational factors and neglecting economic determinants.
This study therefore tries to explore a more elaborated econometrics model that extends
the models predicted by past studies to include both important organizational and economic
determinants to effectively investigate how these determinants work together to influence
performance of firms.
University of Ghana http://ugspace.ug.edu.gh

56
CHAPTER THREE
OVERVIEW OF FIRM PERFORMANCE IN THE GSE AND
MACROECONOMIC DEVELOPMENT IN GHANA
3.0 Introduction
Stock exchanges around the world raise the level of awareness of listed firms to the public
in order to help these firms meet their financing needs.
Studies have been conducted to investigate the effects of Stock exchanges on firms'
performance and have strikingly reached comparable conclusions that going publicly listed
on stock exchanges has shown a significant decline in firm performance (Pagano et al.,
1998; Huang & Song, 2002; Alanazi & Lui, 2013). These studies were conducted on the
Italian, Chinese, and Gulf Corporation Council region markets respectively. However, the
remaining portions of this chapter discusses the overview of firm performance in the Ghana
Stock Exchange (GSE) within the economy of Ghana.
The chapter starts by presenting the history and performance of the Ghana Stock Exchange
(GSE) and adds up to the discussion, the role of the GSE in developing the economy of
Ghana as well as the effect of macroeconomics on performance of the GSE and concludes
with a preview of the performance of its listed firms.
3.1 History and Performance of the GSE
The Ghana Stock Exchange(GSE) was established in July 1989 as a privately-owned firm
limited by guarantee under Ghana's companies' code, 1963 and later changed to a public
University of Ghana http://ugspace.ug.edu.gh

57
firm but kept upholding its initial status as a firm limited by guaranteed in April 1994. The
Exchange started its trading activities in November 1990 which allowed a wide range of
securities to be listed.
The Exchange started with only three promoters but currently, can boast about its fifty-two
listed members made up of eleven Licensed Dealing members (LDM) and forty-one
Associate members.
Furthermore, there are presently thirty-eight (38) listed firms. The criteria for listing
incorporates the following: Capital sufficiency, Benefit, spread of offers, Years of presence
and Administration proficiency.
As mentioned earlier, in 1993, the GSE was the 6th best performing developing stock
exchange, with a capital valuation of 116% and in 1994 made the first position as the best
performing stock exchange among every developing business sector, increasing 124.3% in
its valuation level. 1995's record development was a frustrating 6.3%, mostly because of
increased inflation and interest rates.
Development level for 1997 was 42%, and toward the close of 1998 it was 868.35. GSE-
All Share Index is a market capitalization list of all offer listed on GSE. As of December
2013, the market capitalization of the Ghana Stock Exchange was GH¢61,158.29million
contrasted with the December 2012 figure of GH¢57,264.22million, recording an
expansion of 6.80%. Domestic Market capitalization listed a 76.68% expansion in
December 2014 with GH¢11,694.93 contrasted with GH¢6,753.14 listed for a similar
period in 2012.
University of Ghana http://ugspace.ug.edu.gh

58
At present, the manufacturing and brewing firms are the most performing on the GSE.
Incredibly at third position, is the banking industry while other listed firms fall into the
insurance, mining and oil divisions. Many of the listed firms on the GSE are Ghanaian
owned firms although there are a few from multinational holdings.
The GSE has consequently contributed significantly to the economic development of the
country during recent years (Dziwornu & Awunyo-Vitor, 2013). The next section discusses
the role of the GSE in developing the economy of Ghana.
3.2 The role of the GSE in developing the economy of Ghana
Although the role of stock exchanges in economic development has been very much
recognized over the world as of late (Ezeoha et al., 2009), its connection with economic
development has not gotten the required consideration. Additionally, different perspectives
have been communicated on the nature and heading of causality between stock exchange
performance and economic development (Ezeoha et al. 2009; Hondroyiannis et al., 2004).
Whiles a few examinations have discovered that financial exercises in a nation constitute
the key driver of stock exchange advancement (El-Wassal, 2005; Demirguc-Kunt and
Levine, 1996), others have discovered that stock exchange development rather prompts
economic development (Chinwuba and Amos, 2011; Yartey, 2008). In addition, some have
discovered bi-directional (input) causality between the share trading system improvement
and economic development (Sudharshan and Rakesh, 2011; Soumya and Jaydeep, 2008).
In Ghana, aside from the presence of restricted investigations on the connection between
stock exchange performance and economic development (Quaidoo, 2011; Osei, 2008)
University of Ghana http://ugspace.ug.edu.gh

59
aftereffects of these examinations are blended. (Quaidoo. 2011) found that economic
development prompts stock exchange capitalization with no input, whiles (Osei, 2008)
argued that stock exchange improvement promotes economic development.
(Rousseau and Wachtel, 2000) have however contended that since ostensible market
capitalization is influenced by cost on the stock exchanges the utilization of ostensible
stock exchange capitalization and market capitalization proportion may not be a suitable
pointer since it might prompt deceptive relationship.
The Ghana Stock Exchange is imperative for comprehensive development as far as riches
conveyance and making capital more secure for local investors are involved. The exchange
can make more prominent financial related considerations by presenting new products and
services custom fitted to stay attractive to investors. Advancement, credit advising,
financial instruction and appropriate fragment distinguishing proof constitute the
conceivable procedures to accomplish this.
The GSE as an all-around created stock exchange makes a feasible ease circulation system
for different financial products and services the nation over confirming an earlier argument
made by (Xiaonian, 1997).
Most rising economies have seen a spate of developments in the territory of financial
modelling and these developments remain aftereffect of number of Government directions,
assess approaches, globalization, advancement, and privatization, joining with the
worldwide financial related market and expanding risk in the domestic financial market
(Xiaonian, 1997). Hence, with the expanded instability in the GSE, the requirement for
University of Ghana http://ugspace.ug.edu.gh

60
new financial related advancements to fence risk and increment returns cannot be
exaggerated.
Again, the GSE provides a vital wellspring of fund for long term profitable projects. In this
way, it lessens the over dependence of the corporate division on financing for long term
projects allowing the government to fund projects meant for giving basic comforts to
financial development. (Xiaonian, 1997) argues that this aides in diffusing weights on
keeping the financial framework by coordinating long term projects bearing in mind a
stated capital planned to last for such long-term projects.
In addition, the GSE provides value capital and foundation advancement capital that has
solid financial advantages. The exchange can help the legislature in its privatization
program by offering offers in the public projects to individuals through the exchange to
improve the framework improvement. Projects may include streets, water and sewer
frameworks, lodging, vitality, broadcast communications, open transport.
It likewise enhances the effectiveness of capital allotment through focused evaluating
instrument for better usage of rare assets for expanded financial development (Yean, 1999).
Moreover, the GSE provides roads to project openings that empower a thrift culture basic
in expanding domestic funds and investment opportunities that are fundamental for quick
industrialization. Likewise, it advances public-private associations to energize cooperation
of private segment in useful projects for financial proficiency to improve financial
profitability which has turned out to be inescapable as assets keep on diminishing.
University of Ghana http://ugspace.ug.edu.gh

61
(Yean, 1999) argues that this helps the Government to properly manage assets to
supplement its exertion in financing basic socio-economic projects through raising long
term project-based capital.
The GSE finally empowers the inflow of capital when firms or investors put resources into
domestic securities. According to (Yean, 1999), this provides required seed capital to
support innovative projects.
3.3 Effect of Macroeconomics on Performance of the GSE
Except for interest and exchange rates, stock prices in the GSE appear to lead all economic
activities (Frimpong, 2009). This can be judged from the case that banks tend to charge
high interest rates on loans which put burden on companies’ financial performance.
Furthermore, the cedi to dollar rate has a significant impact on stock market returns.
Inflation, however appear not to significantly affect stock market return in the GSE
(Frimpong, 2009).
University of Ghana http://ugspace.ug.edu.gh

62
3.4 Performance of Firms Listed in the GSE
The GSE is accepted to help enhance firms’ performance within the country’s state of
economy. With the key idea of opening responsibility for investors, the GSE has caused
and keep on providing necessary financing for firms and has turned into the measure with
which the overall performance of an economy is assessed.
Firms listed under the GSE have experienced improved performance as far as offer value
increase throughout the years. Incredibly, in 2013 a sizeable portion of the listed firms
recorded returns of 78.81% which is higher than the exchange’s performance measure.
Out of 34 listed firms, ten made increases of over 100%. PZ Cussons (PZC) stood out with
338.89%.
The others were: Enterprise Group Ltd (EGL) – 291.67%, CAL Bank Ltd (CAL)–
155.26%, Mechanical Lloyd Co. Ltd (MLC) – 153.33%, Guinness Ghana Breweries Ltd (
GGBL) – 136.64% GCB Ltd (GCB) – 130.95%, Benso Oil Palm Plantation (BOPP) –
129.29%, Societte General (SOGEGH) – 120.59%, Unilever Ghana Ltd (UNIL) –
114.91%, HFC Bank Ltd (HFC) – 113.33%.
Five firms also recorded additions of half or more. This classification was driven by:
Ecobank Ghana Ltd (EBG) with 87%, Fan Milk Ltd (FML) – 86.48%, TOTAL Ghana Ltd
(TOTAL) – 72.33%, Ecobank Transnational Inc (ETI) – 58.33% and Sam Woode Ltd
(SWL) – 50%.
Five other firms recorded increases of up half. Be that as it may, there were eight firms
with no adjustment in their offer costs. Then again, TRANSOL drove the washouts
University of Ghana http://ugspace.ug.edu.gh

63
available with a critical loss of 25% in its offer cost among five different firms that lost
between 5%-20% in their offer costs.
3.5 Overview of Macroeconomic Development in Ghana
3.5.1 Growth Trends
One noteworthy determinant of a nation's macroeconomic performance is genuine GDP
development. Ghana's development record was very sporadic before the mid-1980s when
the nation set out on financial changes. From a sensibly high GDP development of 6.2%
out of 1961, the economy of Ghana started to record a consistent stoppage in GDP
development achieving negative 3.0 out of 1967 preceding recouping firmly to record 6.4%
the next year (see Figure 3.1).
Development stayed stable for a brief timeframe and staggered again in 1972 with a
development rate of negative 2.5%. Without a doubt, development was turbulent amid a
significant part of the period after the mid-1960s and just started to balance out in 1984.
As appeared in Figure 3.1, the negative development the nation experienced happened in
1967, 1972, 1975-1976, 1979, and 1980-1981. Educationally, the greater part of the long
stretches of negative development matched with a time of extraordinary political
flimsiness, and outside stuns.
University of Ghana http://ugspace.ug.edu.gh

64
Figure 3.1: real GDP growth rates, 1960-2012 (%)
Source: Ghana Statistical Service
The main negative development happened in the year after the principal military rebellion
in 1966, while the period 1972, 1979 and 1981-1982 concurred with military mediation.
The least development of negative 12.9% was realised around 1975 after a poor reaction
to the oil-value stun of 1973 as Ghana couldn't get to the universal capital markets to
discover the connecting money for residential uses.
Misinformed monetary decisions as well as inflationary financing and household
acquisitions were additionally to fault for the negative development recorded in the 1970s
and mid-1980s. The genuine dry season experienced in the nation in the mid-1980s, and
what monetary antiquarians point to in regard of the arrival of around one million
Ghanaians from Nigeria added worry to an as of now overburdened economy.
In hunting down answers for the financial difficulties confronting the Ghanaian economy
in the late 1970s and mid-1980s, the administration set up liberal monetary policies under
University of Ghana http://ugspace.ug.edu.gh

65
the sponsorship of the World Bank and the International money related Fund (IMF). In
1986, the second period of the change was supplemented with the Structural Adjustment
Program (SAP) directed at redressing various basic uneven characters to guarantee a
managed sound financial development.
The reaction of the economy to the change in perspective of monetary administration from
state control to a changed one was firmly positive with a solid development rate of 8.6%
out of 1984.
Providentially, this positive development performance has proceeded since 1984 and
grabbing unequivocally since 2001.
For the most part, solid monetary development performance is an impression of liberal
financial strategy joined by extensive inflows of help and outside direct investment that
has activated expanded levels of venture, especially in the general population division.
These enhancements combined with help inflows added to elevated amounts of open
spending for the most part on framework, for example, streets, schools and doctor's
facilities. (Aryeetey and Tarp, 2000) have attested that the development of the 1980s
exuded from the extension of capital application, as an outcome of expanded guide inflows.
An estimation of a straightforward development bookkeeping model by (Aryeetey et al.,
2001) ascribed Ghana's development example to add up to factor efficiency (TFP) which
thus was helped by the liberal monetary administration. Since (Aryeetey et al., 2001), there
have been few or no examinations inspecting the wellsprings of development in the
Ghanaian economy.
University of Ghana http://ugspace.ug.edu.gh

66
The passage of unrefined petroleum sends out in the late 2000s, the basic changes occurring
in training and wellbeing strategies, and the contracting of the offer of farming to GDP
give roads to future research, especially on questions in regard to the wellsprings of
development in the Ghanaian economy in the course of recent decades.
3.5.2 Sectoral Analysis of the Economy
The example of Ghana's monetary development has differed essentially by segment and
this is reflected in the movements in the sectoral dissemination of national yield from
horticulture for the two different divisions.
Development has been moderately more grounded in administrations and industry, and the
result of this improvement is the move in sectoral strength from horticulture to
administrations. Assessments from Table 3.1 demonstrates a yearly normal development
rate of horticulture of around 3.3% in the vicinity of 1984 and 2012 contrasted and 7.8%
for industry and 6.7% for administrations.
Therefore, the offer of administrations enhanced from a normal of 37.9% of every 1984-
88 to 42.5% out of 1989-92 in light of 1975 consistent costs. After a rebase of the national
records in 1993, the area's offer which dropped to 31.2% out of 1993-96 enhanced hardly
to 32.9% of every 2001-05.
A rebase of the national records in 2006 further pushed the commitment of the part to GDP
to a normal of half. The solid show of administrations regarding development and sectoral
commitment has exuded generally from enhanced development performance of exchange,
neighborliness, media transmission and money related subsectors, helped by advancement
of exercises that have seen expanded private segment investment in the sub-division.
University of Ghana http://ugspace.ug.edu.gh

67
Table 3.1: Sectoral Growth Rates and Composition of GDP, 1984-2012 (%)
Source: Ghana Statistical Service
The commitment of the mechanical segment to national yield additionally expanded
emphatically from 13.0% out of 1984-1988 to 27.4% by enhanced development
performance of mining and the development sub-areas.
The beginning of oil generation in business amounts in 2011, pushed mechanical
development rate to a high of 41.6% and hence bringing the offer of the part from 21.7%
from 2006-10 to 27.3% (Table 3.1) fabricating recorded some calculable development
performance in the early time of the change in the second 50% of the 1980s which added
to enhanced offer of the subsector in GDP in the late 1980s and mid-1990s.
The evacuation of outside trade limitations as a feature of the financial change added to
enhanced limit of assembling firms through the accessibility of remote trade for the
importation of crude materials, save parts and hardware for the activity of existing plants
and apparatus. The segment has, in any case, saw feeble development which has reflected
University of Ghana http://ugspace.ug.edu.gh

68
in the declining offer of the sub-segment from 10.2% between 1993-96 to 6.9% as of 2012
(Table 3.1). During recent decades, the sub-segment has been doing combating with the
issue of fast deterioration of the household money, staggering expense of credit, absence
of satisfactory and solid vitality supply, shabby imports and frail infrastructural base.
These components, notwithstanding the auxiliary rigidities inside the economy have added
to the not as much as tasteful intensity of local assembling ventures in the changed
exchange condition.
Interestingly, farming which was viewed as the foundation of the Ghanaian economy has
reliably lost its strength in the economy with a decrease in its commitment to national yield
from 49.0% in the periods 1984-88 to 22.7% as of 2012. The nonattendance of sufficient
help for the sustenance product, angling animals’ sub-segments provoked by the expulsion
of rural appropriations as a major aspect of the financial change measures, combined with
promoting issues and post-collect misfortunes can't escape fault for the dreary performance
of agribusiness.
The fast loss of woodland cover because of shrub flames, logging and other human
exercises, restricted help from expansion administrations, and the nonappearance of
sufficient water system offices which represents the substantial dependence on rain have
likewise added to the contracting offer of national yield.
The performance of farming would have been more terrible had the cocoa sub-area not
grabbed firmly from 2001 because of ponder approach by government to recover the
nation's lost magnificence in worldwide cocoa creation. The of mass splashing and
upgraded maker cost for agriculturists prompted enhanced cocoa generation from around
University of Ghana http://ugspace.ug.edu.gh

69
400,000 tons on the eve of the thousand years to 1 million tons in 2009/10, pushing the
nation from third to second position behind Cote d'Ivoire on the association of world cocoa
creating countries.
The move from horticultural strength to administrations in genuine GDP might be seen as
basic change of the economy. Auxiliary change of financial game plan speaks to an
expanding capacity of the economy and society to react productively and viably to
changing and developing weights for improved welfare among individuals.
This involves a procedure by which expanding extents of business and yield of the
economy are represented by areas other than horticulture. It includes a net asset exchange
from horticulture to different areas of the economy over the long haul. Basic change is
additionally connected with a move from casual to formal courses of action in the
association of monetary action.
Nonetheless, confirmation accessible proposes that the strength of casual exercises in the
administrations area and the lessening significance of assembling in financial courses of
action make it troublesome for this auxiliary move to be judged as basic change of the
Ghanaian economy.
3.6 Conclusion
This brings the discussion to a conclusion that stock market performance promotes
economic development and economic development however does not Granger cause stock
market performance. In this sense, a one-way relationship between stock market and
University of Ghana http://ugspace.ug.edu.gh

70
economic development. Economic development thus has a significant effect on financial
performance for firms.
This confirms that within the stock exchange, macroeconomic indicators such as the GDP
greatly influence how firms perform. Hence the need for a well-structured performance
framework which not only incorporate financial principles but with an integrated economic
principle to determining the performance of firms which is of much priority.
University of Ghana http://ugspace.ug.edu.gh

71
CHAPTER FOUR
DATA AND METHODOLOGY
4.0 Introduction
Chapter four will detail the data type and source as well as the methodology of the study.
After a brief presentation of the data, the chapter proceeds with the description of the
theoretical framework, empirical model and justification of variables, estimation procedure
and the diagnostic tests required to undertake panel studies.
Specifically, multicollinearity, panel stationary, panel co-integration and panel causality
tests are performed.
4.1 Data Type and Sources
This study relied on secondary data as the main source of data. This provided ample
discussion for the readers to help them understand more about the issue and the different
variables involved. The data was intrinsically panel, running from 2007 to 2015 for 30
firms listed on the Ghana Stock Exchange (GSE).
All data were sourced from the annual report of the GSE and the listed firms. The data
were retrieved from the various annual report of the firms. The GSE groups these firms
under eight (8) sectors namely; “Technology, Basic Materials, Health care, Industrials, Oil
and Gas, Consumer Good, Consumer Services and Financials.”
Listed companies were preferred over non-listed firms because financial statements of
these companies are readily available at Ghana Stock Exchange unlike the non-listed
companies.
University of Ghana http://ugspace.ug.edu.gh

72
4.2 Theoretical Framework
Macroeconomic factors including GDP, inflation, taxes, demand/supply, interest and
exchange rates influence firm performance which is made up of return of equity and return
on assets in terms of profitability of the firm.
It has been hypothetically tested that a relationship exists between these macroeconomic
variables and firm performance, however, empirical studies reviewed shows that there is
no conclusion on the exact relationship and how significant that relationship is because
different markets exhibit varying results whether it affects performance positively or
negatively.
Again, firm specific factors such as the firms’ age, size, and growth rate along with
financial factors including debt leverage, liquidity, capitalization, and investment also
affect firm performance. However, the firm specific factors were controlled in order to
measure firms’ performance (Amidu, 2007; Catapan, et al., 2012; Gonzalez and Stefan,
2010; Vermeulen and Smit, 2011; Zhou & Ruland, 2006; Mordedzi, 2014).
This study considered the kind of relationship that exist between the variables involved and
whether this relationship is significant or not. Figure 4.1 presents a framework of a typical
organizational climate in the GSE.
University of Ghana http://ugspace.ug.edu.gh

73
Figure 4.2: Framework of Organizational Climate in the GSE
Source: Author’s construct, 2017
4.3 Empirical Model, Measurement and Description of Variables
4.3.1 Empirical Model
Since data used in this study contain observations of multiple phenomena obtained over
multiple time periods for the same set of firms, panel data analysis was performed.
Panel data analysis employs two important models, namely fixed effect model (where the
parameters of the model are predicted to be fixed) and dynamic effect model (where the
parameters of the model have varying effects and also contains a lag of the dependent
variable as a covariate).
Financial Factors
Dividend payout
Leverage
Liquidity
Capitalization
Firm performance
Return on Assets
Return on Equity
Microeconomic Factors:
Age
Firm size
Growth
Macroeconomic Factors:
Inflation
Interest rate
Exchange rate
GDP
University of Ghana http://ugspace.ug.edu.gh

74
This study investigates the efficiency of the fixed effect model in estimating firm
performance because the presence of the lagged dependent variable in a dynamic effect
model may encourage the presence of endogeneity which violates the assumption of strict
exogeneity upon which the fixed effect estimator and the first difference estimator both
rely.
However, the lagged value of firm performance could be a significant driver of its current
value to exploring the effect of past firm performance on its current stands (Ekanayake &
Long, 2012; Demirgüneş, 2015) but in a model such as this, the lagged value of firm
performance may correlate with at least one of the covariates causing multicollinearity
issue.
Hence, dynamic model will not be useful for this study unless we define and include an
appropriate interaction effect between the lagged firm performance variable and the
covariates in the model. (Matyjas, 2014) experimented this theoretical concept in his study
and found that past firm performance values have a noteworthy influence on current firm
performance.
Integrating the financial models predicted by (Amidu 2007; Catapan, et al. 2012; Gonzalez
and Stefan 2010; Vermeulen and Smit 2011; Zhou & Ruland 2006; and Mordedzi, 2014)
with the economic model suggested by (Hansen & Wernerfelt, 1989), the fixed effect
model underpinning firm performance follows a similar model suggested by (Chandrapala
& Knápková, 2013).
University of Ghana http://ugspace.ug.edu.gh

75
𝑃𝐹 = 𝐹(𝐼𝑁𝐹, 𝐼𝑅, 𝐺𝐷𝑃, 𝐸𝑋𝑅, 𝑃𝐴𝑌, 𝑆𝐼𝑍𝐸, 𝐿𝐸𝑉, 𝐺𝑅𝑂𝑊𝑇𝐻) (1)
Where PF = Firm performance in the areas of ROA and ROE. Hence, the fixed effect
models of firms’ performance with regards to the panel nature of the data are:
𝑅𝑂𝐴𝑖𝑡 = 𝛽0 + 𝛽1𝐼𝑁𝐹𝑡 + 𝛽2𝐼𝑅𝑡 + 𝛽3𝐺𝐷𝑃𝑡 + 𝛽4𝐸𝑋𝑅𝑡 + 𝛽5𝑃𝐴𝑌𝑖𝑡 + 𝛽6𝑆𝐼𝑍𝐸𝑖𝑡
+ 𝛽7𝐿𝐸𝑉𝑖𝑡 + 𝛽8𝐺𝑅𝑂𝑊𝑇𝐻𝑖𝑡 + 𝜀𝑖𝑡
(2)
𝑅𝑂𝐸𝑖𝑡 = 𝛽0 + 𝛽1𝐼𝑁𝐹𝑡 + 𝛽2𝐼𝑅𝑡 + 𝛽3𝐺𝐷𝑃𝑡 + 𝛽4𝐸𝑋𝑅𝑡 + 𝛽5𝑃𝐴𝑌𝑖𝑡 + 𝛽6𝑆𝐼𝑍𝐸𝑖𝑡
+ 𝛽7𝐿𝐸𝑉𝑖𝑡 + 𝛽8𝐺𝑅𝑂𝑊𝑇𝐻𝑖𝑡 + 𝜀𝑖𝑡
(3)
Table 4.1 describes the dependent and independent variables for models (2) and (3).
Table 4.1: Variables of the Models
Variable Explanation Expected Sign
Response Variable
𝑅𝑂𝐴𝑖𝑡 Return on Assets; ratio of earnings before interest and
taxes on total assets for firm 𝑖 in period 𝑡.
GHS (Million)
+
𝑅𝑂𝐸𝑖𝑡 Return on Equity; ratio of earnings after interest and
taxes on total equity for firm 𝑖 in period 𝑡.
+
University of Ghana http://ugspace.ug.edu.gh

76
GHS (Million)
Covariates
𝑃𝐴𝑌𝑖𝑡 Dividend Pay-out; dividend per share earnings per
share for firm 𝑖 in period 𝑡
+
𝐼𝑁𝐹𝑡 Inflation; (Ratio) -
𝐼𝑅𝑡 Interest rate; (Ratio) -
𝐸𝑋𝑅𝑡 Exchange rate; (Ratio) + \ -
𝐺𝐷𝑃𝑡 Gross Domestic Product; (Ratio) +
Control Variables
𝑆𝐼𝑍𝐸𝑖𝑡 Firm Size; natural logarithm of total assets for firm 𝑖 in
period 𝑡
+
𝐿𝐸𝑉𝑖𝑡 Leverage; Capital structure; ratio of total debt to book
value of total assets for firm 𝑖 in period 𝑡 (Ratio)
-
𝐺𝑅𝑂𝑊𝑇𝐻𝑖𝑡 Growth; in sales for firm 𝑖 in period 𝑡 (Ratio) +
𝜀𝑖𝑡 represents error term for firm 𝑖 in period 𝑡
University of Ghana http://ugspace.ug.edu.gh

77
4.3.2 Diagnostic tests
Multicollinearity
The existence of multicollinearity in the model estimates leads to higher standard errors
which makes inferences problematic (Green, 2008). Consequently, it is typical to test for
multicollinearity before subjecting the model estimates to critical analysis. This study thus
adopts the Variance Inflation Factor (VIF) to test for the magnitude of multicollinearity in
the data.
4.3.3 Panel Unit Root Test
Most time series or cross-sectional data over a period (panel data) are generally non-
stationary. This implies that the variables often do not revolve around a constant average.
The usage of these variables at their levels generates spurious results which would have no
meaning in informing policy (Gujarati, 2003).
To avoid this problem, all the variables employed in the study were critically subjected to
unit root test. Among the available unit root tests (Dickey & Fuller,1979; Levin & Lin,
1993; Levin, Lin & Chu, 2002), the framework of (Im, Pesaran, & Shin, 2003) is adopted
for the study. Unlike the tests of the former, the latter controls for heterogeneity in
autoregressive coefficients and solves issues of serial correlation (Ekanayake & Long,
2012).
The basic equation underpinning the (Im, Pesaran, & Shin, 2003) panel unit root tests is
specified as follows:
University of Ghana http://ugspace.ug.edu.gh

78
itjti
j
ijtiiiit yy
11
(4)
Where ity represents each variable under consideration in the study. i stands for the fixed
effect and is used to make the residuals uncorrelated over time. The null hypothesis is
that i is zero verses the alternative hypothesis which maintains that i is less than zero.
(see Gujarati, 2003; Green, 2008). The (Im, Pesaran, and Shin, 2003) model is computed
by averaging the individual Dickey-Fuller statistic as follows:
N
i
iTtN 1
1t (5)
Where iTt is the Dicky-Fuller t-statistic for firm i based on the company specific Dicky-
Fuller regression which follows the standard normal distribution asymptotically
(Ekanayake & Long, 2012).
4.3.4 Panel Cointegration Tests
Although variables may be found to be non-stationary, there may be a long run relationship
among them in the regression model. This phenomenon is referred to as Cointegration
(Gujarati, 2003).
In order to examine the long run effect of the predictors on firms’ performance or the
cointegrating relationship between the variable, the study employs the standard panel tests
for cointegration proposed by (Pedroni, 1999, 2004). The Pedroni test allows for
heterogeneity in the intercept and slopes of the cointegrating equation. The tests provide
seven (7) test statistics: Within dimension (panel tests) and between dimension group tests.
University of Ghana http://ugspace.ug.edu.gh

79
These include: Panel v-statistic, Panel Philips-Perron type - statistic, Panel Philips-
Perron type t-statistics, Panel Augmented Dickey-Fuller type t-statistics, Group Philips-
Perron type - statistic, Group Philips-Perron type t-statistic and Group Dickey-Fuller
type t-statistic.
In the spirit of the Pedroni test, these statistics are based on the averages of the individual
autoregressive coefficients connected with the unit root tests of the residuals for each
company in the panel. All the seven test statistics are distributed asymptomatically as
standard normal.
Panel Causality Test
The Pedroni panel co-integration method tests only the existence of long run relationship
among the variables. As a result, the test does not reveal the direction of causality when
the variables are co-integrated (Ekanayake & Long, 2012).
Traditionally, Causality of the long run relationship of variables is tested with the
benchmark framework of the Engel and Granger causality procedure (Green, 2008).
(Holtz-Eakin et.al, 1988, 1989) provide a framework for detecting the causality in panel
studies. For a two-variable model, being co-integrated, the causality equation is modelled
as lags of the dependent and explained variables as follows:
ityikit
K
k
k
J
j
kitj fXY
1
itY (13)
University of Ghana http://ugspace.ug.edu.gh

80
itximit
M
m
m
L
l
litl fYX
1
itX (14)
Where itY and itX are the two cointegrated variables. The (Holtz-Eakin et.al., 1988; 1989)
model extends the standard Engel and Granger test by adding the terms xif and yif to
capture the individual fixed effects for the panel member i.
Following (Holtz-Eakin et.al.,1988; 1989), study specifies the granger causality model for
firm performance and pay-out ratio, due to their peculiar interest in the study. The models
are as follows:
iti
S
s
its
R
r
ritrit XROAROA 12 (15)
iti
V
v
itV
U
u
uituit ROAXX 122 (16)
iti
X
x
itx
W
w
witwit XROEROE 12 (17)
iti
D
d
itd
Z
z
zitzit ROEXX 122 (18)
University of Ghana http://ugspace.ug.edu.gh

81
4.4 Measurement and Description of Variables
In measuring the performance of firms, researchers such as (Baptista et al., 2011) and (Lam
and Lee, 2008) used accounting-based criteria as financial performance indicators (Return
on Assets-ROA and Return on Equity- ROE).
In Ghana, (Amidu, 2007) employed both accounting and marketing-based criteria, thus,
return on Equity and Tobin’s q in measuring the performance of firms from 1997 to 2004.
This study used two accounting based (ROE and ROA) financial performance indicator as
dependent variable.
Dependent Variable
Following (Amidu, 2007), this study uses two accounting measures of performance, Return
on Equity (ROE) and Return on Assets, as the dependent variable serving as proxy for
performance of firms listed on the GSE.
ROE defines the earnings a firm makes after interest and taxes on total equity whilst ROA
defines the earnings a firm makes before interest and taxes on total assets.
Independent Variables
The importance of monetary policy effect cannot be underestimated as it affects all sectors
of the economy. Through the cost of debt and the availability of money and credit,
monetary policy could affect a firm's ability to access external sources of fund. Fiscal
policies affect a firm’s after tax net cash flow, its cost of capital, and keenly the demand
for its products, and survival.
University of Ghana http://ugspace.ug.edu.gh

82
Studies like (Wadhwani, 1986; Davis, 1995; and Robson, 1996) argue that increases in
interest and inflation rates influence firms’ survival and performance. The four
macroeconomic variables inflation, interest rate, exchange rate, and gross domestic product
defined in Table 4.1 are the first set of independent variables considered for this study.
These macroeconomic variables are the main predictors of the outcome of this study.
The second set of predictors considered for this study is dividend pay-out. Dividend pay-
out is measured as dividend per share in line with (Hashim et al., 2013). This points at a
firm’s capacity to pay dividends over the years under study.
Normally, as dividends are regularly paid to stockholders by firms, the actions of
management to perform creditably are regulated to continue the policy. Therefore, whether
to increase the dividend payment policy, maintain previous payments or not to pay at all
may be decided through policy.
Subsequently, as firms employ regular dividend pay-out, performance is more likely to
increase in the short term whilst firms that adopt irregular dividend pay-out may increase
performance but normally in the long run because of the investments such firms may retain
funds to undertake such worthy projects (Oppong, 2015).
On this premise, dividend pay-out may be deemed to either positively or negatively affect
firms’ performance depending on the time horizon. In this study, dummy variables were
used to represent the presence or absence of dividend pay-out (1= Dividend payment policy
0= No dividend payment policy) and if the firms have such policy in place, dividends given
to shareholders was captured as pay-out.
University of Ghana http://ugspace.ug.edu.gh

83
In order to avoid misspecification errors (Green, 2008; Gujarati, 2003), some control
variables are included in the models. These control variables included firm’s age, size,
leverage, growth, liquidity, capitalization, industry effect, and period (year).
Size
Firms generally have relatively easy access to the financial market as they grow and mature
and therefore become less and less dependent on funds generated internally for any form
of investment. This allows them to pay higher dividends to investors which is an indication
of high performance.
Also, larger firms enjoy economies of scale and therefore pay lower transaction cost as
compared to smaller ones.
It is therefore expected that size of a firm has positive impact on its performance. A proxy
for firm size is the logarithm of total assets to control for size differences across the sample
firms.
Growth
Firms that find themselves in growth phase have the potential to gain more as they are
exposed to investment opportunities. Due to the lack in strength at this point to overly
depend on the financial market, firms in the growth phase tend to finance these
University of Ghana http://ugspace.ug.edu.gh

84
opportunities from internally generated funds, thus, such firms have to retain more in order
to enhance performance.
According to (Oppong, 2015), mature companies are likely to be in low growth phase and
less attractive investment opportunities, these firms do not have any incentive to retain
more as a result of less capital expenditure firms, growth in income have been set as a
control variable which is expected to have a positive impact on firms’ ROE and ROA.
Leverage
This is also known as capital structure.
For a firm to have high debt ration means that that firm will inadvertently have high interest
expense. This will push the firm to experience low net income and thus less and less
earnings will be available for shareholders.
Performance may thus be affected by the financing and investment plans particularly where
firms are highly leveraged. Earnings of firms that are highly leveraged are riskier and
volatile. Highly leveraged firms appear to underperform (Oppong, 2015). It is therefore
expected that an inverse association be seen in leverage and firms’ ROE and ROA.
University of Ghana http://ugspace.ug.edu.gh

85
CHAPTER FIVE
PRESENTATION AND DISCUSSIONS OF RESULTS
5.0 Introduction
This chapter presents the study results and discussions. The chapter begins with the
descriptive statistics and correlation matrix. It subsequently presents the diagnostic tests
frameworks.
Specifically, the multicollinearity test, panel unit root test, panel co-integration test, and
panel causality test. It finally delves into the estimation, presentation and discussion of the
results emanating from the fixed effect models.
5.1 Descriptive Statistics
Here, we present the descriptive statistics of the variables used in the study. These statistics
are estimated to enable the researcher to identify and correct the issues of extreme values
in the data.
The primary descriptive measures used are the mean (average), standard deviation, and the
range (minimum and maximum value of the variables) for the period under consideration.
Given the nature of the data (i.e. panel data), other statistics estimated are the overall
statistics, variations in the means of the explained and explanatory variables with regards
to between companies and within companies. Table 5.1 presents the descriptive statistics
of the study.
University of Ghana http://ugspace.ug.edu.gh

86
The panel data is unbalanced with 30 companies, spanning 2007 to 2015. Apart from
company size, Table 5.1 shows that the variations in mean within companies from ROA,
ROE, Growth, pay-out and leverage exceed the between variations.
This indicates that with time the variables tend to be different within a particular company
than it does across companies used in this study. The significant variations imply that the
data contains panel effect (Gujarati, 2003; Green, 2008) which makes panel modelling
suitable for the study.
Table 5.1: Descriptive Statistics
Variable
Mean Std.
Dev.
Min Max Observations
ROE
Overall 10.08 233.79 -2766.61 371.28 N = 270
Between
91.08 -377.11 37.57 n = 30
Within
215.89 -2499.42 370.57 T = 9
ROA
Overall 3.40 55.09 -4.33 905.21 N = 270
Between
18.35 -0.30 100.58 n = 30
Within
52.04 -97.43 808.03 T = 9
SIZE
Overall 6.24 1.65 0.00 9.32 N = 270
Between
1.28 3.98 8.94 n = 30
Within
1.06 -1.02 7.83 T = 9
LEV
Overall 4.87 17.89 -13.78 267.55 N = 270
Between
8.34 -2.09 46.07 n = 30
Within
15.89 -41.20 226.35 T = 9
University of Ghana http://ugspace.ug.edu.gh
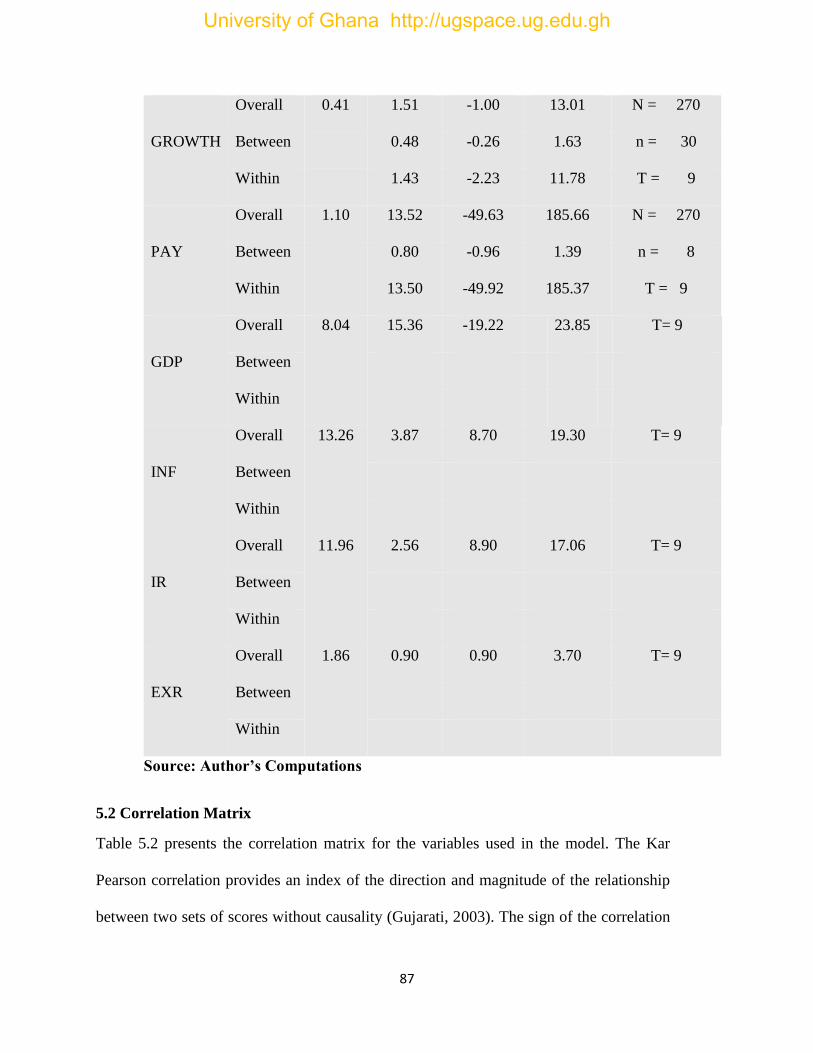
87
GROWTH
Overall 0.41 1.51 -1.00 13.01 N = 270
Between
0.48 -0.26 1.63 n = 30
Within
1.43 -2.23 11.78 T = 9
PAY
Overall 1.10 13.52 -49.63 185.66 N = 270
Between 0.80 -0.96 1.39 n = 8
Within 13.50 -49.92 185.37 T = 9
GDP
Overall 8.04 15.36 -19.22 23.85 T= 9
Between
Within
INF
Overall
Between
Within
13.26 3.87 8.70 19.30 T= 9
IR
Overall 11.96 2.56 8.90 17.06 T= 9
Between
Within
EXR
Overall 1.86 0.90 0.90 3.70 T= 9
Between
Within
Source: Author’s Computations
5.2 Correlation Matrix
Table 5.2 presents the correlation matrix for the variables used in the model. The Kar
Pearson correlation provides an index of the direction and magnitude of the relationship
between two sets of scores without causality (Gujarati, 2003). The sign of the correlation
University of Ghana http://ugspace.ug.edu.gh

88
coefficient gives the direction of the relationship. According to Gujarati (2003) the
correlation matrix is useful to the extent that it shows whether there are elements of
multicollinearity present in the data.
Apart from the correlation between Leverage and ROE which stands at -0.69, results from
Table 5.2 show that there exists low correlation between the firm performance indicator,
ROE and the independent variables since all the correlation coefficients are less than 0.5
(Gujarati, 2003).
With reference to ROA, low correlation is recorded for all including Leverage since the
highest correlation of --0.448 recorded for its correlation with Inflation is still less than 0.5.
Except growth in sales which show a high correlation of about -0.679 with interest rate, all
the firm-specific (controlled) indicators recorded low correlations among other
independent variables. Moreover, most of the macroeconomic indicators show high
correlation among themselves and thus the issue of multicollinearity is likely to be present
in the data (Gujarati, 2003).
University of Ghana http://ugspace.ug.edu.gh

89
Table 5.2: Correlation Matrix of Variables
ROE ROA SIZE LEV GROWTH PAY GDP INF IR EXR
ROE 1 -.003 -.050 -.691 .047 .022 -.069 -.366 -.259 .212
.958 .415 .000 .443 .720 .861 .333 .502 .584
270 270 270 270 270 270 9 9 9 9
ROA -.003 1 -.084 -.007 .020 -.005 -.027 -.448 -.427 -.146
.958 .171 .913 .742 .929 .945 .226 .252 .709
270 270 270 270 270 270 9 9 9 9
SIZE -.050 -.084 1 .154 .110 -.036 -.088 -.307 -.123 -.324
.415 .171 .011 .072 .552 .821 .422 .752 .394
270 270 270 270 270 270 9 9 9 9
LEV -.691 -.007 .154 1 -.010 .000 .086 .170 -.126 -.283
.000 .913 .011 .871 .998 .826 .661 .748 .461
270 270 270 270 270 270 9 9 9 9
GROWTH .047 .020 .110 -.010 1 -.011 .411 -.489 -.679 -.341
.443 .742 .072 .871 .858 .272 .182 .044 .369
270 270 270 270 270 270 9 9 9 9
PAY .022 -.005 -.036 .000 -.011 1 -.010 -.251 -.451 -.200
.720 .929 .552 .998 .858 .979 .515 .224 .605
270 270 270 270 270 270 9 9 9 9
GDP -.069 -.027 -.088 .086 .411 -.010 1 -.685 -.626 -.633
.861 .945 .821 .826 .272 .979 .042 .071 .067
University of Ghana http://ugspace.ug.edu.gh

90
9 9 9 9 9 9 9 9 9 9
INF -.366 -.448 -.307 .170 -.489 -.251 -.685 1 .788 .337
.333 .226 .422 .661 .182 .515 .042 .012 .375
9 9 9 9 9 9 9 9 9 9
IR -.259 -.427 -.123 -.126 -.679 -.451 -.626 .788 1 .295
.502 .252 .752 .748 .044 .224 .071 .012 .442
9 9 9 9 9 9 9 9 9 9
EXR .212 -.146 -.324 -.283 -.341 -.200 -.633 .337 .295 1
.584 .709 .394 .461 .369 .605 .067 .375 .442
9 9 9 9 9 9 9 9 9 9
Source: Author’s Estimates
5.3 Hausman test
Before the estimation of a panel regression, the Hausman test is used to make a choice
between the fixed effect model and the random effect model of panel data analysis.
The Hausman test can detect which of these two models is superior to the other. The null
hypothesis of the Hausman test is that random effect is the preferred model and the
alternative hypothesis is that the fixed effect model is preferred. When the null hypothesis
is rejected, it indicates that cross sectional unit random effects are correlated with the
regressors; therefore, the fixed effect model is superior to the random effect model.
University of Ghana http://ugspace.ug.edu.gh

91
Nonetheless, if we fail to reject the null hypothesis then the random effect is preferable
implying there is no correlation between the unique errors and the explanatory variables.
The results of the Hausman’s test for the two models are presented in Table 5.3 and 5.4
Table 5.3: Hausman test for the ROE model
Coefficients
(b) (B) (b-B) Sqrt (diag(v_b-V_B)
fe re Difference S.E.
SIZE -1.962 -0.166 -1.796 2.925
LEV -8.836 -0.984 -7.852 3.630
GROW -58.051 -0.794 -57.257 12.226
PAY 21.072 1.655 19.417 3.503
GDP -1.557 -0.386 -1.171 1.212
INF -4.715 -0.576 -4.139 1.872
IR -3.208 -0.259 -2.949 2.068
EXR 11.438 0.326 11.112 7.273
b = consistent under Ho and Ha; obtained from xreg
B = inconsistent under Ha, efficient under Ho; obtained from xreg
Test: Ho: difference in coefficients not systematic
Chi2(5) = (b -B)’ [V_b-V_B) ^ ( -1)] (b – B)
= 600.21
Prob > Chi2 = 0.0000
Source: Author’s Estimations
University of Ghana http://ugspace.ug.edu.gh
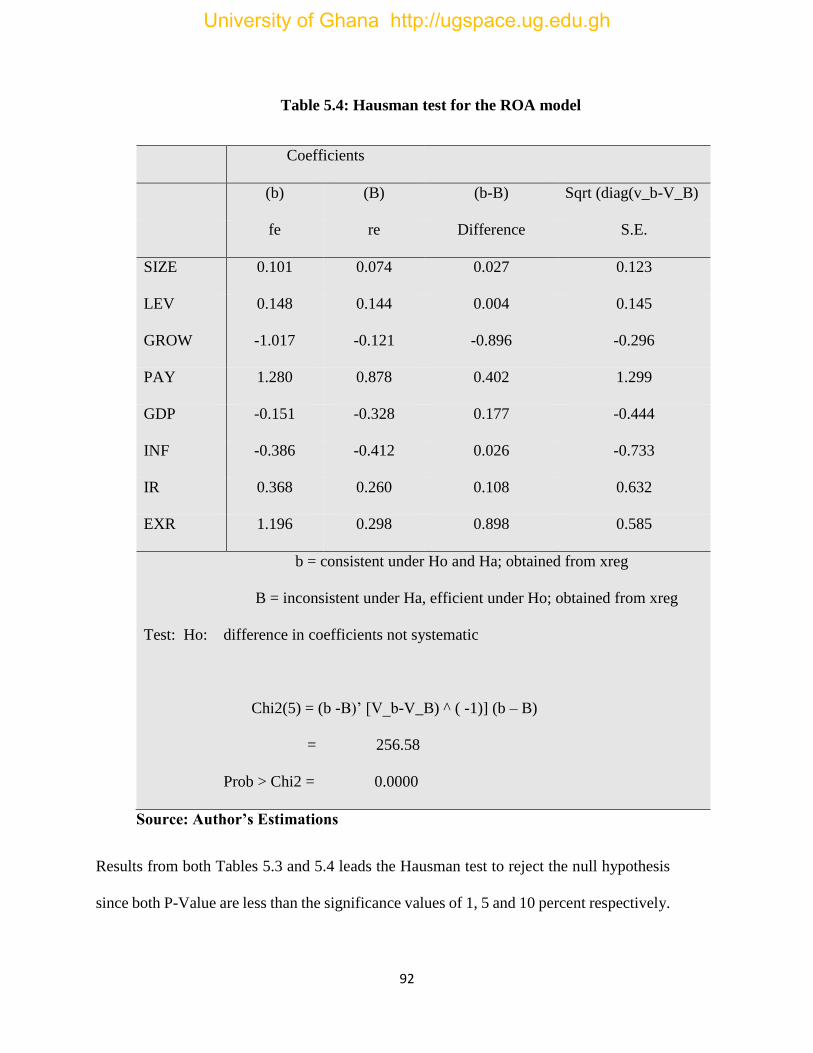
92
Table 5.4: Hausman test for the ROA model
Coefficients
(b) (B) (b-B) Sqrt (diag(v_b-V_B)
fe re Difference S.E.
SIZE 0.101 0.074 0.027 0.123
LEV 0.148 0.144 0.004 0.145
GROW -1.017 -0.121 -0.896 -0.296
PAY 1.280 0.878 0.402 1.299
GDP -0.151 -0.328 0.177 -0.444
INF -0.386 -0.412 0.026 -0.733
IR 0.368 0.260 0.108 0.632
EXR 1.196 0.298 0.898 0.585
b = consistent under Ho and Ha; obtained from xreg
B = inconsistent under Ha, efficient under Ho; obtained from xreg
Test: Ho: difference in coefficients not systematic
Chi2(5) = (b -B)’ [V_b-V_B) ^ ( -1)] (b – B)
= 256.58
Prob > Chi2 = 0.0000
Source: Author’s Estimations
Results from both Tables 5.3 and 5.4 leads the Hausman test to reject the null hypothesis
since both P-Value are less than the significance values of 1, 5 and 10 percent respectively.
University of Ghana http://ugspace.ug.edu.gh

93
This implies that the fixed effect model is superior to the random effects model, for
explaining either ROA or ROE.
5.4 Results of the Diagnostic Tests
5.4.1 Multicollinearity tests
As already indicated, the presence of multicollinearity inflates the standard errors of the
parameter estimates leading to inferential problems. In accordance with (Gujarati, 2003;
Green, 2008), the VIF was employed in estimating the extent of multicollinearity in the
data. Table 5.5 presents these results. Some VIFs are greater than 5, indicating that there
exists multicollinearity in the variables under study for both models.
This implies that at least one or more of the independent variables are linearly correlated.
Hence, estimates and interpretations resulting from such data may be weak (Ekanayake &
Long, 2012).
We observe from the correlation matrix in Table 5.2 that inflation, gross domestic product,
interest rate, and exchange rate show high correlation with each other and are therefore
suspected to be the culprit for multicollinearity.
University of Ghana http://ugspace.ug.edu.gh

94
Table 5.5: Results of Multicollinearity tests
ROA ROE
Variable VIF 1/VIF VIF 1/VIF
SIZE 14.15 0.070671 2.232 0.448
GROWTH 7.69 0.130039 3.689 0.271
LEVERAGE 6.18 0.161812 2.986 0.335
PAY 7.61 0.131406 1.604 0.623
INF 5.63 0.17762 4.977 0.201
IR 12.32 0.081169 4.481 0.223
GDP 24.31 0.041135 5.203 0.192
EXR 3.30 0.30303 6.402 0.156
Source: Author’s Estimations
It becomes very necessary to remove some of these variables causing the problem of
multicollinearity from the model. In addressing this problem, (Frost, 2017) suggests three
methods including principal component analysis (PCA), variable removal, and centring the
various independent variables on their respective means.
This study used the backward approach of the variable removal method and by doing so,
exchange rate, gross domestic product, and interest rate were found to be the lead variables
causing the problem of multicollinearity for the ROA model (i.e. model 2). Whilst
exchange rate, gross domestic product, and inflation were found to be the lead variables
causing the problem of multicollinearity for the ROE model (i.e. model 3).
University of Ghana http://ugspace.ug.edu.gh

95
These variables were then removed from their respective models. VIFs for both models
after applying the variable removal method are all less than 5 as shown in Table 5.6. Hence,
we conclude that there may still exist some form of multicollinearity within the remaining
variables explaining variations within firm performance, but they are not severe to cause
further problems in interpretations of results for our regression (Frost, 2017).
Table 5.6: Results of Multicollinearity Tests after Removing Variables
ROA ROE
Variable VIF 1/VIF VIF 1/VIF
SIZE 2.155 0.464 1.464 0.683
LEVERAGE 2.781 0.360 1.772 0.564
GROWTH 3.601 0.278 3.034 0.330
PAY 1.369 0.730 1.348 0.742
INF 2.638 0.379 N/A N/A
IR N/A N/A 2.376 0.421
Source: Author’s Estimations
5.4.2 Panel Unit root test
The results of the panel unit root tests are shown in Table 5.7 below. The test held that all
companies have unit roots with regards to their variables against the alternative hypothesis
that at least some panel members are without unit root.
The test reveals that all the variables are stationary even at 1 percent significance level for
the “individual effect and individual effect with trend” tests since they all produced
University of Ghana http://ugspace.ug.edu.gh

96
significant probability values smaller than 1%. Hence, employing our variables in a “level
estimation” would yield the most authentic results (Green, 2008).
Table 5.7: Results of Panel Unit Root tests for Variables
Variable With only individual effect With individual effect and
trend
ROA 0.0001 0.0003
ROE 0.0001 0.0006
SIZE 0.0001 0.0002
GROWTH 0.0009 0.0008
LEV 0.0005 0.0004
PAY 0.0008 0.0000
GDP 0.0003 0.0001
INF 0.0007 0.0009
IR 0.0001 0.0001
EXR 0.0004 0.0004
Source: Author’s Estimations
5.4.3 Results of Panel Cointegration test
Having established with the panel unit root test that the variables are integrated, it has
become essential to perform a co-integration test. Table 5.8 presents the Padroni panel co-
integration test results.
University of Ghana http://ugspace.ug.edu.gh

97
Out of the eleven Padroni’s statistics, seven rejects the null hypothesis that there is no
cointegration between the variables. This implies that there is long run relationship
between firms’ performance and pay-out ratio, size, leverage, growth of sales, and the
suggested macroeconomic variables.
Table 5.8: Results of Pedroni Co-integration tests
Prob
Panel v-Statistic 0.0007
Panel rho-Statistic 0.0002
Panel PP-Statistic 0.0000
Panel ADF-Statistic 0.0004
Group rho-Statistic 0.0003
Group PP-Statistic 0.0001
Group ADF-Statistic 0.0012
Source: Author’s Estimation
5.5 Econometric Results and Discussions
The regression results are shown in table 5.9 below. As already indicated, the ROA and
ROE are estimated using the fixed effect technique. All the models are estimated to produce
robust standard errors. The inclusion of robust standard errors helps in containing the
econometric problems of heteroscedasticity (Green, 2008).
Results from Table 5.9 show that individual effects of the predictor variables join forces to
form significant models to explain variations in ROE and ROA by 96% and 98%
respectively since the models recorded R2 values of 0.963 and 0.980. Indeed, these values
University of Ghana http://ugspace.ug.edu.gh

98
indicate considerable aggregate explanatory power for the estimated models. Nevertheless,
both models are judged to be significant at the 5% significance level since they recorded
considerable high F-values with associated significant probabilities less than 5%.
Table 5.9: Model Summary and ANOVA F-test
Model
Sum of
Squares df
Mean
Square F
R2 Adj. R2
Sig.
ROA Regression 0.048 5 0.010 15.806 0.963 0.902 0.023
Residual 0.002 3 0.001
Total 0.049 8
ROE Regression 7096.935 5 1419.387 29.840 0.980 0.947 0.009
Residual 142.700 3 47.567
Total 7239.635 8
Source: Author’s Estimation
At the 10% significance level, results of the regression shown in Table 5.10 depict that five
out of the eight variables including LEV, PAY, GROWTH, SIZE and INF significantly
influence ROA since they recorded probability significant values which are less than 10%.
At the 5% significance level on the other hand, results confirm that four out of the eight
variables including LEV, PAY, GROWTH, and IR influence ROE. Thus, these variables
significantly contribute to the models in predicting the relationship between firm
performance (ROA and ROE) and macroeconomic variables.
University of Ghana http://ugspace.ug.edu.gh

99
Table 5.10: Coefficient Estimates
Model
Unstandardized
Coefficients
Standardized
Coefficients
t Sig. B Std.
Error
Beta
ROA (Constant) 0.430 0.076 5.667 0.011
SIZE -0.024 0.008 -0.493 -3.040 0.056
LEV 0.022 0.008 0.484 2.629 0.078
GROWTH 0.203 0.040 1.070 5.106 0.015
PAY 0.078 0.010 0.972 7.525 0.005
INF -0.019 0.004 -0.911 -5.078 0.015
ROE (Constant) 123.190 22.357 5.510 0.012
SIZE -1.901 1.821 -0.102 -1.044 0.373
LEV -9.654 1.867 -0.558 -5.171 0.014
GROWTH 49.193 10.271 0.676 4.789 0.017
PAY 11.551 2.890 0.376 3.997 0.028
IR -7.457 1.466 -0.635 -5.086 0.015
Source: Author’s Estimation
5.5.1 Effect of Macroeconomic Variables on Firm Performance
To investigate the effect of macroeconomics on firm performance, we perform a partial
regression to determine the contribution of the significant macroeconomic variables given
that SIZE, LEV, GROWTH, and PAY are already contributing to the firm performance
effect.
University of Ghana http://ugspace.ug.edu.gh

100
Table 5.11 present the results for the model summary and ANOVA F-test for the partial
regression. According to results of Table 5.11, we observe that macroeconomic
determinants including IR and INF significantly influence firm performance indicators
(ROE and ROA) since they recorded significant values less than 5% for their respective
models.
However, these macroeconomic determinants alone do not have enough explanatory power
to explain variations in both ROE and ROA since the partial regression performed for these
variables recorded low R2 values.
Table 5.11: Model Summary for the Partial Regression
R2 Adj. R2 Sig.
ROA 0.405 0.271 0.043
ROE 0.467 0.387
0.018
Source: Author’s Estimation
Results from Table 5.10 show that INF and IR are the two macroeconomic variables that
significantly affect firm performance. The results further establish that INF affect ROA
whilst IR on the other hand affect ROE. A negative coefficient value of -0.019 recorded
for INF in the ROA model explains that a percentage increase in INF reduces firm
performance (ROA) by 0.02%.
Similarly, a negative coefficient value of -7.457 recorded for IR in the ROE model explains
that a percentage increase in IR also reduces firm performance (ROE) by 7.46%.
University of Ghana http://ugspace.ug.edu.gh

101
5.5.2 Effect of Dividend Pay-Out ratio on Firm Performance
The results further reveal that dividend pay-out ratio increases firm performance in Ghana.
The result is statistically significant at the 5 percent significance level in both the ROE and
ROA models.
For a percentage increase in dividend pay-out, ROE and ROA increases by 11.55 and 0.08
percent respectively. This implies that a corporate policy that focuses on high dividend
pay-out would attract higher performance.
The results are consistent with (Arnott & Asness, 2003) and (Zhou & Ruland, 2006).
(Arnott & Asness, 2003) explain that the positive relationship is driven by sticky dividends
combined with mean reversion in more volatile earnings.
5.5.3 Effects of Leverage, Size and Growth on Firm Performance
The study finds that leverage affects firm performance (ROE) negatively. In terms of
magnitude, the results indicate that a percentage increase in leverage reduces firm
performance (ROE) by 9.65 percent whilst it appears to increase firm performance (ROA)
by 0.02 percent. Statistically this is significant at 5 percent.
Additionally, growth in company sales affects both ROE and ROA positively, a finding
that is statistically significant at 5 percent. This finding confirms the views of (Velnampy
& Nimalathasan, 2009) and (Velnampy, 2013).
A percentage increase in GROWTH increases firm performance (ROE and ROA) by 49.19
and 0.20 percent respectively. This is probably because, growth in sales encourages
University of Ghana http://ugspace.ug.edu.gh

102
companies to expand which impacts their financial performance positively. The results
therefore suggest that corporate policies that lead to sales growth must be strengthened to
ensure sustainable firm growth.
Again, a percentage increase in SIZE significantly reduces firm performance (ROE) by
0.02 percent. This result is statistically significant at the 5% significance level.
5.6 Panel Causality test results
The panel causality test results are shown in Table 5.12 below. The test was undertaken
with the Wald Causality results.
This tests the null hypothesis that macroeconomic variables (inflation and interest rates) do
not cause firm performance against the alternative that macroeconomic variables (inflation
and interest rates) cause firm performance.
The test rejects the null hypothesis at 5 percent significance for ROE and ROA respectively
against the associated macroeconomic variables. The results imply that inflation causes
ROA whilst interest rate causes ROE.
Table 5.12: Wald Causality Results
Null hypothesis Inflation does
not cause
ROA
ROA does
not cause
Inflation
Interest rate
does not
cause ROE
ROE does not
cause Interest
rate
2 5.078 0.887 4.070 1.987
P-value 0.015 0.401 0.045 0.302
University of Ghana http://ugspace.ug.edu.gh

103
CHAPTER SIX
SUMMARY, CONCLUSIONS AND POLICY RECOMMENATION
6.0 Introduction
This chapter presents a brief overview of the preceding chapters in this study. It also covers
the summary of findings, conclusions, policy recommendations and limitations of the
study.
6.1 Summary of Findings
The role of macroeconomics on firm performance has attracted attention of economists for
decades due to the complexity in formulating corporate policies in achieving success
among many organizations.
Whiles some scholars have found positive evidence of macroeconomics on firm
performance, others maintain that macroeconomics has no significant impact on
performance.
Despite the contradicting views on the relationship between macroeconomics and firms’
performance globally, few empirical evidence exist in Ghana and even those that exist are
limited to few firms, such as banking and manufacturing firms (Amidu & Abor, 2006;
Amidu, 2007).
This study generally sought to examine the relationship between macroeconomics and
firm’s performance. Additional objectives were to evaluate the significant effects of key
macroeconomic variables on firm performance. The study also sought to ascertain the
University of Ghana http://ugspace.ug.edu.gh

104
direction of causality between firm performance and keenly significant macroeconomic
variables.
Following literature, ROE and ROA were selected as proxy for firm performance and
suggested independent variables included were growth in the sales of the firms, total assets,
leverage, dividend pay-out, and key macroeconomic variables (GDP, inflation, interest,
and exchange rates).
To address the above objectives, the study made use of panel data of the firms listed on the
Ghana Stock Exchange running from 2007 to 2015. Two panel econometric models were
estimated using a fixed model technique for both ROE and ROA.
In addition to these models, a panel causality model was espoused to effectively address
the direction of causality between firm performance and the significant macroeconomic
variables.
In accordance with literature, the necessary diagnostic tests were performed to ensure that
the parameter estimates are efficient and consistent for inferential purposes. Particularly,
multicollinearity, panel unit roots, Hausman, and panel cointegration tests were performed.
The multicollinearity tests showed that the degree of collinearity was higher than the
threshold of ten provided by the Variance Inflation Factor for some of the variables,
indicating that multicollinearity is a likely problem within the variables.
However, the backward approach of the variable removal method was used to address the
problem of multicollinearity. The panel unit roots test indicated that all the variables were
integrated. Following the panel unit root test, the panel cointegration tests revealed that
University of Ghana http://ugspace.ug.edu.gh

105
long run relationship exists between the variables. The Hausman test showed that fixed
effects models are suitable for modelling firm performance (both ROE and ROA).
With regards to the first objective, the results showed that there exists a meaningful
relationship between some macroeconomic variables and firm performance. But further
analysis suggests that only macroeconomic variables lack enough explanatory power to
explain variations within firm performance.
To increase the explanatory power for analysis, variables such as dividend pay-out, growth
in company sales, leverage, and size were added to the model which increased the
explanatory power to over 96%, a very considerable value. A percentage increase in
dividend pay-out also increases ROE and ROA respectively by 11.55 and 0.08 percent.
The study finds that leverage affects firm performance (ROE) negatively. Again, a
percentage increase in leverage reduces firm performance (ROE) by 9.65 percent whilst it
increases firm performance (ROA) by 0.02 percent. A percentage increase in GROWTH
increases firm performance (ROE and ROA) by 49.19 and 0.20 percent respectively. A
percentage increase in SIZE significantly reduces firm performance (ROA) by 0.02
percent.
The study also revealed that inflation and interest rates significantly affect ROA and ROE
respectively. We found that at the 5% significance level, a percentage increase in inflation
reduces firm performance (ROA) by 0.02% and similarly, a percentage increase in interest
rate also reduces firm performance (ROE) by 7.46%.
University of Ghana http://ugspace.ug.edu.gh

106
Considering the second objective, the study revealed that at the 5% significance level, a
percentage increase in dividend pay-out increases ROE and ROA by 11.55 and 0.08 percent
respectively.
Addressing the third objective saw the estimation of the Wald causality framework. The
test found that inflation and interest rates respectively drive ROA and ROE for Ghanaian
firms.
6.2 Conclusion
Macroeconomics has stimulated academic and management discussions for decades, with
varying findings. Though results of such a key area is necessary in guiding corporate
policy, it has been lacking in the Ghanaian financial and economic literature.
The study therefore sought to fill this gap. It can be concluded that macroeconomics
especially inflation and interest rates significantly impact firm performance in Ghana,
specifically, ROE and ROA.
Also, inflation and interest rates significantly drive the performance of firms listed on the
GSE. Hence, any variable that affects inflation and/or interest rates will also likely affect
firm performance.
6.3 Policy Recommendations
Based on the findings of the study, firms are recommended to raise their current
performance for a better performance in the future. This can be achieved by making
effective use of all relevant information from the domestic and global economy in their
decision making.
University of Ghana http://ugspace.ug.edu.gh

107
Such practice would cushion them from incurring debts and liabilities which may accrue
higher interest rates to distort their equity returns.
Also, since inflation and interest rates drive firm performance, monetary policies must be
geared towards stabilizing these variables where the economy seeks to see firms operating
in it do well to grow the economy.
6.4 Limitations of the Study
The study was limited in one main area – Time.
Due to the limited time, the study could not make use of many observations to further
enrich the findings. Future studies will and must endeavour to employ several data points
for all companies listed on the GSE. This would provide a comprehensive view of the role
of macroeconomics on performance of firms listed on the GSE.
University of Ghana http://ugspace.ug.edu.gh

108
REFERENCES
Ahluwalia, M.S., (1998). Infrastructure development in India’s reforms, in I.J. Ahluwalia and
I.M.D. Little (eds.), India’s Economic Reforms and Development Essays for Manmohan Singh,
New Delhi: Oxford University Press, 87-121.
Alanazi, A. S. & Lui, B., 2013. IPO financial and operating performance: Evidence from the six
countries of the GCC., s.l.: s.n.
Al-Kuwari, D. (2009). Determinants of the dividend pay-out in emerging stock exchanges. Global
Economy & Finance Journal, 2(2), 38 – 63.
Allen, D.E. and V.S. Rachim, (1996). Dividend pay-out and stock price volatility: Australian
evidence, Applied Financial Economics, 6 (2), 175-188.
Amidu M. and Abor, J. (2006). Determinants of dividend pay-out ratios in Ghana‖, The Journal of
Risk Finance, Vol. 7, 136-145.
Amidu, M. (2007). How does dividend pay-out affect performance of the firm on Ghana stock
Exchange? Investment Management and Financial Innovations, 4(2), 104 – 112.
Arnott, D. R. and Asness, S. C. (2003). Surprise higher dividends is higher earnings growth.
Financial Analyst Journal, 70 – 87.
Aryeetey, E., Fosu, A.K., and Bwumiah, M. (2001). Explaining African Economic Growth
Performance: The Case of Ghana, African Economic Research Consortium Project on Explaining
African Economic Growth Performance, www.gdnet.org
University of Ghana http://ugspace.ug.edu.gh

109
Aryeetey, E., and F. Tarp. (2000). Structural Adjustment & After: Which Way Forward? in
Aryeetey E., Harrigan J. and Nissanke M. Currey J. (eds.) Economic Reforms in Ghana, The
Miracle and The Mirage, James Curry Ltd, Oxford.
Athanasoglou, P.P., Sophocles, N.B., & Matthaios, D.D. (2005) Bank-specific, industry-specific
and exchange rate, interest rate, inflation rate and GDP fluctuation determinants of bank
profitability. Working paper, Bank of Greece,3-4
Azam, M., Usmani, S. & Abassi, Z. (2011). The impact of corporate governance on firm’ s
performance: Evidence from Oil and Gas Sector of Pakistan. Australian journal of basic and
applied science, 5(12), 2978–2983.
Azhagaiah, R. & Priya, N. S., 2008. The Impact of Dividend pay-out on Shareholders’ Wealth.
International Research Journal of Finance and Economics, Volume 20, pp. 180-187.
Baker, M., 2007. Investor sentiments in the stock market. The national bureau of economic
research, 21(2).
Bernanke, B. S., & Kuttner, K. N. (2005). What explains the stock market's reaction to Federal
Reserve policy? The Journal of Finance, 60(3), 1221-1257.
Bhattacharya, S., (1979). Imperfect information, dividend pay-out, and “the bird in the hand”
fallacy, Bell Journal of Economics and Management Science, 10(1), 259-270.
Boyd, J. H., Hu, J. & Jagannathan, R., 2005. The Stock Market’s Reaction to Unemployment
News: Why Bad News Is Usually Good for Stocks. Journal of Finance, Volume 60, pp. 649-672.
Bozcuk, A. E. (2011). Performance effects of outside directors on corporate boards. International
Journal of Business and Social Science, 2(20), 80–84.
University of Ghana http://ugspace.ug.edu.gh

110
Bozec, R., Dia, M. & Bozec, Y. (2010). Governance – performance relationship: A Re-
examination Using Technical Efficiency Measures. British Journal of Management, 21, 684–700.
http://dx.doi.org/10.1111/j.1467-8551.2008.00624.
Brealey, R.A. & Myers, S.C. (2005). Principles of Size, leverage, agency cost, growth and risk do
not Corporate Finance, McGraw-Hill, New York.
Brigham, E. F. (1995) Fundamentals of Financial Management, Harcourt Brace College,
Publishers, Orlando, F1, pp. 423-489.
Broadstock, D. C., Shu, Y. & Xu, B., 2011. The Heterogeneous Impact of Macroeconomic
Conditions on Firms’ Earnings Forecast. Macao, Macao International Symposium on Accounting
and Finance.
Brown, P. & Ball, R., 1967. Some preliminary findings on the association between the earnings of
a firm. Its Industry, and the Economy. Journal of Accounting Research, pp. 55-77.
Chandrapala, P. & Knápková, A., 2013. Firm-Specific Factors and Financial Performance of Firms
in the Czech Republic, s.l.: Acta Universitatis Agriculturae et Silviculturae Mendelianae
Brunensis.
Chen, N. J. & Scott, A. (2004) Competition, Globalization and the Decline of Inflation, CEPR
Discussion paper series No. 4695. www.cepr.org.
Chiang, H. & Lin, M. (2011). Examining board composition and firm performance. The
International Journal of Business and Finance Research, 5(3), 15–28.
Chinwuba, O. & Amos, O. A., 2011. Stimulating Economic Development Through the Capital
Market. The Nigerian Experience. Jorind, 9(2).
University of Ghana http://ugspace.ug.edu.gh

111
Coakley, J., Flood, R., Fuertes, A. & Taylor, M. (2005). Purchasing power parity and the theory
of general relativity: the first tests. Journal of International Money and Finance 24 (2005) 293–
316 Countries. Review of Economics and Statistics, 85, 212-217
Copisarow, R. (2000). The application of microcredit technology to the UK: Key commercial and
policy issues. Journal of Microfinance/ESR Review, 2(1), 13-42.
Crowley, J. (2007). Interest Rate (2007). Interest Rate Spreads in English- Speaking Africa. IMF
Working paper. April 2007.
Davis, E. P., 1995. Debt, Financial Fragility, and Systemic Risk, Revised and Expanded Edition.
New York, Oxford University Press.
DeAngelo, H., DeAngelo, L. and Stulz, R. (2006). Dividend pay-out and the earned/contributed
capital mix: a test of the life-cycle theory. Journal of Financial Economics, 81, 227-254.
Demirguc-Kunt, A. & Levine, R., 1996. Stock Market, Corporate Finance and EconomicGrowth:
An Overview. The World Bank Review, 10(2), pp. 223-239.
Demsetz, H. & Lehn, K. (1985). The structure of corporate ownership: Causes and consequences.
Journal of political economy, 93(6), 1155-1177.
Dziwornu, R. K. & Awunyo-Vitor, D., 2013. STOCK EXCHANGE PERFORMANCE AND
ECONOMIC GROWTH IN GHANA: IS THERE A CAUSAL LINK?. Asian Journal of Empirical
Research, 3(9), pp. 1152-1165.
Easterbrook, F.H. (1984). Two agency-cost as Determinants of Dividend Pay-out Ratio. The
Explanations of dividends. The American Economic Journal of Financial Research, (3): 249-259.
Review, 74(4): 650-659.
University of Ghana http://ugspace.ug.edu.gh

112
El-Wassal, A. K., 2005. Understanding the growth in emerging stock markets. Journal of Emerging
Market Finance, 4(3), p. 227–261.
Ezeoha, A., Ogamba, E. & Oyiuke, O. N., 2009. Stock market development and privateinvestment
growth in Nigeria. Journal of Sustainable Development in Africa, 11(2), pp. 20-35.
Fama, E.F. and K.R. French, (2001). Disappearing dividends: changing firm characteristics or
lower propensity to pay? Journal of Financial Economics, 60 (1), 3-43.
Farsio, F., Geary, A. and Moser, J. (2004). The relationship between dividends and earnings.
Journal for Economic Educators, 4(4), 1 – 5.
Foong, S. S., Zakaria, N. B. & Tan, H. B., 2007. Firm Performance and Dividend-Related Factors:
The Case of Malaysia. Labuan Bulletin of International Business & Finance, Volume 5, pp. 97-
111.
Frost, J., 2017. Multicollinearity in Regression Analysis: Problems, Detection, and Solutions.
[Online]
Available at: http://statisticsbyjim.com/regression/multicollinearity-in-regression-analysis/
[Accessed 20 May 2018].
Ganguli, S. K., & Agrawal, S. (2009). Ownership structure and firm performance: An empirical
study on listed Mid-Cap Indian Companies.
Gordon, M. (1963). Determination of dividend pay-out. The evidence from Saudi Arabia,
International journal of business and social sciences. Vol 4(1).
Gordon, M. (1963). Determination of dividend pay-out. The evidence from Saudi Arabia,
International journal of business and social sciences. Vol 4(1).
University of Ghana http://ugspace.ug.edu.gh

113
Hafeez, A. & Attiya, Y.J. (2009). The Determinants of Dividend pay-out in Pakistan. International
Research Journal of Finance Economics, vol. 25: 148-171.
Haniffa, R., & Hudaib, M. (2006). Corporate governance structure and performance of Malaysian
listed companies. Journal of Business Finance and Accounting, 33(7-8),1034-1062.
Hansen, G. S. & Wernerfelt, B., 1989. Determinants of Firm Performance: The Relative
Importance of Economic and Organizational Factors. Strategic Management Journal, 10(5), pp.
399-411.
Harris, M. and A. Raviv, (1991). The theory of capital structure, Journal of Finance, 46 (1), 297-
355.
Hondroyiannis, G., Lolos, S. & Papapetrou, E., 2004. Financial markets and economicgrowth in
Greece. Journal of International Financial Markets, 15(2), pp. 173-188.
Huang, S. H. & Song, F. M., 2002. The Financial and Operating Performance of China’s Newly
Listed H-firms, s.l.: s.n.
Hunjra, A. I. et al., 2014. Impact of Micro Economic Variables on Firms Performance. Munich
Personal RePEc Archive, pp. 65-73.
Hutchinson, M., & Gull, F., (2004). Investment opportunity set, corporate governance practices,
and firm performance. Journal of Corporate Finance, 10(1), 595-614.
Ibrahim, Haslindar, & AbdulSamad, F. A. (2011). Corporate governance mechanisms and
performance of public-listed family-ownership in Malaysia. International Journal of Economics
and Finance, 3(1), 105–115.
University of Ghana http://ugspace.ug.edu.gh

114
Ismail, N., Ishak, I., Manaf, N. A. & Husin, M. M., 2018. Macroeconomic Factors Affecting
Performance of Insurance Companies in Malaysia. Academy of Accounting and Financial Studies
Journal, 22(1), pp. 1-5.
Issah, M. & Antwi, S., 2017. Role of macroeconomic variables on firms’ performance: Evidence
from the UK. Cogent Economics & Finance, 5(1), pp. 1-18.
Jagannathan, M., C.P. Stephens, and M.S. Weisbach, (2000). Financial flexibility and the choice
between dividends and stock repurchases, Journal of Financial Economics, 57 (3), 355-384.
Jensen, M.C. and Meckling, W.H. (1976). Theory of Dividend pay-out in Jordan: An Application
of the firm: Managerial behavior, agency costs and Tobit Model. Journal of Economic &
Administrative ownership structure 30, (4).
John, K. and J. Williams, (1985). Dividends, dilution and taxes: A signalling equilibrium, Journal
of Finance, 40(4), 1053-1070.
Kapopoulos, P., & Lazaretou, S. (2007). Corporate ownership structure and firm performance:
evidence from Greek firms. Corporate Governance, 15(2), 144–159.
Khan, K., Nemati, A. R. & Iftikhar, M. (2011). Impact of corporate governance on firm
performance evidence from the Tobacco Industry of Pakistan. International Research Journal of
Finance and Economics, 61, 7–14.
Klapper, L. & Love. I. (2002). Corporate governance, investor protection, and performance in
emerging markets. Washington, DC. United States: World Bank. Mimeographed document.
University of Ghana http://ugspace.ug.edu.gh

115
Kumar, A. (2013). Relationship between inflation and stock returns – evidence from BRICS
markets using panel Co integration Test. International Journal of Accounting and
FinancialReporting. Vol, 4, 2.
Kumar, J. (2006) “Corporate Governance and Dividend pay-out in India”, Journal of Emerging
Market Finance, vol. 5, no. 5: 15-58.
Liargovas, P. & Skandalis, K. S., 2010. Factors Affecting Firms' Financial Performance: The Case
of Greece. Global Business and Management Research, 2(3), pp. 141-295.
Limpanithiwat, K. & Rungsombudpornkul, L. (2010). Relationship between inflation and stock
prices in Thailand.
Lin, C. (2011). An examination of board and firm Performance: evidence from Taiwan. The
International Journal of Business and Finance Research, 5(4), 17–35.
Lins, L., 2014. Soft Dollars and Other Trading Activities. s.l., Thomson West.
Lintner, J., (1956). Distribution of incomes of corporations among dividends, retained earnings,
and taxes, American Economic Review, 46(2), 97-113.
Mashayekhi, B., & Bazazb, M. S. (2008). Corporate governance and firm performance in Iran,
4(2), 156–172. http://dx.doi.org/10.1016/S1815-5669(10)70033-3.
Matyjas, Z., 2014. Industry and Firm Influences on Performance: Evidence from Polish Public
Firms. Journal of Management Policy and Practice, 15(2), pp. 88-96.
McNamara, R. & Duncan, K., 1995. Firm performance and macro-economic variables, s.l.: Bond
University.
University of Ghana http://ugspace.ug.edu.gh

116
Miller, M.H. and K. Rock, (1985). Dividend pay-out under asymmetric information, Journal of
Finance, 40(4), 1031-1051.
Miller, M.H. and M.S. Scholes, (1978). Dividends and taxes, Journal of Financial Economics, 6,
333-364.
Miller, M.H. and Modigliani, F. (1961). Dividend pay-out, growth, and the valuation of shares,
Journal of Business, 34 (4), 411-433.
Modigliani, F. and Miller, M. H. (1961). Dividend pay-out, Growth and the Valuation of shares.
Journal of Business. PP 411.
Najid, N. A., & Abdul Rahman, R. A. (2011). Government ownership and performance of
Malaysian government-linked companies. International Research Journal of Finance and
Economics, 61, 42–56.
Ngugi, R.W.(2001). An Empirical Analysis of Interest Rate Spread in Kenya. African Economic
Research Consortium, Research Paper 106
Nissim, D. & Ziv, D., 2001. Dividend changes and future profitability. Journal of Finance, 56(6),
p. 2111–2133.
Njoroge, K.A., (2013). The relationship between interest rate and firm performance among
companies listed in NSE. MBA Thesis. University of Nairobi, Unpublished
Nuryanah, S. & Islam, S. M. N. (2011). Corporate governance and performance: Evidence from
an Emerging Market. Malaysian Accounting Review, 10(1), 17–42.
Oleka, C.D., Sabina, E.A., & Ebue, I. M. (2015). Relationship between Inflation and Firms’
Performance- Evidence. World Applied Sciences Journal. 33 (5): 814- 822,
University of Ghana http://ugspace.ug.edu.gh

117
Ongore, V.O. (2011) The relationship between ownership structure and firm performance: An
empirical analysis of listed companies in Kenya. African Journal of Business Management, 5(6),
2120-2128.
Oppong, K. (2015). Dividend pay-out and firms ‘performance: a case of listed (Doctoral
Dissertation, Kwame Nkrumah University of Science and Technology).
Osei, V., 2008. Does the stock market matter in Ghana? A granger-causality analysis. Accra, Bank
of Ghana.
Pagano, M., Panetta, F. & Zingales, L., 1998. Why do Companies go public? An Empirical
analysis. The Journal of Finance, 1(1), pp. 27-62.
Pandey, I. (2009) Financial Management. 9th Edition, Vikas publishing House.
Pandey, I. M., 2005. What Drives the Shareholer Value?, Ahmedabad: Indian Institute of
Management.
Pandya, H. (2011). Corporate governance structures and financial performance of selected Indian
Banks. Journal of Management and Public Policy, 2(2), 4-22.
Prasad, S. C. J. Green and V. Murinde, (2001., Company financing, capital structure, and
ownership: A survey, and implications for developing economies, SUERF Studies No. 12, Vienna:
SUERF.
Pruitt, S.W. and L.J. Gitman, (1991). The Interactions Economics Issue, 29: 110-125. Between the
Investment, Financing and Dividend.
Quaidoo, C., 2011. Stock Market Capitalization and Economic Growth in Ghana, Cape Coast:
Department of Economic, University of Cape Coast.
University of Ghana http://ugspace.ug.edu.gh

118
Robson, M. T., 1996. Macroeconomic Factors in the Birth and Death of U.K. Firms: Evidence
from Quarterly VAT Registration. Manchester School, Volume 64, pp. 57-69.
Ross, D. (2007). Diminishing dividend: The Union and the economy.
Ross, S.A. (1976). The Arbitrage Theory of Capital Asset Pricing. Journal of Economic Theory,
Vol. 13, pp. 341-360.
Ross, S. A., Westerfield, R. W. & Jaffe, J., 2002. Corporate Finance. 6th ed. s.l.:McGraw-Hill.
Rousseau, P. L. & Wachtel, P., 2000. Equity Markets and Growth: Gross-Country Evidence on
Timing and Outcomes, 1980–1995. Journal of Business and Finance, Volume 24, pp. 1933-1957.
Rozeff, M.S., (1982). Growth, beta and agency costs as determinants of dividend pay-out ratios,
Journal of Financial Research, 5 (3), 249-259.
Samuel Kwaku Agyei and Edward Marfo-Yiadom (2011). Dividend pay-out and Bank
Performance in Ghana, International Journal of Economics and Finance Vol. 3, No. 4; September
2011.
Sánchez-ballesta, J. P., & García-meca, E. (2007). A meta-analytic vision of the effect of
ownership structure on firm performance. Corporate Governance, 15(5), 879–894.
Sellin, P. (2005) Monetary Policy and Stock Markets: Theory and empirical evidence Journal of
Economics Surveys 15(4), 491-541
Shan, Y. G., & McIver, R. P. (2011). Corporate governance mechanisms and financial
performance in China: panel data evidence on listed non-financial companies. Asia Pacific
Business Review, 17(3), 301–324. http://dx.doi.org/10.1080/13602380903522325
University of Ghana http://ugspace.ug.edu.gh

119
Sharpe, W. F. (1964). Capital Asset Prices: A Theory of Market Equilibrium under Conditions of
Risk. Journal of Finance, 425-42.
Soumya, G. D. & Jaydeep, M., 2008. Does Stock Market Development Cause EconomicGrowth?
A Time Series Analysis for Indian Economy. International Research Journal of Finance and
Economic, Volume 21, pp. 142-149.
Stock, J. H. & Watson, M. W., 2008. Forecasting in dynamic factor models subject to structural
instability. Oxford: Oxford University Press.
Stock, J. H. & Watson, M. W., 2008. Forecasting in dynamic factor models subject to structural
instability. Oxford: Oxford University Press.
Sudharshan, R. P. & Rakesh, G., 2011. An Empirical Analysis of Stock Market Performance and
Economic Growth: Evidence from India. International Research Journal of Finance and
Economics, Volume 73, pp. 133-149.
Velnampy, T. (2006). An empirical study on application of Altman original bankruptcy forecasting
model in Sri Lankan companies.
Velnampy, T. (2013). Corporate governance and firm performance: a study of Sri Lankan
manufacturing companies.
Velnampy, T., & Nimalathasan, B. (2009). Firm Size on Profitability: A Comparative Study of
Bank of Ceylon and Commercial Bank of Ceylon Ltd in Sri Lanka. Global Journal of Management
and Business Research, 10(2), 96–100.
Vong, A, Chan, S. (2009) Determinants of Bank Profitability in Macao. Faculty of Business
Administration, University of Macau.
University of Ghana http://ugspace.ug.edu.gh

120
Wadhwani, S., 1986. Inflation, Bankruptcy, Default Premia and the Stock Market,. Economic
Journal, 96(1), pp. 20-38.
Wahla, K.-U.-R., Shah, S. Z. A., & Hussain, Z. (2012). Impact of ownership structure on firm
performance evidence from non-financial listed companies at Karachi Stock Exchange.
International Research Journal of Finance and Economics, 84, 6–13.
World Bank, 2017. World Bank. [Online]
Available at: http://pubdocs.worldbank.org/en/710231493655506452/Global-Economic-
Prospects-June-2017-Regional-Overview-SSA.pdf
[Accessed 11 may 2018].
Xiaonian, X., 1997. Building a Company Governance Mechanism and Capital Market on the base
of Corporation Structure. Reform, Volume 5.
Yartey, A. C., 2008. The determinants of stock market development in emerging economies: Is
South Africa different? Washington D. C., International Monetary Fund.
Yean, Z., 1999. The Empirical Research on influence of Financial Repression to Enterprise
Financing ability. Economic Research Journal, Issue 2.
Zeckhouser R.J. & Pound, J. (1990) “Are large shareholders’ effective monitors? An investigation
of share ownership and corporate performance”, in Hubbard, R.G. (ed.), Asymmetric information,
corporate finance and investment, Chicago: The University of Chicago Press.
Zhou, P. & Ruland, W. (2006). Dividend pay-out and Future Earnings Growth. Financial Analysts
Journal, 62(3), 58-69
University of Ghana http://ugspace.ug.edu.gh

121
Zulfiquar, Z. & Din, N. (2015). Inflation, interest rate and firms’ performance: the evidence from
textile industry of Pakistan. International Journal of Arts and Commerce. Vol 4(2).
University of Ghana http://ugspace.ug.edu.gh