the impact of liberalization and globalization on india s
TRANSCRIPT
56
The Impact of Liberalization and Globalization on India’s Agrarian Economy
V. K. Ramachandran, Indian Statistical Institute Vikas Rawal, Jawaharlal Nehru University
ABSTRACT This paper describes and analyzes the impact of policies of globalization and liberalization on the agrarian economy of India. In particular, it discusses the reversal of land reform, changes in the policies of administered agricultural input costs and output prices, cutbacks in public investment in rural physical and social infrastructure, the dismantling of the institutional structure of social and development banking, the withdrawal of quantitative restrictions on the import of agricultural products, cutbacks in the public distribution system, and the undermining of national systems of research and extension and protection of national plant and other biological wealth. The data used in the paper come from the major sources of national-level official statistics and primary data collected as part of a Project on Agrarian Relations in India. KEY WORDS agrarian economy, globalization, India, liberalization, Project on Agrarian Relations in India 1. Introduction
The subject of this paper is the impact of policies of so-called stabilization and structural adjustment, or liberalization and globalization, on the agrarian economy of India. These are policies that have been imposed, in differing degrees, on the people of the Third World by international capital and domestic bourgeoisies for more than two decades now, and we shall examine their specific form and impact on the Indian countryside (Ramachandran and Swaminathan 2002). In India, although there are continuities between the era of globalization and preceding periods, particularly after 1984, the sharp acceleration of the policies of neoliberal reform can be said to have occurred after 1991, when the Congress Government in which the present Prime Minister was first made Finance Minister came to power.
In order to understand the impact of globalization and liberalization in rural India, it is important to understand the nature of the agrarian question, and, in turn, the class character of the state in India. Landlords are a constituent part of the state in India, and nothing in the present situation has undermined landlordism as a fundamental
57
barrier to agrarian and general social progress. At the same time, the general class policies of the Indian state in the countryside, and, specifically, its collaboration with imperialism, have taken qualitatively new forms since 1991.
This paper begins with a discussion of land reform and landlordism. We discuss the interconnections between landlordism, moneylender-merchant exploitation and caste and gender oppression in the countryside, and argue that neo-liberalism has not lessened the tactical or strategic importance of addressing these issues.
Next, we attempt to show how state policy has acted as a vast depressor in the countryside, and we document the reversal of policies of administered agricultural input costs and output prices, cutbacks in public investment in rural physical and social infrastructure, the dismantling of the institutional structure of social and development banking, the withdrawal of quantitative restrictions on the import of agricultural products, cutbacks in the public distribution system, and the undermining of national systems of research, extension and the protection of national plant and other biological wealth.
The paper uses data from, first, the major sources of national-level official data, and, secondly, primary data collected as part of a larger Project on Agrarian Relations in India.
2. The Reversal of Land Reform Genuine agrarian reform alters class relations in favour of the working people,
frees demand constraints and opens up home markets in the countryside, and provides a basis for broad-based productive investment. The promise of land reform was part of our freedom movement, a promise betrayed in practice by the ruling classes in the years following Independence.
In India today, however, land reform as conceived during the Independence movement and in the first decades after Independence, has been jettisoned by official policy, and reversed in certain areas in favour of counter-reform.1 Legislation is being considered and has been passed that raises ceilings to levels that undermine the objectives of land ceiling laws and make absentee farming by large owners and corporations a certainty. Such policies reduce the extent of land for redistribution, accelerate the loss of land by poor peasants and worsen inequalities in the distribution of land.
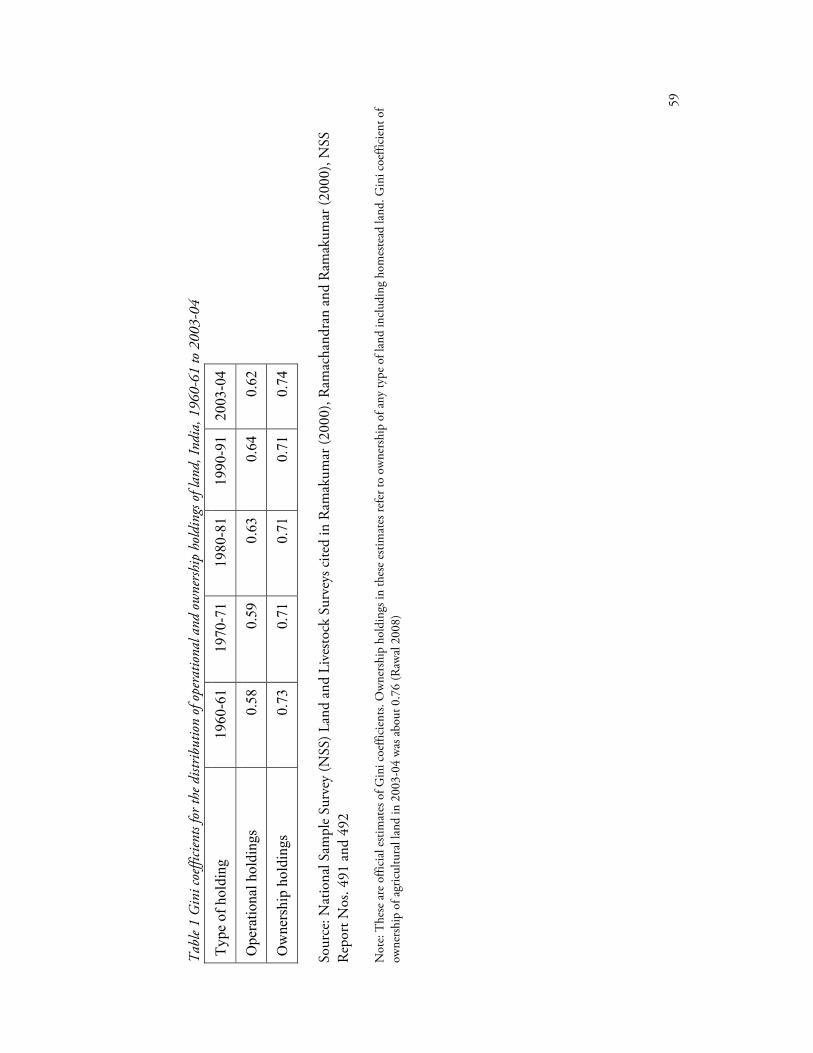
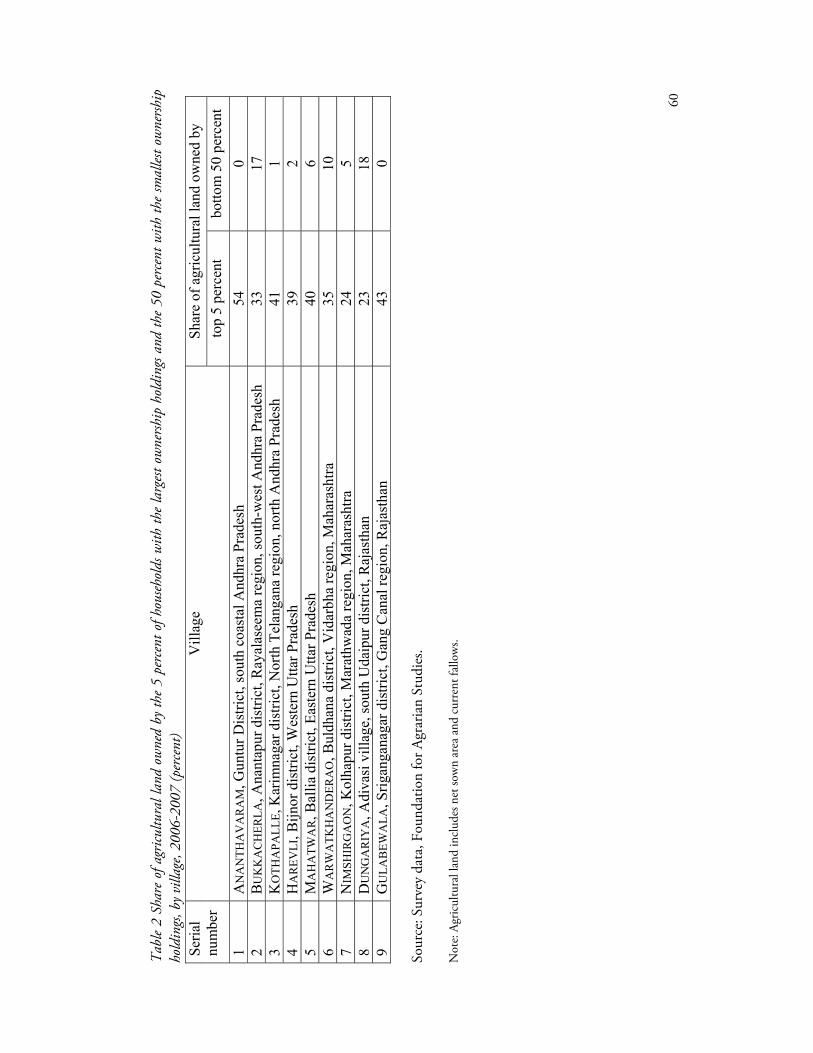
One of the objectives of land reform is the destruction of landlordism. A major feature of landlordism is the concentration of ownership of land and other assets in the hands of landlords, that is, of a class that does not work on the major manual operations on the land and is a historical participant in the land monopoly. The data are clear that the state has not abandoned the slogan of land reform because this class – and such concentration of wealth – has ceased to exist. On the contrary, data from the National Sample Survey (Table 1) and from recent village studies (Table 2) show the continuation of very sharp inequality.
In Table 1, data from the National Sample Survey (NSS) indicate that the degree of concentration in the distribution of operational and ownership holdings of land has marginally increased over the last four decades.2
Table 2 presents data from different villages across India; these are the first nine
58
villages surveyed as part of the Project on Agrarian Relations in India. As can be seen, the surveys have been conducted across a variety of agrarian regimes – in surface-irrigated, lift-irrigated, and unirrigated tracts – across the country. The immediate conclusion is that, although there are differences of degree, sharp inequalities persist in respect of the ownership of land.3
With regard to the actual redistribution of land, an estimate from official data by a senior member of the All-India Kisan Sabha4 illustrates the chasm between potential and performance in India. Working with a ceiling of 25 acres a household, ‘no less than 63 million acres of land would have been available in the mid-1950s and early 1960s for distribution among landless and land-poor farmer households’ (Mishra 2007). The reality, according to the Annual Report of the Ministry of Rural Development 2006-07, is that only 4.89 million acres of land were distributed over the first 60 years of Independence (Mishra 2007). A recent estimate based on the NSSO’s Survey on Land and Livestock Holdings (2002-03) suggests that the current extent of ceiling-surplus land is more than three times the extent of land that has ever been redistributed under land reform (Rawal 2008). 3. Public Investments in Agriculture and Rural Infrastructure (Particularly Irrigation and Roads) Slowed Down Substantially
Economists are familiar with the concept of complementarity between public and private expenditure; when the state withdraws from investment in public works, infrastructure and programs of mass employment, it robs the countryside of the foundations for growth and the means of poverty alleviation.
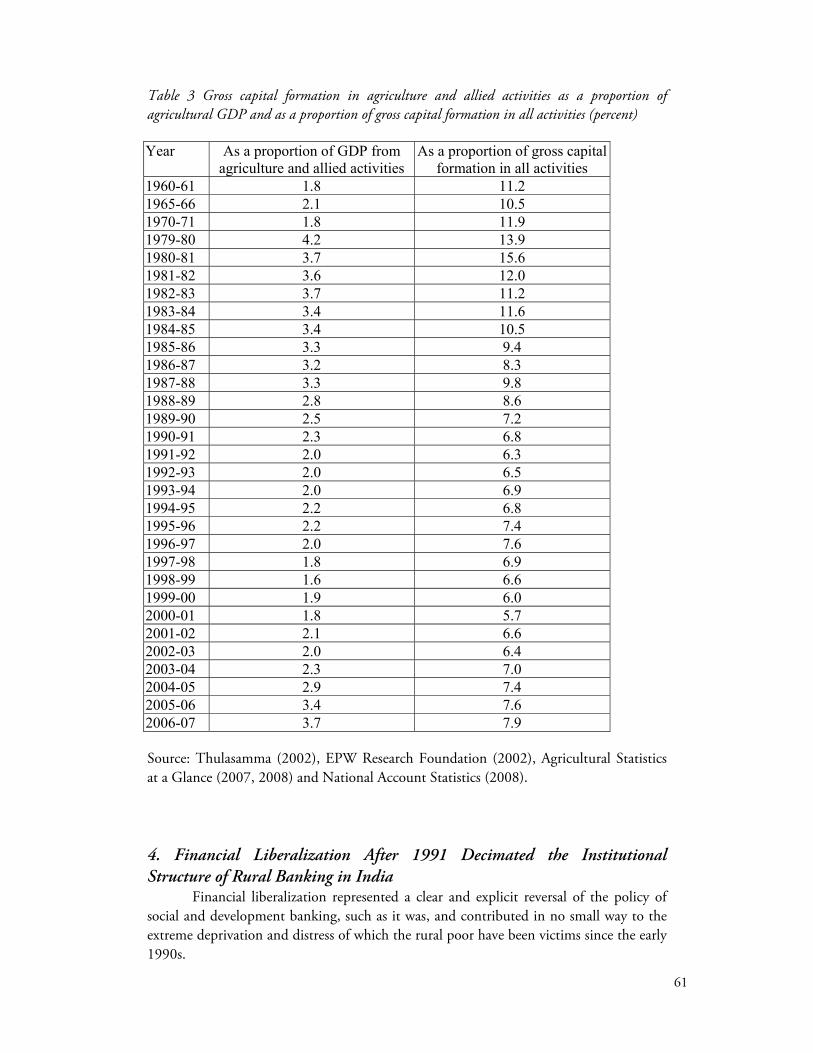
Fiscal contraction is at the core of current policy, and Table 3, which shows the trends in public investment in agriculture and allied activities, shows that the decline in public investment in agriculture started in the 1980s and accelerated further in the 1990s. By the end of 1990s, public investment in agriculture and allied activities was only about 1.6 percent of agricultural GDP and about 6.6 percent of total gross capital formation in the public sector.5
59
Tab
le 1
Gin
i coe
fficie
nts f
or th
e dist
ribut
ion
of o
pera
tiona
l and
ow
nersh
ip h
oldi
ngs o
f lan
d, In
dia,
196
0-61
to 2
003-
04
Type
of h
oldi
ng
1960
-61
1970
-71
1980
-81
1990
-91
2003
-04
Ope
ratio
nal h
oldi
ngs
0.58
0.59
0.63
0.64
0.
62
Ow
ners
hip
hold
ings
0.
730.
710.
710.
71
0.74
Sour
ce: N
atio
nal S
ampl
e Su
rvey
(NSS
) Lan
d an
d Li
vesto
ck S
urve
ys c
ited
in R
amak
umar
(200
0), R
amac
hand
ran
and
Ram
akum
ar (2
000)
, NSS
R
epor
t Nos
. 491
and
492
N
ote:
The
se a
re o
ffici
al e
stim
ates
of G
ini c
oeffi
cien
ts. O
wne
rshi
p ho
ldin
gs in
thes
e es
timat
es re
fer t
o ow
ners
hip
of a
ny ty
pe o
f lan
d in
clud
ing
hom
este
ad la
nd. G
ini c
oeffi
cien
t of
owne
rshi
p of
agr
icul
tura
l lan
d in
200
3-04
was
abo
ut 0
.76
(Raw
al 2
008)
60
Tab
le 2
Shar
e of
agr
icultu
ral l
and
owne
d by
the
5 pe
rcen
t of h
ouseh
olds
with
the
larg
est o
wne
rship
hol
ding
s and
the
50 p
erce
nt w
ith th
e sm
alles
t ow
nersh
ip
hold
ings
, by v
illag
e, 20
06-2
007
(per
cent
) Sh
are
of a
gric
ultu
ral l
and
owne
d by
Se
rial
num
ber
Vill
age
top
5 pe
rcen
t bo
ttom
50
perc
ent
1 A
NA
NTH
AV
AR
AM
, Gun
tur D
istri
ct, s
outh
coa
stal
And
hra
Prad
esh
54
0 2
BU
KK
AC
HER
LA, A
nant
apur
dis
trict
, Ray
alas
eem
a re
gion
, sou
th-w
est A
ndhr
a Pr
ades
h 33
17
3
KO
THA
PALL
E, K
arim
naga
r dis
trict
, Nor
th T
elan
gana
regi
on, n
orth
And
hra
Prad
esh
41
1 4
HA
REV
LI, B
ijnor
dis
trict
, Wes
tern
Utta
r Pra
desh
39
2
5 M
AH
ATW
AR
, Bal
lia d
istri
ct, E
aste
rn U
ttar P
rade
sh
40
6 6
WA
RW
ATK
HA
ND
ERA
O, B
uldh
ana
dist
rict,
Vid
arbh
a re
gion
, Mah
aras
htra
35
10
7
NIM
SHIR
GA
ON
, Kol
hapu
r dis
trict
, Mar
athw
ada
regi
on, M
ahar
asht
ra
24
5 8
DU
NG
AR
IYA
, Adi
vasi
vill
age,
sout
h U
daip
ur d
istri
ct, R
ajas
than
23
18
9
GU
LAB
EWA
LA, S
rigan
gana
gar d
istri
ct, G
ang
Can
al re
gion
, Raj
asth
an
43
0 So
urce
: Sur
vey
data
, Fou
ndat
ion
for A
grar
ian
Stud
ies.
Not
e: A
gric
ultu
ral l
and
incl
udes
net
sow
n ar
ea a
nd c
urre
nt fa
llow
s.
61
Table 3 Gross capital formation in agriculture and allied activities as a proportion of agricultural GDP and as a proportion of gross capital formation in all activities (percent) Year As a proportion of GDP from
agriculture and allied activities As a proportion of gross capital
formation in all activities 1960-61 1.8 11.2 1965-66 2.1 10.5 1970-71 1.8 11.9 1979-80 4.2 13.9 1980-81 3.7 15.6 1981-82 3.6 12.0 1982-83 3.7 11.2 1983-84 3.4 11.6 1984-85 3.4 10.5 1985-86 3.3 9.4 1986-87 3.2 8.3 1987-88 3.3 9.8 1988-89 2.8 8.6 1989-90 2.5 7.2 1990-91 2.3 6.8 1991-92 2.0 6.3 1992-93 2.0 6.5 1993-94 2.0 6.9 1994-95 2.2 6.8 1995-96 2.2 7.4 1996-97 2.0 7.6 1997-98 1.8 6.9 1998-99 1.6 6.6 1999-00 1.9 6.0 2000-01 1.8 5.7 2001-02 2.1 6.6 2002-03 2.0 6.4 2003-04 2.3 7.0 2004-05 2.9 7.4 2005-06 3.4 7.6 2006-07 3.7 7.9 Source: Thulasamma (2002), EPW Research Foundation (2002), Agricultural Statistics at a Glance (2007, 2008) and National Account Statistics (2008). 4. Financial Liberalization After 1991 Decimated the Institutional Structure of Rural Banking in India
Financial liberalization represented a clear and explicit reversal of the policy of social and development banking, such as it was, and contributed in no small way to the extreme deprivation and distress of which the rural poor have been victims since the early 1990s.
62
It is well known that the burden of indebtedness in rural India is very great, and that, despite major structural changes in credit institutions and forms of rural credit in the post-independence period, the exploitation of the rural masses in the credit market is one of the most pervasive and persistent features of rural life in India.
Historically, there have been four major problems with respect to the supply of credit to the Indian countryside. First, the supply of formal credit to the countryside as a whole has been inadequate. Second, rural credit markets themselves have been imperfect and fragmented. Third, as the foregoing suggests, the distribution of formal credit has been unequal, particularly with respect to region and class, caste and gender in the countryside. Formal sector credit needs specially to reach backward areas, income-poor households, people of the oppressed castes and tribes, and women. Fourth, the major source of credit to rural households, particularly income-poor working households, has been the informal sector. Informal sector loans, typically, are advanced at very high rates of interest. Further, the terms and conditions attached to these loans have given rise to an elaborate structure of coercion – economic and extra-economic – in the countryside.
That these constitute what may be called the ‘problem of rural credit’ has been well recognized; recognized, in fact, in official evaluations and scholarship since the end of the nineteenth century. Given the issues involved, the declared objectives of public policy with regard to rural credit in the post-independence period, were in the words of a former Governor of the Reserve Bank of India, ‘to ensure that sufficient and timely credit, at reasonable rates of interest, is made available to as large segment of the rural population as possible’ (Rangarajan 1996). The policy instruments to achieve these objectives were to be: first, extending the geographical and functional reach of the formal sector; second, directed lending; and third, concessional or subsidized credit (Rangarajan 1996). Public policy was thus aimed not only at meeting rural credit needs, but also at pushing out the informal sector and the exploitation to which it subjected borrowers. Rural credit policy in India envisaged the provision of a range of credit services, including long-term and short-term credit and large-scale and small-scale loans to rural households.
The period from 1969 to the present can be characterized as representing, broadly speaking, three phases in banking policy vis-à-vis the Indian countryside. The period immediately following bank nationalization was also the early phase of the ‘green revolution’ in rural India, and one of the objectives of the nationalization of banks was for the state to gain access to new liquidity, particularly among rich farmers, in the countryside. The declared objectives of the new policy with respect to rural banking – what came to be known as ‘social and development banking’ – were: (i) to provide banking services in previously unbanked or under-banked rural areas; (ii) to provide substantial credit to specific activities including agriculture and cottage industries; (iii) to provide credit to certain disadvantaged groups, such as for example, Dalit and scheduled tribe households.
The second phase, which began in the late 1970s and early 1980s, was a period when the rhetoric of land reform was finally discarded by the ruling classes themselves, and when the major instruments of official anti-poverty policy were programs for the creation of employment. Two strategies for employment generation were envisaged, namely wage employment through state-sponsored rural employment schemes and self-employment by means of loans-cum-subsidy schemes targeted at the rural poor. Thus began a period of directed credit, during which credit was to be directed towards ‘the weaker sections’ of society.
63
The third and current phase, which began in 1991, is that of liberalization. There has been much recent research on financial liberalization and rural credit in India.6 The main features of the post-liberalization phase are the following:
Social and development banking ceased to be official policy. The policy objectives of this phase are encapsulated in the Report of the Committee on the Financial System, a Committee appointed by the Reserve Bank of India which called for ‘a vibrant and competitive financial system…to sustain the ongoing reform in the structural aspects of the economy’. The Committee said that redistributive objectives ‘should use the instrumentality of the fiscal rather than the credit system’ and, accordingly, that ‘directed credit programs should be phased out’. It also recommended that interest rates be deregulated, that capital adequacy norms be changed (to ‘compete with banks globally’), that branch licensing policy be revoked, that a new institutional structure that is ‘market-driven and based on profitability’ be created, and that the part played by private Indian and foreign banks be enlarged (Reserve Bank of India 1991).
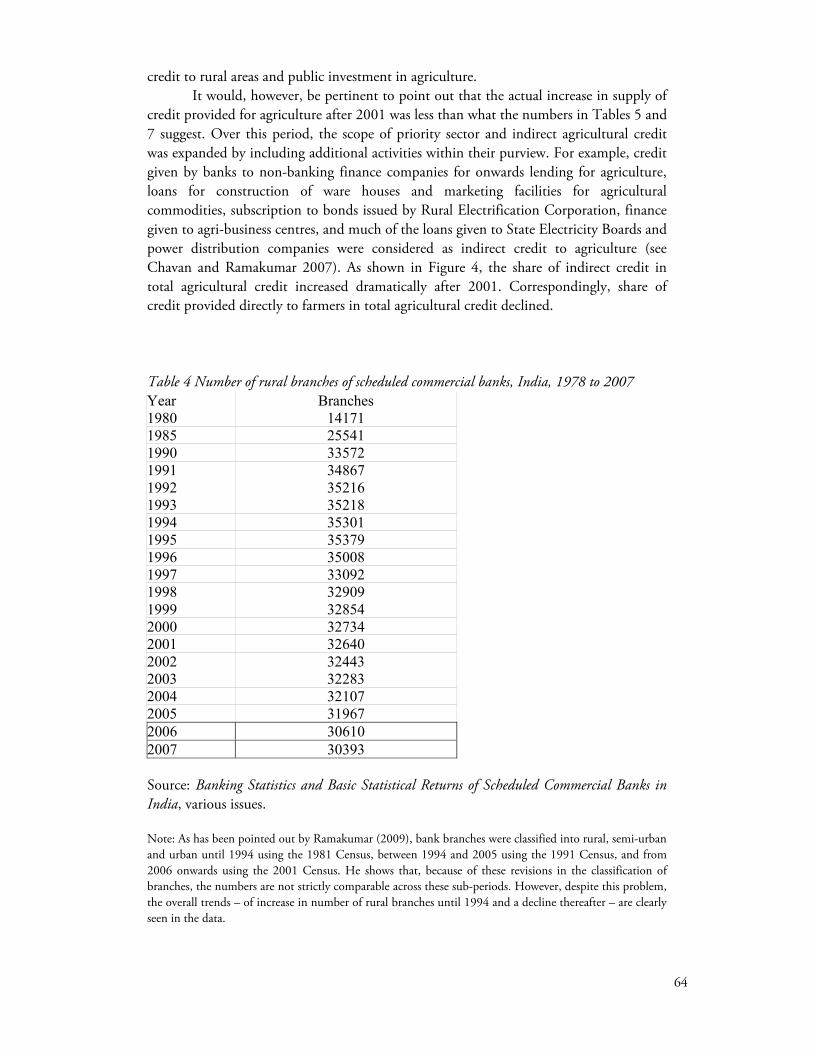
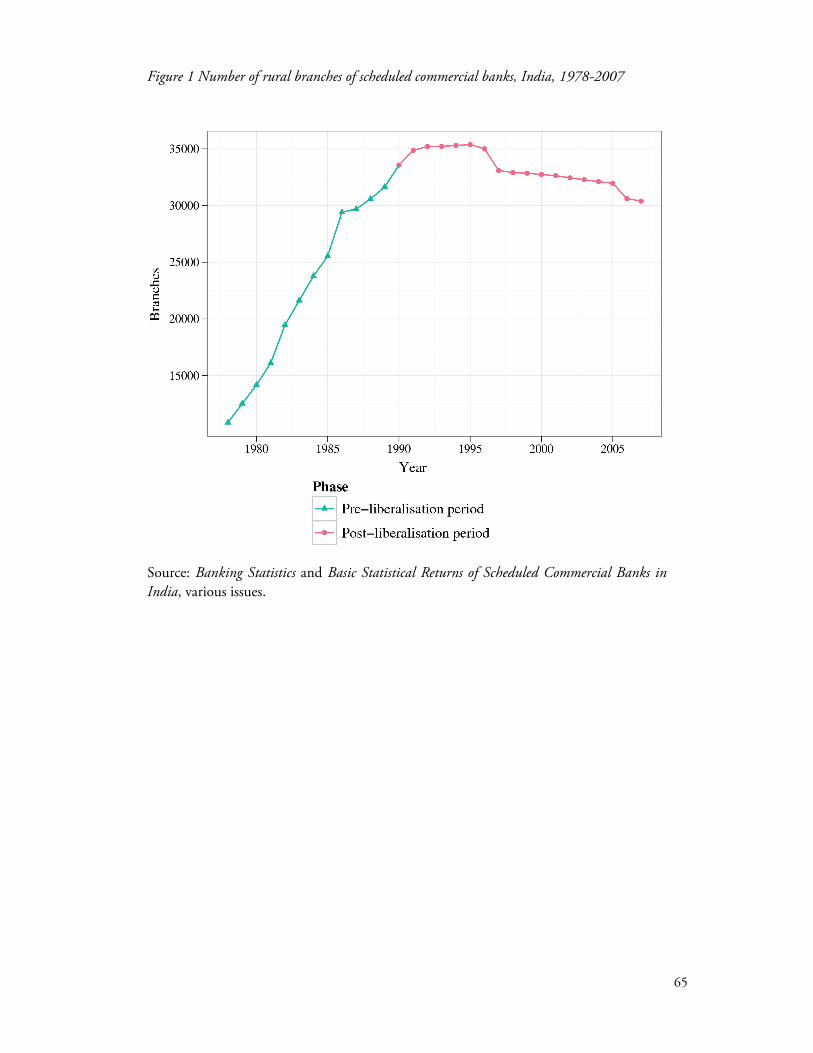
The expansion of public-sector rural banking was ended, and a large number of
rural branches of commercial banks were actually shut down after 1995 (Table 4, Figure 1).
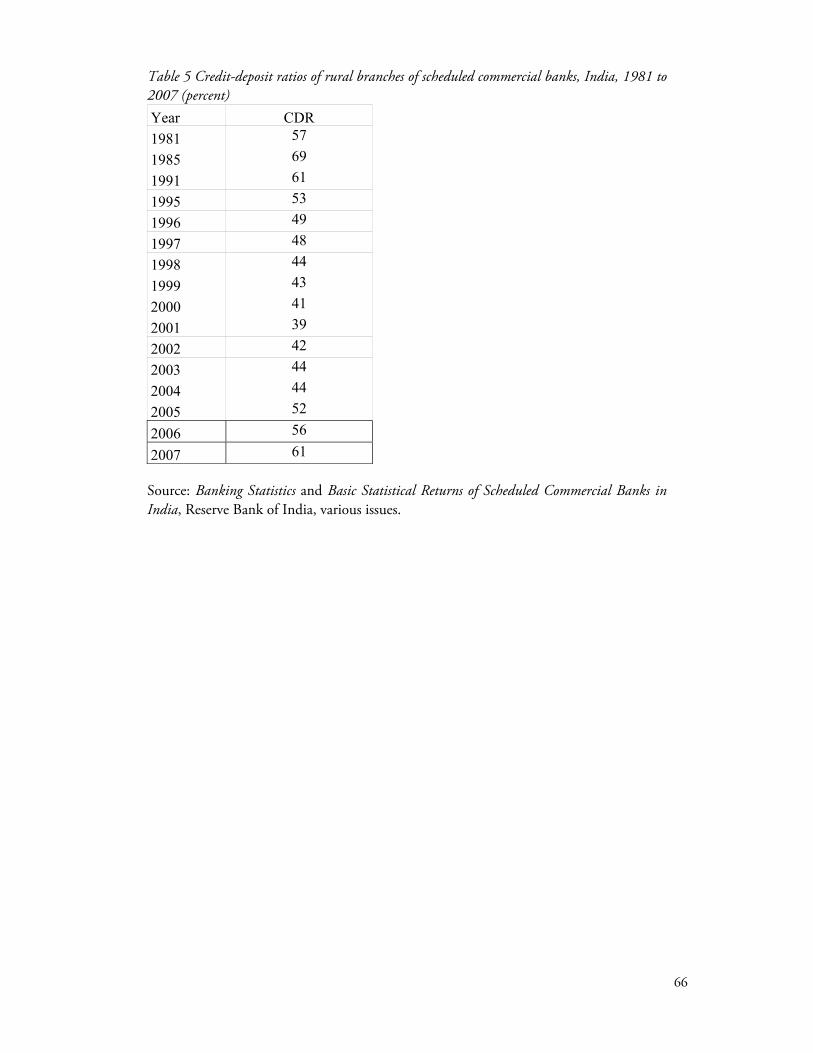
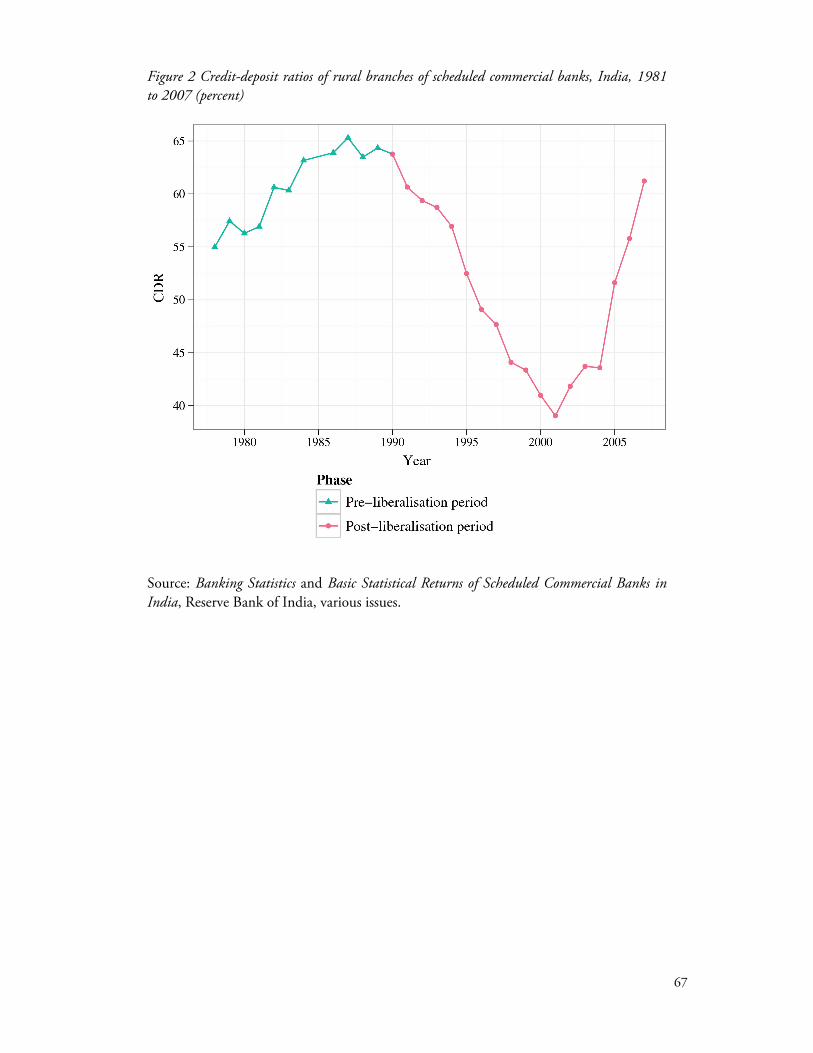
The credit-deposit ratios of rural commercial bank branches fell sharply between
1991 and 2004 (Table 5, Figure 2).
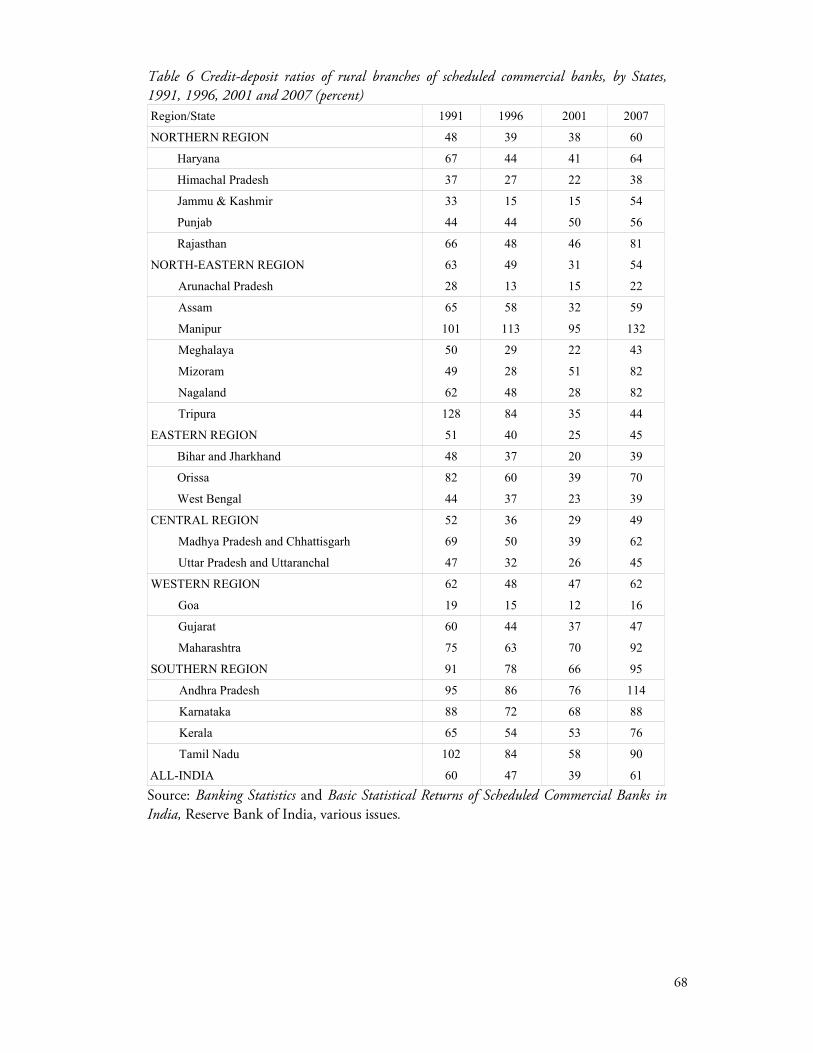
Inter-State inequalities in rural banking increased, and regions where banking has historically been underdeveloped suffered the worst (Table 6).7
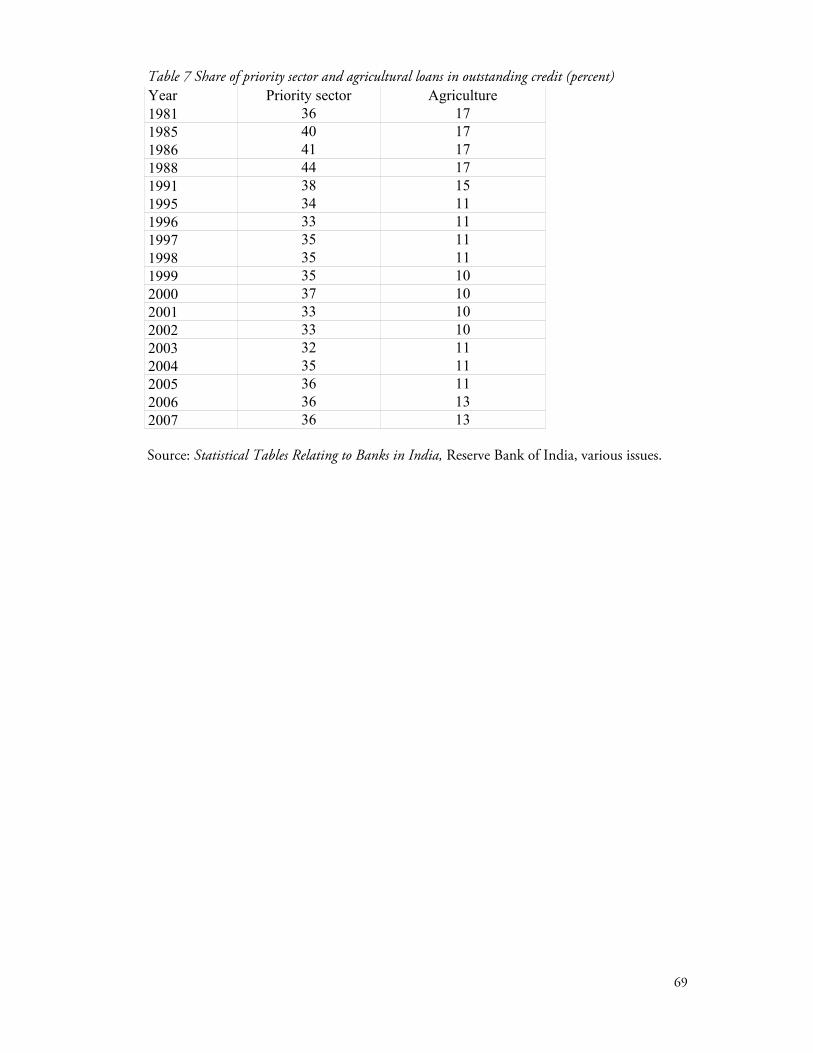
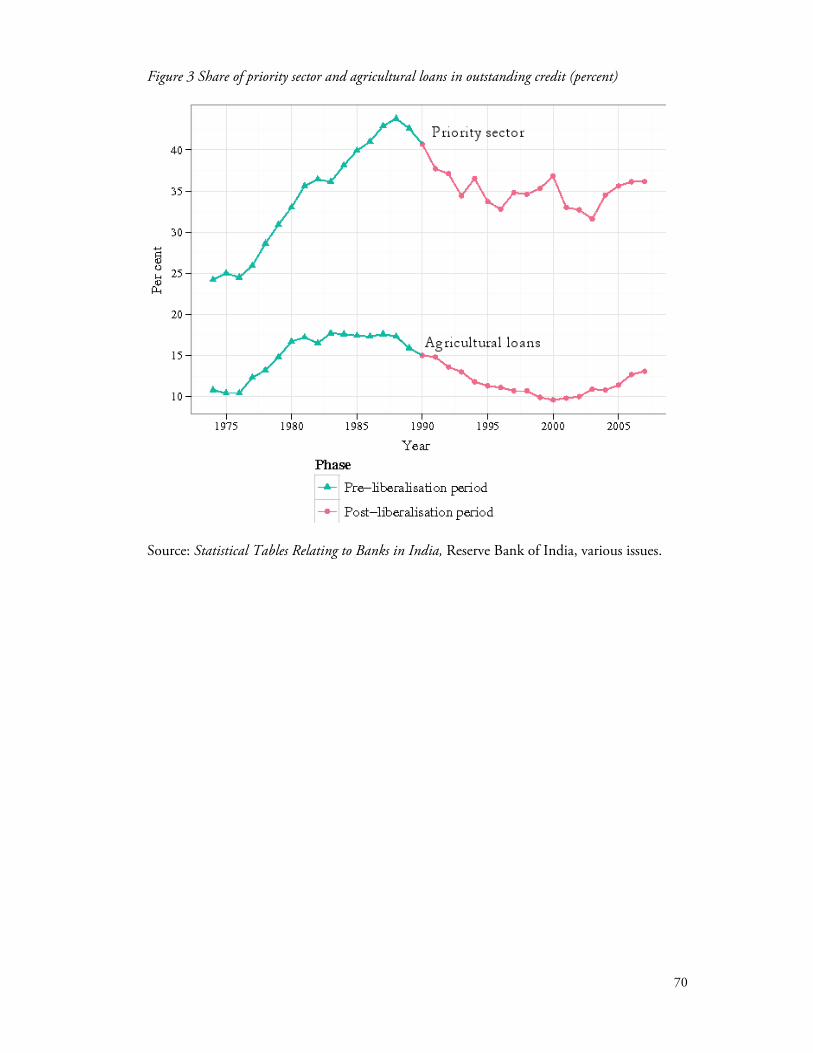
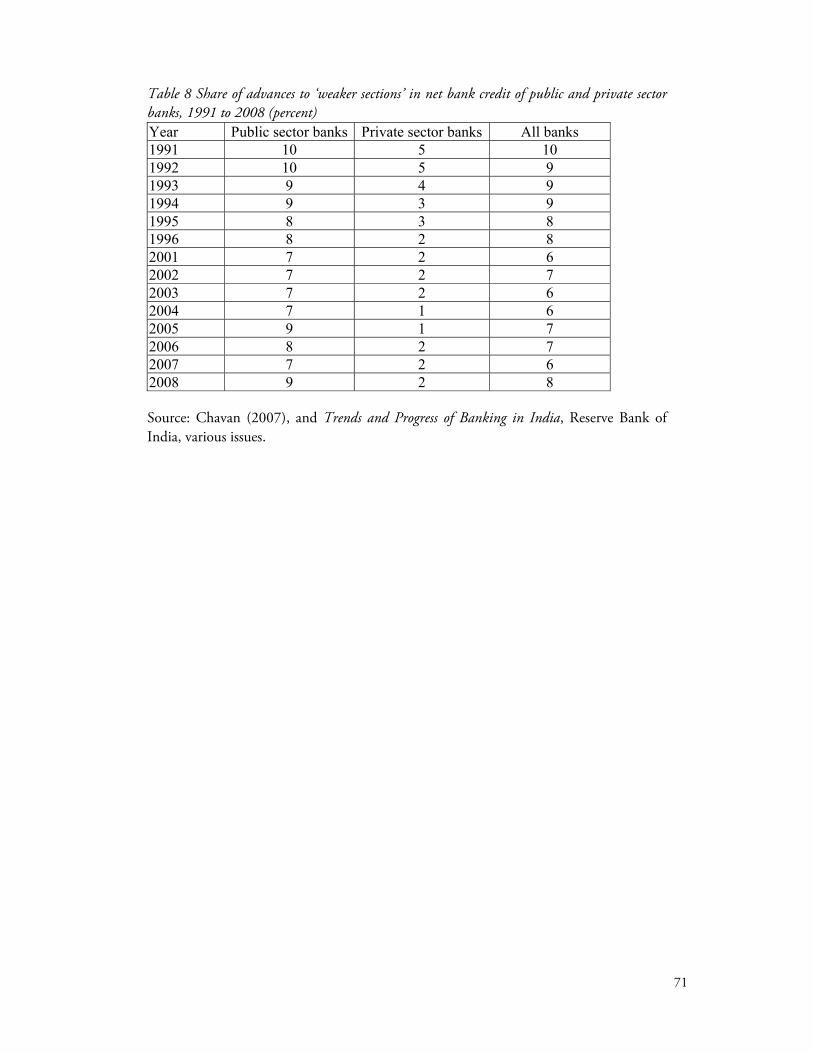
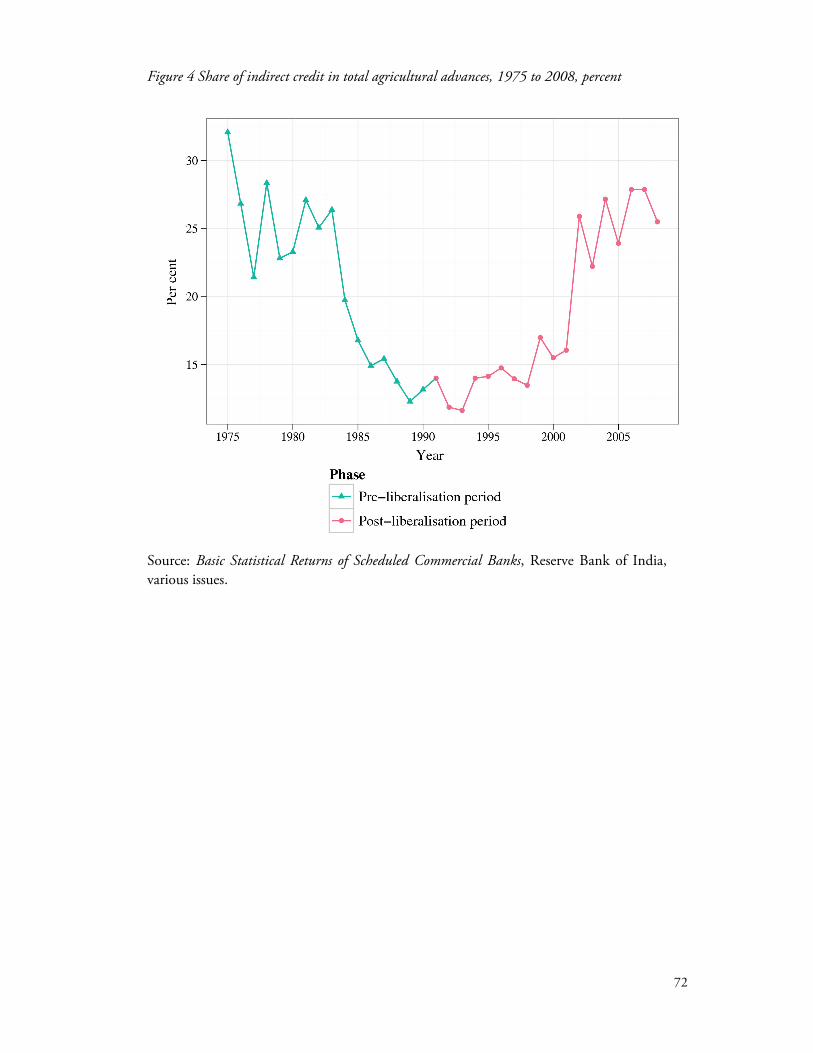
Priority-sector advances fell, and, with that, so did the shares of credit to
agriculture, to cultivators owning two hectares or less, and to Dalit and Adivasi households (Tables 7-8, Figures 3-4) (see Chavan 2007).
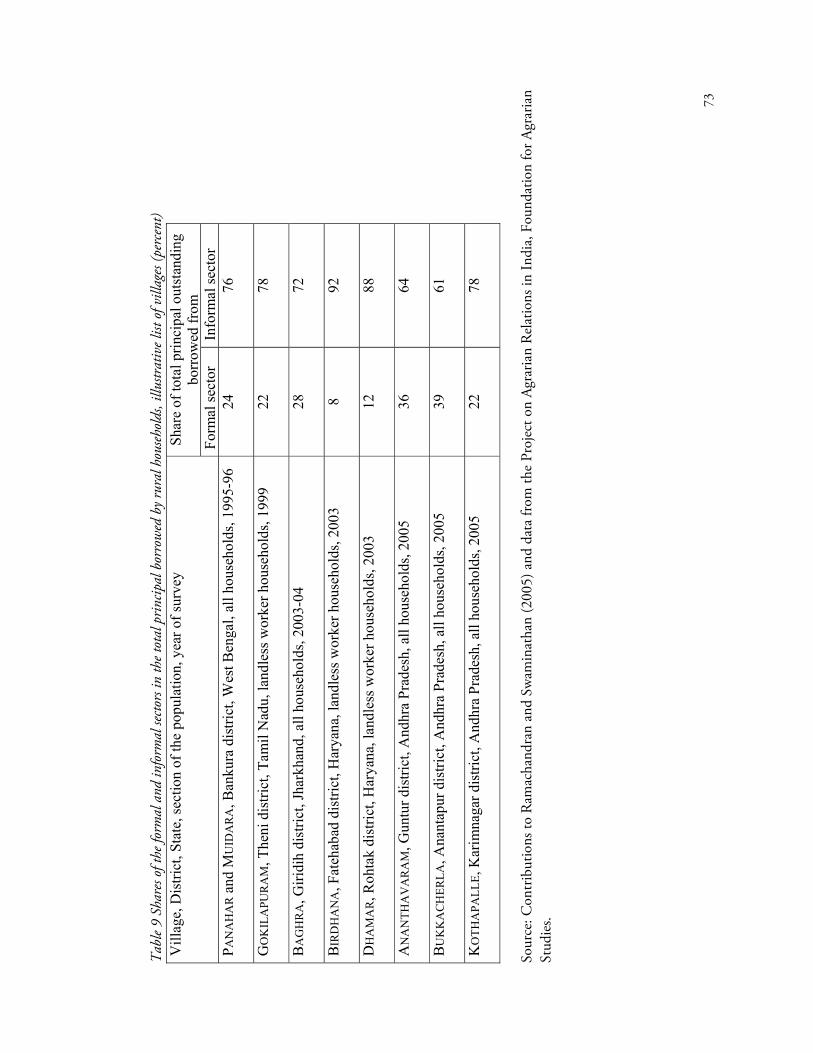
The share of informal-sector credit in the principal borrowed by rural households
is very high (Table 9), and has increased over the liberalization phase.
There was a partial recovery in provision of formal-sector credit to rural areas after 2001. While the supply of rural credit started to increase in 2001, the major expansion in provision of rural credit, and a clear break from the earlier policy of withdrawal of formal-sector banking from rural areas, took place since 2004 (Tables 5 and 6, Figures 2 and 3). It is noteworthy that, by 2008, the credit-deposit ratio of rural branches of scheduled commercial banks went back to the level in 1991. Table 3, which discusses trends in public investment, shows that the share of agriculture and allied activities in total public investment also started to increase in 2004-05. Reversal of trends in rural credit and public investment was made possible because of the space opened by dependence of the UPA government on the Left parties for its survival.8 The Left, in its demands, identified collapse of rural credit and decline in public investment as major causes of rural distress and actively lobbied for expansion of provision of formal-sector
64
credit to rural areas and public investment in agriculture. It would, however, be pertinent to point out that the actual increase in supply of
credit provided for agriculture after 2001 was less than what the numbers in Tables 5 and 7 suggest. Over this period, the scope of priority sector and indirect agricultural credit was expanded by including additional activities within their purview. For example, credit given by banks to non-banking finance companies for onwards lending for agriculture, loans for construction of ware houses and marketing facilities for agricultural commodities, subscription to bonds issued by Rural Electrification Corporation, finance given to agri-business centres, and much of the loans given to State Electricity Boards and power distribution companies were considered as indirect credit to agriculture (see Chavan and Ramakumar 2007). As shown in Figure 4, the share of indirect credit in total agricultural credit increased dramatically after 2001. Correspondingly, share of credit provided directly to farmers in total agricultural credit declined. Table 4 Number of rural branches of scheduled commercial banks, India, 1978 to 2007
Source: Banking Statistics and Basic Statistical Returns of Scheduled Commercial Banks in India, various issues. Note: As has been pointed out by Ramakumar (2009), bank branches were classified into rural, semi-urban and urban until 1994 using the 1981 Census, between 1994 and 2005 using the 1991 Census, and from 2006 onwards using the 2001 Census. He shows that, because of these revisions in the classification of branches, the numbers are not strictly comparable across these sub-periods. However, despite this problem, the overall trends – of increase in number of rural branches until 1994 and a decline thereafter – are clearly seen in the data.
Year Branches 1980 14171 1985 25541 1990 33572 1991 34867 1992 35216 1993 35218 1994 35301 1995 35379 1996 35008 1997 33092 1998 32909 1999 32854 2000 32734 2001 32640 2002 32443 2003 32283 2004 32107 2005 31967 2006 30610 2007 30393
65
Figure 1 Number of rural branches of scheduled commercial banks, India, 1978-2007
Source: Banking Statistics and Basic Statistical Returns of Scheduled Commercial Banks in India, various issues.
66
Table 5 Credit-deposit ratios of rural branches of scheduled commercial banks, India, 1981 to 2007 (percent) Year CDR 1981 57
1985 69 1991 61
1995 53 1996 49
1997 48 1998 44
1999 43
2000 41
2001 39
2002 42 2003 44
2004 44 2005 52
2006 56
2007 61 Source: Banking Statistics and Basic Statistical Returns of Scheduled Commercial Banks in India, Reserve Bank of India, various issues.
67
Figure 2 Credit-deposit ratios of rural branches of scheduled commercial banks, India, 1981 to 2007 (percent)
Source: Banking Statistics and Basic Statistical Returns of Scheduled Commercial Banks in India, Reserve Bank of India, various issues.
68
Table 6 Credit-deposit ratios of rural branches of scheduled commercial banks, by States, 1991, 1996, 2001 and 2007 (percent) Region/State 1991 1996 2001 2007
NORTHERN REGION 48 39 38 60
Haryana 67 44 41 64
Himachal Pradesh 37 27 22 38
Jammu & Kashmir 33 15 15 54
Punjab 44 44 50 56
Rajasthan 66 48 46 81
NORTH-EASTERN REGION 63 49 31 54
Arunachal Pradesh 28 13 15 22
Assam 65 58 32 59
Manipur 101 113 95 132
Meghalaya 50 29 22 43
Mizoram 49 28 51 82
Nagaland 62 48 28 82
Tripura 128 84 35 44
EASTERN REGION 51 40 25 45
Bihar and Jharkhand 48 37 20 39
Orissa 82 60 39 70
West Bengal 44 37 23 39
CENTRAL REGION 52 36 29 49
Madhya Pradesh and Chhattisgarh 69 50 39 62
Uttar Pradesh and Uttaranchal 47 32 26 45
WESTERN REGION 62 48 47 62
Goa 19 15 12 16
Gujarat 60 44 37 47
Maharashtra 75 63 70 92
SOUTHERN REGION 91 78 66 95
Andhra Pradesh 95 86 76 114
Karnataka 88 72 68 88
Kerala 65 54 53 76
Tamil Nadu 102 84 58 90
ALL-INDIA 60 47 39 61 Source: Banking Statistics and Basic Statistical Returns of Scheduled Commercial Banks in India, Reserve Bank of India, various issues.
69
Table 7 Share of priority sector and agricultural loans in outstanding credit (percent) Year Priority sector Agriculture 1981 36 17 1985 40 17 1986 41 17 1988 44 17 1991 38 15 1995 34 11 1996 33 11 1997 35 11 1998 35 11 1999 35 10 2000 37 10 2001 33 10 2002 33 10 2003 32 11 2004 35 11 2005 36 11 2006 36 13 2007 36 13 Source: Statistical Tables Relating to Banks in India, Reserve Bank of India, various issues.
70
Figure 3 Share of priority sector and agricultural loans in outstanding credit (percent)
Source: Statistical Tables Relating to Banks in India, Reserve Bank of India, various issues.
71
Table 8 Share of advances to ‘weaker sections’ in net bank credit of public and private sector banks, 1991 to 2008 (percent) Year Public sector banks Private sector banks All banks 1991 10 5 10 1992 10 5 9 1993 9 4 9 1994 9 3 9 1995 8 3 8 1996 8 2 8 2001 7 2 6 2002 7 2 7 2003 7 2 6 2004 7 1 6 2005 9 1 7 2006 8 2 7 2007 7 2 6 2008 9 2 8 Source: Chavan (2007), and Trends and Progress of Banking in India, Reserve Bank of India, various issues.
72
Figure 4 Share of indirect credit in total agricultural advances, 1975 to 2008, percent
Source: Basic Statistical Returns of Scheduled Commercial Banks, Reserve Bank of India, various issues.
73
Tab
le 9
Shar
es of
the f
orm
al a
nd in
form
al se
ctors
in th
e tot
al p
rincip
al b
orro
wed
by r
ural
hou
sehol
ds, i
llustr
ativ
e list
of v
illag
es (p
erce
nt)
Shar
e of
tota
l prin
cipa
l out
stan
ding
bo
rrow
ed fr
omV
illag
e, D
istri
ct, S
tate
, sec
tion
of th
e po
pula
tion,
yea
r of s
urve
y
Form
al se
ctor
In
form
al se
ctor
PA
NA
HA
R a
nd M
UID
AR
A, B
anku
ra d
istri
ct, W
est B
enga
l, al
l hou
seho
lds,
1995
-96
24
76
GO
KIL
APU
RA
M, T
heni
dis
trict
, Tam
il N
adu,
land
less
wor
ker h
ouse
hold
s, 19
99
22
78
BA
GH
RA
, Giri
dih
dist
rict,
Jhar
khan
d, a
ll ho
useh
olds
, 200
3-04
28
72
BIR
DH
AN
A, F
ateh
abad
dis
trict
, Har
yana
, lan
dles
s wor
ker h
ouse
hold
s, 20
03
8 92
DH
AM
AR
, Roh
tak
dist
rict,
Har
yana
, lan
dles
s wor
ker h
ouse
hold
s, 20
03
12
88
AN
AN
THA
VA
RA
M, G
untu
r dis
trict
, And
hra
Prad
esh,
all
hous
ehol
ds, 2
005
36
64
BU
KK
AC
HER
LA, A
nant
apur
dis
trict
, And
hra
Prad
esh,
all
hous
ehol
ds, 2
005
39
61
KO
THA
PALL
E, K
arim
naga
r dis
trict
, And
hra
Prad
esh,
all
hous
ehol
ds, 2
005
22
78
Sour
ce: C
ontr
ibut
ions
to R
amac
hand
ran
and
Swam
inat
han
(200
5) a
nd d
ata
from
the
Proj
ect o
n Ag
raria
n R
elat
ions
in In
dia,
Fou
ndat
ion
for A
grar
ian
Stud
ies.
74
5. The Peasantry Faces a Two-pronged Attack From Falling Commodity Prices and Rising Input Costs
It is now impossible to ensure adequate incomes among the peasantry if they are not protected from the ravages of adverse product and input markets. Most peasants are net buyers of food grain, and thus victims of inflation in food prices as well. The costs of cultivation have risen steeply, particularly in the 1990s and early 2000s. The rise in the costs of seed, fertilizer, irrigation and the use of machinery has been particularly steep in the recent period.
As a consequence of India’s joining the World Trade Organization, Indian agriculture has been exposed, in a new and unprecedented way, to volatility in the international prices of food and non-food crops and, in the case of several commodities, prolonged periods of steep declines in prices (see for instance, Ghosh 2005). The most important policies of the Government of India in this regard are, of course, the removal of quantitative restrictions on the import and export of a very wide range of agricultural commodities, including wheat and wheat products, rice, pulses, edible oils and agricultural seeds, and substantial cuts in import tariffs on crops. New incentives and support to exports of agricultural commodities will inevitably have an impact on land use and cropping pattern, as will the decision to ‘decanalize’ and allow and encourage private agencies in the agricultural export sector.
In addition, the Minimum Support Prices (MSP) announced by the Government to ensure remunerative prices have not compensated for the actual costs of production per unit of output for most crops in a majority of States. Further, the very policy of MSP has not been implemented in most States.
This problem of peasant incomes is particularly intense in the present context of the removal of quantitative restrictions on the import of agricultural products, the emphasis on export-oriented production, and the fall in the prices of primary commodities internationally. It is not fortuitous that the 1990s, the first decade of accelerated liberalization, was also the first period since the beginning of the ‘green revolution’ in which the rate of growth of food grain production was lower than the rate of growth of population in India.9
The Left in India has demanded that the Government ensure that the costs of all inputs be controlled; that the system of MSP cover all 26 crops covered by the Commission on Agricultural Costs and Prices; that fair and remunerative prices be offered through a country-wide crop procurement system; that a universal public distribution system be established; and that the Government reverse the abolition of quantitative restrictions and raise tariffs on the import of agricultural and agriculture-related products. In the context of widespread crop damage, low yields and the ruin of vulnerable cultivators, a new demand is that a Farm Income Insurance Scheme be implemented rapidly in all disaster areas and subsequently be extended to all districts of the country and to all crops.
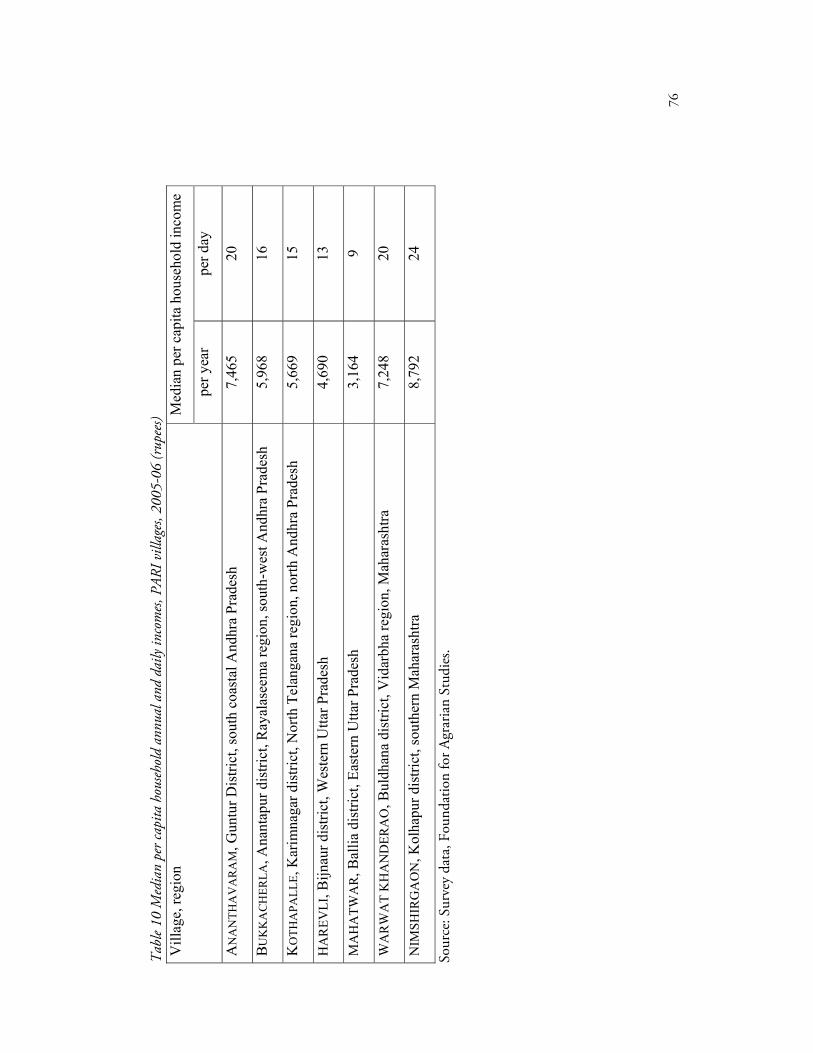
Our survey data from Andhra Pradesh, Uttar Pradesh and Maharashtra indicate the near-impossibility, in the present circumstances, of peasant households with two hectares of operational holdings or less earning an income sufficient for family survival. The daily per capita median income in the village with the highest median income was about Rs 24 (see Table 10).
75
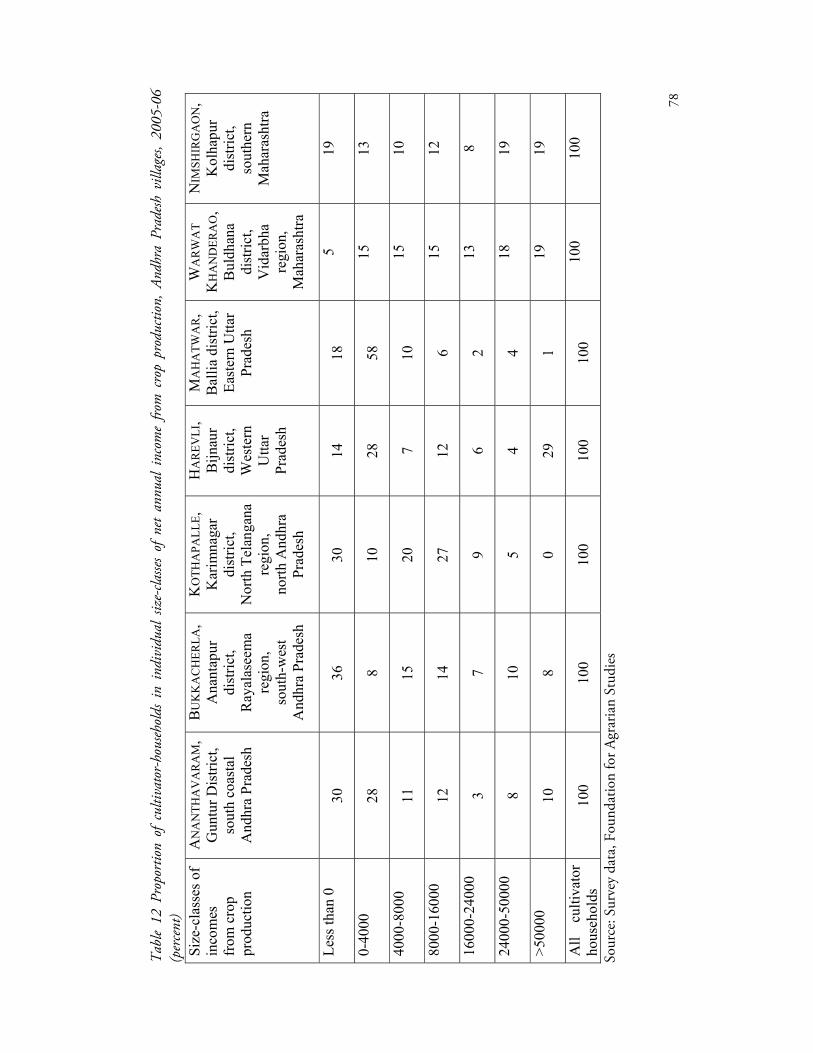
The net annual incomes of a substantial section of the poor and middle peasantry from crop production are negative. The data in Table 12 are new and truly alarming. The Table shows that over 30 percent of cultivator-households in each of the three Andhra Pradesh households, 19 percent of cultivator-households in Nimshirgaon (a village in Kolhapur district), 18 percent of cultivator-households in Mahatwar (a village in eastern UP), 14 percent of cultivator-households in Harevli (a village in Bijnaur district in western UP) and 5 percent of cultivator-households in Warwat Khaderao (a village in Vidarbha) had negative net incomes from crop production.
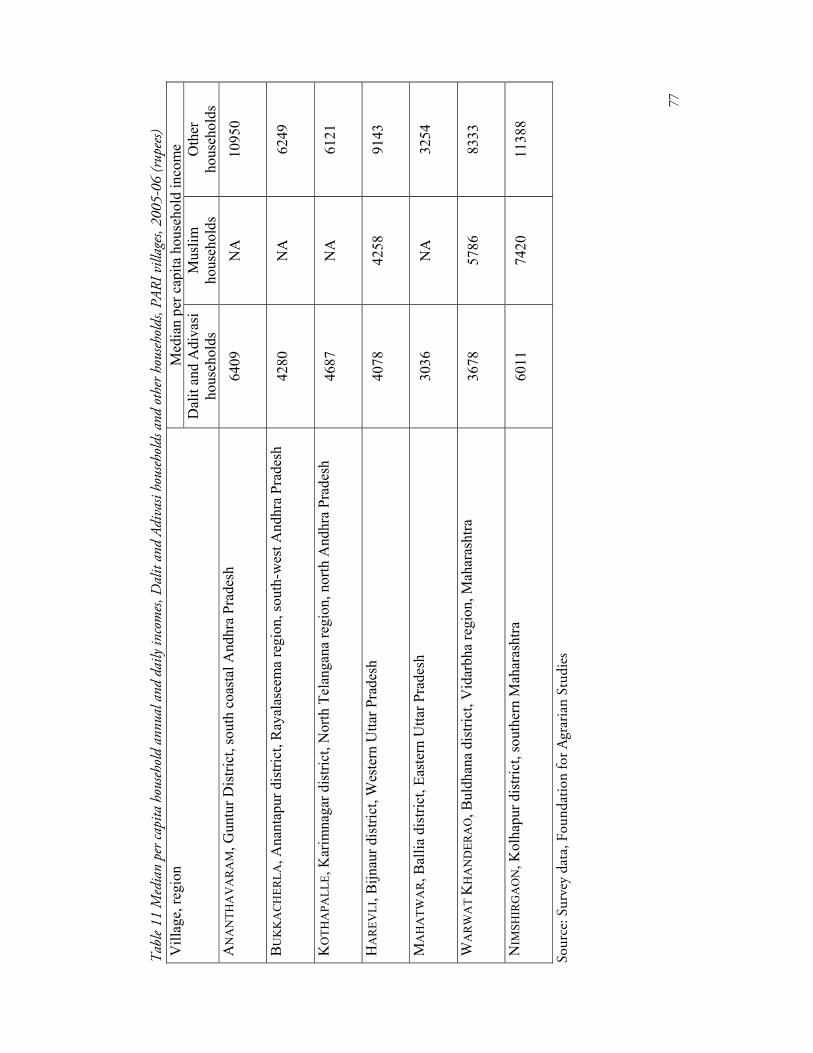
Annual incomes among Dalit and Adivasi households were substantially lower than the corresponding incomes among others (see Table 11). In Ananthavaram, a multi-caste irrigated village in south coastal Andhra Pradesh, the mean annual income from crop production alone was negative (minus 624 rupees) for Dalit households and Rs 27,892 for other cultivators.
Food self-sufficiency has been a key component of India’s national sovereignty, and the new trends in the agrarian regime have very serious implications for land use, cropping patterns and the future of self-sufficiency in food in India.
76
Tab
le 10
Med
ian
per c
apita
hou
sehol
d an
nual
and
dai
ly in
com
es, P
ARI v
illag
es, 2
005-
06 (r
upee
s) M
edia
n pe
r cap
ita h
ouse
hold
inco
me
Vill
age,
regi
on
per y
ear
per d
ay
AN
AN
THA
VA
RA
M, G
untu
r Dis
trict
, sou
th c
oast
al A
ndhr
a Pr
ades
h 7,
465
20
BU
KK
AC
HER
LA, A
nant
apur
dis
trict
, Ray
alas
eem
a re
gion
, sou
th-w
est A
ndhr
a Pr
ades
h 5,
968
16
KO
THA
PALL
E, K
arim
naga
r dis
trict
, Nor
th T
elan
gana
regi
on, n
orth
And
hra
Prad
esh
5,66
9 15
HA
REV
LI, B
ijnau
r dis
trict
, Wes
tern
Utta
r Pra
desh
4,
690
13
MA
HA
TWA
R, B
allia
dis
trict
, Eas
tern
Utta
r Pra
desh
3,
164
9
WA
RW
AT
KH
AN
DER
AO
, Bul
dhan
a di
stric
t, V
idar
bha
regi
on, M
ahar
asht
ra
7,24
8 20
NIM
SHIR
GA
ON
, Kol
hapu
r dis
trict
, sou
ther
n M
ahar
asht
ra
8,79
2 24
Sour
ce: S
urve
y da
ta, F
ound
atio
n fo
r Agr
aria
n St
udie
s.
77
Tab
le 11
Med
ian
per c
apita
hou
sehol
d an
nual
and
dai
ly in
com
es, D
alit
and
Adiv
asi h
ouseh
olds
and
oth
er h
ouseh
olds
, PAR
I vill
ages,
200
5-06
(rup
ees)
Med
ian
per c
apita
hou
seho
ld in
com
eV
illag
e, re
gion
D
alit
and
Adi
vasi
ho
useh
olds
M
uslim
ho
useh
olds
O
ther
ho
useh
olds
A
NA
NTH
AV
AR
AM
, Gun
tur D
istri
ct, s
outh
coa
stal
And
hra
Prad
esh
6409
N
A
1095
0
BU
KK
AC
HER
LA, A
nant
apur
dis
trict
, Ray
alas
eem
a re
gion
, sou
th-w
est A
ndhr
a Pr
ades
h 42
80
NA
62
49
KO
THA
PALL
E, K
arim
naga
r dis
trict
, Nor
th T
elan
gana
regi
on, n
orth
And
hra
Prad
esh
4687
N
A
6121
HA
REV
LI, B
ijnau
r dis
trict
, Wes
tern
Utta
r Pra
desh
40
78
4258
91
43
MA
HA
TWA
R, B
allia
dis
trict
, Eas
tern
Utta
r Pra
desh
30
36
NA
32
54
WA
RW
AT
KH
AN
DER
AO
, Bul
dhan
a di
stric
t, V
idar
bha
regi
on, M
ahar
asht
ra
3678
57
86
8333
NIM
SHIR
GA
ON
, Kol
hapu
r dis
trict
, sou
ther
n M
ahar
asht
ra
6011
74
20
1138
8
Sour
ce: S
urve
y da
ta, F
ound
atio
n fo
r Agr
aria
n St
udie
s
78
Tab
le 12
Pro
port
ion
of c
ultiv
ator
-hou
sehol
ds i
n in
divi
dual
siz
e-cla
sses
of n
et a
nnua
l in
com
e fro
m c
rop
prod
uctio
n, A
ndhr
a Pr
adesh
vill
ages,
200
5-06
(p
erce
nt)
Size
-cla
sses
of
inco
mes
fr
om c
rop
prod
uctio
n
AN
AN
THA
VA
RA
M,
Gun
tur D
istri
ct,
sout
h co
asta
l A
ndhr
a Pr
ades
h
BU
KK
AC
HER
LA,
Ana
ntap
ur
dist
rict,
R
ayal
asee
ma
regi
on,
sout
h-w
est
And
hra
Prad
esh
KO
THA
PALL
E,
Kar
imna
gar
dist
rict,
N
orth
Tel
anga
na
regi
on,
north
And
hra
Prad
esh
HA
REV
LI,
Bijn
aur
dist
rict,
Wes
tern
U
ttar
Prad
esh
MA
HA
TWA
R,
Bal
lia d
istri
ct,
East
ern
Utta
r Pr
ades
h
WA
RW
AT
KH
AN
DER
AO
, B
uldh
ana
dist
rict,
Vid
arbh
a re
gion
, M
ahar
asht
ra
NIM
SHIR
GA
ON
, K
olha
pur
dist
rict,
sout
hern
M
ahar
asht
ra
Less
than
0
30
36
30
14
18
5 19
0-40
00
28
8 10
28
58
15
13
4000
-800
0 11
15
20
7
10
15
10
8000
-160
00
12
14
27
12
6 15
12
1600
0-24
000
3 7
9 6
2 13
8
2400
0-50
000
8 10
5
4 4
18
19
>500
00
10
8 0
29
1 19
19
All
culti
vato
r ho
useh
olds
10
0 10
0 10
0 10
0 10
0 10
0 10
0
Sour
ce: S
urve
y da
ta, F
ound
atio
n fo
r Agr
aria
n St
udie
s
79
6. The Depressor Effect on Rural Employment As is clear from the foregoing, liberalization and globalization imply the
imposition of deflationary policies on the countryside; their depressor effect on rural manual employment has been profound. The decline of public investment in agriculture, the decline in direct agricultural extension and information dissemination, and the consequent decline in agriculture itself have had a direct impact on the number of days of employment that a hired worker in rural India receives.10
There are not good enough macro-data on the number of days of employment, agricultural and non-agricultural, per worker per year in India. Not only do the data from the Rural Labour Enquiries appear intuitively to be incorrect, but it is also well-recognized that employment data from micro-studies show consistently lower volumes of employment than Rural Labour Enquiry data. There are, of course, major conceptual, definitional and methodological reasons for this divergence. This latter observation is as true now as it was twenty years ago.
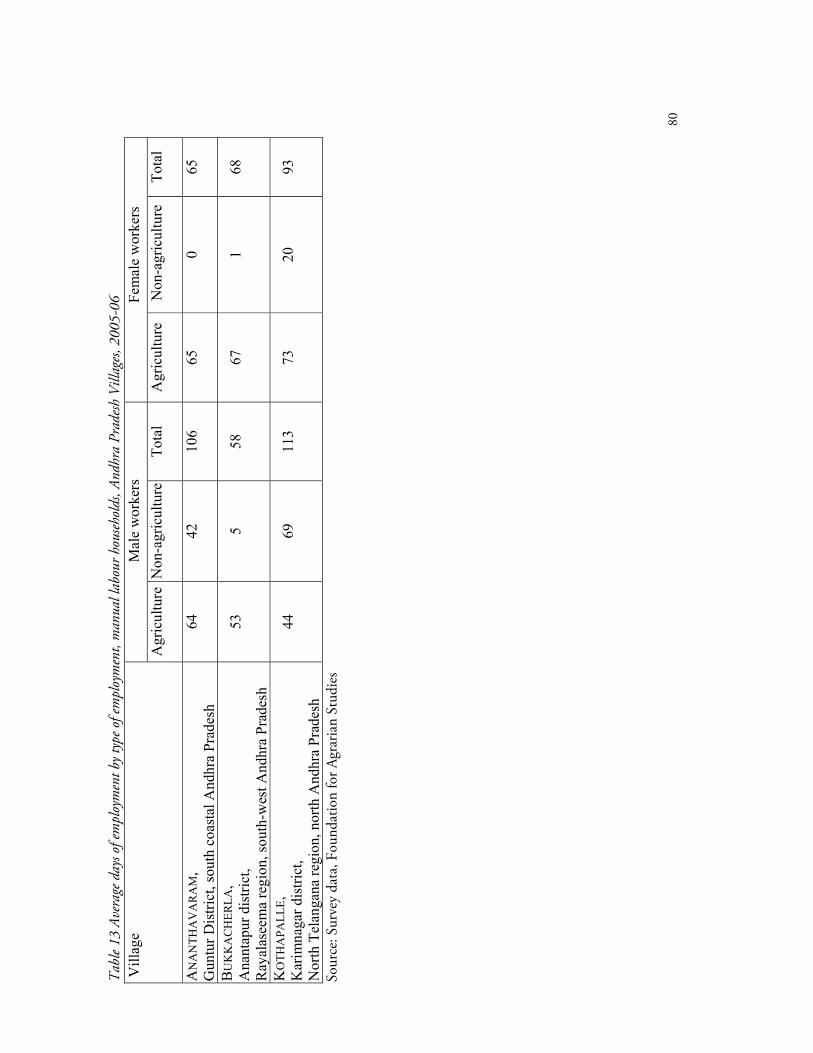
The village data from Andhra Pradesh illustrate the scarcity of the means of employment available today to a hired rural manual worker (Table 13).
The prospects for employment are also disturbing indeed. Let us examine some factors that traditionally have influenced the volume of employment available to a rural manual worker. LABOUR ABSORPTION IN RICE AND WHEAT CULTIVATION
The issues with regard to labour absorption have been summarized in Ramachandran and Swaminathan (2004). The main conclusions of that paper are that, with respect to wheat, mechanization has caused a secular decline in labour absorption. With regard to the cultivation of paddy, there has been, first, a decline in the employment of labour power per hectare. Secondly, female employment has been particularly affected by the decline in labour absorption. Thirdly, and as important, there are no viable technologies on offer today that involve higher levels of labour power input per hectare in the irrigated cultivation of high-yielding rice. IRRIGATION
Much has been written on the causal links between an expansion of irrigation and an expansion of agricultural employment. It is entirely possible that irrigated area (groundwater- and surface-irrigated) may expand in certain regions and watersheds. Nevertheless, the question remains: given the nature of policies of so-called structural adjustment, is it likely that, in the aggregate, the rate of growth of either (i) direct or complementary investment necessary for the expansion of groundwater irrigation or (ii) direct public investment necessary for the expansion of surface irrigation (large, medium or small scale) will rise to levels that are necessary to meet the demand for irrigation (or provide for sustained increase in employment) in rural India? In an earlier period in India’s development history, the answer may have been a qualified ‘yes’. Given the record of sharp decline in public investment in agriculture since 1991 (see Table 3), the answer now is ‘not under the present neo-liberal regime.’
80
Tab
le 13
Ave
rage
day
s of e
mpl
oym
ent b
y typ
e of e
mpl
oym
ent,
man
ual l
abou
r hou
sehol
ds, A
ndhr
a Pr
adesh
Vill
ages,
200
5-06
M
ale
wor
kers
F
emal
e w
orke
rs
Vill
age
Agr
icul
ture
Non
-agr
icul
ture
Tota
l A
gric
ultu
re
Non
-agr
icul
ture
To
tal
AN
AN
THA
VA
RA
M,
Gun
tur D
istri
ct, s
outh
coa
stal
And
hra
Prad
esh
64
42
106
65
0 65
BU
KK
AC
HER
LA,
Ana
ntap
ur d
istri
ct,
Ray
alas
eem
a re
gion
, sou
th-w
est A
ndhr
a Pr
ades
h
53
5 58
67
1
68
KO
THA
PALL
E,
Kar
imna
gar d
istri
ct,
Nor
th T
elan
gana
regi
on, n
orth
And
hra
Prad
esh
44
69
113
73
20
93
Sour
ce: S
urve
y da
ta, F
ound
atio
n fo
r Agr
aria
n St
udie
s
81
NON-AGRICULTURAL EMPLOYMENT An important lesson from rural development experience in India and elsewhere in
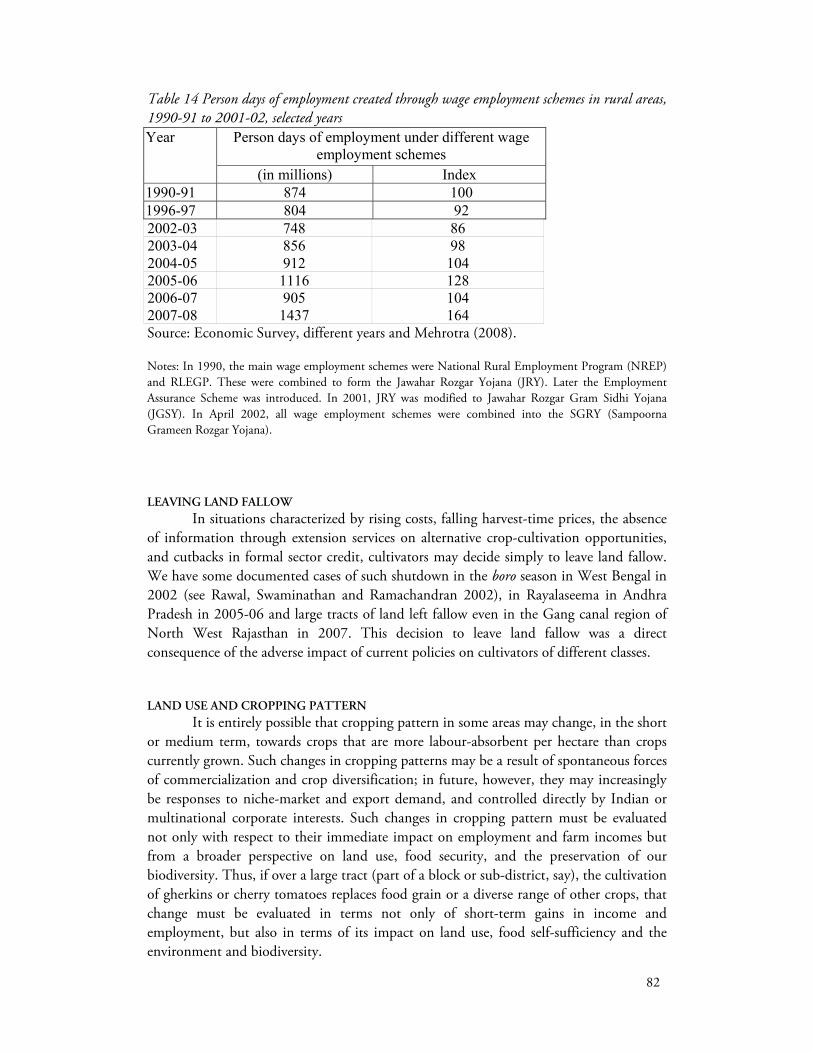
the less developed countries is that schemes for large-scale employment of hired manual workers or large-scale schemes for self-employment are necessarily state-driven and state-financed. The withdrawal of the state from state-sponsored employment schemes through the 1990s and early years of this decade is clear from Table 14.
The major change in this regard came after the passage, under pressure from the Left, of the National Rural Employment Guarantee Act (NREGA) by the present Parliament. The NREGA seeks to provide a guarantee of up to 100 days of employment per household. The scheme was introduced in 200 districts of India in 2005-06. In April 2008, the program was extended to the rural areas of all districts in the country. The most important difference between the NREGA and previous wage employment programs is that the NREGA seeks to provide a guarantee of 100 days of employment per household to any rural household that demands it. Where employment is not provided within 15 days of a demand for employment, the scheme provides for an unemployment allowance to be paid to the household that demanded work.
Data show that in 2007-08, the second full year of NREGA, about 1400 million person-days of work were generated in the 330 districts in which it was in operation in the year (Table 14). This was much higher than the work generated under previous wage employment programs. Data also show that, in 2007-08, on average, about 43 days of work were provided to households that participated in the program. The evidence suggests that in many areas where NREGA has been operational, the prospect of employment-generation under the scheme helped raise agricultural wage rates (Mehrotra 2008, Dreze and Khera 2009). It is also noteworthy that of the total employment generated under the program, the share of employment gained by women was 48 percent, by Dalit workers 31 percent, and by Scheduled Tribe workers 24 percent. Although NREGA represents an important gain for the rural work force, we must also remember that the program provides a very limited guarantee of employment, and that it has been marred by serious obstacles and problems (Karat 2005, Gupta 2007). The implementation agencies, for example, have a restricted portfolio of works that can be undertaken under the scheme (Karat 2008). Banks have been reluctant to open zero-balance accounts for workers who participate in NREGA. In many cases, the piece-rates under the program are low and, as a result, most workers are unable to do enough work on a sustained basis to earn the statutory minimum wage (Karat 2008). The nature of work provided and the Schedule of Rates are such that they typically discriminate against women workers who, on average, earn substantially lower wages than male workers (Karat 2008; ISWSD 2007). The unemployment allowance is seldom paid and, as a result, the goal of providing a guarantee of 100 days of work per household has not been achieved in practice. Evaluations have pointed out that, in most States, implementation of the scheme is fraught with problems such as delays in the payment of wages, a lack of work-site facilities (particularly for women), and corruption in the execution of work and maintenance of records (ISWSD 2007, Dreze and Khera 2009).
82
Table 14 Person days of employment created through wage employment schemes in rural areas, 1990-91 to 2001-02, selected years
Person days of employment under different wage employment schemes
Year
(in millions) Index 1990-91 874 100 1996-97 804 92 2002-03 748 86 2003-04 856 98 2004-05 912 104 2005-06 1116 128 2006-07 905 104 2007-08 1437 164 Source: Economic Survey, different years and Mehrotra (2008). Notes: In 1990, the main wage employment schemes were National Rural Employment Program (NREP) and RLEGP. These were combined to form the Jawahar Rozgar Yojana (JRY). Later the Employment Assurance Scheme was introduced. In 2001, JRY was modified to Jawahar Rozgar Gram Sidhi Yojana (JGSY). In April 2002, all wage employment schemes were combined into the SGRY (Sampoorna Grameen Rozgar Yojana). LEAVING LAND FALLOW
In situations characterized by rising costs, falling harvest-time prices, the absence of information through extension services on alternative crop-cultivation opportunities, and cutbacks in formal sector credit, cultivators may decide simply to leave land fallow. We have some documented cases of such shutdown in the boro season in West Bengal in 2002 (see Rawal, Swaminathan and Ramachandran 2002), in Rayalaseema in Andhra Pradesh in 2005-06 and large tracts of land left fallow even in the Gang canal region of North West Rajasthan in 2007. This decision to leave land fallow was a direct consequence of the adverse impact of current policies on cultivators of different classes. LAND USE AND CROPPING PATTERN
It is entirely possible that cropping pattern in some areas may change, in the short or medium term, towards crops that are more labour-absorbent per hectare than crops currently grown. Such changes in cropping patterns may be a result of spontaneous forces of commercialization and crop diversification; in future, however, they may increasingly be responses to niche-market and export demand, and controlled directly by Indian or multinational corporate interests. Such changes in cropping pattern must be evaluated not only with respect to their immediate impact on employment and farm incomes but from a broader perspective on land use, food security, and the preservation of our biodiversity. Thus, if over a large tract (part of a block or sub-district, say), the cultivation of gherkins or cherry tomatoes replaces food grain or a diverse range of other crops, that change must be evaluated in terms not only of short-term gains in income and employment, but also in terms of its impact on land use, food self-sufficiency and the environment and biodiversity.
83
7. International Corporations and Indian Agriculture The new trade and patent regime leaves the field of agricultural research at the
mercy of multinational corporations, thus weakening public-sector national agricultural research systems and open-access international research institutions. Further, this regime infringes on the rights of farmers and indigenous plant breeders and threatens to lead, in the words of India’s leading agricultural scientist, ‘from biodiversity to genetic slavery’.
A significant new aspect of globalization and the agrarian economy is the new intervention by US corporations in agricultural policy and policy-making institutions. The new Knowledge Initiative on Agriculture (KIA), formally called the ‘US-India Knowledge Initiative on Agricultural Education, Teaching, Research, Service, and Commercial Linkages,’ seeks to tie the agrarian economy of India to US corporate interests.11 The KIA is to support certain activities related to agricultural research, education and extension that will help bring an ‘evergreen revolution’ based on ‘environmentally-sustainable and market-oriented agriculture.’ Specifically, the KIA focuses on ‘capacity-building’ for education (including curriculum revision), food processing, biotechnology (particularly aimed at making transgenic crops the focus of Indian agricultural research) and water management (with emphasis on precision and high-tech agriculture).
The agreement does not cover any funding for agricultural research and education by the United States Government. In fact, while the Government of India has already pledged Rs. 3500 million for the activities proposed, there has been no commitment from the United States. Documents available in the public domain make it clear that private funding from agribusiness corporations for research in public institutions in India will be linked to patent rights and licenses on products that emerge from such research.
India’s agricultural research infrastructure and institutional setup expanded greatly in the post-independence period and is unmatched across most less-developed countries. In addition to a number of central institutions under the umbrella of the Indian Council for Agricultural Research (ICAR), there are a large number of State Agricultural Universities, Colleges and other institutions of higher learning. India has more than 7000 agricultural scientists and more than 40,000 agricultural extension workers. One aspect of KIA is that it is to be a means by which US agribusiness corporations gain access to this institutional setup and pool of scientists and technological personnel.
KIA is to be designed and monitored by a governing board that has, as members, representatives of major US agribusiness and retail firms. The US side includes, among its eight members, representatives from Monsanto and Walmart and other business organiations.
It is clear that an important objective of KIA is to bring a patent-protected regime of commercial agriculture to India that will, first, attempt to meet the demand for tropical agricultural products in the developed world, and secondly, to ensure large returns to multinational agribusiness firms through patent rights on biochemical farm inputs.
84
8. The Public Food Distribution System Has Been Set Back by Decades As a result of economic liberalization, major programs of food security were
reversed.12 Three key objectives of economic reforms – and these are stated explicitly in many policy documents including different Economic Surveys – have been to reduce food subsidies, to leave distribution to the market and to restrict public systems for food distribution by means of policies of narrow targeting.
Specifically, the central government introduced a policy of narrow targeting of the public distribution system (PDS), one of the pillars of food security policy in India. The PDS is a rationing mechanism that entitles households to specified quantities of selected commodities at subsidized prices. In most parts of the country, up to 1997, the PDS was universal and all households with a registered residential address, rural and urban, were entitled to rations. In 1996-97, a new system, the Targeted PDS, was introduced.
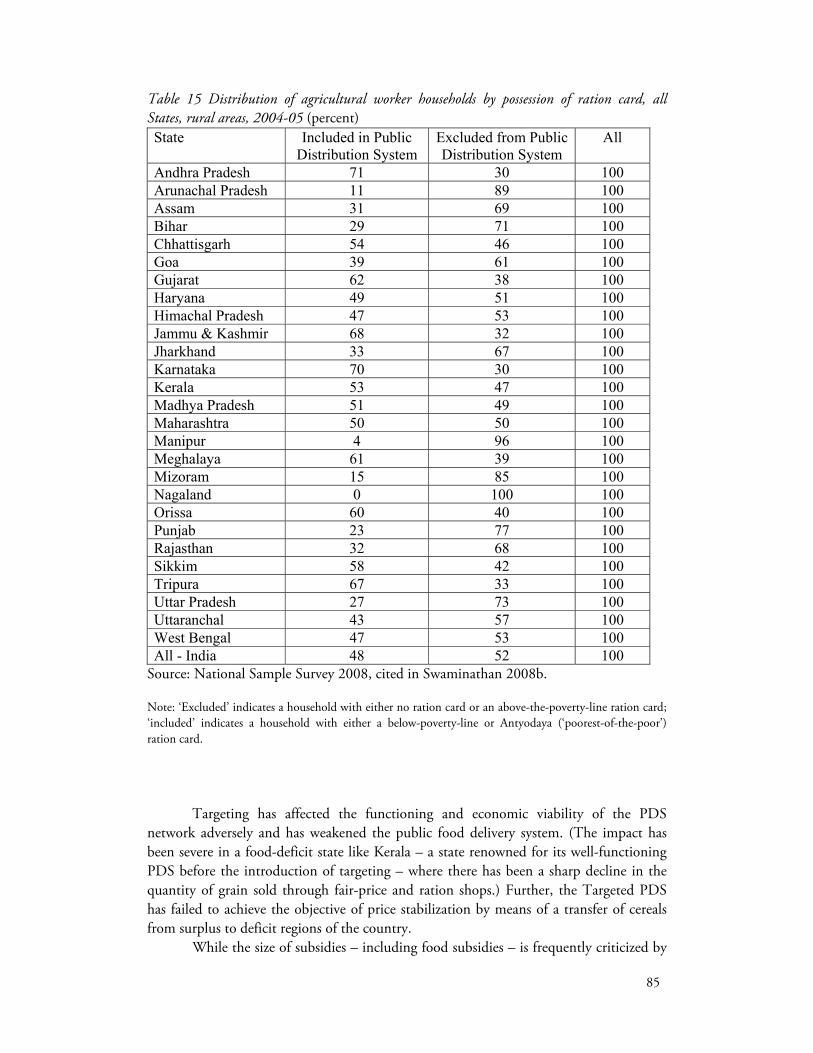
The implementation of the Targeted PDS led to the large-scale exclusion of genuinely needy persons from the PDS. Recent evidence from the 61st Round of the National Sample Survey, conducted in 2004-05, make it clear that a large proportion of agricultural labour and other worker households, of households belonging to the Scheduled Castes and Tribes, of landless and near-landless households, and households in the lowest expenditure classes, are excluded from the PDS today. Swaminathan (2008b) defines households without a ration card or with an APL (Above Poverty Line) card as those effectively excluded from the PDS and those with a BPL (Below Poverty Line) card or an Antyodaya (‘poorest of the poor’) card as those effectively included in the PDS.13 By this definition, the data show that there were only four States out of 27 (Tamil Nadu excluded) in which two-thirds or more of agricultural labour households were effectively included and 33 percent or less were effectively excluded from the PDS. These States were Andhra Pradesh, Karnataka, Jammu and Kashmir and Tripura (Table 15). The all-India data indicate that 52 percent of agricultural worker households were effectively excluded from the PDS. The effective exclusion was 71 percent in Bihar and 73 percent in Uttar Pradesh.
The exception is Tamil Nadu, which is the only State to have a universal system of PDS with rice available at Rs 2 a kilogram (reduced on 15 September 2008 to 1 rupee a kg) to all card-holders.
85
Table 15 Distribution of agricultural worker households by possession of ration card, all States, rural areas, 2004-05 (percent) State Included in Public
Distribution System Excluded from Public Distribution System
All
Andhra Pradesh 71 30 100 Arunachal Pradesh 11 89 100 Assam 31 69 100 Bihar 29 71 100 Chhattisgarh 54 46 100 Goa 39 61 100 Gujarat 62 38 100 Haryana 49 51 100 Himachal Pradesh 47 53 100 Jammu & Kashmir 68 32 100 Jharkhand 33 67 100 Karnataka 70 30 100 Kerala 53 47 100 Madhya Pradesh 51 49 100 Maharashtra 50 50 100 Manipur 4 96 100 Meghalaya 61 39 100 Mizoram 15 85 100 Nagaland 0 100 100 Orissa 60 40 100 Punjab 23 77 100 Rajasthan 32 68 100 Sikkim 58 42 100 Tripura 67 33 100 Uttar Pradesh 27 73 100 Uttaranchal 43 57 100 West Bengal 47 53 100 All - India 48 52 100
Source: National Sample Survey 2008, cited in Swaminathan 2008b. Note: ‘Excluded’ indicates a household with either no ration card or an above-the-poverty-line ration card; ‘included’ indicates a household with either a below-poverty-line or Antyodaya (‘poorest-of-the-poor’) ration card.
Targeting has affected the functioning and economic viability of the PDS network adversely and has weakened the public food delivery system. (The impact has been severe in a food-deficit state like Kerala – a state renowned for its well-functioning PDS before the introduction of targeting – where there has been a sharp decline in the quantity of grain sold through fair-price and ration shops.) Further, the Targeted PDS has failed to achieve the objective of price stabilization by means of a transfer of cereals from surplus to deficit regions of the country.
While the size of subsidies – including food subsidies – is frequently criticized by
86
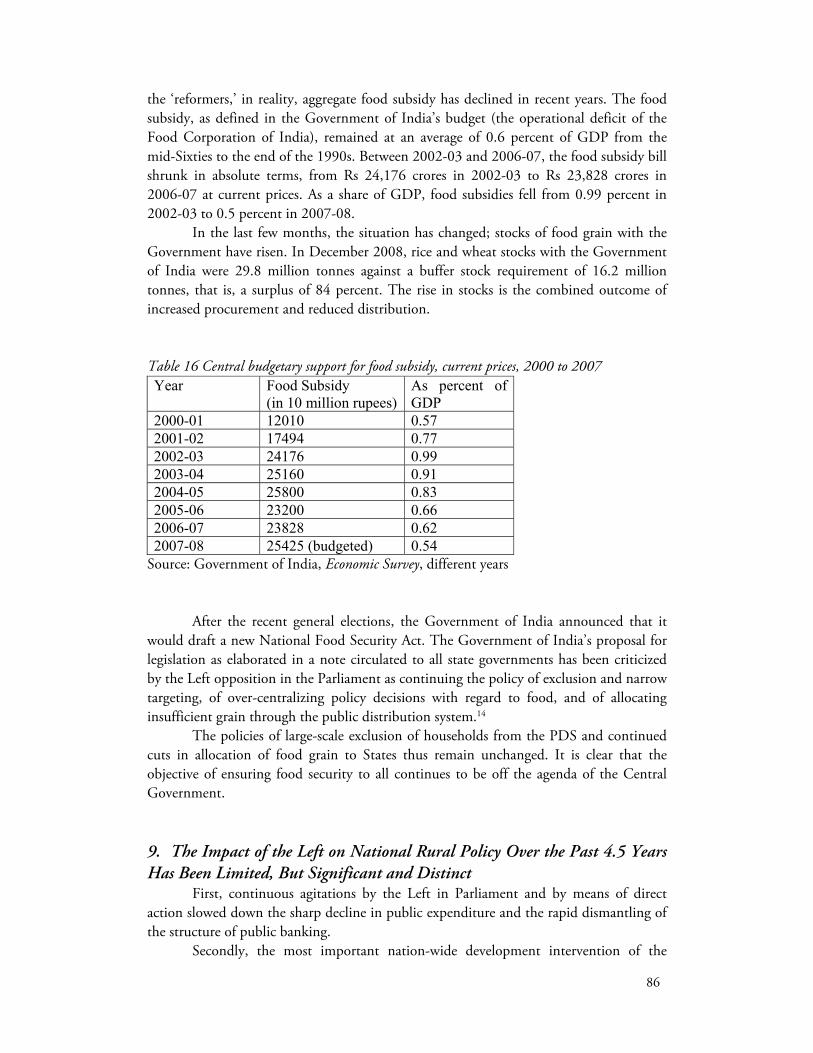
the ‘reformers,’ in reality, aggregate food subsidy has declined in recent years. The food subsidy, as defined in the Government of India’s budget (the operational deficit of the Food Corporation of India), remained at an average of 0.6 percent of GDP from the mid-Sixties to the end of the 1990s. Between 2002-03 and 2006-07, the food subsidy bill shrunk in absolute terms, from Rs 24,176 crores in 2002-03 to Rs 23,828 crores in 2006-07 at current prices. As a share of GDP, food subsidies fell from 0.99 percent in 2002-03 to 0.5 percent in 2007-08.
In the last few months, the situation has changed; stocks of food grain with the Government have risen. In December 2008, rice and wheat stocks with the Government of India were 29.8 million tonnes against a buffer stock requirement of 16.2 million tonnes, that is, a surplus of 84 percent. The rise in stocks is the combined outcome of increased procurement and reduced distribution. Table 16 Central budgetary support for food subsidy, current prices, 2000 to 2007 Year Food Subsidy
(in 10 million rupees)As percent of GDP
2000-01 12010 0.57 2001-02 17494 0.77 2002-03 24176 0.99 2003-04 25160 0.91 2004-05 25800 0.83 2005-06 23200 0.66 2006-07 23828 0.62 2007-08 25425 (budgeted) 0.54
Source: Government of India, Economic Survey, different years
After the recent general elections, the Government of India announced that it would draft a new National Food Security Act. The Government of India’s proposal for legislation as elaborated in a note circulated to all state governments has been criticized by the Left opposition in the Parliament as continuing the policy of exclusion and narrow targeting, of over-centralizing policy decisions with regard to food, and of allocating insufficient grain through the public distribution system.14
The policies of large-scale exclusion of households from the PDS and continued cuts in allocation of food grain to States thus remain unchanged. It is clear that the objective of ensuring food security to all continues to be off the agenda of the Central Government. 9. The Impact of the Left on National Rural Policy Over the Past 4.5 Years Has Been Limited, But Significant and Distinct
First, continuous agitations by the Left in Parliament and by means of direct action slowed down the sharp decline in public expenditure and the rapid dismantling of the structure of public banking.
Secondly, the most important nation-wide development intervention of the
87
present government, the National Rural Employment Guarantee program, was directly the result of Left intervention and pressure.
Thirdly, the most important legislation directly affecting the right to livelihood of the Adivasi people, the Scheduled Tribe and Other Forest Dwellers (Recognition of Forest Rights) Act, was spearheaded by the Left in Parliament, and would never have become law without the attention to detail of the Left MPs, and without the struggles for forest rights of Left-led mass organizations. 10. Some Concluding Notes
In conclusion, there are three features of the current situation that we shall highlight. First, the major force on the Left in India considers the Indian state to be the organ of the class rule of the bourgeoisie and landlords, led by the big bourgeoisie, who are in increasing collaboration – as a junior partner or subordinate ally – of imperialism. This is the view of the state that informs this paper, and we cannot emphasize enough that nothing in the present situation has undone landlordism as a fundamental barrier to agrarian and general social progress. By this view, the agrarian question has been, since Independence, and remains, the major national question in India. Any resolution of the agrarian question requires revolutionary change, including agrarian reform that targets landlordism, moneylender-merchant exploitation and caste and gender oppression in the countryside. Neo-liberalism has not lessened the tactical or strategic importance of this contradiction; recent developments have sharpened the contradiction rather than blunted it.
Secondly, since 1991, state intervention and the part played by imperialism in the countryside – that is, the class policies of the state in rural India – have taken qualitatively new forms. As we have seen, state policy has acted as a vast depressor, reversing policies of administered agricultural input costs and output prices, scaling down public investment in rural physical and social infrastructure, dismantling the institutional structure of social and development banking, withdrawing quantitative restrictions on the import of agricultural products, restricting the public distribution system, and undermining national systems of research, extension and the protection of national plant and other biological wealth.
Thirdly, globalization does not flatten out all local landscapes – the problems of the uneven development of capitalism have been accentuated under neo-liberalism. In the present situation, we need to study the common features of imperialist globalization and the transformation of rural societies – including the impact of globalization and liberalization – in specific situations.15
The current situation thus raises a crucial issue for those involved in the movement for radical, progressive rural change in less developed countries. The solution to the agrarian question involves both direct class struggle in the diverse conditions of the Third World countryside (in the Indian context, it involves the struggle against landlordism, moneylender-merchant exploitation and caste and gender oppression) as well as the struggle against the new onslaught by imperialism and domestic bourgeoisies. How the links are to be made between the different aspects of the struggle for agrarian change is a crucial issue of theory and practice for the future of democratic movements in
88
the Third World countryside. ACKOWLEDGEMENTS We are grateful to John Harriss, Paul Bowles, other participants at the Conference on ‘Globalization(s) and Labour: China, India and the West’ organized by the University of Northern British Columbia and Simon Fraser University, and two referees, for comments, and to Madhura Swaminathan for data, comments and much help with this paper. NOTES 1 A detailed evaluation of the legislation is in Ramachandran and Ramakumar (2000). See also Ramachandran and Swaminathan (2002), Hirashima (2000). 2 For a discussion of the problems of the NSS database on ownership and operational holdings of land, see Rawal (2008) and Bakshi (2008). 3 The village with the lowest concentration of ownership of land holdings, Dungariya in Rajasthan (row 8), is an Adivasi village in southern Rajasthan. The data from this village, where the development of the productive forces in agriculture has been relatively low, show that while differentiation in the distribution of holdings among the peasantry does exist, it is of a lower order than elsewhere. 4 The All-India Kisan Sabha (or Peasant Union) is the largest organization of the peasantry in India. It has over 20 million members. 5 While private investment rose in the 1980s and 1990s, it was by no means adequate. The share of agriculture in aggregate capital formation fell from 14.6 in the 1970s to 7.1 in the 1990s (Thulasamma 2003). It follows that the situation with respect to the expansion of irrigated area (and the lack of access of small cultivators and the landless to irrigated land) is a serious and disturbing aspect of the present situation. 6 Ramachandran and Swaminathan (2005) and the references in Chavan and Ramakumar (2007). 7 See Chavan and Ramakumar (2007) and Ramachandran and Swaminathan (2005). 8 The following parties comprise the Left in the two Houses of the Parliament: the Communist Party of India (Marxist), the Communist Party of India, the All India Forward Bloc, and the Revolutionary Socialist Party. 9 The rice economy of India has been particularly stagnant over the past two decades (see for instance, Surjit 2008). 10 For a detailed discussion of neoliberal economic policy and rural employment, see Ramachandran and Swaminathan (2004). 11 On this, see Rawal (2006) and Purkayastha (2006). 12 For the data in this section, see Swaminathan (2008b); see also Swaminathan (2000). 13 In 1997, the Public Distribution System was changed to Targetted Public Distribution System under which subsidized food grain are provided only to those households that were given BPL (Below Poverty Line) cards. Above Poverty Line households have a smaller entitlement and are provided food grain without any subsidy.
89
14 See the Resolution adopted at the National Convention for the Right to Food and Against Price Rise 26 August, New Delhi. http://www.cpim.org/statement/2009/08262009-food-conv-res.pdf. 15 In an important paper, T.J. Byres has argued against ‘determinism’ with respect to globalization, and of ignoring (as did dependency theory in an earlier period) the ‘specificities and substantive diversity’ of capitalist development in specific areas (Byres 2002). REFERENCES Bakshi, A. (2008) ‘Social Inequality in Land Ownership in India: A Study with Particular Reference to West Bengal’, Social Scientist, 39(9-10): 95-116. Byres, T. J. (2002) ‘Paths of Capitalist Agrarian Transition in the Past and in the Contemporary World’, in V.K. Ramachandran and M. Swaminathan (eds), Agrarian Studies: Essays on Agrarian Relations in Less-Developed Countries (pp. 54-83). New Delhi: Tulika Books. Chavan, P. (2007) ‘Access to Bank Credit: Implications for Dalit Rural Households’, Economic and Political Weekly 42(31): 3219-3224. Dreze, J. and Khera, R. (2009) ‘The Battle for Employment Guarantee’, Frontline 26(1), 3-16 January 2009. EPW Research Foundation (2002) National Account Statistics. Mumbai: EPW Research Foundation. Ghosh, J. (2005) ‘Trade Liberalization in Agriculture: An Examination of Impact and Policy Strategies with Special Reference to India’, occasional paper, Human Development Report 2005. New York: United National Development Program. Government of India, Ministry of Agriculture and Cooperation (2008) Agricultural Statistics at a Glance. New Delhi: Ministry of Agriculture and Cooperation. Gupta, S. (2007) ‘The Significance and Limitations of India’s National Rural Employment Guarantee Act in Addressing Rural Poverty’, paper presented at the International Conference and Workshop on 'Policy Perspectives on Growth, Economic Structures and Poverty Reduction', Beijing, June 3-9. http://www.networkideas.org/ideasact/Jun07/Beijing_Conference_07/Smita_Gupta.pdf. Hirashima, S. (2000) ‘Issues in Agricultural Reforms: Public Investment and Land Market Development’, Economic and Political Weekly 35(42): 3879-3884. Indian School of Women’s Studies and Development (ISWSD) (2007) ‘Implementation
90
of the National Rural Employment Guarantee Scheme: Submission to the Parliamentary Standing Committee on Rural Development’. New Delhi: Indian School of Women’s Studies and Development. Karat, B. (2005) ‘Towards Implementing the Rural Employment Guarantee Act’, People’s Democracy 29(42/43), 16 and 23 October 2005. Karat, B. (2008) ‘Stop Dilution of REGA’, People’s Democracy 32(20-21), 25 May-1 June 2008. Mishra, S.K. (2007) ‘On Agrarian Transition in West Bengal’, The Marxist 23(3). Mehrotra, S. (2008) ‘NREG Two Years On: Where Do We Go from Here?’, Economic and Political Weekly, 2 August 2008. Government of India Ministry of Statistics and Program Implementation (2008) National Account Statistics. New Delhi: Central Statistical Organization, Ministry of Statistics and Program Implementation, Government of India. Purkayastha, P. (2006) ‘Indo-US Agricultural Initiative: Handing Indian Agriculture to Monsantos’, People’s Democracy 30(9), 26 February 2006. Ramachandran, V. K. and Ramakumar, R. (2000), ‘Agrarian Reforms and Rural Development Policies in India: A Note’, paper presented at the International Conference on Agrarian Reform and Rural Development organized by the Department of Agrarian Reform, Government of the Philippines and the Philippines Development Academy, Tagaytay City, 5-8 December 2000.
Ramachandran, V. K. and Swaminathan, M. (2002) ‘Introduction’, in V.K. Ramachandran and M. Swaminathan (eds), Agrarian Studies: Essays on Agrarian Relations in Less-Developed Countries. New Delhi: Tulika Books.
Ramachandran, V.K. and Swaminathan, M. (eds) (2005) Financial Liberalization and Rural Credit in India. New Delhi: Tulika Books. Ramakumar, R. (2000) ‘Magnitude and Terms of Tenancy in India: A State-wise Analysis of Changes, 1981-82 to 1991-92’, Indian Journal of Agricultural Economics 55(3): 337. Ramakumar, R. (2009) ‘Declining Number of Rural Bank Branches in India’, ms., Mumbai: Tata Institute of Social Sciences. Ramakumar, R. and Chavan, P. (2007) ‘Revival of Agricultural Credit in the 2000s: An Explanation’, Economic and Political Weekly 42(52): 955-965.
91
Rangarajan, C. (1996) ‘Rural India, The Role of Credit’, Reserve Bank of India Bulletin May 1996. Bombay: Reserve Bank of India. Rawal, Vikas (2006) ‘The Indo-US Knowledge Initiative on Agriculture: What Does it Have for Indian Farmers?’, ms., New Delhi: Jawaharlal Nehru University. Rawal, V. (2008) ‘Ownership Holdings of Land in Rural India: Putting the Record Straight’, Economic and Political Weekly 43(10): 43-47. Reserve Bank of India (1991), ‘Report of the Committee on the Financial System’, (Chairman: M. Narasimham), Mumbai, India. Surjit, V. (2008) Farm Business Incomes in India: A Study of Two Rice Growing Villages of Thanjavur Region, Tamil Nadu, unpublished Ph.D. dissertation, University of Calcutta, Kolkata. Swaminathan, M. (2000) Weakening Welfare: The Public Distribution of Food in India. Delhi: Leftword Books. Swaminathan, M. (2008a), ‘Public Distribution System and Social Exclusion’, The Hindu, Chennai, 7 May 2008. Swaminathan, M. (2008b) ‘Programs to Protect the Hungry: Lessons from India’, Department of Economic and Social Analysis (DESA) Working Paper no. 70. New York: United Nations. Thulasamma, L. (2003) ‘Investment in Agriculture: Trends and Issues’, paper presented at the All-India Conference on Agriculture and Rural Society in Contemporary India, Barddhaman, 17-20 December 2003. BIOGRAPHICAL NOTE V.K. Ramachandran is with the Social Sciences Division, Indian Statistical Institute, Kolkata, India. Vikas Rawal is with the Centre for Economic Studies and Planning, Jawaharlal Nehru University, New Delhi, India.