the impact of landline and cell phone usage patterns ... impact of landline and cell phone usage...
TRANSCRIPT

The Impact of Landline and Cell Phone Usage Patterns among Young Adults on RDD Survey Outcomes
Douglas Currivan1, David Roe2, and Jason Stockdale1
1RTI International 2Survey Sciences Group, LLC
May 2008 This paper was prepared for presentation at the American Association for Public Opinion Research annual meetings in New Orleans, LA on May 16, 2008. The authors thank the New York State Department of Health for supporting this research. All conclusions and opinions expressed in this paper are solely those of the authors.
Abstract
A current challenge in conducting telephone surveys is obtaining satisfactory representation among young adults. Surveys using random-digit dial (RDD) or directory-listed sample frames exclude the approximately 28 percent of adults age 18 to 24 who live in households without landline phone service. In addition to this well-documented coverage issue, a further problem is the potential difficulty in contacting and interviewing the 70 percent of young adults who do live in households with landline phone service. RDD telephone surveys may further under-represent the full population of young adults by excluding those young adults who primarily rely on cell phones and are difficult to reach by landline phones. Young adults who primarily use cell phones may have important similarities with those who only have wireless phone service. Excluding them would therefore negatively effect survey representativeness. To better understand the potential impact of phone usage patterns on nonresponse among young adults, this paper examines patterns of landline and cell phone use among adults age 18 to 24 and assesses the impact of these usage patterns on nonresponse bias. The data we use are drawn from an RDD-based survey on health behaviors that targeted young adults in the state of New York. All participants were asked about their current phone service and usage patterns with respect to both landline and cell phones. We examined whether and how the presence, number, and sharing of cell phones in households was related to young adults’ responsiveness to landline phone calls. In addition, we expected (and found) that young adults interviewed via landline phones would report significantly greater use of cell phones versus landline phones. Bringing several demographic characteristics and health indicators into the analysis, we then assessed how young adults’ reliance on wireless phone service could potentially contribute to nonresponse error in RDD surveys on health behaviors.
1
Introduction
A current challenge in conducting telephone surveys is obtaining satisfactory representation among younger adults. Surveys using random-digit dial (RDD) based sample frames currently exclude about 28 percent of adults age 18 to 24 who live in households without landline phone service. This coverage issue is increasingly well-documented via National Health Interview Survey (NHIS), a face-to-face household survey (Blumberg and Luke, 2007).
A second, related challenge is the likelihood of contacting and interviewing the 70 percent of young adults who do live in households with landline phone service. Even when young adults have access to landline phones, and can therefore be included in RDD-based sample frames, they may not regularly answer calls to landline phones. High penetration of cell phone service and usage among cell phones seems likely to relegate use of landline phones to secondary status (Blumberg and Luke, 2007; Tucker, Brick, and Meekins, 2007). As Tucker, et al (2007) note, nonresponse bias could be observed in RDD surveys if certain types of households with both landline and cell phones primarily use their cell phones. Young adults phone usage patterns may add significant nonresponse error to the existing coverage error in RDD-based telephone surveys. This research explores usage patterns of landline and wireless phones among young adults, and the implications of these usage patterns on survey outcomes. We examine data from an RDD-based survey on health behaviors that targeted adults age 18 to 24. The survey included a series of questions about landline and cell phone usage. We use these data to examine factors related to usage patterns, and then examine the relation of specific usage patterns to key survey measures of health behaviors. Our results provide specific examples of how nonresponse error may further reduce researchers’ ability to adequately represent the experiences of young adults in RDD surveys.
Phone Usage Patterns among Young Adults
A starting assumption of this research is that young adults rely primarily cell phones and other wireless devices for communication and increasingly limit their use of landline phones in their homes. Some evidence supports this view. The latest data from the NHIS presented by Blumberg and Luke (2007) indicate that about 28 percent of adults age 18 to 24 live in households with only wireless phone service. This percentage has increased dramatically over the past three years, as only about 10 percent of young adults lived in households with wireless phone service only in the first half of 2004 (Blumberg and Luke, 2007). These numbers indicate cell phone usage is both pervasive and increasing among young adults. Even greater reliance on wireless phones is observed among adults with characteristics typically associated with those in the 18 to 24 age range. For example, about 55 percent of all adults who live with unrelated roommates live in households with only wireless phone service.
2
Although the NHIS data clearly indicate increasing reliance on cell phones among young adults, less is known about the usage patterns of the vast majority of 18 to 24 year olds who do live in households with landline phone service. Logically, young adults with both wireless and landline phone service can conform to one of three phone usage patterns:
(1) use their wireless phones significantly more than their landline phone service
(2) use their wireless phones about the same as their landline phone service, or
(3) use their landline phone service significantly more than their wireless phones.
We expect to find that most young adults use their wireless phones more than or as much as their landline phones, and would therefore fall under either the first and second usage pattern. Still, without existing data to address this point, we cannot simply rule out the possibility that a non-trivial portion of young adults fall under the third pattern.
The primary objective of this research is to assess phone usage patterns among young adults. Such data will provide evidence on the challenges associated with including young adults who do live in households with landline phone service in RDD surveys. If the vast majority of young adults use their cell phones significantly more than their landline phone service, for example, they may be less likely to respond to calls in RDD surveys. Even when other adult informants such as parents or roommates identify a young adult in the households who is then selected to participate in the survey, those who rarely use the landline service may be difficult to interview on the landline phone. Given these concerns, we explore how phone usage patterns among young adults may be related to nonresponse potential.
Phone Usage Patterns and Survey Estimates among Young Adults
The secondary objective of this research is to assess how phone usage patterns among young adults might be related to key survey estimates such as health behaviors. Blumberg and Luke (2007) demonstrate the potential impact of non-coverage of young adults due to wireless substitution on health indicators. NHIS data from the first half of 2007 indicate that adults living in households with wireless phone service were more likely to engage in binge drinking, more likely to be current smokers, and less likely to have health insurance coverage. At the same time, those adults with only wireless phone service were also more likely to report their health status as excellent or very good and more likely to regularly engage in regular physical activity in their leisure time (Blumberg and Luke, 2007).
These observed differences in behavioral health indicators may be primarily driven by the relative youth of U.S. residents in cell phone only households versus those who have landline service. This factor also appears to explain some key demographic differences between wireless-only households and those with landline phones. For example, Blumberg and Luke (2007) found that More than one-half of all adults living with unrelated roommates lived in households with only wireless telephones. This was the highest prevalence rate of cell-phone
3
only adults among all of the population subgroups they examined using NHIS data. Similarly, they found adults renting their homes (28.2%) were over four times as likely than adults who own their homes (6.7%) to be living in households with only wireless phone service. Both of these findings appear to be associated with younger adults.
Furthermore, even within the young adult population, there may be differences in behaviors between those with cell phones only and those with landline service. Delnevo, Gunderson, and Hagman (2007) conclude that observed declines in cigarette smoking and alcohol use among young adults in the Behavioral Risk Factors Surveillance System (BRFSS) from 2003 to 2005 are artifacts of undercoverage of young adults without landline service. These authors note that such declines have not been observed in surveys based on area probability samples, such as the NHIS and the National Survey of Drug Use and Health (NSDUH). These findings indicate that young adults in cell phone only situations behave differently than those with landlines with respect to factors related to their health.
About 70 percent of young adults currently live in households with landline phone service and can therefore be included in RDD-based surveys. In telephone surveys, errors of omission may affect survey estimates both from noncoverage and nonresponse. Young adults may use landline phones to receive personal or business messages, but not regularly receive or place calls on these phones. Further limits to the responsiveness of young adults to landline phone calls may occur when landline phone service is shared with parents or roommates. For example, young adults who live with parents may not associate themselves with this phone service and therefore be difficult to include in telephone surveys. We explore young adults phone usage patterns to see whether these patterns indicate that significant nonresponse error may add to the coverage error for young adults in RDD-based telephone surveys. For example, young adults who rarely use the landline phones in their households may engage in similar smoking and drinking behaviors as those without landline service. Consequently, their lower participation in telephone survey may add further bias to behavioral health estimates.
Research Questions
To understand young adults phone usage patterns and the potential impact of these patterns on survey estimates, this research seeks answer to three questions:
1. How is the presence of cell phone service related to young adults use of landline phone service?
2. How can young adults phone behaviors be categorized into specific phone usage patterns?
3. How are phone usage patterns among young adults related to demographic characteristics and behavioral health indicators?
4
We expect that answers to these questions will provide some evidence on the extent to which young adults’ participation in phone surveys may be limited further, and the impact of this limitation on key survey measures.
Data
The data we use to address our research questions come from the New York Young Adult Tobacco Survey (NY YATS). The NY YATS was sponsored by the New York State Department of Health. The purpose of this study was to measure smoking behaviors among adults age 18 to 24 and assess factors that influence smoking behavior or the likelihood of initiating smoking. With respect to influences, the study assessed the role of smoking policies in young adults’ residences (including school campuses) and exposure to anti-smoking media campaigns and tobacco marketing.
Households were sampled via list-assisted RDD sampling, supplemented by directory-listed numbers to increase sample efficiency in reaching households with at least one eligible adult age 18 to 24. Sample selection procedures matched those used for the ongoing New York Adult Tobacco Survey, whereby the RDD and directory-listed frames are stratified by eight county groups across the state of New York. This produced a total of 16 strata. Phone numbers were then randomly selected from each stratum proportional to the county group’s share of the population. When identified, one adult age 18 to 24 was selected in each household. If more than one person in the household fell into the eligible age range, the CATI program followed a procedure where all eligible adults and their gender were enumerated and then one was selected randomly. All participants were contacted and interviewed via regular landline phones. Therefore, like other current RDD surveys, young adults living in households with wireless phone service only were excluded from the survey. A total of 2,502 adults age 18 to 24 participated in the NY YATS. All interviews were completed in English. The average interview length was 25.5 minutes. The overall response rate was 32.6 percent among eligible households, based on the AAPOR RR 3 formula. Among young adults identified and contacted, the cooperation rate was 72.7 percent, based on the AAPOR COOP 3 formula. The NY YATS interview included standard demographic items, such as age, gender, Hispanic/Latino origin, race, employment status, and marital status. In addition, the interview asked young adults about their weekly income from both employment and other sources and also asked respondents about the nature of their current housing. The NY YATS survey items regarding wireless phone service were modeled after Current Population Survey (CPS) questions reported by Tucker, Brick, and Meekins (2007) and items from a University of
5
Maryland survey reported by Brick, Brick, Dipko, Presser, Tucker, and Yuan (2007). A key feature of the cell phone service items was clearly indicating that the questions referred to phones intended for personal use, as opposed to business use (Brick, et al, 2007). Three of the four items on phone usage patterns were adapted from CPS questions reported by Tucker, et al (2007). The fourth usage item, referring to the likelihood of answering cell versus landline phone calls, was devised by the authors. Appendix A presents all survey items used in the analysis with coding and frequencies.
Analysis
The analysis was conducted in three parts:
1. Cross-tabulations and chi-square tests of landline phone usage by the presence of wireless phone service, including having multiple and shared cell phones in the household.
2. Use of phone service and phone behaviors to classify respondents into one of three phone usage types – primarily cell users, mixed cell and landline users, and primarily landline users.
3. Cross tabulations and chi-square tests of demographic items and health indicators by the three phone usage types.
These analyses will address our three research questions on potential barriers to young adults’ participation in telephone surveys associated with their phone usage patterns and the consequences of these barriers for survey outcomes.
Results
Research Question 1
Our first question concerned how the presence of cell phone service was related to usage of landline phones among young adults. This analysis was based on a survey item adapted from Tucker, et al (2007) that was essentially intended to determine how likely respondents were to answer unsolicited calls to their regular landline phones, such as survey calls. We assessed the impact of three phone service patterns on the likelihood of answering unsolicited landline calls:
1. whether the respondent had a cell phone or other wireless device,
2. whether members of the household had only one cell phone or more than one cell phone; and
3. whether members of the household shared any of the cell phone(s) or not.
6
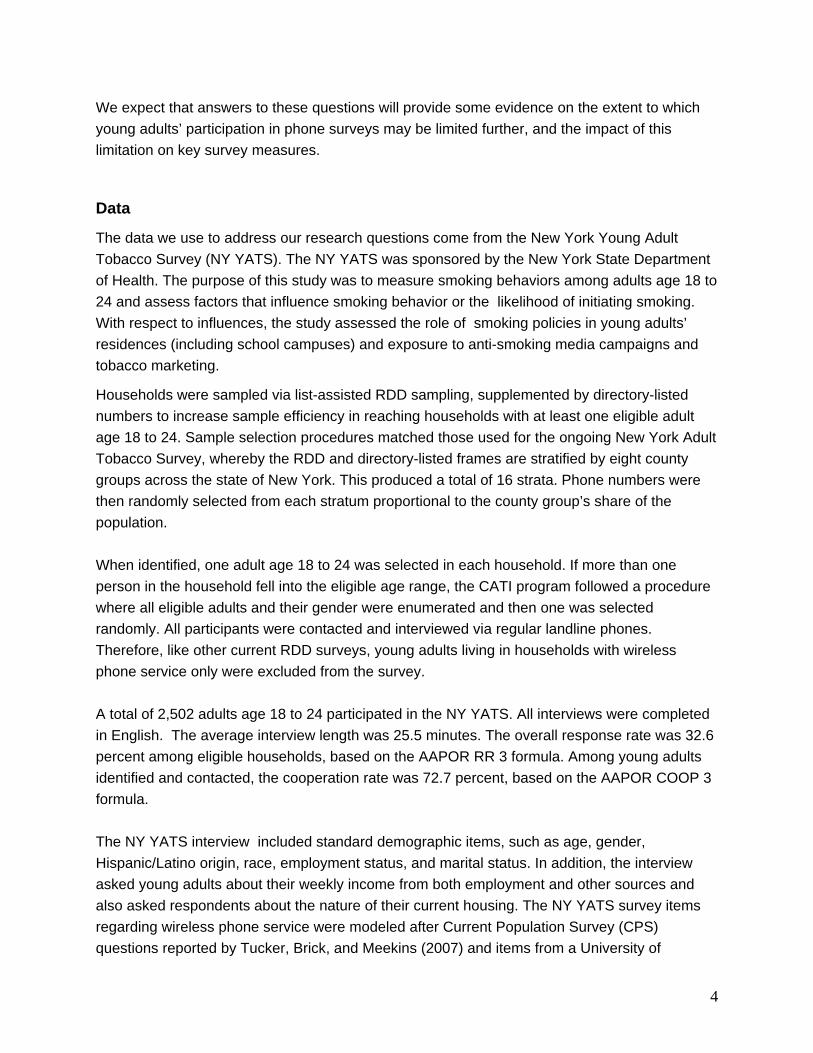
Table 1. Likelihood of Answering Landline Phone by Phone Service in Household How many calls to your regular home phone do you answer when you don’t recognize the caller’s phone number?
Landline Service Only
(n = 231)
Both Landline and Cell Service ( n = 1,999)
All or almost all
39.0 %
(90)
40.8 % (816)
More than half
11.3 %
(26)
9.9 % (198)
Less than half
11.7 %
(27)
10.0 % (195)
Very few or none
38.1 %
(88)
39.4 % (790)
Table 1 shows the results of comparing the likelihood of answering unsolicited landline calls by the type of phone service respondents had, either landline service only or both landline and cell phones. Overall, about 90 percent of NY YATS participants indicated that they had cell phone service in addition to regular landline service. However, having a cell phone or other wireless device for receiving calls did not have any significant association with the likelihood of young adults’ answering regular landline calls. Responses to this item were similarly bimodal for all respondents regardless of phone service, with about 40 percent in each group indicating that they answer “all or almost all” of the landline calls they receive and about 40 percent in each group indicating that they answer “very few or none” of the landline calls they receive.
Table 2 presents the comparison for the likelihood of answering unsolicited landline calls by the number of cell phones in the household, either one cell phone or more than one cell phone. Having only one versus more than one cell phone in the household was significantly correlated with the likelihood of young adults’ answering regular landline calls. The key difference appeared to be that about 31 percent of respondents living in households with a single cell phone indicated that they answer “very few or none” of the landline calls they receive, while 40 percent of those living in households with more than one cell phone indicated that they answer “very few or none” of the landline calls received. This observed association is tempered by the fact that relatively few respondents to the NY YATS who had at least one cell phone in their household lived in households with only one cell phone (about 6 percent). Nearly all

7
Table 2. Likelihood of Answering Landline Phone by Number of Cell Phones in Household
How many calls to your regular home phone do you answer when you don’t recognize the caller’s phone number? *
Only One Cell Phone
(n = 135)
More than one Cell Phone ( n = 1,992)
All or almost all
43.0 %
(58)
40.3 % (816)
More than half
8.9 %
(12)
9.9 % (198)
Less than half
17.0 %
(23)
9.5 % (195)
Very few or none
31.1 %
(42)
40.2 % (790)
* Difference in response pattern between respondents with only one cell phone and those with more than one cell phone is statistically significant at p < .05.
respondents in households with cell phones lived in households with others, such as parents or roommates, who also had cell phones.
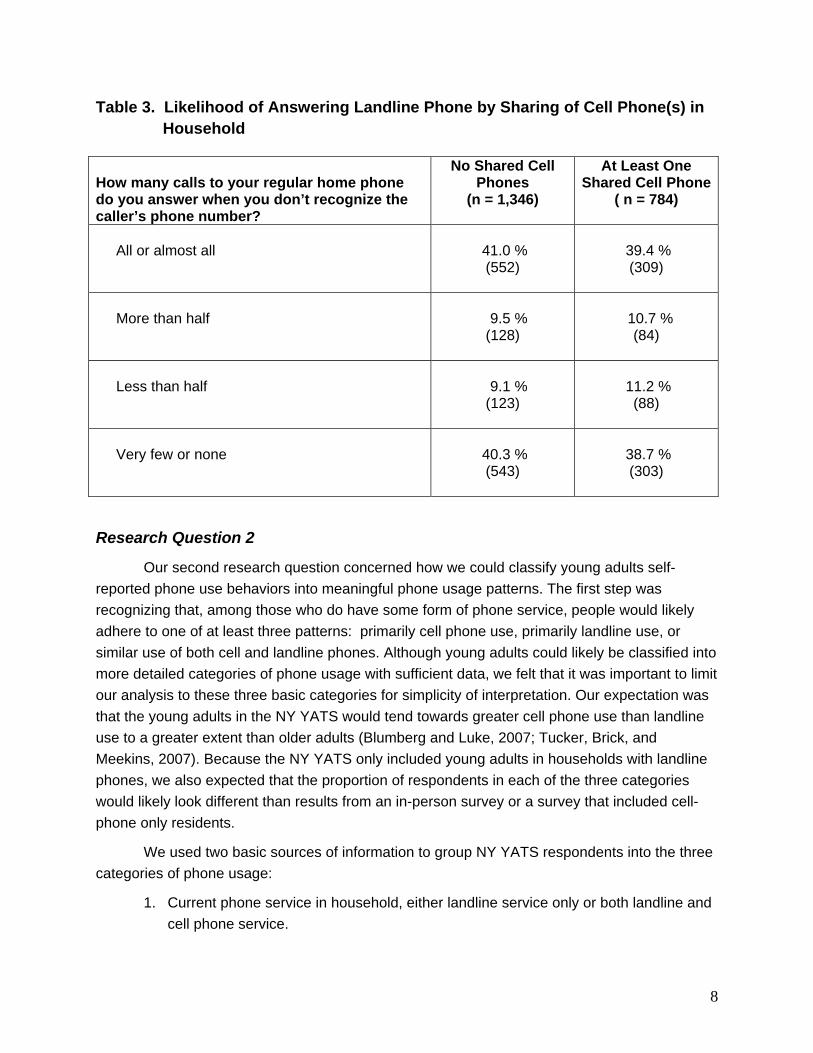
Table 3 provides the outcome of comparing the likelihood of answering unsolicited landline calls by the presence of at least one shared cell phone versus no shared cell phones in the household. Overall, about 37 percent of NY YATS respondents indicated having at least one cell phone in the household that was regularly answered by more than one household member. The comparison shows that whether or not household members shared cell phones did not have any significant relationship with their likelihood of answering unsolicited landline calls. Among both those who lived in households with at least one shared cell phone and those who did not, about 40 percent in each group indicating that they answer “all or almost all” of the landline calls they receive and about 40 percent in each group indicating that they answer “very few or none” of the landline calls they receive. In this respect, these findings looked very similar to the results on how the likelihood of answering unsolicited landline calls may be related to the type of phone service respondents had. In both cases, the distribution of response were bimodal and unrelated to the cell phone service in the household.
8
Table 3. Likelihood of Answering Landline Phone by Sharing of Cell Phone(s) in Household
How many calls to your regular home phone do you answer when you don’t recognize the caller’s phone number?
No Shared Cell Phones
(n = 1,346)
At Least One Shared Cell Phone
( n = 784)
All or almost all
41.0 % (552)
39.4 % (309)
More than half
9.5 % (128)
10.7 %
(84)
Less than half
9.1 % (123)
11.2 %
(88)
Very few or none
40.3 % (543)
38.7 % (303)
Research Question 2
Our second research question concerned how we could classify young adults self-reported phone use behaviors into meaningful phone usage patterns. The first step was recognizing that, among those who do have some form of phone service, people would likely adhere to one of at least three patterns: primarily cell phone use, primarily landline use, or similar use of both cell and landline phones. Although young adults could likely be classified into more detailed categories of phone usage with sufficient data, we felt that it was important to limit our analysis to these three basic categories for simplicity of interpretation. Our expectation was that the young adults in the NY YATS would tend towards greater cell phone use than landline use to a greater extent than older adults (Blumberg and Luke, 2007; Tucker, Brick, and Meekins, 2007). Because the NY YATS only included young adults in households with landline phones, we also expected that the proportion of respondents in each of the three categories would likely look different than results from an in-person survey or a survey that included cell-phone only residents.
We used two basic sources of information to group NY YATS respondents into the three categories of phone usage:
1. Current phone service in household, either landline service only or both landline and cell phone service.
9
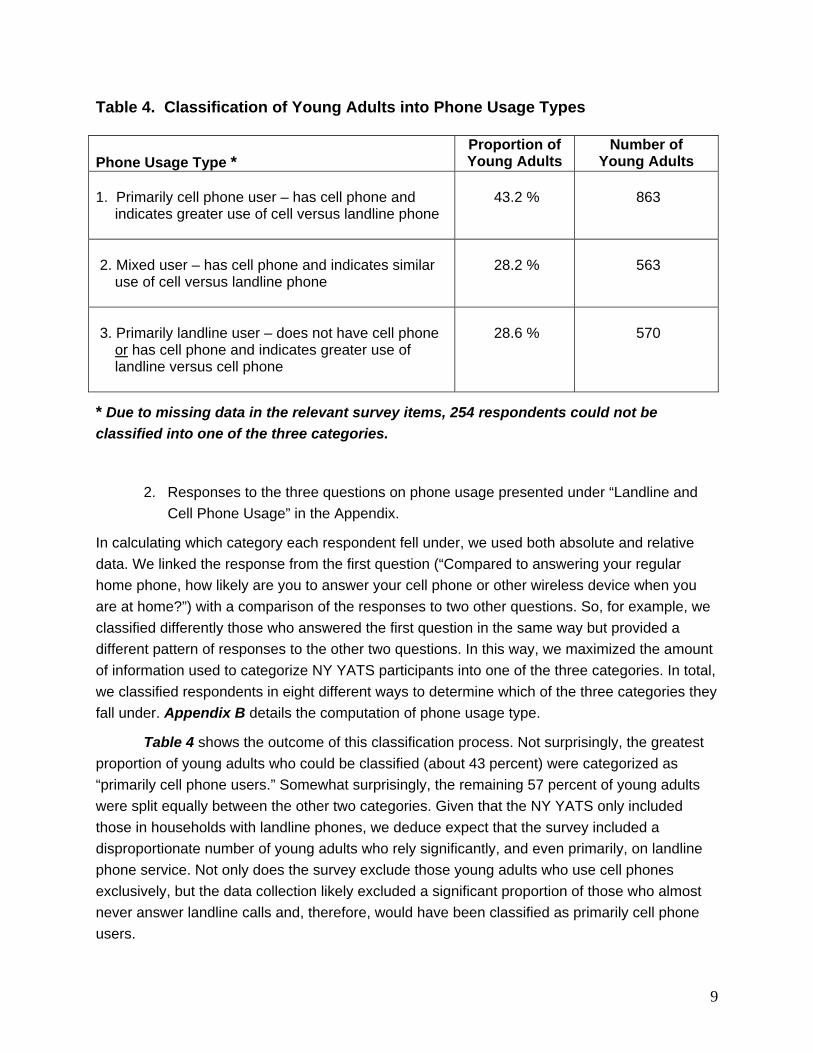
Table 4. Classification of Young Adults into Phone Usage Types Phone Usage Type *
Proportion of Young Adults
Number of Young Adults
1. Primarily cell phone user – has cell phone and
indicates greater use of cell versus landline phone
43.2 %
863
2. Mixed user – has cell phone and indicates similar
use of cell versus landline phone
28.2 %
563
3. Primarily landline user – does not have cell phone
or has cell phone and indicates greater use of landline versus cell phone
28.6 %
570
* Due to missing data in the relevant survey items, 254 respondents could not be classified into one of the three categories.
2. Responses to the three questions on phone usage presented under “Landline and Cell Phone Usage” in the Appendix.
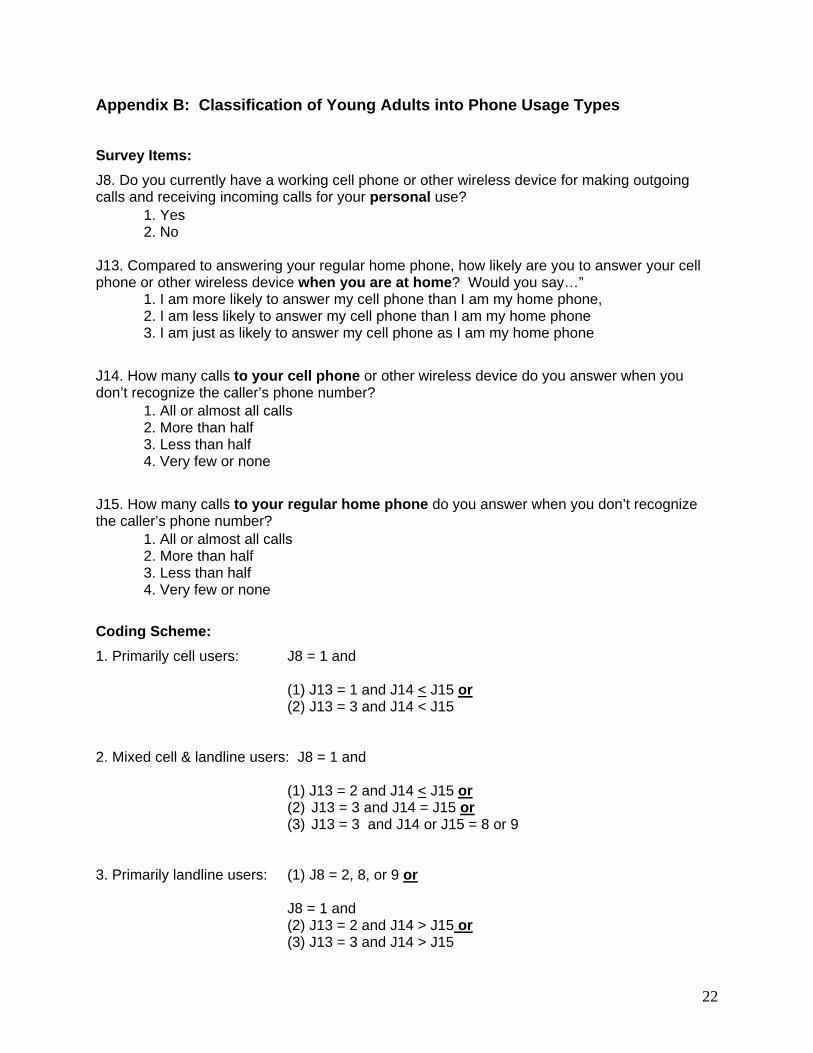
In calculating which category each respondent fell under, we used both absolute and relative data. We linked the response from the first question (“Compared to answering your regular home phone, how likely are you to answer your cell phone or other wireless device when you are at home?”) with a comparison of the responses to two other questions. So, for example, we classified differently those who answered the first question in the same way but provided a different pattern of responses to the other two questions. In this way, we maximized the amount of information used to categorize NY YATS participants into one of the three categories. In total, we classified respondents in eight different ways to determine which of the three categories they fall under. Appendix B details the computation of phone usage type.
Table 4 shows the outcome of this classification process. Not surprisingly, the greatest proportion of young adults who could be classified (about 43 percent) were categorized as “primarily cell phone users.” Somewhat surprisingly, the remaining 57 percent of young adults were split equally between the other two categories. Given that the NY YATS only included those in households with landline phones, we deduce expect that the survey included a disproportionate number of young adults who rely significantly, and even primarily, on landline phone service. Not only does the survey exclude those young adults who use cell phones exclusively, but the data collection likely excluded a significant proportion of those who almost never answer landline calls and, therefore, would have been classified as primarily cell phone users.
10
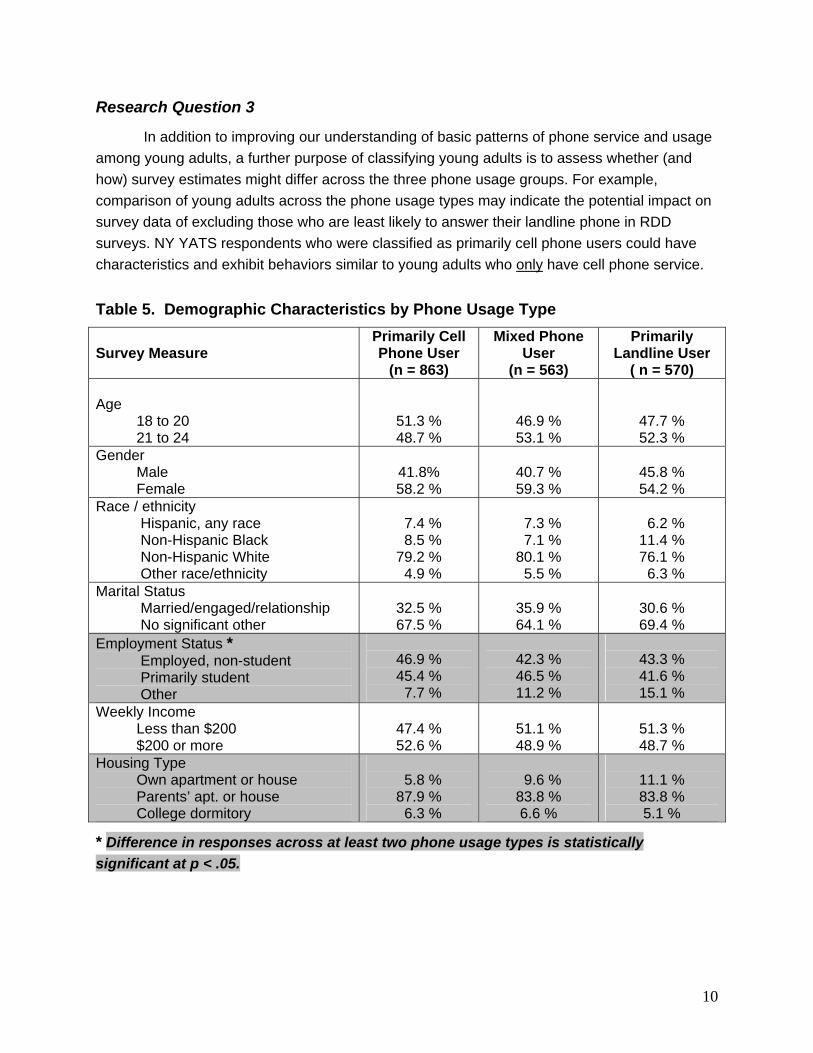
Research Question 3
In addition to improving our understanding of basic patterns of phone service and usage among young adults, a further purpose of classifying young adults is to assess whether (and how) survey estimates might differ across the three phone usage groups. For example, comparison of young adults across the phone usage types may indicate the potential impact on survey data of excluding those who are least likely to answer their landline phone in RDD surveys. NY YATS respondents who were classified as primarily cell phone users could have characteristics and exhibit behaviors similar to young adults who only have cell phone service.
Table 5. Demographic Characteristics by Phone Usage Type
Survey Measure
Primarily Cell Phone User
(n = 863)
Mixed Phone User
(n = 563)
Primarily Landline User
( n = 570) Age 18 to 20 21 to 24
51.3 % 48.7 %
46.9 % 53.1 %
47.7 % 52.3 %
Gender Male Female
41.8% 58.2 %
40.7 % 59.3 %
45.8 % 54.2 %
Race / ethnicity Hispanic, any race Non-Hispanic Black Non-Hispanic White Other race/ethnicity
7.4 % 8.5 % 79.2 % 4.9 %
7.3 % 7.1 % 80.1 % 5.5 %
6.2 % 11.4 % 76.1 % 6.3 %
Marital Status Married/engaged/relationship No significant other
32.5 % 67.5 %
35.9 % 64.1 %
30.6 % 69.4 %
Employment Status * Employed, non-student Primarily student Other
46.9 % 45.4 % 7.7 %
42.3 % 46.5 % 11.2 %
43.3 % 41.6 % 15.1 %
Weekly Income Less than $200 $200 or more
47.4 % 52.6 %
51.1 % 48.9 %
51.3 % 48.7 %
Housing Type Own apartment or house Parents’ apt. or house College dormitory
5.8 % 87.9 % 6.3 %
9.6 % 83.8 % 6.6 %
11.1 % 83.8 % 5.1 %
* Difference in responses across at least two phone usage types is statistically significant at p < .05.
11
Research among all adults indicates that we could expect those who rarely use landline phones to differ from those who use regularly landline phones both in terms of demographic characteristics, such as age and housing situation, and health indicators, such as drinking and smoking (Blumberg and Luke, 2007; Delnevo, Gunderson, and Hagman (2007). In this way, we essentially use extrapolation techniques to assess how heavy reliance on cell phones among the 70 percent of young adults who do have landline service may influence RDD survey estimates.
Table 5 presents the results of comparing demographic characteristics across the three phone usage types. Overall, NY YATS respondents looked similar across the three categories in terms of the distributions of age, gender, race/ethnicity, marital status, and income. Two differences were observed across the three groups stand out:
1. Employment patterns. Young adults who were primarily cell phone users were more likely to be employed and slightly less likely to fall under the “other” category than those in the other two groups.
2. Housing type. Young adults who were primarily cell phone users were less likely to live in their own apartment or house and more likely to live in their parents’/guardians’ home than those in the other two groups.
These findings indicate that those who were primarily cell phone users were both more likely to be employed and more likely to live in their parents’ household. These two factors that could make these adults more difficult to reach in RDD surveys where calls are being made to their parents’ landline phone.
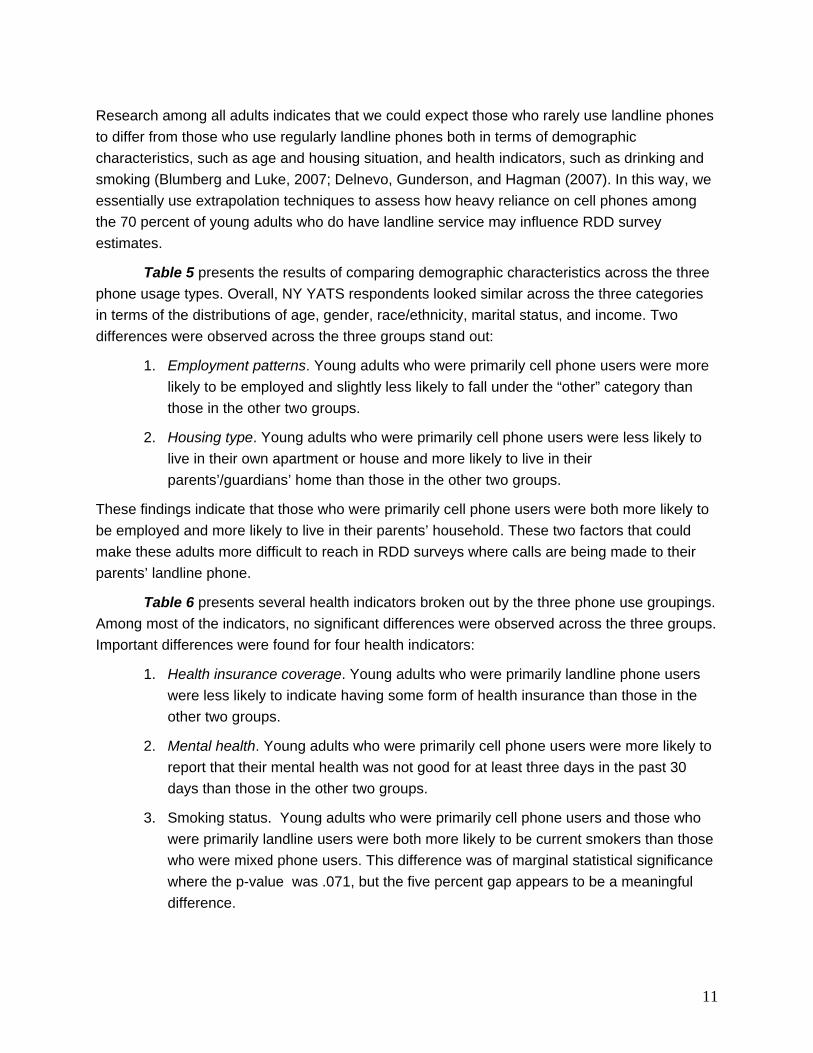
Table 6 presents several health indicators broken out by the three phone use groupings. Among most of the indicators, no significant differences were observed across the three groups. Important differences were found for four health indicators:
1. Health insurance coverage. Young adults who were primarily landline phone users were less likely to indicate having some form of health insurance than those in the other two groups.
2. Mental health. Young adults who were primarily cell phone users were more likely to report that their mental health was not good for at least three days in the past 30 days than those in the other two groups.
3. Smoking status. Young adults who were primarily cell phone users and those who were primarily landline users were both more likely to be current smokers than those who were mixed phone users. This difference was of marginal statistical significance where the p-value was .071, but the five percent gap appears to be a meaningful difference.

12
Table 6. Health Indicators by Phone Usage Type Survey Measure
Primarily Cell Phone User
(n = 863)
Mixed Phone User
(n = 563)
Primarily Landline User
( n = 570) Health Insurance Coverage * Yes No
86.9 % 13.1 %
85.4 % 14.6 %
80.5 % 19.5 %
General Health Status Poor/Fair/Good Very Good/Excellent
24.5 % 75.5%
25.4 % 74.6 %
27.4 % 72.6 %
Physical Health Not Good in Past Month Less than 3 days 3 days or more
76.9 % 23.1 %
77.5 % 22.5 %
77.8 % 22.2 %
Mental Health Not Good in Past Month * Less than 3 days 3 days or more
61.0 % 39.0 %
67.4 % 32.6 %
68.7 % 31.3 %
Moderate Physical Activities Less than 3 days 3 days or more
15.4 % 84.6 %
14.8 % 85.2 %
12.5 % 87.5 %
Vigorous Physical Activities Less than 3 days 3 days or more
43.0 % 57.0 %
43.1 % 56.9 %
42.9 % 57.1 %
Seen Health Professional in Past Year Yes No
84.2 % 15.8 %
83.7 % 16.3 %
83.5 % 16.5 %
Current Smoking Status Non-smoker Smoker
79.8 % 20.2 %
84.6 % 15.4 %
80.7 % 19.3 %
Binge Drinking in Past Month * 0 times 1 or more times
41.5 % 58.5 %
52.1 % 47.9 %
47.9 % 52.1 %
* Difference in responses across at least two phone usage types is statistically significant at p < .05.
* Difference in responses across at least two phone usage types is statistically significant at p < .10.
4. Binge drinking. Young adults who were primarily cell phone users were more likely to
report binge drinking in the past 30 days than those who were primarily landline phone users, who in turn were more likely to report binge drinking than who were mixed phone users.
These findings indicate that RDD surveys of young adults are likely to understate health insurance coverage, recent mental health issues, and possibly smoking. The implications for
13
binge drinking were less conclusive, as those who primarily use cell phones and those who primarily use landlines were significantly more likely to engage in binge drinking than the mixed use group. Because those who were primarily cell phone users had the highest report of binge drinking overall, it is most likely that RDD surveys would tend to underestimate this behavior among young adults.
Discussion
This research examined phone usage behavior among young adults age 18 to 24 in order to assess the potential for nonresponse error in traditional landline-based RDD surveys. A key question was how the presence and usage of cell phone services could impact young adults’ participation in RDD surveys and, therefore, the specific survey estimates from these surveys. The combined results show that reliance on cell phones has some potential to impact RDD survey outcomes among young adults.
Although having or sharing a cell phone was not associated with lower likelihood of answering unsolicited landline calls, having more than one cell phone in a household was associated with a greater likelihood of answering “very few or no” landline calls when the caller was unknown. This finding suggests that young adults living in households with multiple cell phone users would generally be more difficult to reach in RDD surveys than young adults with only a single cell phone in the household or no cell phones at all. Blumberg and Luke (2007) noted that over half of all adults who had unrelated roommates lived in households with only wireless phone service. Together, these findings suggest that young adults living with roommates are not only more likely to be excluded from RDD sample frames entirely, but may also be less likely to participate in RDD surveys when they and their roommates do have landline service.
When we categorized young adults who had responded to an RDD survey using both their reported phone service and phone usage behaviors, the largest group by far were those classified as primarily cell phone users, over 43% of respondents. Furthermore, those who primarily used cell phones looked different from other young adults in two important ways. Young adults who were primarily cell phone users were more likely to be employed and less likely to live in their own apartment or house than mixed phone users or those who primarily used landline phones. The finding on employment status was consistent with Tucker, Brick, and Meekins (2007), who found that not being employed reduced the likelihood of individuals having only cell phone service. The finding on housing type is difficult to compare to current literature, given the way the question was asked and the age range of NY YATS participants. Blumberg and Luke (2007) found that adults who rent their homes were more likely than those who owned their homes to only have cell phone service. But such comparisons are difficult to apply to 18 to 24 year olds, many of whom who are attending post-secondary schooling and also living with their parents all or part of the time.
14
Perhaps the most significant findings involved health indicators. Young adults who primarily used cell phones were more likely to report recent mental health issues, more likely to be current smokers, and recently engaged in binge drinking than at least one of the other two groups. These results are strikingly consistent with Blumberg and Luke’s (2007) comparison of cell-phone only individuals with those who have landline service, whereby those in cell-phone only households were more likely to report binge drinking and current smoking than those who had landline phones. These findings suggest that young adults who are primarily cell phone users may engage in health risk behaviors in similar ways to those in cell-phone only households, ways that are quite distinct from those who rely more on landline phones. One result that did not appear consistent with Blumberg and Luke’s (2007) findings was that young adults who were primarily cell phone users and those who were mixed users were both more likely to report having health insurance coverage than those who were primarily landline users. Blumberg and Luke (2007) found that adults living in cell-phone only households were actually less likely to report being covered than those living in homes with landline phone service. We also did not find the difference Blumberg and Luke (2007) observed with respect to general health status and phone usage patterns, but this comparison was likely limited by the narrow age range of adult respondents in the NY YATS.
Overall, this research indicates that reliance primarily on cell phones among young adults can add nonresponse error to the existing coverage problem in RDD-based health surveys. Young adults who rely primarily on cell phones exhibit different behaviors and have some different characteristics than those who use landline phones more regularly. The potential for “substituting” significant numbers of young adults who are primarily cell phone users with those who rely more on landline phones in RDD surveys could therefore produce important biases in these estimates.
Given the potential for both coverage and nonresponse bias, the key question is whether we can adequately represent the subpopulation of adults age 18 to 24 in landline only RDD surveys. If not, the only real solution to this problem is to include a cell phone sample in each phone survey. For surveys where including a cell phone sample is not currently feasible, one possible solution would be to develop special protocols for including a higher proportion of young adults who are primarily cell phone users in landline surveys. For example, more intensive mail or internet communications about the survey procedures could possibly improve response among young adults who would otherwise be unlikely to participate by landline phone. Given the general decline in response rates and the considerable challenge of reaching young adults (both those who primarily use cell phones and others), this option seems limited. Still, exploring and testing such enhancements to landline phone surveys seems a worthwhile undertaking for phone surveys that are still unable to include a cell phone sample.
Alternatively, a statistical solution may be feasible if we see strong and consistent data indicating that young adults who have landline phone service but are primarily cell users produce very similar survey data as young adults who only have cell phones. Such data would
15
suggest that we could, for example, compare key survey items from young adults who participate via an in-person survey with responses from primarily cell users who participate via a phone survey. This would allow us generate weighting adjustments for the landline data to estimate how these data would look if we had included the cell-only adults. At least three steps would be required to make this alternative work. First, we would have to ask the relevant, standardized set of questions about landline and cell-phone use in both phone and in-person surveys to all respondents. Second, researchers would have to reach general consensus on how to define “primarily cell phone” users based on these survey items. Third, we would have to carefully assess the impact of weighting adjustments across multiple surveys to have confidence that such adjustments are improving the representativeness of young adults. Part of this evaluation process should also include comparisons to data from cell phone samples, to ensure that mode effects or other factors aren’t confounding survey estimates and weighting adjustments.
References Blumberg, Stephen J. and Julian V. Luke. Wireless substitution: Early release of estimates from
the National Health Interview Survey, January – June 2007. National Center for Health Statistics. Available from http://www.cdc.gov/nchs/nhis.htm. December 10, 2007.
Blumberg, Stephen J. and Julian V. Luke. 2007. Coverage bias in traditional telephone surveys of low-income and young adults. Public Opinion Quarterly 71:734-749.
Brick, J. Michael, Pat D. Brick, Sarah Dipko, Stanley Presser, Clyde Tucker, and Yangyang Yuan. 2007. Cell phone survey feasibility in the U.S.: Sampling and calling cell numbers versus landline numbers. Public Opinion Quarterly 71:23–39.
Delnevo, Cristine D., Daniel A. Gundersen, and Brett T. Hagman. Declining estimated prevalence of alcohol drinking and smoking among young adults nationally: Artifacts of sample undercoverage?” American Journal of Epidemiology Advance Access published October 31,2007.
Tucker, Clyde, J. Michael Brick, and Brian Meekins. 2007. Household telephone service and usage patterns in the United States in 2004: Implications for telephone samples. Public Opinion Quarterly 71:3–22
16
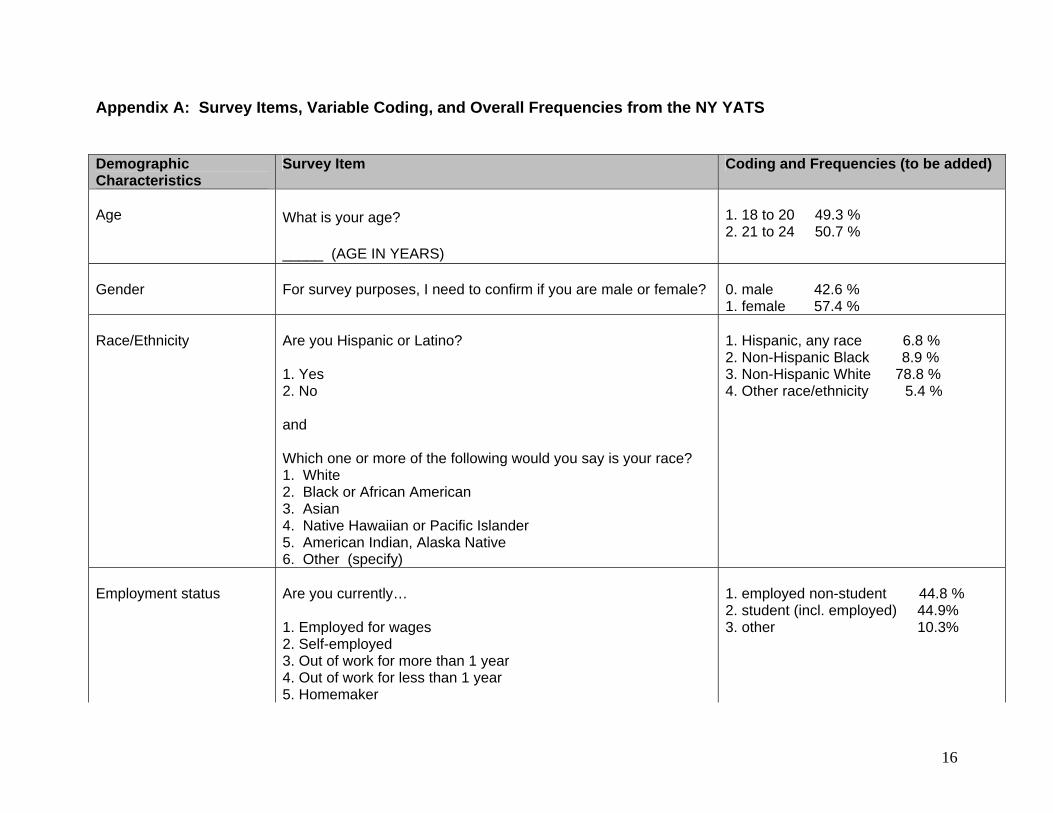
Appendix A: Survey Items, Variable Coding, and Overall Frequencies from the NY YATS
Demographic Characteristics
Survey Item Coding and Frequencies (to be added)
Age
What is your age? _____ (AGE IN YEARS)
1. 18 to 20 49.3 % 2. 21 to 24 50.7 %
Gender
For survey purposes, I need to confirm if you are male or female?
0. male 42.6 % 1. female 57.4 %
Race/Ethnicity
Are you Hispanic or Latino? 1. Yes 2. No and Which one or more of the following would you say is your race? 1. White 2. Black or African American 3. Asian 4. Native Hawaiian or Pacific Islander 5. American Indian, Alaska Native 6. Other (specify)
1. Hispanic, any race 6.8 % 2. Non-Hispanic Black 8.9 % 3. Non-Hispanic White 78.8 % 4. Other race/ethnicity 5.4 %
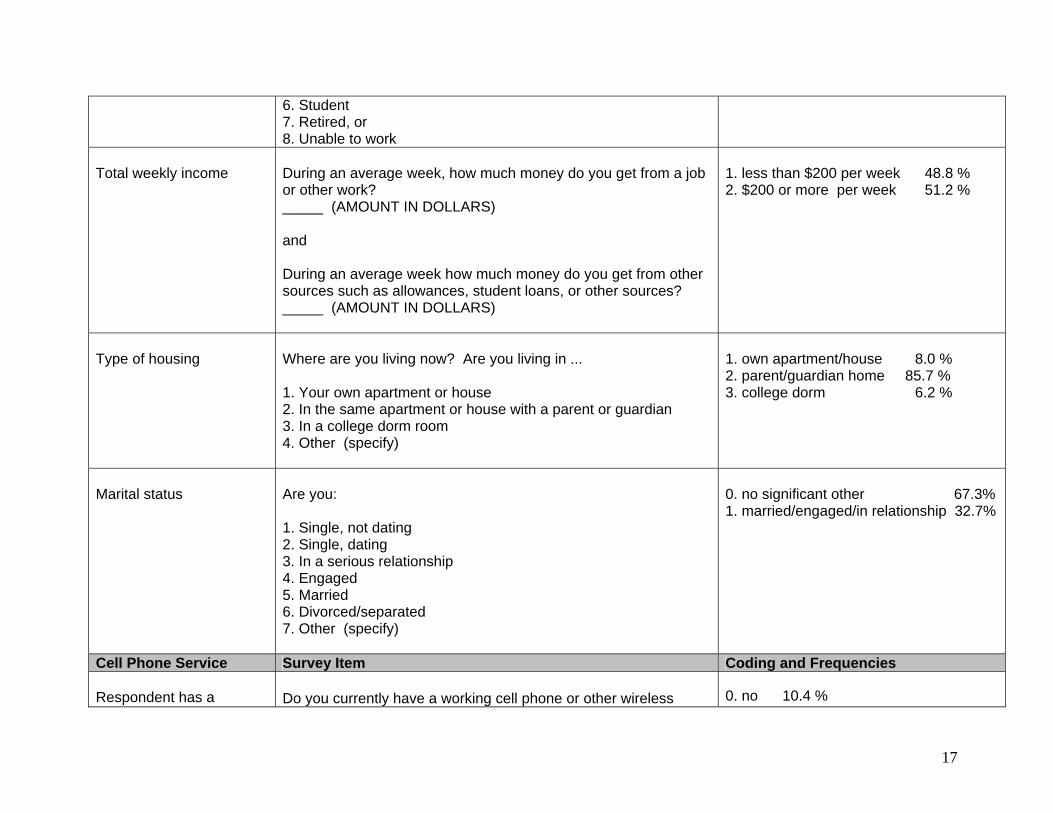
Employment status
Are you currently… 1. Employed for wages 2. Self-employed 3. Out of work for more than 1 year 4. Out of work for less than 1 year 5. Homemaker
1. employed non-student 44.8 % 2. student (incl. employed) 44.9% 3. other 10.3%
17
6. Student 7. Retired, or 8. Unable to work
Total weekly income
During an average week, how much money do you get from a job or other work? _____ (AMOUNT IN DOLLARS) and During an average week how much money do you get from other sources such as allowances, student loans, or other sources? _____ (AMOUNT IN DOLLARS)
1. less than $200 per week 48.8 % 2. $200 or more per week 51.2 %
Type of housing
Where are you living now? Are you living in ... 1. Your own apartment or house 2. In the same apartment or house with a parent or guardian 3. In a college dorm room 4. Other (specify)
1. own apartment/house 8.0 % 2. parent/guardian home 85.7 % 3. college dorm 6.2 %
Marital status
Are you:
1. Single, not dating 2. Single, dating 3. In a serious relationship 4. Engaged 5. Married 6. Divorced/separated 7. Other (specify)
0. no significant other 67.3% 1. married/engaged/in relationship 32.7%
Cell Phone Service Survey Item Coding and Frequencies Respondent has a
Do you currently have a working cell phone or other wireless
0. no 10.4 %

18
wireless phone device for making outgoing calls and receiving incoming calls for your personal use? 1. Yes 2. No
1. yes 89.6 %
At least one other wireless phone(s) in household
Does anyone else in your household currently have a working cell phone or other wireless device for making outgoing calls and receiving incoming calls for personal use? 1. Yes 2. No
0. no 8.3 % 1. yes 91.7 %
Total number of wireless phones in households
What is the total number of cell phone or other wireless numbers owned by all of the members of your household for personal use? ______ (NUMBER OF PHONES)
1. 1 phone 6.4 % 2. 2 phones 17.3 % 3. 3 phones 31.2 % 4. 4 phones 29.0 % 5. 5 phones 12.3 % 6. 6 phones 3.2 % 7. 7 phones 1.0 %
Number of shared wireless phones in household
How many of the {fill response from prior item} cell phone or other wireless numbers are regularly answered by more than one household member? ______ (NUMBER OF PHONES)
0. none 63.1 % 1. one 15.3 % 2. two 9.5 % 3. three 6.7 % 4. four 4.1 % 5. five 1.0 % 6. six 0.2 % 7. seven 0.1 %
Landline and Cell Phone Usage
Survey Item Coding and Frequencies
Likelihood of answering
Compared to answering your regular home phone, how likely are
1. more likely to answer cell phone 48.0%
19
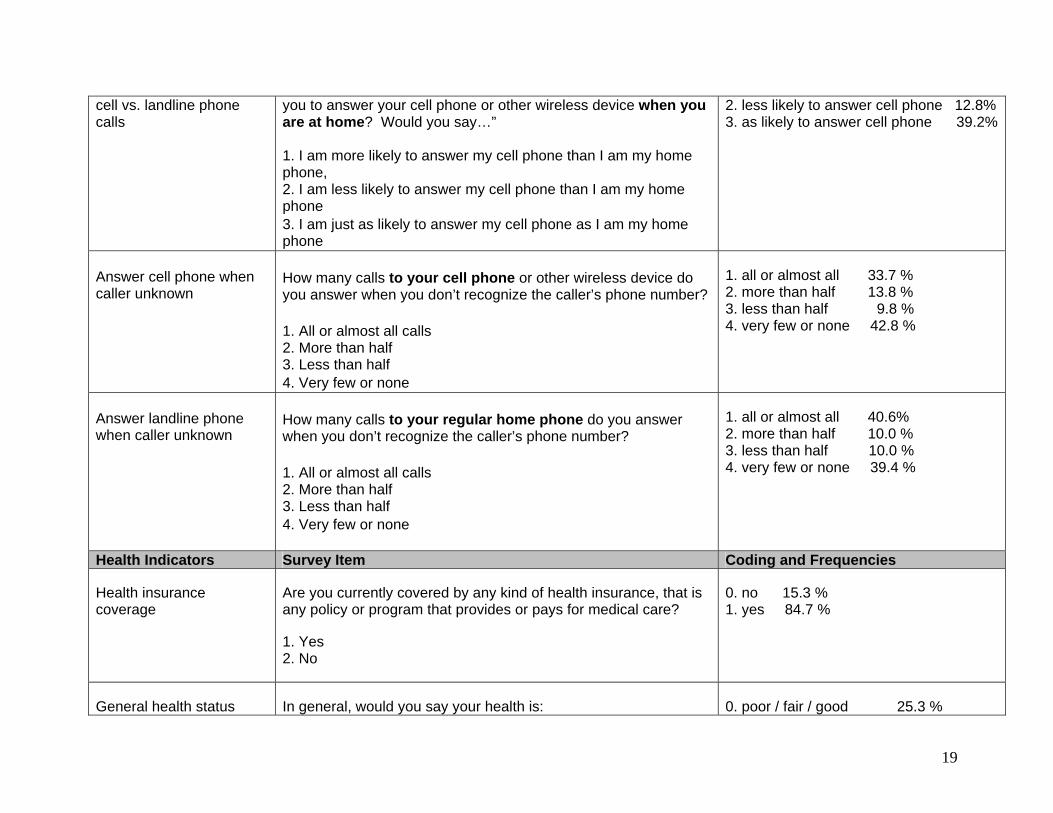
cell vs. landline phone calls
you to answer your cell phone or other wireless device when you are at home? Would you say…” 1. I am more likely to answer my cell phone than I am my home phone, 2. I am less likely to answer my cell phone than I am my home phone 3. I am just as likely to answer my cell phone as I am my home phone
2. less likely to answer cell phone 12.8% 3. as likely to answer cell phone 39.2%
Answer cell phone when caller unknown
How many calls to your cell phone or other wireless device do you answer when you don’t recognize the caller’s phone number? 1. All or almost all calls 2. More than half 3. Less than half 4. Very few or none
1. all or almost all 33.7 % 2. more than half 13.8 % 3. less than half 9.8 % 4. very few or none 42.8 %
Answer landline phone when caller unknown
How many calls to your regular home phone do you answer when you don’t recognize the caller’s phone number? 1. All or almost all calls 2. More than half 3. Less than half 4. Very few or none
1. all or almost all 40.6% 2. more than half 10.0 % 3. less than half 10.0 % 4. very few or none 39.4 %
Health Indicators Survey Item Coding and Frequencies Health insurance coverage
Are you currently covered by any kind of health insurance, that is any policy or program that provides or pays for medical care? 1. Yes 2. No
0. no 15.3 % 1. yes 84.7 %
General health status
In general, would you say your health is:
0. poor / fair / good 25.3 %
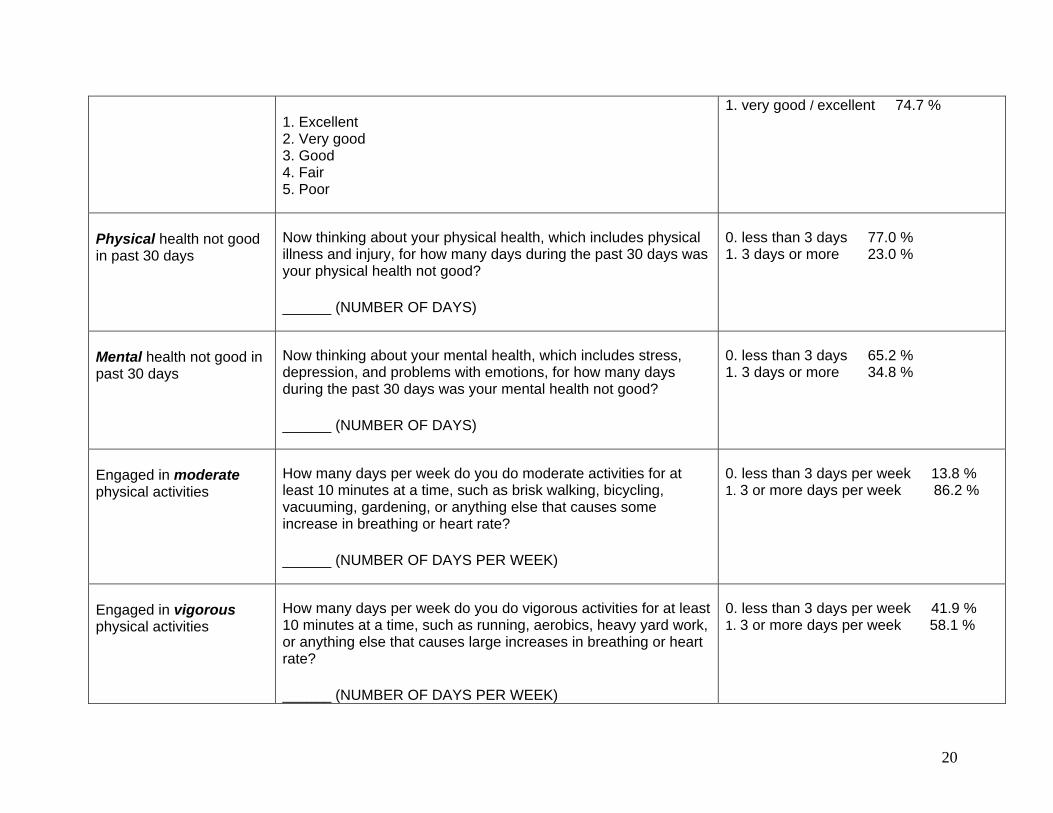
20
1. Excellent 2. Very good 3. Good 4. Fair 5. Poor
1. very good / excellent 74.7 %
Physical health not good in past 30 days
Now thinking about your physical health, which includes physical illness and injury, for how many days during the past 30 days was your physical health not good? ______ (NUMBER OF DAYS)
0. less than 3 days 77.0 % 1. 3 days or more 23.0 %
Mental health not good in past 30 days
Now thinking about your mental health, which includes stress, depression, and problems with emotions, for how many days during the past 30 days was your mental health not good? ______ (NUMBER OF DAYS)
0. less than 3 days 65.2 % 1. 3 days or more 34.8 %
Engaged in moderate physical activities
How many days per week do you do moderate activities for at least 10 minutes at a time, such as brisk walking, bicycling, vacuuming, gardening, or anything else that causes some increase in breathing or heart rate? ______ (NUMBER OF DAYS PER WEEK)
0. less than 3 days per week 13.8 % 1. 3 or more days per week 86.2 %
Engaged in vigorous physical activities
How many days per week do you do vigorous activities for at least 10 minutes at a time, such as running, aerobics, heavy yard work, or anything else that causes large increases in breathing or heart rate? ______ (NUMBER OF DAYS PER WEEK)
0. less than 3 days per week 41.9 % 1. 3 or more days per week 58.1 %
21
Seen health professional in past year
In the past 12 months, have you seen a doctor, nurse, or other health professional to get any kind of care for yourself? 1. Yes 2. No
0. no 15.7 % 1. yes 84.3 %
Smoking status
A. Have you smoked at least 100 cigarettes in your entire life? 1. Yes 2. No and B. Do you now smoke cigarettes everyday, some days, or not at all? 1. Every day 2. Some days 3. Not at all
0. Non-smoker 82.2 % [a=2 or (a=1 and b=3)] 1. Current smoker 17.8 % [a=1 and (b=1 or b=2)
Recent binge drinking
During the past 30 days, on how many days did you have 5 or more drinks of alcohol in a row, that is, within a couple of hours? ______ (NUMBER OF DAYS)
0. 0 days 45.0 % 1. 1 or more days 55.0 %
22
Appendix B: Classification of Young Adults into Phone Usage Types
Survey Items: J8. Do you currently have a working cell phone or other wireless device for making outgoing calls and receiving incoming calls for your personal use?
1. Yes 2. No
J13. Compared to answering your regular home phone, how likely are you to answer your cell phone or other wireless device when you are at home? Would you say…”
1. I am more likely to answer my cell phone than I am my home phone, 2. I am less likely to answer my cell phone than I am my home phone 3. I am just as likely to answer my cell phone as I am my home phone
J14. How many calls to your cell phone or other wireless device do you answer when you don’t recognize the caller’s phone number?
1. All or almost all calls 2. More than half 3. Less than half 4. Very few or none
J15. How many calls to your regular home phone do you answer when you don’t recognize the caller’s phone number?
1. All or almost all calls 2. More than half 3. Less than half 4. Very few or none
Coding Scheme: 1. Primarily cell users: J8 = 1 and
(1) J13 = 1 and J14 < J15 or
(2) J13 = 3 and J14 < J15 2. Mixed cell & landline users: J8 = 1 and (1) J13 = 2 and J14 < J15 or
(2) J13 = 3 and J14 = J15 or (3) J13 = 3 and J14 or J15 = 8 or 9
3. Primarily landline users: (1) J8 = 2, 8, or 9 or J8 = 1 and (2) J13 = 2 and J14 > J15 or (3) J13 = 3 and J14 > J15