the impact of key economic trends on the nh workforce ross gittell james r. carter professor...
Post on 21-Dec-2015
216 views
TRANSCRIPT

The Impact of Key Economic The Impact of Key Economic Trends on the NH WorkforceTrends on the NH Workforce
Ross GittellRoss GittellJames R. Carter Professor James R. Carter Professor
Whittemore School of Business & EconomicsWhittemore School of Business & Economics
University of New HampshireUniversity of New Hampshire

How are we doing……..How are we doing……..
NH – Strong Performance Last 2 DecadesNH – Strong Performance Last 2 Decades Current Economy: Current Economy:
– Tentative Recovery in US and NHTentative Recovery in US and NH– Uncertainty (e.g., stock market, possible war)Uncertainty (e.g., stock market, possible war)– When will business capital investment and high When will business capital investment and high tech and manufacturing recover (mid-2003??)tech and manufacturing recover (mid-2003??)
–NH is not alone…..NH is not alone….. The OutlookThe Outlook
– NH’s Entrepreneurial & high tech businesses NH’s Entrepreneurial & high tech businesses have experience and expertise in responding to have experience and expertise in responding to changing market opportunities and recovering changing market opportunities and recovering
– NH expected to continue to be the strongest NH expected to continue to be the strongest economy in region (New England Economic economy in region (New England Economic Project)Project)

Productivity Leader...Growth in Output Per Employee, 1977-99
2.2
0.8
2.3
2.6
1.7
1.5
1.1
2.1
0.0 0.5 1.0 1.5 2.0 2.5 3.0
Connecticut
Maine
Massachusetts
New Hampshire
Rhode Island
Vermont
UNITED STATES
NEW ENGLAND
Annual Average Growth Rate (%)
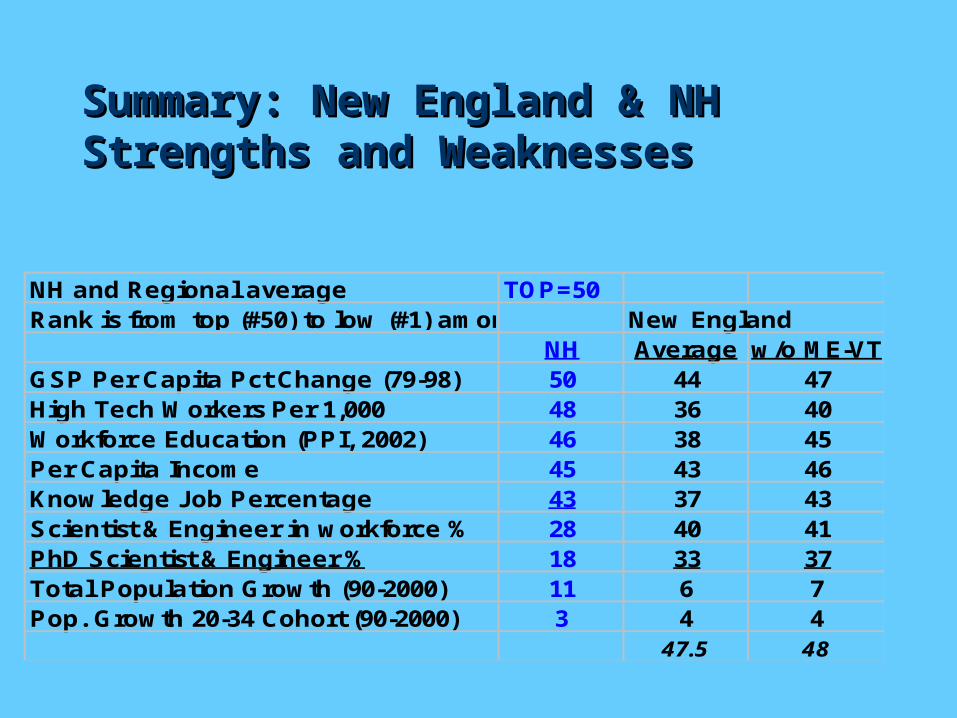
Summary: New England & NH Summary: New England & NH Strengths and WeaknessesStrengths and Weaknesses
NH and Regional average TOP=50Rank is from top (#50) to low (#1) among the 50 US states New England NH Average w/o ME-VTGSP Per Capita Pct Change (79-98) 50 44 47High Tech Workers Per 1,000 48 36 40Workforce Education (PPI, 2002) 46 38 45Per Capita Income 45 43 46Knowledge Job Percentage 43 37 43Scientist & Engineer in workforce % 28 40 41PhD Scientist & Engineer % 18 33 37Total Population Growth (90-2000) 11 6 7Pop. Growth 20-34 Cohort (90-2000) 3 4 4
47.5 48
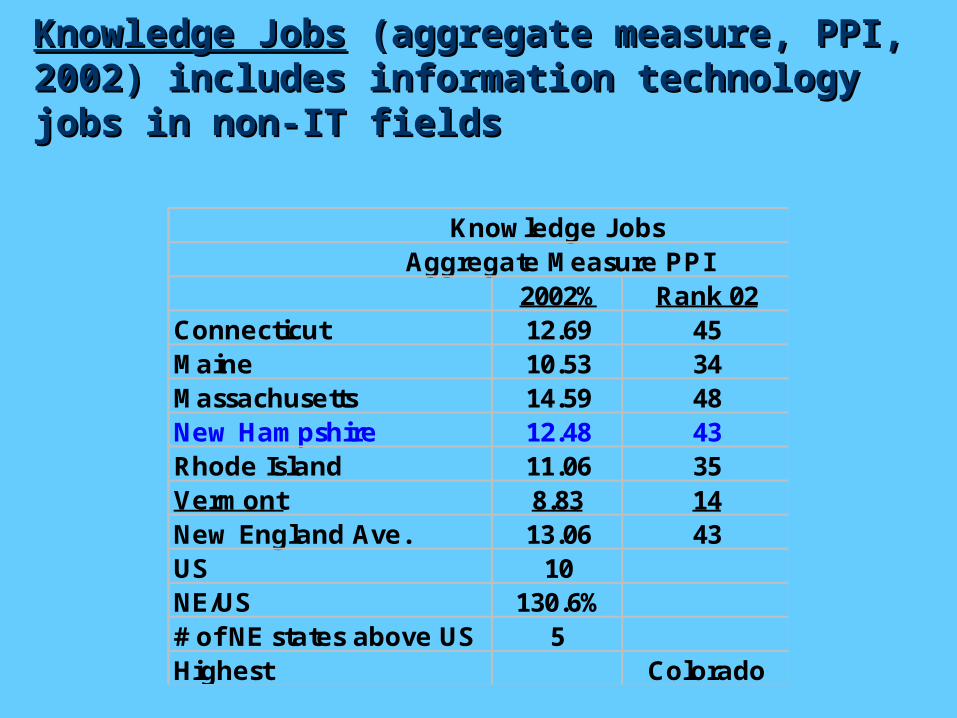
Knowledge JobsKnowledge Jobs (aggregate measure, PPI, (aggregate measure, PPI, 2002) includes information technology jobs 2002) includes information technology jobs in non-IT fieldsin non-IT fields
Knowledge JobsAggregate Measure PPI
2002% Rank 02Connecticut 12.69 45Maine 10.53 34Massachusetts 14.59 48New Hampshire 12.48 43Rhode Island 11.06 35Vermont 8.83 14New England Ave. 13.06 43US 10NE/US 130.6%# of NE states above US 5Highest Colorado

Education Advantages translate into high output Education Advantages translate into high output per worker across industries in regionper worker across industries in region
Finance Workers % with College Degree
2001% Rank 01Connecticut 50.6 40Maine 40.3 17Massachusetts 57 45New Hampshire 55 44Rhode Island 46.9 33Vermont 46.1 29New England Ave. 52.54 40

NH Ranks #1 in Concentration of High Tech NH Ranks #1 in Concentration of High Tech ManufacturingManufacturing, 2/3rds of NH high tech , 2/3rds of NH high tech employment is in manufacturing compared to a employment is in manufacturing compared to a little over 1/3rd nationallylittle over 1/3rd nationally
Rank StateHigh Tech
Rank StateHigh Tech
Manuf.Rank State
High Tech Service
1 Colorado 109 1 New Hampshire 59 1 Colorado 772 Massachusetts 104 2 Idaho 45 2 Virginia 763 New Hampshire 93 3 Massachusetts 44 3 Massachusetts 603 California 93 4 California 42 4 Maryland 595 New Jersey 90 5 Oregon 39 5 New Jersey 576 Virginia 88 6 Minnesota 38 6 Utah 537 Idaho 85 7 South Dakota 34 7 Washington 528 Utah 81 8 Connecticut 34 8 California 519 Maryland 76 9 Arizona 32 9 Georgia 48
10 Connecticut 72 10 New Jersey 32 10 New Mexico 4611 Minnesota 72 11 Colorado 32 11 Texas 4212 Washington 69 12 Utah 28 12 Nebraska 4013 Oregon 68 13 New York 26 13 Kansas 4014 Texas 67 14 Texas 25 14 Idaho 4015 New Mexico 66 15 Pennsylvania 25 15 New York 3916 New York 65 16 Indiana 24 16 Connecticut 3917 Arizona 64 17 Illinois 23 17 Missouri 3818 Nebraska 61 18 Nebraska 20 18 New Hampshire 3419 Illinois 56 19 New Mexico 20 19 Minnesota 3320 Georgia 56 20 North Carolina 19 20 Illinois 3321 Pennsylvania 55 21 Washington 17 21 Arizona 3122 North Carolina 49 22 Delaware 16 22 Florida 3123 South Dakota 49 23 Maryland 16 23 Alabama 3024 Missouri 48 24 Maine 16 24 Pennsylvania 3025 Kansas 47 25 Rhode Island 16 25 Oregon 30
High Tech Employment Concentration per thousand, 2000
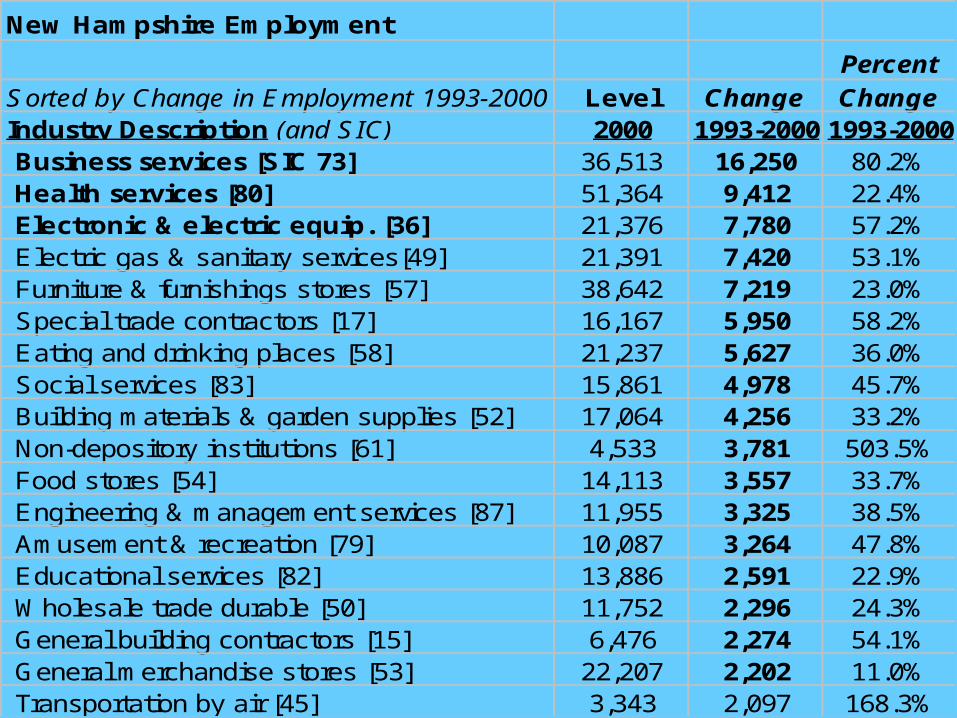
New Hampshire Employment
PercentSorted by Change in Employment 1993-2000 Level Change ChangeIndustry Description (and SIC) 2000 1993-2000 1993-2000 Business services [SIC 73] 36,513 16,250 80.2% Health services [80] 51,364 9,412 22.4% Electronic & electric equip. [36] 21,376 7,780 57.2% Electric gas & sanitary services[49] 21,391 7,420 53.1% Furniture & furnishings stores [57] 38,642 7,219 23.0% Special trade contractors [17] 16,167 5,950 58.2% Eating and drinking places [58] 21,237 5,627 36.0% Social services [83] 15,861 4,978 45.7% Building materials & garden supplies [52] 17,064 4,256 33.2% Non-depository institutions [61] 4,533 3,781 503.5% Food stores [54] 14,113 3,557 33.7% Engineering & management services [87] 11,955 3,325 38.5% Amusement & recreation [79] 10,087 3,264 47.8% Educational services [82] 13,886 2,591 22.9% Wholesale trade durable [50] 11,752 2,296 24.3% General building contractors [15] 6,476 2,274 54.1% General merchandise stores [53] 22,207 2,202 11.0% Transportation by air [45] 3,343 2,097 168.3%

Southern and Northern NH Southern and Northern NH differences in Leading Industriesdifferences in Leading Industries SOUTHERN NH Semiconductor & other electronic
component mfg Nav, measuring, medical, control
instruments mfg Full-service restaurants Software publishers Service industry machinery mfg Employment services Offices of physicians General medical hospitals Grocery stores Insurance carriers Other fab metal product mfg Business schools & computer &
mgt training
NORTHERN NH Pulp, paper & paperboard mills Sawmills & wood preservation Traveler accommodation Full-service restaurants RV parks & recreational camps General medical hospitals Outpatient care centers Offices of physicians Grocery stores General purp. machinery mfg Individual & family services Electronic shopping & mail-order
houses Limited-service eating places
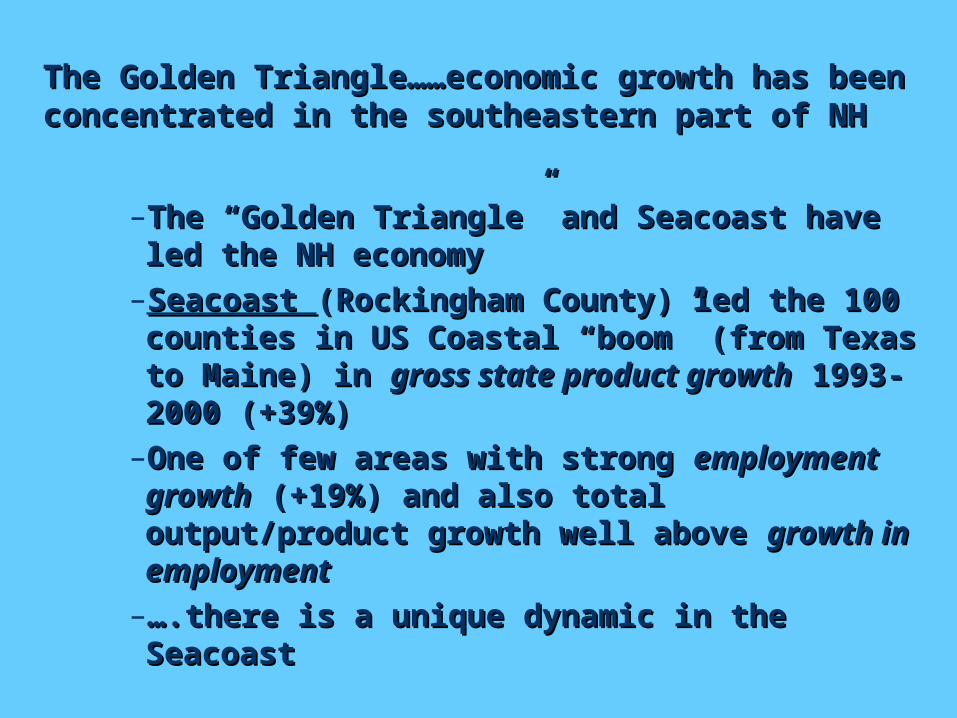
The Golden Triangle……economic growth has The Golden Triangle……economic growth has been concentrated in the southeastern part of been concentrated in the southeastern part of NHNH
–The “Golden Triangle” and Seacoast have The “Golden Triangle” and Seacoast have led the NH economyled the NH economy
–Seacoast Seacoast (Rockingham County) led the 100 (Rockingham County) led the 100 counties in US Coastal “boom” (from counties in US Coastal “boom” (from Texas to Maine) in Texas to Maine) in gross state product gross state product growthgrowth 1993-2000 (+39%) 1993-2000 (+39%)
–One of few areas with strong One of few areas with strong employment employment growthgrowth (+19%) and also total (+19%) and also total output/product growth well above output/product growth well above growth growth in employmentin employment
–…….there is a unique dynamic in the .there is a unique dynamic in the SeacoastSeacoast

Yet…during Yet…during late 1990s tech “boom”late 1990s tech “boom” NH ranked only NH ranked only 36th of 50 states in high tech employment growth, 36th of 50 states in high tech employment growth, grew below US ave & less than competitor statesgrew below US ave & less than competitor states……this resulted in decline in AeA rank from 1st to 3rdthis resulted in decline in AeA rank from 1st to 3rd
From Q1-98 to Q1-01 Percentage Change in From Q1-98 to Q1-01 Percentage Change in High Technology EmploymentHigh Technology Employment– NH 7.6% (ranked 36th highest among 50 NH 7.6% (ranked 36th highest among 50
states)states)– Compared to US ave of 18% and Compared to US ave of 18% and
CO 22%, VA 19%, CA 17.6%NY 13.3%, PA 11.4%, MA 11.3%

Unemployment in NH (well below US Unemployment in NH (well below US ave) and tight labor market in MA ave) and tight labor market in MA limited high tech growth in NH, limited high tech growth in NH, relatively low unemployment continuesrelatively low unemployment continues
Unemployment Rates
0
1
2
3
4
5
6
7
US
MA
NH
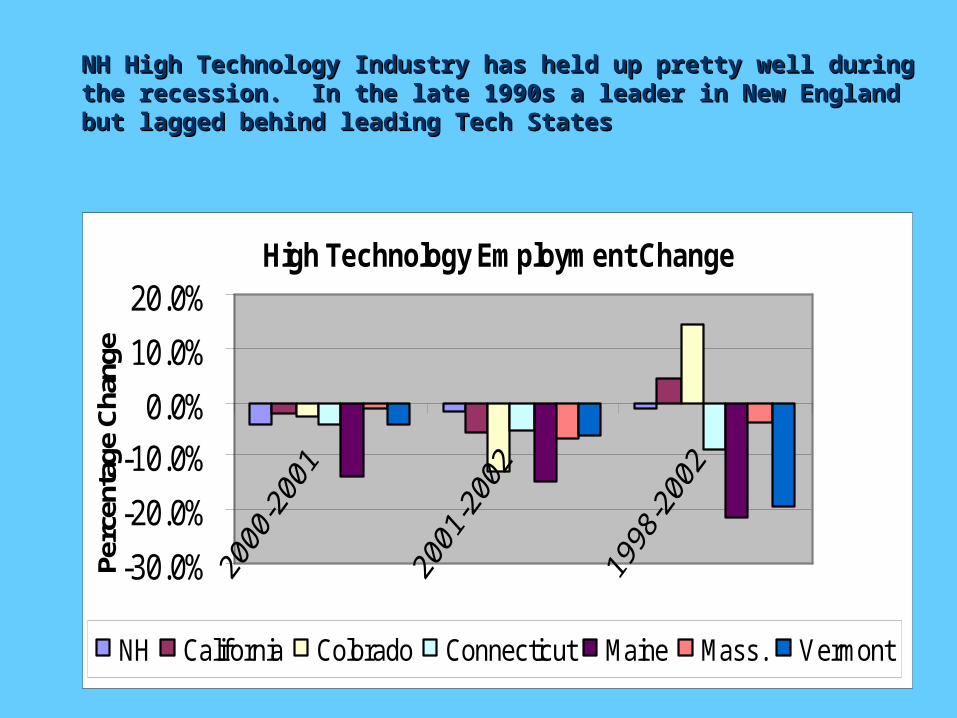
NH High Technology Industry has held up pretty well during NH High Technology Industry has held up pretty well during the recession. In the late 1990s a leader in New England but the recession. In the late 1990s a leader in New England but lagged behind leading Tech Stateslagged behind leading Tech States
High Technology Employment Change
-30.0%
-20.0%
-10.0%
0.0%
10.0%
20.0%
Perc
enta
ge C
hang
e
NH California Colorado Connecticut Maine Mass. Vermont

For example in NH…3 MSAs have relatively For example in NH…3 MSAs have relatively strong economies.. strong economies.. different from extreme different from extreme boom-bust in Silicon Valleyboom-bust in Silicon Valley
Tech Centers: Change in Total Employment since 2000
-10.0%
-5.0%
0.0%
5.0%
10.0%
15.0%
01/00-01/01
01/01-01/02
01/02-06/02
01/98-06-02P
erc
en
tag
e C
ha
ng
e Portsmouth
Nashua
Manchester
Boston
Raleigh
San Jose
During the During the recent economic downturnrecent economic downturn NH’s NH’s economy has performed better than US economy has performed better than US average and better than other high tech average and better than other high tech leadersleaders
Total EmploymentTotal Employment Decline Decline March 01 to July 02March 01 to July 02… … –NH less than 1% (-.8%) and below US average (-NH less than 1% (-.8%) and below US average (-1.3%)1.3%)
–Less of a decline thanLess of a decline thanCO nearly 3%MA over 2%
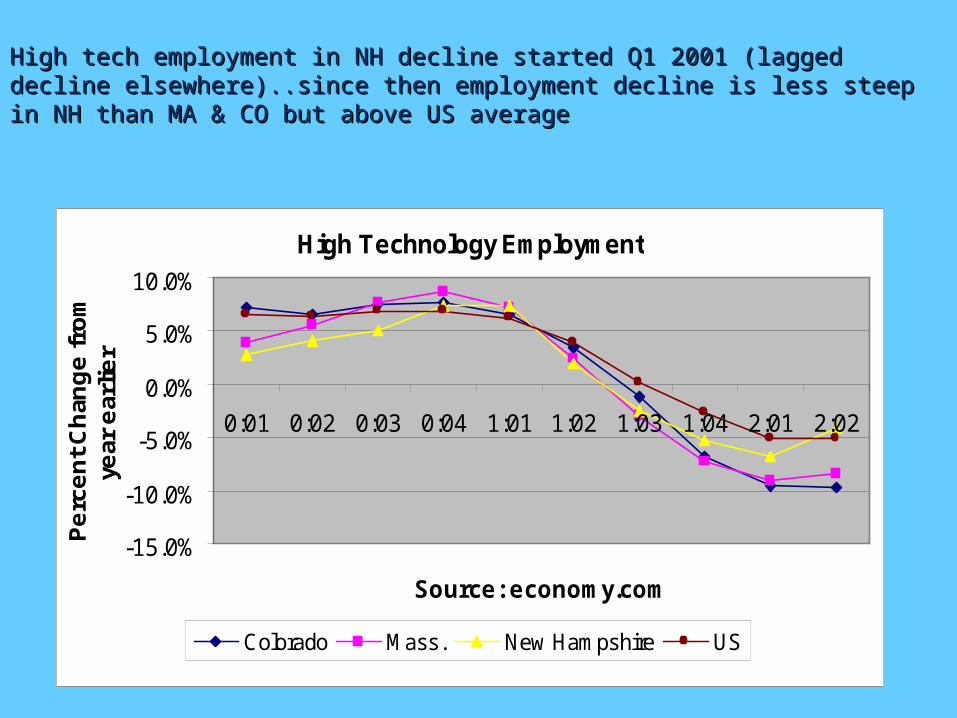
High tech employment in NH decline started Q1 2001 (lagged decline High tech employment in NH decline started Q1 2001 (lagged decline elsewhere)..since then employment decline is less steep in NH than MA & CO elsewhere)..since then employment decline is less steep in NH than MA & CO but above US averagebut above US average
High Technology Employment
-15.0%
-10.0%
-5.0%
0.0%
5.0%
10.0%
0:01 0:02 0:03 0:04 1:01 1:02 1:03 1:04 2:01 2:02
Source: economy.com
Pe
rce
nt
Ch
ang
e f
rom
ye
ar e
arlie
r
Colorado Mass. New Hampshire US

Layoffs in NH concentrated in high tech Layoffs in NH concentrated in high tech manufacturing .. manufacturing .. 50% of layoffs50% of layoffs
# Layoffs # Closures# People
Permanently % of totalJan. 1, 2001 through Aug. 22, 2001 48 6 4,376 48.8%Aug. 23, 2001 through Dec. 31, 2001 29 9 2,659 54.5%Jan. 1, 2002 through Aug. 22, 2002 23 8 1,532 46.7%Totals Jan 2001 to Aug 2002 100 23 8,567Percent of Total Layoffs in the State 36.8% 25.8% 50.0%
SICs 35 & 36 (Industrial Machinery & Electric/Electronic Equip Mfg

Steepest Decline in Manufacturing in Steepest Decline in Manufacturing in Manchester and Portsmouth MSAs, decline Manchester and Portsmouth MSAs, decline greater than other tech centersgreater than other tech centers
Percent Change in Manufacturing Employment: 1/98 to 6/02
-3.5%
-13.0%
-16.2%
-10.5%-13.3%
-1.1%
-12.7%
3.0%
-20.0%
-15.0%
-10.0%
-5.0%
0.0%
5.0%
Nashua
Portsm
outh
Manchester
Boston
Boulder
Raleigh
San Jose
San D
iego

Some signs that decline and Some signs that decline and layoffs are slowing down..but a layoffs are slowing down..but a lot of uncertainty, mixed signals lot of uncertainty, mixed signals and slow growth anticipatedand slow growth anticipated
Year to date 2002 layoff notifications in NH Year to date 2002 layoff notifications in NH (NH DRED, Oct 2002)(NH DRED, Oct 2002)
–78 layoffs, 27 closures, 3,667 78 layoffs, 27 closures, 3,667 permanently laid offpermanently laid off
September 2002September 2002
–5, 2 and 206 5, 2 and 206

WORKFORCE ISSUES: WORKFORCE ISSUES: Current situation…the 2001 Current situation…the 2001 employment picture for graduatesemployment picture for graduates
Relatively strong fields include:Relatively strong fields include:
– technology jobs in health care (from technician to technology jobs in health care (from technician to software engineer)software engineer)
– computer maintenance and servicescomputer maintenance and services
– wireless technology (m-commerce)wireless technology (m-commerce)
– electrical, mechanical, and computer engineeringelectrical, mechanical, and computer engineering A complicated technology employment outlook ... A complicated technology employment outlook ...
On one hand, it is bleak, yet the numbers indicate On one hand, it is bleak, yet the numbers indicate there are job opportunitiesthere are job opportunities

What about the future...BLS Projections What about the future...BLS Projections for the USfor the US
Information on 2000 and projected 2010 Information on 2000 and projected 2010 occupational employment developed by the occupational employment developed by the Bureau of Labor StatisticsBureau of Labor Statistics
Part of Occupational Employment Projections Part of Occupational Employment Projections ProgramProgram
Data derived from 2000-10 National Employment Data derived from 2000-10 National Employment MatrixMatrix
The information presented part of 2002-2003 The information presented part of 2002-2003 edition of edition of Occupational Projections and Training Occupational Projections and Training DataData. .
Data and projections are available on the BLS Data and projections are available on the BLS website: website: http://data.http://data.blsbls..govgov//oepoep//noetednoeted//empoptdempoptd..jspjsp

Occupations with Largest Increases Occupations with Largest Increases Over Next Decade in Employment for Over Next Decade in Employment for US workers with US workers with Bachelors+Bachelors+
Number(000's)
Computer software engineers, 380 760 380General and operations managers 2,398 2,761 363Postsecondary teachers 1,344 1,659 315Computer software engineers, systems 317 601 284Computer systems analysts 431 689 258Elementary teachers, excep spec. ed. 1,532 1,734 202Secondary teachers, excep. spec. ed. 1,004 1,190 187Accountants and auditors 976 1,157 181All other business operations 827 960 133Chief executives 547 641 94
2000 2010Occupation
Totalemployment
(000's)
2000-2010changein total
employment
But there is a declining relevance of traditional But there is a declining relevance of traditional definitions and categoriesdefinitions and categories
Occupational & Industry categories and Occupational & Industry categories and definitions and categories are increasingly definitions and categories are increasingly less relevant and useful in human capital less relevant and useful in human capital development and higher educationdevelopment and higher education
–people change occupations and careers people change occupations and careers multiple times during their lifetimemultiple times during their lifetime
–there are no longer “traditional” there are no longer “traditional” industries ..industries are constantly industries ..industries are constantly changing changing
–have to move away from thinking of have to move away from thinking of preparing workers for particular preparing workers for particular industries or occupationsindustries or occupations

Keys for WorkforceKeys for Workforce
Portfolio of competenciesPortfolio of competencies–need for workers to develop range of need for workers to develop range of capabilitiescapabilities
–and add to portfolio over timeand add to portfolio over time ““Execution” SkillsExecution” Skills
–problem solveproblem solve–work with otherswork with others–deliver a product or service that meets a deliver a product or service that meets a specific (but ever changing) societal or specific (but ever changing) societal or market needmarket need
–business planningbusiness planning Attitude and capability to change and Attitude and capability to change and
continuously learncontinuously learn
...in support of new industries and ...in support of new industries and careerscareers
Workers/Business Owners in NH in the Workers/Business Owners in NH in the 21st Century in many respects will have 21st Century in many respects will have to increasingly to increasingly create and then re-create create and then re-create their own occupations, industries and their own occupations, industries and businessesbusinesses
The challenge for economic developers is The challenge for economic developers is to provide the infrastructure support and to provide the infrastructure support and environment to help workers and environment to help workers and businesses develop the capacity and businesses develop the capacity and competencies to create new industries competencies to create new industries and businesses and businesses
Industry opportunities thinking beyond Industry opportunities thinking beyond BioTech:BioTech: Industries in which technology Industries in which technology can be used to solve problemscan be used to solve problems ““Big” ProblemsBig” Problems
– National Defense & Homeland SecurityNational Defense & Homeland Security– Health Care Health Care – Energy (efficiency and alternative sources)Energy (efficiency and alternative sources)– The Environment & Public HealthThe Environment & Public Health
Transportation (e.g., the Segway)Air Quality (e.g., AIRMAP project at UNH)
““Small” ProblemsSmall” Problems– Business applicationsBusiness applications– Government (public policies, “e-Government”)Government (public policies, “e-Government”)– Non-profits (management and service delivery)Non-profits (management and service delivery)

The Defense IndustryThe Defense Industry... evidence of a coming ... evidence of a coming increase in defense spending & employmentincrease in defense spending & employment
Congress has passed appropriations bills for tens of Congress has passed appropriations bills for tens of billions of dollars in new defense spendingbillions of dollars in new defense spending
Investment analysts project that the defense budget will Investment analysts project that the defense budget will grow a staggering $200 billion, to $500 billion by 2005grow a staggering $200 billion, to $500 billion by 2005
Pentagon has asked private companies and universities Pentagon has asked private companies and universities to propose a broad array of technologies that can help to propose a broad array of technologies that can help America “sniff out terrorists”America “sniff out terrorists”

Defense & Homeland Security Related Defense & Homeland Security Related OpportunitiesOpportunities
In the short term... the main increase will be for In the short term... the main increase will be for established weapons systems… e.g., missiles & established weapons systems… e.g., missiles & helicopters.. helicopters..
Longer term, there will be need for “smarter” military Longer term, there will be need for “smarter” military systems designed for special operations and the war systems designed for special operations and the war against terrorismagainst terrorism
There will be increased need for scientists and There will be increased need for scientists and engineers developing and implementing the new engineers developing and implementing the new systems and their commercial “spin-offs”systems and their commercial “spin-offs”

New Industries ...Beyond Defense & New Industries ...Beyond Defense & Homeland Security:Homeland Security:
Photonics.. Replacing electronics in technology and Photonics.. Replacing electronics in technology and other applicationsother applications
Software systems that can be used in a wide range of Software systems that can be used in a wide range of integrative applications e.g., environmental integrative applications e.g., environmental sciences, health care, large database system sciences, health care, large database system management.management.
Optical computer (OptIPuter) focusing on problems in Optical computer (OptIPuter) focusing on problems in the earth sciences and neurosciencesthe earth sciences and neurosciences
– Using computers to monitor vast radar maps and Using computers to monitor vast radar maps and create public warning systems for earthquakescreate public warning systems for earthquakes
– In neurosciences ...mapping the human brain at a In neurosciences ...mapping the human brain at a level of resolution well beyond the limits of today's level of resolution well beyond the limits of today's technologytechnology
What can be done to promote What can be done to promote the NH economy the NH economy (some (some thoughts)thoughts)
Take advantage of unique mix (diverse Take advantage of unique mix (diverse economy) ..high tech, manufacturing, economy) ..high tech, manufacturing, professional services, retail and tourismprofessional services, retail and tourism
Leverage strengths in tourism-related Leverage strengths in tourism-related industries (recreational and other industries (recreational and other amenities/magnets) to recruit entrepreneurs amenities/magnets) to recruit entrepreneurs and other types of firms in other industriesand other types of firms in other industries
Leverage strengths in high tech (and local Leverage strengths in high tech (and local spending power) to diversify and upgrade spending power) to diversify and upgrade value-added in tourism and retailvalue-added in tourism and retail

What can be done to promote NH What can be done to promote NH economy economy (some thoughts)(some thoughts)
Position NH as the Entrepreneurial state in the Position NH as the Entrepreneurial state in the region... region...
–An emphasis on Entrepreneurship reflects the An emphasis on Entrepreneurship reflects the general business strength and activity in the general business strength and activity in the statestate
–In the late 1990s Entrepreneurial activity was In the late 1990s Entrepreneurial activity was concentrated in “e”lectronic-related-activities… concentrated in “e”lectronic-related-activities… but that has changed with technological and but that has changed with technological and market opportunitiesmarket opportunities
High Tech NH: Creative High Tech NH: Creative DestructionDestructionFrom the slowdown seeds for the From the slowdown seeds for the futurefuture
Many leading high tech companies were birthed Many leading high tech companies were birthed during economic downcycles (e.g., US-Microsoft, during economic downcycles (e.g., US-Microsoft, NH-companies include BottomLine and DEC NH-companies include BottomLine and DEC “alumni” start-ups)“alumni” start-ups)
NH businesses and entrepreneurs seem to excel at NH businesses and entrepreneurs seem to excel at rapid response to new market opportunities rapid response to new market opportunities
In the late 1990s business opportunities were In the late 1990s business opportunities were concentrated in software & Internet-related… in concentrated in software & Internet-related… in the future..photonics, environmental and medical the future..photonics, environmental and medical technology, instrumentation and equipment, technology, instrumentation and equipment, biotechnology and new “unknown” industries biotechnology and new “unknown” industries
What can be done to promote What can be done to promote the economy the economy (some more (some more thoughts)thoughts)
Position the state and cities in the state to Position the state and cities in the state to attract corporate headquarters (e.g., Apogent) attract corporate headquarters (e.g., Apogent) and financial and professional services (e.g. and financial and professional services (e.g. legal, management & engineering services)legal, management & engineering services)
Recruit & retain engineering and design Recruit & retain engineering and design oriented manufacturers that supply OEMs oriented manufacturers that supply OEMs globally globally
The “Selling Points” include:The “Selling Points” include:– access to Boston and Route 495 and 128access to Boston and Route 495 and 128– skilled workforceskilled workforce– transportation node (including air transport)transportation node (including air transport)– quality of lifequality of life